
Response of Northern Populations of Black Spruce and Jack Pine to Southward Seed Transfers: Implications for Climate Change


Abstract
:1. Introduction
2. Materials and Methods
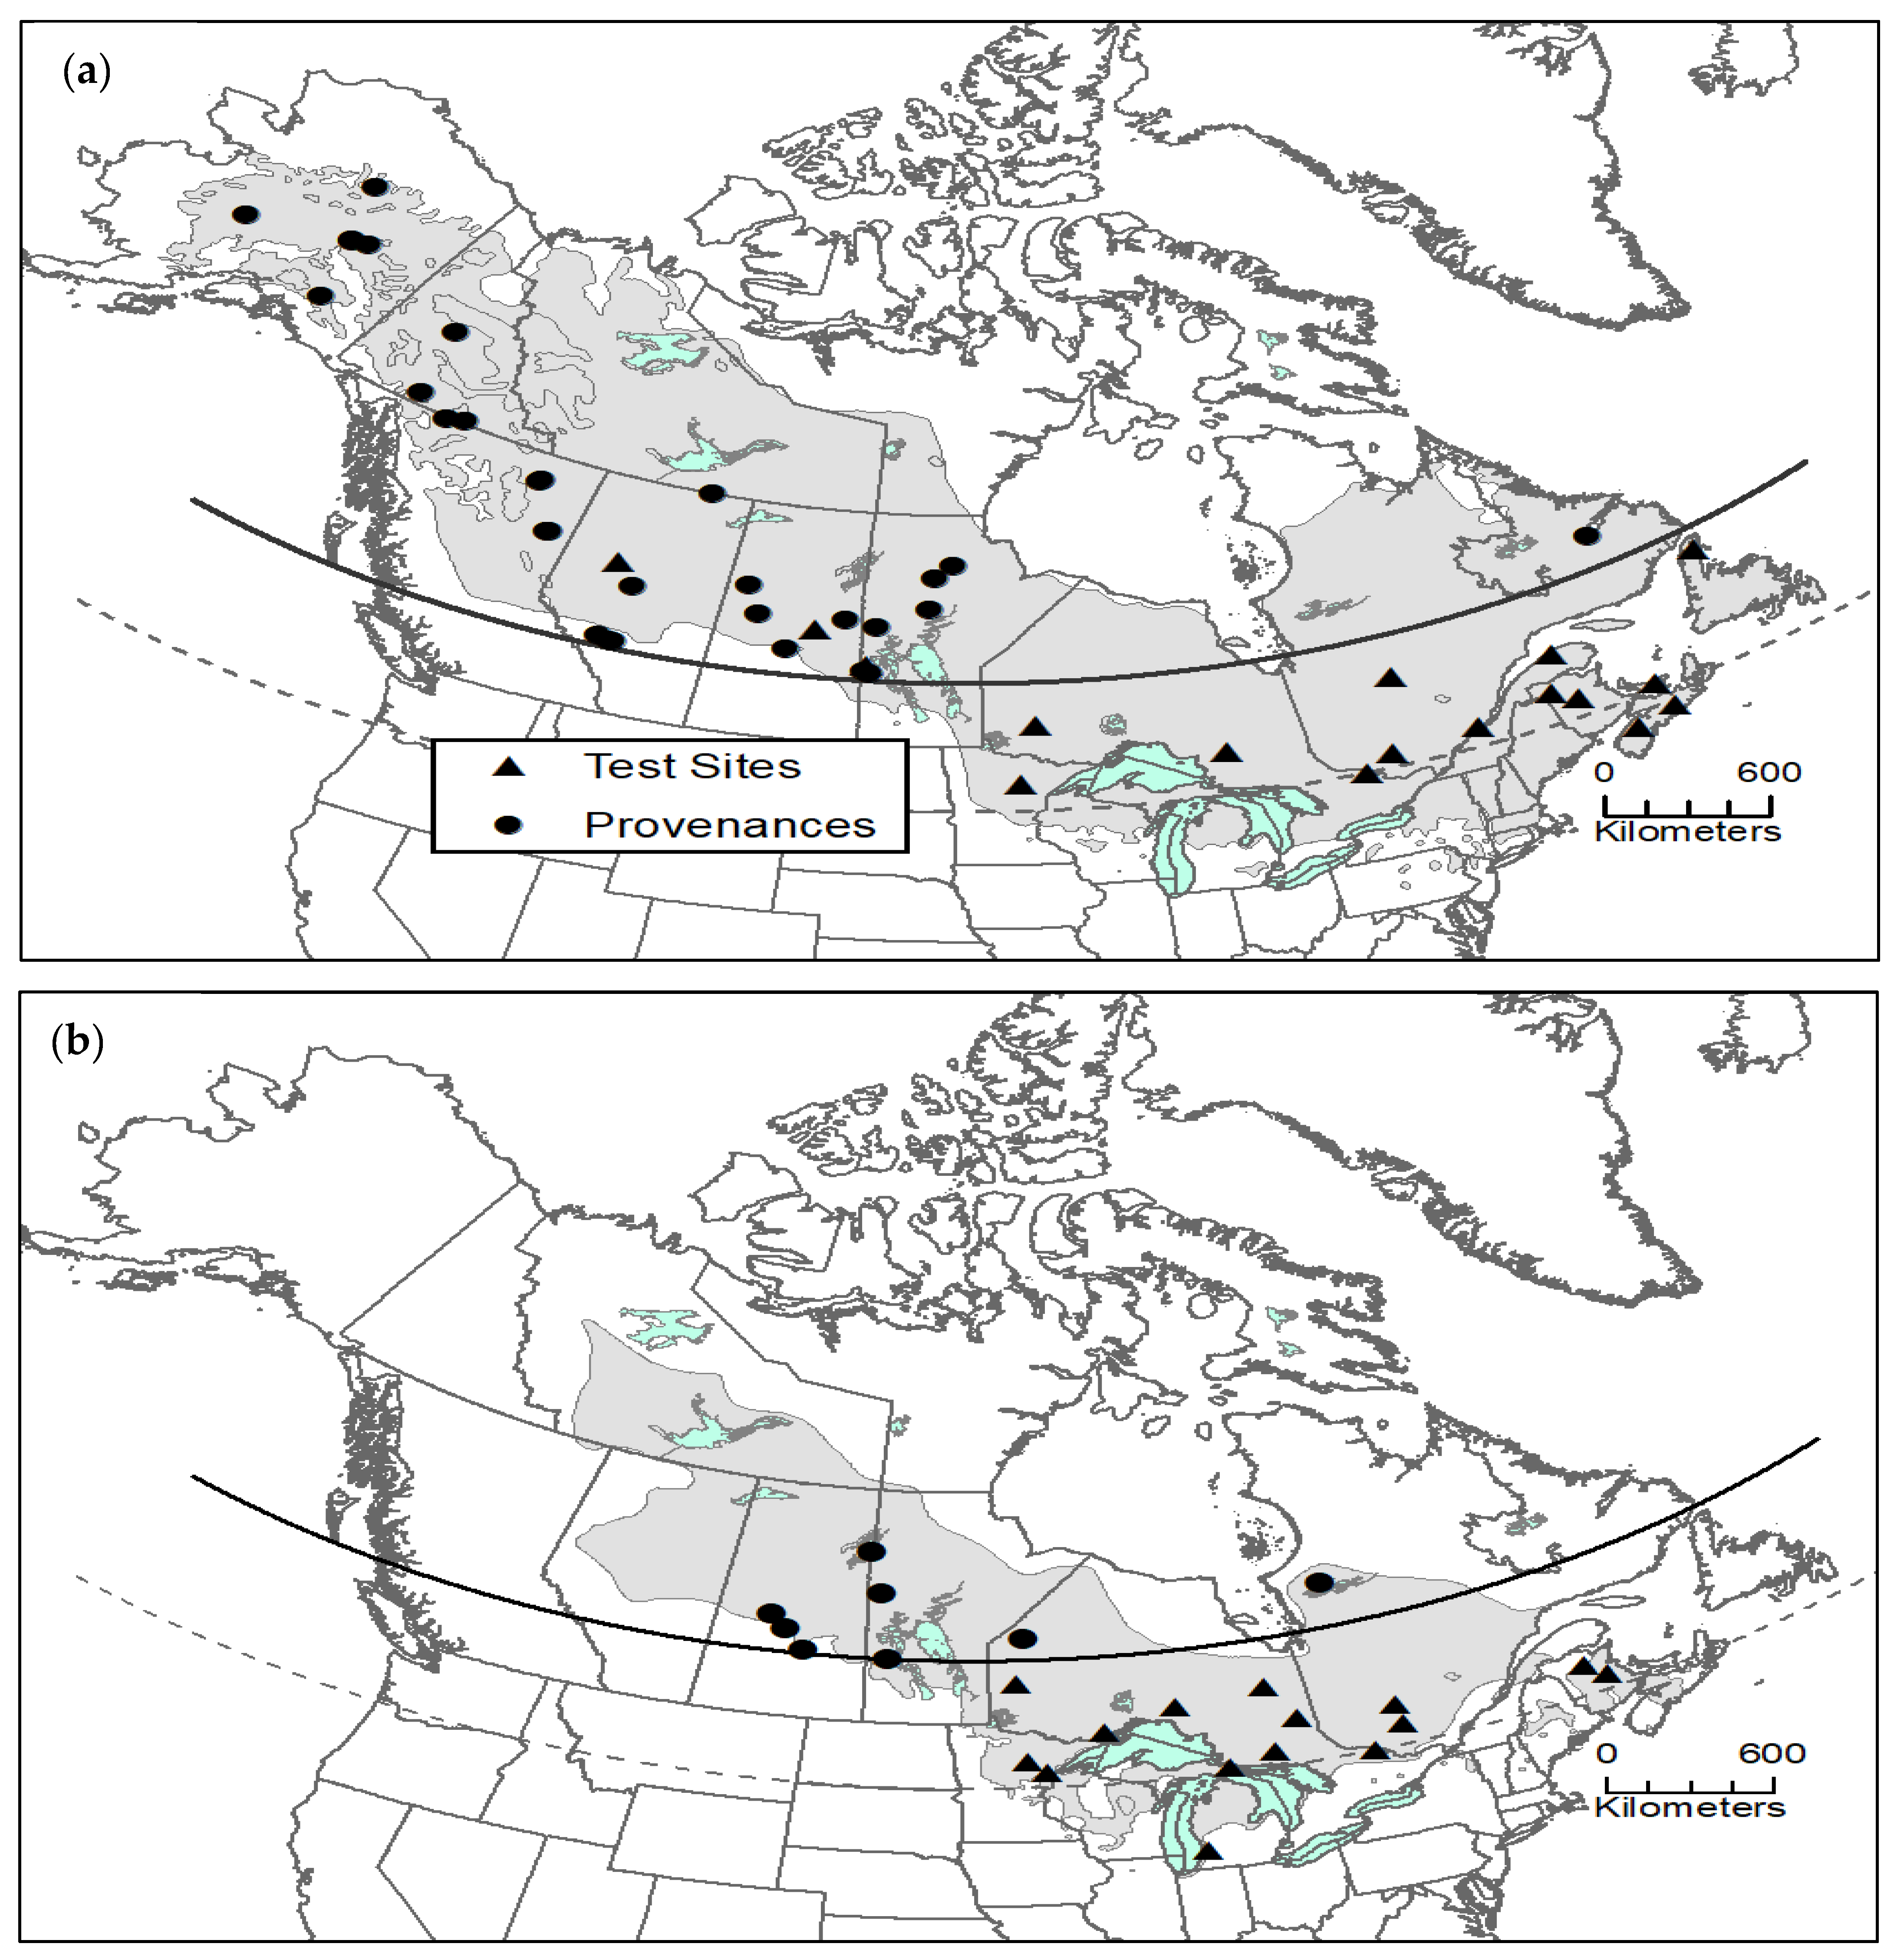
2.1. Provenance Study Data
2.2. Climate Data
2.3. Statistical Analyses
3. Results
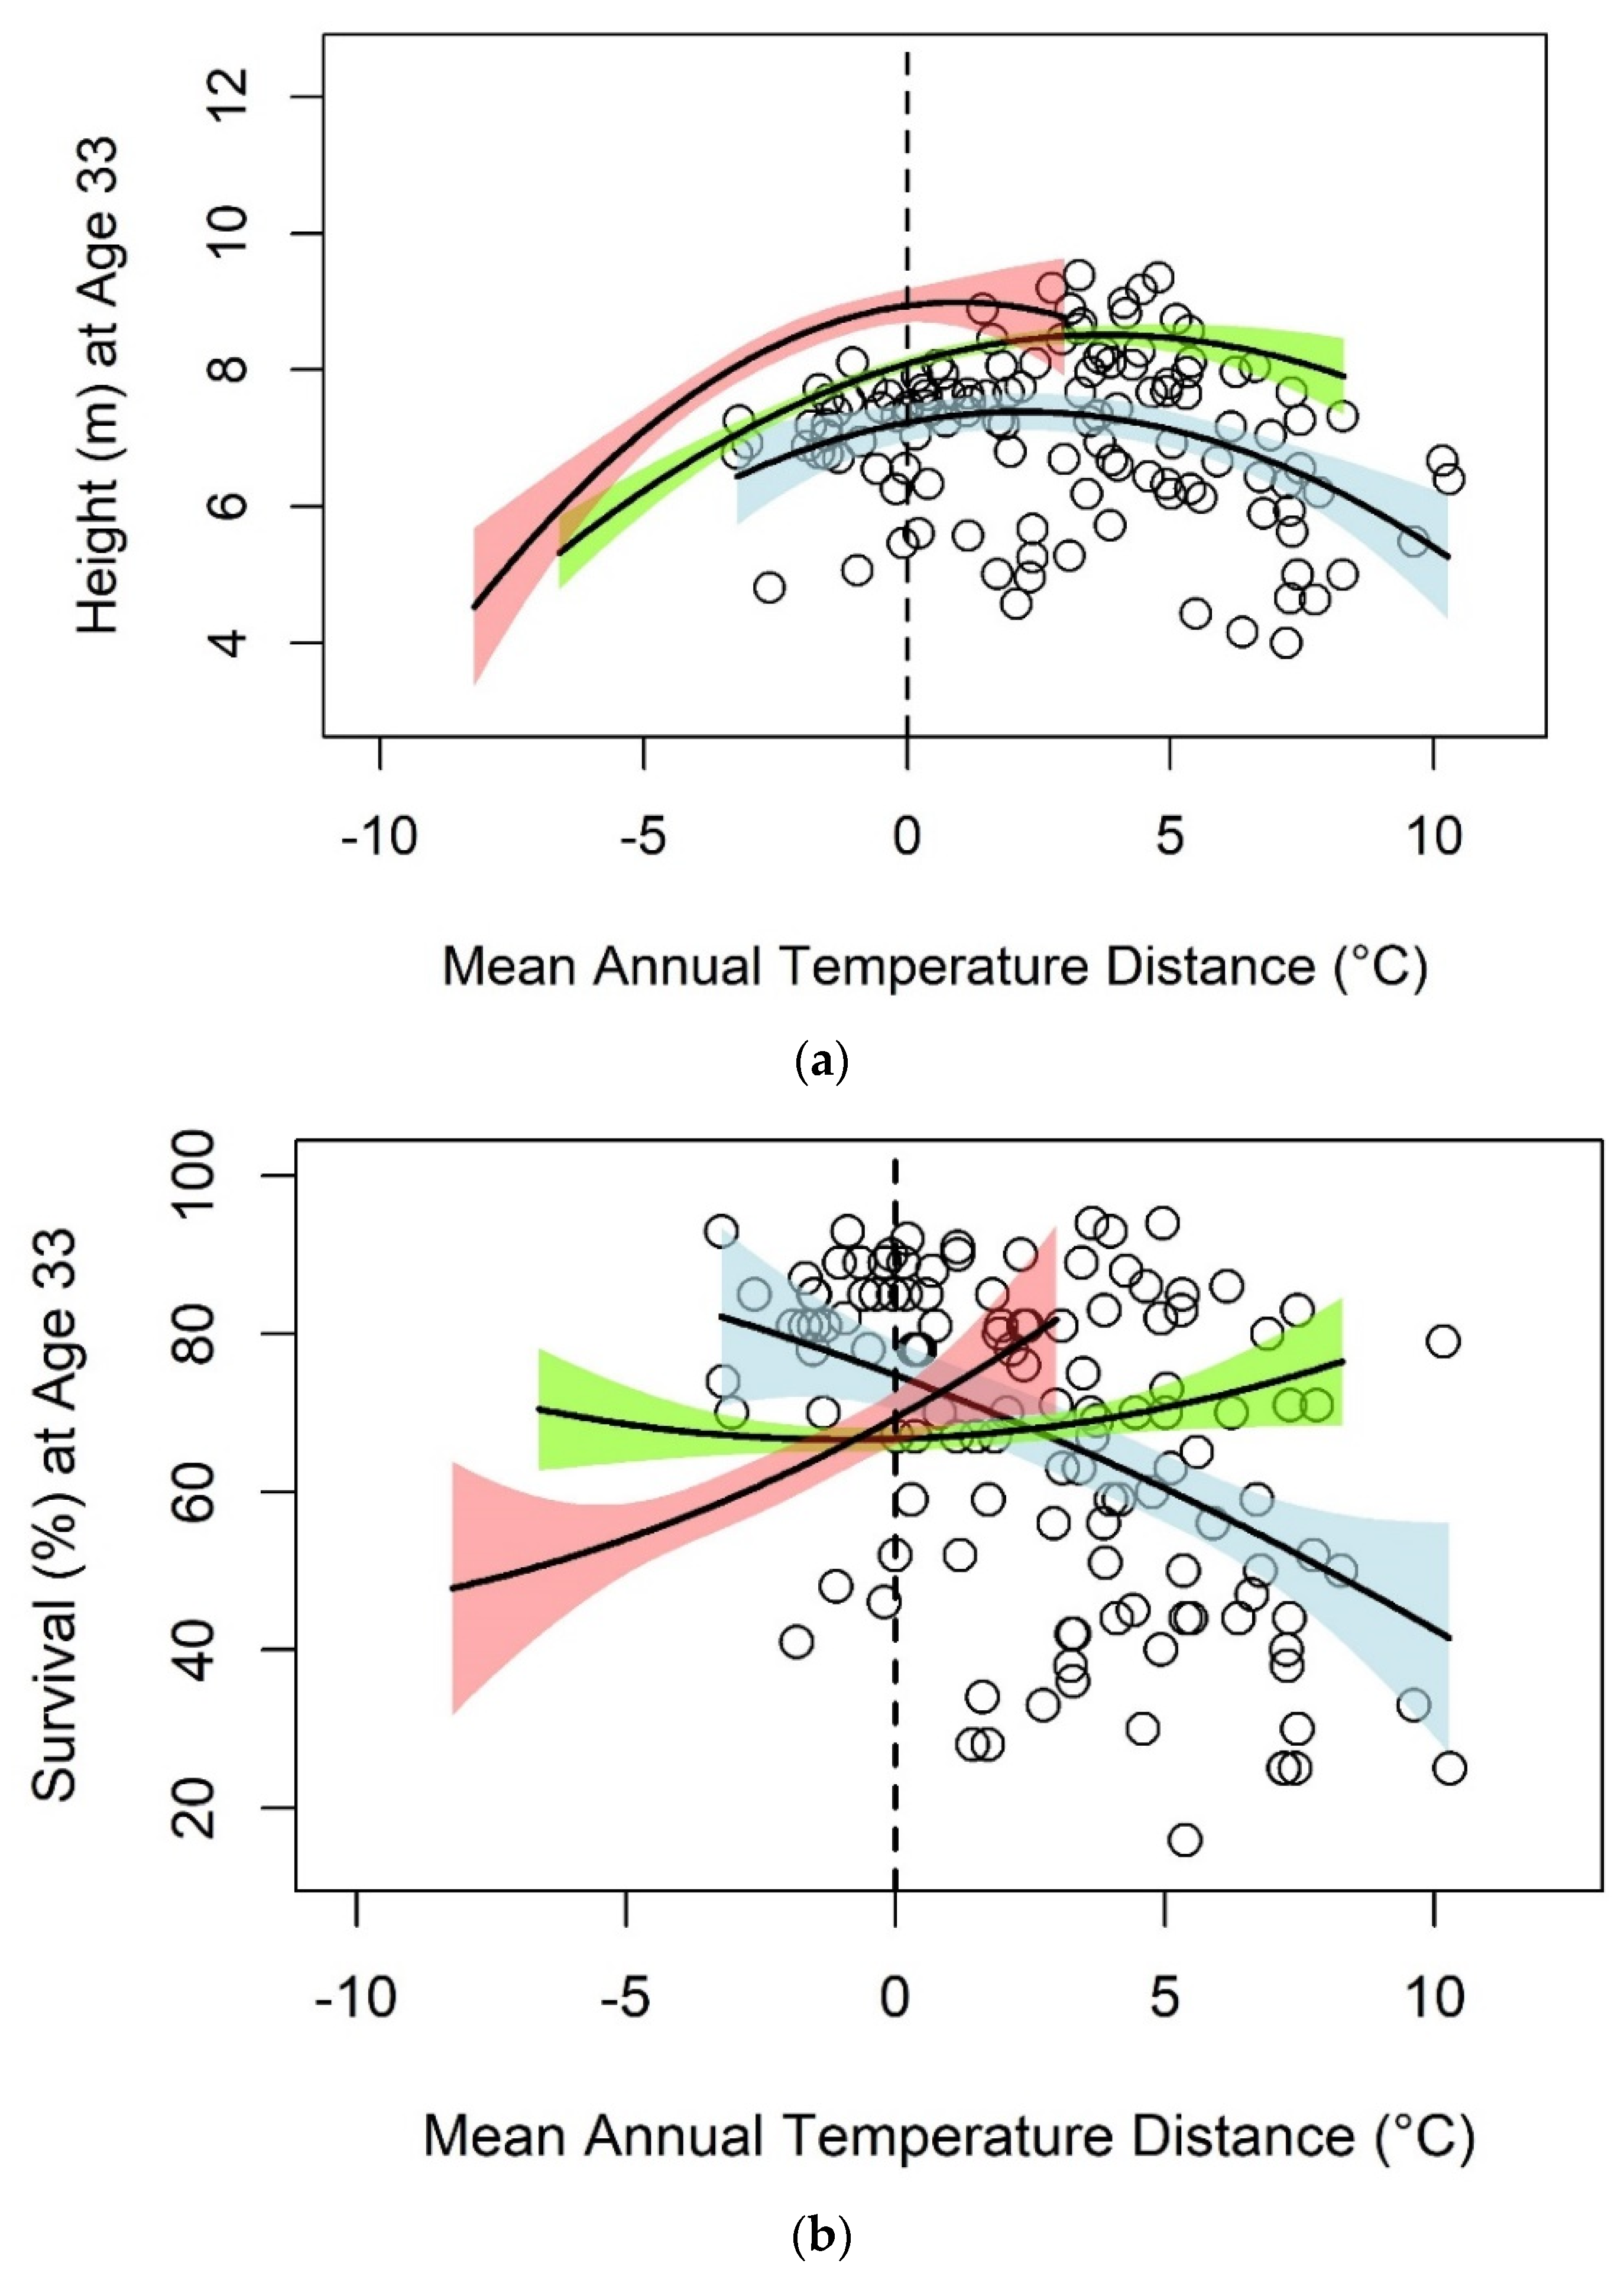
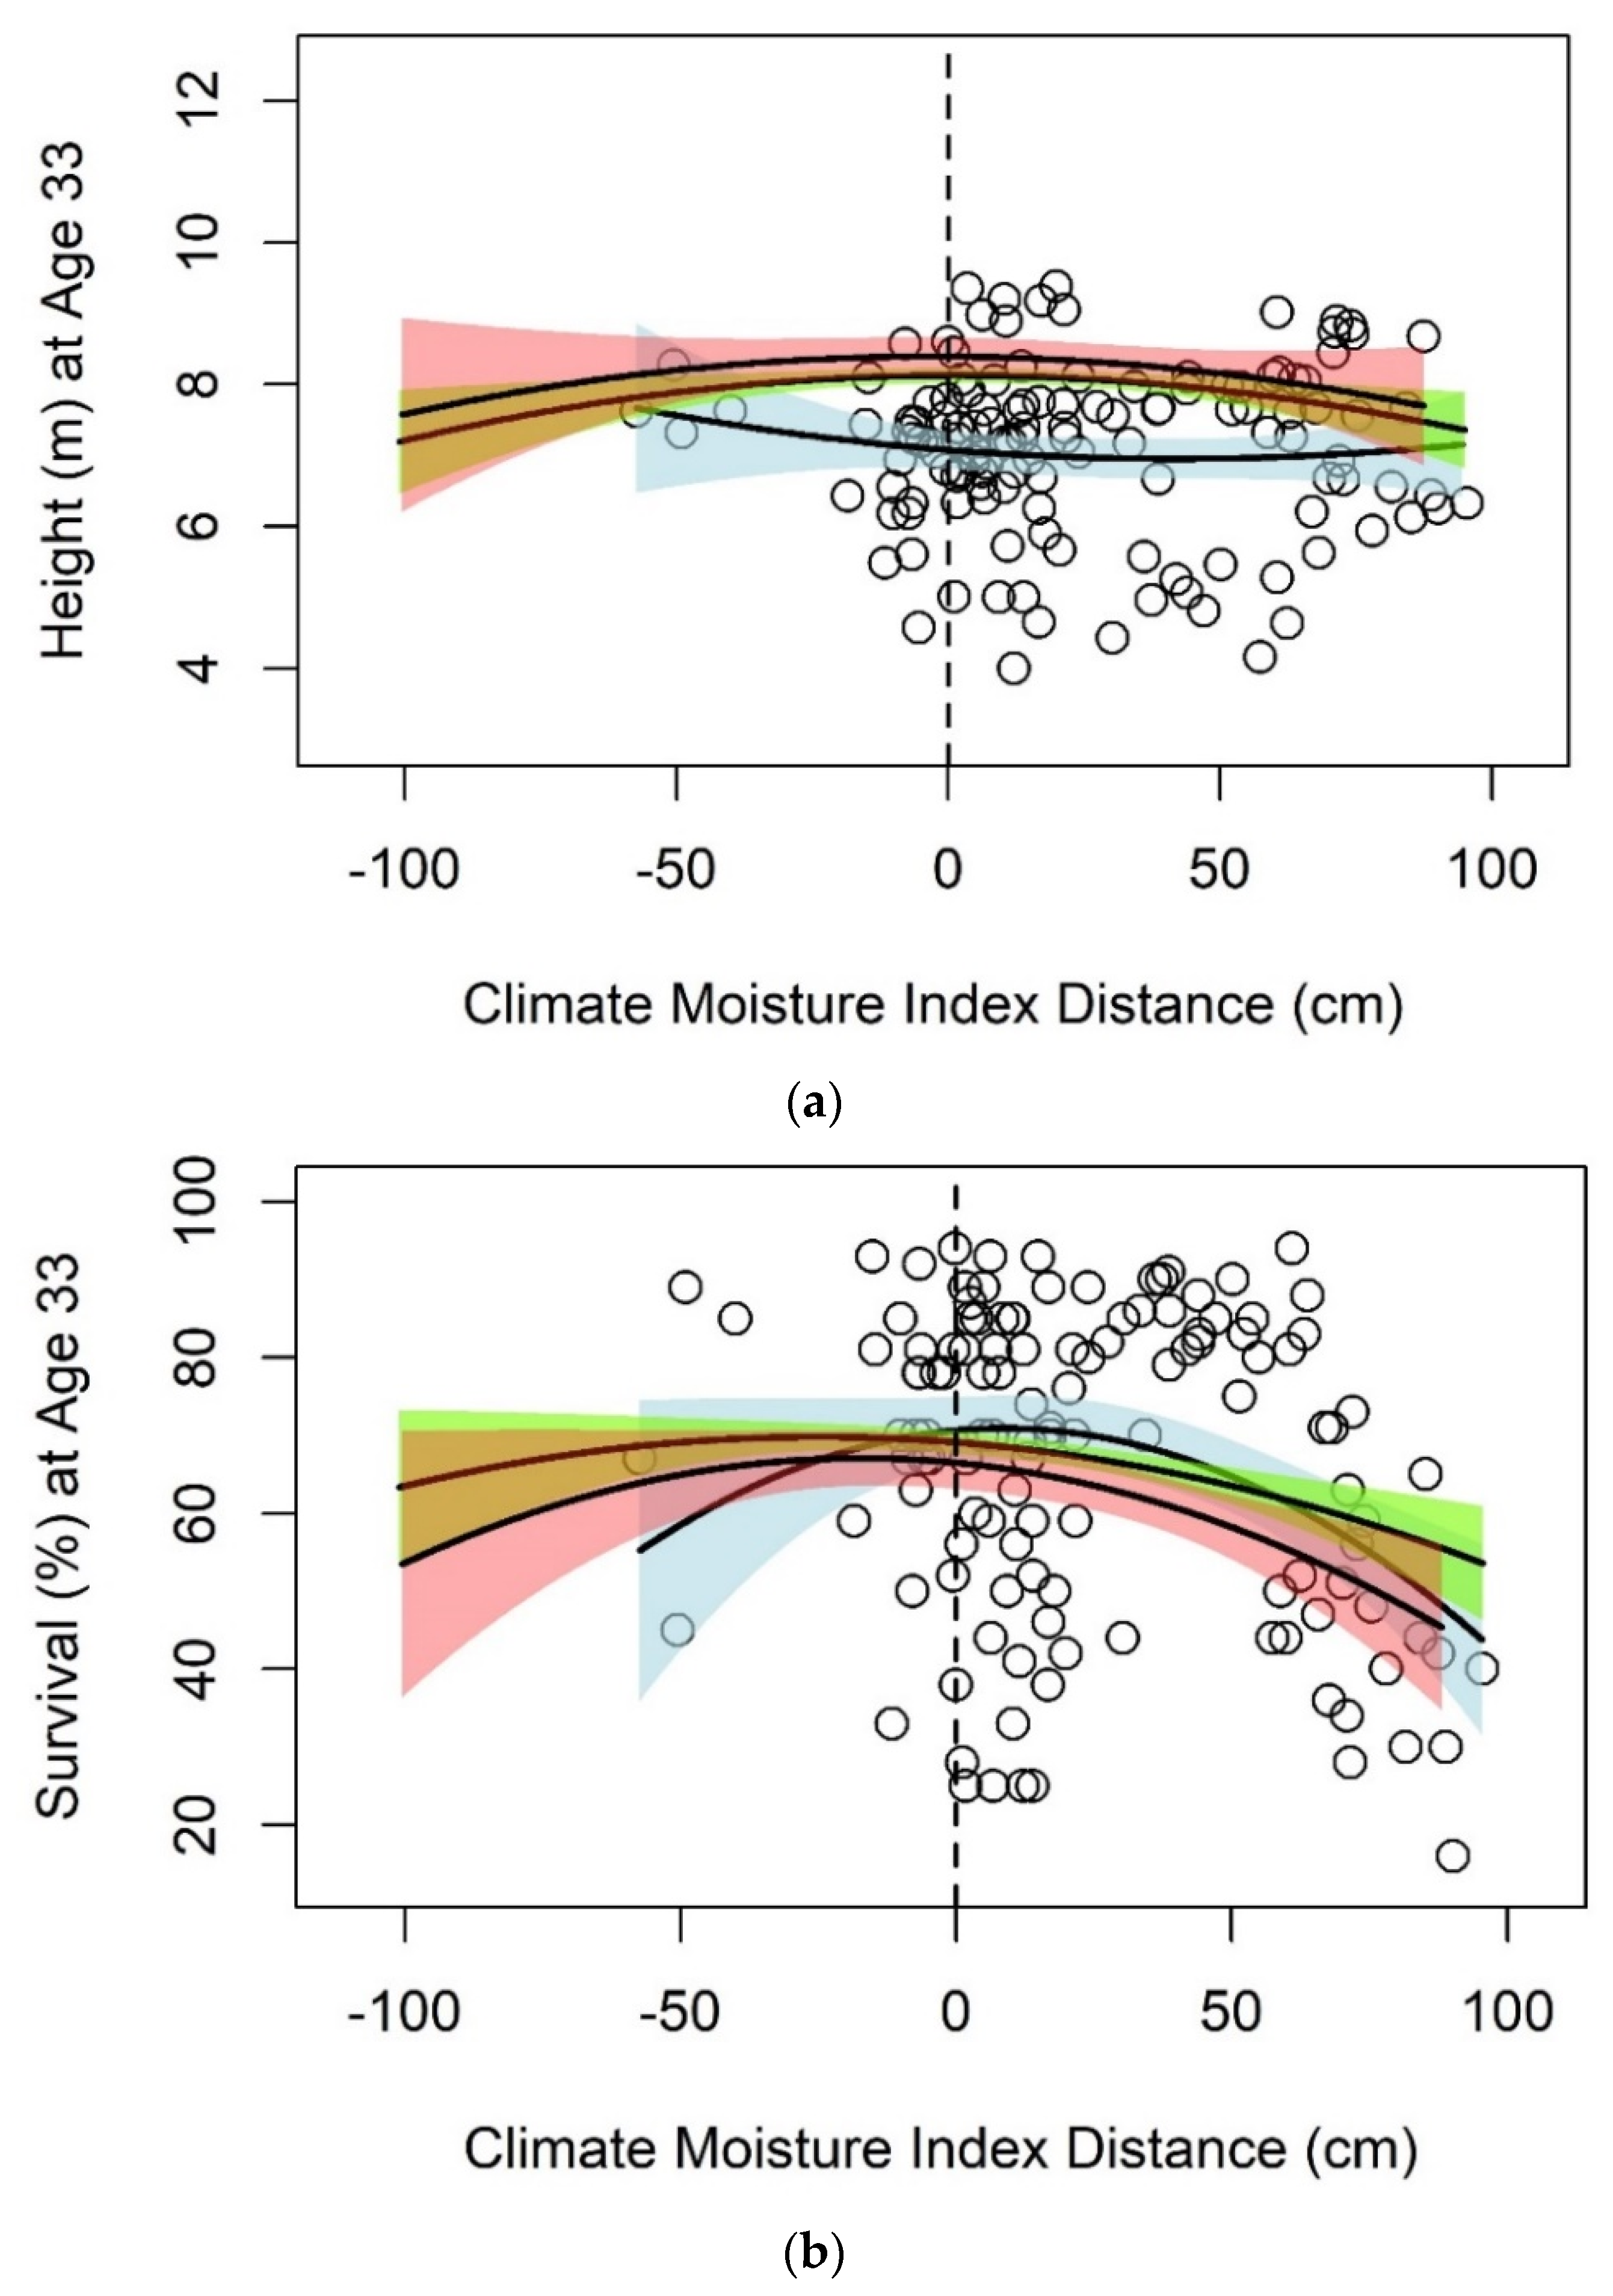
3.1. Black Spruce
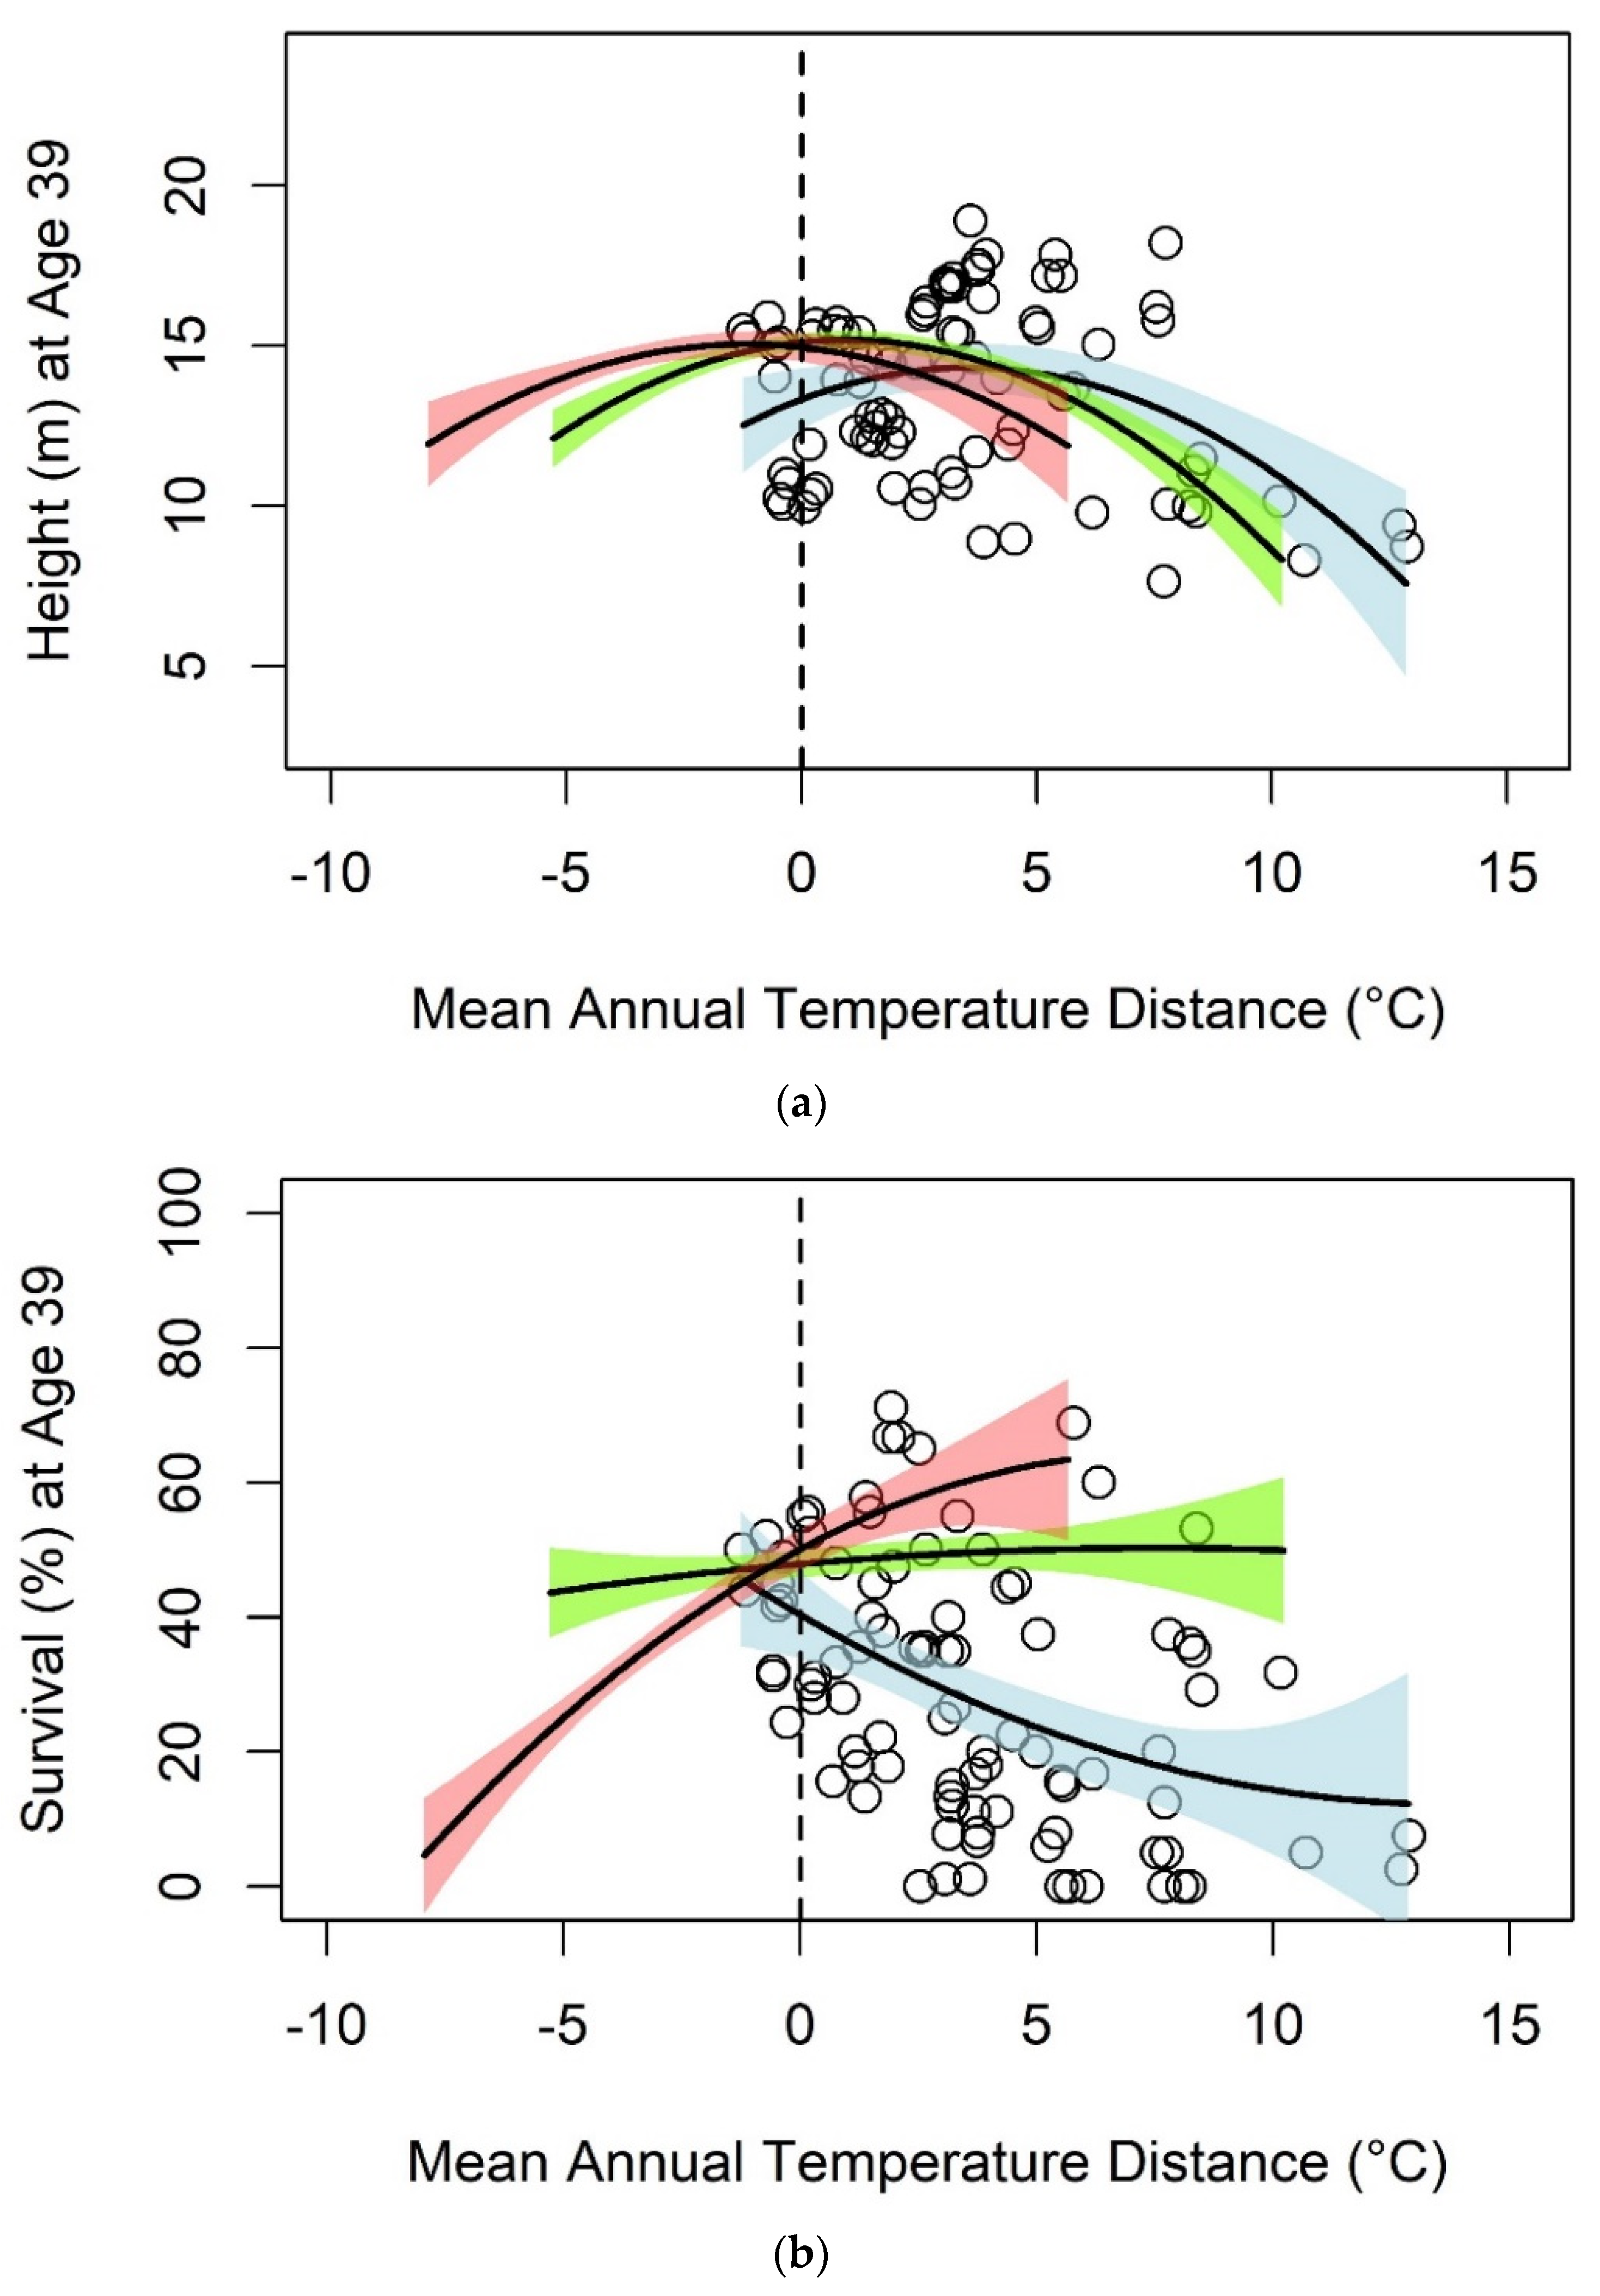
3.2. Jack Pine
4. Discussion
5. Conclusions
Supplementary Materials
Author Contributions
Funding
Institutional Review Board Statement
Informed Consent Statement
Data Availability Statement
Acknowledgments
Conflicts of Interest
References
- Box, J.E.; Colgan, W.T.; Christensen, T.R.; Schmidt, N.M.; Lund, M.; Parmentier, F.J.W.; Brown, R.; Bhatt, U.S.; Euskirchen, E.S.; Romanovsky, V.E.; et al. Key indicators of Arctic climate change: 1971–2017. Environ. Res. Lett. 2019, 14, 045010. [Google Scholar] [CrossRef]
- Vincent, L.A.; Zhang, X.; Brown, R.D.; Feng, Y.; Mekis, E.; Milewska, E.J.; Wan, H.; Wang, X.L. Observed trends in Canada’s climate and influence of low-frequency variability modes. J. Clim. 2015, 28, 4545–4560. [Google Scholar] [CrossRef]
- Zhang, X.; Flato, G.; Kirchmeier-Young, M.; Vincent, L.; Wan, H.; Wang, X.; Rong, R.; Fyfe, J.; Li, G.; Kharin, V.V. Changes in temperature and precipitation across Canada. In Canada’s Changing Climate Report; Bush, E., Lemmen, D.S., Eds.; Government of Canada: Ottawa, ON, Canada, 2019; pp. 112–193. [Google Scholar]
- Gamache, I.; Payette, S. Latitudinal response of subarctic tree lines to recent climate change in eastern Canada. J. Biogeogr. 2005, 32, 849–862. [Google Scholar] [CrossRef]
- Frost, G.V.; Epstein, H.E. Tall shrub and tree expansion in Siberian tundra ecotones since the 1960s. Glob. Chang. Biol. 2014, 20, 1264–1277. [Google Scholar] [CrossRef] [PubMed]
- Pearson, R.G.; Phillips, S.J.; Loranty, M.M.; Beck, P.S.; Damoulas, T.; Knight, S.J.; Goetz, S.J. Shifts in Arctic vegetation and associated feedbacks under climate change. Nat. Clim. Chang. 2013, 3, 673–677. [Google Scholar] [CrossRef]
- Girardin, M.P.; Bouriaud, O.; Hogg, E.H.; Kurz, W.; Zimmermann, N.E.; Metsaranta, J.M.; de Jong, R.; Frank, D.C.; Esper, J.; Büntgen, U.; et al. No growth stimulation of Canada’s boreal forest under half-century of combined warming and CO2 fertilization. Proc. Natl. Acad. Sci. USA 2016, 113, E8406–E8414. [Google Scholar] [CrossRef] [Green Version]
- Tei, S.; Sugimoto, A.; Yonenobu, H.; Matsuura, Y.; Osawa, A.; Sato, H.; Fujinuma, J.; Maximov, T. Tree-ring analysis and modeling approaches yield contrary response of circumboreal forest productivity to climate change. Glob. Chang. Biol. 2017, 23, 5179–5188. [Google Scholar] [CrossRef]
- Hofgaard, A.; Ols, C.; Drobyshev, I.; Kirchhefer, A.J.; Sandberg, S.; Söderström, L. Non-stationary response of tree growth to climate trends along the Arctic margin. Ecosystems 2019, 22, 434–451. [Google Scholar] [CrossRef] [Green Version]
- Goetz, S.J.; Epstein, H.E.; Bhatt, U.S.; Jia, G.J.; Kaplan, J.O.; Lischke, H.; Yu, Q.; Bunn, A.; Lloyd, A.H.; Alcaraz-Segura, D.; et al. Recent changes in Arctic vegetation: Satellite observations and simulation model predictions. In Eurasian Arctic Land Cover and Land Use in a Changing Climate; Gutman, G., Reissell, A., Eds.; Springer: Dordrecht, The Nederlands, 2010; pp. 9–36. [Google Scholar] [CrossRef]
- Berner, L.T.; Beck, P.S.A.; Bunn, A.G.; Goetz, S.J. Plant response to climate change along the forest-tundra ecotone in northeastern Siberia. Glob. Chang. Biol. 2013, 19, 3449–3462. [Google Scholar] [CrossRef]
- Sulla-Menashe, D.; Woodcock, C.E.; Friedl, M.A. Canadian boreal forest greening and browning trends: An analysis of biogeographic patterns and the relative roles of disturbance versus climate drivers. Environ. Res. Lett. 2018, 13, 014007. [Google Scholar] [CrossRef]
- Matyas, C. Modeling climate change effects with provenance test data. Tree Physiol. 1994, 14, 797–804. [Google Scholar] [CrossRef] [Green Version]
- Rehfeldt, G.E.; Ying, C.C.; Spittlehouse, D.L.; Hamilton, D.A. Genetic responses to climate in Pinus contorta: Niche breadth, climate change, and reforestation. Ecol. Monogr. 1999, 69, 375–407. [Google Scholar] [CrossRef]
- Wang, T.; Hamann, A.; Yanchuk, A.; O’Neill, G.A.; Aitken, S.N. Use of response functions in selecting lodgepole pine populations for future climates. Glob. Chang. Biol. 2006, 12, 2404–2416. [Google Scholar] [CrossRef]
- Thomson, A.M.; Riddell, C.L.; Parker, W.H. Boreal forest provenance tests used to predict optimal growth and response to climate change: 2. Black spruce. Can. J. For. Res. 2009, 39, 143–153. [Google Scholar] [CrossRef]
- Pedlar, J.H.; McKenney, D.W.; Lu, P. Critical seed transfer distances for selected tree species in eastern North America. J. Ecol. 2021, 109, 2271–2283. [Google Scholar] [CrossRef]
- Morgenstern, E.K. Geographic Variation in Forest Trees: Genetic Basis and Application of Knowledge in Silviculture; UBC Press: Vancouver, BC, Canada, 1996. [Google Scholar]
- Pedlar, J.H.; McKenney, D.W. Assessing the anticipated growth response of northern conifer populations to a warming climate. Sci. Rep. 2017, 7, 43881. [Google Scholar] [CrossRef] [Green Version]
- Savolainen, O.; Pyhajarvi, T.; Knurr, T. Gene flow and local adaptation in trees. Annu. Rev. Ecol. Evol. Syst. 2007, 38, 595–619. [Google Scholar] [CrossRef]
- Aitken, S.N.; Bemmels, J.B. Time to get moving: Assisted gene flow of forest trees. Evol Appl. 2016, 9, 271–290. [Google Scholar] [CrossRef] [PubMed]
- Selkirk, W.H. Origin of Provenances in the Cooperative, Range-Wide Black Spruce Study; Petawawa Forest Experiment Station: Chalk River, ON, Canada, 1974. [Google Scholar]
- Rudolph, T.D.; Yeatman, C.W. Genetics of Jack Pine; USDA Forest Service: Washington, DC, USA, 1982; 60p.
- Thomson, A.M.; Parker, W.H. Boreal forest provenance tests used to predict optimal growth and response to climate change. 1. Jack pine. Can. J. For. Res. 2008, 38, 157–170. [Google Scholar] [CrossRef]
- Burns, I.; James, P.M.; Coltman, D.W.; Cullingham, C.I. Spatial and genetic structure of the lodgepole × jack pine hybrid zone. Can. J. For. Res. 2019, 49, 844–853. [Google Scholar] [CrossRef]
- McKenney, D.W.; Hutchinson, M.F.; Papadopol, P.; Lawrence, K.; Pedlar, J.H.; Campbell, K.; Owen, T. Customized spatial climate models for North America. Bull. Am. Meteorol. Soc. 2011, 92, 1611–1622. [Google Scholar] [CrossRef]
- Mekis, E.; Donaldson, N.; Reid, J.; Zucconi, A.; Hoover, J.; Li, Q.; Nitu, R.; Melo, S. An overview of surface-based precipitation observations at Environment and Climate Change Canada. Atmos. Ocean. 2018, 56, 71–95. [Google Scholar] [CrossRef] [Green Version]
- Hogg, E.H. Climate and the southern limit of the western Canadian boreal forest. Can. J. For. Res. 1994, 24, 1835–1845. [Google Scholar] [CrossRef]
- Andalo, C.; Beaulieu, J.; Bousquet, J. The impact of climate change on growth of local white spruce populations in Quebec, Canada. For. Ecol. Manag. 2005, 205, 169–182. [Google Scholar] [CrossRef]
- Wang, T.; O’Neill, G.A.; Aitken, S.N. Integrating environmental and genetic effects to predict responses of tree populations to climate. Ecol. Appl. 2010, 20, 153–163. [Google Scholar] [CrossRef]
- Leites, L.P.; Robinson, A.P.; Rehfeldt, G.E.; Marshall, J.D.; Crookston, N.L. Height-growth response to climatic changes differs among populations of Douglas-fir: A novel analysis of historic data. Ecol. Appl. 2012, 22, 154–165. [Google Scholar] [CrossRef]
- Yang, J.; Pedlar, J.H.; McKenney, D.W.; Weersink, A. The development of universal response functions to facilitate climate-smart regeneration of black spruce and white pine in Ontario, Canada. For. Ecol. Manag. 2015, 339, 34–43. [Google Scholar] [CrossRef]
- R Core Team. R: A Language and Environment for Statistical Computing; R Foundation for Statistical Computing: Vienna, Austria, 2019; Available online: https://www.R-project.org/ (accessed on 12 October 2021).
- Huang, J.; Tardif, J.C.; Bergeron, Y.; Denneler, B.; Berninger, F.; Girardin, M.P. Radial growth response of four dominant boreal tree species to climate along a latitudinal gradient in the eastern Canadian boreal forest. Glob. Chang. Biol. 2010, 16, 711–731. [Google Scholar] [CrossRef]
- Andreu-Hayles, L.; D’Arrigo, R.; Anchukaitis, K.J.; Beck, P.S.A.; Frank, D.; Goetz, S. Varying boreal forest response to Arctic environmental change at the Firth River. Alaska Environ. Res. Lett. 2011, 6, 045503. [Google Scholar] [CrossRef]
- Lu, P.; Parker, W.H.; Cherry, M.; Colombo, S.; Parker, W.C.; Man, R.; Roubal, N. Survival and growth patterns of white spruce (Picea glauca [Moench] Voss) rangewide provenances and their implications for climate change adaptation. Ecol. Evol. 2014, 4, 2360–2374. [Google Scholar] [CrossRef] [PubMed]
- Isaac-Renton, M.; Montwé, D.; Hamann, A.; Spiecker, H.; Cherubini, P.; Treydte, K. Northern forest tree populations are physiologically maladapted to drought. Nat. Commun. 2018, 9, 5254. [Google Scholar] [CrossRef] [Green Version]
- Hogg, E.H. Temporal scaling of moisture and the forest-grassland boundary in western Canada. Agric. For. Meteorol. 1997, 84, 115–122. [Google Scholar] [CrossRef] [Green Version]
- Michaelian, M.; Hogg, E.H.; Hall, R.J.; Arsenault, E. Massive mortality of aspen following severe drought along the southern edge of the Canadian boreal forest. Glob. Chang. Biol. 2011, 17, 2084–2094. [Google Scholar] [CrossRef] [Green Version]
- Hogg, E.H.; Michaelian, M.; Hook, T.I.; Undershultz, M.E. Recent climatic drying leads to age-independent growth reductions of white spruce stands in western Canada. Glob. Chang. Biol. 2017, 23, 5297–5308. [Google Scholar] [CrossRef] [PubMed]
- Cruzado-Vargas, A.L.; Blanco-García, A.; Lindig-Cisneros, R.; Gómez-Romero, M.; Lopez-Toledo, L.; de la Barrera, E.; Sáenz-Romero, C. Reciprocal Common Garden Altitudinal Transplants Reveal Potential Negative Impacts of Climate Change on Abies religiosa Populations in the Monarch Butterfly Biosphere Reserve Overwintering Sites. Forests 2021, 12, 69. [Google Scholar] [CrossRef]
- Morgenstern, E.K.; Mullin, T.J. Growth and survival of black spruce in the range-wide provenance study. Can. J. For. Res. 1990, 20, 130–143. [Google Scholar] [CrossRef]
- Martínez-Berdeja, A.; Hamilton, J.A.; Bontemps, A.; Schmitt, J.; Wright, J.W. Evidence for population differentiation among Jeffrey and Ponderosa pines in survival, growth and phenology. For. Ecol. Manag. 2019, 434, 40–48. [Google Scholar] [CrossRef]
- O’Neill, G.A.; Stoehr, M.; Jaquish, B. Quantifying safe seed transfer distance and impacts of tree breeding on adaptation. For. Ecol. Manag. 2014, 328, 122–130. [Google Scholar] [CrossRef]
- Carmean, W.H. Site Classification for Northern Forest Species; General Technical Report NE-29; Department of Agriculture, Forest Service, Northeastern Forest Experiment Station: Upper Darby, PA, USA, 1977; pp. 205–239.
- Li, Z.; Huffman, T.; Zhang, A.; Zhou, F.; McConkey, B. Spatially locating soil classes within complex soil polygons–Mapping soil capability for agriculture in Saskatchewan Canada. Agric. Ecosyst. Environ. 2012, 152, 59–67. [Google Scholar] [CrossRef]
- Way, D.A.; Montgomery, R.A. Photoperiod constraints on tree phenology, performance and migration in a warming world. Plant. Cell Environ. 2015, 38, 1725–1736. [Google Scholar] [CrossRef]
- Sebastian-Azcona, J.; Hamann, A.; Hacke, U.G.; Rweyongeza, D. Survival, growth and cold hardiness tradeoffs in white spruce populations: Implications for assisted migration. For. Ecol. Manag. 2019, 433, 544–552. [Google Scholar] [CrossRef]
- Rollinson, C.R.; Kaye, M.W. Experimental warming alters spring phenology of certain plant functional groups in an early successional forest community. Glob. Chang. Biol. 2012, 18, 1108–1116. [Google Scholar] [CrossRef]
- Laube, J.; Sparks, T.H.; Estrella, N.; Höfler, J.; Ankerst, D.P.; Menzel, A. Chilling outweighs photoperiod in preventing precocious spring development. Glob. Chang. Biol. 2014, 20, 170–182. [Google Scholar] [CrossRef] [PubMed]
- Huang, J.; Ma, Q.; Rossi, S.; Biondi, F.; Deslauriers, A.; Fonti, P.; Liang, E.; Mäkinen, H.; Oberhuber, W.; Rathgeber, C.B.K.; et al. Photoperiod and temperature as dominant environmental drivers triggering secondary growth resumption in Northern Hemisphere conifers. Proc. Natl. Acad. Sci. USA 2020, 117, 20645–20652. [Google Scholar] [CrossRef]
- Ste-Marie, C.A.; Nelson, E.; Dabros, A.; Bonneau, M.E. Assisted migration: Introduction to a multifaceted concept. For. Chron. 2011, 87, 724–730. [Google Scholar] [CrossRef] [Green Version]
- Pedlar, J.H.; McKenney, D.W.; Aubin, I.; Beardmore, T.; Beaulieu, J.; Iverson, L.; O’Neill, G.A.; Winder, R.S.; Ste-Marie, C. Placing forestry in the assisted migration debate. BioScience 2012, 62, 835–842. [Google Scholar] [CrossRef]
- Kuparinen, A.; Savolainen, O.; Schurr, F.M. Increased mortality can promote evolutionary adaptation of forest trees to climate change. For. Ecol. Manag. 2010, 259, 1003–1008. [Google Scholar] [CrossRef]


| Species | Climate Variable | Response Variable | N | Intercept (β0) | Slope 1 (β1) | Slope 2 (β2) | R-Squared |
|---|---|---|---|---|---|---|---|
| Black Spruce | Mean Annual Temperature | Height | 125 | 7.230 | 0.1418 * | −0.0325 *** | 0.12 |
| Survival | 125 | 74.777 | −2.5179 * | −0.0702 | 0.21 | ||
| Climate Moisture Index | Height | 125 | 7.075 | −0.0061 | 0.00007 | 0.01 | |
| Survival | 125 | 70.618 | 0.0620 | −0.0036 ** | 0.11 | ||
| Jack Pine | Mean Annual Temperature | Height | 86 | 13.327 | 0.5538 * | −0.0778 *** | 0.17 |
| Survival | 93 | 40.413 | −4.0798 ** | 0.1473 | 0.19 | ||
| Climate Moisture Index | Height | 86 | 14.196 | 0.0046 | −0.0005 | 0.06 | |
| Survival | 93 | 21.809 | 0.5038 ** | −0.0051 * | 0.11 |
Publisher’s Note: MDPI stays neutral with regard to jurisdictional claims in published maps and institutional affiliations. |
© 2021 by the authors. Licensee MDPI, Basel, Switzerland. This article is an open access article distributed under the terms and conditions of the Creative Commons Attribution (CC BY) license (https://creativecommons.org/licenses/by/4.0/).
Share and Cite
Pedlar, J.H.; McKenney, D.W.; Lu, P.; Thomson, A. Response of Northern Populations of Black Spruce and Jack Pine to Southward Seed Transfers: Implications for Climate Change. Atmosphere 2021, 12, 1363. https://0-doi-org.brum.beds.ac.uk/10.3390/atmos12101363
Pedlar JH, McKenney DW, Lu P, Thomson A. Response of Northern Populations of Black Spruce and Jack Pine to Southward Seed Transfers: Implications for Climate Change. Atmosphere. 2021; 12(10):1363. https://0-doi-org.brum.beds.ac.uk/10.3390/atmos12101363
Chicago/Turabian StylePedlar, John H., Daniel W. McKenney, Pengxin Lu, and Ashley Thomson. 2021. "Response of Northern Populations of Black Spruce and Jack Pine to Southward Seed Transfers: Implications for Climate Change" Atmosphere 12, no. 10: 1363. https://0-doi-org.brum.beds.ac.uk/10.3390/atmos12101363