
Estimation of Emission Factors for Hazardous Air Pollutants from Petroleum Refineries


Department of Chemistry, Materials and Chemical Engineering “Giulio Natta”, Politecnico di Milano, Piazza Leonardo da Vinci 32, 20133 Milano, Italy
*
Author to whom correspondence should be addressed.
Atmosphere 2021, 12(11), 1531; https://0-doi-org.brum.beds.ac.uk/10.3390/atmos12111531
Submission received: 22 October 2021
/
Revised: 15 November 2021
/
Accepted: 17 November 2021
/
Published: 20 November 2021
(This article belongs to the Special Issue Air Pollution, Air Quality and Human Health)
Abstract
:The hazardous air pollutants (HAPs) group is composed of 187 chemicals that are known to be potentially carcinogenic and dangerous for human health. Due to their toxicological impact, HAPs are an increasingly studied class of compounds. Of the different HAPs sources, refineries are one of the major sources. In order to obtain a preliminary assessment of the impact of a refinery in terms of emissions, a useful instrument is the determination of the emission factor (EF). For this reason, this work, focusing on the USA refining scenario, aims to provide evidence for a generic trend in refinery emissions to evaluate a correlation between the plant size and the amount of its emissions, in particular the HAPs emissions. Based on the analysis of the data collected from the U.S. Environmental Protection Agency (US EPA), a general trend in the emissions from refinery plants was established, showing a positive correlation between the HAPs emissions and the refinery size, represented by a value of the Pearson correlation coefficient r close to 1. Once this correlation was highlighted, a purpose of this work became the estimation of an organic HAPs emission factor (EF): from a whole refining plant, the EF of the total organic HAPs is equal to 10 g emitted for each ton of crude oil processed. Moreover, it was also possible to undertake the same evaluation for two specific HAP molecules: benzene and formaldehyde. The benzene and formaldehyde EFs are equal to, respectively, 0.8 g and 0.2 g for each ton of processed crude oil. This work provides a simple rule of thumb for the estimation of hazardous substances emitted from petroleum refineries in their mean operating conditions.
1. Introduction
One of the main environmental impacts of refinery process units is represented by atmospheric emissions, which are typically constituent of CO, CO2, SO2, NOX, CH4, particulates, and volatile organic compounds (VOCs) [1,2,3]. VOCs are emitted from a variety of sources [4,5,6,7,8,9,10,11] and, in recent years, the attention toward the emission of VOCs has been increasing due to the consistent amount of VOCs emitted from different industrial processes and their environmental and health impact [12,13,14]. In addition, VOC emissions can produce odor annoyance [15,16,17], which can have a negative impact on life quality [18,19]. Among this class of substances, 187 compounds have been defined as hazardous air pollutants (HAPs) [20] according to their hazardous potential. Indeed, all the pollutants recognized or suspected as carcinogens, according to the International Agency for Research on Cancer (IARC), or able to cause other serious health issues, such as reproductive or birth defects, or adverse environmental effects, are defined as HAPs [21]. Regarding the specific case of refineries, which are a major source of VOCs [22,23,24], the US Environment Protection Agency (US EPA) decided to monitor the emission of substances classified as HAPs by collecting them in a database called Comprehensive data collected from the petroleum refining sector [25,26].
Despite the potential environmental and health problems related to the emissions of VOCs from refineries, no environmental control agencies, at the current state of technical and regulatory progress, have provided an emission limit for VOCs as a class of substances. In fact, unlike the previously mentioned oxidized combustion products [2] for which environmental control agencies all over the world have imposed and, over the years, continue to revise and lower the limits for annual refinery emissions [27], an emission limit for VOCs has not been established yet. Several considerations on the lack of regulatory limits for VOC emissions, such as the importance of considering an emission factor for these compounds as a class of chemicals for the refining landscape, were addressed in previous work by the authors of this document: a numerical emission factor for the total VOCs emitted from Italian and European petroleum refineries has been evaluated [28]. Furthermore, considerations on the difficulties of the quantification of the emission rate have been recently exposed [29]. This lack of regulatory limits and methodology on emissions remains true even in the more specific case of the sub-category of HAP compounds. In this specific case, in reference to the Clean Air Act (CAA) [30], the EPA Potential to Emit (PTE) [31], and to the United States Code (USC) Title 42—The Public Health And Welfare, Chapter 85—Air Pollution Prevention And Control [32], a cut-off value in the emission of HAPs can be found, but it is established only to determine if a plant has to be considered a major or minor emitting source. A major emitting source is every plant or installation capable of emitting 10 ton/y of a single compound out of the 187 HAPs or 25 ton/y of a mixture of two or more HAPs [31].
A possible tool for an immediate investigation of the emission level and the associated impacts related to the release of a pollutant substance from a plant into the atmosphere is the so-called emission factor (EF). In general, an emission factor is a representative value that relates the quantity of a pollutant released to the atmosphere to a given associated activity [33].
Therefore, this work aims to provide emission factors (EFs) relevant to the HAPs emitted by US refineries based on their emission capacity[34,35]. The evaluation of a global EF is an important tool for the assessment of plant emissions and its impact: this value will provide a tool useful for a preliminary estimation of the hazardous substances emitted from petroleum refineries, representative of an average emissive situation, thereby excluding peak conditions and incidental releases. Indeed, a global EF provides a preliminary evaluation of plant emissions without detailed knowledge of the processing units. For the same reason, the impact of the entire plant could be evaluated without conducting specific experimental field measurements but only knowing the EF and the operation capacity. The procedure followed to determine an EF for HAPs was to compare the total emissions of the refineries collected in the EPA database [25] with their respective operational capabilities in order to highlight characteristic and repeatable trends and to verify the possibility to generalize the statements and to relate the emissions to the capacity of a plant through a general trend. Once the relationship between emissions and plant size was highlighted, it was possible to determine a preliminary EF capable of providing a first estimate of the emissions of an installation based on its size. This number allows evaluating the first-trial evaluation of the impacts on human health and the environment of a selected plant based on its production capacity.
In this paper, based on the EPA database analysis, three different pollutant classes were considered:
- the first one, relevant to the total HAPs emissions, includes all the potentially carcinogenic compounds emitted from a refinery plant, both organics and inorganics;
- the second one, which aims to be representative of the emissions of VOCs, is relevant to the compounds classified as “organic HAPs”, thereby excluding inorganic compounds;
- two single compounds (i.e., benzene and formaldehyde), selected based on their contribution to the total emissions and the criticalities they present, were selected in order to carry out evaluations on the behavior of a single compound emitted by a refinery.
It is possible to notice that, among the 187 substances classified as HAPs, there is a 5small number of compounds (i.e., 26) that represent a major contribution (i.e., 90%) to the total hazardous emissions. Based on this observation, it was decided to further focus the analysis on two compounds (benzene and formaldehyde) in order to verify that the trend of the emitted quantity obtained for these substances was similar to the general trend observed for the overall emissions. Formaldehyde and benzene were chosen as the target compounds for this analysis because of their relevance both in terms of emitted concentration and of toxicological potential [36,37,38]. In Section 2, a detailed description of the source of raw data, the used statistics basics, and the preprocessing is provided. Section 3 reports the numerical results of the total and single HAP contributions in the EFs. Finally, Section 4 provides a summary of the conclusions of this study.
2. Materials and Methods
2.1. Origin of the Emission Data
Every three years, the US EPA draws up a database including the HAPs emissions of all the refining plants present in the USA. This document is named Comprehensive Data Collected from the Petroleum Refining Sector [25]. At the time of drafting this paper, the most updated available version of this collection is the one of 2011, which was, therefore, analyzed for the present work. In the EPA database, it is possible to find a multitude of information relevant to the plants, such as the production capacity, the geographical position, the equipment that constitutes the refineries, and, more importantly for the purpose of this work, the HAPs emitted, evaluated both in qualitative and quantitative terms and reported for each different plant section. The EPA document follows an extensive and complex procedure to obtain quantitative and qualitative information on the emissive scenario related to US refineries. The agency collects information directly from all American refineries using the Information Collection Request (ICR), in which the plants must report their emission levels. After data collection, the collected data are organized by US EPA into a consultable database. Only a small amount of information is excluded from this collection (i.e., data protected by corporate no disclosure agreement and patent), listed as Confidential Business Information (CBI) and not available for consultation. These datasets are used for the development of regulations relating to the oil refining sector.
For the intended purpose, the collected information regarding the plant’s size or the production capacity and the total emissions is extremely important, as well as the speciation of the HAPs present in those emissions.
It should be specified that the speciation of chemical emissions reported in this data collection does not consider combustion products, such as CO, CO2, NOX, and SOX. The EPA database includes emission data (ton/y) for the calendar year 2010 for individual HAPs and data relating to all the emission sources located in the plant. The examined emission sources include:
- Each processing unit for which an identification code has been provided;
- Each unit of electricity generation, steam or heat generation, and power combined;
- Each process heater;
- Each fuel and natural gas system for which equipment leakage data have been provided;
- Each storage tank regardless of the size or partial pressure of the stored material;
- Any “other atmospheric vent”;
- Every flare.
This collection of information may be extremely exhaustive. Indeed, within this database, it is possible to research each substance separately for each plant investigated. In addition, it is possible to know the flow rates of pollutants released by each refinery equipment and, for each of these, evaluate the speciation of the emissions.
2.2. Emission Data Regression through the Estimation of the Pearson Correlation Coefficient r
Raw data described in Section 2.1 were primarily analyzed to determine a trend relating the emissions of HAPs with the selected activity index. For the purpose of this paper, the effective refinery operative production capacity was assumed as activity index, expressed in tons of crude oil processed in order to evaluate a correlation between refinery size and the number of toxic compounds released into the atmosphere related to it.
To establish this relationship, the operative capacity and the total emission values for each considered plant were reported in graphical form: the trend line for each considered scenario (Section 2.4) and the corresponding Pearson correlation coefficient r are evaluated from the graphs.
Pearson’s correlation coefficient [39] measures the existence and strength of a linear relationship between two variables. Depending on the resulting value of the Pearson coefficient, it is possible to state to which extent the two variables are correlated.
Pearson’s correlation coefficient of a sample is denoted by r and is by design constrained as follows:
−1 ≤ r ≤ 1
The closer the value is to 1 or −1, the stronger the linear correlation, direct and reverse, respectively.
According to Evans [40], correlation is an effect size and, thus, it allows to evaluate the strength of the correlation for the value of r:
- 0.00–0.19 “very weak”;
- 0.20–0.39 “weak”;
- 0.40–0.59 “moderate”;
- 0.60–0.79 “strong”;
- 0.80–1.0 “very strong”.
2.3. Calculation of the Emission Factors
As stated previously and according to the EPA procedure for the definition of EF [41], the numerical elaborations were proposed by comparing the ratio of the two quantities examined: the HAPs annual emissions over the operational capacity of the plants (considered as the activity index). The data were represented in graphical form, and the trend line was traced to evaluate the existence of a correlation between these two quantities. The illustrated data are measured starting from the emissions by converting the original data from metric tons (i.e., 1000 kg = 2204 lb) per year [ton/y] to tons per day [ton/d], and from the operational capacity, reported in the database in barrels (i.e., 159 liters) of crude oil a day [bbl/d] and appropriately converted to [ton/d] as well. The EFs are then presented in [g/ton], and their values are estimated as shown in Section 3.2.
2.4. Selection of the Plants to Be Considered for the Evaluation of the EF
By analyzing the data reported in the US EPA document, it is possible to notice that the database includes a significant amount of data relating to 140 refineries. In order to concretely evaluate the trends of the quantities under investigation, it was decided to apply some selection criteria in order to exclude incomplete data or those for which it was not possible to certainly affirm that the plants were operating under steady-state conditions and excluding incidental events.
The first selection criterion is correlated with plant capacity. Indeed, in the database used for this study, some plants did not report complete information about the operational capacity (i.e., “missing” or “incomplete”); these plants were excluded from our dataset. Due to this preliminary consideration, the number of refineries included in the analysis was brought from 140 to 119.
Subsequently, the plants with emission data significantly differing from the average value of emissions from other refineries of the same size (outliers) were excluded from the total number of plants considered. This decision was related to the impossibility to prove with certainty that the data reported were not affected by an error connected to partial or biased data or to incidental events responsible for large uncontrolled emissions that do not represent the regular activity of the refining process. The considered number of plants reaches the amount of 109. This second downsizing of the dataset was carried out because the intent of this work is to provide, through an EF, an estimation representative of an average refining scenario, which would represent the standard operating conditions and not potential accidents or extraordinary operations.
2.5. Inclusion Criteria
To recall, two different inclusion criteria relating to the emission data collected were selected:
- Total HAPs: no selection parameters about pollutants categories were applied. So, the emissions are assessed in their entirety (187 compounds) for the selected plants;
- Organic HAPs: according to the definition of VOC [42], all inorganic substances are excluded from the calculation of the total emissions. In this way, the emissions considered are representative exclusively of the organic HAPs released in the atmosphere as volatile compounds. In this specific case, the inorganic substances excluded from the database are mainly metals and acids (antimony, arsenic, beryllium, cadmium, chlorine, chromium, cobalt, mercury, hydrochloric acid, hydrofluoric acid, hydrogen cyanide, hydrogen sulphide, lead, manganese, nickel, phosphorus, and selenium).
3. Results
3.1. Dataset Analysis, Evaluation of r, and Consideration of Present Compounds
The analysis of the data relevant to the US refineries, used to evaluate the trend lines and r values, shows a trend that correlates the production capacity of a plant with the quantity of HAPs emitted. Due to this evidence, it is possible to affirm that a certain proportionality between the refinery size and emission in terms of HAPs exists. This correlation will be discussed later in this section.
An initial evaluation was conducted using 119 refineries. These refineries were selected after excluding the plants for which complete information regarding the production capacity was missing. The inclusion criteria previously described in Section 2.5 were applied to both scenarios. From the analysis of the total emissions reported for each of the 119 plants considered, expressed in ton/day, as a function of the plant size, it is possible to evaluate an r value equal to 0.73. This value of r, according to the Evans classification of r, suggests a strong positive linear correlation. Subsequently, the investigation involved the exclusion of the inorganic substances, limiting the evaluation only to the organic HAPs. The emission trend for the organic HAPs related to the operational capacity of each plant provided an r value of 0.69, similar to the previous case.
Since, as previously discussed in paragraph 2.4, some plants showed anomalous behavior with respect to the average trend and have been considered outliers, the actual considerations for the determination of the emission factor have been carried out on the case related to the 109 selected plants. The r values for both cases (total and organic HAPs) and the trend highlighted by the dataset are discussed in full detail in the following paragraph 3.1.1.
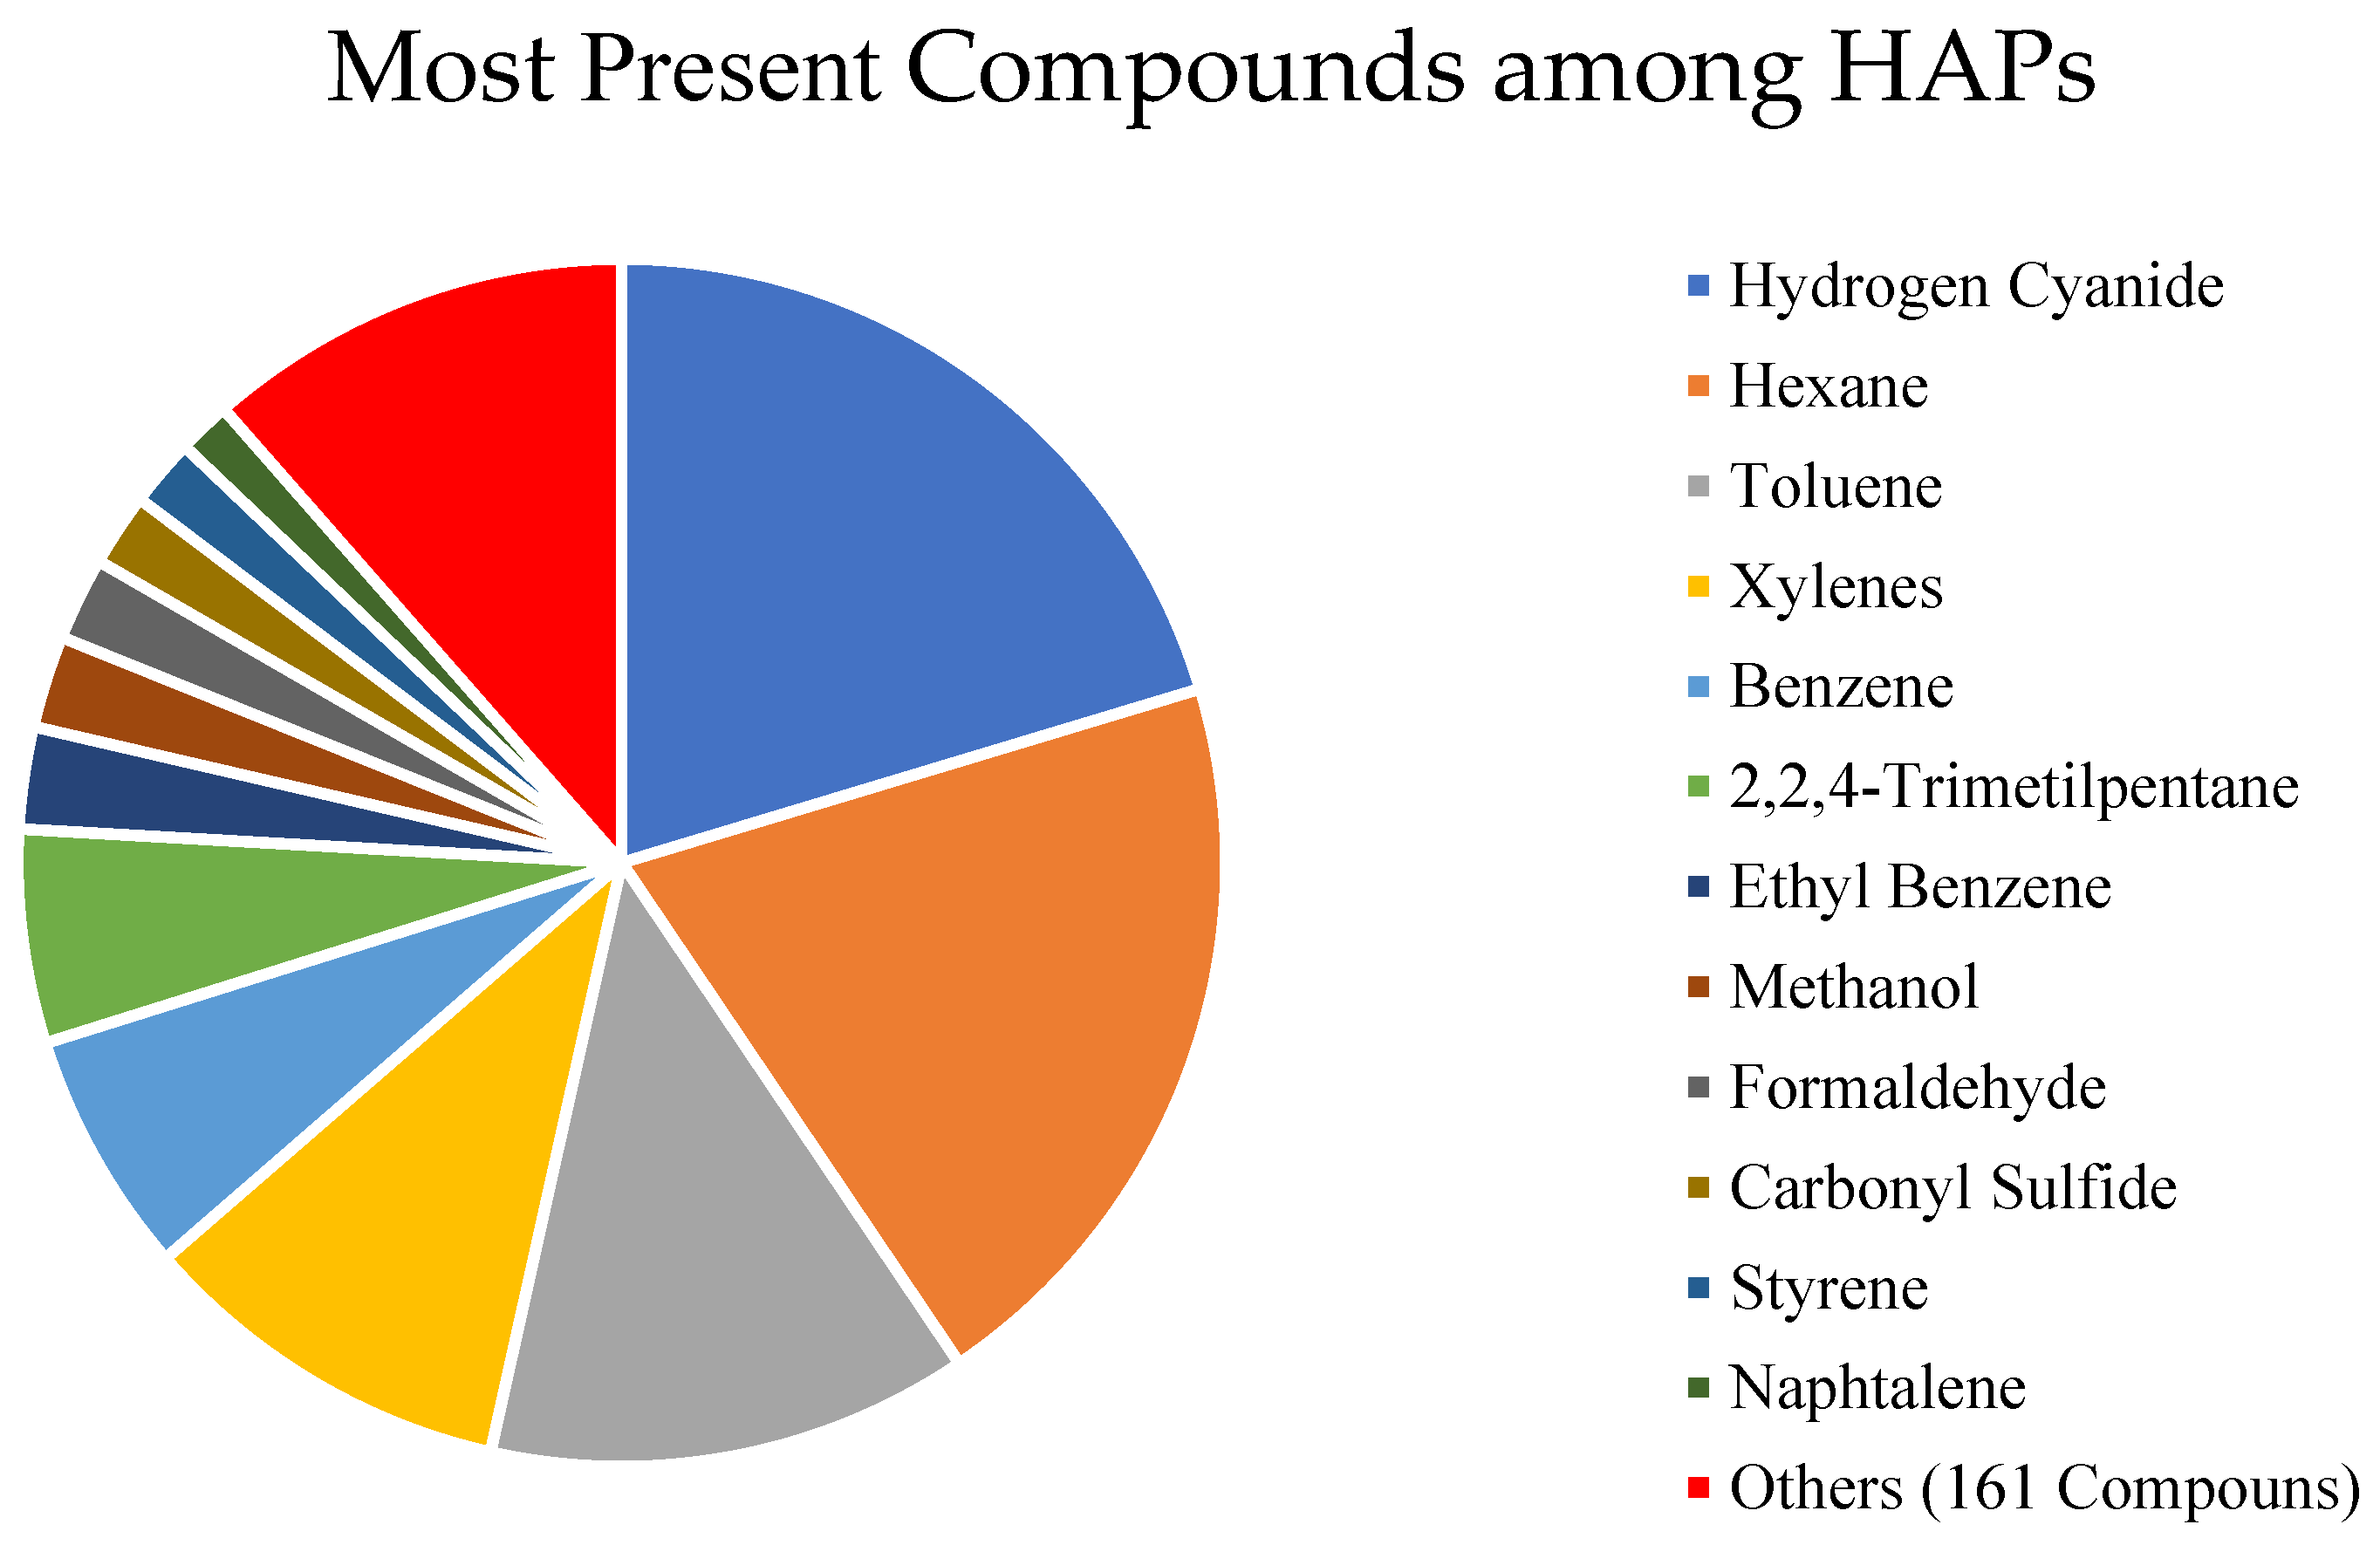
An analysis of the individual compounds emitted was carried out while excluding the inorganic HAPs to evaluate the behavior of the organic HAPs and develop their emission factor. This analysis allowed the assessment of the emissions of the individual substances released from each plant, and the deep analysis performed on the dataset led to an immediate visualization of the relative contribution of every single compound on the total emissions. It is, therefore, possible to highlight how a small number of substances—compared to the total number of HAPs in the overall emissions—represents about 90% (by mass flux) of the total emissions for almost all the selected plants. The list of substances responsible for 90% of the total emissions is reported in Table 1 and Figure 1:
From the list of compounds contained in Table 1 it is possible to highlight that there is a very limited contribution to the total emission of HAPs by aliphatic hydrocarbons, without heteroatoms, with a carbon number lower than 6 (i.e., only two light hydrocarbons are reported, 1,3-Butadiene and Hexane). The value of the Pearson correlation coefficient r evaluated considering only the above-mentioned compounds emitted from 109 refineries has been calculated and has a value of 0.79, thus highlighting a very strong linear behavior.
Because of their relevant emission levels and their low TLV values, obtained by the American Conference of Governmental Industrial Hygienists (ACGIH) database [43] (except HCN, for which the TLV value was found in Occupational Safety and Health Administration (OSHA) [44] in mg/m3 and then converted in ppm), specific considerations about the emission trends of benzene and formaldehyde were carried out in Section 3.2.2 and Section 3.2.3.
Benzene is one of the most relevant compounds emitted in the refining process, and it is known for its high carcinogenic potential [36,45,46]. The exposure to relatively high amounts of formaldehyde in medical and occupational settings has been linked to some types of cancer in humans, but the effect of the exposure to small amounts is less clear [37,38,47,48,49]. Due to the relevant quantity of formaldehyde reported in refinery emissions, this compound was selected for further investigation as well. The same considerations made previously for all the HAP compounds were thus repeated considering benzene and formaldehyde emissions individually: the quantities of benzene and formaldehyde emitted by each plant considered were analyzed in relation to the plant operating capacity.
3.1.1. Organic HAPs
Considering the 109 plants according to the criteria discussed in Section 2.4, from the comparison of the emission level with the operational capacity, it is possible to consider a scenario purged of outliers. The same considerations displayed in the previous Section 3.1 paragraph were carried out, thus evaluating the trends and the respective value of r for both the total and organic HAPs.
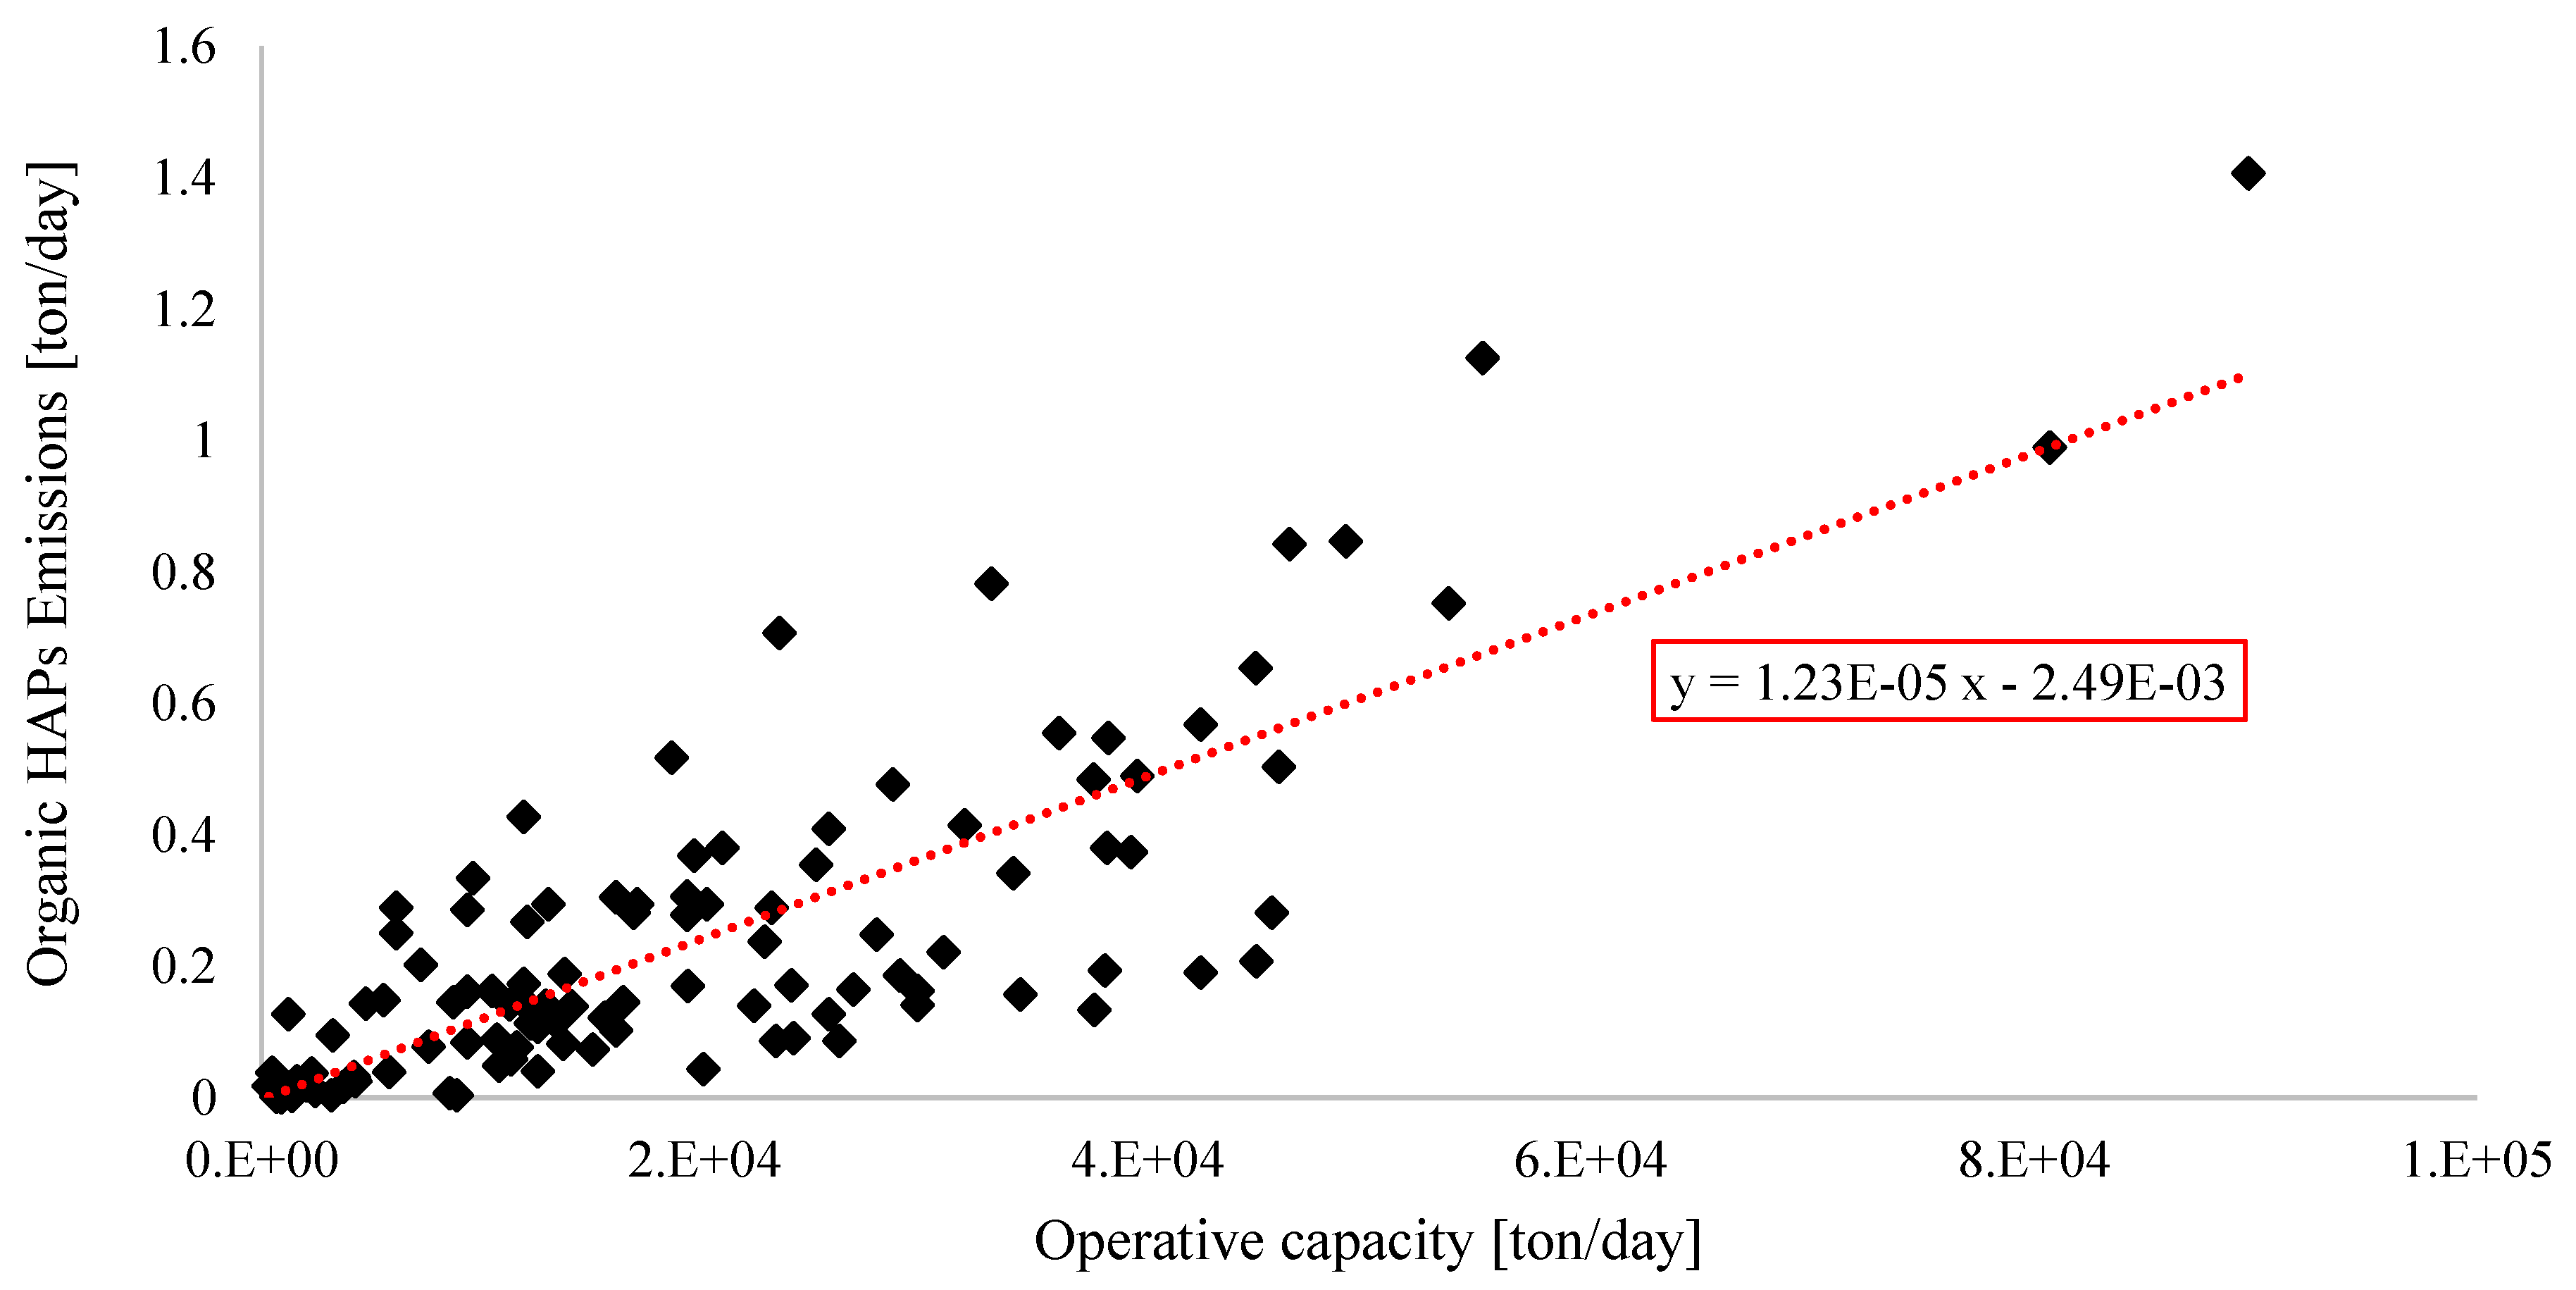
The r relevant to the comparison of the operating capacity of the 109 refineries with their respective total emissions is 0.83. This r value indicates a very strong positive linear correlation. The evaluation of the trend line for the case involving only organic HAPs (Figure 2) was realized after the exclusion of all the inorganic compounds from the total HAPs list. The value of r obtained for this latter case is equal to 0.81, slightly lower than the previous case but still a very strong positive linear correlation marker.
To facilitate comparison, Table 2 reports the r values obtained for each scenario and case evaluated.
In all the analyzed scenarios, the r values expressing the correlation between emissions and plant size were above 0.6, thus representing a “strong” linear correlation for 119 plants and a “very strong” linear correlation for 109 plants. This outcome points out the existence of a positive linear correlation between the quantity of HAPs emitted and the refinery treatment capacity: the bigger the refinery, the higher its HAPs emissions.
This correlation supports the choice of the operational capacity as an activity index for the estimation of the EF. Despite this consideration perhaps appearing obvious, it is important to highlight that other parameters besides the plant capacity may influence the emissions of an installation, such as a lack of control of poor maintenance of old and deteriorated equipment. These events may lead small plants to have much higher emissions than bigger plants that are properly maintained and operated. This is the criterion applied here for the consideration of two different scenarios, but it does not exclude the possibility that some of the 109 considered plants present poor maintenance of minor uncontrolled releases during their yearly activity.
3.1.2. Benzene
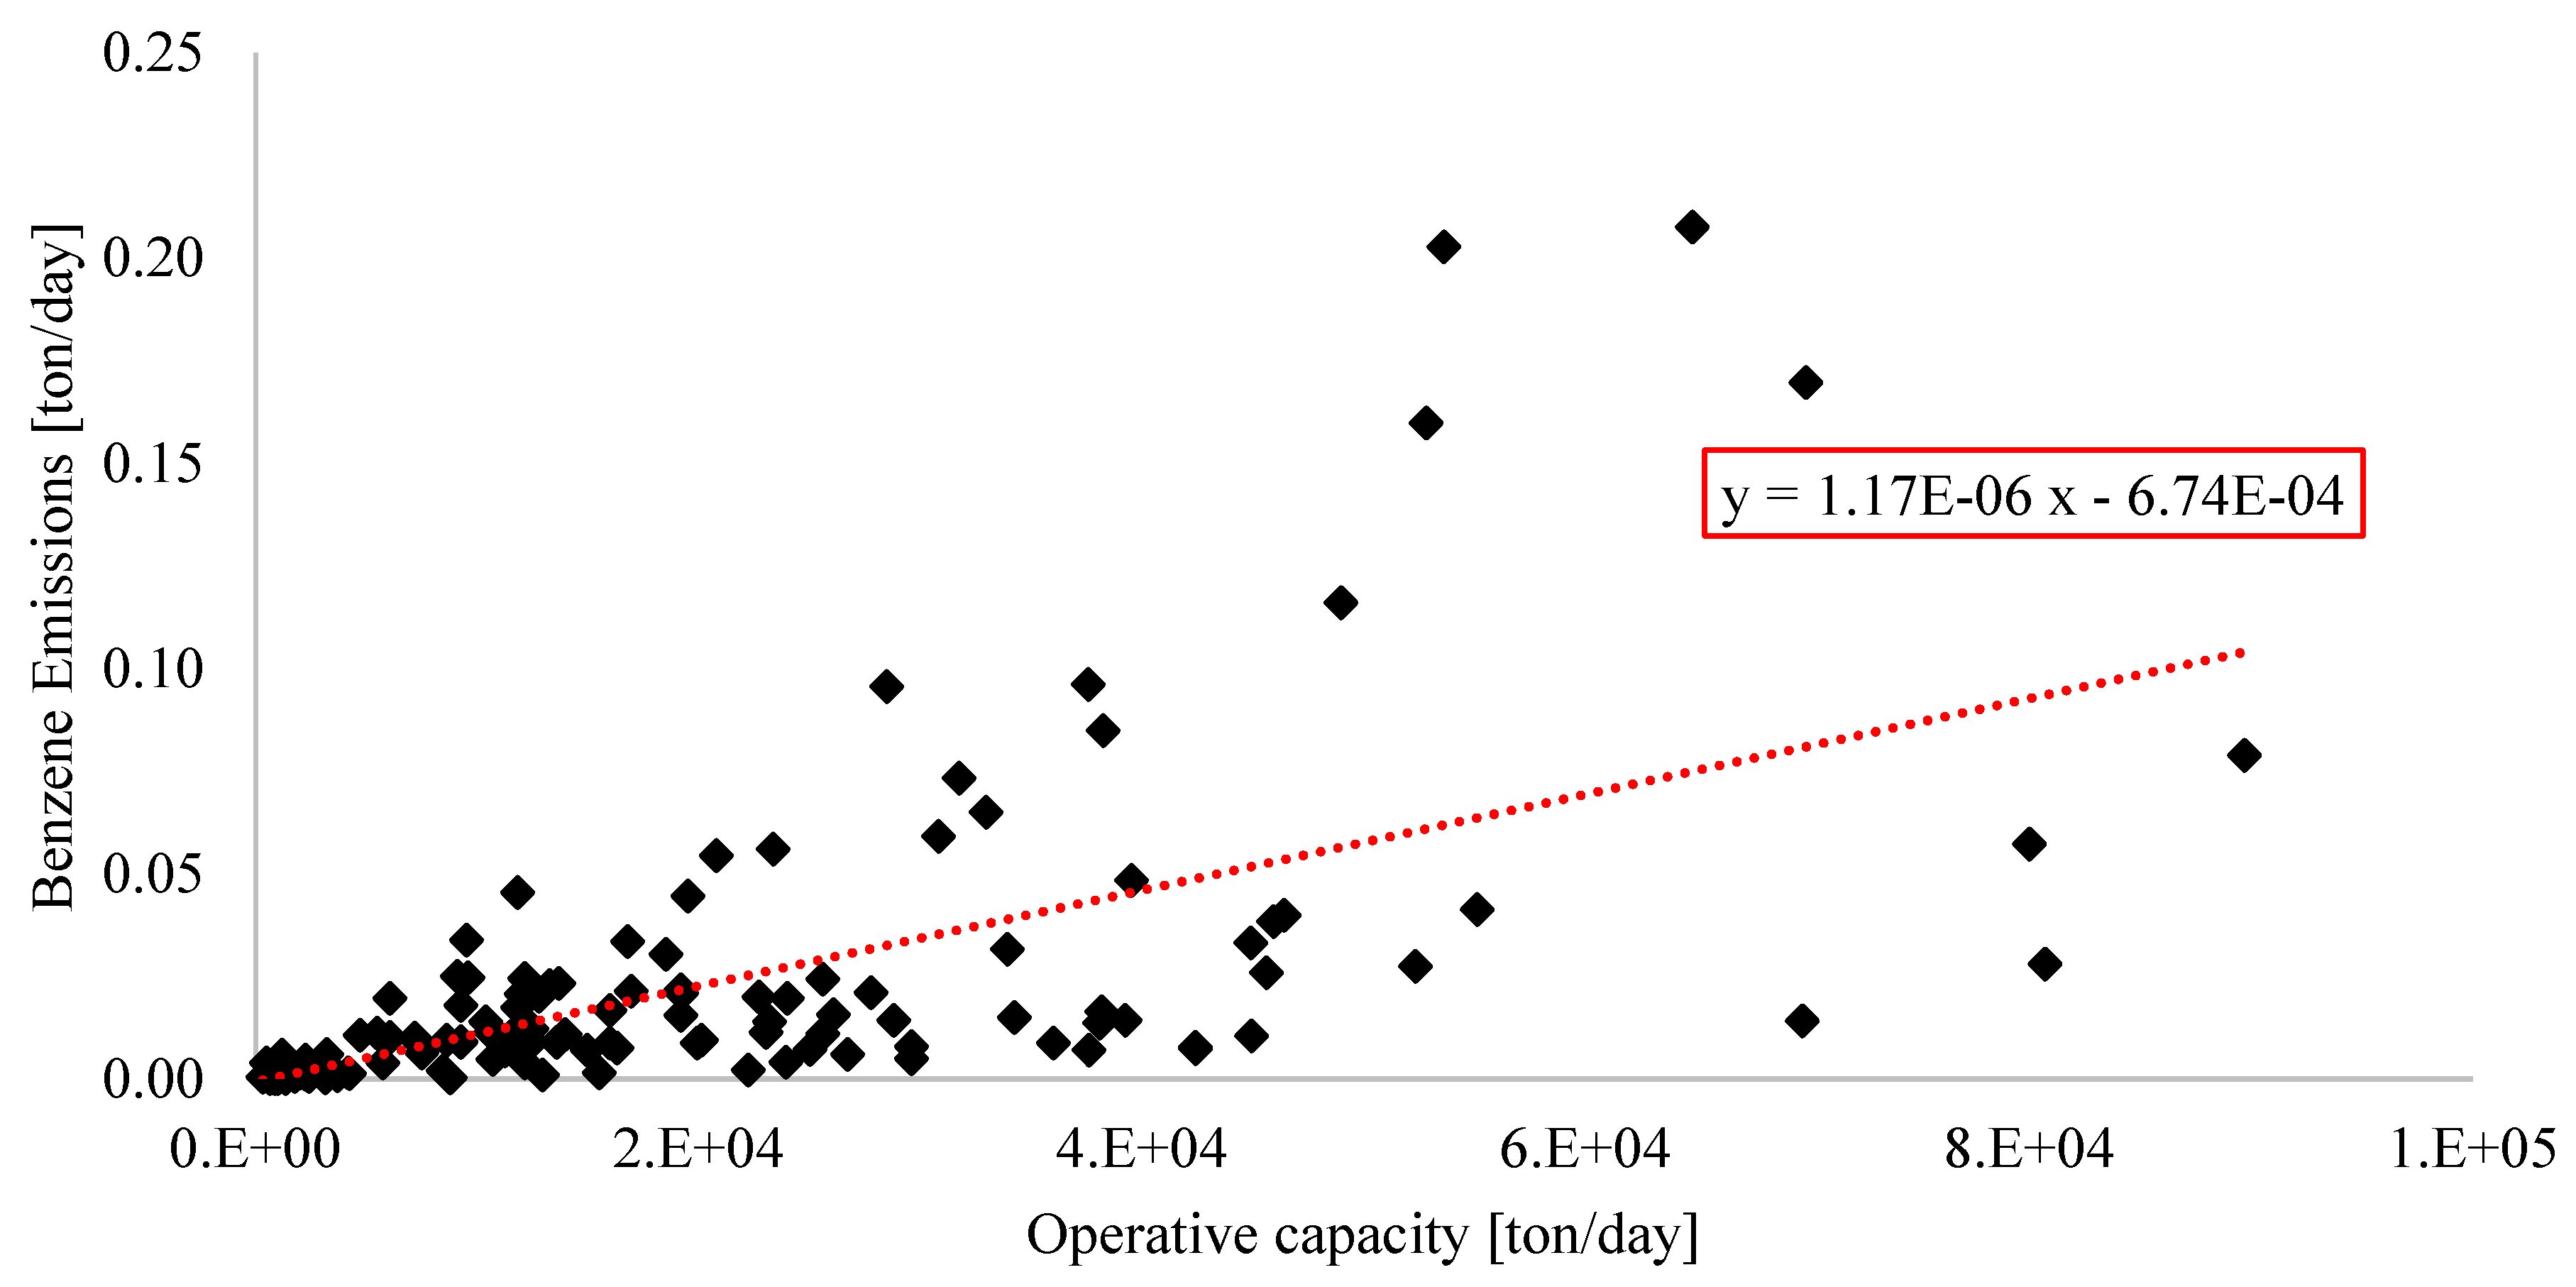
All the 119 refineries were taken into consideration since, while analyzing benzene emission, no outlier data were detected. The emission trend is reported in Figure 3.
The r value for this correlation is equal to 0.60, marking a “strong” positive linear correlation between the increase of the benzene emissions and the size of the plant. This value is interesting given that, even by considering only one of the most representative of the 187 compounds considered, a comparable trend with the one observed for all the HAPs is revealed.
3.1.3. Formaldehyde
Unlike the case concerning benzene, the data relative to formaldehyde are not available for all the plants reported. In fact, for some of the 119 refineries considered (i.e., 10), there are no formaldehyde emissions reported in the database.
The trend of formaldehyde emissions from the refineries has, therefore, been assessed for 109 plants. Although this is the same number of plants considered before in Section 3.1.1 for the total HAPs, the plants’ dataset is not the same.
The formaldehyde emission trend is reported in Figure 4. The r value resulting from the analysis of the formaldehyde emission trend with the plant size is equal to 0.65, marking also in this case a “strong” positive linear correlation between the increase of formaldehyde emissions and the size of the plant. Moreover, in this case, by considering only one of the most representative compounds out of the total 187 compounds, it is possible to highlight a linear correlation like the one observed for all the HAPs.
3.2. Emission Factor Calculation
Based on the analysis of the emission and capacity data analyzed in the previous paragraphs, it was finally possible to define a numerical value for the EF expressing the HAPs emitted by a refinery as a function of its operational capacity.
The considerations expressed in the previous paragraphs relevant to the selection of the different inclusion criteria led to the selection of organic HAPs emitted from 109 plants as a model for the determination of the EF.
Once the EF was calculated, as explained in Section 2.3, for each considered plant, the statistical parameters (i.e., the mean, median, and standard deviation) were calculated for the dataset, providing the values shown in Table 3.
In the following, the organic HAPs case is considered for numerical evaluation.
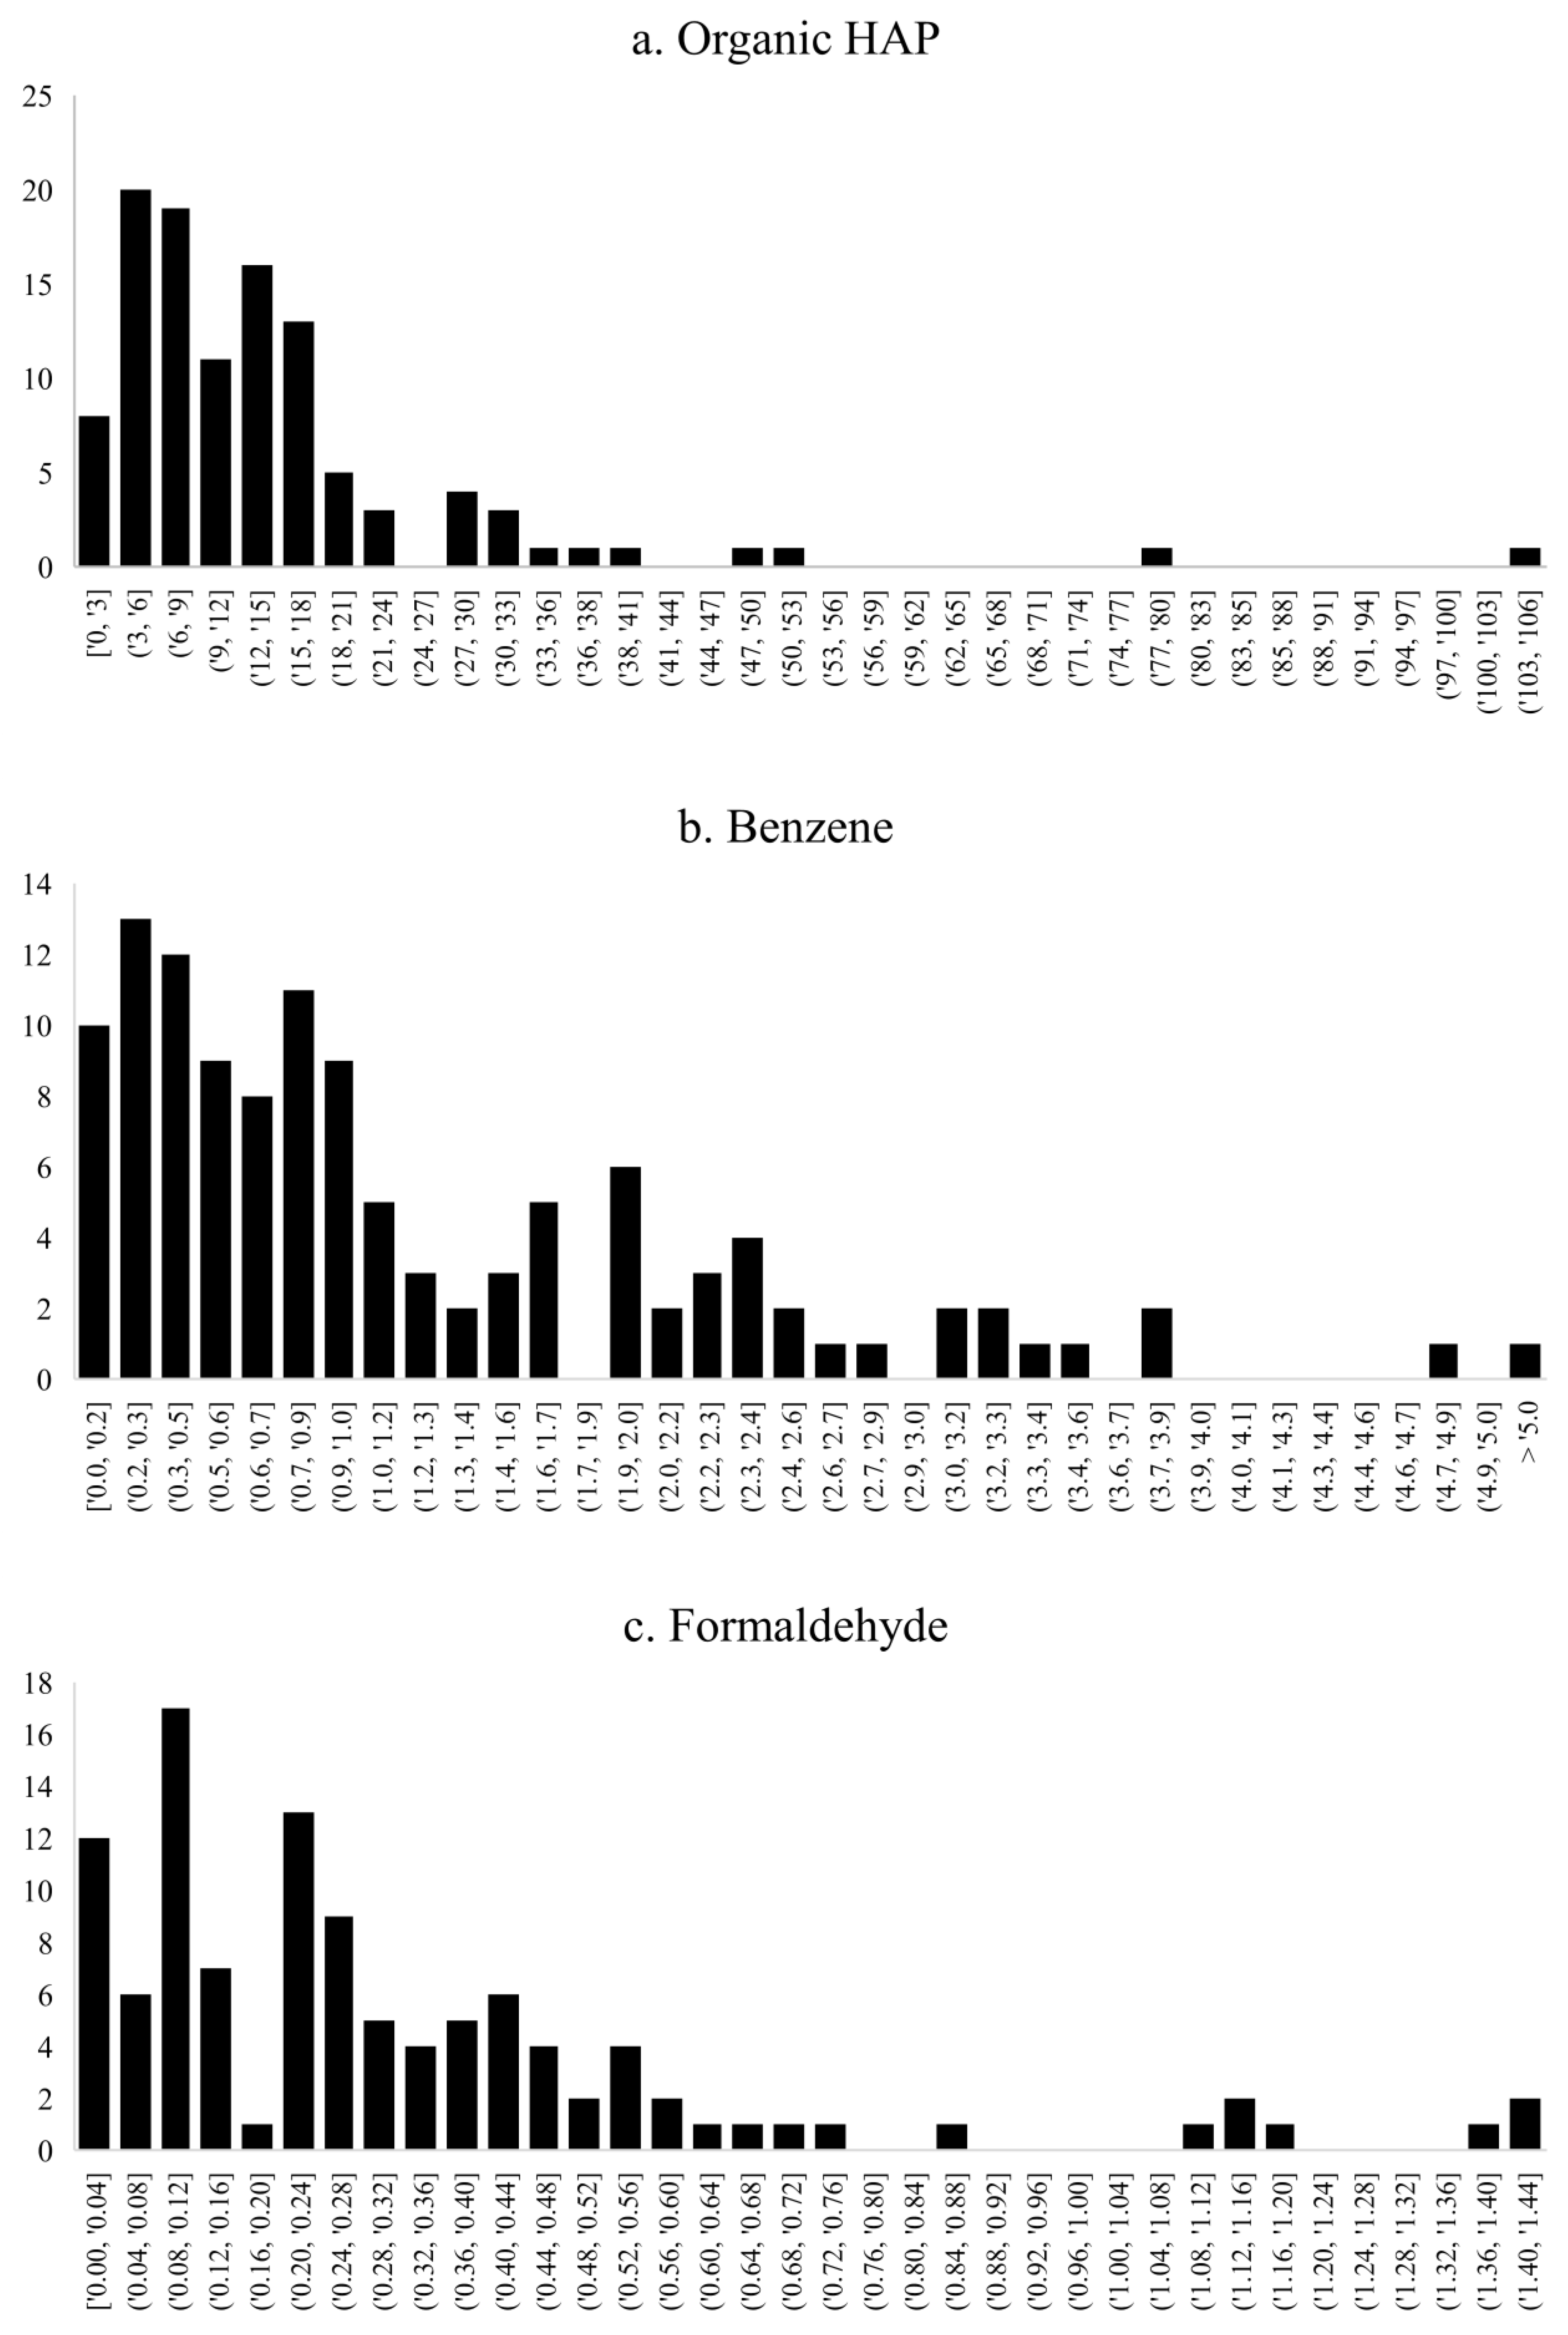
Based on the fact that the value assumed by an emission factor, such as the one calculated in our case, cannot assume negative values, after a graphical representation of data (Figure 5a), it was possible to carry out some considerations relative to the type of distribution that the data assumed. It seems appropriate to consider that the dataset considered behaves like a log-normal distribution rather than a Gaussian one [50]. A random variable X is said to be log-normally distributed if log(X) is normally distributed. Only positive values are possible for the variable, and the distribution is skewed to the left. Once the distribution of the data relating to the organic HAPs had been represented graphically, the same evaluation was carried out on the distributions relating to benzene and formaldehyde, from which it can be seen (Figure 5b,c) that, in these two cases as well, the distribution appears to be a log-normal one rather than a Gaussian.
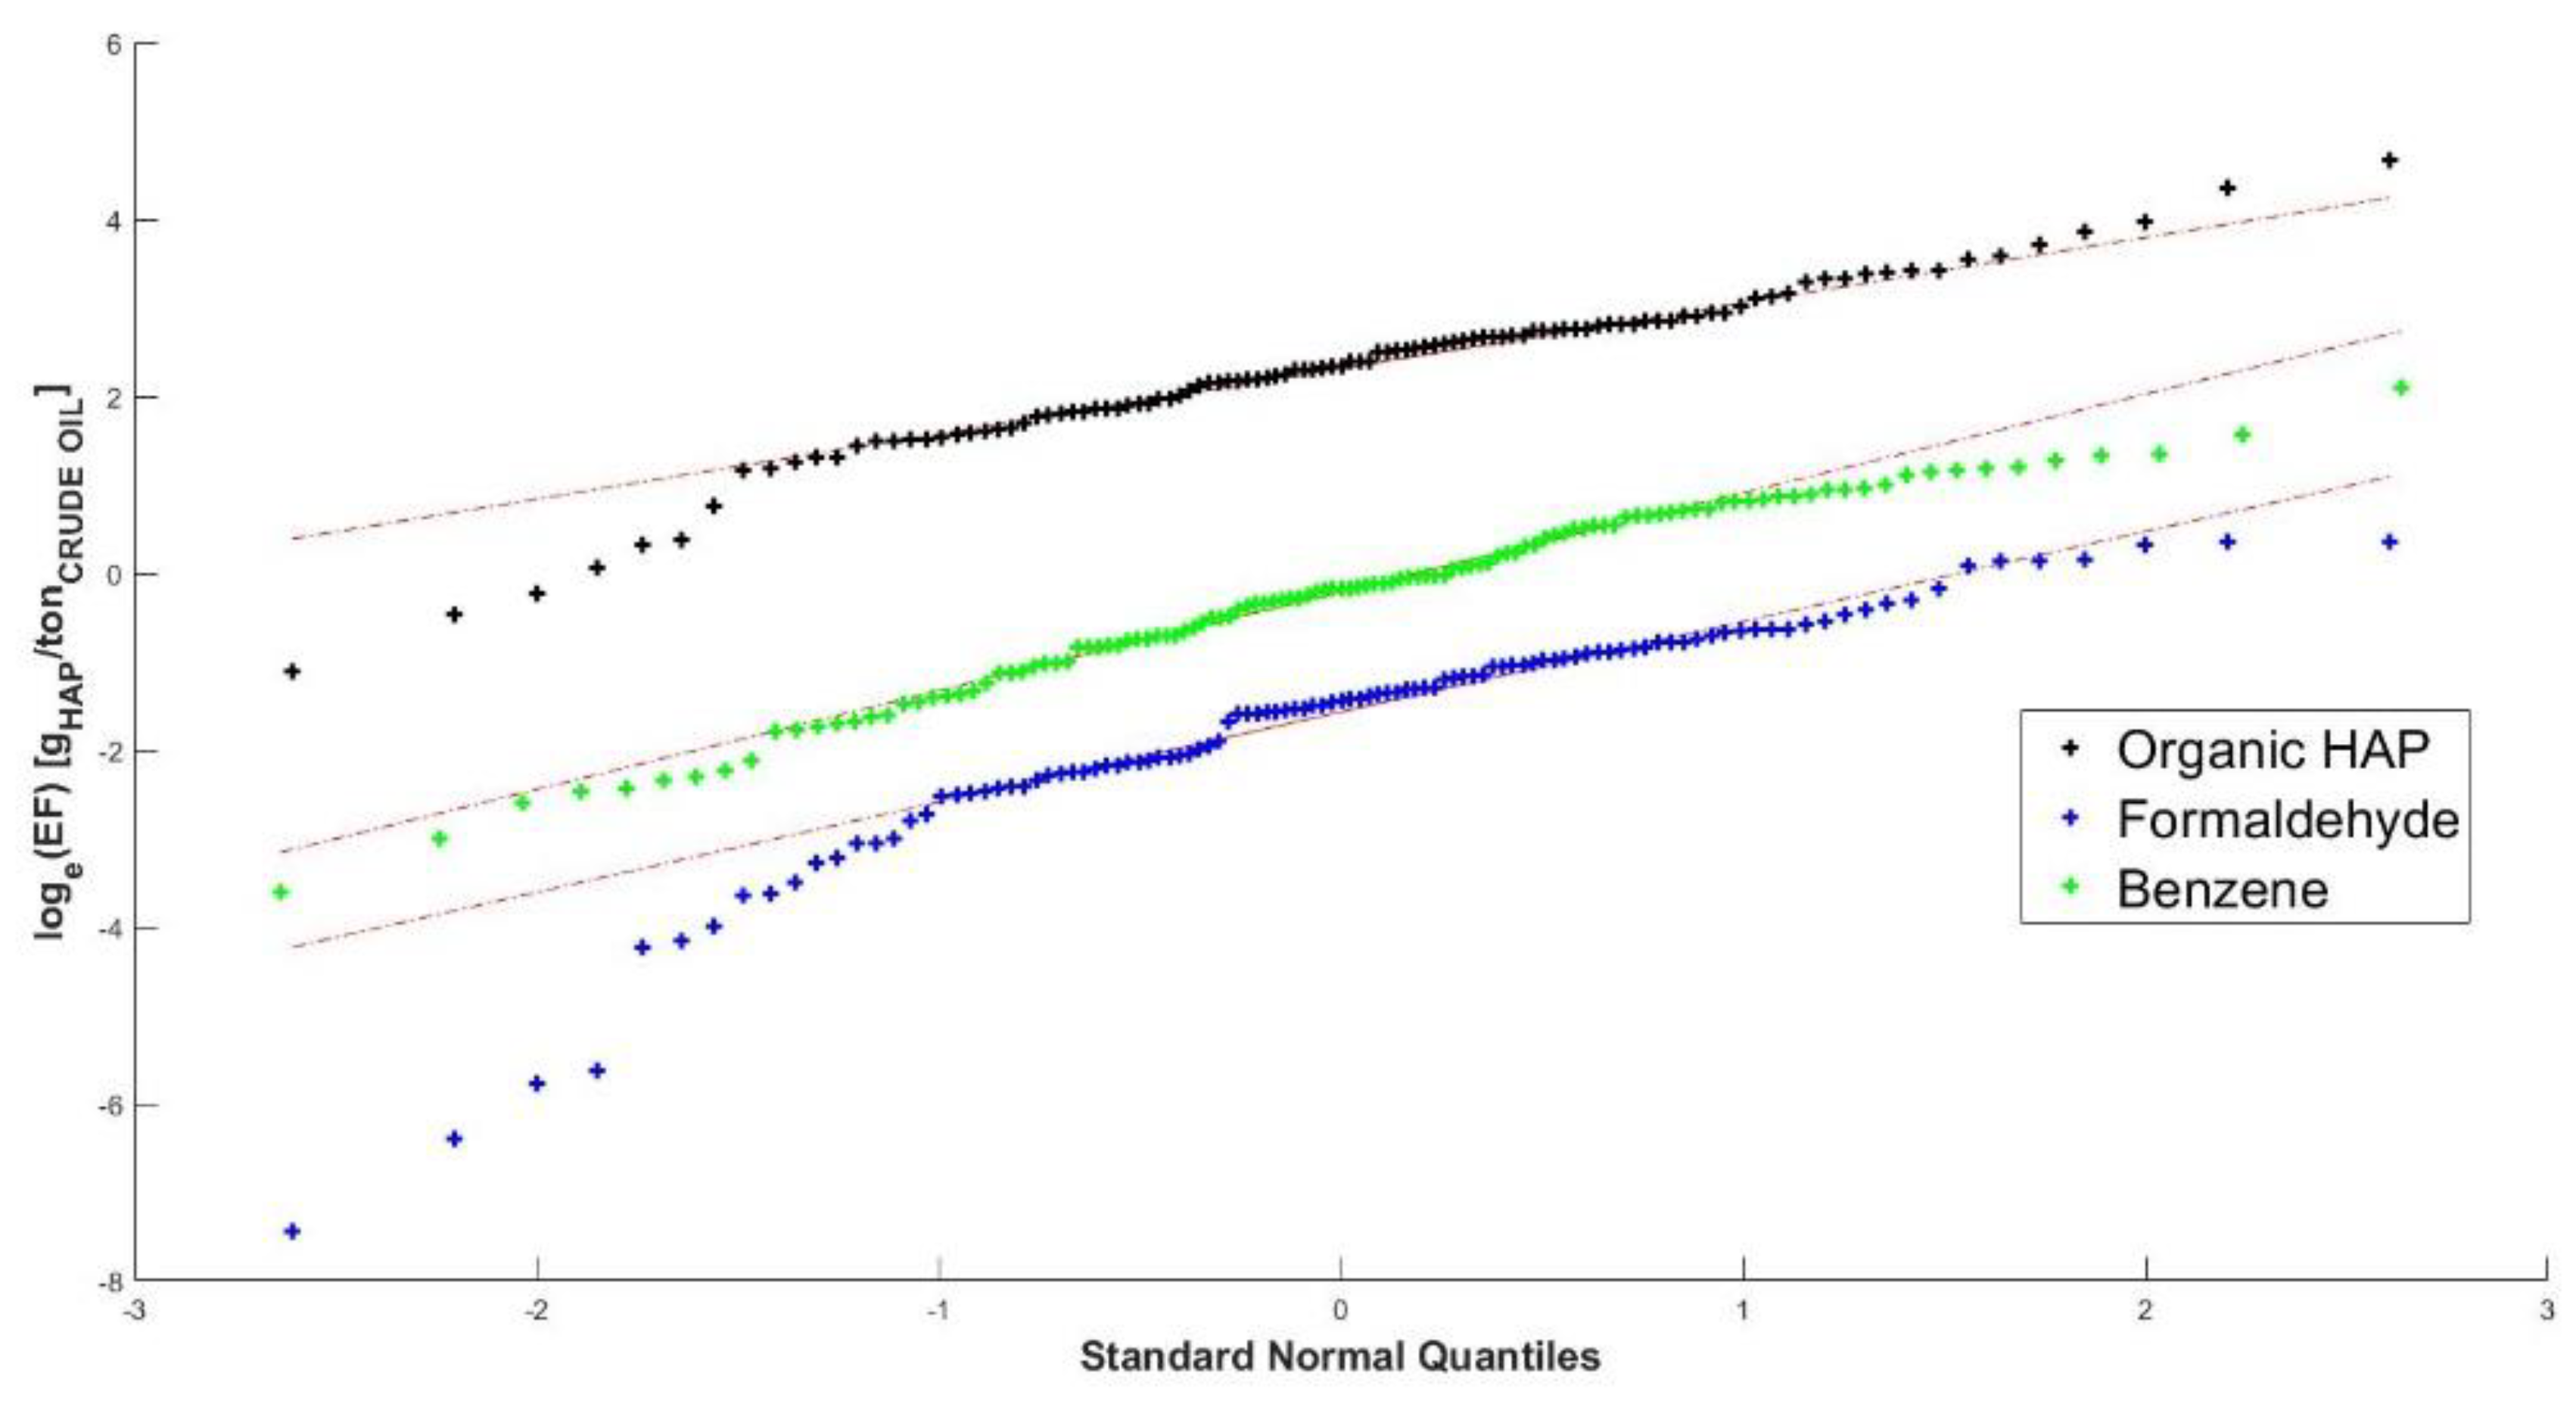
The distribution trend was also assessed by means of QQ-Plot (Figure 6) [51] tests, which consist of the graphical representation of the quantiles of distribution and compare the cumulative distribution of the observed variable with the cumulative distribution of the normal. If the observed variable has a normal distribution, the points of this joint distribution thicken on the diagonal that goes from the bottom to the top and from left to right.
Two parameters are needed to specify a log-normal distribution. Traditionally, the mean µ and the standard deviation σ (or the variance σ2) of ln(X) (the set of data that is normally distributed) are used, and they are reported in the following Table 4.
However, based on the considerations made on the distribution of the data with which the emission factor is calculated, it is possible to consider the expected value (i.e., the emission factor) equal to:
which coincides with the geometric mean of the distribution considered as Gaussian, while the confidence interval calculated as a statistical value ± 1 (i.e., k = 1) times the standard error gives a “confidence” of about 68%, which is equal to:
where LL and UL are, respectively, the lower limit and the upper limit of the confidence interval.
3.2.1. Organic HAPs
The expected value, standard deviation, LL, and UL of the confidence interval for the organic HAPs are shown below in Table 5.
The emission factor for organic HAPs emitted from a petroleum refinery is equal to 10 g for each ton of crude oil processed.
3.2.2. Benzene
The expected value, standard deviation, LL, and UL of the confidence interval for benzene are shown below in Table 6.
The emission factor for benzene emitted from a petroleum refinery is equal to 0.8 g for each ton of crude oil processed.
3.2.3. Formaldehyde
The expected value, standard deviation, LL, and UL of the confidence interval for formaldehyde are shown below in Table 7.
The emission factor for formaldehyde emitted from a petroleum refinery is equal to 0.2 g for each ton of crude oil processed.
3.3. Discussion
In the data analysis, it was hypothesized that the “anomalous” behaviors, based on which 10 plants were considered “outliers” and thus excluded from the evaluation of scenario 2, are due to the release in significant quantities of a limited number of substances that are usually not emitted in remarkable quantities during the normal operations of a refining plant. Such anomalous situations may be due to the poor conditions of the equipment due to ageing or inadequate maintenance or potential incidental events that occurred during the year, which may have led to uncontrolled emissions of some substances. For these reasons, the most suitable scenario to represent a raw EF able to describe the average emission behavior of a refinery is the one found considering the organic HAPs emissions released by the 109 refineries without the outliers’ plants.
After having graphically represented the data population and having verified that it is log-normally distributed, it was possible to calculate the parameters to define the emission factor, equal to 10 g of the organic HAPs emitted for each ton of crude oil processed in the plant.
If the expected value for the log-normal distribution is considered as the global EF for the organic HAPs emitted from the refinery plants, it is possible to compare it with the emission values reported in the scientific literature. For instance, in the European BREF Reference Document for the Refining of Mineral Oil European Reference Document [2], it is possible to find a range for the emission of VOCs from refineries that goes from 50 to 1000 tons emitted for 1 million tons of crude oil processed from the plant, which corresponds to an emission factor of 50–1000 [g/ton] and is thus much higher than the emission factor for organic HAPs determined in this paper.
This difference could be explained considering that, according to what can be found in the literature [52,53,54], it is possible to state that about 60 to 70% of the emissions from a refining plant are due to substances such as ethane, propane, butane, and pentane, which are not included in the list of HAPs. A similar consideration could be true for other VOCs that are normally emitted from a refinery but are not considered as HAPs. Moreover, as mentioned, many difficulties may arise in the quantification of all contributions to the VOC emission inventory of a refinery [29]. As a consequence of the considerations made in paragraph 3.1 regarding two of the most present compounds, benzene and formaldehyde, it was possible to determine an emission factor for these two substances as well. Following the same procedure illustrated for the case of organic HAPs, it was possible to determine an emission factor for benzene equal to 0.8 [g/ton] and one for formaldehyde equal to 0.2 [g/ton] [54].
For formaldehyde emitted by a refinery, no known range of values is reported in the literature. On the contrary, for benzene, it is possible to find a value similar to the one illustrated for VOCs in the European BREF Reference Document for the Refining of Mineral Oil European Reference Document [2], where benzene emissions from refineries are reported to be in a range of 0.005–8 [g/ton], consistent with the data obtained in this paper.
Considering a whole refinery, a summary specification of the main VOCs emitted in the refining process is proposed in the “Emission Inventory Guidebook” [53]. In this document, it is precisely indicated that ethane, propane, butane, and pentane are responsible for about 60% of the total VOC emissions from refineries.
Similarly, as far as Canadian legislation is concerned, the document “Canadian fuels code of practice” [52] attributes more than 50% of the total VOC emissions to the substances listed above, with a carbon number lower than 6.
Other similar data can be found in the literature, referring to single sections of the plant. In the case of tank farms [54], the speciation of the emissions related to the storage tanks section of the refinery has been found in the literature. By applying the EPA TANKS software [55], it has been estimated that about 61.12% of the total VOCs emitted from the tank farm by volume were alkanes, whereby pentane was the most abundant (27.4%), followed by cyclopentane (19.22%), propene (19.02%), and isobutene (14.22%).
In a previous work by the authors of this paper [28], the EF for the VOCs emitted from European petroleum refineries was determined, resulting in a value of 188 ± 166 g per ton of crude oil processed. Considering the previously reported information about the main constituents of VOC emissions from refineries being compounds with a carbon number lower than 6, representing about 60–70% of the total VOC emissions [53,54], it is possible to highlight that the EF for the HAPs determined in this study is consistent with the one for the total VOCs evaluated in the previous work.
4. Conclusions
This paper aimed to provide an emission factor (EF) for the organic hazardous air pollutants emitted from petroleum refineries in the United States.
The definition of this EF was carried out by choosing the operational capacity of a plant as the activity index for the estimation of the emission factor, which is related to the total amount of HAPs emitted in one year of exercise. A linear trend can be obtained with good approximation when comparing different plants’ emissions as a function of their operational capacity.
For emission monitoring and control evaluation, the knowledge of a global EF allows a preliminary assessment of the emissions related to a petroleum refining plant, needing only the datum relevant to the operational capacity of a considered plant.
The purpose of this work was to provide a tool useful for the preliminary estimation of the hazardous substances emitted from petroleum refineries, representative of an average emissive situation, thereby excluding peak conditions and incidental releases. Therefore, refineries that exhibited anomalous behavior were excluded from the present analysis. Inorganic substances were then excluded in order to limit the evaluation to organic HAPs only, theoretically comparable with the behavior of the VOC compounds.
The analysis of refinery emissions further enabled the observation that a limited number of substances account for over 90% of the total HAP emissions and, by considering a single compound, benzene, as representative of this group of compounds, it is possible to recognize a linear correlation of the emissions with the plant size, such as the one highlighted for the overall emissions comprising all the 187 compounds. Considering the differences between the total VOCs usually emitted and the calculation conducted on the data relevant to the database accounting the HAPs from the refining plants, the EF for the organic HAPs emitted from the refineries is 10 g for each ton of processed crude oil. The EFs for benzene and formaldehyde are, respectively, equal to 0.8 g and 0.2 g for each ton of processed crude oil.
It shall be highlighted that refineries constitute a particularly complex case of industrial plants, with different possible configurations and many different unit operations. For this reason, to provide a first estimate of the refinery emissions in relation to the size, even just knowing the order of magnitude of this data is particularly important.
The assessment of an average benchmark in emission, provided in this work, may be a useful tool for oil refining companies in order to compare their own emissions to the mean values, helping them to understand if a maintenance or revamping intervention is urgent or not. The constant updating of the emissive population will be a valuable help to the strategic investment decisions of oil companies and public institutions in order to proceed to an overall and well-reasoned decrease in pollutant emission in this sector.
In parallel, attention and commitment should also be paid to the research, development, and testing of innovative methodologies for the quantification and direct measurement of VOC emission fluxes from different types of sources.
Author Contributions
Conceptualization, M.I., L.C. and S.S.; formal analysis, M.I.; data curation, L.R. and E.P.; writing—original draft preparation, L.R.; writing—review and editing, E.P., M.I., L.C. and S.S. All authors have read and agreed to the published version of the manuscript.
Funding
This research received no external funding.
Institutional Review Board Statement
Not applicable.
Informed Consent Statement
Not applicable.
Data Availability Statement
The datasets analyzed during the current study are available in the “Comprehensive Data Collected from the Petroleum Refining Sector” repository by US EPA, https://www.epa.gov/stationary-sources-air-pollution/comprehensive-data-collected-petroleum-refining-sector#Component2 (accessed on 28 January 2021).
Conflicts of Interest
The authors declare no conflict of interest.
References
- Seinfeld, J.H.; Pandis, S.N. Atmospheric Chemistry and Physics: From Air Pollution to Climate Change; John Wiley & Sons: Hoboken, NJ, USA, 2016; ISBN 1118947401. [Google Scholar]
- European Commission. Best Available Techniques (BAT) Reference Document for the Refining of Mineral Oil and Gas; Publications Office of the European Union: Brussels, Belgium, 2015; ISBN 9789279461989. [Google Scholar]
- European Commission. Guidance Document for the Implementation of the European PRTR; European Commission: Brussels, Belgium, 2006; p. 142. [Google Scholar]
- Virdi, S.S.; Lee, L.Y.; Li, C.; Dev, A.K. Simulation of VOC Emission During Loading Operations in a Crude Oil Tanker. Int. J. Marit. Eng. 2021, 163, 1–16. [Google Scholar] [CrossRef]
- Fetisov, V.; Pshenin, V.; Nagornov, D.; Lykov, Y.; Mohammadi, A.H. Evaluation of Pollutant Emissions into the Atmosphere during the Loading of Hydrocarbons in Marine Oil Tankers in the Arctic Region. J. Mar. Sci. Eng. 2020, 8, 917. [Google Scholar] [CrossRef]
- Log, T.; Pedersen, W.B.; Moumets, H. Optical Gas Imaging (OGI) as a moderator for interdisciplinary cooperation, reduced emissions and increased safety. Energies 2019, 12, 1454. [Google Scholar] [CrossRef] [Green Version]
- Invernizzi, M.; Teramo, E.; Busini, V.; Sironi, S. A model for the evaluation of organic compounds emission from aerated liquid surfaces. Chemosphere 2020, 240, 124923. [Google Scholar] [CrossRef] [PubMed]
- Huang, W.; Huang, F.; Fang, J.; Fu, L. A calculation method for the numerical simulation of oil products evaporation and vapor diffusion in an internal floating-roof tank under the unsteady operating state. J. Pet. Sci. Eng. 2020, 188, 106867. [Google Scholar] [CrossRef]
- Zhang, G.; Huang, F.; Huang, W.; Zhu, Z.; Fang, J.; Ji, H.; Fu, L.; Sun, X. Analysis of Influence of Floating-Deck Height on Oil-Vapor Migration and Emission of Internal Floating-Roof Tank Based on Numerical Simulation and Wind-Tunnel Experiment. Processes 2020, 8, 1026. [Google Scholar] [CrossRef]
- Okamoto, K.; Ichikawa, T.; Fujimoto, J.; Kashiwagi, N.; Nakagawa, M.; Hagiwara, T.; Honma, M. Prediction of evaporative diffusion behavior and explosion damage in gasoline leakage accidents. Process Saf. Environ. Prot. 2021, 148, 893–902. [Google Scholar] [CrossRef]
- Pshenin, V.; Zaripova, N.; Zaynetdinov, K. Modeling of the crude oil (or petroleum products) vapor displacement during rail tanks loading. Pet. Sci. Technol. 2019, 37, 2435–2440. [Google Scholar] [CrossRef]
- Xuan, L.; Ma, Y.; Xing, Y.; Meng, Q.; Song, J.; Chen, T.; Wang, H.; Wang, P.; Zhang, Y.; Gao, P. Source, temporal variation and health risk of volatile organic compounds (VOCs) from urban traffic in harbin, China. Environ. Pollut. 2021, 270, 116074. [Google Scholar] [CrossRef] [PubMed]
- Davidson, C.J.; Hannigan, J.H.; Bowen, S.E. Effects of inhaled combined Benzene, Toluene, Ethylbenzene, and Xylenes (BTEX): Toward an environmental exposure model. Environ. Toxicol. Pharmacol. 2021, 81, 103518. [Google Scholar] [CrossRef]
- Zhao, Q.; Li, Y.; Chai, X.; Xu, L.; Zhang, L.; Ning, P.; Huang, J.; Tian, S. Interaction of inhalable volatile organic compounds and pulmonary surfactant: Potential hazards of VOCs exposure to lung. J. Hazard. Mater. 2019, 369, 512–520. [Google Scholar] [CrossRef] [PubMed]
- Invernizzi, M.; Sironi, S. Odour emission rate estimation methods for hydrocarbon storage tanks. Chem. Eng. Trans. 2021, 85, 67–72. [Google Scholar] [CrossRef]
- Invernizzi, M.; Ilare, J.; Capelli, L.; Sironi, S. Proposal of a method for evaluating odour emissions from refinery storage tanks. Chem. Eng. Trans. 2018, 68, 49–54. [Google Scholar] [CrossRef]
- González, D.; Colón, J.; Sánchez, A.; Gabriel, D. A systematic study on the VOCs characterization and odour emissions in a full-scale sewage sludge composting plant. J. Hazard. Mater. 2019, 373, 733–740. [Google Scholar] [CrossRef]
- Wojnarowska, M.; Plichta, G.; Sagan, A.; Plichta, J.; Stobiecka, J.; Sołtysik, M. Odour nuisance and urban residents’ quality of life: A case study in Kraków’s in Plaszow district. Urban Clim. 2020, 34, 100704. [Google Scholar] [CrossRef]
- Wu, C.; Liu, J.; Liu, S.; Li, W.; Yan, L.; Shu, M.; Zhao, P.; Zhou, P.; Cao, W. Assessment of the health risks and odor concentration of volatile compounds from a municipal solid waste landfill in China. Chemosphere 2018, 202, 1–8. [Google Scholar] [CrossRef]
- U.S. EPA. What are Hazardous Air Pollutants? Available online: https://www.epa.gov/haps/what-are-hazardous-air-pollutants (accessed on 28 May 2021).
- U.S. EPA. Health Effects Notebook for Hazardous Air Pollutants. Available online: https://www.epa.gov/haps/health-effects-notebook-hazardous-air-pollutants (accessed on 1 June 2021).
- Shen, L.; Xiang, P.; Liang, S.; Chen, W.; Wang, M.; Lu, S.; Wang, Z. Sources Profiles of Volatile Organic Compounds (VOCs) Measured in a Typical Industrial Process in Wuhan, Central China. Atmosphere 2018, 9, 297. [Google Scholar] [CrossRef] [Green Version]
- Cui, H. Source profile of volatile organic compounds(VOCs) of a petrochemical industry in the Yangtze River Delta, China. Chem. Eng. Trans. 2016, 54, 121–126. [Google Scholar] [CrossRef]
- Kansal, A. Sources and reactivity of NMHCs and VOCs in the atmosphere: A review. J. Hazard. Mater. 2009, 166, 17–26. [Google Scholar] [CrossRef]
- U.S.EPA. Comprehensive Data Collected from the Petroleum Refining Sector. Available online: https://www.epa.gov/stationary-sources-air-pollution/comprehensive-data-collected-petroleum-refining-sector (accessed on 28 January 2021).
- U.S. EPA. ICR Component 1 Data- Questionnaire on Processes and Controls; U.S. EPA: Washington, DC, USA, 2011. [Google Scholar]
- U.S. EPA. Emissions Estimation Protocol for Petroleum Refineries; U.S. EPA: Washington, DC, USA, 2015. [Google Scholar]
- Roveda, L.; Polvara, E.; Invernizzi, M.; Capelli, L.; Sironi, S. Definition of an Emission Factor for VOC Emitted from Italian and European Refineries. Atmosphere 2020, 11, 564. [Google Scholar] [CrossRef]
- Invernizzi, M.; Roveda, L.; Polvara, E.; Sironi, S. Lights and Shadows of the Voc Emission Quantification. Chem. Eng. Trans. 2021, 85, 109–114. [Google Scholar] [CrossRef]
- U.S. EPA. Summary of the Clean Air Act. Available online: https://www.epa.gov/laws-regulations/summary-clean-air-act (accessed on 1 June 2021).
- U.S. EPA. Potential to Emit. A Guide for Small Businesses; U.S. EPA: Washington, DC, USA, 1998. [Google Scholar]
- United States Code. Title 42: The Public Health and Welfare; U.S. Government Publishing Office: Washington, DC, USA, 2016. [Google Scholar]
- U.S. EPA AP 42. Fifth Edition Compilation of Air Pollutant Emission Factors, Volume 1: Stationary and Point Sources; U.S. EPA: Washington, DC, USA, 1995; pp. 1–10. [Google Scholar]
- Shie, R.-H.; Chan, C.-C. Tracking hazardous air pollutants from a refinery fire by applying on-line and off-line air monitoring and back trajectory modeling. J. Hazard. Mater. 2013, 261, 72–82. [Google Scholar] [CrossRef] [PubMed] [Green Version]
- U.S. EPA. AP-42: Compilation of Air Emissions Factors; U.S. EPA: Washington, DC, USA, 1995. [Google Scholar]
- Loomis, D.; Guyton, K.Z.; Grosse, Y.; El Ghissassi, F.; Bouvard, V.; Benbrahim-Tallaa, L.; Guha, N.; Vilahur, N.; Mattock, H.; Straif, K. Carcinogenicity of benzene. Lancet Oncol. 2017, 18, 1574–1575. [Google Scholar] [CrossRef]
- OSHA 1910.1048—Formaldehyde. Available online: https://www.osha.gov/laws-regs/regulations/standardnumber/1910/1910.1048 (accessed on 1 June 2021).
- Kang, D.S.; Kim, H.S.; Jung, J.-H.; Lee, C.M.; Ahn, Y.-S.; Seo, Y.R. Formaldehyde exposure and leukemia risk: A comprehensive review and network-based toxicogenomic approach. Genes Environ. 2021, 43, 13. [Google Scholar] [CrossRef]
- Sedgwick, P. Pearson’s correlation coefficient. BMJ Br. Med. J. 2012, 345, e4483. [Google Scholar] [CrossRef] [Green Version]
- Evans, J.D. Straightforward Statistics for the Behavioral Sciences; Brooks/Cole Publishing Company: Pacific Grove, CA, USA, 1995; ISBN 0534231004. [Google Scholar]
- U.S. EPA. Procedures for Preparing Emission Factor Documents; U.S. EPA: Washington, DC, USA, 1997. [Google Scholar]
- U.S EPA. What Is the Definition of VOC? Available online: https://www.epa.gov/air-emissions-inventories/what-definition-voc (accessed on 12 June 2021).
- ACGIH®. ACGIH® Threshold Limit Values (TLVs®) and Biological Exposure Indices (BEIs®); ACGIH: Cincinnati, OH, USA, 2020; ISBN 978-1-607261-45-2. [Google Scholar]
- OSHA Hydrogen Cyanide. Available online: https://www.osha.gov/chemicaldata/559 (accessed on 13 October 2021).
- Begou, P.; Kassomenos, P. One-year measurements of toxic benzene concentrations in the ambient air of Greece: An estimation of public health risk. Atmos. Pollut. Res. 2020, 11, 1829–1838. [Google Scholar] [CrossRef]
- Stenehjem, J.S.; Kjærheim, K.; Bråtveit, M.; Samuelsen, S.O.; Barone-Adesi, F.; Rothman, N.; Lan, Q.; Grimsrud, T.K. Benzene exposure and risk of lymphohaematopoietic cancers in 25,000 offshore oil industry workers. Br. J. Cancer 2015, 112, 1603–1612. [Google Scholar] [CrossRef] [Green Version]
- Metwally, F.M.; Gamal El Din, A.A.; Kotob, S.E.; Khalil, W.K.B.; Morsy, F.A.; Ahmed, H.H. Integrated view of formaldehyde in lung toxicity: Molecular mechanisms, cellular aberrations and pathological considerations. J. Glob. Pharma Technol. 2020, 12, 340–356. [Google Scholar]
- Bernstein, R.S.; Elliott, L.J.; Blade, L. Inhalation Exposure to Formaldehyde: An Overview of Its Toxicology, Epidemiology, Monitoring, and Control. Am. Ind. Hyg. Assoc. J. 1984, 45, 778–785. [Google Scholar] [CrossRef]
- Council, N.R. Review of the Formaldehyde Assessment in the National Toxicology Program 12th Report on Carcinogens; The National Academies Press: Washington, DC, USA, 2014; ISBN 978-0-309-31227-1. [Google Scholar]
- Limpert, E.; Stahel, W.; Abbt, M. Log-normal Distributions across the Sciences: Keys and Clues. Bioscience 2001, 51, 341–352. [Google Scholar] [CrossRef]
- Garcia, E. A Tutorial on Quantile-Quantile Plots. Available online: https://www.researchgate.net/publication/308631899_A_Tutorial_on_Quantile-Quantile_Plots (accessed on 12 June 2021).
- Canadian Fuels Association. Code of Practice for Developing an Emission Inventory for Refineries and Terminals; Canadian Fuels Association: Ottawa, ON, Canada, 2021. [Google Scholar]
- EMEP/EEA. Air Pollutant Emission Inventory Guidebook 2019; EMEP/EEA: Luxembourg, 2019; ISBN 978-92-9480-098-5. [Google Scholar]
- Saikomol, S.; Thepanondh, S.; Laowagul, W. Emission losses and dispersion of volatile organic compounds from tank farm of petroleum refinery complex. J. Environ. Health Sci. Eng. 2019, 17, 561–570. [Google Scholar] [CrossRef] [PubMed]
- U.S. EPA. Emission Factor Documentation for AP-42 Organic Liquid Storage Tanks Final Report; U.S. EPA: Washington, DC, USA, 2020. [Google Scholar]
Figure 1.
Contribution of the most present compounds to the total HAP emissions.

Figure 2.
Total emissions of organic HAPs for 109 refineries.

Figure 3.
Total emissions of benzene for 119 refineries.

Figure 4.
Total emissions of formaldehyde for 109 refineries.

Figure 5.
Distribution of the dataset for (a) organic HAPs; (b) benzene; (c) formaldehyde.

Figure 6.
QQ-Plot for the three datasets.


Table 1.
List of compounds responsible for almost 90% of total HAP emissions from American refineries with respective TLV–TWA [43,44].
| Compound Name | TLV–TWA [ppm] | % of Total HAPs |
|---|---|---|
| 1,3-Butadiene | 2 | 0.6 |
| 2,2,4-Trimetilpentane | 100 | 5.4 |
| 2-Metilnaphtalene | 0.5 | 0.3 |
| Acenaphtene | 0.2 | 0.0 |
| Acetaldehyde | 25 | 0.4 |
| Anthracene | 0.2 | 0.1 |
| Benzene | 0.5 | 6.2 |
| Biphenyl | 0.2 | 0.2 |
| Carbon Disulfide | 10 | 0.6 |
| Carbonyl Sulfide | 5 | 1.9 |
| Cumene | 50 | 0.8 |
| Diethanolamine | 3 | 0.3 |
| Ethyl Benzene | 20 | 2.6 |
| Formaldehyde | 0.1 | 2.1 |
| Hexane | 50 | 19.0 |
| Hydrogen Cyanide | 10 | 19.2 |
| Methanol | 200 | 2.3 |
| Methyl Tert-Butyl Ether | 50 | 0.6 |
| m-Xylene | 100 | 0.5 |
| Naphtalene | 10 | 1.3 |
| o-Xylene | 100 | 0.4 |
| Phenol | 5 | 0.3 |
| p-Xylene | 100 | 0.6 |
| Styrene | 10 | 1.7 |
| Toluene | 20 | 12.2 |
| Xylenes | 100 | 9.6 |
| Others (161 compounds) | - | 10.8 |
Table 2.
Recap of r values for both scenarios 1 and 2 and both total HAPs emission and only organic HAPs emission.
Table 2.
Recap of r values for both scenarios 1 and 2 and both total HAPs emission and only organic HAPs emission.
| Scenario | Total HAPs | Organic HAPs |
|---|---|---|
| 1. 119 refineries | 0.73 | 0.69 |
| 2. 109 refineries | 0.83 | 0.81 |
Table 3.
Mean, median, and standard deviation evaluated of organic HAP EF of the dataset expressed in g/ton of crude oil processed.
Table 3.
Mean, median, and standard deviation evaluated of organic HAP EF of the dataset expressed in g/ton of crude oil processed.
| Mean | Median | Standard Deviation |
|---|---|---|
| 14.3 | 10.4 | 14.6 |
Table 4.
Mean and standard deviation for the ln(x) distribution, with x expressed in g/ton of crude oil processed.
Table 4.
Mean and standard deviation for the ln(x) distribution, with x expressed in g/ton of crude oil processed.
| µ | σ (ln(X)) |
|---|---|
| 2.3 | 0.93 |
Table 5.
Expected value, standard deviation, and back transformed mean and standard deviation for the log-normal distribution expressed in g/ton of crude oil processed for organic HAPs.
Table 5.
Expected value, standard deviation, and back transformed mean and standard deviation for the log-normal distribution expressed in g/ton of crude oil processed for organic HAPs.
| EF | σ | LL | UL |
|---|---|---|---|
| 9.8 | 0.93 | 3.9 | 24.9 |
Table 6.
Expected value, standard deviation, and back transformed mean and standard deviation for the log-normal distribution expressed in g/ton of crude oil processed for benzene.
Table 6.
Expected value, standard deviation, and back transformed mean and standard deviation for the log-normal distribution expressed in g/ton of crude oil processed for benzene.
| EF | σ | LL | UL |
|---|---|---|---|
| 0.75 | 1.1 | 0.26 | 2.2 |
Table 7.
Expected value, standard deviation, and back transformed mean and standard deviation for the lognormal distribution expressed in g/ton of crude oil processed for formaldehyde.
Table 7.
Expected value, standard deviation, and back transformed mean and standard deviation for the lognormal distribution expressed in g/ton of crude oil processed for formaldehyde.
| EF | σ | LL | UL |
|---|---|---|---|
| 0.18 | 1.3 | 0.046 | 0.69 |
Publisher’s Note: MDPI stays neutral with regard to jurisdictional claims in published maps and institutional affiliations. |
© 2021 by the authors. Licensee MDPI, Basel, Switzerland. This article is an open access article distributed under the terms and conditions of the Creative Commons Attribution (CC BY) license (https://creativecommons.org/licenses/by/4.0/).
Share and Cite
MDPI and ACS Style
Polvara, E.; Roveda, L.; Invernizzi, M.; Capelli, L.; Sironi, S. Estimation of Emission Factors for Hazardous Air Pollutants from Petroleum Refineries. Atmosphere 2021, 12, 1531. https://0-doi-org.brum.beds.ac.uk/10.3390/atmos12111531
AMA Style
Polvara E, Roveda L, Invernizzi M, Capelli L, Sironi S. Estimation of Emission Factors for Hazardous Air Pollutants from Petroleum Refineries. Atmosphere. 2021; 12(11):1531. https://0-doi-org.brum.beds.ac.uk/10.3390/atmos12111531
Chicago/Turabian StylePolvara, Elisa, Luca Roveda, Marzio Invernizzi, Laura Capelli, and Selena Sironi. 2021. "Estimation of Emission Factors for Hazardous Air Pollutants from Petroleum Refineries" Atmosphere 12, no. 11: 1531. https://0-doi-org.brum.beds.ac.uk/10.3390/atmos12111531
Note that from the first issue of 2016, this journal uses article numbers instead of page numbers. See further details here.