
Ozone Variation during the Development of a Tropical Cyclone: Case Study

 , and
, and 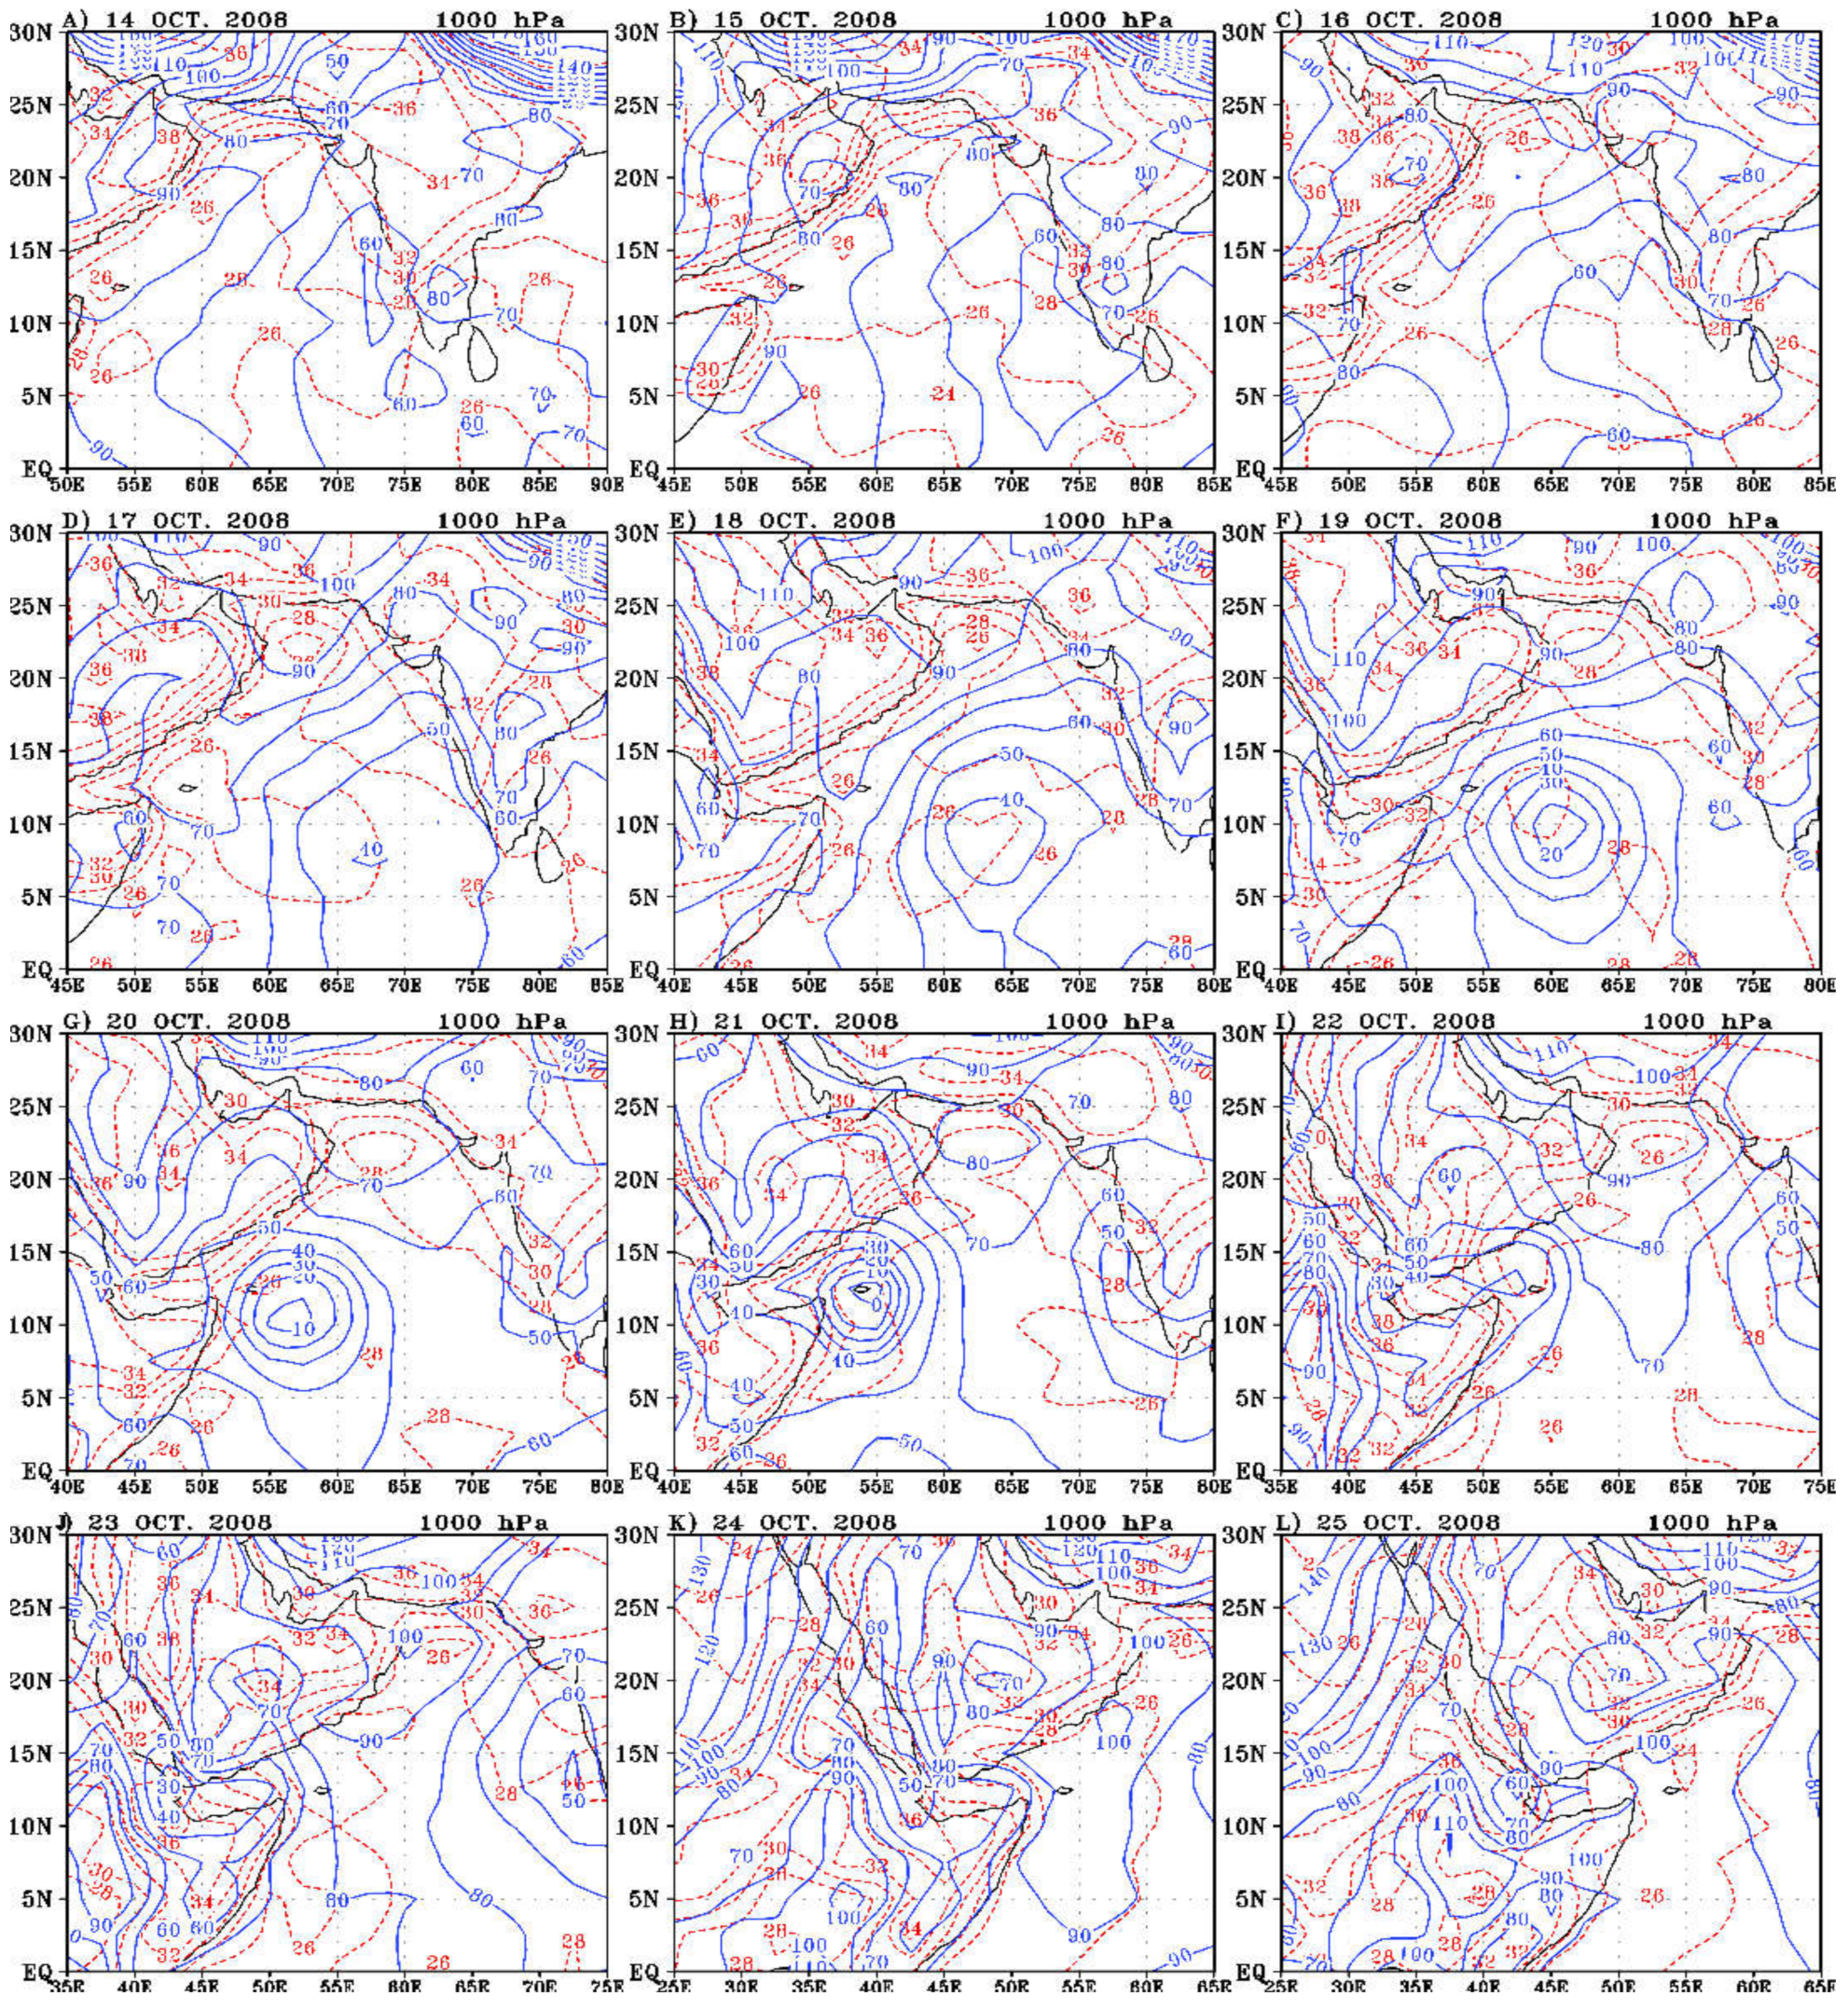
Abstract
:1. Introduction
2. Data and Statistical Procedures
Data Acquisition
3. Results and Discussions
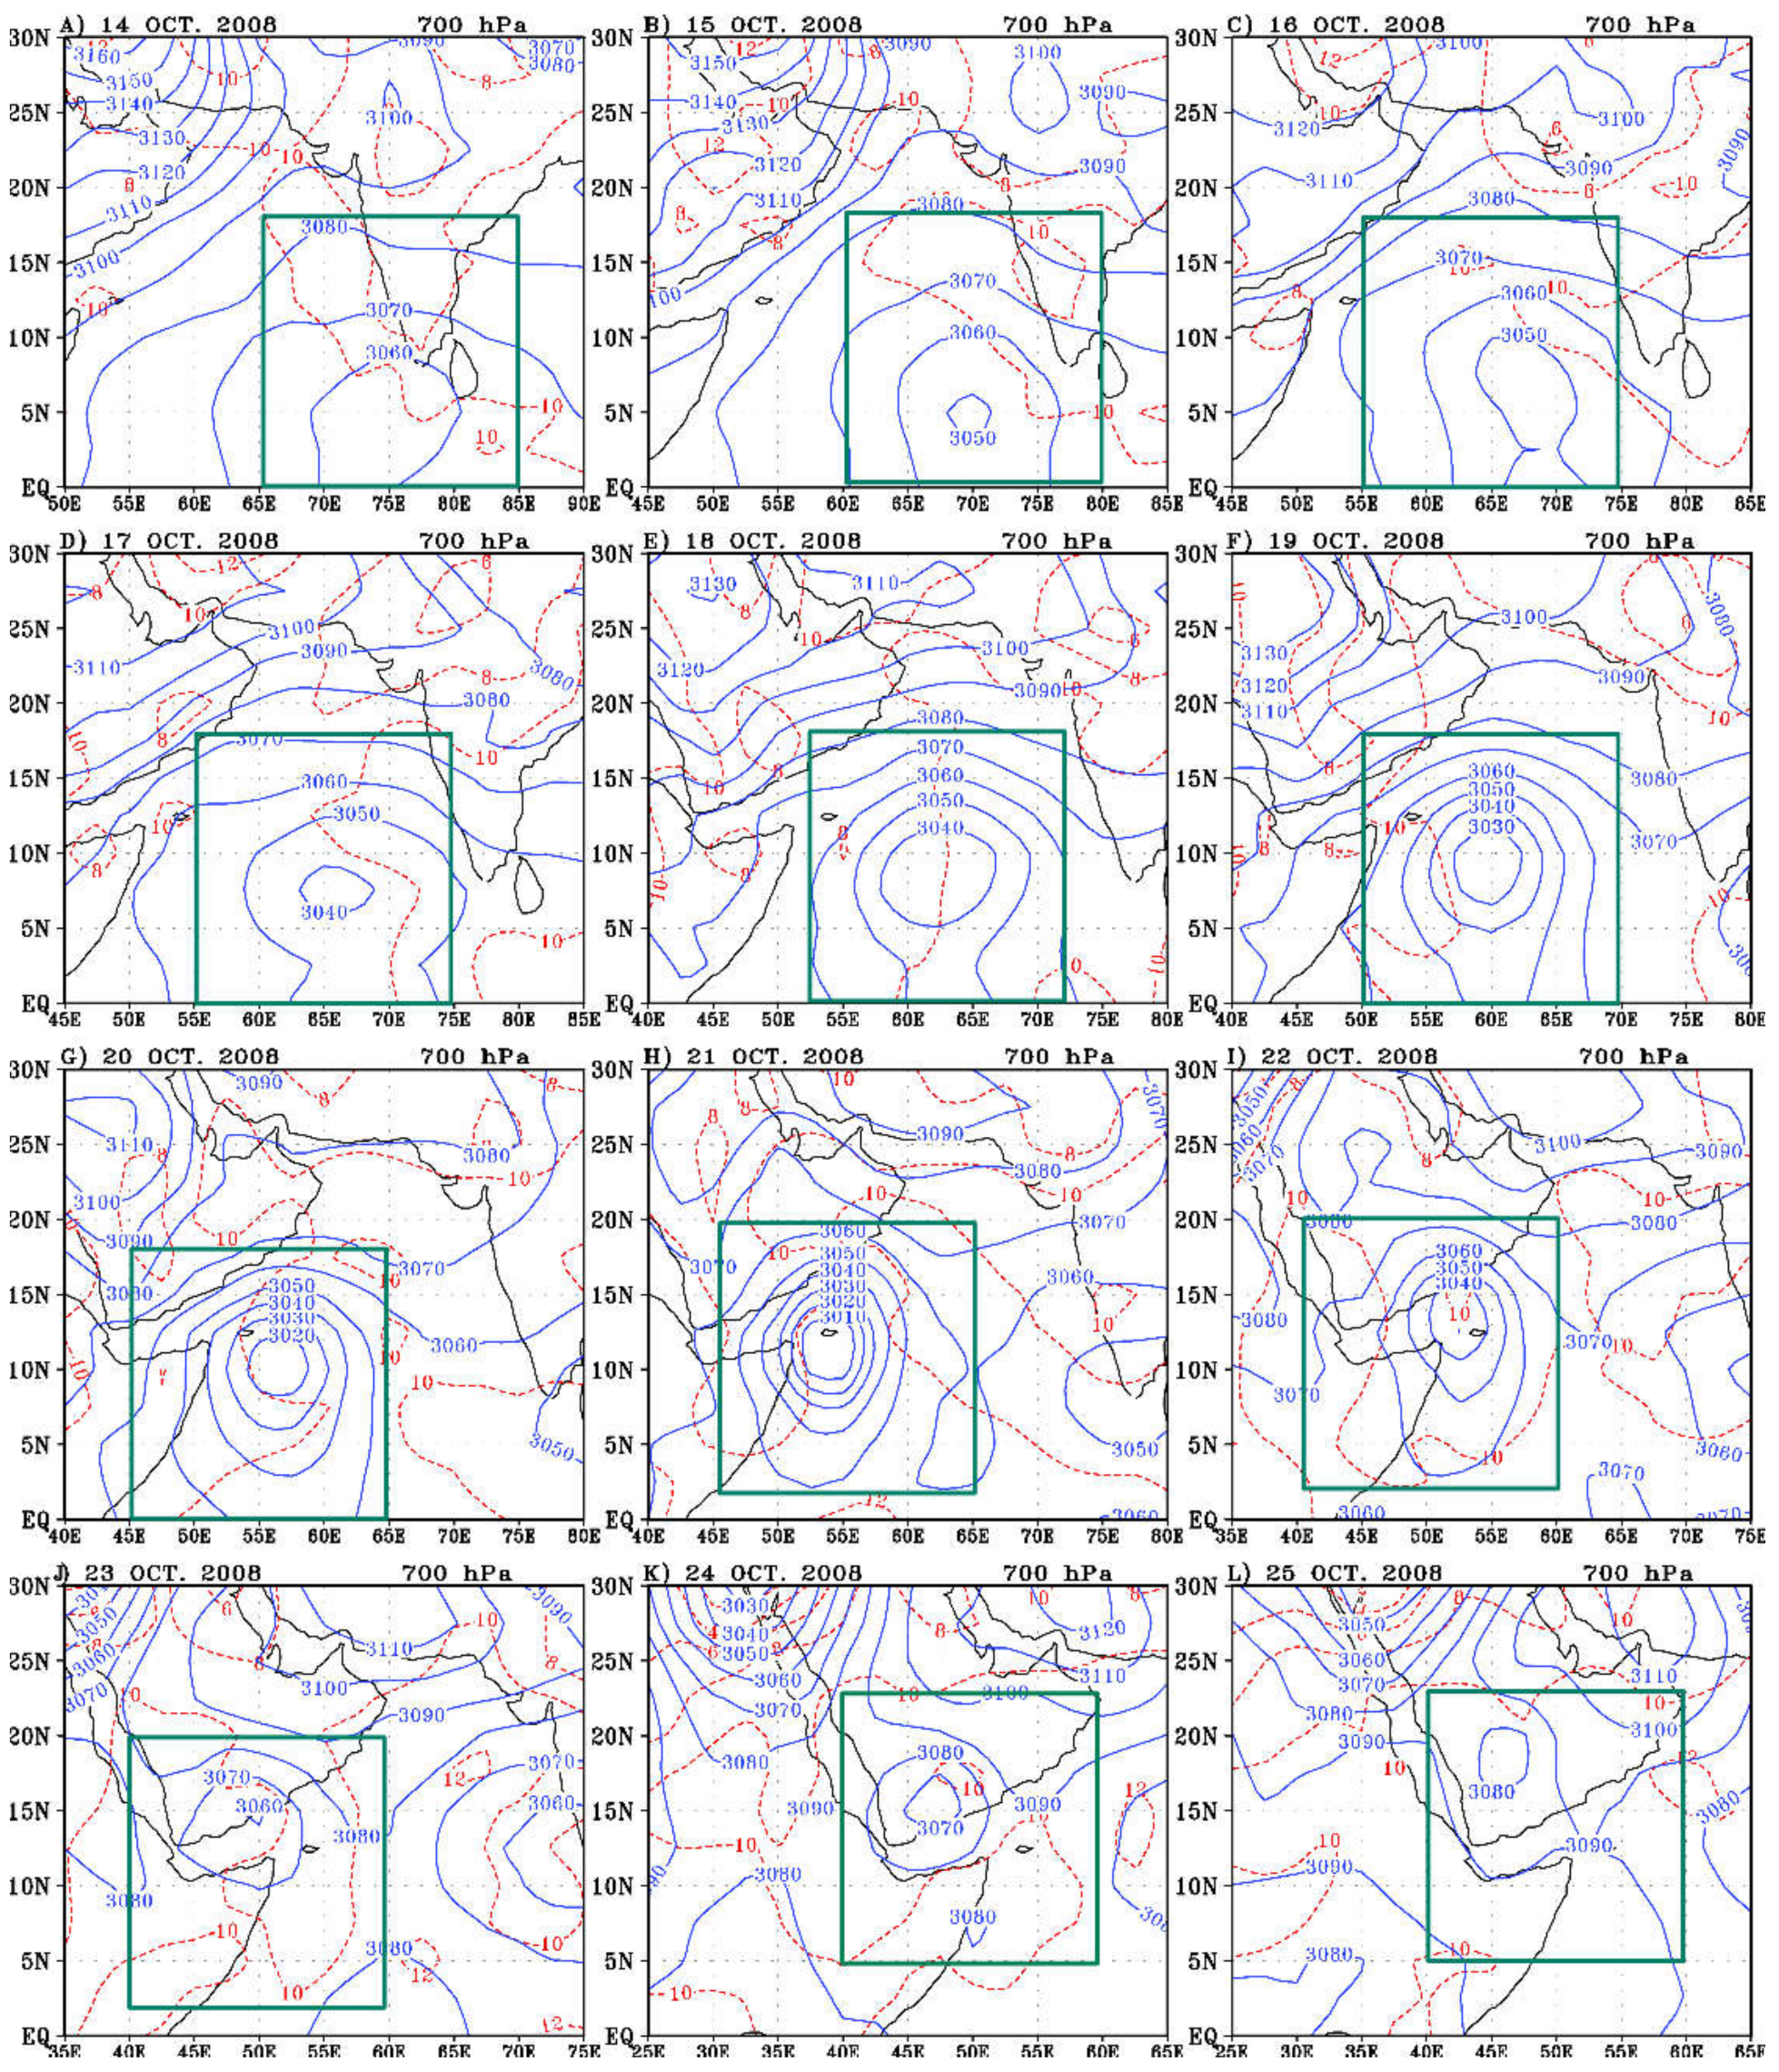
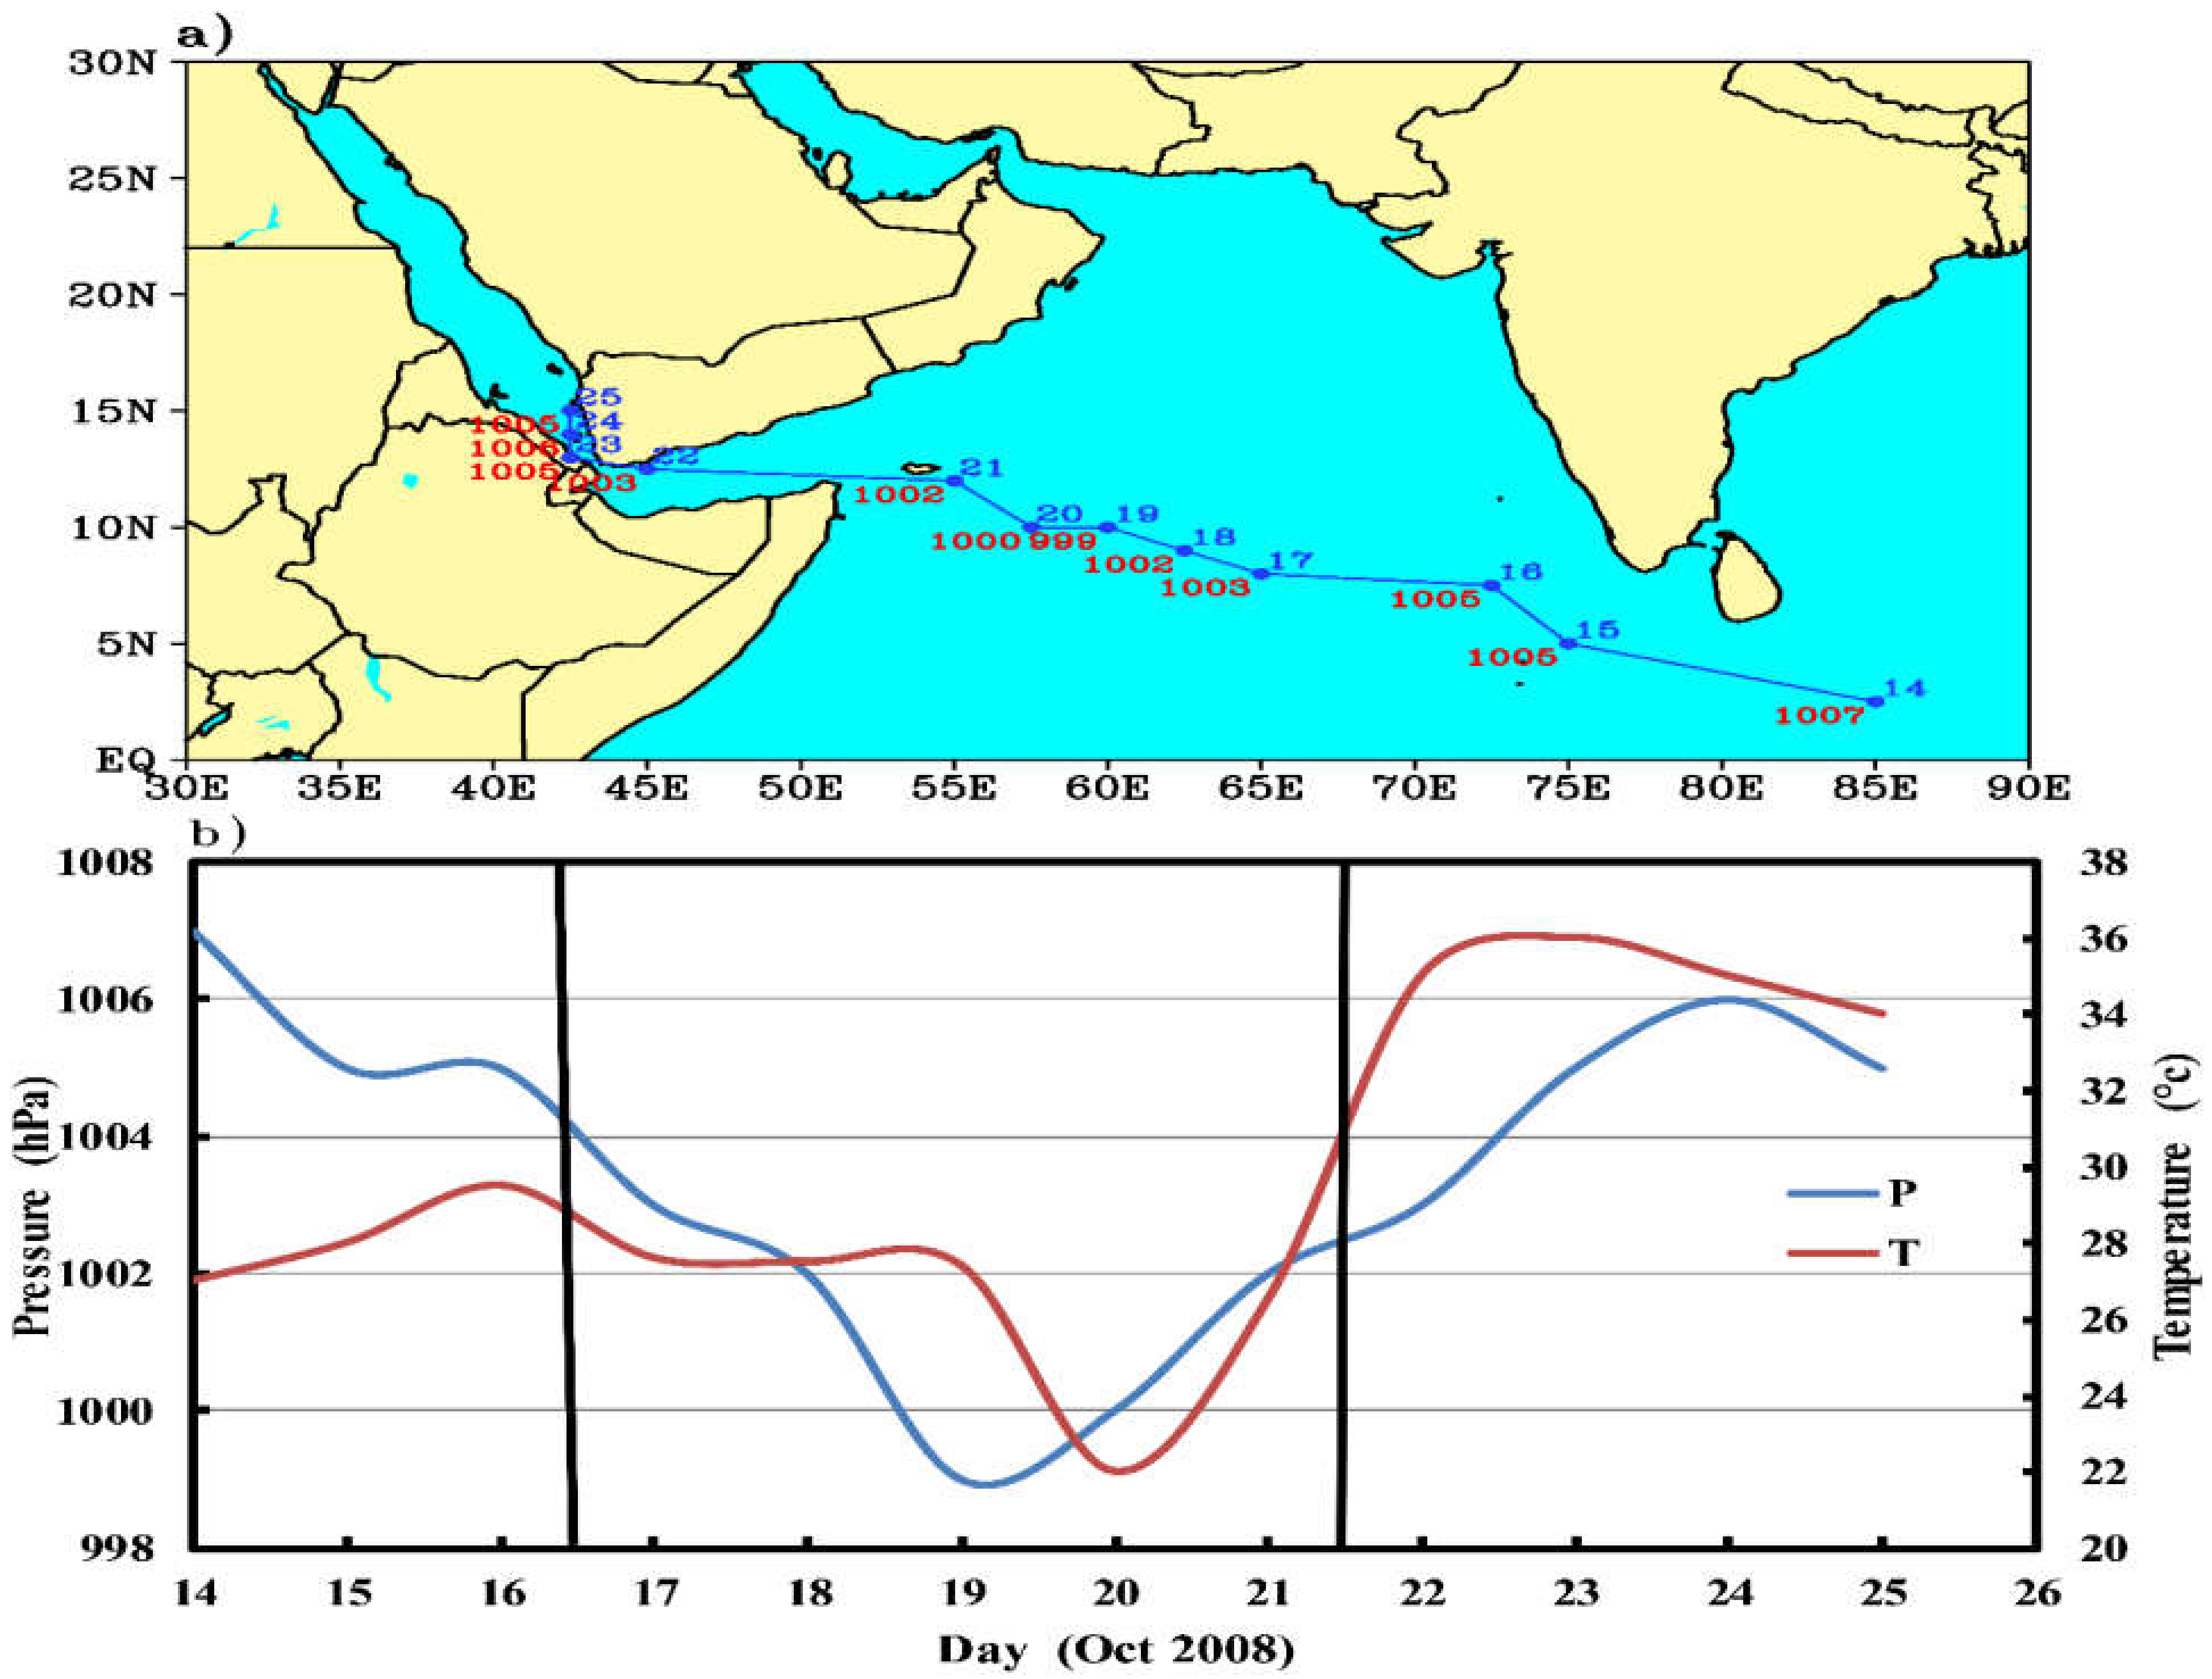
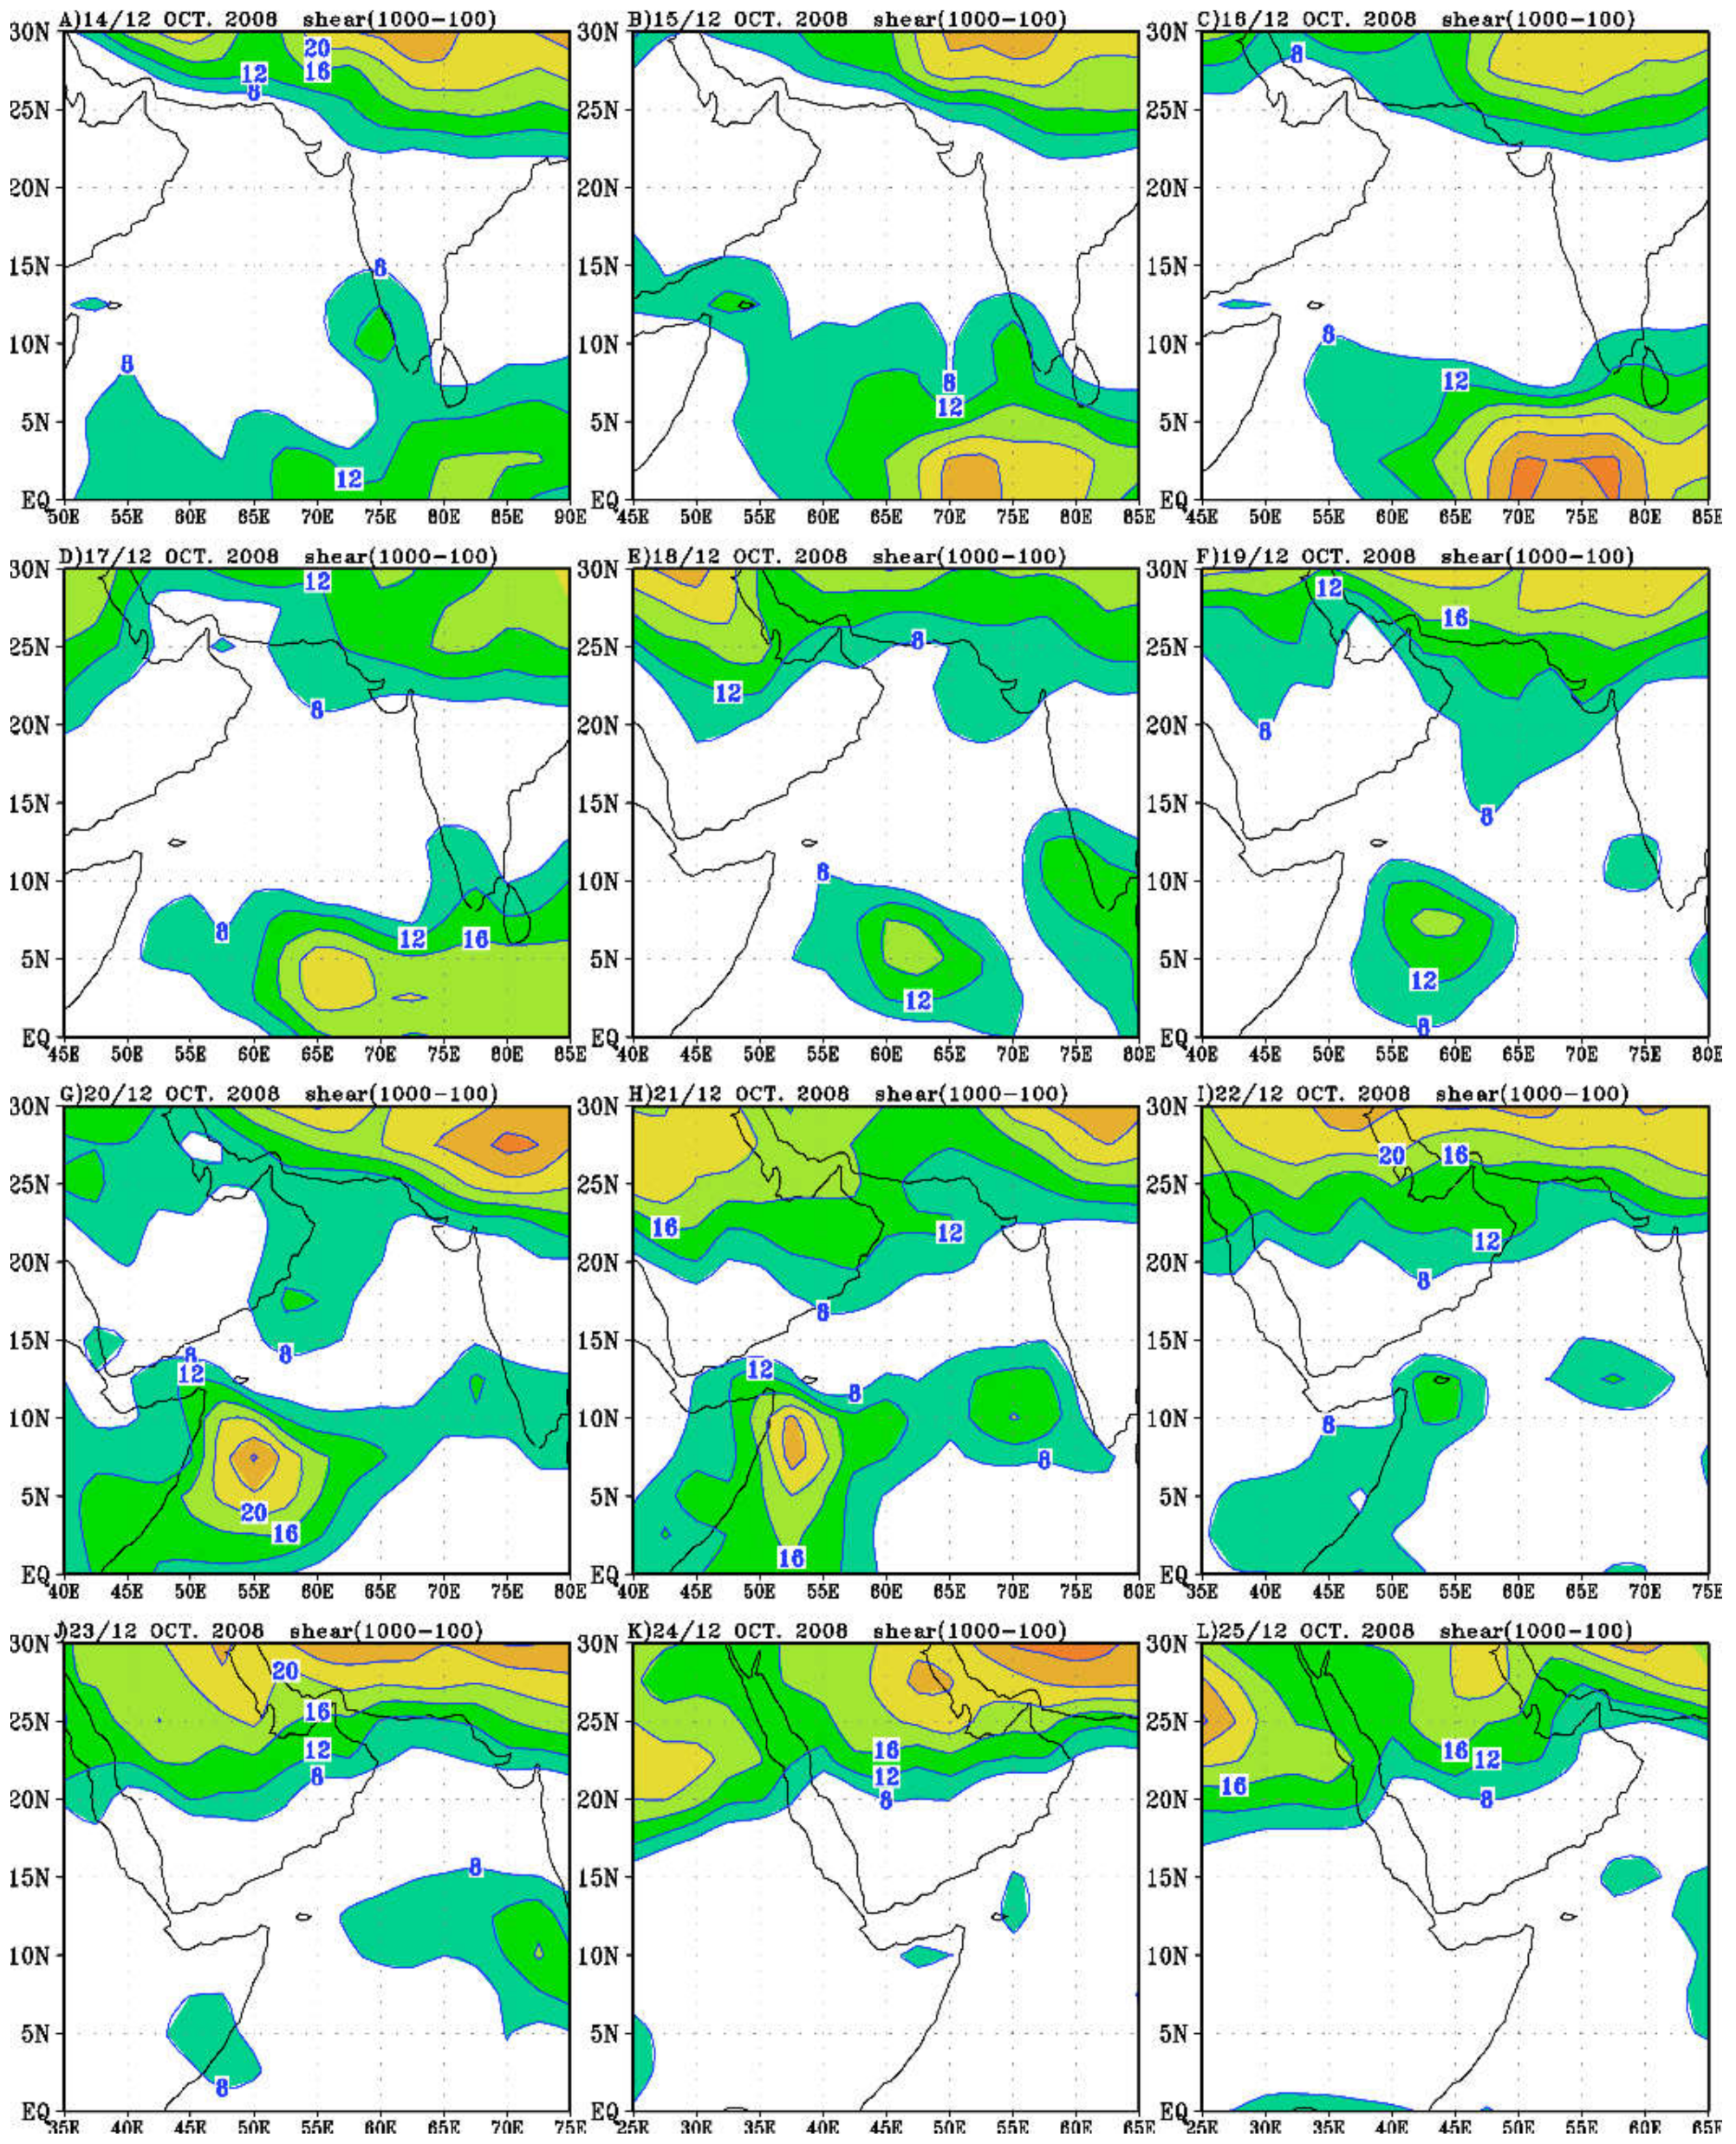
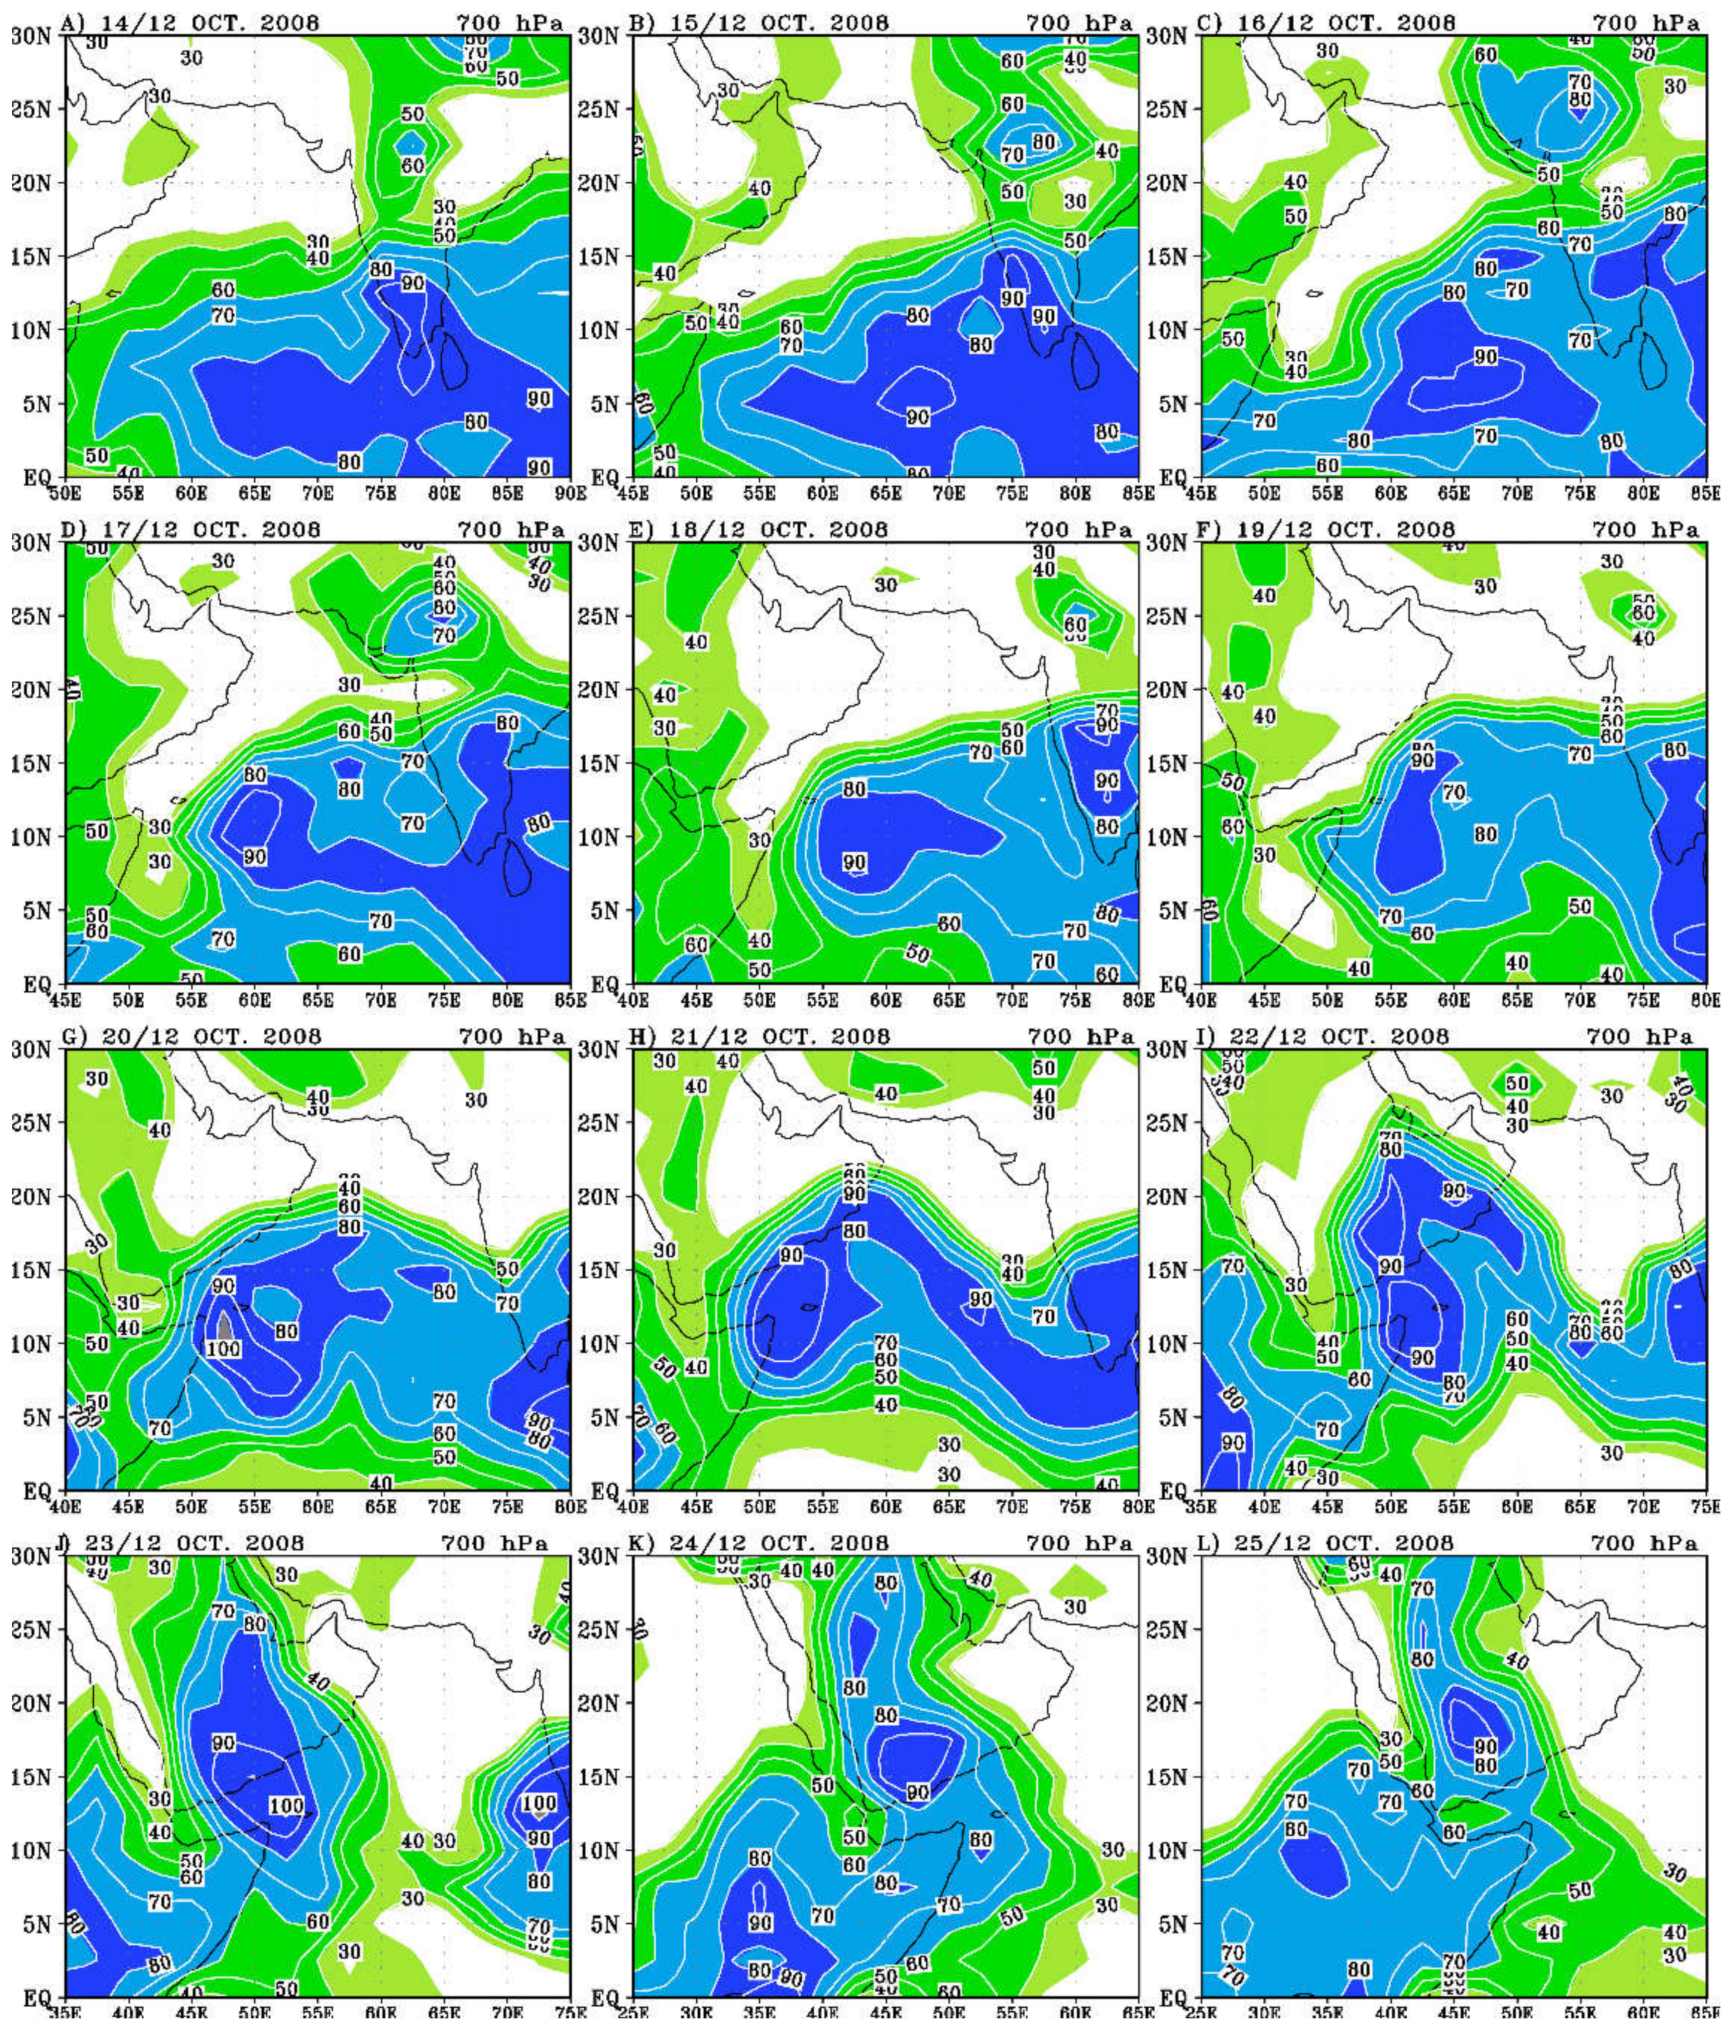
3.1. Synoptic Discussion
3.2. Vertical Tilt of Tropical Cyclone
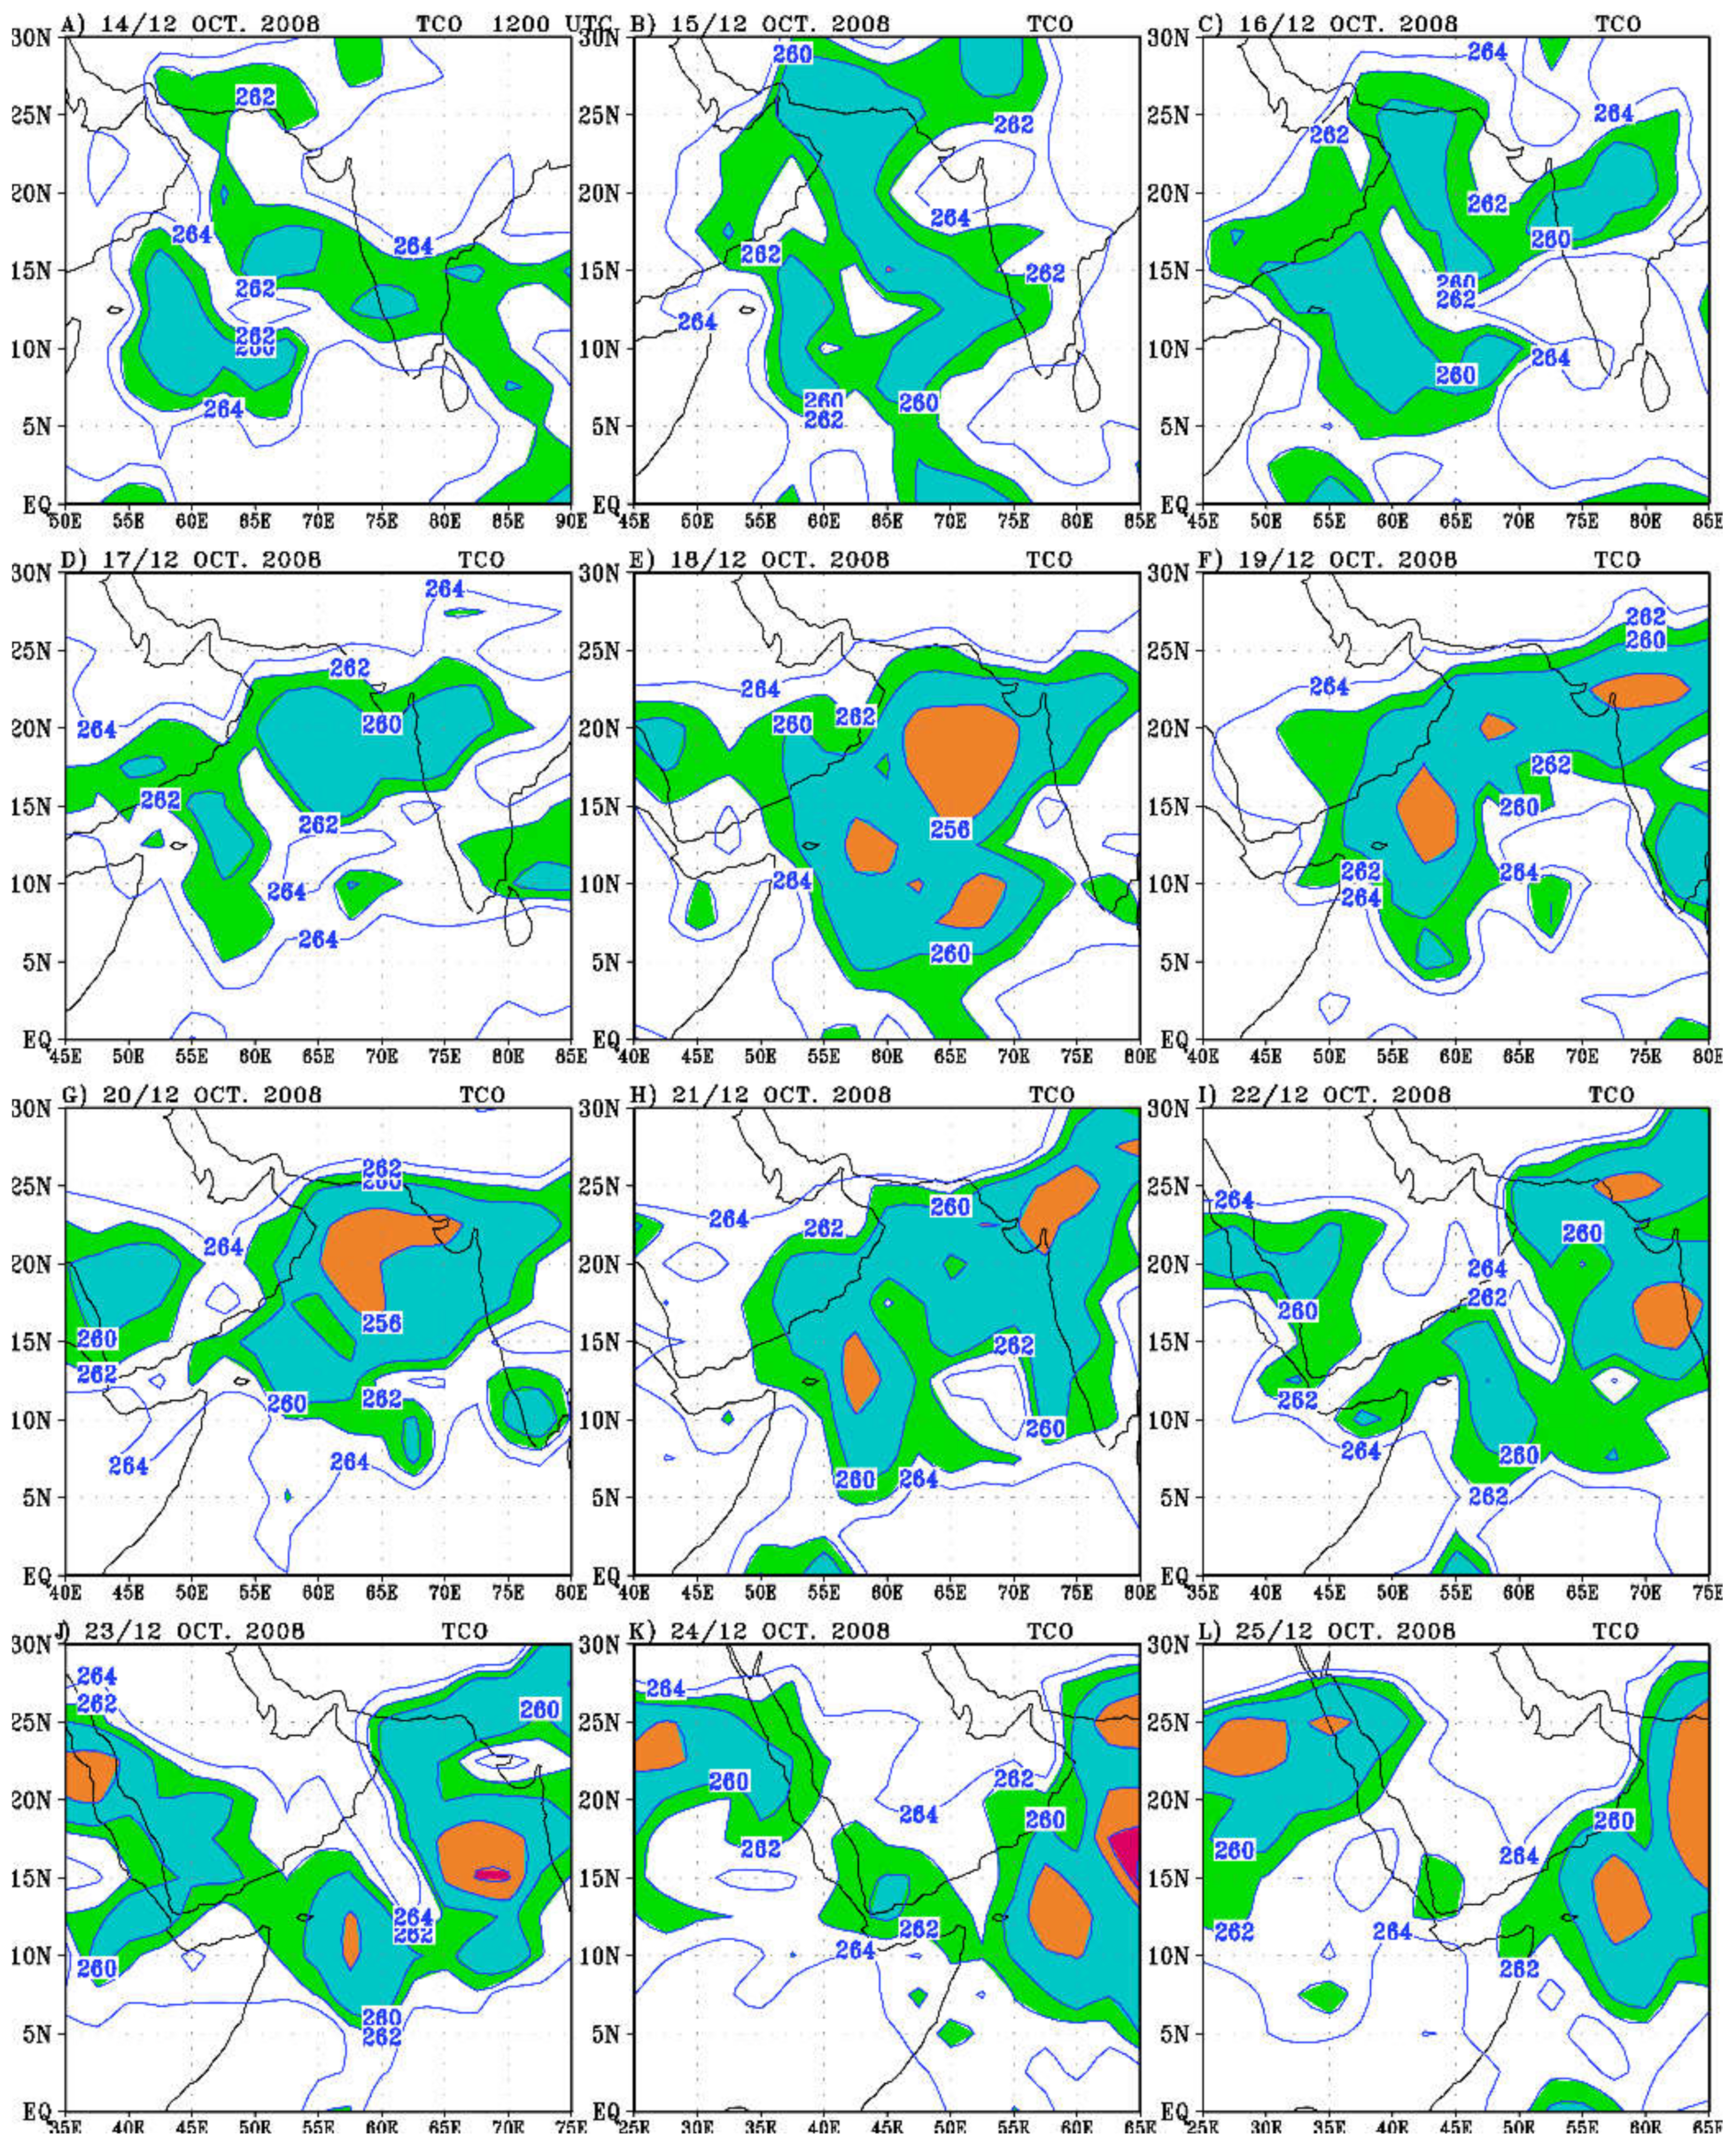
3.3. The Horizontal Distribution of TOC
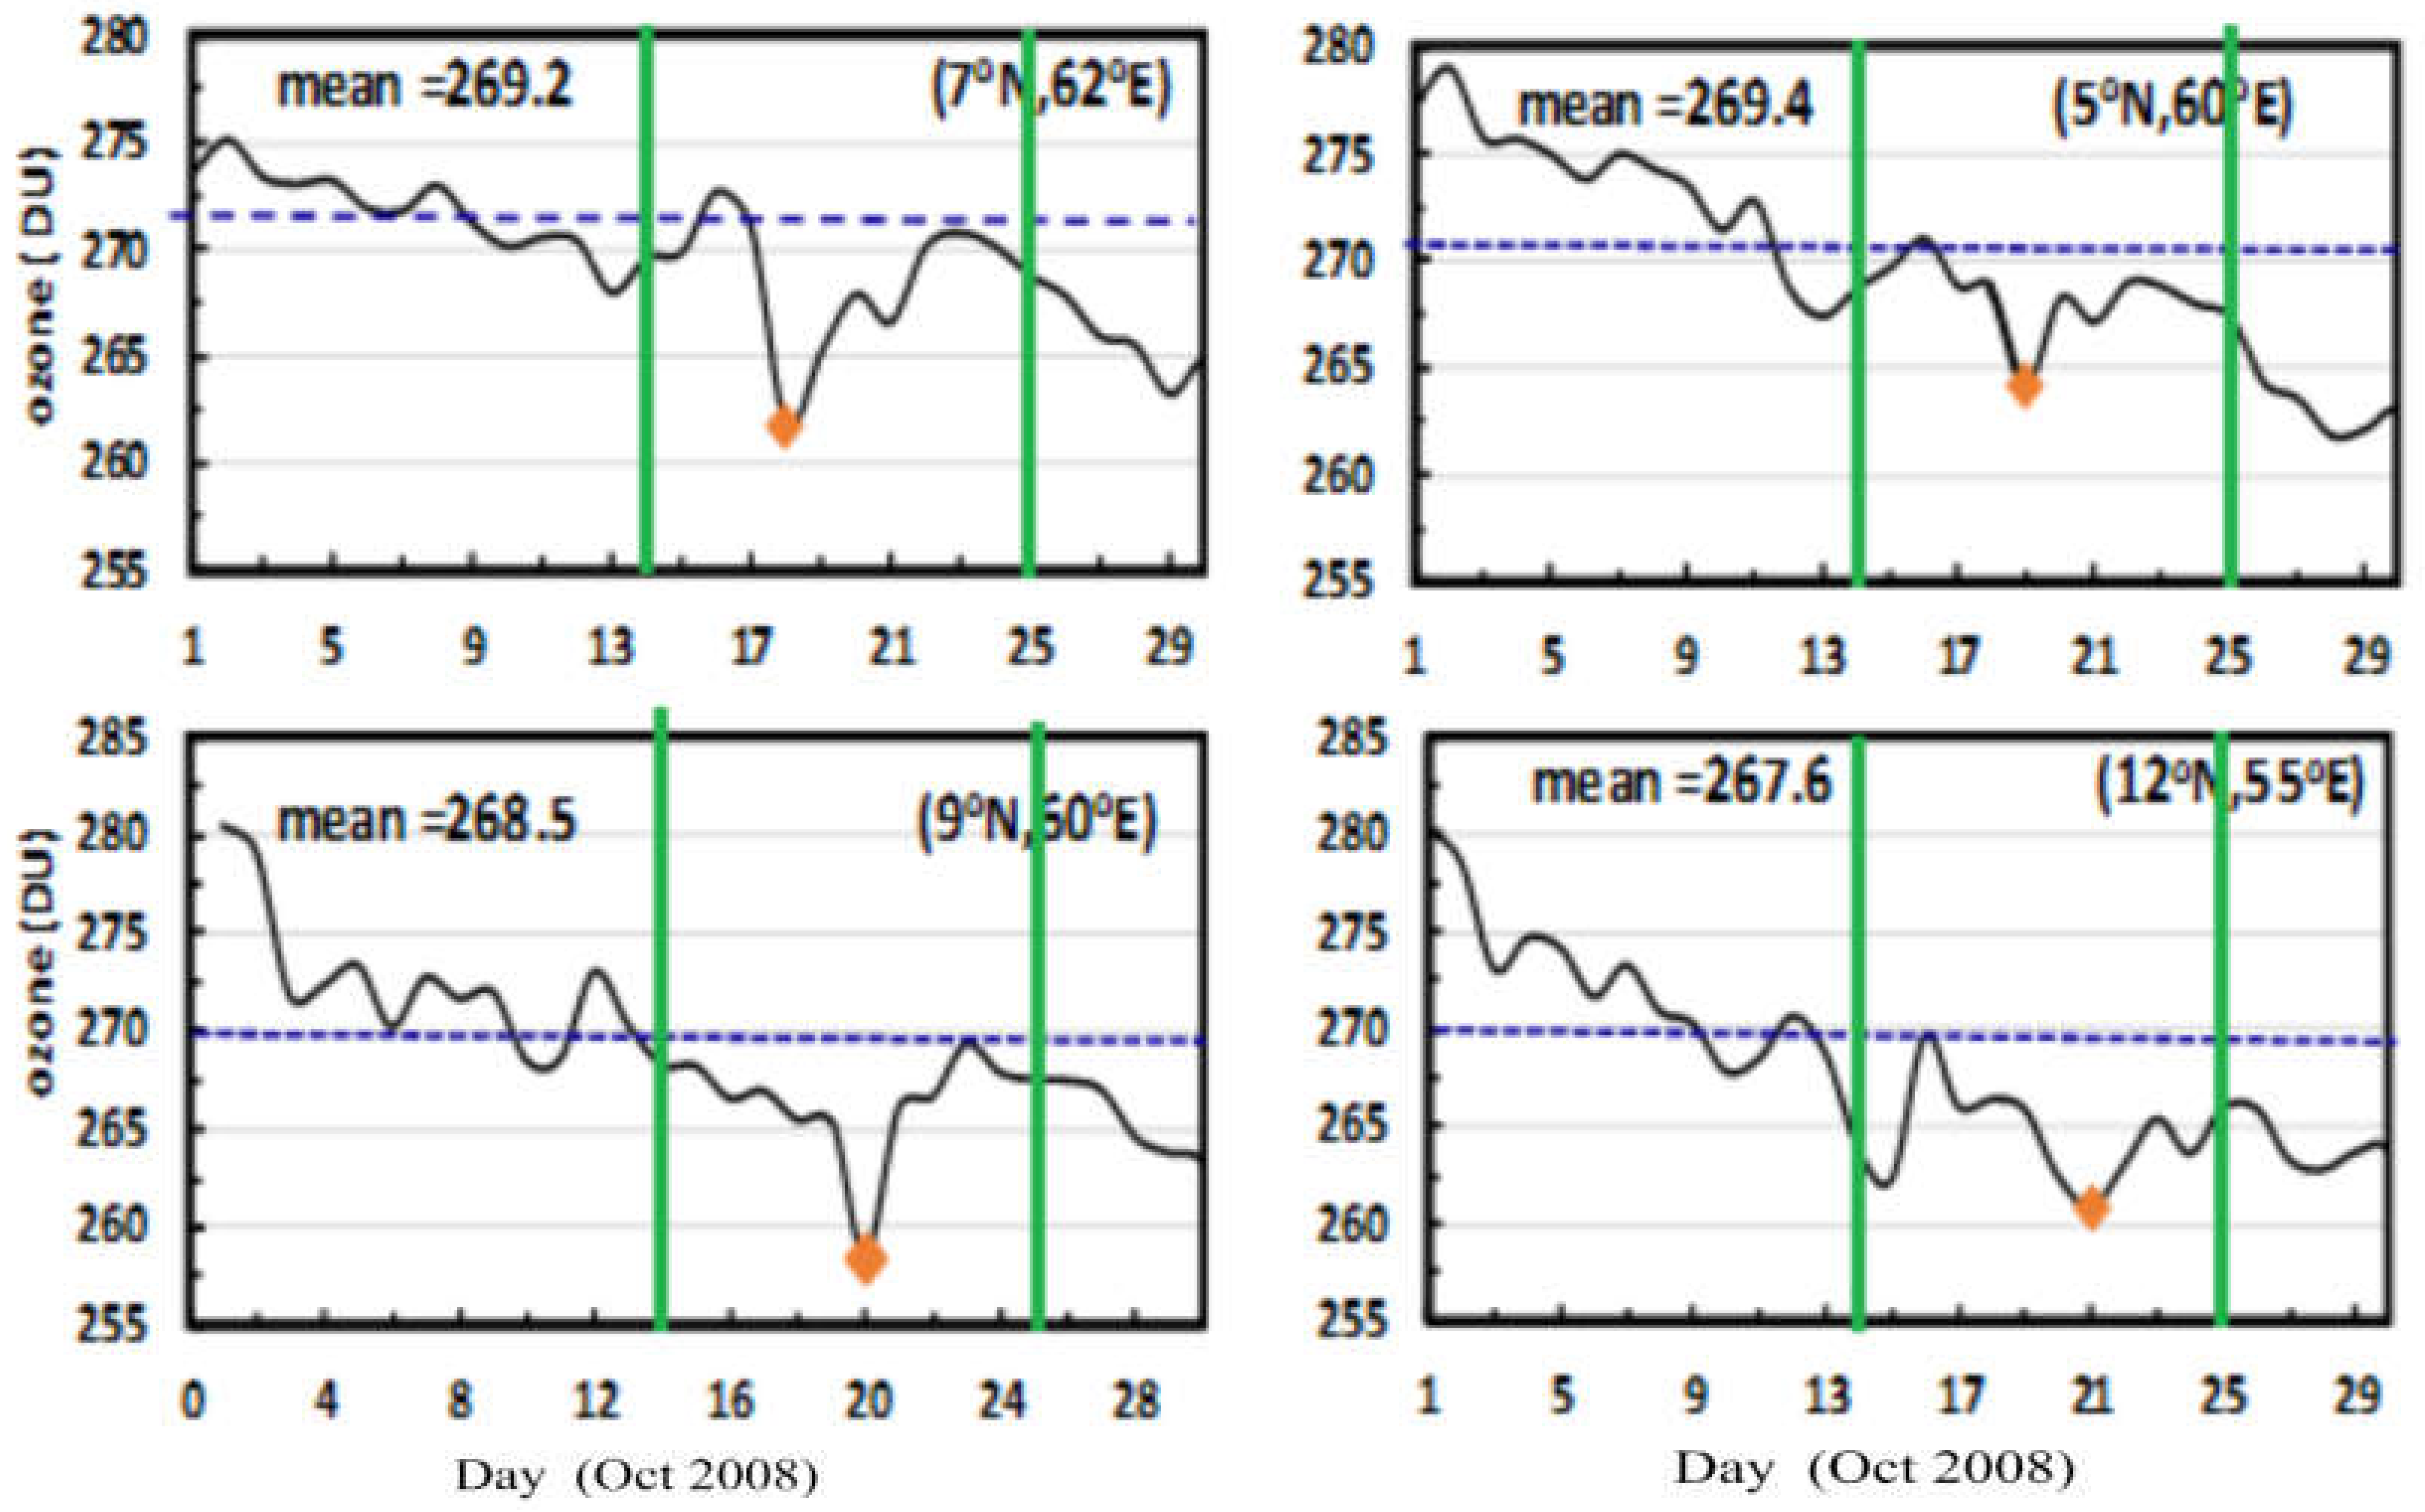
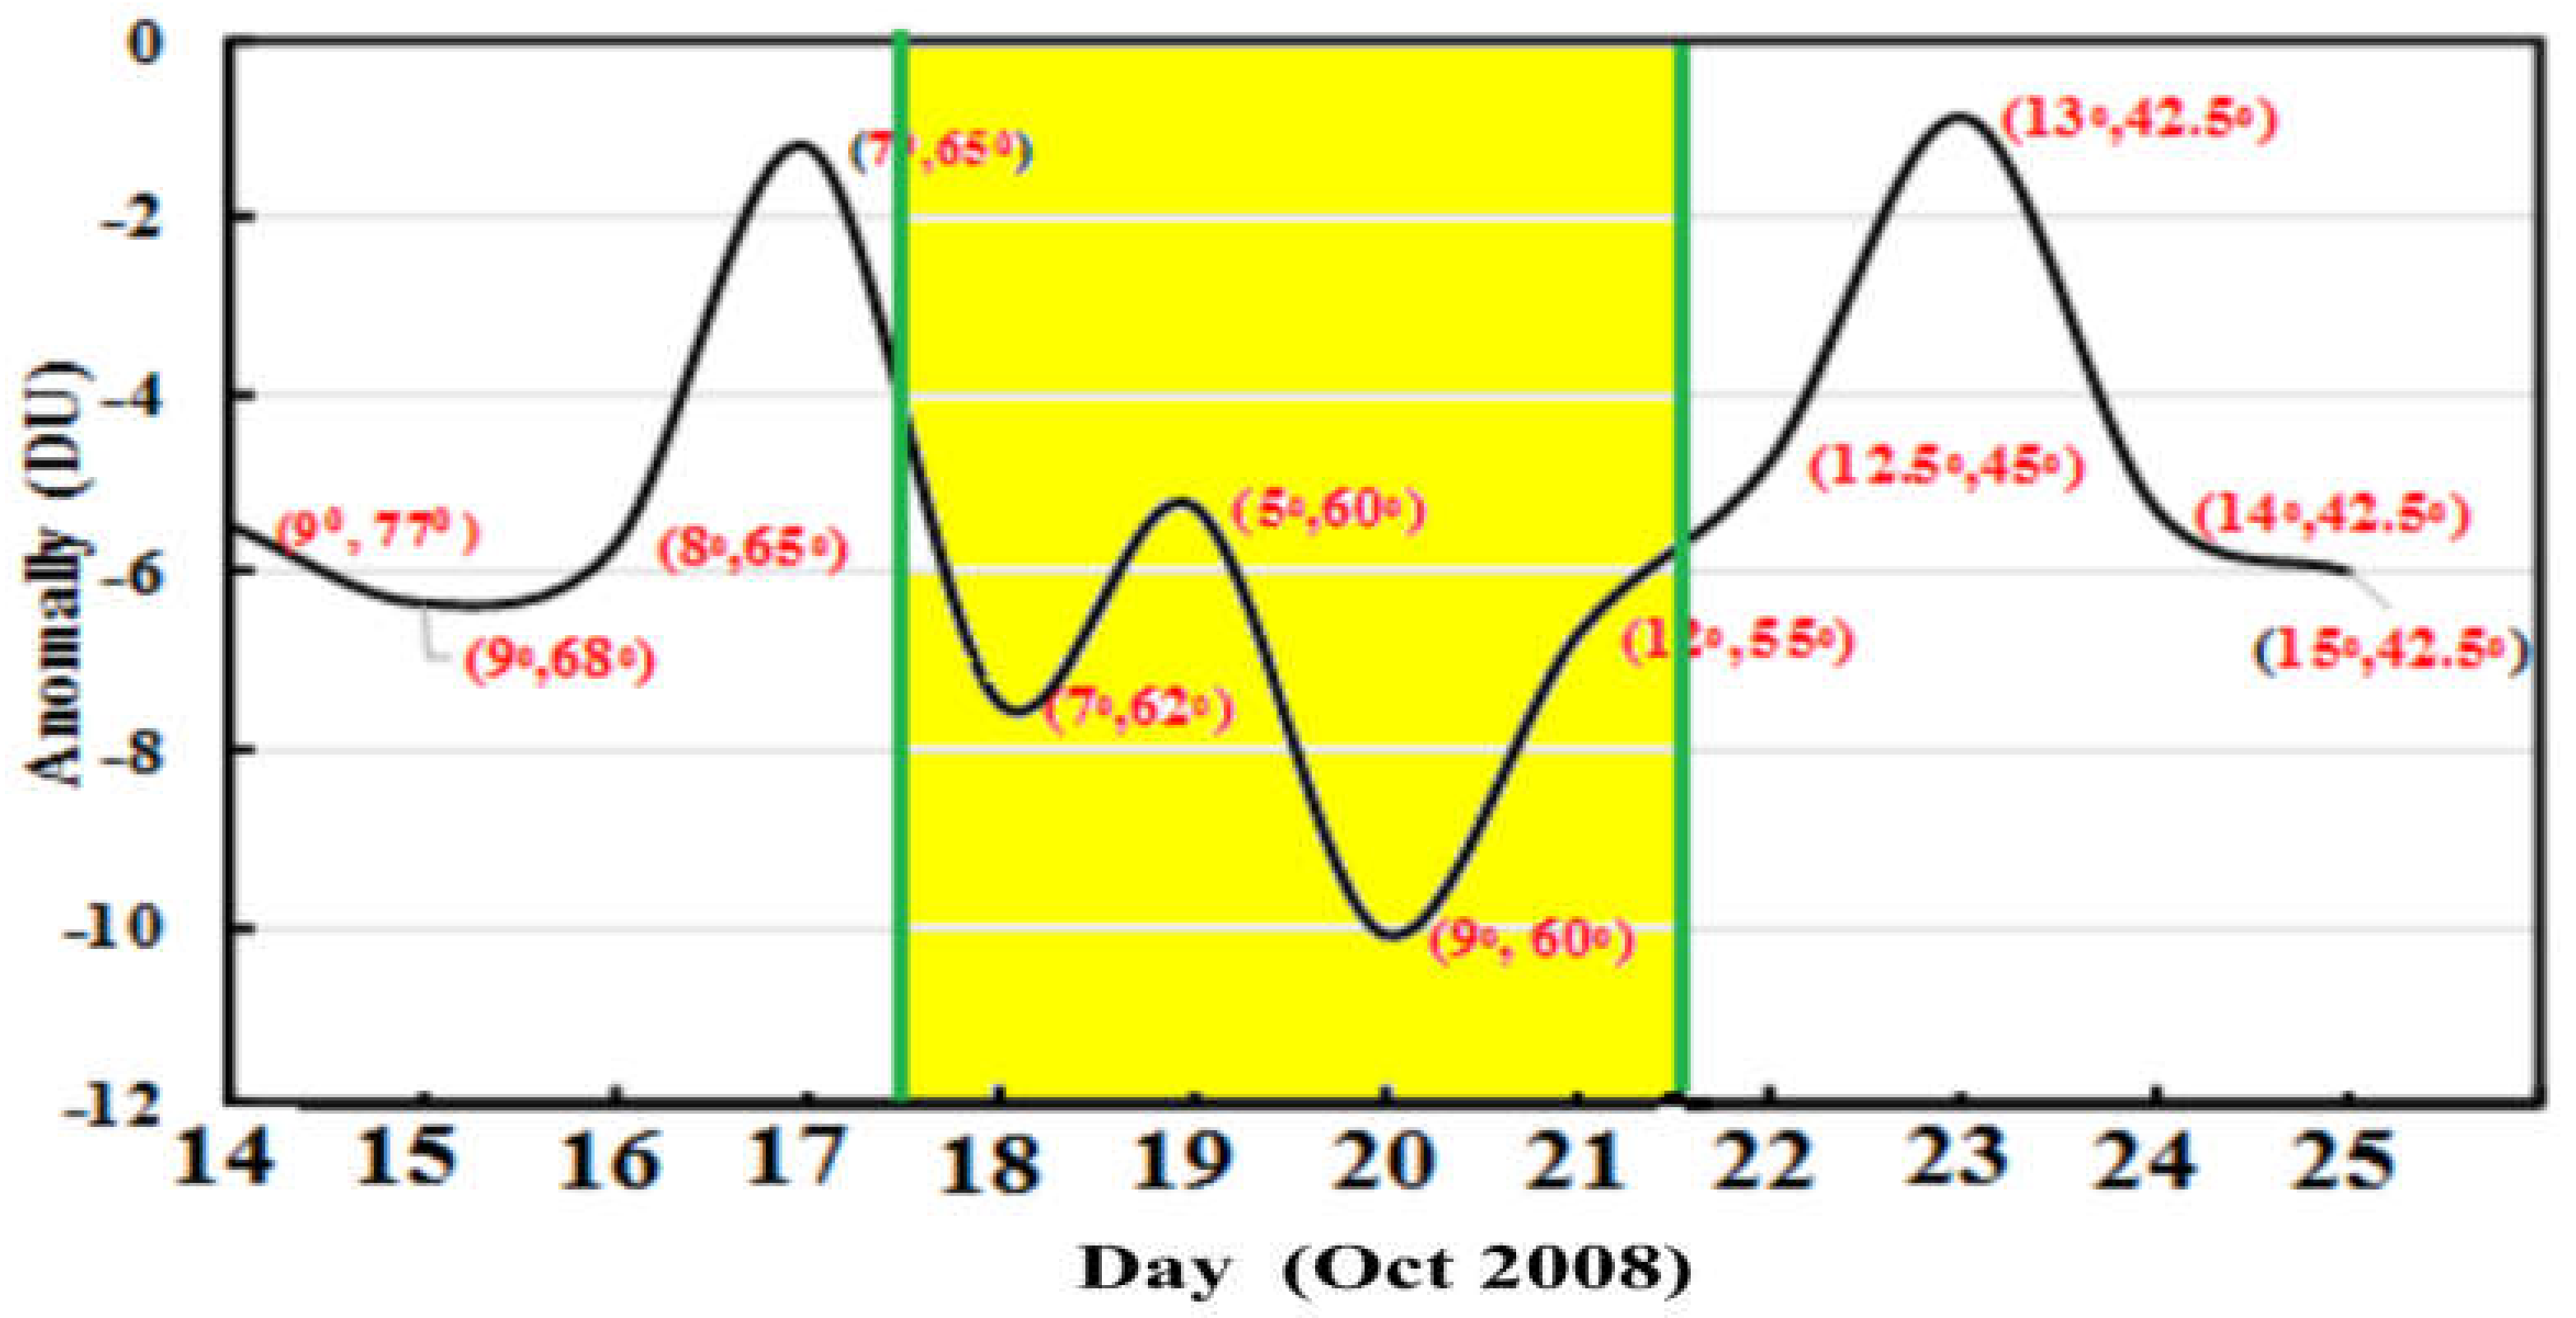
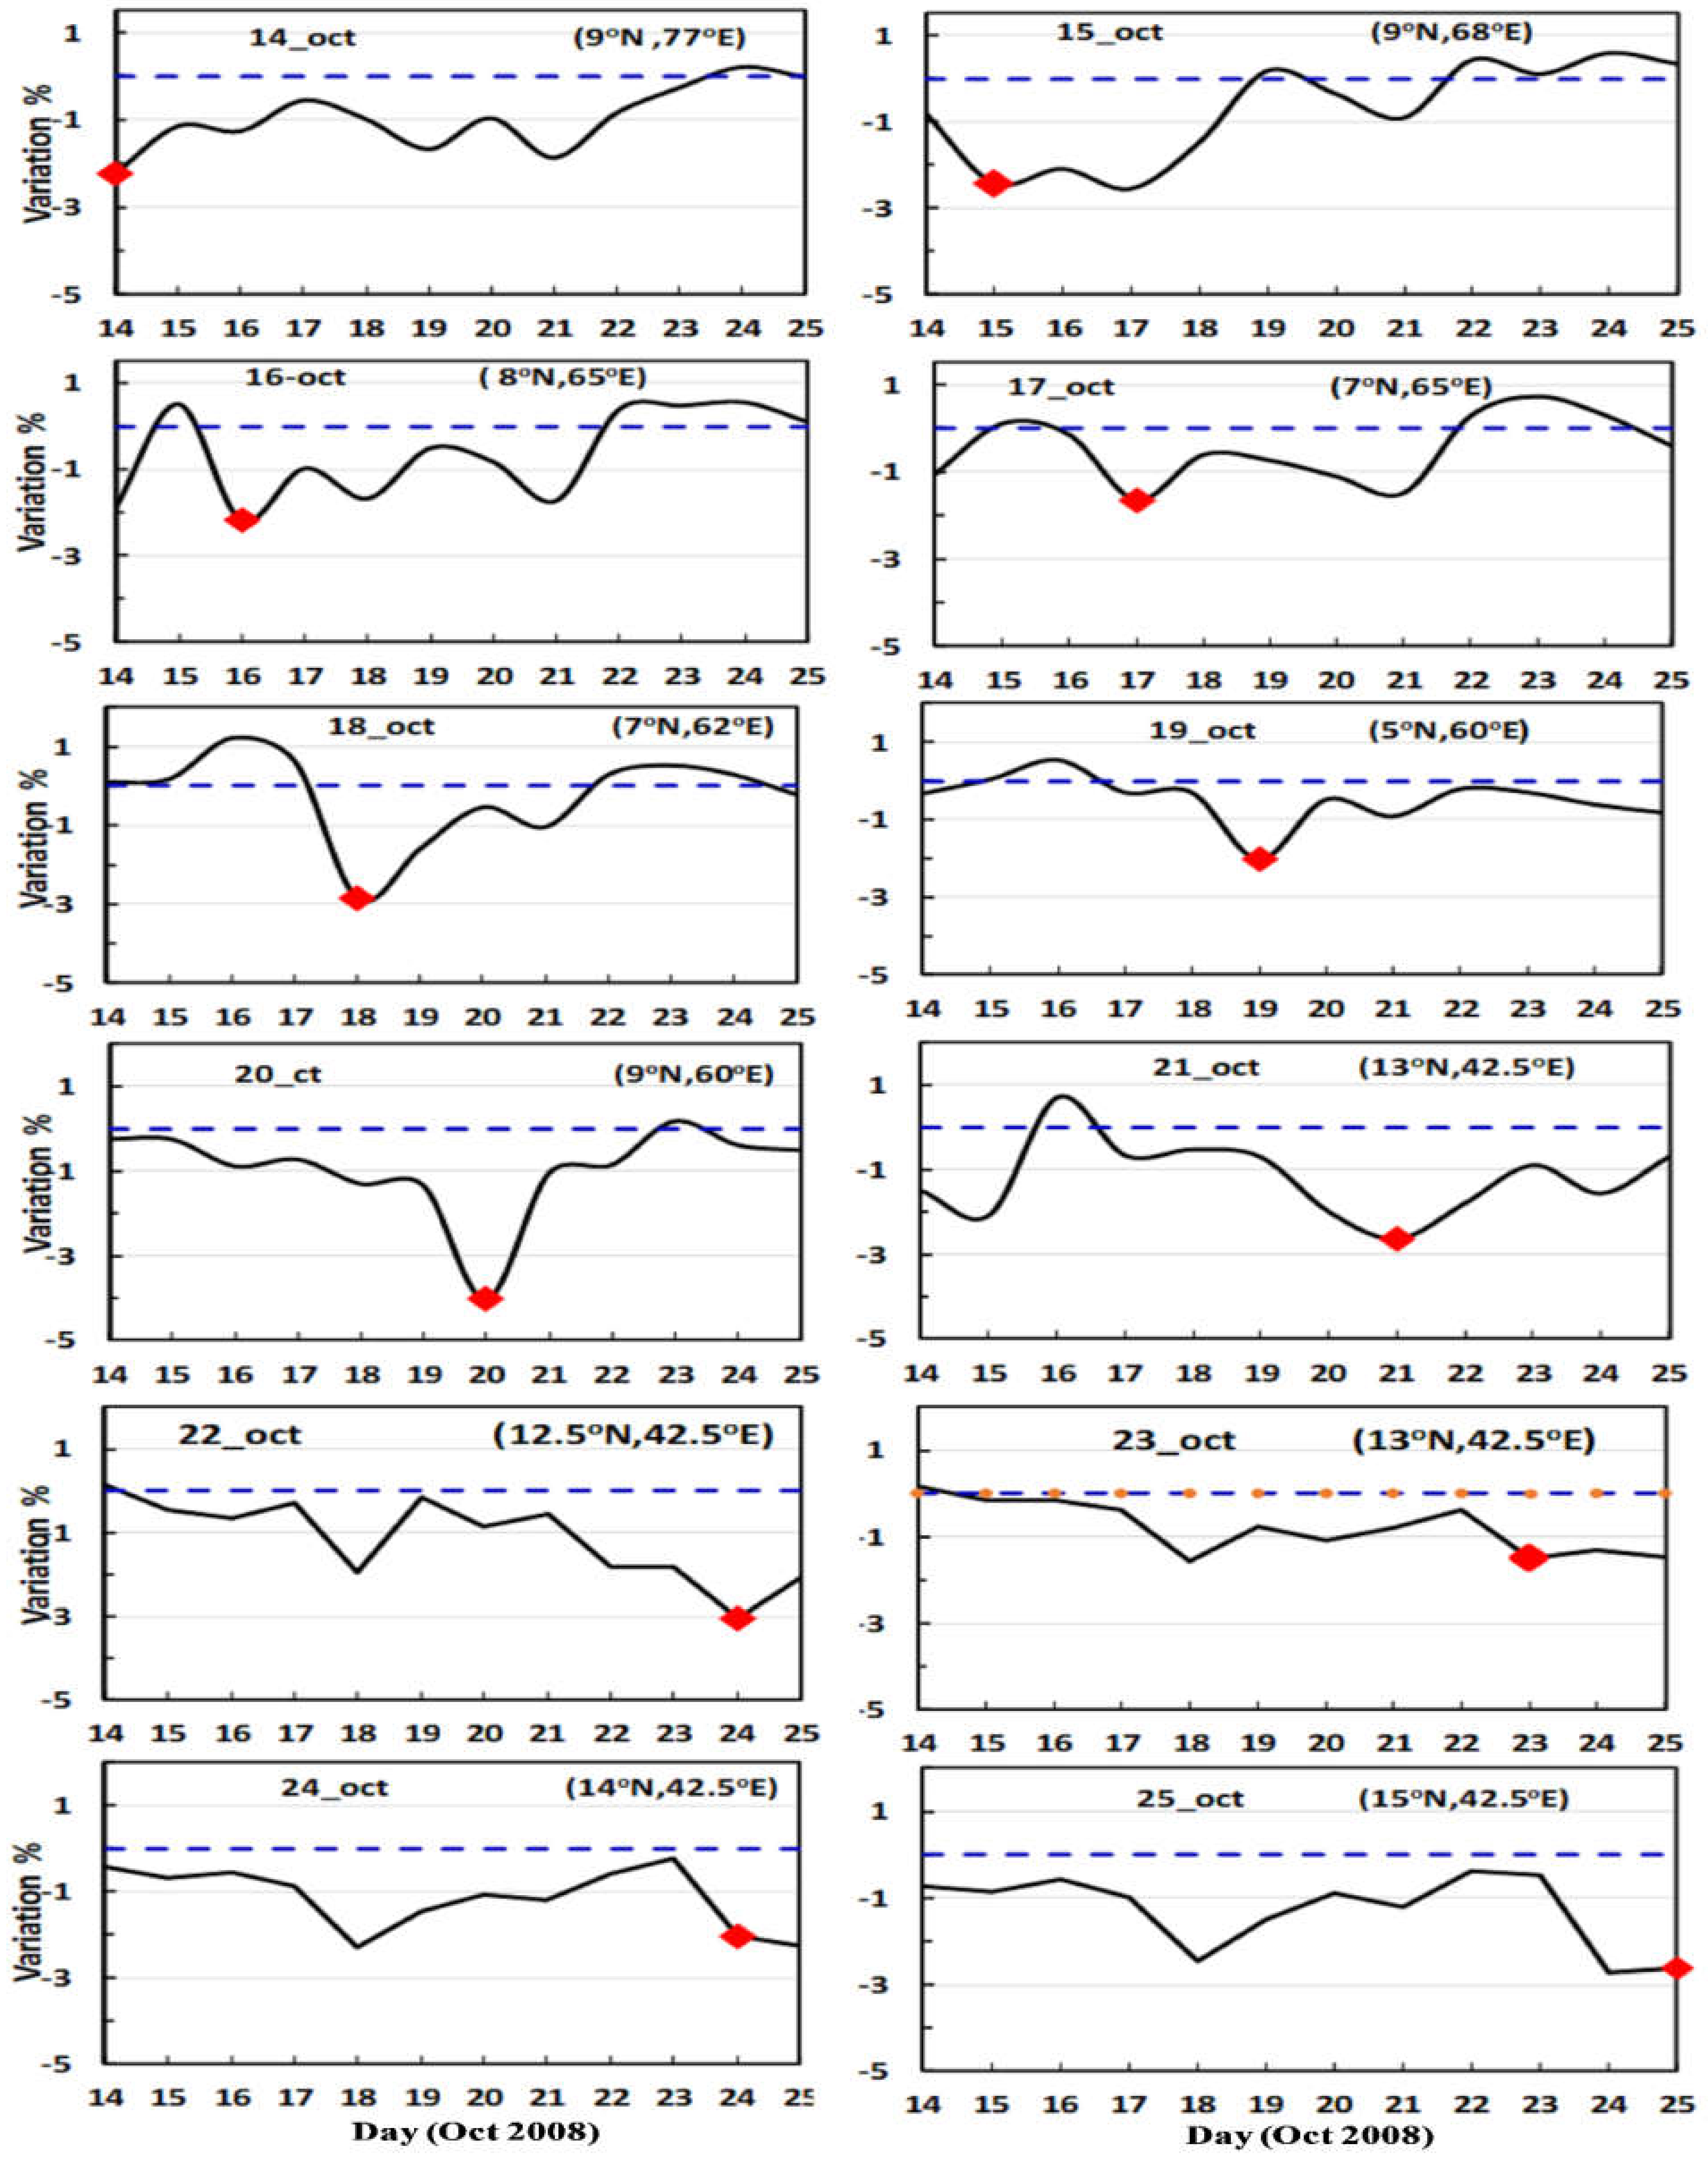
3.4. TOC Variation during Tropical Cyclone
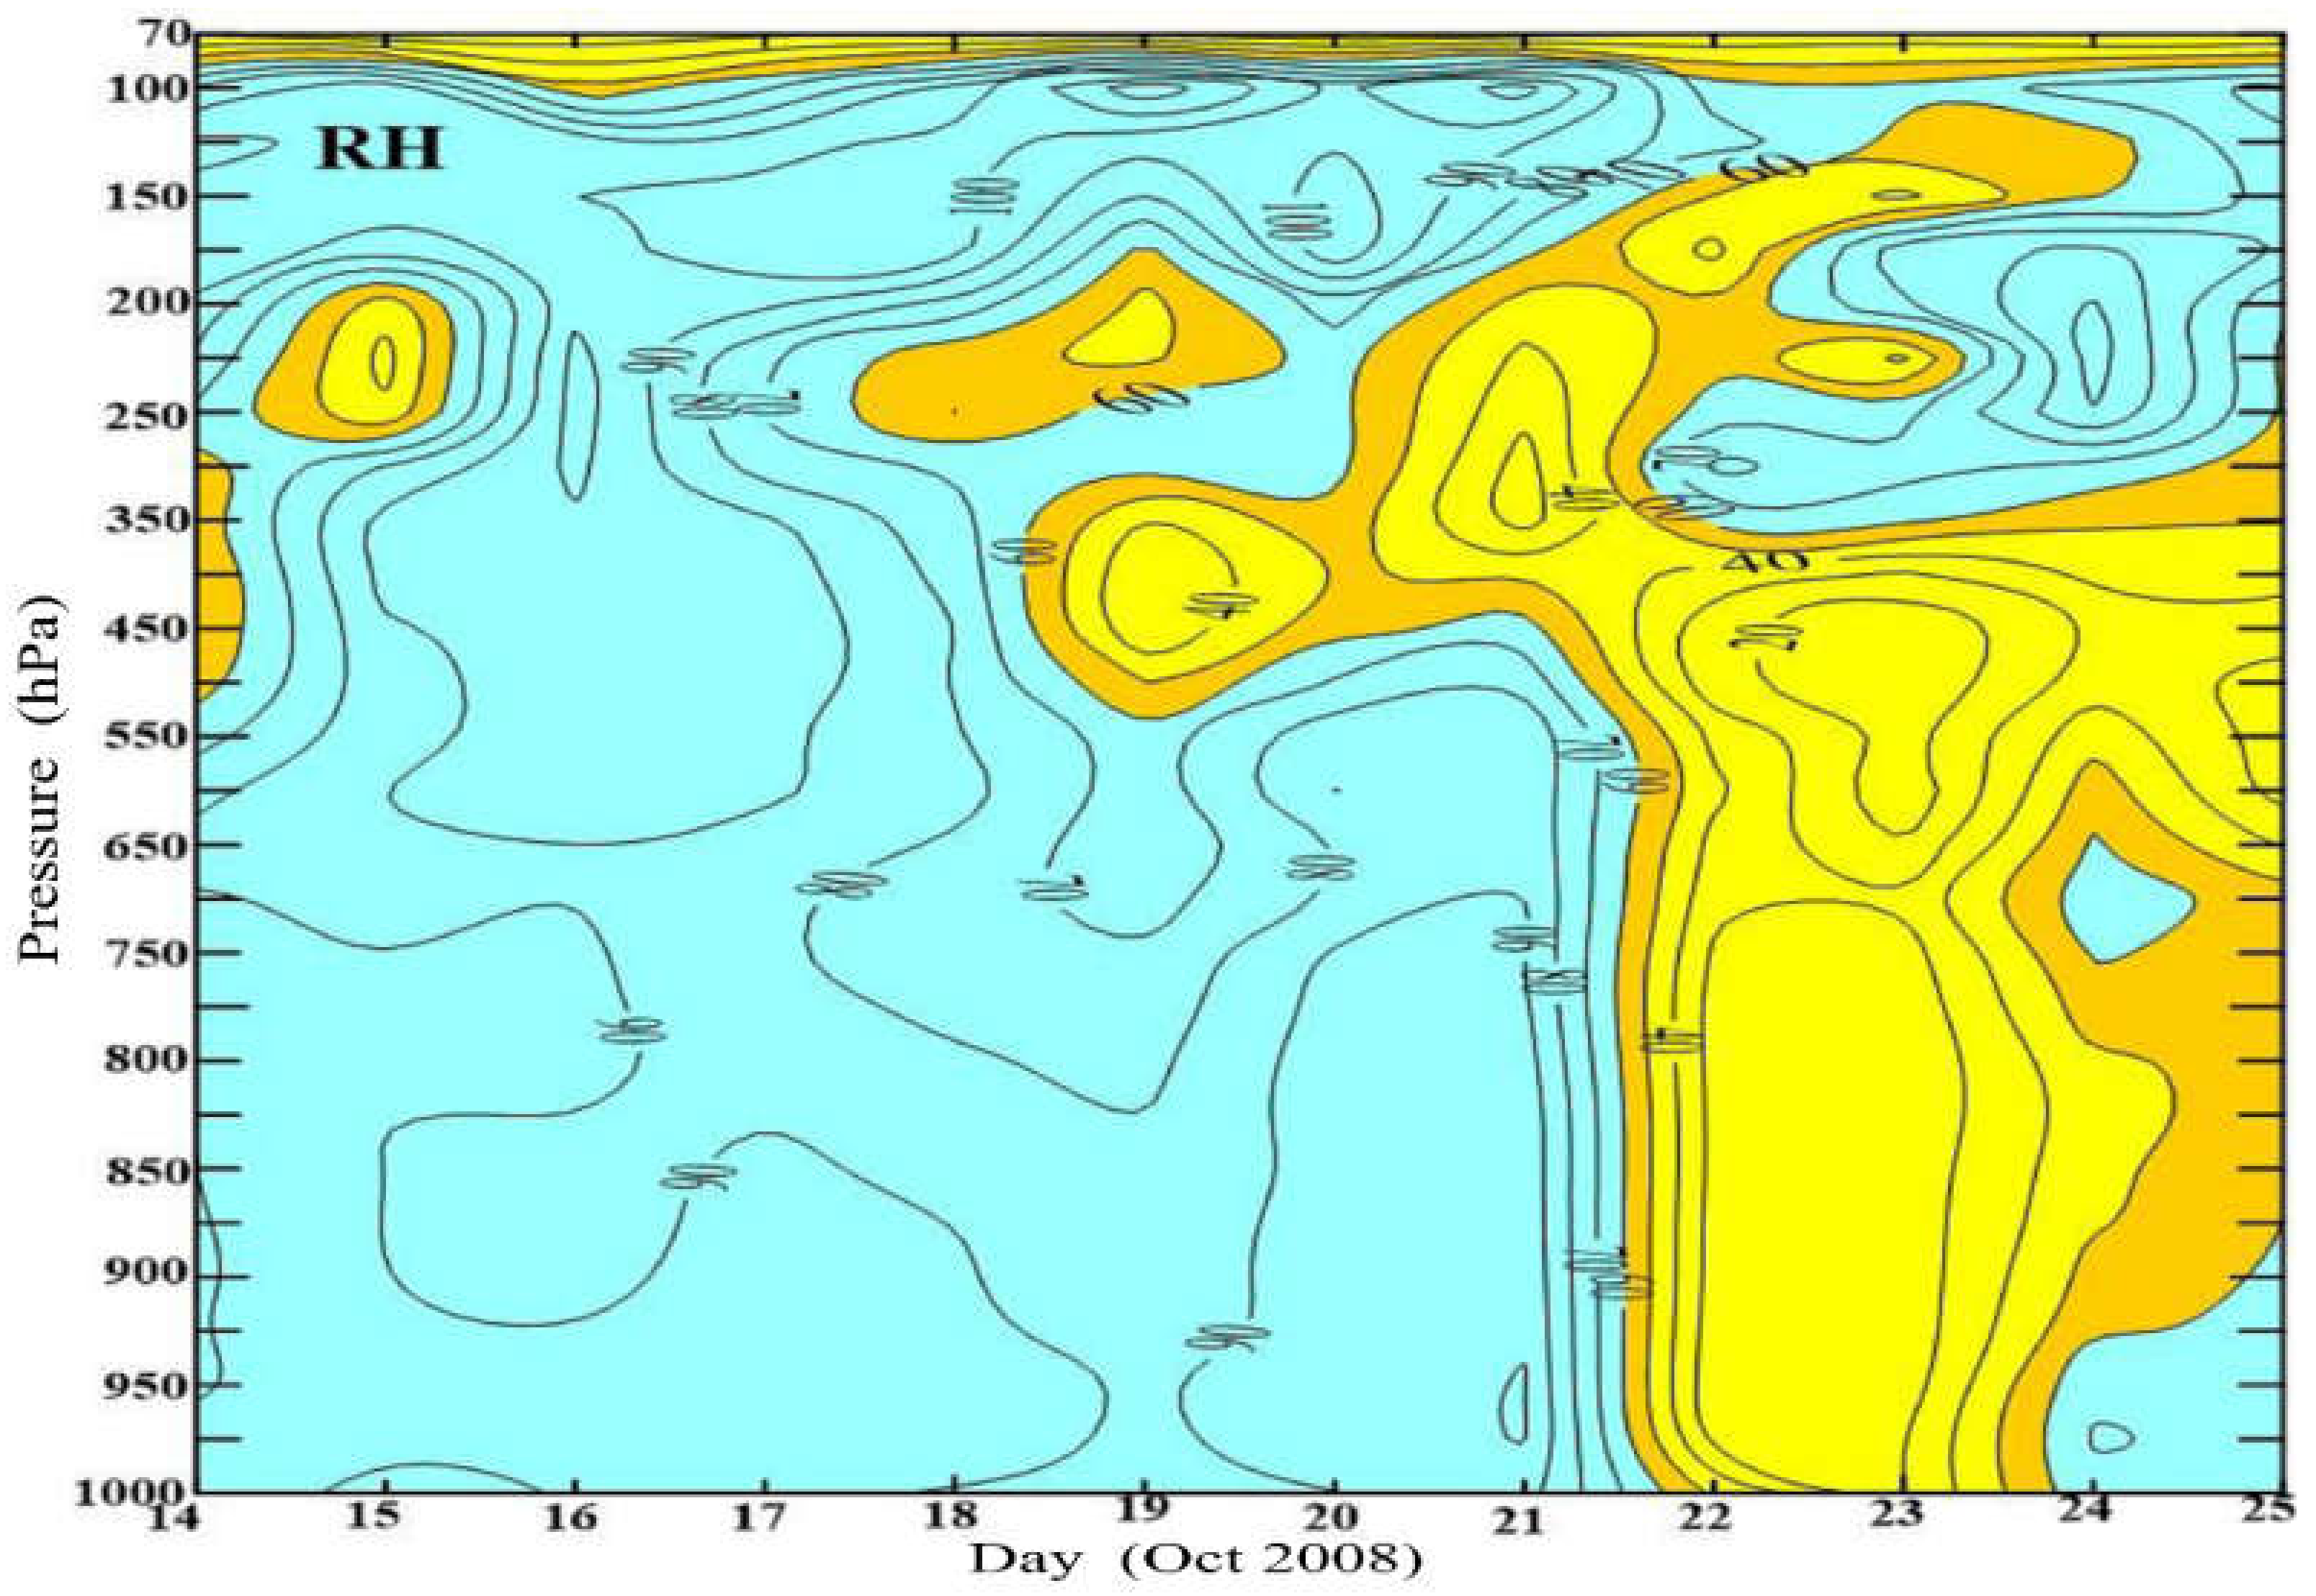
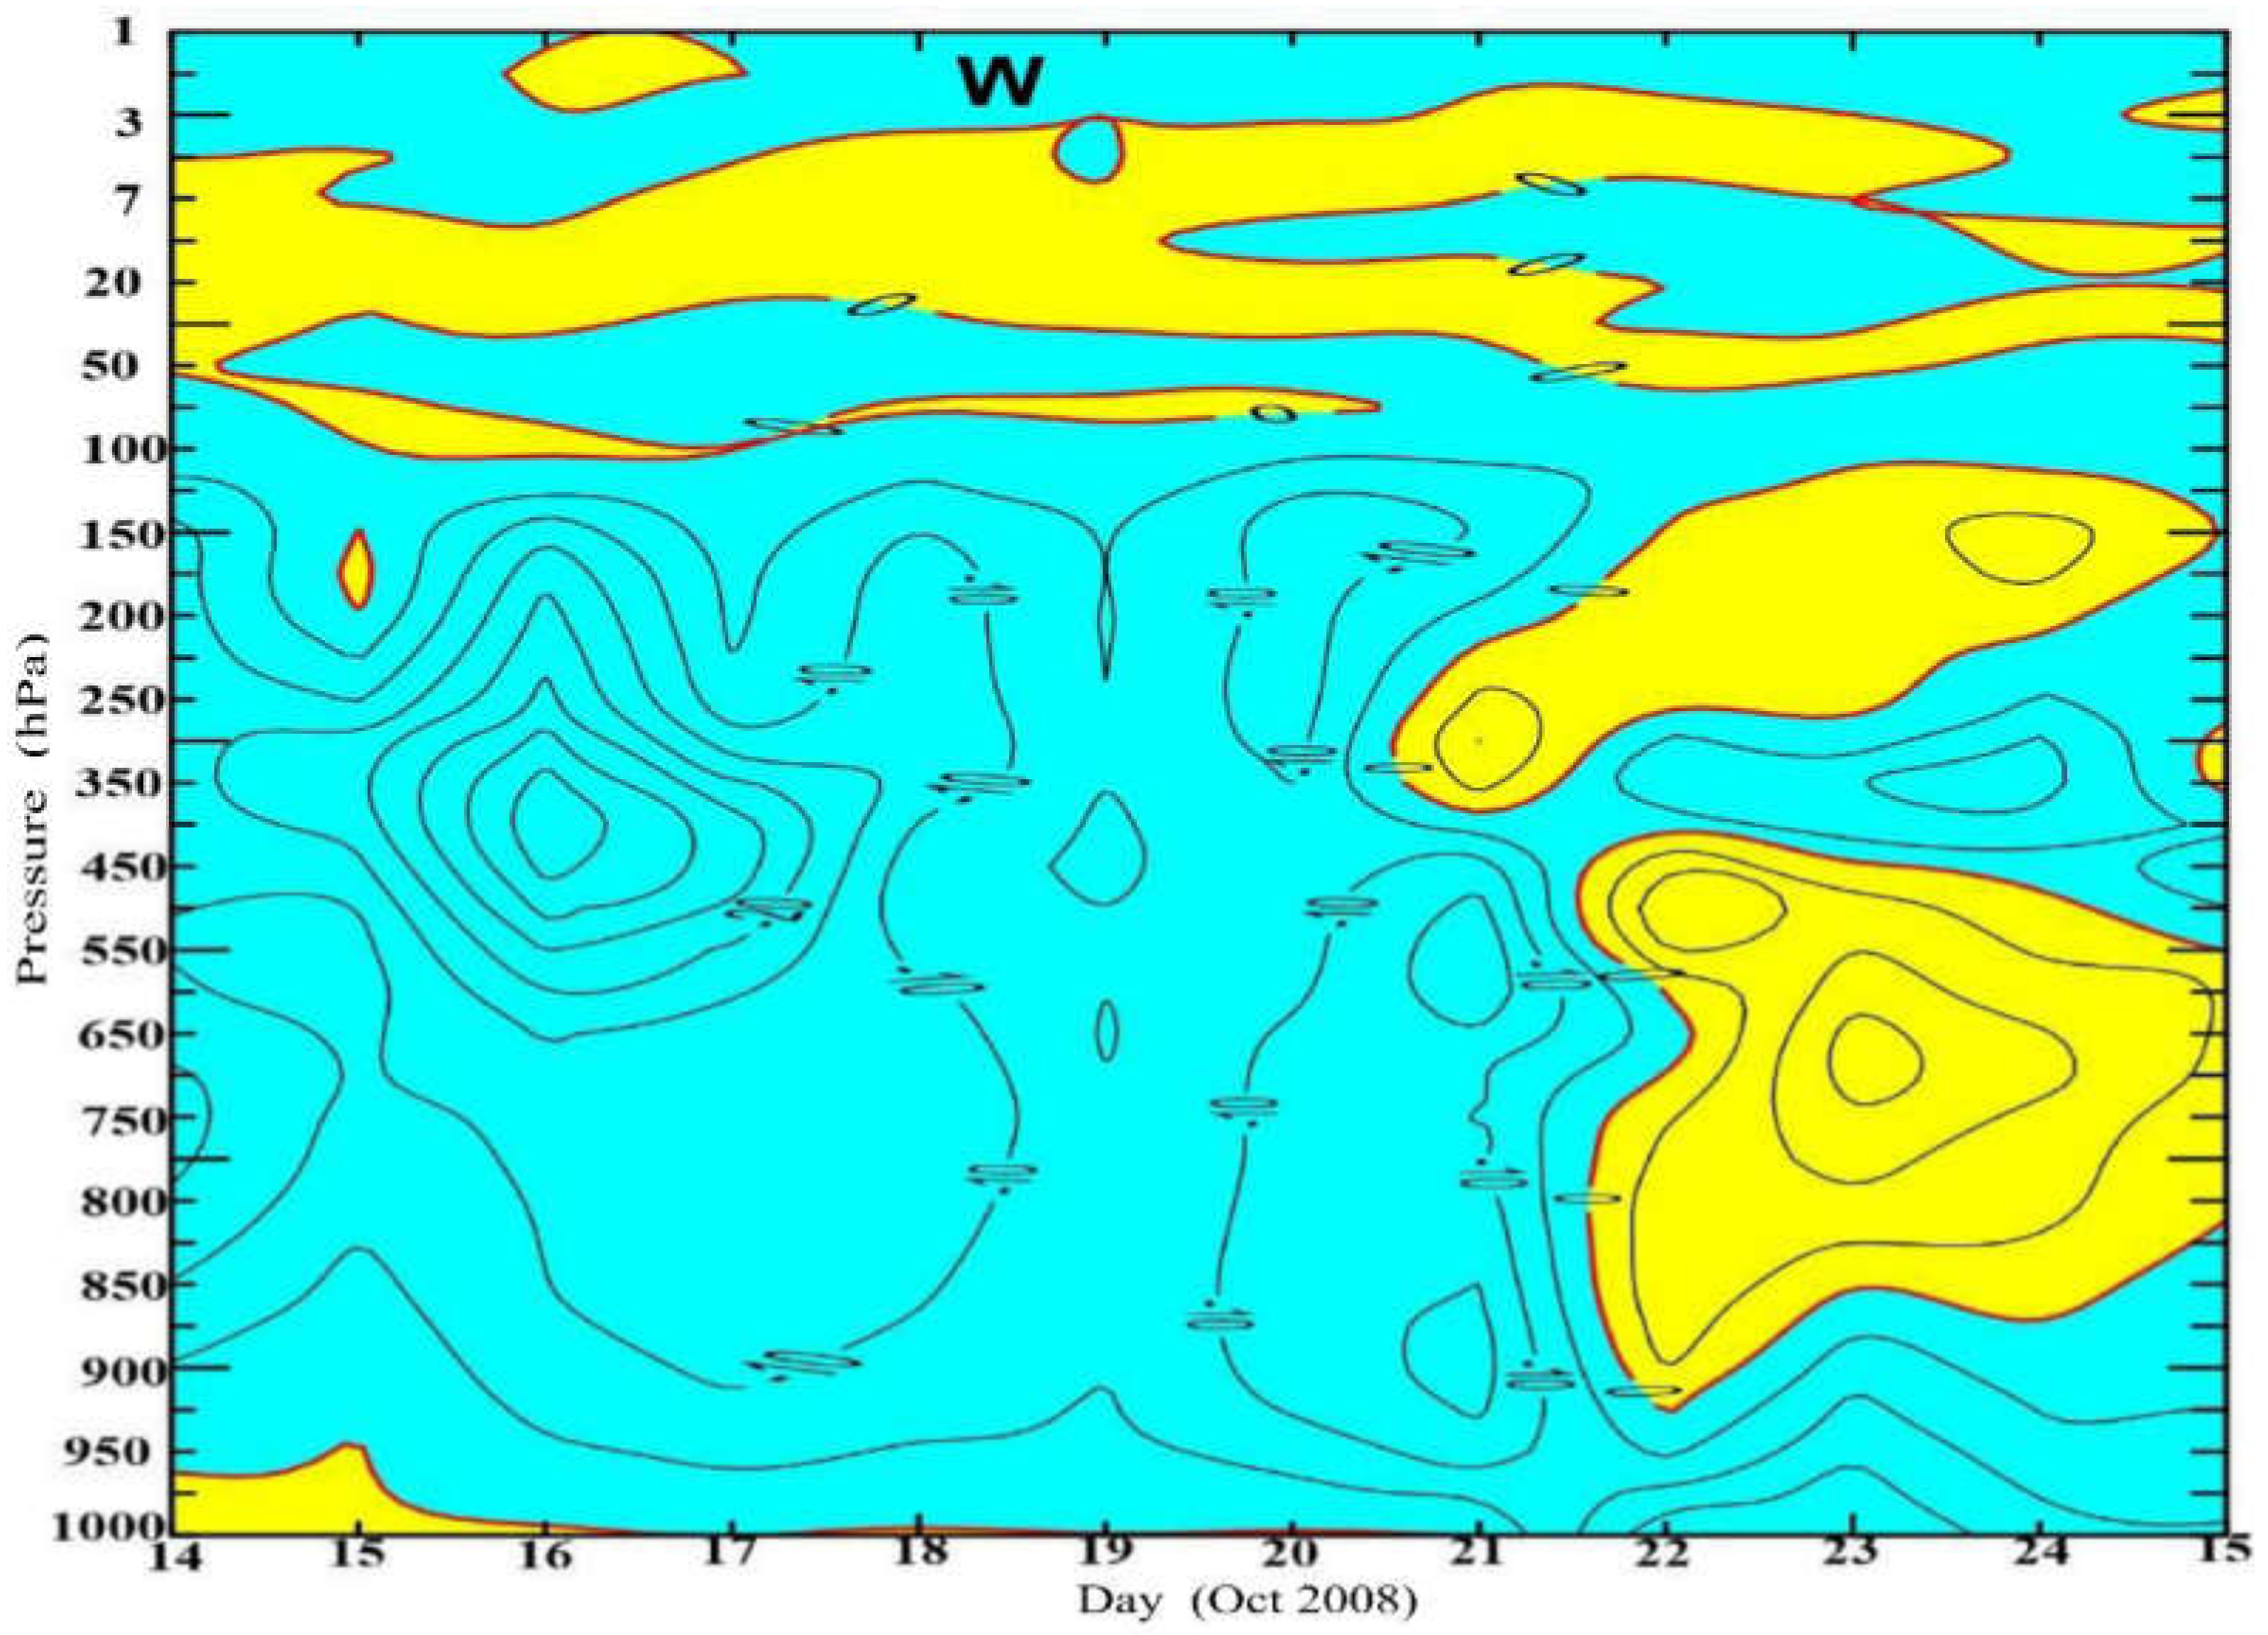
3.5. Time Height Variations of Ozone Mass Mixing Ratio
4. Conclusions
Author Contributions
Funding
Institutional Review Board Statement
Informed Consent Statement
Data Availability Statement
Acknowledgments
Conflicts of Interest
References
- Baray, J.-L.; Randriambelo, T.; Baldy, S.; Ancellet, G. Tropical cyclone Marlene and stratosphere-troposphere exchange. J. Geophys. Res. Spa. Phys. 1999, 104, 13953–13970. [Google Scholar] [CrossRef]
- Ratnam, M.V.; Babu, S.R.; Das, S.S.; Basha, G.; Krishnamurthy, B.V.; Venkateswararao, B. Effect of tropical cyclones on the stratosphere–troposphere exchange observed using satellite observations over the north Indian Ocean. Atmos. Chem. Phys. Discuss. 2016, 16, 8581–8591. [Google Scholar] [CrossRef] [Green Version]
- Das, S.S. A new perspective on MST radar observations of stratospheric intrusions into-troposphere associated with tropical cyclone. Geophys. Res. Lett. 2009, 36. [Google Scholar] [CrossRef]
- Li, D.; Vogel, B.; Müller, R.; Bian, J.; Günther, G.; Li, Q.; Zhang, J.; Bai, Z.; Vömel, H.; Riese, M. High tropospheric ozone in Lhasa within the Asian summer monsoon anticyclone in 2013: Influence of convective transport and stratospheric intrusions. Atmos. Chem. Phys. Discuss. 2018, 18, 17979–17994. [Google Scholar] [CrossRef] [Green Version]
- Pan, L.L.; Homeyer, C.R.; Honomichl, S.; Ridley, B.A.; Weisman, M.; Barth, M.C.; Hair, J.W.; Fenn, M.A.; Butler, C.; Diskin, G.S.; et al. Thunderstorms enhance tropospheric ozone by wrapping and shedding stratospheric air. Geophys. Res. Lett. 2014, 41, 7785–7790. [Google Scholar] [CrossRef]
- Bian, J.; Li, D.; Bai, Z.; Li, Q.; Lyu, D.; Zhou, X. Transport of Asian surface pollutants to the global stratosphere from the Ti-betan Plateau region during the Asian summer monsoon. Natl. Sci. Rev. 2020, 7, 516–533. [Google Scholar] [CrossRef] [Green Version]
- Danielsen, E.F. In situ evidence of rapid, vertical, irreversible transport of lower tropospheric air into the lower tropical stratosphere by convective cloud turrets and by larger-scale upwelling in tropical cyclones. J. Geophys. Res. Sp. Phys. 1993, 98, 8665–8681. [Google Scholar] [CrossRef]
- Das, S.S.; Uma, K.N.; Bineesha, V.N.; Suneeth, K.V.; Ramkumar, G. Four-decadal climatological intercomparison of rock-etsonde and radiosonde with different reanalysis data: Results from Thumba Equatorial Station. Q. J. R. Meteorol. Soc. 2016, 142, 91–101. [Google Scholar] [CrossRef]
- Pan, L.L.; Honomichl, S.B.; Randel, W.J.; Apel, E.C.; Atlas, E.L.; Beaton, S.P.; Bresch, J.F.; Hornbrook, R.; Kinnison, D.E.; Lamarque, J.; et al. Bimodal distribution of free tropospheric ozone over the tropical western Pacific revealed by airborne observations. Geophys. Res. Lett. 2015, 42, 7844–7851. [Google Scholar] [CrossRef] [Green Version]
- Randel, W.J.; Park, M. Deep convective influence on the Asian summer monsoon anticyclone and associated tracer variabil-ity observed with Atmospheric Infrared Sounder (AIRS). J. Geophys. Res. Atmos. 2006, 111. [Google Scholar] [CrossRef]
- Singh, D.; Nair, S. Total ozone depletion due to tropical cyclones over Indian Ocean. In Proceedings of the International TOVS study Conference, Angra dos Reis, Brazil, 7–13 May 2008. [Google Scholar]
- Midya, S.K.; Dey, S.S.; Chakraborty, B. Variation of the total ozone column during tropical cyclones over the Bay of Bengal and the Arabian Sea. Theor. Appl. Clim. 2012, 117, 63–71. [Google Scholar] [CrossRef]
- Heymsfield, G.M.; Simpson, J.; Halverson, J.; Tian, L.; Ritchie, E.; Molinari, J. Structure of Highly Sheared Tropical Storm Chantal during CAMEX-4. J. Atmos. Sci. 2006, 63, 268–287. [Google Scholar] [CrossRef] [Green Version]
- Li, Q.; Duan, Y.; Yu, H.; Fu, G. A High-Resolution Simulation of Typhoon Rananim (2004) with MM5. Part I: Model Verification, Inner-Core Shear, and Asymmetric Convection. Mon. Weather. Rev. 2008, 136, 2488–2506. [Google Scholar] [CrossRef]
- Reasor, P.D.; Rogers, R.; Lorsolo, S. Environmental flow impacts on tropical cyclone structure diagnosed from airborne Doppler radar composites. Mon. Weather. Rev. 2013, 141, 2949–2969. [Google Scholar] [CrossRef]
- Xu, Y.; Wang, Y. On the Initial Development of Asymmetric Vertical Motion and Horizontal Relative Flow in a Mature Tropical Cyclone Embedded in Environmental Vertical Shear. J. Atmos. Sci. 2013, 70, 3471–3491. [Google Scholar] [CrossRef]
- Barnes, C.E.; Barnes, G.M. Eye and Eyewall Traits as Determined with the NOAA WP-3D Lower-Fuselage Radar. Mon. Weather. Rev. 2014, 142, 3393–3417. [Google Scholar] [CrossRef]
- DeHart, J.C.; Houze, R.A.; Rogers, R.F. Quadrant distribution of tropical cyclone inner-core kinematics in relation to envi-ronmental shear. J. Atmos. Sci. 2014, 71, 2713–2732. [Google Scholar] [CrossRef]
- Li, Q.; Wang, Y.; Duan, Y. A Numerical Study of Outer Rainband Formation in a Sheared Tropical Cyclone. J. Atmos. Sci. 2017, 74, 203–227. [Google Scholar] [CrossRef]
- Dee, D.P.; Uppala, S.M.; Simmons, A.J.; Berrisford, P.; Poli, P.; Kobayashi, S.; Andrae, U.; Balmaseda, M.A.; Balsamo, G.; Bauer, D.P.; et al. The ERA-Interim reanalysis: Configuration and performance of the data assimilation system. Q. J. R. Meteorol. Soc. 2011, 137, 553–597. [Google Scholar] [CrossRef]
- Gray, W.M. Global view of the origin of tropical disturbances and storms. Mon. Weather Rev. 1968, 96, 669–700. [Google Scholar] [CrossRef]
- McBride, J.L.; Zehr, R. Observational Analysis of Tropical Cyclone Formation. Part II: Comparison of Non-Developing versus Developing Systems. J. Atmos. Sci. 1981, 38, 1132–1151. [Google Scholar] [CrossRef] [Green Version]
- Merrill, R.T. Environmental Influences on Hurricane Intensification. J. Atmos. Sci. 1988, 45, 1678–1687. [Google Scholar] [CrossRef] [Green Version]
- DeMaria, M. The effect of vertical shear on tropical cyclone intensity change. J. Atmos. Sci. 1996, 53, 2076–2088. [Google Scholar] [CrossRef] [Green Version]
- Wang, Y.Q.; Wu, C.C. Current understanding of tropical cyclone structure and intensity changes–A review. Meteorol. Atmos. Phys. 2004, 87, 257–278. [Google Scholar] [CrossRef]
- Paterson, L.A.; Hanstrum, B.N.; Davidson, N.E.; Weber, H.C. Influence of environmental vertical wind shear on the inten-sity of hurricane-strength tropical cyclones in the Australian region. Mon. Weather Rev. 2005, 133, 3644–3660. [Google Scholar] [CrossRef]
- Zeng, Z.; Wang, Y.; Wu, C.-C. Environmental Dynamical Control of Tropical Cyclone Intensity—An Observational Study. Mon. Weather. Rev. 2007, 135, 38–59. [Google Scholar] [CrossRef] [Green Version]
- Zeng, Z.; Chen, L.; Wang, Y. An Observational Study of Environmental Dynamical Control of Tropical Cyclone Intensity in the Atlantic. Mon. Weather. Rev. 2008, 136, 3307–3322. [Google Scholar] [CrossRef]
- Zeng, Z.; Wang, Y.; Chen, L. A statistical analysis of vertical shear effect on tropical cyclone intensity change in the North Atlantic. Geophys. Res. Lett. 2010, 37. [Google Scholar] [CrossRef] [Green Version]
- Wang, Y.; Rao, Y.; Tan, Z.-M.; Schönemann, D. A Statistical Analysis of the Effects of Vertical Wind Shear on Tropical Cyclone Intensity Change over the Western North Pacific. Mon. Weather. Rev. 2015, 143, 3434–3453. [Google Scholar] [CrossRef]
- Emanuel, K.A. The Finite-Amplitude Nature of Tropical Cyclogenesis. J. Atmos. Sci. 1989, 46, 3431–3456. [Google Scholar] [CrossRef] [Green Version]
- Bister, M.; Emanuel, K.A. The Genesis of Hurricane Guillermo: TEXMEX Analyses and a Modeling Study. Mon. Weather Rev. 1997, 125, 2662–2682. [Google Scholar] [CrossRef]
- Nolan, D.S. For tropical cyclogenesis? Australian Meteorological Magazine, 2007; 241–246. [Google Scholar]
- Nerushev, A.F. Perturbations of the ozone layer induced by intense atmospheric vortices. Int. J. Remote. Sens. 2008, 29, 2705–2732. [Google Scholar] [CrossRef]
- Singh, D.; Singh, V. Impact of tropical cyclone on total ozone measured by TOMS–EP over the Indian region. Curr. Sci. 2007, 93, 471–476. [Google Scholar]
- Bates, D.R.; Nicolet, M. The photochemistry of atmospheric water vapor. J. Geophys. Res. Sp. Phys. 1950, 55, 301–327. [Google Scholar] [CrossRef]


Publisher’s Note: MDPI stays neutral with regard to jurisdictional claims in published maps and institutional affiliations. |
© 2021 by the authors. Licensee MDPI, Basel, Switzerland. This article is an open access article distributed under the terms and conditions of the Creative Commons Attribution (CC BY) license (https://creativecommons.org/licenses/by/4.0/).
Share and Cite
Al-Kallas, S.; Al-Mutairi, M.; Basset, H.A.; Badawy, A.; Abdeldym, A.; Morsy, M. Ozone Variation during the Development of a Tropical Cyclone: Case Study. Atmosphere 2021, 12, 1582. https://0-doi-org.brum.beds.ac.uk/10.3390/atmos12121582
Al-Kallas S, Al-Mutairi M, Basset HA, Badawy A, Abdeldym A, Morsy M. Ozone Variation during the Development of a Tropical Cyclone: Case Study. Atmosphere. 2021; 12(12):1582. https://0-doi-org.brum.beds.ac.uk/10.3390/atmos12121582
Chicago/Turabian StyleAl-Kallas, Saleha, Motirh Al-Mutairi, Heshmat Abdel Basset, Ayman Badawy, Abdallah Abdeldym, and Mostafa Morsy. 2021. "Ozone Variation during the Development of a Tropical Cyclone: Case Study" Atmosphere 12, no. 12: 1582. https://0-doi-org.brum.beds.ac.uk/10.3390/atmos12121582