1. Introduction
The tropical cyclone (TC) is the most destructive weather system in the world. With the rapid development of society and economies, the damage caused by TCs may increase exponentially in the future [
1,
2,
3]. Given the significant impact of TCs on human life and property, many studies have been devoted to understanding the activity of TCs and their causes [
3,
4,
5,
6]. In particular, much work has focused on the Atlantic and Pacific regions. However, relatively few studies have paid attention to Indian Ocean TCs.
The North Indian Ocean (NIO), including the two sub-basins of the Bay of Bengal (BOB) and the Arabian Sea (AS), is one of the ocean basins most seriously affected by TCs. TCs in the NIO represent a considerable threat to a vast population. According to the World Meteorological Organization’s list of “notable” TCs during 1970–2019, seven of the ten deadliest TCs were generated in the NIO [
7]. For example, tropical storm “Bhola”, which was generated in the BOB in November 1970, caused 300,000 human casualties, making it the deadliest TC on record. Additionally, in the AS, tropical storm “Phet” in 2010 caused extreme precipitation events and led to more than 40 deaths and economic losses of approximately 780 million USD in Oman, Pakistan, and India [
8]. On the other hand, the TC distribution and their climate change are spatially inhomogeneous around the world. Increases and decreases in TC depend on the region [
9]. The frequency of TCs in the NIO is increasing. The TC frequency in the AS increased faster than that in the BOB [
10,
11]. Therefore, further understanding the activities of TCs over the NIO is important.
Tropical cyclone genesis (TCG) in the BOB shows a unique bimodal seasonal cycle [
12,
13,
14,
15], with the maximum peak occurring in the post-monsoon season of October–November and the second peak occurring in the pre-monsoon season of April–May [
12,
14]. This is very different from the single-peak TCG seasonal cycle in other oceans, such as the western North Pacific and Atlantic [
12]. Previous studies have shown that the monsoon-induced changes in the atmospheric and oceanic environments are responsible for the bimodal variation in TCG frequency in the BOB [
3,
12,
13,
14]. Yanase et al. [
15] pointed out that the depression of cyclogenesis during the period of July–August is due to the intense vertical shear accompanying the onset of the summer monsoon. Meanwhile, Xing and Huang [
14] showed that the potential intensity term, which relates to the air–sea interaction, makes the largest contribution to the bimodal TCG distribution. Li et al. [
12] pointed out that the influence of relative humidity is also critical, insofar as a favorable humidity factor in the post-monsoon season causes more storms than in the pre-monsoon season.
Similar to the BOB, the seasonal variation of TCG in the AS also shows a bimodal cycle [
3,
16] but with lower TCG. Evan and Camargo (2011) revealed the relationship between cyclonic storms in the AS and large-scale environments from a climatological perspective [
16]. The results suggested that, associated with the South Asian monsoon, coherently organized large-scale conditions can create particular environments—especially weak vertical wind shear—conducive to TCG during the pre- and post-monsoon seasons. Interestingly, further research has also shown that aerosols such as black carbon can reduce the vertical wind shear in the AS by changing the atmospheric circulation, thus leading to an increase in storms in the AS, especially in the pre-monsoon season [
17]. This also confirms the importance of vertical wind shear for tropical storm activity in the AS.
Broadly, the frequency of TCG in the BOB and AS present similar bimodal characteristics, and previous studies have indicated that critical environmental factors such as low-level relative vorticity, vertical wind shear, potential intensity, and low- and middle-level relative humidity, when coherently organized, create favorable conditions for TCG in the pre- and post-monsoon seasons [
12,
13,
16]. However, from the climatological perspective, the activities of TCG, including the frequency and spatiotemporal distribution, show significant differences between the AS and BOB [
13,
16]. Climatologically, the frequency of TCG in the BOB is higher relative to that in the AS [
11,
13,
16]. Furthermore, previous studies have shown markedly different atmospheric and oceanic conditions between these two sub-basins, which may result in significant differences of TCG. Xiao et al. [
18,
19] demonstrated that the influence of the Somali jet on the AS is more direct than on the BOB, especially in the western part of the AS, while Wu et al. (2011) observed that the ocean–atmosphere–land interaction surrounding the NIO region in spring is favorable for the formation of cyclonic circulation in the southwestern BOB [
20]. Thermodynamic oceanic processes in the western and eastern Indian Ocean also present significant discrepancies [
21], which manifest as the well-known Indian Ocean dipole mode [
22,
23]. These differences in atmospheric and oceanic conditions may lead to significant differences in TC activity between the BOB and AS. Recently, Yuan et al. (2019) [
24] studied the interannual variability of TCG activity in the entire Indian Ocean basin. The results showed that the dominant mode of Indian Ocean TCG in September–November shows a distinct east–west zonal dipole pattern, indicating that the TCG in the BOB and AS basins vary in an opposite manner. In addition, the climate change of TC frequency also shows the difference between the BOB and AS. In the last 20 years, the TC frequency of the AS has increased significantly. By contrast, the frequency of TC remains relatively stable in the BOB. The reasons may be related to internal variability, greenhouse gases, aerosols, and volatile eruptions [
9,
10]. The large-scale environment in different sea areas has different change characteristics. These issues need more and further investigations. To carry out further research, a basic understanding is needed: what is the difference in TCG in the BOB and AS in the climate mean state. However, a detailed comparison of TCG and the large-scale environments between the BOB and AS has yet to be conducted.
The present study focuses mainly on comparing the seasonal variation of TCG and related large-scale environments between the BOB and AS. First, on the basis of unified data, we present the temporal and spatial distributions of TCG in detail on the seasonal time scale and emphasize the differences between the BOB and AS sub-basins. Second, we analyze the large-scale atmospheric and oceanic environments that are favorable for TCG in the BOB and AS. The aim of this paper is to elucidate and discuss the differences in the seasonal variation of TCG and related mechanisms between the BOB and AS sub-basins of the NIO.
Previous studies have shown that large-scale oceanic and atmospheric environments play important roles in TCG, including the sea surface thermal condition, low-level relative vorticity, vertical wind shear, Coriolis forcing, and humidity in the lower and middle troposphere [
3,
25]. The GPI, first proposed by Gray (1979) and later further developed by Emanuel and Nolan (2004), is used to quantitatively describe the contributions of large-scale environmental factors to TCG [
25,
26].
Following this introduction,
Section 2 describes the data and methods used in our study.
Section 3 presents the characteristics of the seasonal variation of TCG in the BOB and AS.
Section 4 describes the large-scale oceanic and atmospheric environments that affect the seasonal variation of TCG in the BOB and AS. In
Section 5, the contributions of thermal and dynamic factors to the TCG seasonal cycle in the BOB and AS sub-basins are quantitatively analyzed using the genesis potential index (GPI). Finally,
Section 6 provides a summary of our key findings along with some further discussion.
3. Seasonal Variation of TCG in the BOB and AS
3.1. Overview of TCG in the BOB and AS
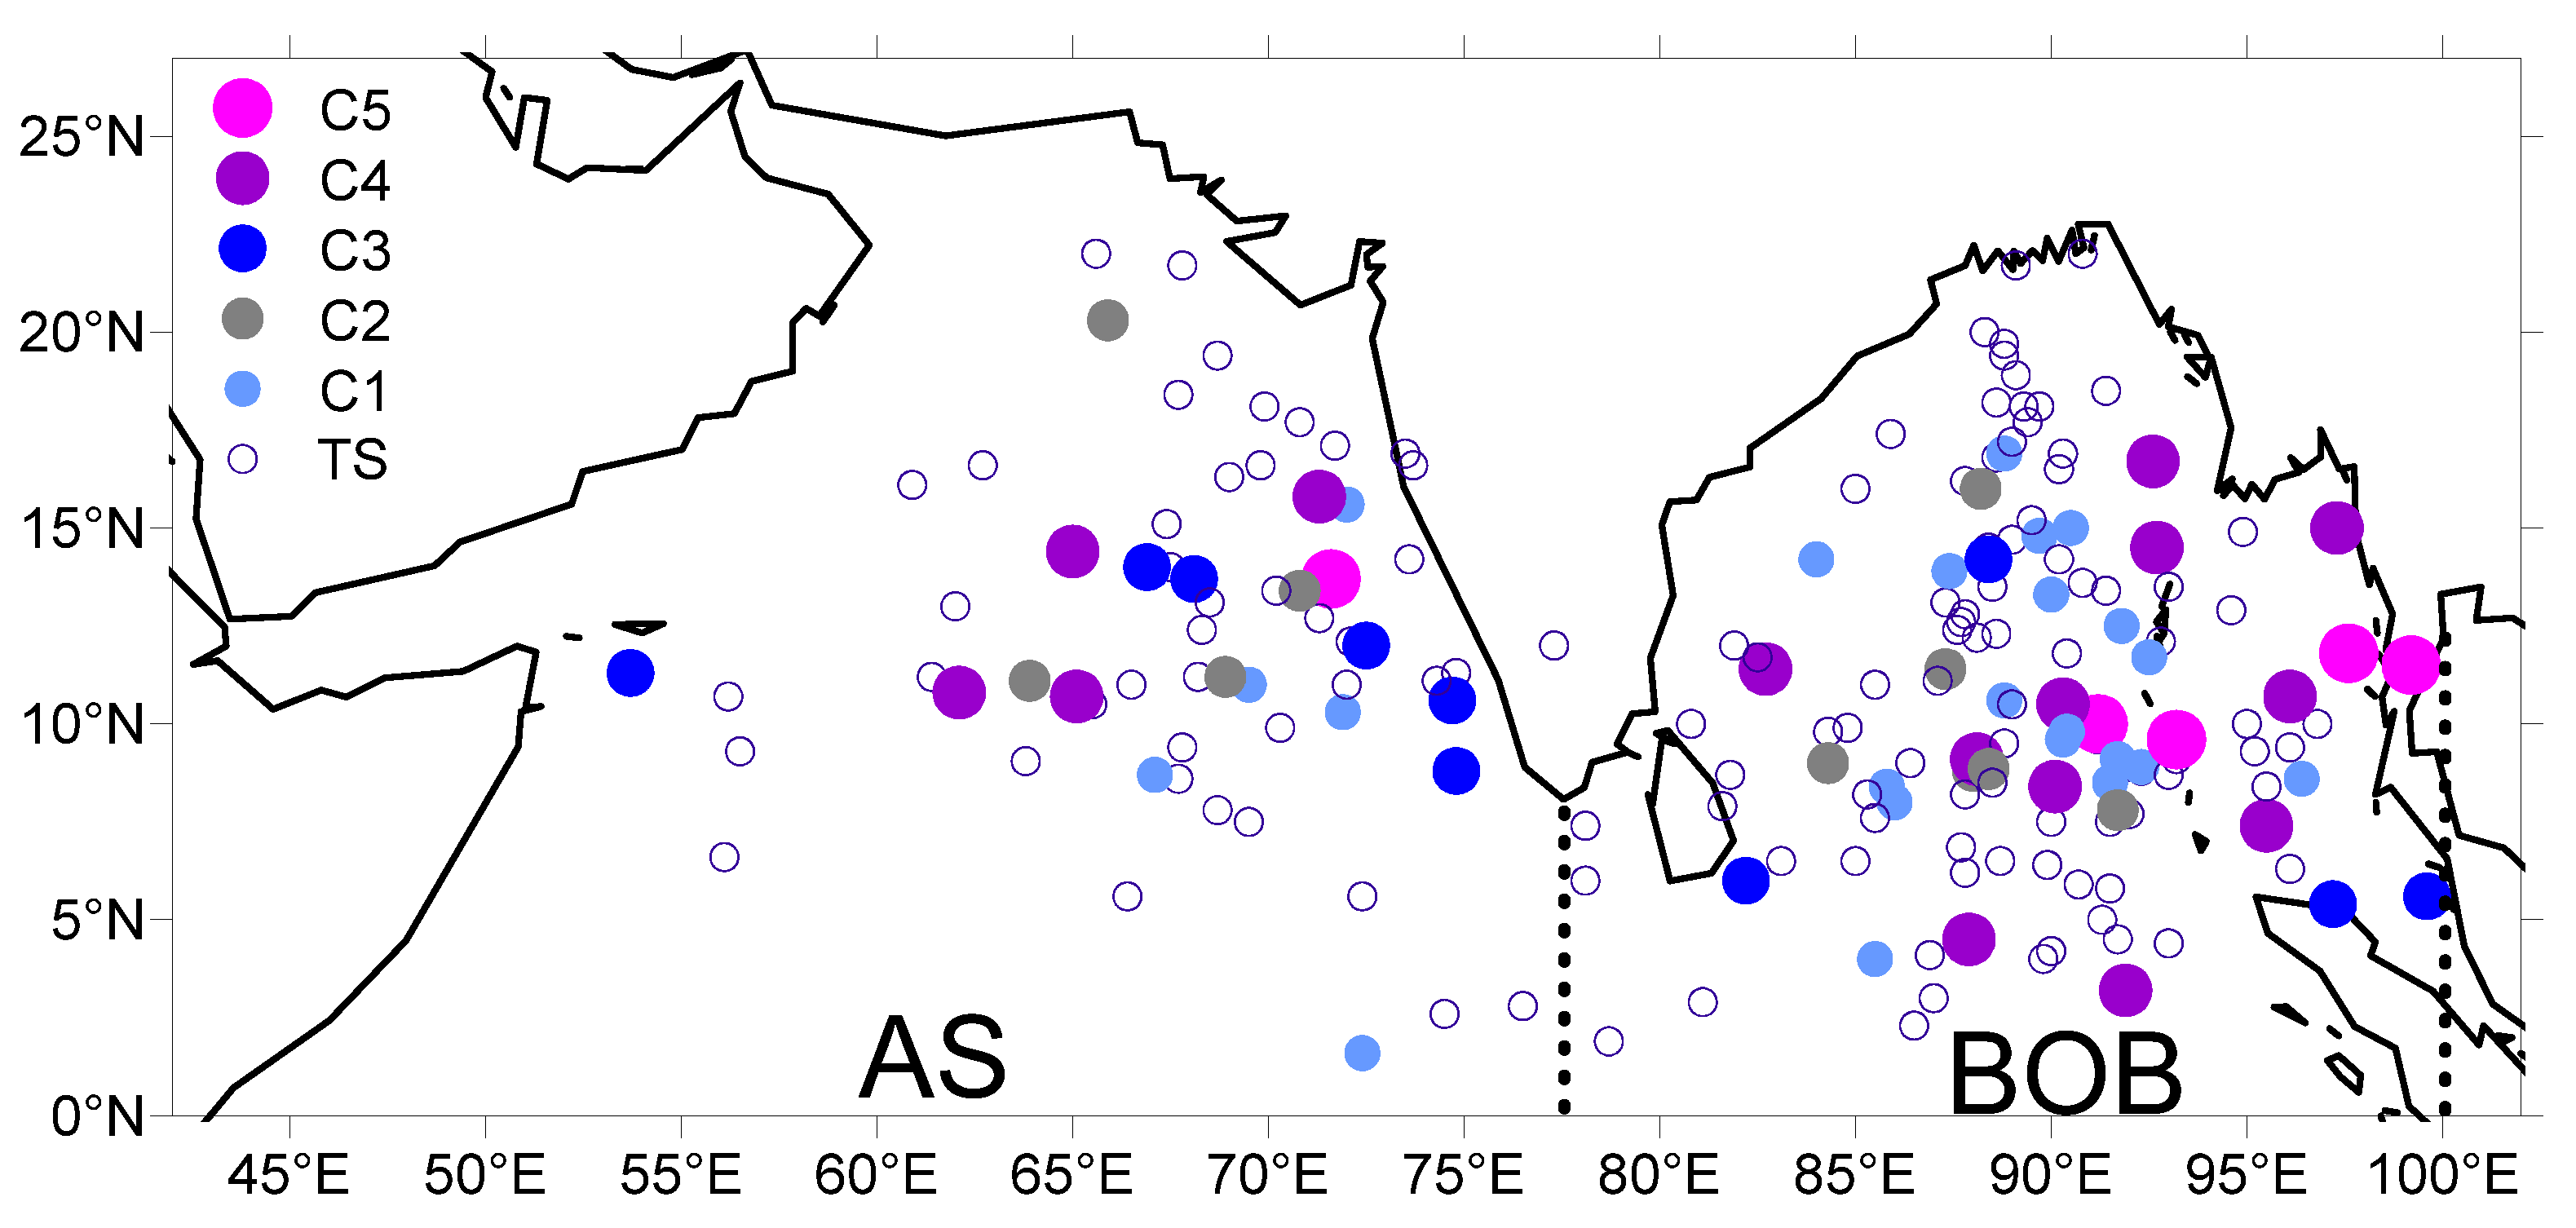
During the period 1980–2019, a total of 193 TCs were generated in the NIO, including 130 and 63 TCs in the BOB and AS basins, respectively. The average TCG number in the AS is 1.58 per year, while around 3.25 TCs are generated in the BOB. Hence, the TCG number in the BOB is approximately double that in the AS, even though the area of the AS is larger.
TCs are generated widely in the BOB, while the genesis locations are relatively concentrated in the AS. As shown in
Figure 1, TCs mainly form to the east of 60° E in the AS; whereas, in the BOB, TCG is distributed uniformly throughout the ocean region. In addition, as seen from
Figure 1, AS TCs are usually of lower intensity. During the period 1980–2019, only one TC and four storms reached grades C5 and C4 in the AS, respectively. However, in the BOB, four storms reached grade C5 and 11 storms reached grade C4.
Although the AS basin is larger, TCs are more active in the BOB basin, with higher values of both frequency and intensity. Therefore, the large-scale environments that are favorable for TC activities in the AS and BOB may also present some differences.
3.2. Seasonal Variability of TCG in the BOB and AS
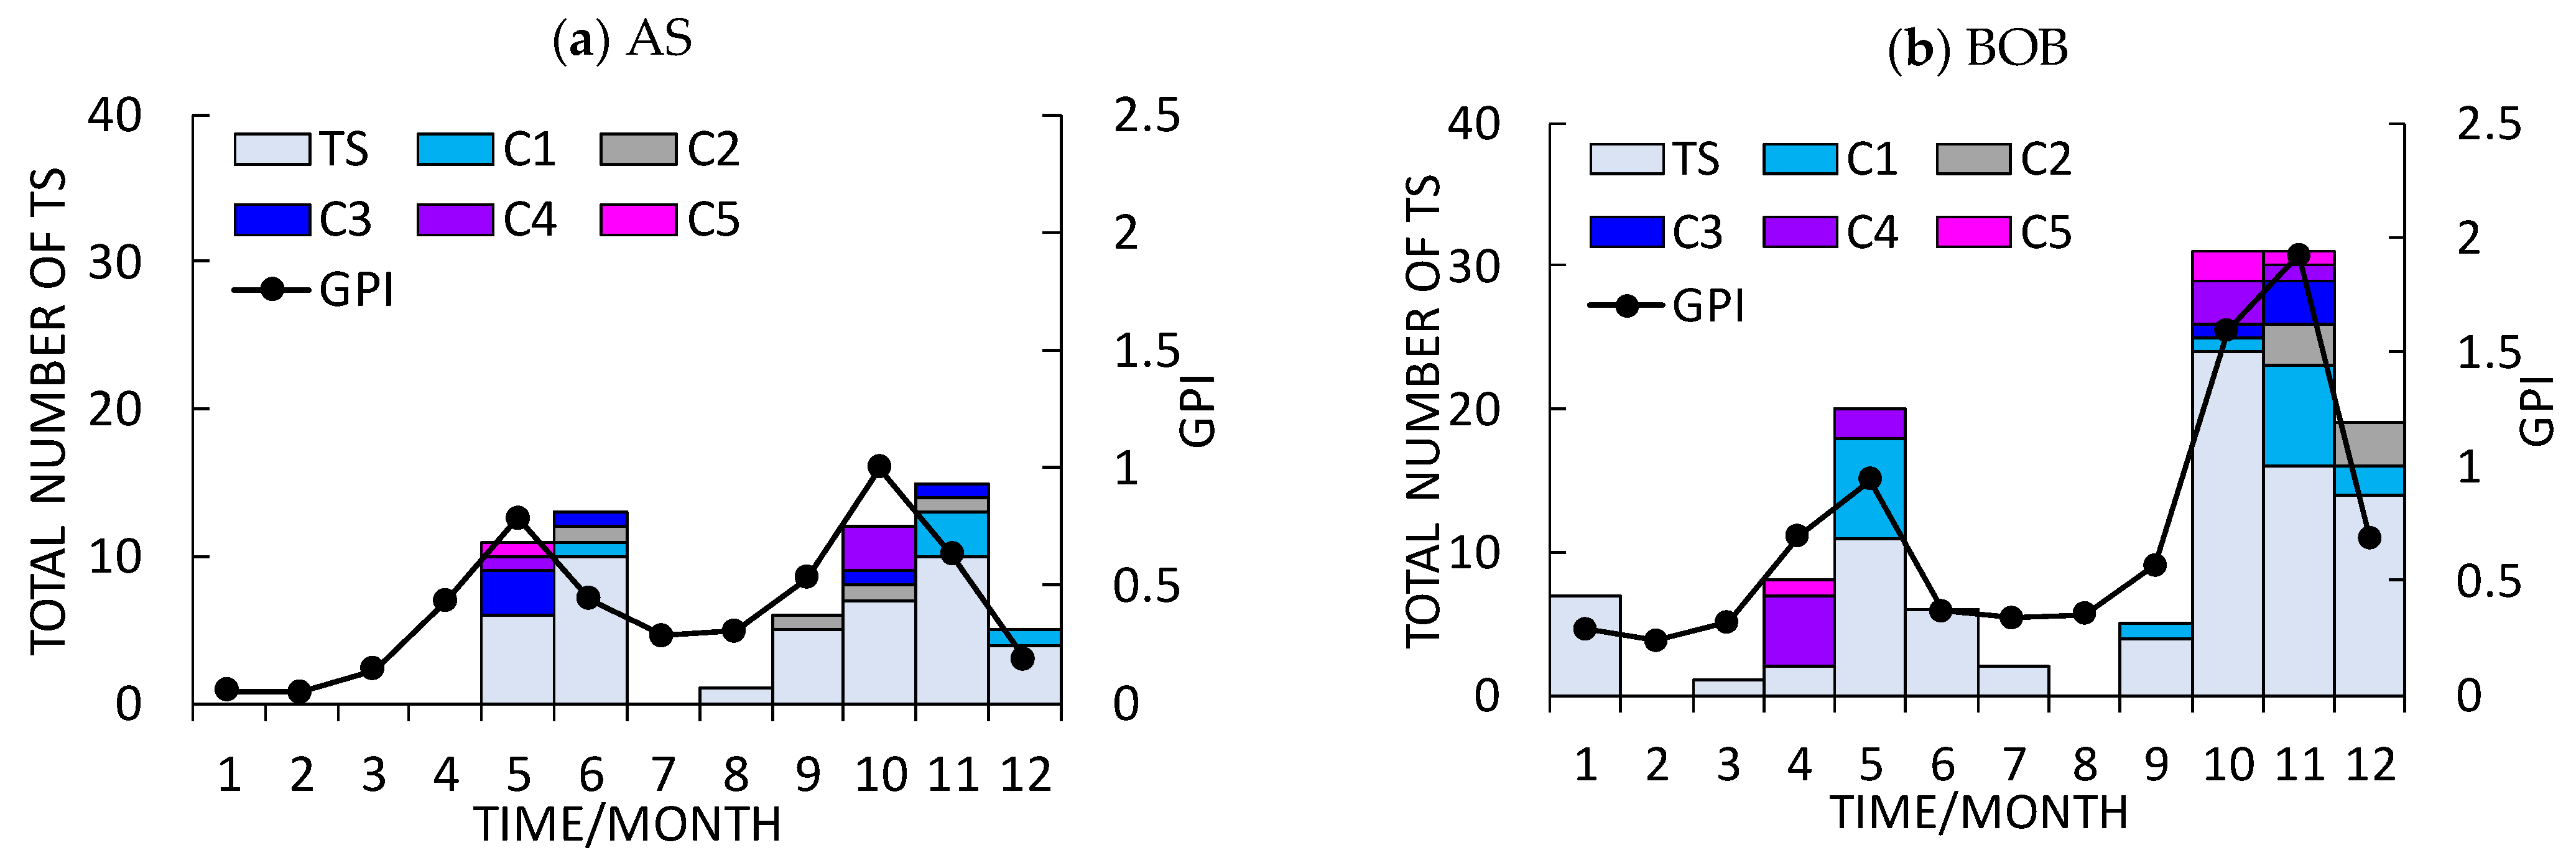
The average numbers of TCs generated in each month are shown in
Figure 2, revealing that the TCGs in both the BOB and AS sub-basins present bimodal patterns of seasonal variation. Specifically, TCs are generated mainly in the post-monsoon season of September–November and the pre-monsoon season of May–June, while few TCs occur during the monsoon season of June–August. These results are consistent with previous studies on TCs in the BOB [
12,
13] and AS [
16].
Although the seasonal cycle of TCG frequency shows a bimodal distribution in both the AS and BOB, some differences are noticeable (
Figure 2). The two main periods of TCG in the AS are May–June and September–December. In contrast, no TCs are generated in January–April or July (
Figure 2a), and only one TC appears in August during the study period (1980–2019). In the pre-monsoon season of the AS, the peak value of TCG appears in June, with a cumulative frequency of 13 cases. However, the TCG frequency in this basin also reaches 11 cases in May, with more TCs above the C3 level (reaching four cases) and only one case reaching the C3 level in June. In the post-monsoon season, the peak month of TCG is in November, with a cumulative frequency of 15 cases. Comparing the two peaks, the peak in the post-monsoon season can be seen as being slightly higher.
For the BOB, the two TC genesis periods are March–July and September–January (
Figure 2). Only in February and August are no storms found. The peak month of the pre-monsoon season in the BOB is May, and the cumulative frequency is 20 cases. In contrast, the peak months of the post-monsoon season are October and November, and the cumulative frequencies of these two months are the same at 31 cases, albeit with stronger TCs generated in November. Significantly more and stronger TCs are active in the post-monsoon season than in the pre-monsoon season.
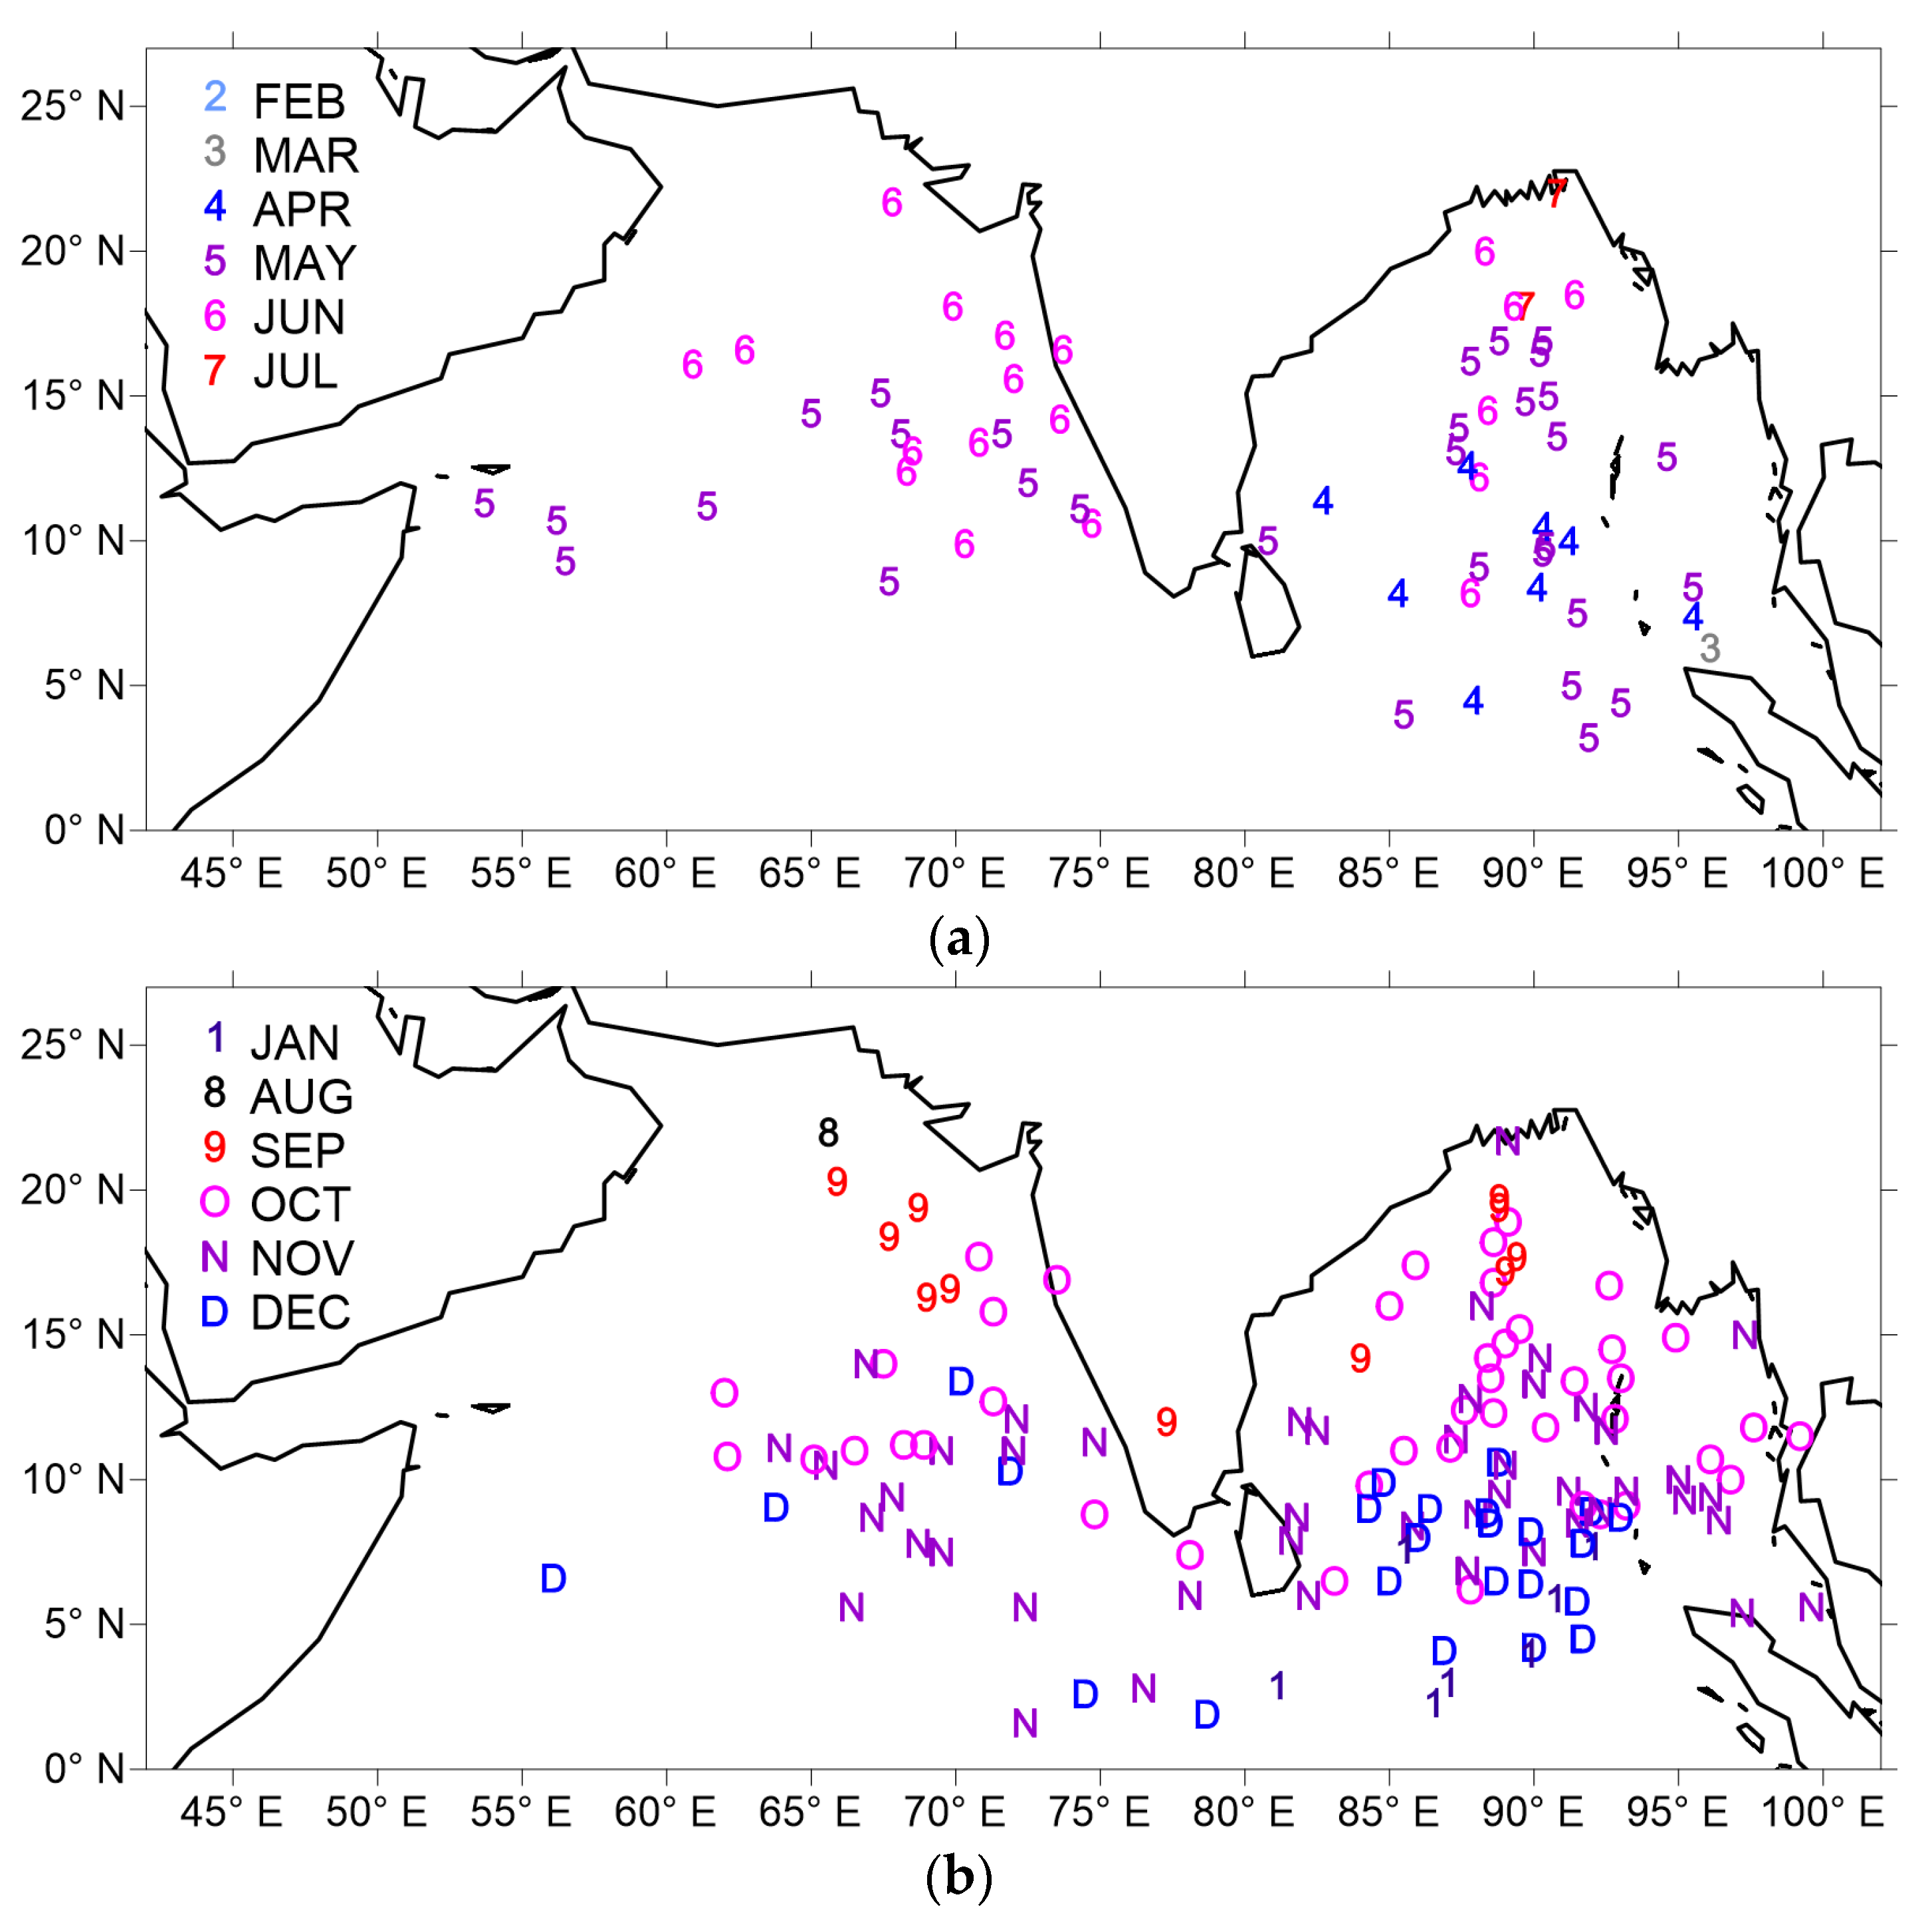
To present the spatial distribution of TCG in detail from a seasonal variation perspective, the monthly distribution of the initial location of NIO TCs is shown in
Figure 3. As seen, the initial positions of NIO TCs are characterized by gradual northward movement in the pre-monsoon season (
Figure 3a). In the post-monsoon season, however, the initial positions of TCs move southwards from August to December. These distributions are closely related to the establishment and retreat of the South Asian summer monsoon [
33,
34]. The seasonal variation in the South Asian summer monsoon has an essential influence on NIO TCs.
In the pre-monsoon season in the AS, the initial positions of TCs in May are mainly located in the area south of 15° N, shown as a zonally distributed belt. After June, the TCG initial positions move northwards obviously, even to the area north of 20° N, and the distribution of positions also shifts to the east of the AS. For the BOB, TCs can occur as early as in March or April and are mainly located to the south of 7° N and the south of 15° N, respectively. The initial locations of TCs move northwards to the area near 20° N in May and as far as the area north of 20° N in June and can then reach the northern edge of the BOB in July. A large number of BOB TCs occur in May, and their distribution also covers most areas of the BOB, albeit the central part of the BOB is the most concentrated area.
In the post-monsoon season in the AS, only one TC was generated in August during 1980–2019. In September, the initial positions of TCs move southwards to the area south of 20° N, and then during October–December, they move gradually southwards. The northern boundary of the initial locations of TCs in November and December is near 15° N, while the southern boundary is almost at the equator. For the BOB, a gradual southward shift in the initial locations of storms is also evident but from September to January of the following year. The northern boundary of the initial points of TCs in September is around 20° N, whereas by January of the following year, it is around 8° N. October and November are the peak seasons of TCG in the BOB, and the initial points of TCs can be distributed in most areas of the sub-basin. Taking November as an example, compared with October, the initial points of TCs have moved southwards but can appear in the area of 7°–20° N. In this period, the distribution of TCG in the BOB is more intensive than in the AS, and only the BOB can generate TCs in January. This feature shows that the conditions for TCG in the BOB are more organized and stable than those in the AS, and these conditions for TCG have a longer duration.
The TCGs in both the AS and BOB show bimodal seasonal cycles, but their spatial distributions are different. In the pre-monsoon season of May–June, the average number of TCGs is 0.3 and 0.35 in the AS and BOB, respectively, i.e., the number of TCGs is approximately the same in the two basins. In the post-monsoon season of October–November, however, the average monthly TCG number is 0.34 in the AS and 0.78 in the BOB, i.e., significantly more (specifically, 2.3 times more) TCs are generated in the BOB basin than in the AS basin. In short, in the post-monsoon season, TCs are generated in the BOB with higher frequency and intensity than in the AS.
Similar to the seasonal cycle of TCG frequency, the GPI also presents a typical bimodal pattern of seasonal variation (
Figure 2). The correlation between the GPI and TCG frequencies reached 0.63 in the AS, which passed the test of significance level of 0.02. In the BOB, the correlation between GPI and TCG frequencies even reached 0.93, which passed the test of 0.01 level of significance. The GPI shows good performance in representing the combined effect of large-scale environmental processes on TCG in the BOB and AS [
34,
35]. In addition, during the pre-monsoon season of May–June, the average GPI values are approximately the same, being 0.8 and 0.9 in the AS and BOB in May, respectively. However, the GPI value in the BOB is roughly double that in the AS during the post-monsoon season of October–November. These results indicate that, first, the environmental factors that favor TCG also present similar seasonal cycles to that of TCG in both the AS and BOB and, second, the GPI also performs well in reflecting the TCG environment on the seasonal scale. Thus, further analyzing the oceanic and atmospheric environments and using the GPI to quantify the contributions of these environmental factors to the TCG seasonal cycle in the two basins are necessary. These aspects are discussed next, in
Section 4 and
Section 5.
4. Oceanic and Atmospheric Environments Related to TCG
Previous studies [
3,
12,
15,
36,
37] have indicated that the basic conditions for the formation of a typhoon or TC are as follows: an SST higher than 26 °C, suitable low- and middle-level humidity, essential low-level relative vorticity (convergence in lower levels or the boundary layer), and relatively small vertical wind shear (U200 hPa–U850 hPa). The first two are hydrothermal conditions, and the latter two are dynamic conditions. The analysis and discussion in this part combines the above conditions and proceeds from the spatial and temporal changes in circulation and associated variables. The spatial distribution of physical quantities provides the distribution of peak months and base months. The peak months are May and November, and the base months are February and August. In terms of the regional average for the temporal variation, the AS sub-basin is 0°–20° N, 55°–77.8° E, and the BOB sub-basin is 0°–20° N, 77.8° E–100° E.
4.1. Sea Surface Temperature
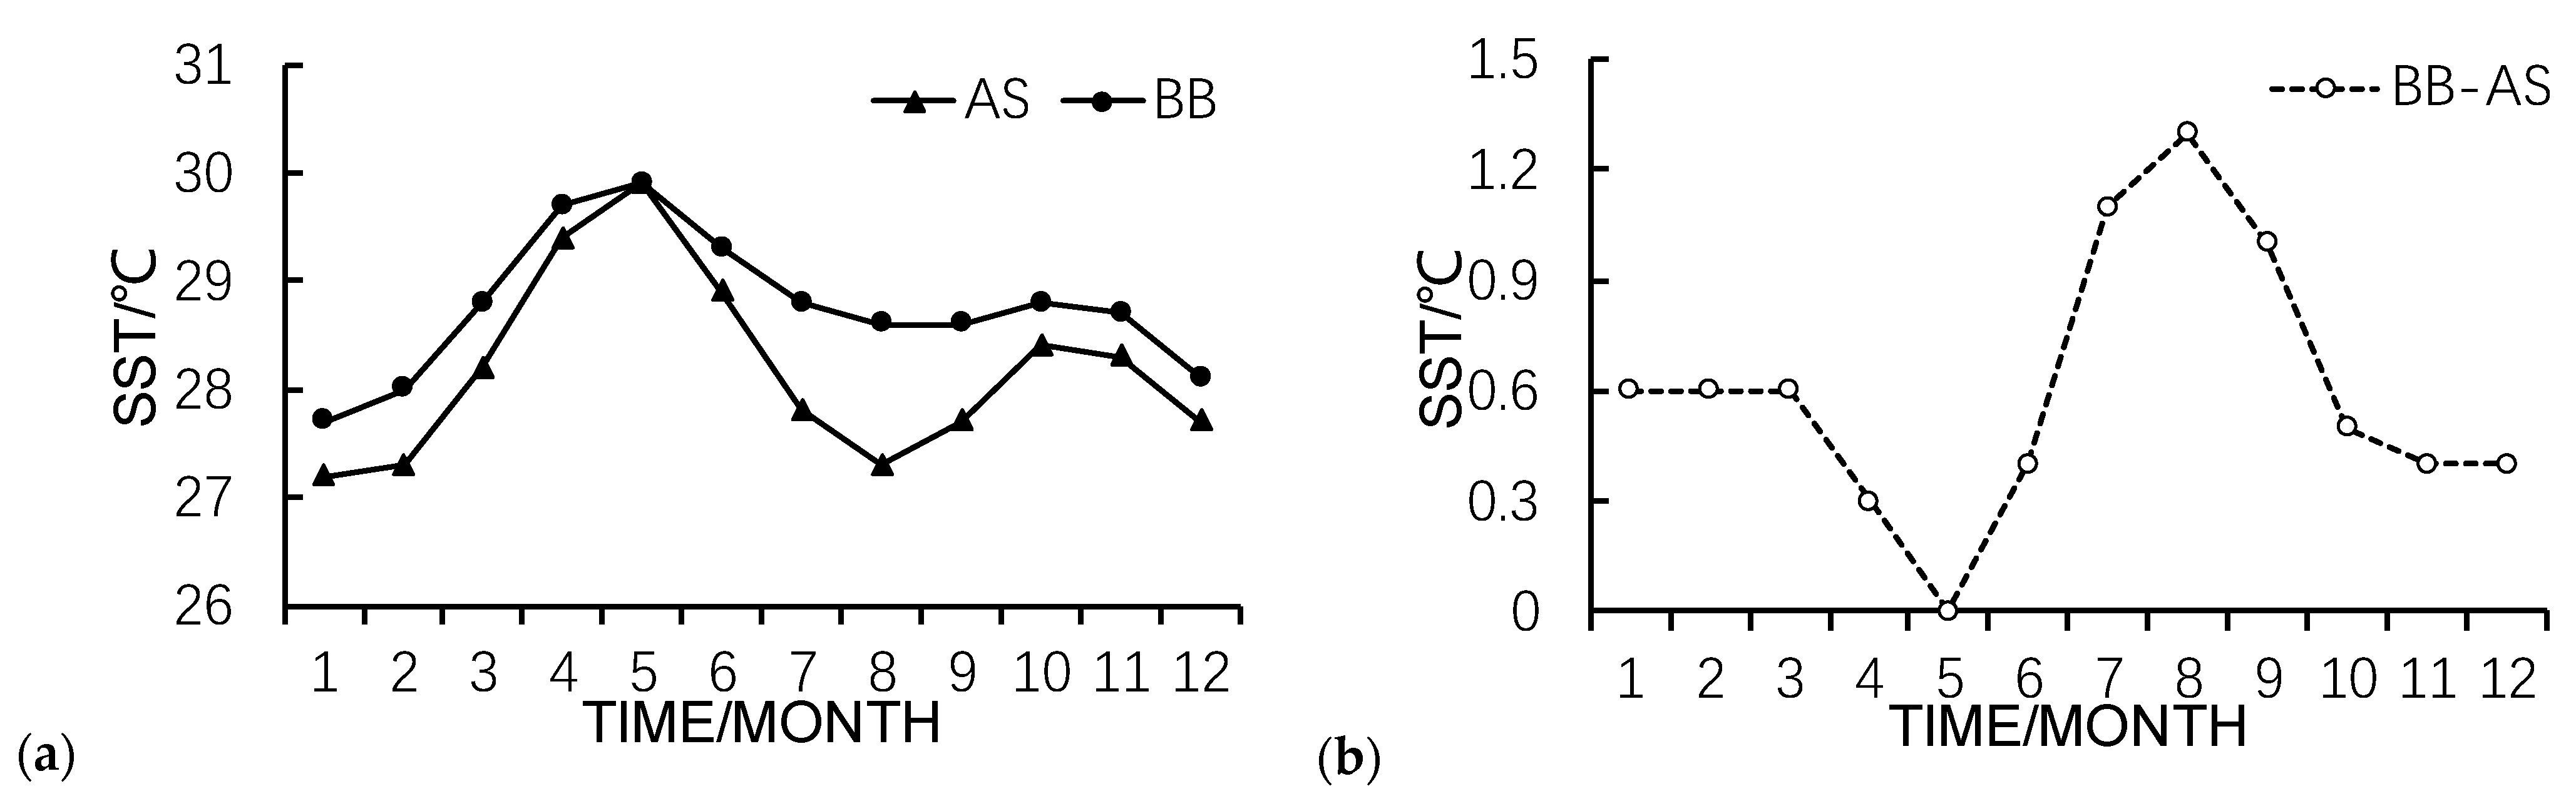
SST is the most convenient and straightforward physical quantity to characterize ocean heat content. The greater the ocean heat content, the greater the number of TCs that can be produced and the greater their potential intensity. Therefore, SST is considered an important factor in the seasonal variability of TCs. The pattern of seasonal change in SST is bimodal in both the BOB and AS (
Figure 4), and the peak time is consistent with the peak time of TCG. This shows that SST during the peak period for storms also provides a favorable condition. In the BOB and AS, SST can be maintained above 26 °C throughout the year, which is the empirical threshold for tropical storm genesis. However, TCs do not occur throughout the year in the NIO, indicating that other inhibitory factors may also influence TCG activity, such as the relative humidity in the monsoon, winter, and spring seasons. In addition, the BOB has higher SST throughout the year than the AS, which indicates that the former basin has more favorable SST conditions for TCG.
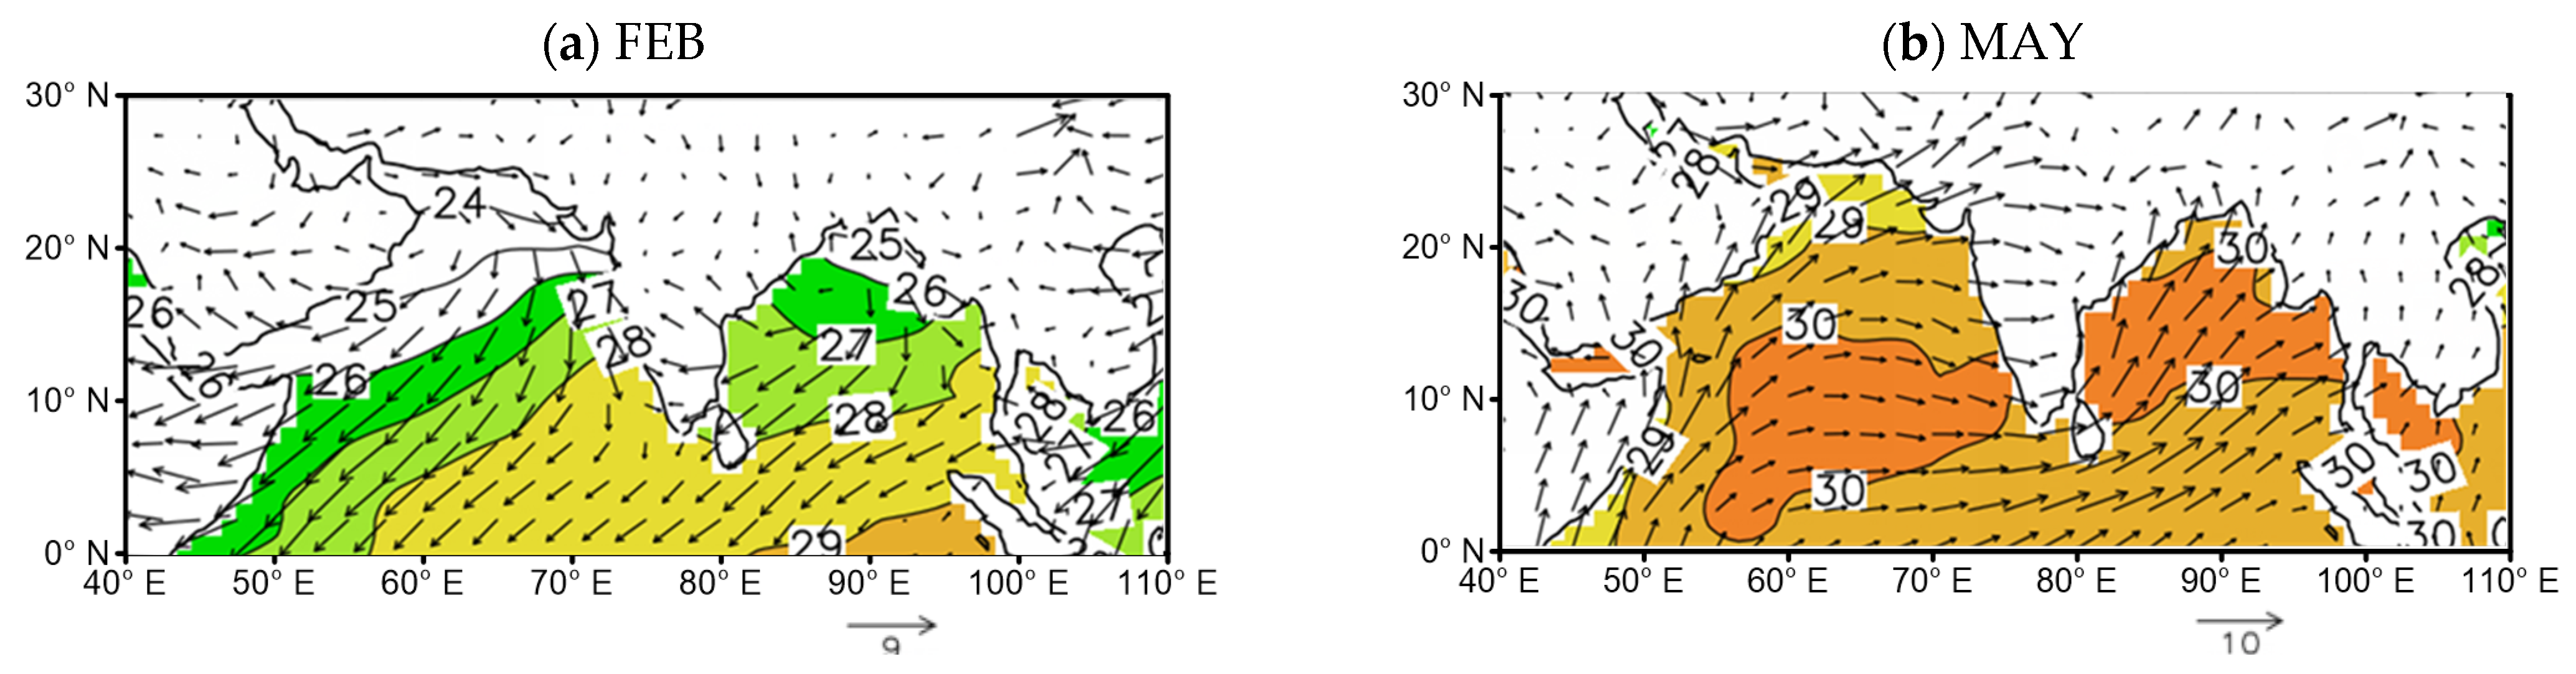
Figure 5 shows the distribution of monthly mean SST and surface wind for the peak and base months of NIO TCG. In February, the distribution pattern of NIO SST shows low values in the northwest and high values in the southeast (
Figure 5a). In all areas of the NIO, except the northwestern AS, the SST is higher than 26 °C. In May, the SST reaches its highest value in the whole year, and this month is also the peak month of TCG in the pre-monsoon season. Most areas of the NIO have an SST that exceeds 29 °C, and that of the central NIO is above 30 °C. The spatial distribution of NIO SST is quasi-symmetric, with higher SST in the middle and lower SSTs in the south and north. The 30 °C area also overlaps with the high-incidence area of storms in the same month (
Figure 3a). In August, a spatial heterogeneity in NIO SST is evident, with the SST in the AS being lower than that in the BOB. Therein, the spatial pattern of AS SST is high in the east and low in the west (
Figure 5c), with the latter being lower than 26 °C (below the sea temperature threshold required for TCG) and with the former being about 26 °C–29 °C. In contrast, the BOB SST is universally higher than 28 °C, apart from the northwest of the sub-basin and at the southeastern margin. In November (
Figure 5d), the overall NIO SST is above 27 °C, in which the distribution of AS SST is lower in the northwest (~27 °C) and higher in the southeast (~28 °C). The overall BOB SST at this time exceeds 28 °C.
The SSTs in February and August are not low, especially in certain sea areas. In fact, it is higher than 28 °C, i.e., even higher than in November, but there are very few TCs. This shows that, while a sufficiently high SST is a necessary condition for storm generation, it is not a guarantee.
Combined with the analysis of (sea) surface wind, the wind may be the key to the spatiotemporal variability of SST. In February (
Figure 5a), the surface wind from Eurasia has a cooling effect on the NIO, while the wind from the Arabian Peninsula is more robust than that from the Indian Peninsula. Therefore, the AS is colder and the SST is lower, especially in the northwest of the sub-basin. In May (
Figure 3b), the surface wind gradually manifests as the initial form of the South Asian summer monsoon. Under the force of the surface wind stress, warm water gathers at the sea surface in the NIO region. As a result, the SST in the central parts of the AS and BOB can exceed 30 °C. These characteristics provide favorable oceanic conditions for TCG and lead to its peak in May. During the pre-monsoon season of April–June, the average SST differs by very little between the AS and BOB basins (
Figure 5b).
In August (
Figure 5c), the South Asian monsoon matures. The Somali jet causes intense surface winds and forces oceanic upwelling along the coast of East Africa and the Arabian Peninsula. This causes cooling of the SST in the AS basin. Thus, during the monsoon period, the SST in the AS is lower than that of the BOB. Specifically, the SST in the western part of the AS in August can even be lower than 26 °C. Therefore, we speculate that the low SST may suppress TCG in the AS during the monsoon season.
After November, the South Asian summer monsoon retreats, the surface wind in the winter begins to cool the SST in the NIO region again, and the wind speed is higher in the AS. The process of surface wind cooling in the AS is more potent than that in the BOB. In the AS, the surface wind in the western part is stronger than that in the eastern part, and thus, the cooling effect is naturally stronger in the former than the latter.
In general, the force of surface winds on the AS and BOB is very strong in August and February (
Figure 5), and the induced cooling effect leads to a bimodal seasonal cycle of the SST. Thus, the maximum SSTs appear in May and November, which are also the peak months of TCG in the pre- and post-monsoon seasons, respectively.
The sub-surface temperature in the NIO is also roughly consistent with the variability characteristics of the SST (Figure omitted). In general, the overall SST in the BOB is higher than that in the AS.
Both the TCG and SST in the NIO show the bimodals’ pattern of seasonal variation, and a good relationship between them. Generally, higher SST is conducive to a higher formation frequency and intensity of TCs. The peaks of TCG in the AS and BOB are related to the high SST in May and November. Compared with the AS, the BOB has higher SST throughout the year, which means that it possesses more favorable heat conditions for the formation and strengthening of storms. The SST has an important influence on the distribution of TCG. The locations of TCG in the AS are mostly concentrated in the western part of the sub-basin, while TCs form throughout the entire BOB and are distributed more evenly. In addition, the peak value of SST in the pre-monsoon season is higher than that in the post-monsoon season but the TCG frequency is higher in the post-monsoon season. This indicates that SST may be just one of the key factors that influence the variability of TCG, with the atmospheric environment also being very important.
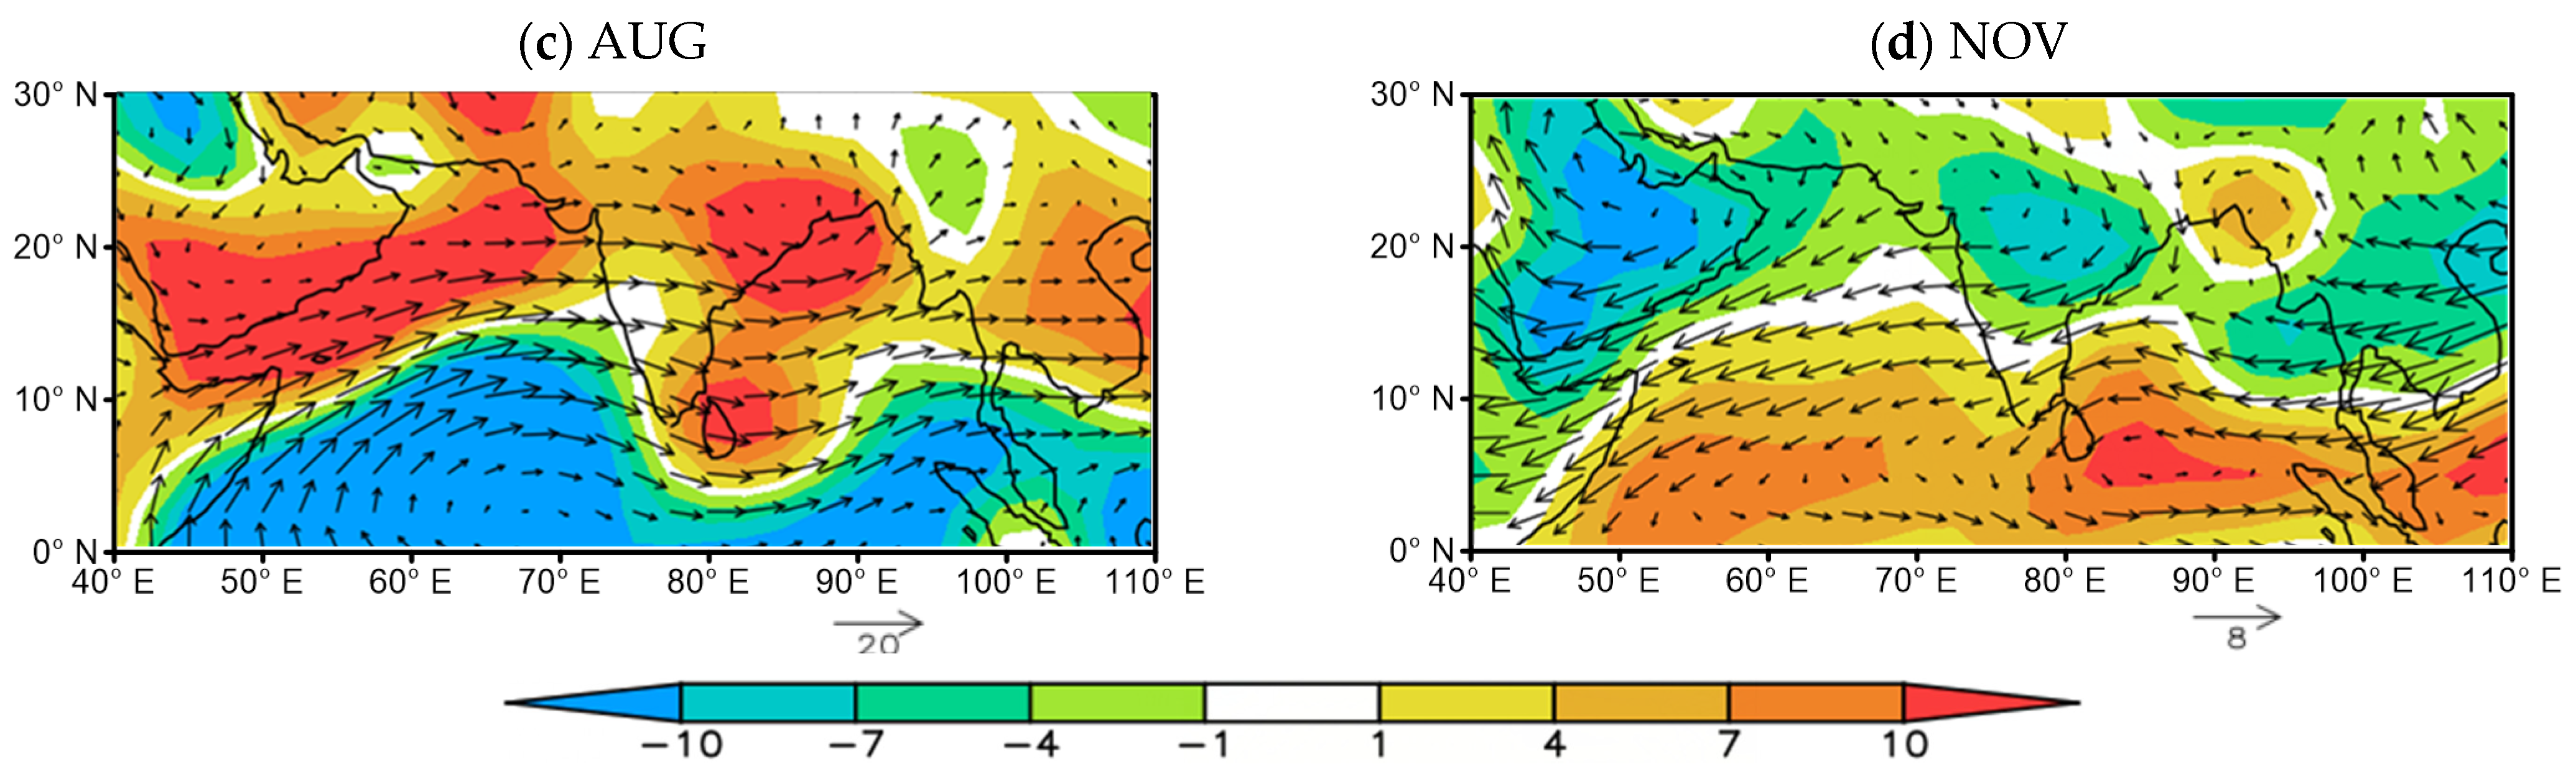
4.2. Low- and Middle-Level Relative Humidity
Low- and middle-level relative humidity is usually used to reflect the water vapor and thermodynamic conditions in the lower and middle troposphere. In this part of the analysis, 600 hPa relative humidity is used to represent low- and middle-level relative humidity.
The relative humidity at 600 hPa in the NIO shows a typical unimodal change (
Figure 6), which is closely related to the South Asian summer monsoon activity. The establishment and maintenance of the South Asian summer monsoon provides abundant water vapor in the low- and middle-level troposphere over the NIO. Therefore, the single peak value of relative humidity at 600 hPa appears in the South Asian summer monsoon season of July–September. However, the bimodal peaks of TCG frequency are in the pre- and post-monsoon seasons. This shows that, first, a lower humidity limit must be reached for TCG, and once that threshold is reached, the requirements for TCG are met and, second, although higher humidity is more conducive to TCG, in the monsoon season (July–September), the promotional effect of 600 hPa relative humidity on TCG may be offset by other factors such as vertical wind shear [
16].
In the AS, the relative humidity in the lower and middle troposphere presents extremely low values of less than 30% during January–April, and concurrent with this, no TCG takes place. This indicates that such dry humidity in the lower and middle levels plays an important role in restricting TCG. Thus, the low relative humidity at 600 hPa may act as a key factor that inhibits the generation of TCs in winter and spring.
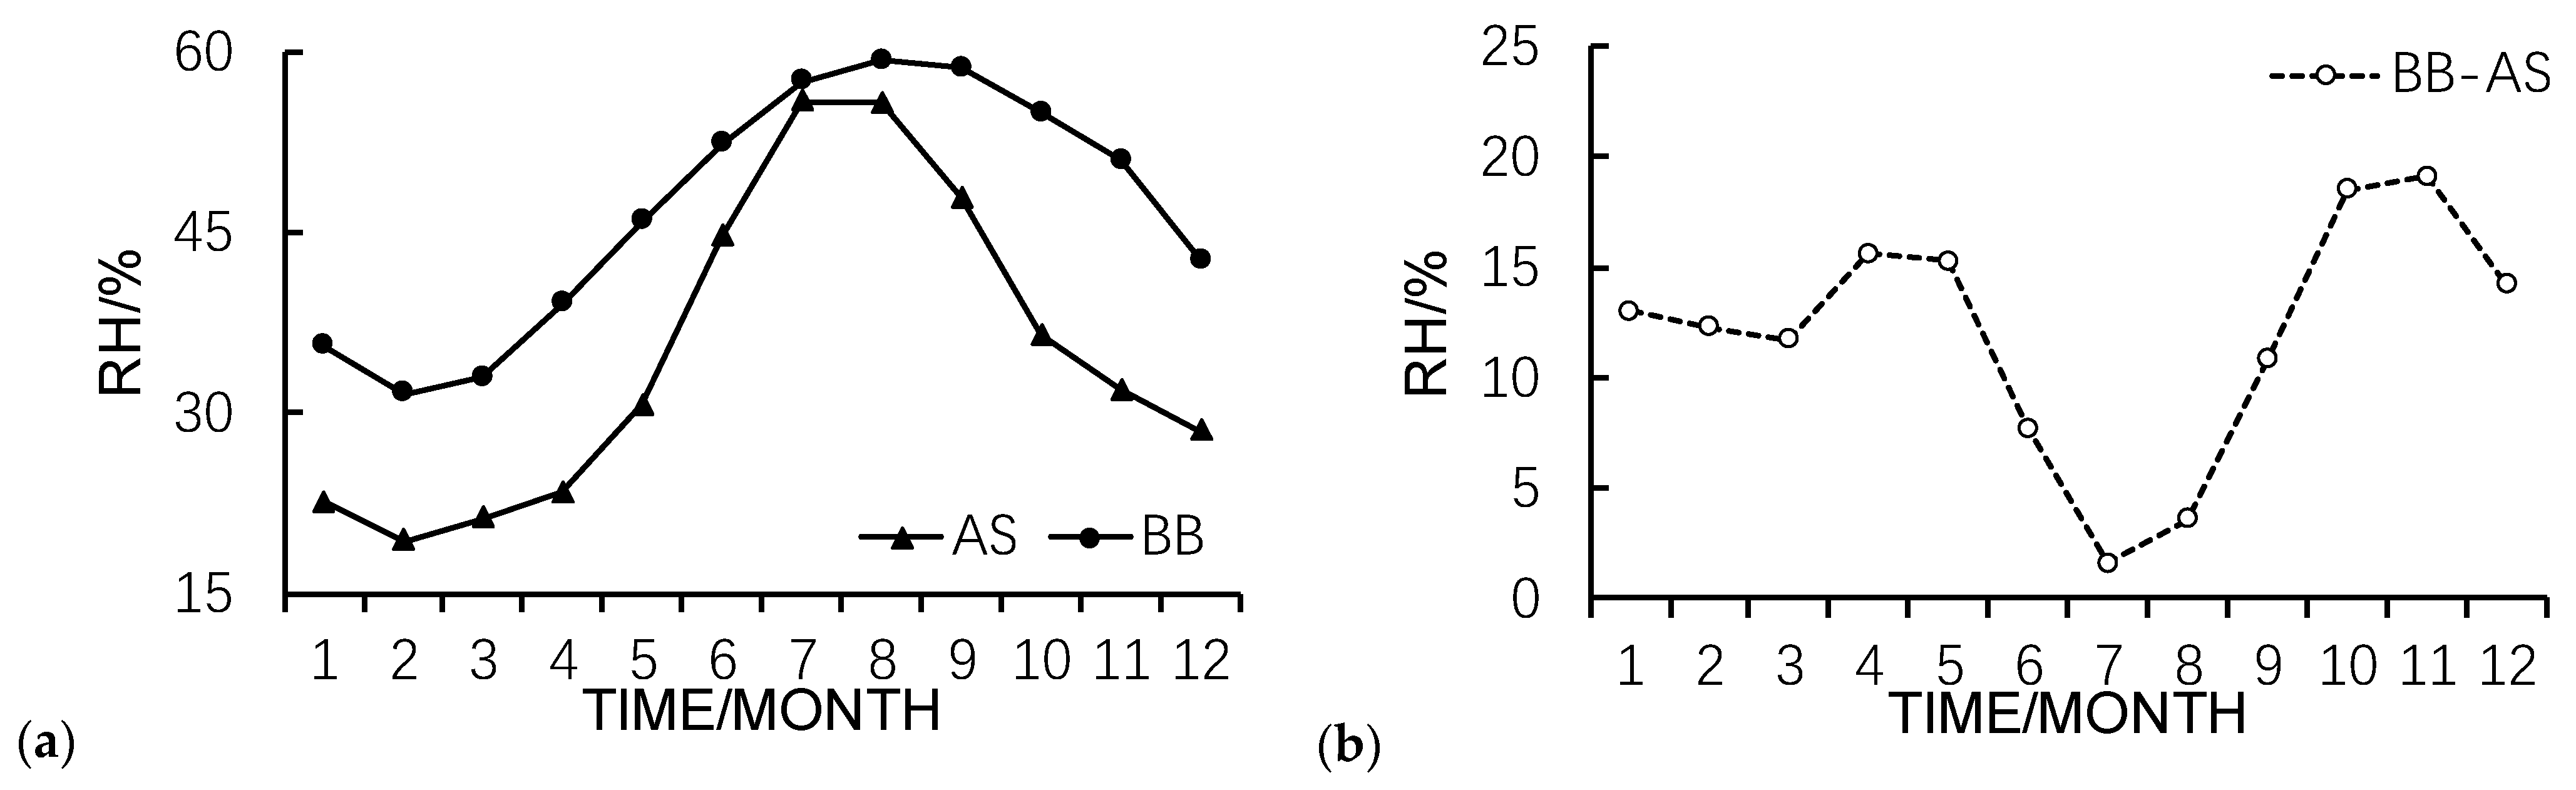
Generally, the relative humidity at lower and middle levels in the BOB is higher than that in the AS throughout the entire seasonal cycle, indicating that the moisture condition in the BOB is more favorable for TCG than in the AS. Interestingly, the difference in 600 hPa relative humidity between the AS and BB shows a double-peak pattern similar to that of the TCG seasonal cycle (
Figure 2 and
Figure 6b). During the pre-monsoon season of April–May and the post-monsoon season of October–November, the moisture condition in the lower and middle troposphere over the BOB and AS presents a marked difference. In the pre-monsoon season, the difference in 600 hPa relative humidity is about 15% from April to May, whereas in the post-monsoon season, this difference exceeds 17% from October to November. More favorable moisture conditions over the BOB may partly contribute to the higher TCG frequency in this sub-basin.
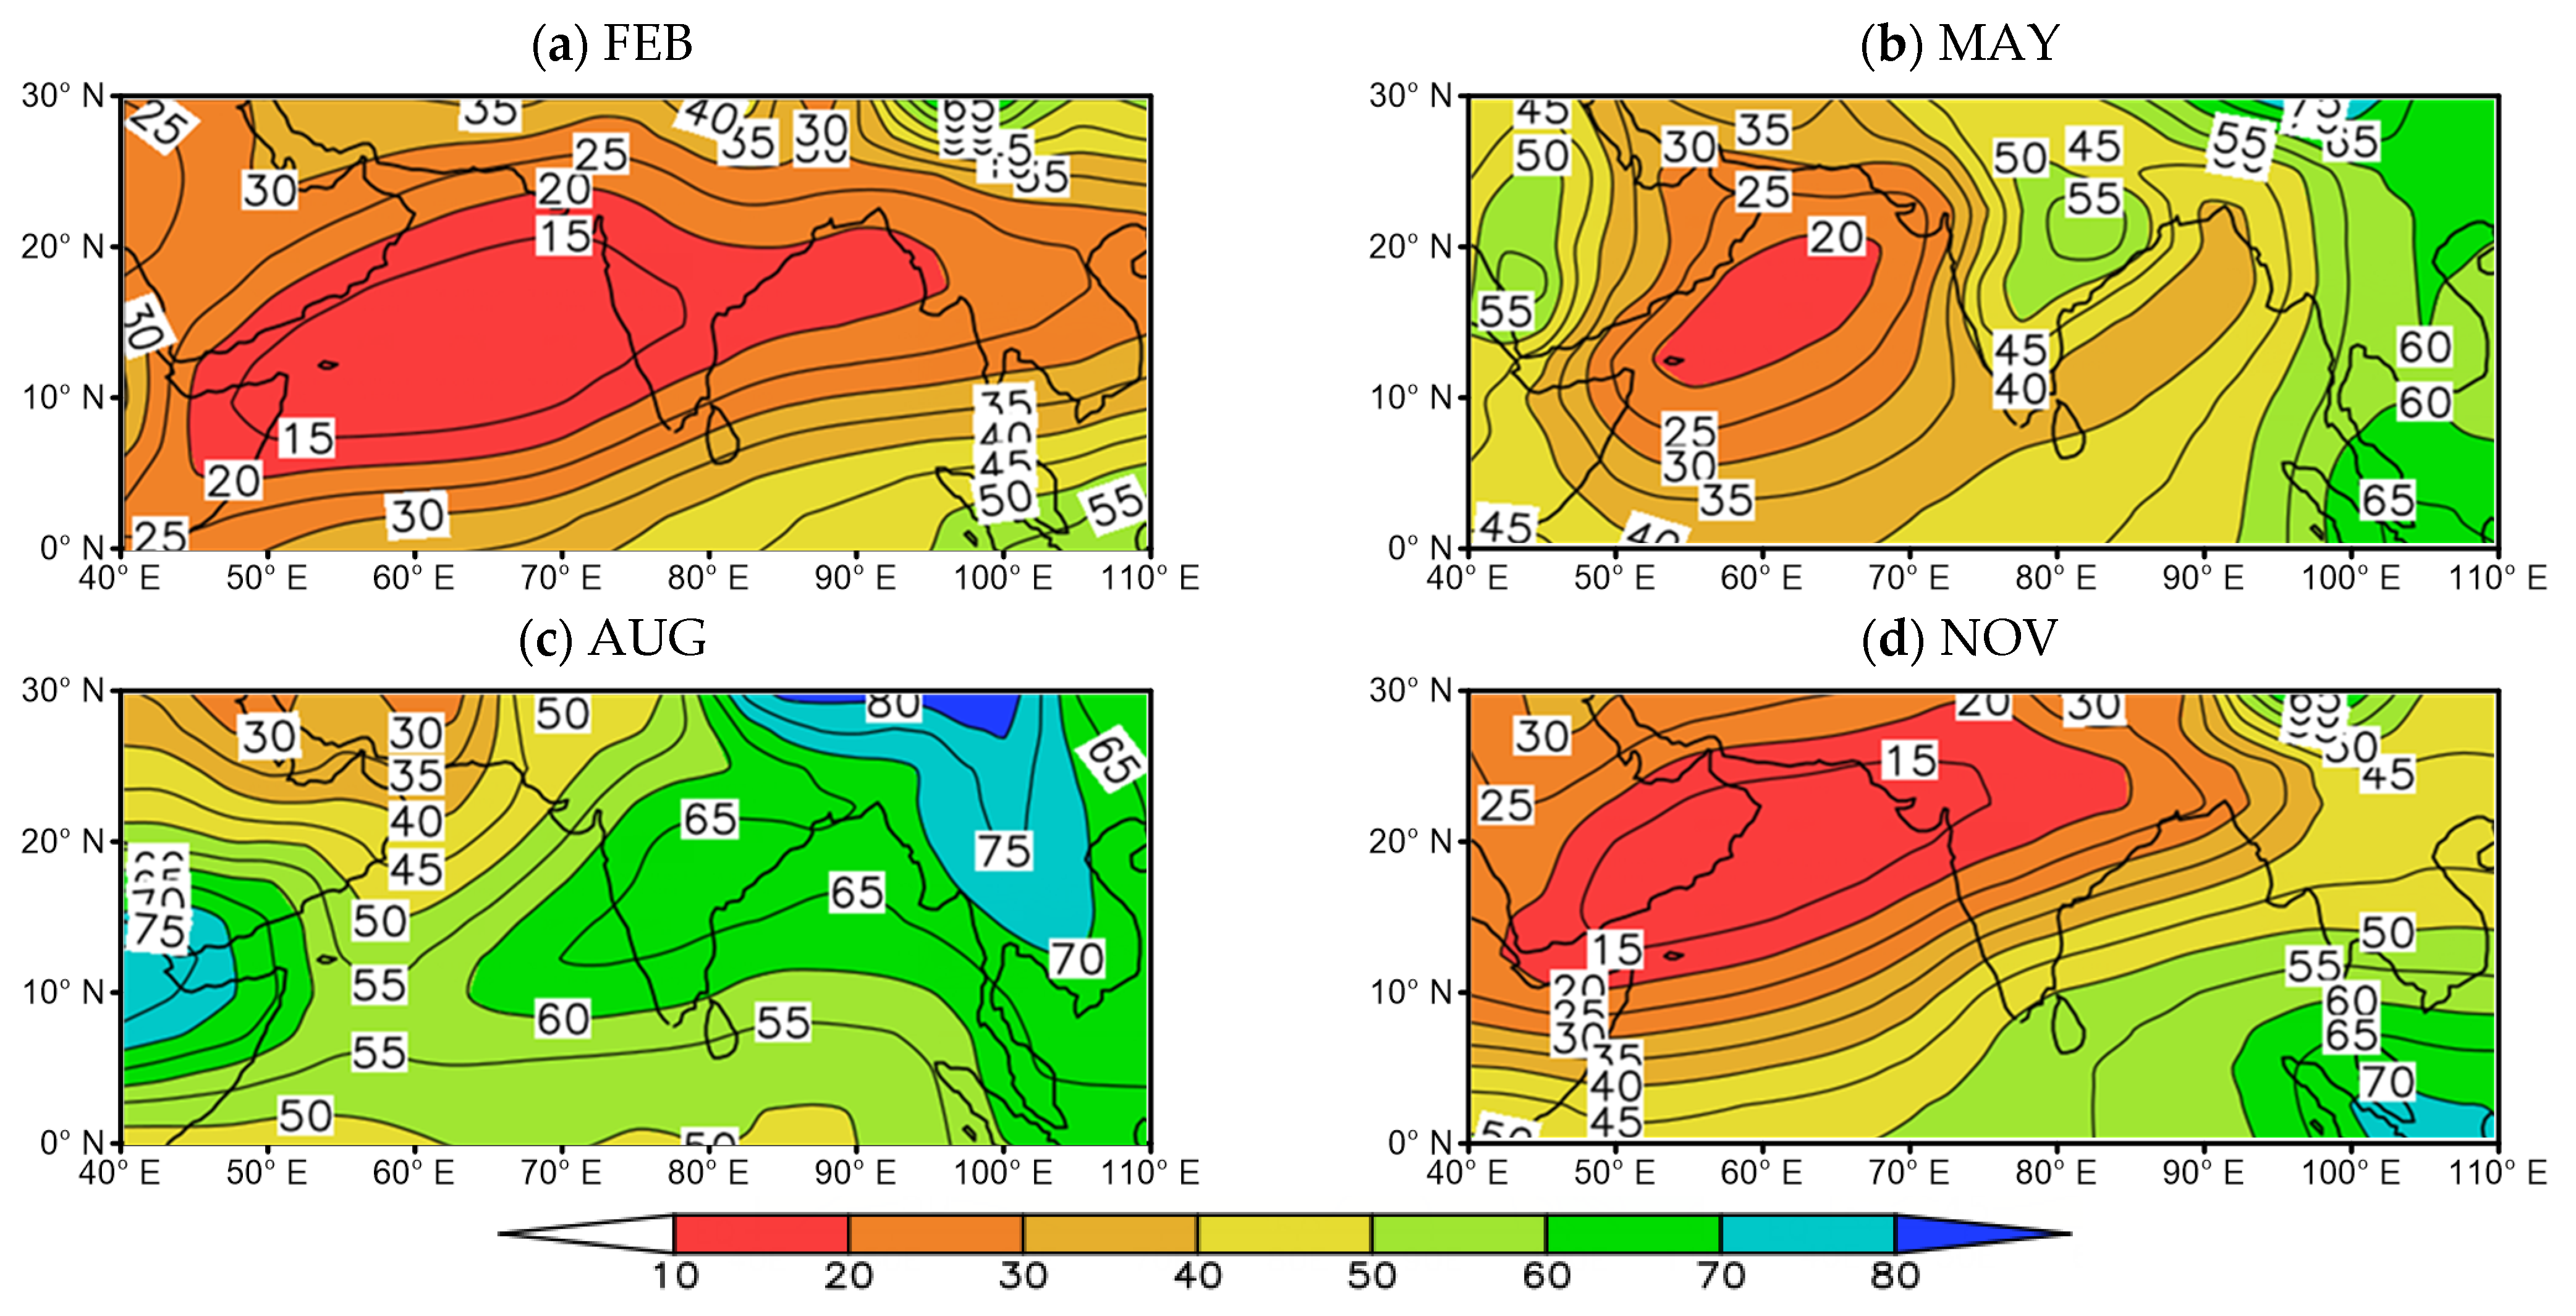
Figure 7 shows the spatial distribution of relative humidity at 600 hPa in the peak and base months of TCG. In the driest month of February, the relative humidity at 600 hPa is below 30% in all areas of the NIO except in the BOB near the equator, where it is close to but over 30%. In February, no TCG takes place across the entire NIO region. The relative humidity at 600 hPa in the NIO gradually increases in May, at which time the spatial distribution of 600 hPa relative humidity in the AS presents a pattern of being dry in the northwest and being wet in the southeast, with values varying from 10% to 40%. In the BOB, the distribution of relative humidity shows low values in the center and high values at the two flanks, with values varying from 35% to 50%. In August, the relative humidity at 600 hPa shows its highest value of the whole year, exceeding 50% in most areas of the NIO. In November, the 600 hPa relative humidity in the NIO shows a pattern of being dry in the northwest and being wet in the southeast, with values varying from 15% to 55%.
As seen, the relative humidity at 600 hPa may be an important factor in controlling the distribution of TCG. Especially in autumn, winter, and spring, which are the seasons with comparative insufficiency of water vapor, the relative humidity in the lower and middle troposphere may play critical roles in influencing TCG. For example, in May and November, the northern boundary of the initial positions of TCs in the AS and BOB is consistent with the 30% regional distribution of 600 hPa relative humidity during the same period.
Note that, in the monsoon season, the humidity conditions in the lower and middle troposphere are theoretically more favorable for TCG but the TCG numbers are very low. Therefore, the positive effect of relative humidity in the lower and middle levels on TCG may be offset by other factors, such as the dynamic factors. This notion is analyzed in the next section.
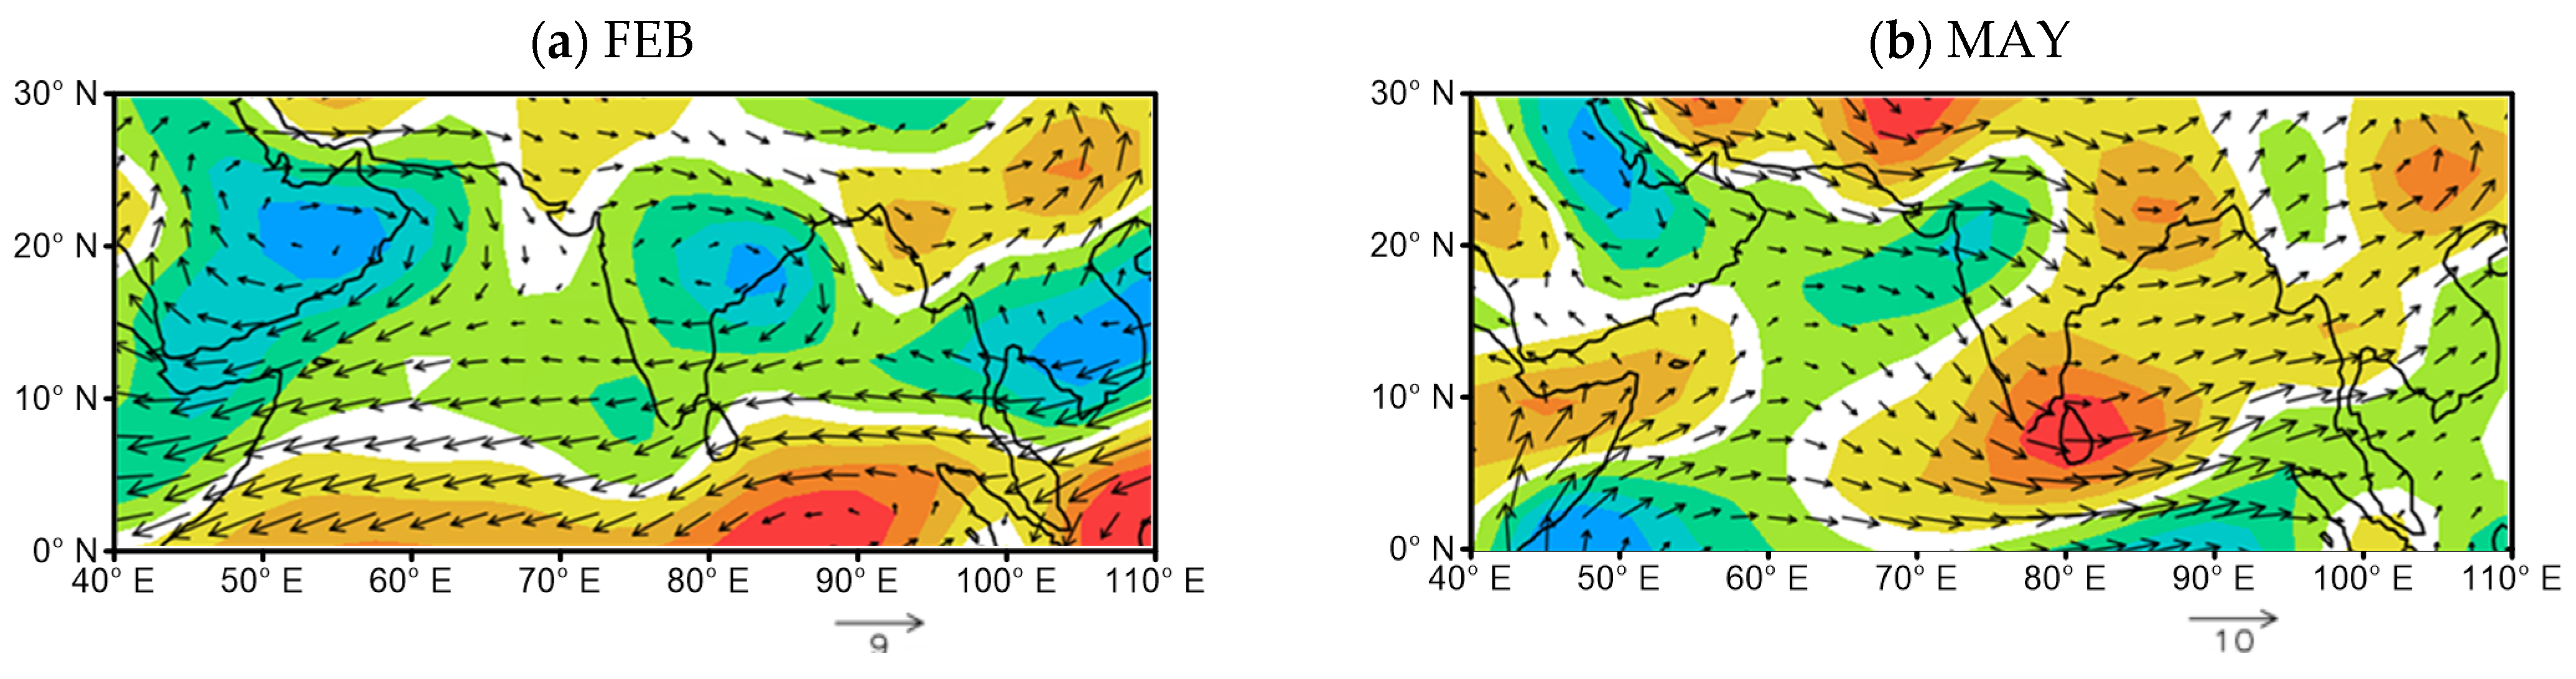
4.3. Low-Level Relative Vorticity
Low-level disturbance or convergence is one of the critical dynamic factors required for TCG. The average relative vorticity at 850 hPa also presents a typical bimodal seasonal cycle in both the AS and BOB (
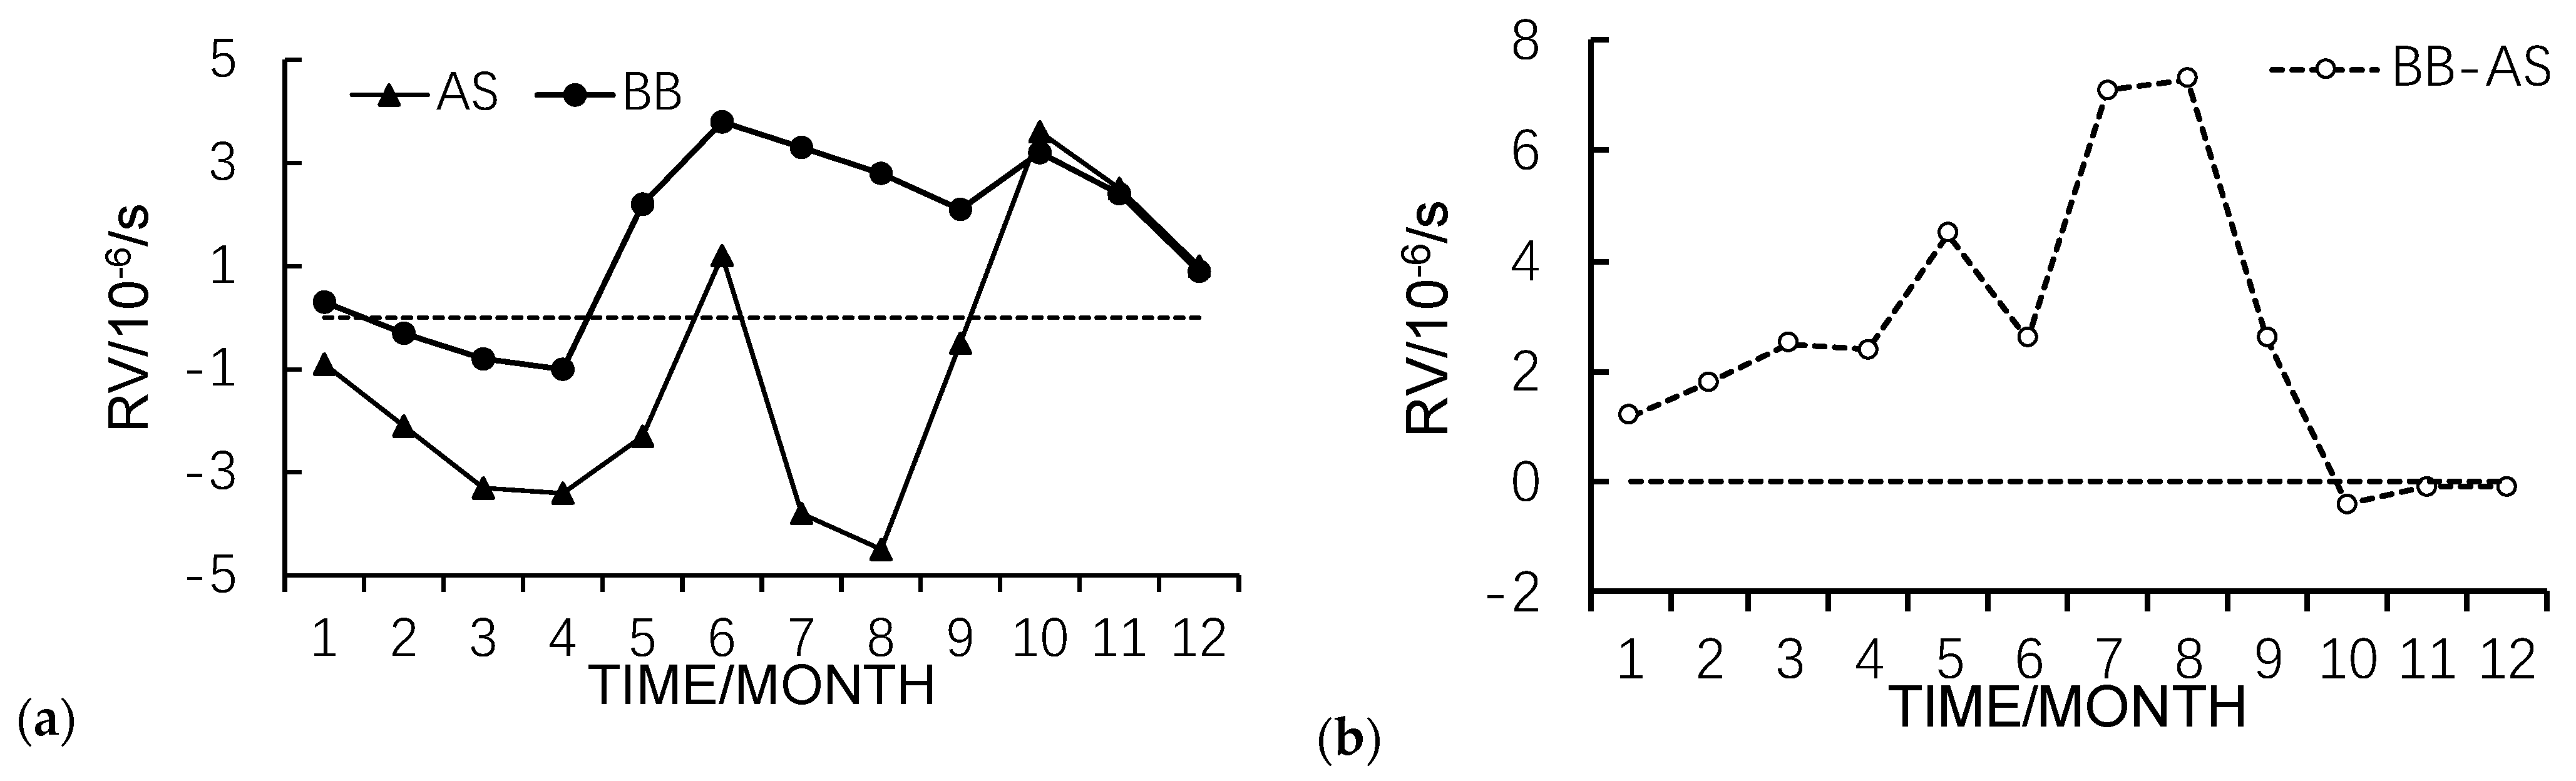
Figure 8a). The first peaks occur in June, and the second peak appears in October. The periodicity is only one month away from the peaks of TCG. May and November are also the high-value months of 850 hPa relative vorticity in the year.
The differences in relative vorticity at 850 hPa between the AS and BOB show that, in most months (from January to September), the values in the BOB are higher than those in the AS; the exception is that the values are roughly equivalent in October and December (
Figure 8b). This indicates that the initial disturbance conditions at lower levels over the BOB are more favorable than those over the AS, which is conducive to more TCG in the BOB.
Figure 9 shows the average 850 hPa relative vorticity and wind field of the TCG peak and base months from 1980 to 2019. In February, except in the low latitudes of the NIO, which is a positive vorticity area, most of the region has negative vorticity, which is unfavorable for TCG. Most of the NIO then turns into a positive vorticity area in May, and the BOB is controlled by positive vorticity, with a vorticity range of 1–10 × 10
−6/s. This is also one of the key conditions behind the tendency for the distribution of BOB TCs in May to be more uniform. At this time, the northern and southern areas of the AS are negative vorticity regions, the central area of 10° N is mainly controlled by positive vorticity, and its distribution corresponds well to the zonal distribution of AS TCs in May. The South Asian summer monsoon matures and peaks in August. The monsoon circulation controls the NIO. The monsoon trough-controlled area is a positive vorticity area, and the rest is a negative vorticity area. The BOB is the area where positive vorticity is mainly distributed, with a range of 4–10 × 10
−6/s, and the water and heat conditions are also good. However, TCs are only generated in August, and these TCs do not develop into tropical storms. The intense change in vertical wind shear (
Figure 10 and
Figure 11) is considered a crucial inhibitor [
38]. With the retreat of the South Asian summer monsoon, the 850 hPa relative vorticity and wind field of the NIO in November are basically reversed from those in August. The central and southern parts of the AS and BOB are positive vorticity areas, and the BOB vorticity is stronger than that in the AS, with the vorticity in the southern part of the BOB reaching more than 10 × 10
−6/s.
From the above analysis, the 850 hPa relative vorticity and TCG activity in the NIO are in good correspondence. The BOB has a stronger 850 hPa relative vorticity than the AS from January to September, which is more favorable for TCG in the BOB. Although the average 850 hPa relative vorticity of the two regions is quite similar in the post-monsoon season of October–November, the spatial distribution of the 850 hPa relative vorticity in the BOB is more conducive to TCG.
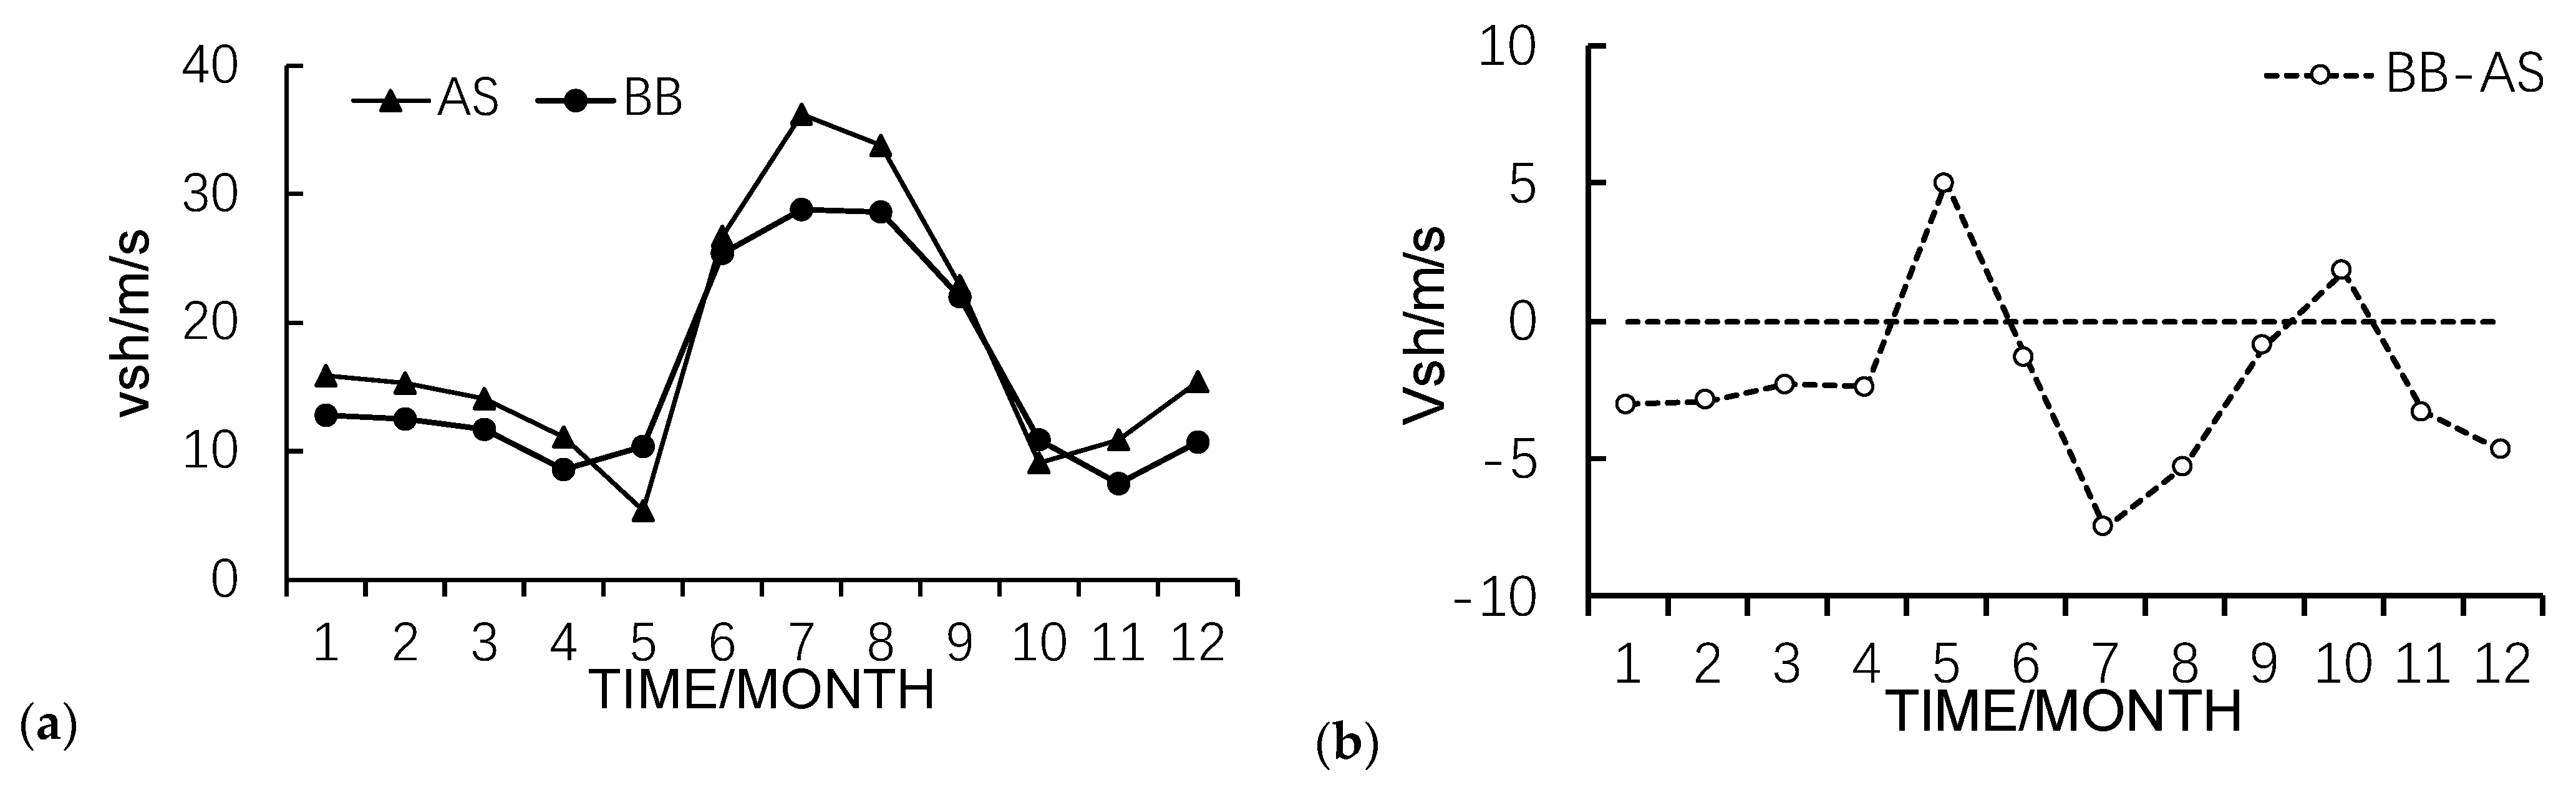
4.4. Vertical Wind Shear
Vertical wind shear is the critical factor determining whether the latent heat released by convective condensation can be concentrated in a certain range of the air column. It is also the critical dynamic factor for the formation of a warm center structure for a TC, which ensures continuous decreases in the initial disturbance pressure and ultimately forms the storm. Weak vertical wind shear is a necessary condition for TCG, while strong vertical wind shear is a destructive factor.
The average vertical wind shear over the AS and BOB basins presents a similar “two bases and one peak” seasonal cycle pattern. The two base periods of vertical wind shear appear in the pre-monsoon season of April–May and the post-monsoon season of October–November, which coincide with the establishment and retreat of the South Asian summer monsoon, respectively. The average values of vertical wind shear are around 10 m/s in both the pre- and post-monsoon season, and such low vertical wind shear is favorable for the formation and development of TCs in these seasons. During the monsoon season from June to September, the vertical wind shear over the NIO increases, and values vary within the range of 20–30 m/s. As a result, although warm and humid oceanic and low- and middle-level atmospheric environments exist, with frequent and strong tropical disturbances occurring during the monsoon season, the strong vertical wind shear suppresses the occurrence and development of TCs. Notably, whilst the vertical wind shear over the AS and BOB basin is weak in winter and spring (December–March), the humidity and SST conditions are relatively unsuitable for TCG.
Comparing the vertical wind shear of the AS and BOB, it can be seen that the vertical wind shear in the BOB changes less during the year than it does in the AS, having higher peaks and lower bases. Except in May and November, the vertical wind shear in the BOB is weaker than that in the AS throughout the year, which is a more favorable condition for TCG.
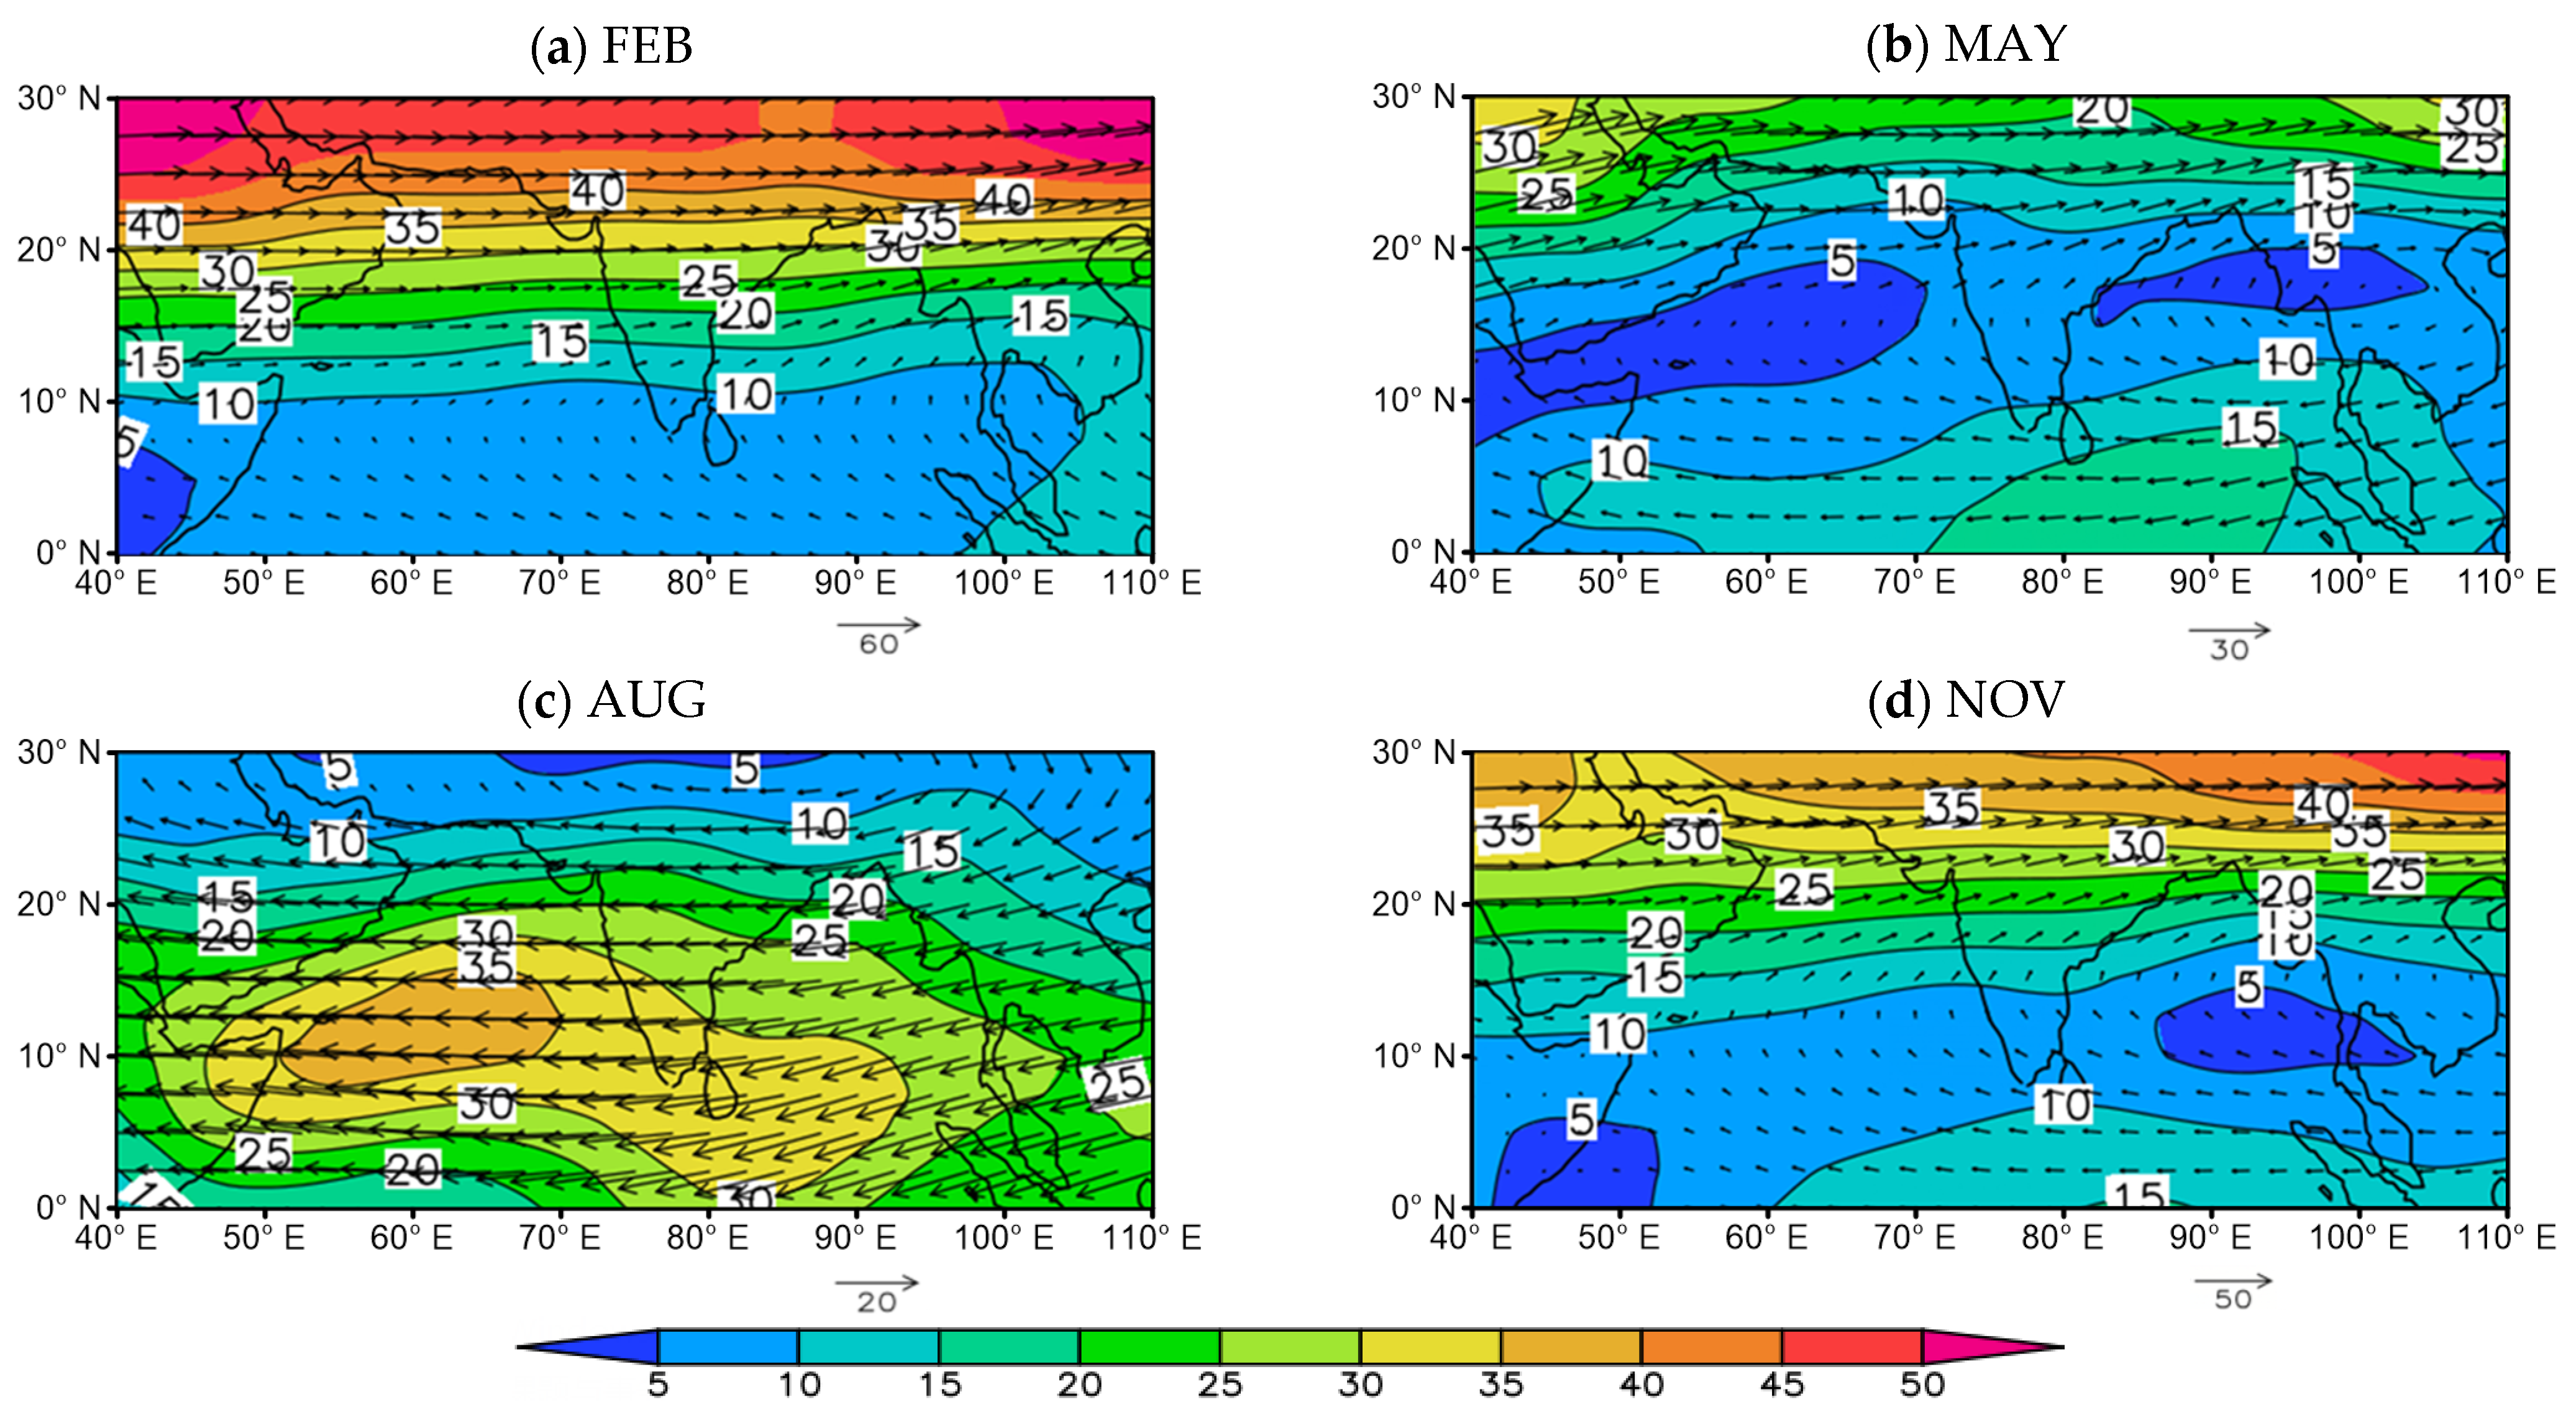
Over the NIO, vertical wind shear largely follows the magnitude and direction of the 200 hPa wind (
Figure 11). In February, the westerly zone and the subtropical westerly jet dominate the northern region of South Asia. The vertical wind shear in the NIO shows a zonal distribution of being low in the south and high in the north. The vertical wind shear to the south of 10° N in the NIO is generally below 10 m/s. In May, the 200 hPa upper westerly zone and the westerly jet move significantly northwards, and the areas with vertical wind shear less than 10 m/s also moves northwards, controlling most of the NIO (AS and BOB). At the same time, the South Asian high-pressure anticyclonic circulation is located in the NIO. In the overlying atmosphere of the NIO, strong divergence of airflow appears in the upper levels, which provides favorable conditions for frequent storms. In August, the 200 hPa level over the NIO is controlled by the tropical easterly jet, and the vertical wind shear of the NIO is as high as 25–35 m/s, which is not conducive to the formation and maintenance of the warm core structure of a convection system. This means that, in the summer months when the tropical easterly jet is at its strongest, the wind shear inhibits the formation of TCs. In November, the South Asian summer monsoon retreats, the subtropical westerly jet stream moves south again, and the vertical wind shear area over the NIO is once again less than 10 m/s, controlling the central and southern regions of the NIO (i.e., the AS and BOB). The reappearance of the wind shear and high-altitude divergence conditions is conducive to TCG.
Previous studies have shown that the spatiotemporal variations of TCG in the AS and BOB basins are closely related to the South Asian summer monsoon and its components, such as the Somali jet and the monsoon trough [
13,
16]. This section mainly discussed the large-scale oceanic and atmospheric circulation conditions related to TCG. As seen from the results, the two sub-basins have common bimodal characteristics of seasonal variation, which is closely related to the process of the South Asian summer monsoon. In general, in the pre-monsoon and post-monsoon seasons, high SST, weak vertical wind shear, strong initial disturbance, and appropriate humidity conditions jointly lead to the peak values of TCG. In the monsoon seasons, although the humidity conditions are good, less TCG takes place, owing to the joint inhibition of relatively low SST, weak low-level vorticity disturbance, and strong vertical wind shear. Compared with the AS, the BOB has more favorable conditions for TCG. Specifically, the SST is higher, the relative humidity in the middle and lower layers is higher, the initial disturbance is stronger, and the vertical wind shear is weaker. In particular, the relative humidity condition of the BOB in the post-monsoon season is significantly better than that of the AS, which may be an important factor leading to the higher TCG frequency in the BOB in the post-monsoon season. The results in this section show that the TCG of the two sub-basins is coordinated by marine and atmospheric factors. In order to quantify the contributions of each factor, an analysis using the GPI is carried out in the following section.
5. Quantitative Analysis of the Environmental Factors for GPI
The analysis in
Section 3.2 (
Figure 2) demonstrated that the GPI can represent the seasonal cycles in the AS and BOB well. Here, following Li et al. [
12], we quantitatively assess the contributions of each environmental factor, as shown in
Figure 12 and
Table 2.
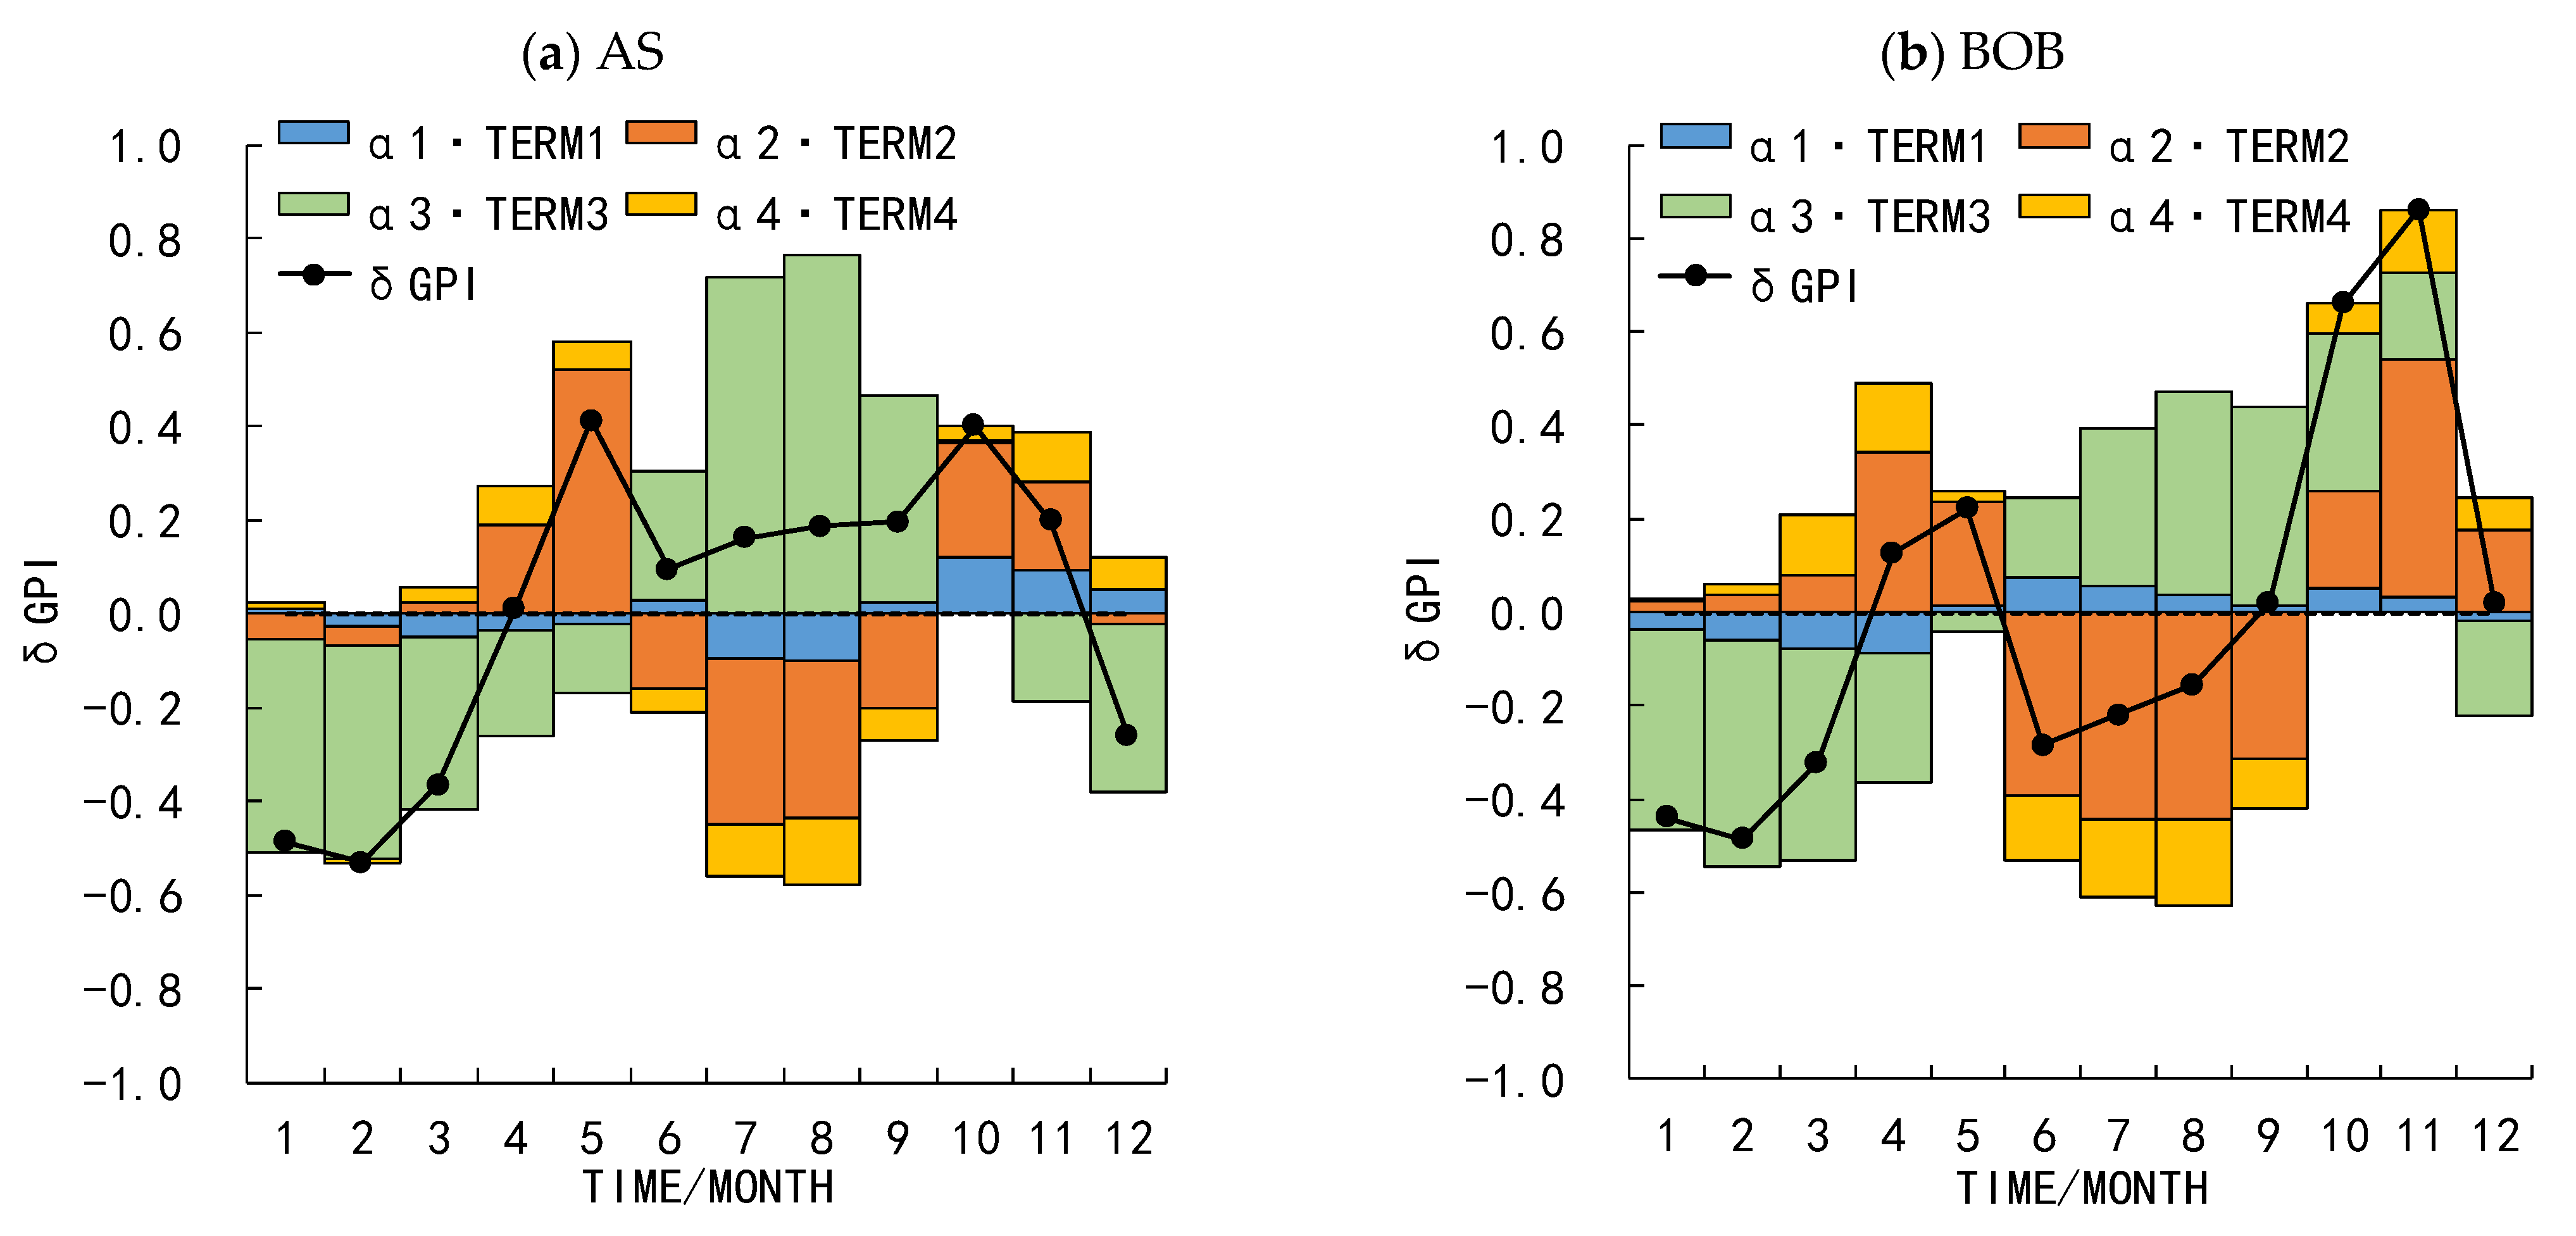
The GPI is defined as a positive index. All changes that bring about an increase in the value of the GPI are conducive to increasing the frequency of TCG. Conversely, the changes that bring about a decrease in the GPI inhibit the frequency of TCG. For the GPI, the relative humidity is low in winter, which overcomes the changes brought by other factors and inhibits TCG. This also explains why the SST meets the TC threshold in winter and other elements seem to meet the basic conditions, but there are no TCs. The base period of the GPI in summer in the AS and BOB can primarily be attributed to the vertical shear wind and potential intensity, although the relative humidity tends to enhance the TC frequency in summer.
To further clarify the large-scale process controlling the frequency of TCs in different seasons in the AS and BOB, especially in the peak and base months, the contributions from the four terms of the GPI and their percentages are listed quantitatively in
Table 2. In the first TCG base month (February), the relative humidity is the dominant controlling term in the two sub-basins. For the change in GPI, the absolute contribution from relative humidity can reach −0.46, and the relative contribution can reach 86%. Low humidity conditions basically restrict TCG. For the first TCG peak month (May), the vertical wind shear is the dominant controlling term. At this time, the absolute contribution of vertical wind shear to the change in GPI is 0.52, and the relative contribution is 127%. Owing to the South Asian summer monsoon beginning in May, the humidity in the lower and middle troposphere shows improvement. The negative contribution of relative humidity decreases, and the limitation imposed on TC formation clearly weakens. The positive contributions of the vertical wind shear and potential intensity terms both increase rapidly, but the increase in the former is relatively larger. In the first peak and base period, the large-scale circulation and its process in the NIO are relatively simple and consistent. The individual contributions from the four GPI terms in the AS and BOB differ only slightly in quantity but do not reflect a difference in nature.
The large-scale process is much more complex for the second peak and base periods, and more obvious differences can be found between the two sub-basins. For the second base month (August), the GPI value at this time is small and the change in contribution from any of the terms can easily exceed ±50% to then behave as the main controlling term. Therefore, the contribution from each term to the change in GPI cannot be ignored. This shows that the low frequency of TCs in August derives from the complex interplay among these four different processes and not because of the strong vertical wind shear alone. Specifically, the favorable conditions brought by the relative humidity are offset or even suppressed by the changes in the other terms, and the characteristics are different between the two sub-basins. For the AS, the primary control is the relative humidity (absolute contribution: 0.76; relative contribution: 414%). However, the vertical wind shear (absolute contribution: −0.33), potential intensity (absolute contribution: −0.15), and absolute vorticity (absolute contribution: −0.10) all offset the change in GPI caused by the relative humidity. However, the GPI in the AS still maintains a small positive value (0.18). For the BOB, the contributions from vertical wind shear (absolute contribution: −0.44; relative contribution: 281%) and relative humidity (absolute contribution: 0.44; relative contribution: 279%) cancel each other out, but the contributions from vertical wind shear and potential intensity can suppress the favorable contribution from relative humidity and absolute vorticity. In summer, the monsoon trough of the South Asian summer monsoon is located in the BOB, which leads to different contributions from the absolute vorticity term in the BOB and AS (as shown in
Figure 9).
For the second peak (October for the AS, and October and November for the BOB), the main controlling term is vertical wind shear, and the four contributing terms are all positive. The overall effect on the generation of TCs is relatively optimal during this period, and this also contributes to the main peak period of TCG frequency in the NIO.
However, the differences in the environmental factors affecting TCG between the AS and BOB are palpable in the second peak period. Specifically, the conditions in the BOB are more favorable for TCG. In October and November in the BOB, all of the contributing terms are positive, and both the relative humidity and vertical wind shear contribute significantly. In October, the main controlling term in the BOB is the relative humidity (absolute contribution: 0.34; relative contribution: 51%), followed by the vertical wind shear (absolute contribution: 0.21; relative contribution: 32%). Then, in November, the main controlling term in the BOB is vertical wind shear (absolute contribution: 0.51; relative contribution: 59%), followed by relative humidity (absolute contribution: 0.18; relative contribution: 21%). The absolute contribution from the relative humidity to the change in GPI can reach 0.34, while the relative contribution is 51%.
In contrast, only in October in the AS are all contributions positive; however, in November, the contribution from relative humidity becomes negative. The primary controlling term in October in the AS is vertical wind shear, for which the absolute contribution can reach 0.24 and the relative contribution is 61%. Then, in November, the vertical wind shear (absolute contribution: 0.19; relative contribution: 96%) is still the primary controlling term; however, the relative humidity (absolute contribution: −0.19; relative contribution: −96%) becomes the equivalent offset term. This is due to the fact that the relative humidity in the AS decreased significantly since October, and this process is significantly faster than in the BOB (
Figure 6). In addition, the BOB has more favorable vertical wind shear conditions, i.e., less vertical wind shear, during this period. The vertical wind shear of the two sub-basins in October is comparable, while the vertical wind shear in the BOB in November is smaller than that in the AS, which is related to the seasonal variation of the South Asian high and its position relative to the different basins (as shown in
Figure 10 and
Figure 11).
The dominant processes controlling the variation of TCG are similar in the AS and BOB in the pre-monsoon season from March to May. The GPI in the BOB and AS increases significantly, which is mainly caused by the increase in the positive contribution from vertical wind shear and the decrease in the negative contribution from relative humidity. At this time, the potential intensity also makes a small positive contribution. Although the negative contribution from relative humidity decreased, it was always negative, indicating that the humidity conditions were poor. From June to September, the relative humidity conditions of the two basins improved owing to the monsoon; however, its positive contribution was offset by the vertical wind shear and potential intensity, resulting in a small GPI value at this time, which is not conducive to TCG activity. Especially in the BOB, the change in GPI presented a negative value. Notably, in the post-monsoon season from October to November, the change in GPI in the two sub-basins was complex and different. The GPI change in the AS derives mainly from the overall positive contributions of vertical wind shear, potential intensity, and absolute vorticity. The GPI change in the BOB, on the other hand, comes from the overall positive contributions from vertical wind shear, potential intensity, absolute vorticity, and relative humidity. The reason for this difference may be that the vertical circulation in the two sub-basins is very different in autumn, resulting in different contributions from humidity [
24]. Based on this comprehensive analysis of the change in GPI, the BOB has conditions that are more favorable to TCG. Especially in the second TCG peak period, the BOB possesses more advantageous TCG conditions in two aspects—namely, relative humidity and vertical wind. The relative positional differences in the AS and BOB with respect to the South Asian summer monsoon circulation and South Asian high are the cause of atmospheric circulation.
6. Summary and Discussion
The seasonal variation of TCG in the BOB and AS is a typical bimodal distribution. However, few studies have explicitly identified the similarities and differences between the TCG in the BOB and AS, especially the seasonal changes in large-scale conditions and environmental factors. This study attempted to understand these similarities and differences, and the relationship between the TCs and their large-scale conditions and environmental factors by analyzing observational and reanalysis data. The average climatic distribution of SST and surface (sea surface) wind, 600 hPa relative humidity, 850 hPa relative vorticity and wind field, vertical wind shear, and 200 hPa wind were analyzed. This study proves that the seasonal cycle of NIO TCG results from the combined effect of hydrothermal conditions and dynamic conditions. It comprehensively explains how these environmental characteristics change together synergistically, and the difference between the AS and BOB.
The TCG in both the AS and BOB sub-basin shows a bimodal seasonal cycle, with the peaks appearing in the pre- and post-monsoon seasons and the base values appearing in the South Asian monsoon season. However, the distribution of TCG in the two basins is different. In the pre-monsoon season, the TCG numbers are approximately the same in the two basins. However, the spatiotemporal distribution of TCG is more concentrated in the AS than in the BOB. In the post-monsoon season, significantly more (roughly 2.3 times more) TCs are generated in the BOB than in the AS.
The bimodal seasonal cycles of TCG in the AS and BOB are closely associated with the South Asian monsoon process. Accompanying this, the related large-scale oceanic and atmospheric environments dominate the TCG seasonal variations over the AS and BOB. The combination of high SST, weak vertical wind shear, strong initial disturbance, and suitable humidity is favorable for TCG during the pre- and post-monsoon seasons; in contrast, in the monsoon season, the positive humidity contributions are offset by the joint inhibitory effect of the relatively low SST, weak low-level vorticity disturbance, and strong wind shear, thus resulting in low TCG. Generally, the large-scale environment in the BOB is more beneficial for TCG than in the AS, with higher SST, better moisture conditions, stronger initial disturbance, and weaker vertical wind shear. In the post-monsoon season especially, the more suitable relative humidity in the lower and middle troposphere in the BOB may be an important factor for more TCG appearing in the BOB than in the AS.
The quantitative analysis of the GPI indicated that vertical wind shear and relative humidity are two important factors for TCG. The combined contribution from these two factors dominates the seasonal variation in TCG in both the BOB and AS. In the pre-monsoon season, the increase in the positive contribution from vertical wind shear and the decrease in the negative contribution from relative humidity together are favorable for TCG in the AS and BOB. During the monsoon season, relative humidity makes a significant positive contribution to TCG, but its positive effect is offset by the strong negative effect of vertical wind shear and potential intensity, thus resulting in very low TCG in the AS and BOB. However, when examining the finer details of the relative contributions from each environmental factor to the variation in TCG in the AS and BOB, we can see some important differences, especially in the post-monsoon season.
In post-monsoon season, the primary positive contributor to TCG in the AS is vertical wind shear, whereas, in the BOB, it is the combined effect of vertical wind shear and relative humidity that dominates the TCG. The humidity in the lower and middle troposphere provides highly favorable conditions for TCG in the BOB. Note, however, that the vertical Walker circulations over the AS and BOB are different during this season [
12,
16]. Strong ascent appears in the BOB, which may transport abundant water vapor to the lower and middle levels and is favorable for TCG in the BOB basin. In contrast, an obvious descending branch of the Walker circulation appears in the AS, which inhibits water transport in the upward direction and is unfavorable for TCG. The related processes have been reported in previous studies [
12,
24].
Previous studies have also revealed bimodal seasonal cycles of TCG in the AS and BOB from an individual sub-basin perspective [
3,
12,
13,
16,
26]. On the basis of these works, we further compared the seasonal variation of TCG and the related large-scale environments in the AS and BOB sub-basins from a combined, whole basin perspective. The results revealed the similarities and differences in TCG activity between the AS and BOB basins in detail. In addition, the combined contribution from vertical wind shear and relative humidity dominates the seasonal variation in TCG in both the BOB and AS. This result is, to some extent, different from previous findings that have reported a single factor, such as vertical wind shear or relative humidity, to be more important [
12,
13,
16]. This is mainly because we studied the whole seasonal cycle from a wider perspective and focused on comparing the similarities and differences in TCG over the two sub-basins. Thus, we acquired and highlighted collaborative contributions from large-scale environmental factors. In addition, we revealed that TCG activity and related environmental factors are markedly different between the BOB and AS during the post-monsoon season, which may be closely related to the vertical circulation over these basins. This is very interesting and needs further analysis in the future.


