
Dynamic of Particulate Matter for Quotidian Aerosol Sources in Indoor Air


1
Physics Department, Faculty of Science, Minia University, Minia 61519, Egypt
2
Experimental Physics Department, Physics and Technology Institute, Ural Federal University, Mira Street 19, 620002 Ekaterinburg, Russia
3
Institute of Industrial Ecology UB RAS, Sophy Kovalevskoy Street 20, 620990 Ekaterinburg, Russia
*
Authors to whom correspondence should be addressed.
Atmosphere 2021, 12(12), 1682; https://0-doi-org.brum.beds.ac.uk/10.3390/atmos12121682
Submission received: 20 October 2021
/
Revised: 8 December 2021
/
Accepted: 9 December 2021
/
Published: 15 December 2021
(This article belongs to the Special Issue Bioaerosols: Composition, Meteorological Impact, and Transport)
Abstract
:A correlation between the mass concentration of particulate matter (PM) and the occurrence of health-related problems or diseases has been confirmed by several studies. However, little is known about indoor PM concentrations, their associated risks or their impact on health. In this work, the PM1, PM2.5 and PM10 produced by different indoor aerosol sources (candles, cooking, electronic cigarettes, tobacco cigarettes, mosquito coils and incense) are studied. The purpose is to quantify the emission characteristics of different indoor particle sources. The mass concentration, the numerical concentration, and the size distribution of PM from various sources were determined in an examination room 65 m3 in volume. Sub-micrometer particles and approximations of PM1, PM2.5 and PM10 concentrations were measured simultaneously using a diffusion aerosol spectrometer (DAS). The ultrafine particle concentration for the studied indoor aerosol sources was approximately 7 × 10⁴ particles/cm3 (incense, mosquito coils and electronic cigarettes), 1.2 × 10⁵ particles/cm3 for candles and cooking and 2.7 × 10⁵ particles/cm3 for tobacco cigarettes. The results indicate that electronic cigarettes can raise indoor PM2.5 levels more than 100 times. PM1 concentrations can be nearly 55 and 30 times higher than the background level during electronic cigarette usage and tobacco cigarette burning, respectively. It is necessary to study the evaluation of indoor PM, assess the toxic potential of internal molecules and develop and test strategies to ensure the improvement of indoor air quality.
1. Introduction
Over the past two decades, several epidemiological and clinical studies have been conducted that indicate a relationship between exposure to particulate matter (PM) and numerous health effects [1,2,3,4,5,6,7,8,9,10,11,12,13,14,15,16,17]. PM exposure mostly occurs indoors, as people spend a major part of their lives indoors at home or the workplace (approximately 90%) [16,18].
Increases in PM exposure predominantly led to increased hospitalization, especially in the elderly and individuals with heart and lung problems. Not only long-term, but also short-term exposure to fine PM air pollution increases the risk of myocardial infarctions [19,20,21,22,23,24,25], lung disease [26,27,28] and strokes [29,30,31,32,33].
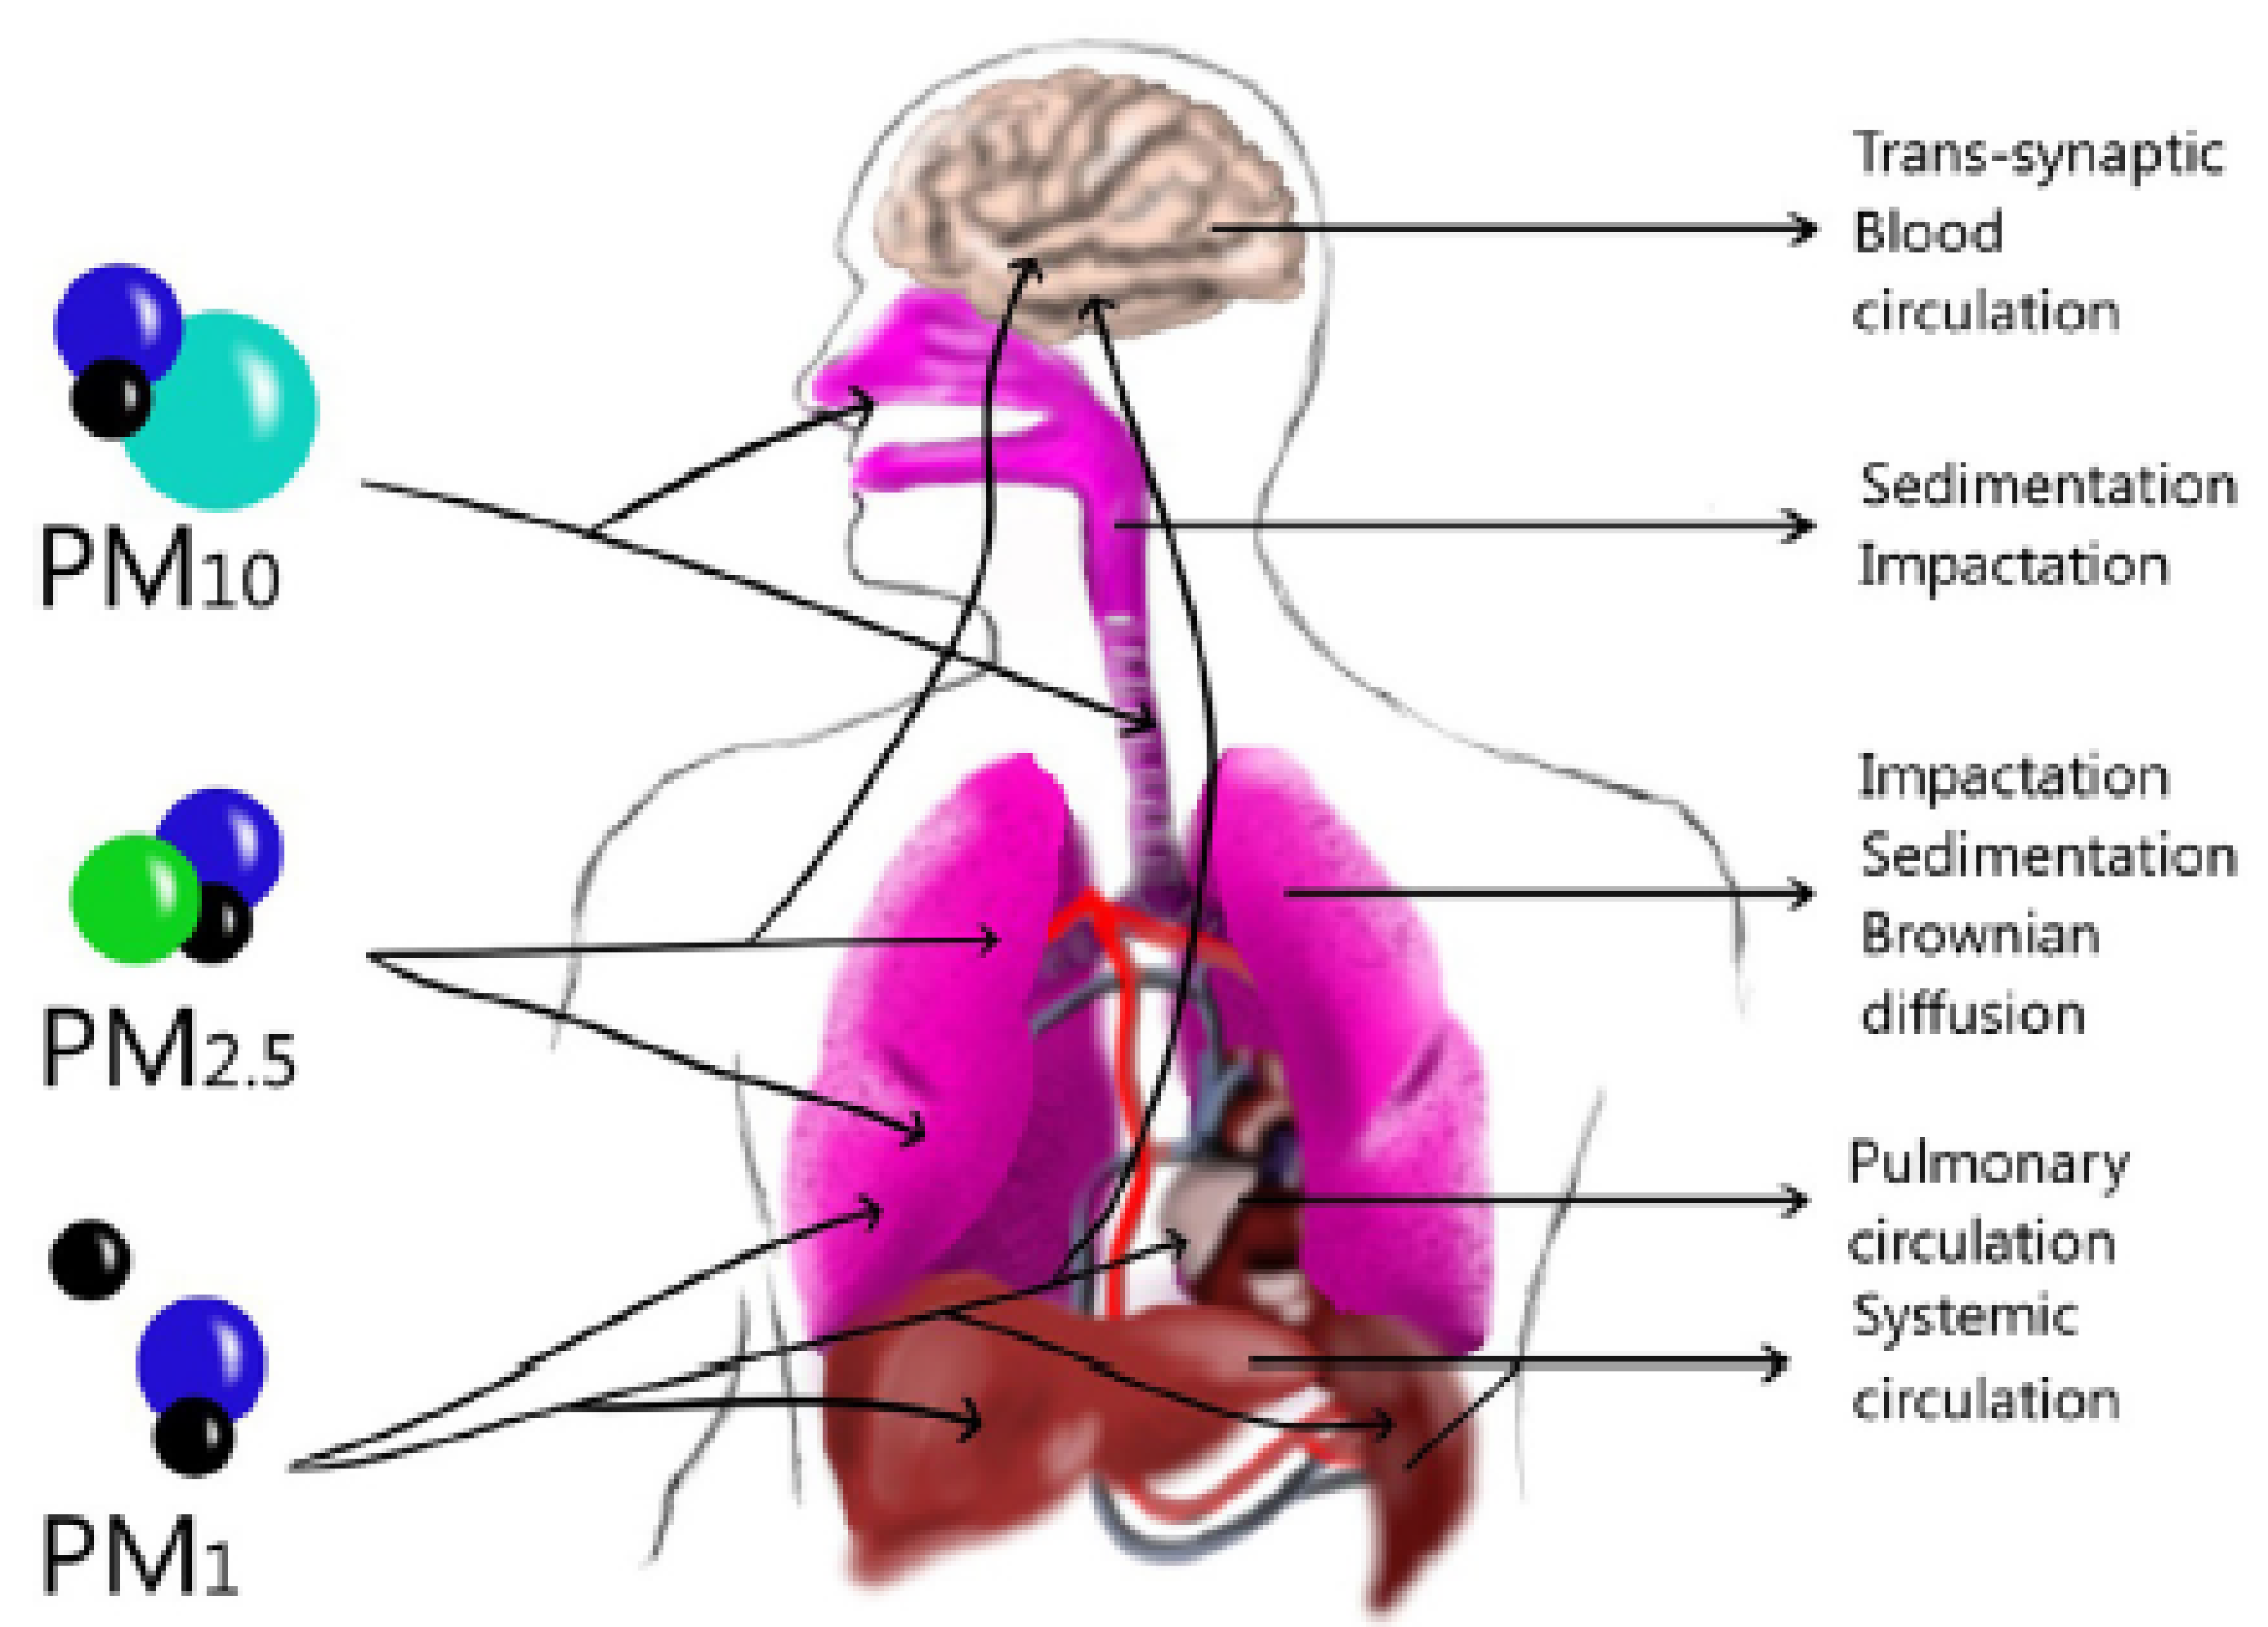
With a confirmed negative impact on human health, scientists divided particles into fine (diameter >100 nm) and ultrafine particles (diameter <100 nm). Ultrafine particles can penetrate deep into the respiratory system and even cross biological barriers, leading to harmful health effects due to their small size [34,35,36,37,38,39,40,41,42,43,44,45,46,47,48]. Therefore, a precise characterization of multiple parameters for fine and ultrafine particles is required [42,49]. Indeed, it has been reported that number concentration may be a better indicator of exposure than mass concentration [46,50]. Moreover, it has been reported that the biological effects of ultrafine particles are more clearly related to the surface area of the particles than to their mass [36,37]. Therefore, potential health effect assessments urgently need to evaluate the indoor exposure associated with a specific source emission using several complementary measures (number, mass, surface distribution, volume, and chemical composition). The dynamics of PM in the lungs and others tissues of the respiratory system are shown in Figure 1 [15].
In recent years, concerns over indoor air quality have significantly increased due to the recognition of different pollutants produced by various external and internal sources. These sources depend on the procedures operating within the environment [51]. The US Environmental Protection Agency (USEPA) put indoor air pollution onto its list of top five environmental hazards [52]. Singh et al. (2014) confirm that long-term exposure to resident pollutants in indoor air is the cause of diseases related to respiratory and cardiovascular issues, and even potentially carcinogenesis [53].
The characterization of particle size distribution is not only useful in determining the lung deposition of molecules on a regional level, but also for examining the distribution of the sources of internal aerosols via receptor modeling methods [28,54]. In an indoor environment, both indoor and outdoor sources contribute to PM levels. However, many PM measurements have been made outdoors: few data are available on indoor air pollution [55].
PM indoors is affected by ambient concentrations, air exchange rates, penetration factors and sedimentation and re-suspension mechanisms. There is a growing body of evidence linking ambient particulate air pollution from combustion sources to a harmful health outcome [1,56]. As people spend the majority of their time indoors, it is important to measure exposure to respirable particulates from indoor combustion sources, an important step towards assessing their role in health outcomes.
The main indoor sources are combustion processes producing smaller particles, the vast majority of which fall into the sub-micrometer zone and consist of organic and inorganic materials [57]. In this delicate and complex environment, activities such as cooking, cleaning, walking and especially smoking are the main sources of particles indoors. Numerous studies have identified a large number of indoor particle sources, and the emissions from these sources have been investigated. The most significant sources include cooking, smoking, heating and burning incense [28,54]. The smoking of cigarettes [58] causes PM to form indoors [8]. Kankaria et al. (2014) examined ultrafine particle concentrations in seven residences in Northern California: their results indicate that cooking was the most significant internal activity contributing to the ultrafine particle level within the buildings. They also conclude that smoke from combustion causes the release of particulate matter, which poses a broader health risk when inhaled [13].
In general, exposure to aerosols through inhalation is of the utmost significance, as it is a major potential source of risk to human health. This depends on airborne concentrations, duration of exposure and chemical composition. Therefore, it is quite important to measure concentrations of PM in the size fractions known to affect human health [59]. The quantitative evaluation of the properties of indoor emissions in real situations is a complex task, and therefore, only qualitative information is available on the contribution of many sources of indoor particles to health problems or about the ranges of the PM levels resulting from such sources indoors.
Particulate Matter (PM2.5/10) Health Effects
The main health impacts include premature deaths, respiratory and cardiovascular diseases and changes in lung function [7,13,60]. Inhaled particles that can reach the lower airways are classified into three categories by size: PM10 (diameter ≤ 10 μm), PM2.5 (diameter ≤ 2.5 μm) and PM1 (diameter ≤ 1 μm). Air particulates are generally classified by how deep they penetrate into the human respiratory system. Particles smaller than 2.5 microns (PM2.5) are known as fine particles, and they pose the greatest health risks because they can enter the deepest parts of the human respiratory system and lead to harmful health effects. Particles larger than 2.5 microns but smaller than 10 microns (PM10) in size are known as coarse particles; these are too large to enter the human respiratory system, but prolonged exposure can lead to respiratory disease. Short-term exposure has major implications for respiratory health, but, in terms of mortality, PM2.5 is a greater risk than PM10. Studies have shown that with a 10 μg/m3 increase in PM10 concentration indoors, cardiovascular deaths increased by 0.36% and respiratory deaths by 0.42%. Likewise, with an increase of 10 μg/m3 in the indoor PM2.5 concentration, cardiovascular deaths increased by 0.63% and respiratory mortality by 0.75% [60,61,62].
In most cases, the concentration and size play a role in determining the response after inhalation, in addition to the particle number concentration itself. However, the interpretation of ultrafine particle data, in terms of the surface area of the particles, leads to a dose response independent of the diameter of the particles in many cases [37,63]. A similar trend has been observed in the diameters of larger particles [64], indicating that the low solubility particles that characterize exposure, in terms of surface area, will result in more appropriate exposure limits and evaluation methods [65,66].
Therefore, the aim in the present study is to simultaneously evaluate PM1, PM2.5 and PM10 suspended particles from different indoor aerosol sources (cooking, burning candles, regular and electronic cigarette smoking, incense and coils for protection against insects) in terms of their numerical concentration, mass concentration and surface area. This will deepen our knowledge of indoor air quality.
2. Materials and Methods
The sources were tested in a room with a volume of 65 m3. The room temperature during the experiments ranged from 22 to 25 °C with a relative humidity of 40–50%. A diffusion aerosol spectrometer (DAS) was used to monitor mass concentrations continuously before the aerosol source was turned on (BG), during the time it was on and at intervals after it was switched off. The technical design and the description of the DAS (Model 2702 M) are presented in previous works [43,44,45,46,47,48].
Using the DAS, aerosol particle parameters such as numerical concentration, various PM concentrations (PM1, PM2.5 and PM10), average particle surface area and metrological parameters (temperature, humidity, and pressure) were recorded and automatically saved every ~2 min. An electronic unit controlled the spectrometer operations, processing, calculation, display of the measured results and storing data. The data was transferred from the DAS to another computer via a USB interface. The output files were EXCEL files containing the measured data. The specific surface area of aerosol particles was calculated from the numerical distribution of particles by diameter, under the assumption that the aerosol particle is spherical.
Aerosol Sources
Some of the most widely used indoor aerosol sources are presented in Table 1. Six sources were used (candles, cooking, electronic cigarettes, tobacco cigarettes, mosquito coils and incense). Throughout most of the experiments, the sources were active until the concentration seemed to stabilize. The source was then removed or deactivated, and the subsequent decrease in concentration was studied. Four candles were lit indoors until the concentration of aerosol particles was stable. After burning the candles for 40 min, they were extinguished with a damp cloth. After stopping burning, the candles were not removed from the room. The different aerosol sources were placed in the center of the room at 3 m from the DAS.
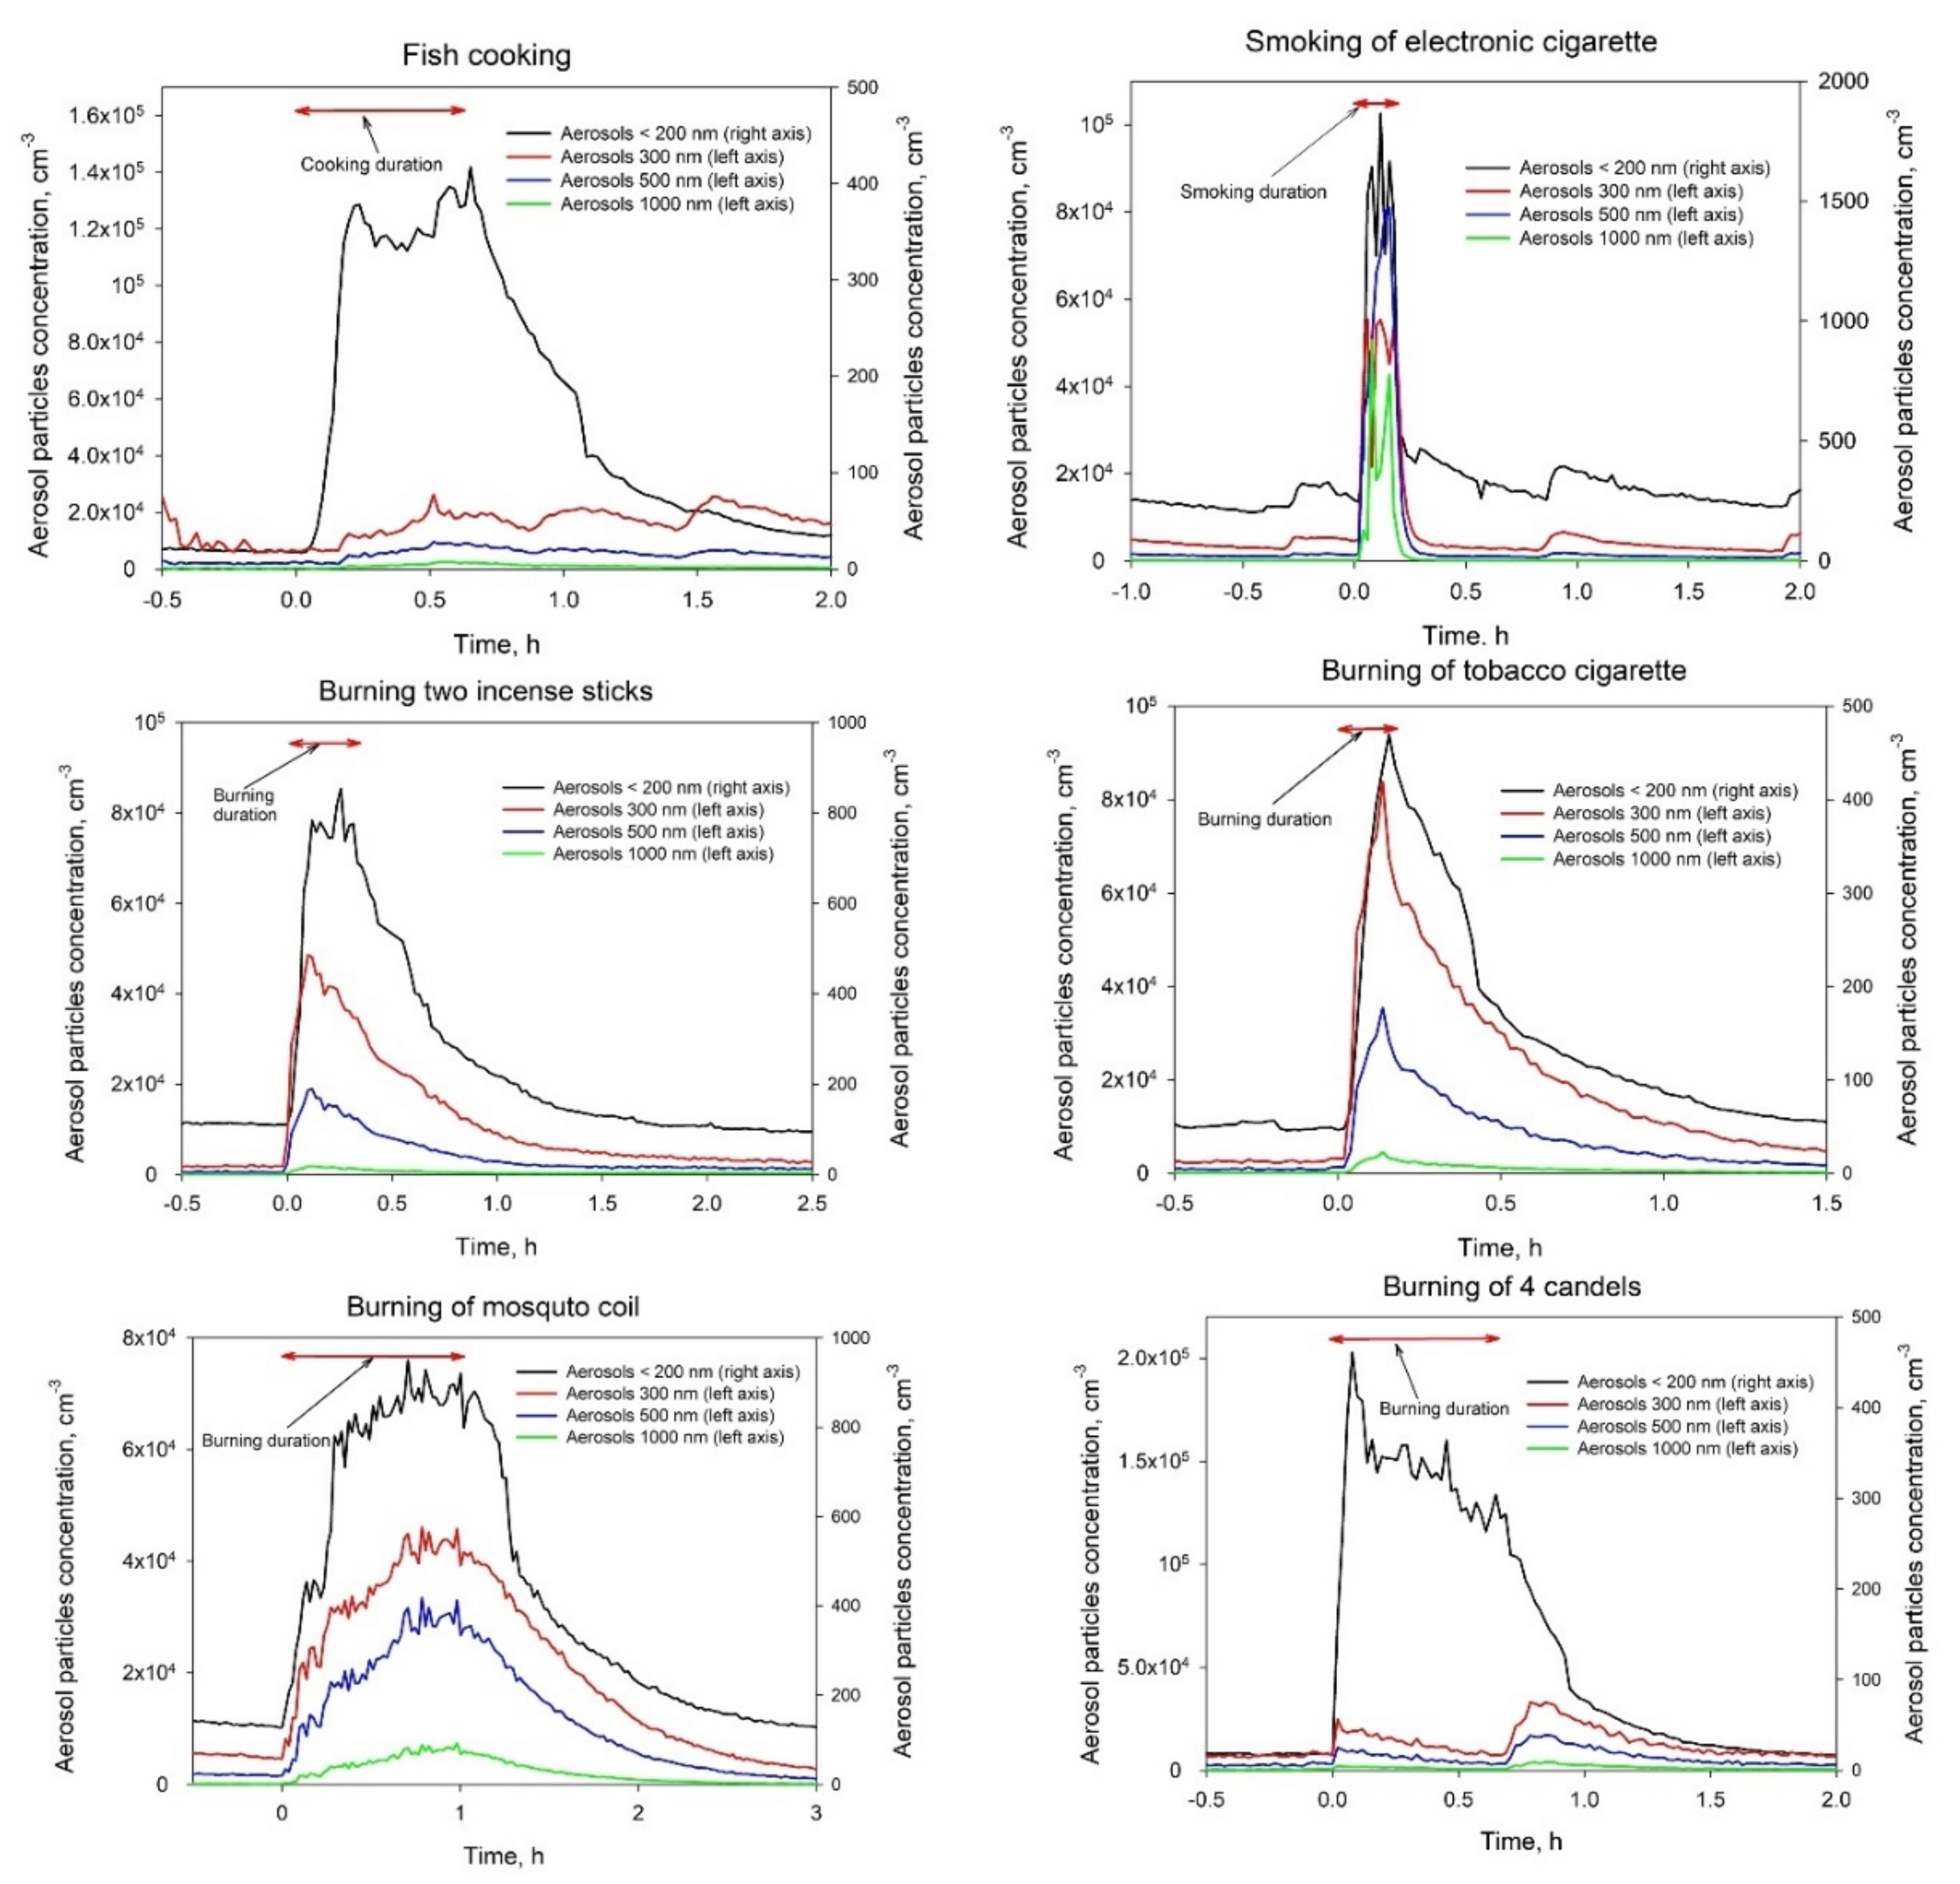
Figure 2 presents the level of particle concentration created from six different aerosol sources (cooking fish, electronic cigarettes, incense sticks, tobacco cigarettes, mosquito coils and candles) with different burning/functioning times. The sources were active until the concentration appeared to have stabilized. Cooking and burning candles produced the maximum concentration of ultrafine particles (<200 nm), approximately 1.2 × 10⁵ particles/cm3. The mosquito coil produced the minimum concentration, ~7 × 10⁴ particles/cm3. For 300 nm particles, the number concentration ranges from 50 to 800 particles/cm3. The number concentrations for particles with diameters of 500 and 1000 nm ranged from 20 to 1400 particles/cm3 and 5–700 particles/cm3, respectively, for different sources. It was observed that the electronic cigarette produced the highest concentration of fine particles; the burning candles produced the lowest. For the incense sticks, tobacco cigarettes, and electronic cigarette, the fine and ultrafine particle fractions reached their maximum the moment they were extinguished. As for mosquito coils, this only happens with the fine particles. The situation for the candles was different, as the fine particles began to increase when they stopped burning. For cooking, there is no noticeable change in terms of the fine particles: only the ultrafine particles increased and slowly deceased after the stove was turned off.
3. Results
The ultrafine particle (UFP) numerical concentrations of the six different indoor aerosol sources (candles, cooking, electronic cigarettes, tobacco cigarettes, mosquito coils and incense) are presented in Figure 3.
From Figure 3, it appears that the particulate matter concentration from incense, candles and tobacco cigarettes achieved the highest level at the end of the burning period, unlike the other sources (cooking, electronic cigarettes, and mosquito coils), which achieved this value five minutes after stopping the sources. The highest initial particle concentration was emitted by the combustion of the tobacco cigarette, but it also had a faster decline rate directly after combustion ceased. In general, the particle concentration decrease is due to various particle loss processes, including air exchange, particle filtering, deposition and coagulation [67,68,69]. Earlier published studies indicate that major indoor UFP sources include combustion due to cigarette smoking, candle burning and incense [7,8,70,71].
The particles from cooking achieved their maximum numerical concentration 5 min after the process was ended. The rate of particle removal was low: after 30 min, only half of the particles were removed. For other sources, the particle number concentration was nearly back to background levels after 30 min. This may be due to the nature of cooking particles, which are a combination of different materials evaporated with water vapor and have a low interaction cross section with surrounding particles in the air indoors [28,72]. The other sources emit particles, which quickly react with suspended aerosol particles when indoors.
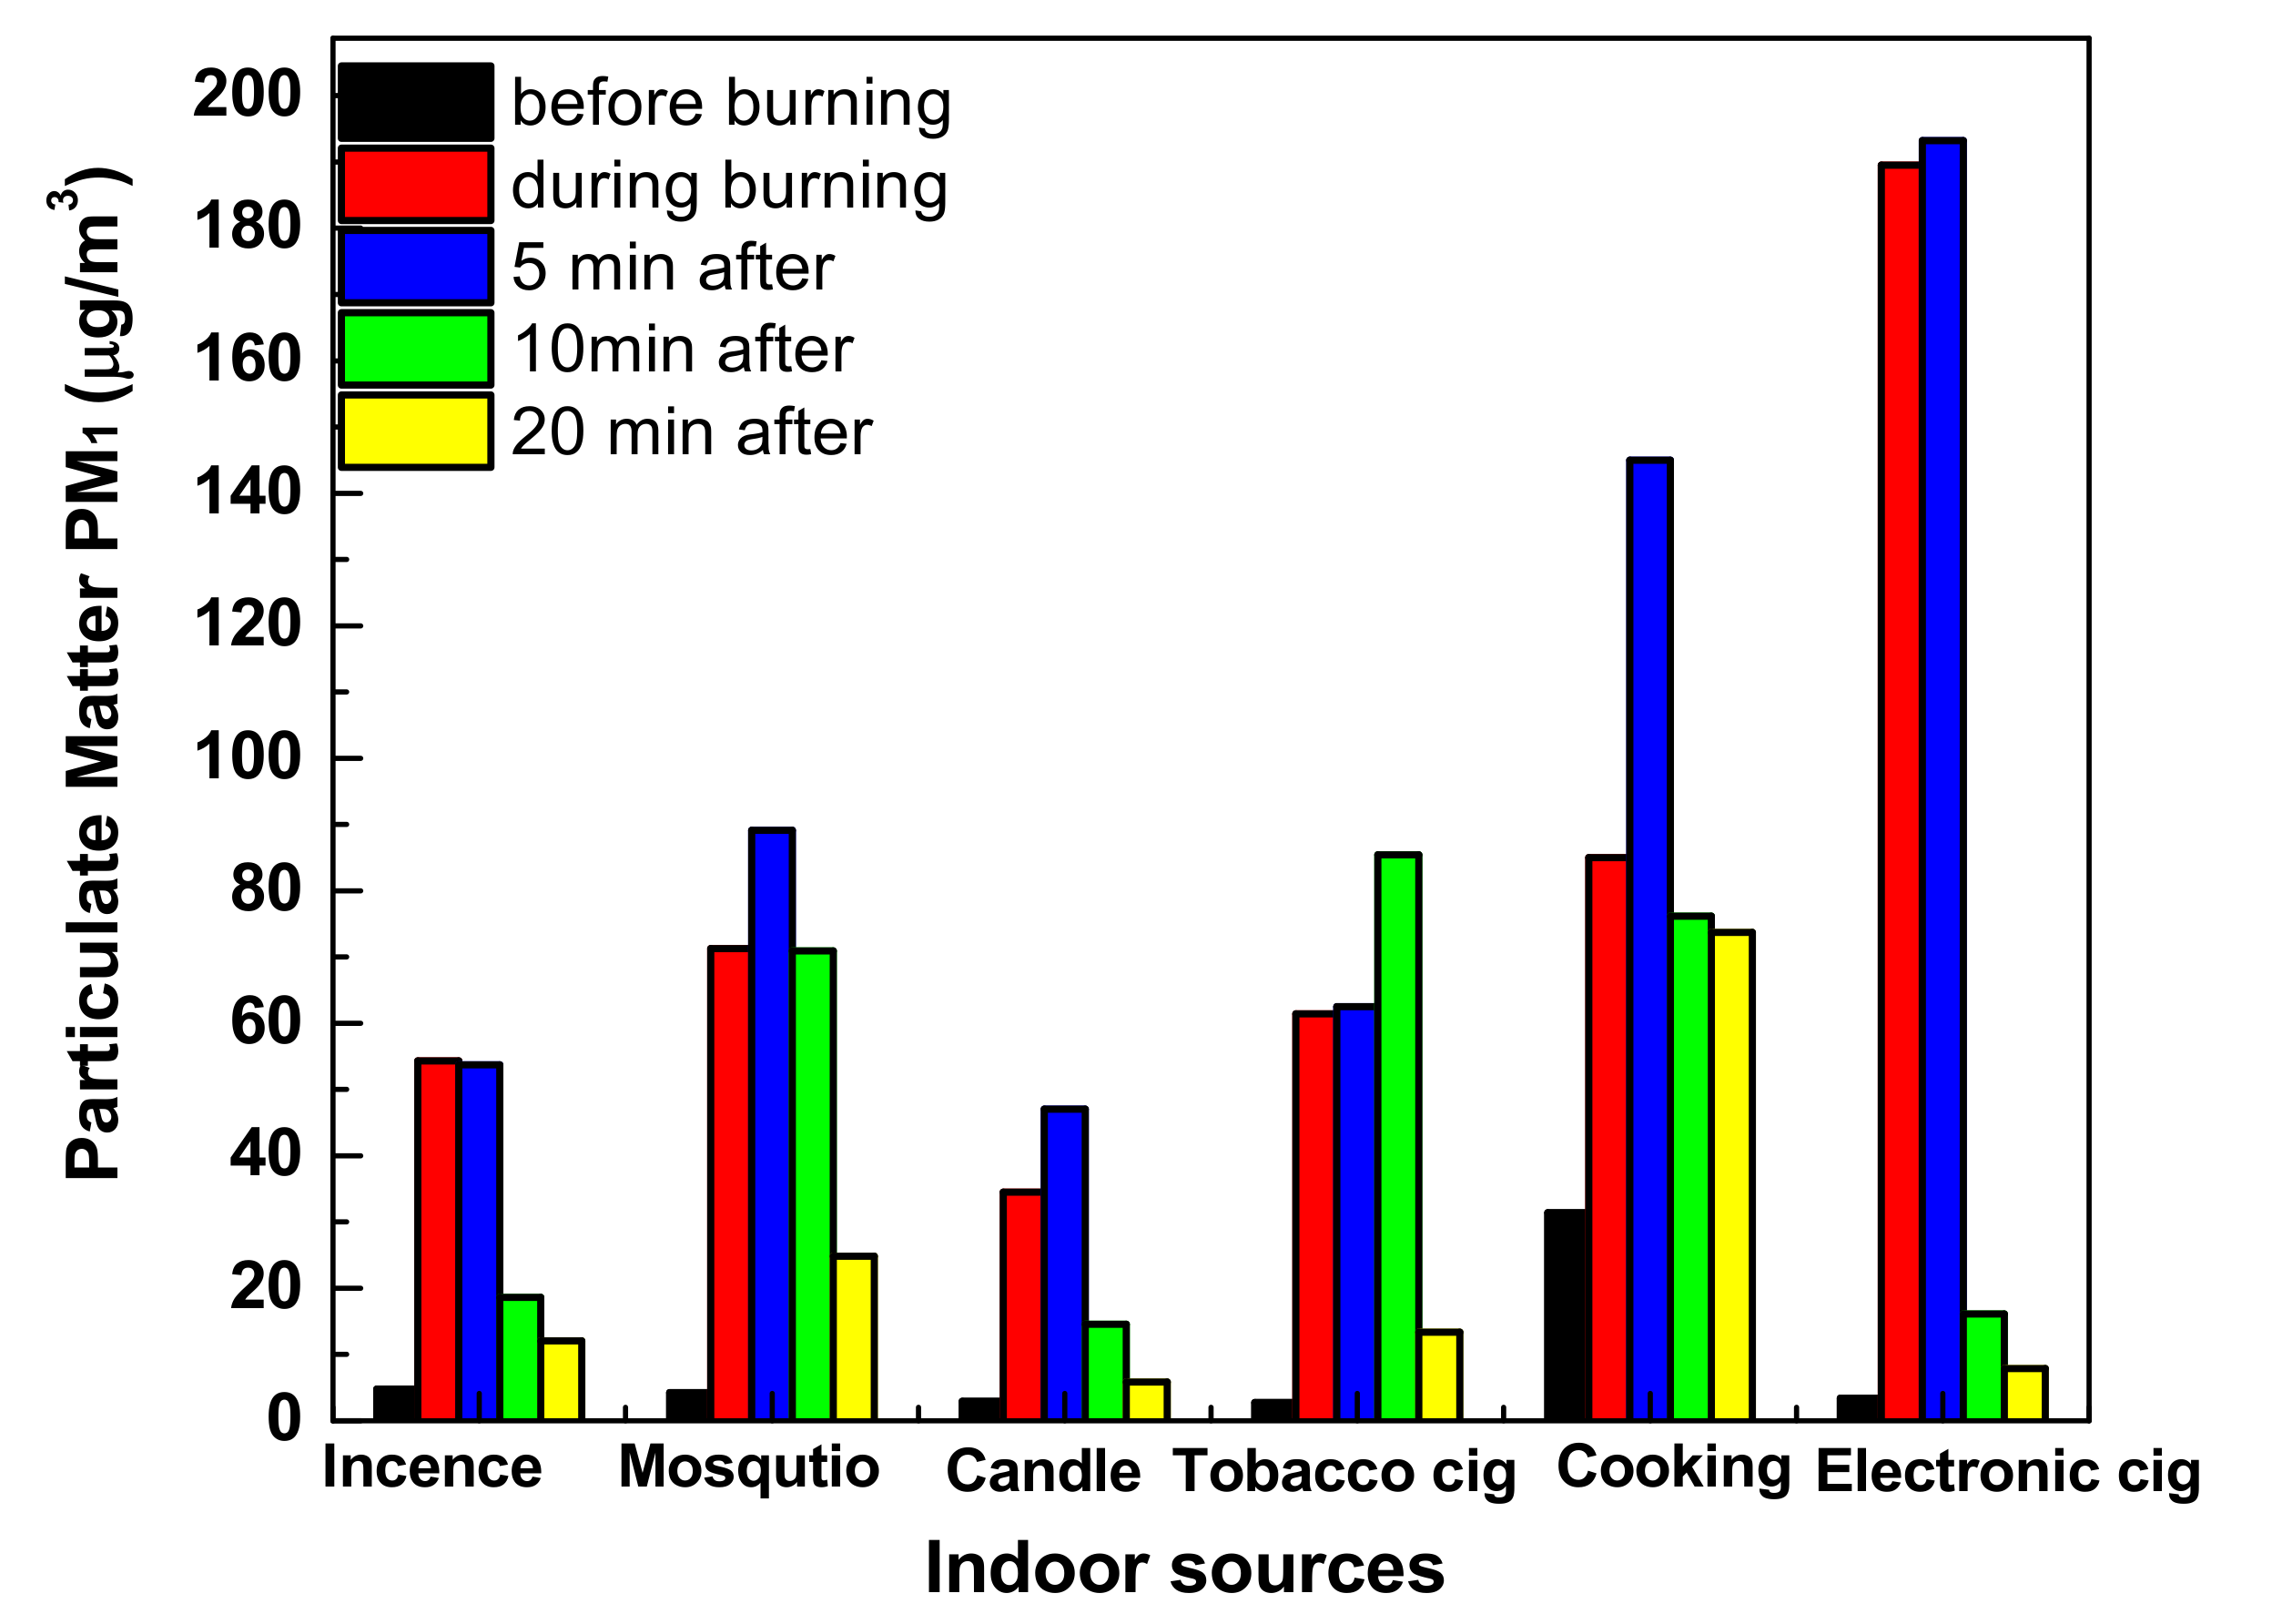
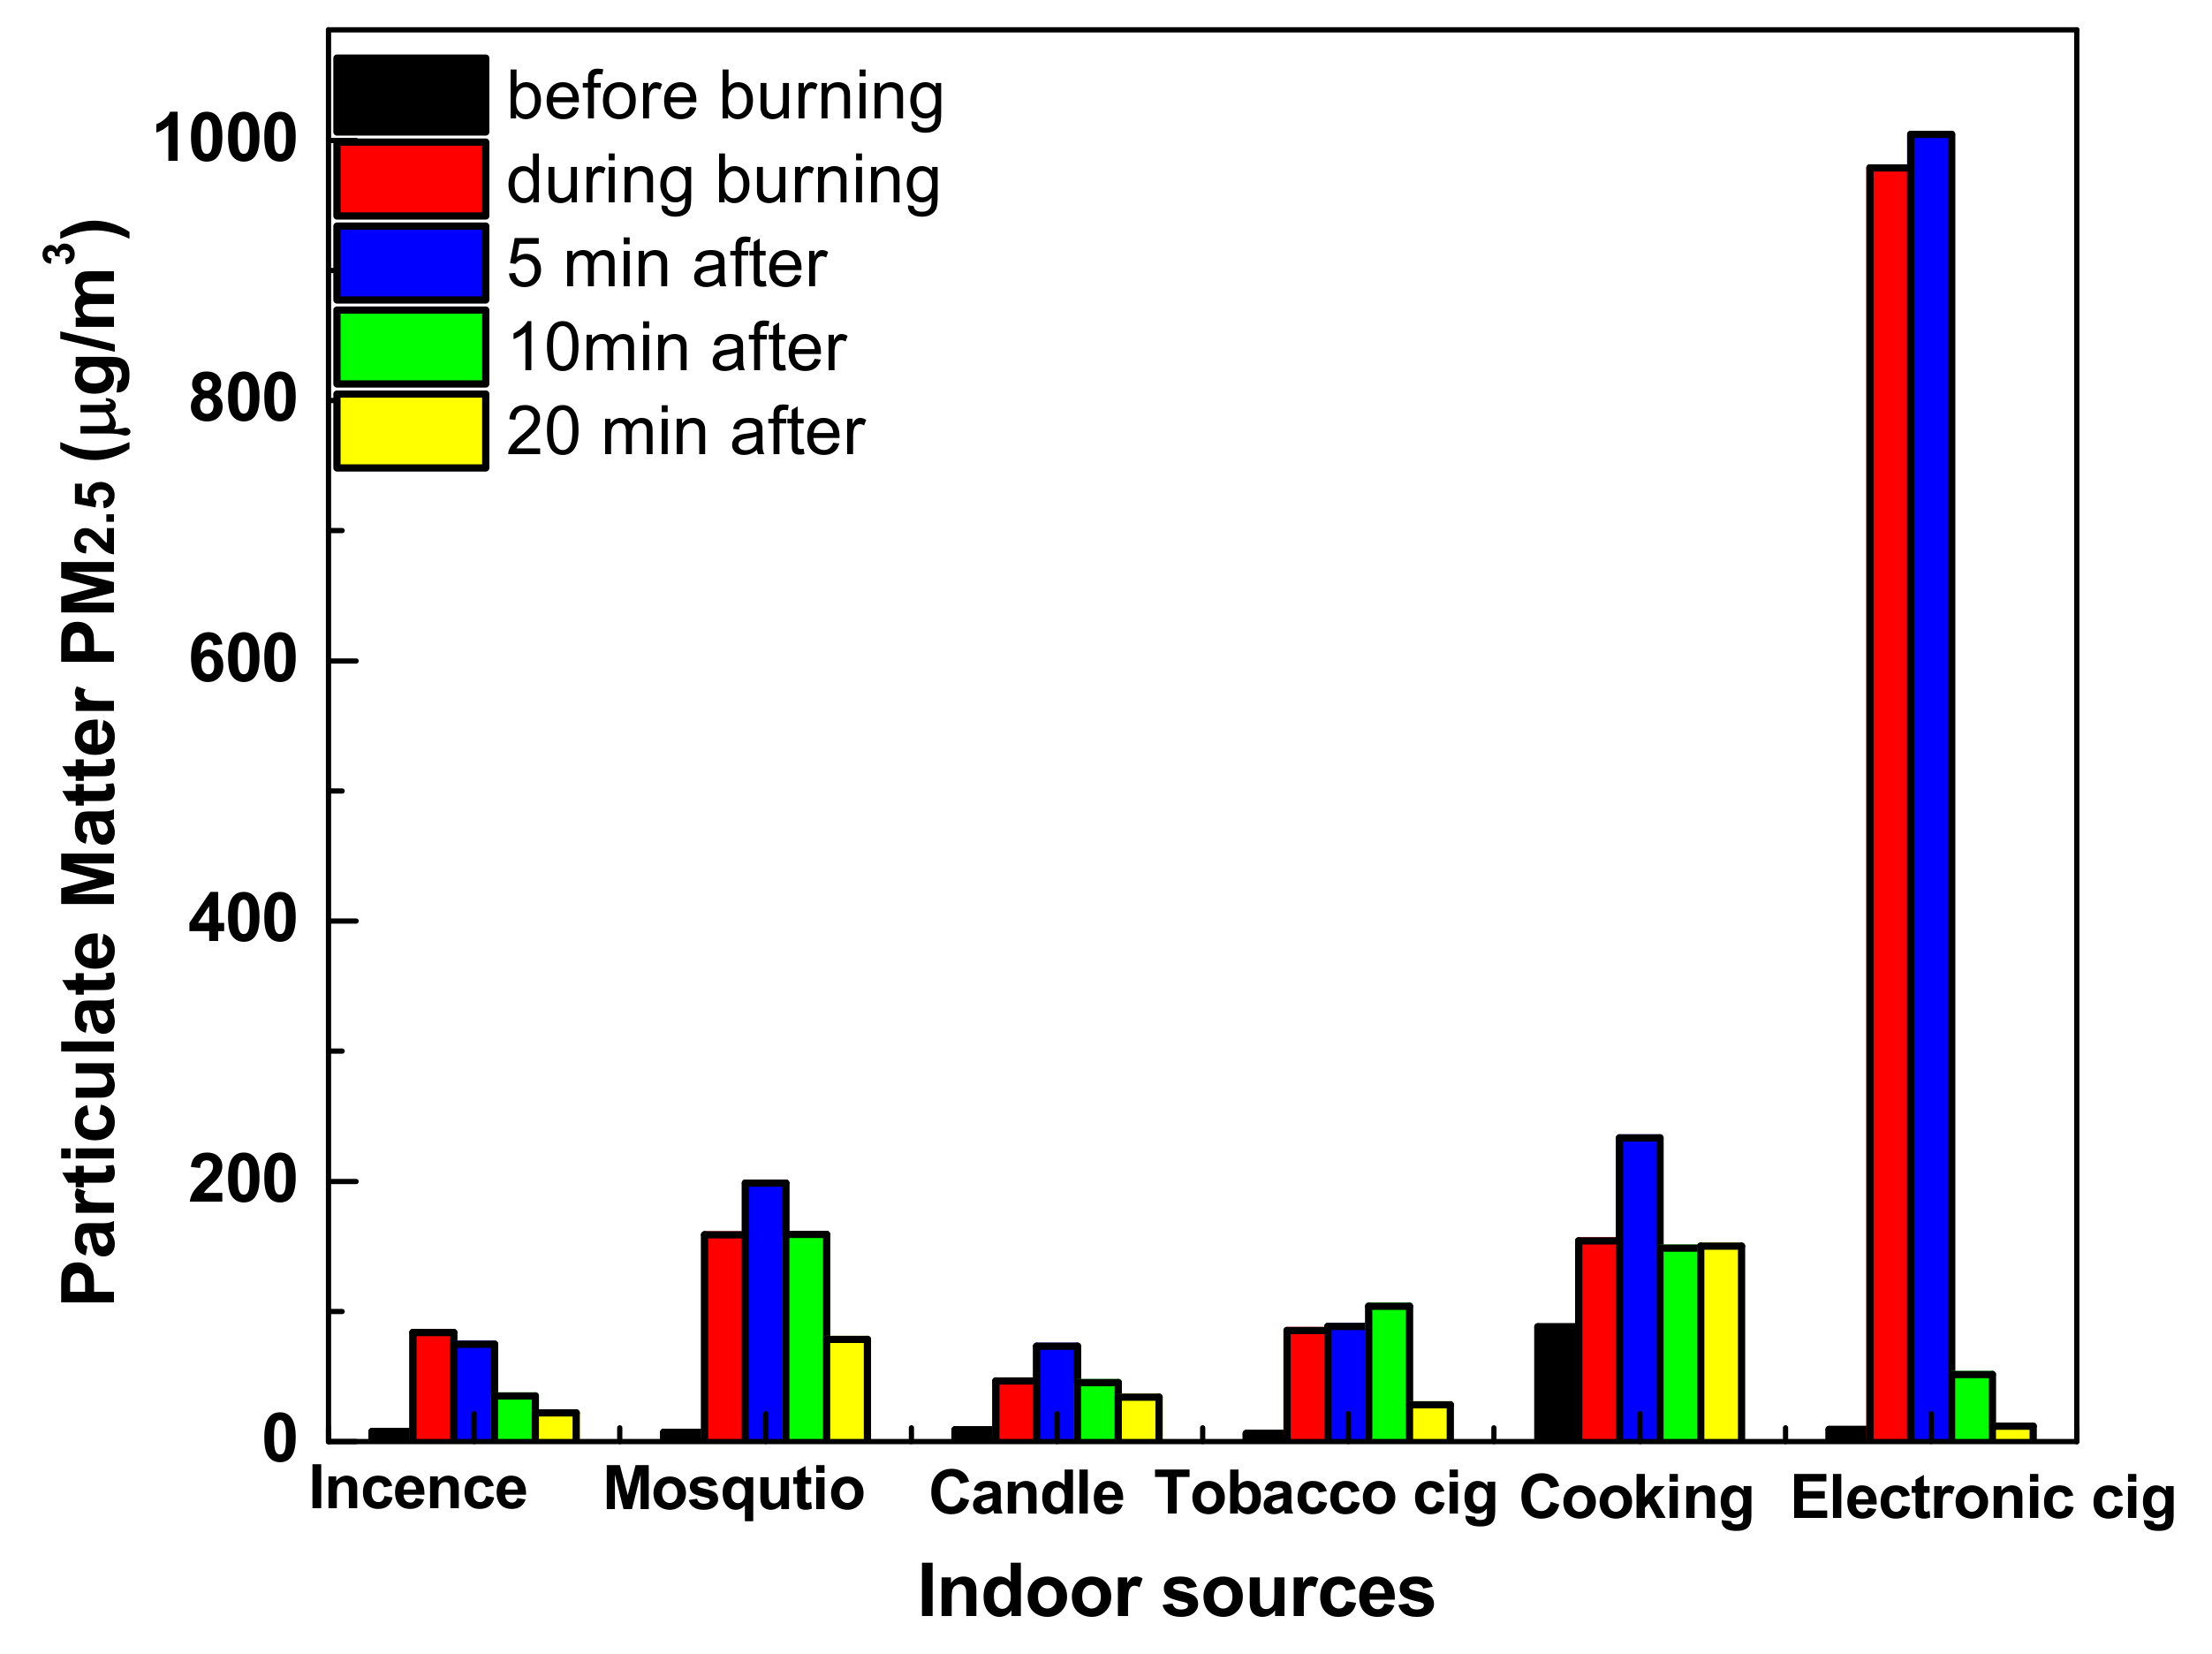
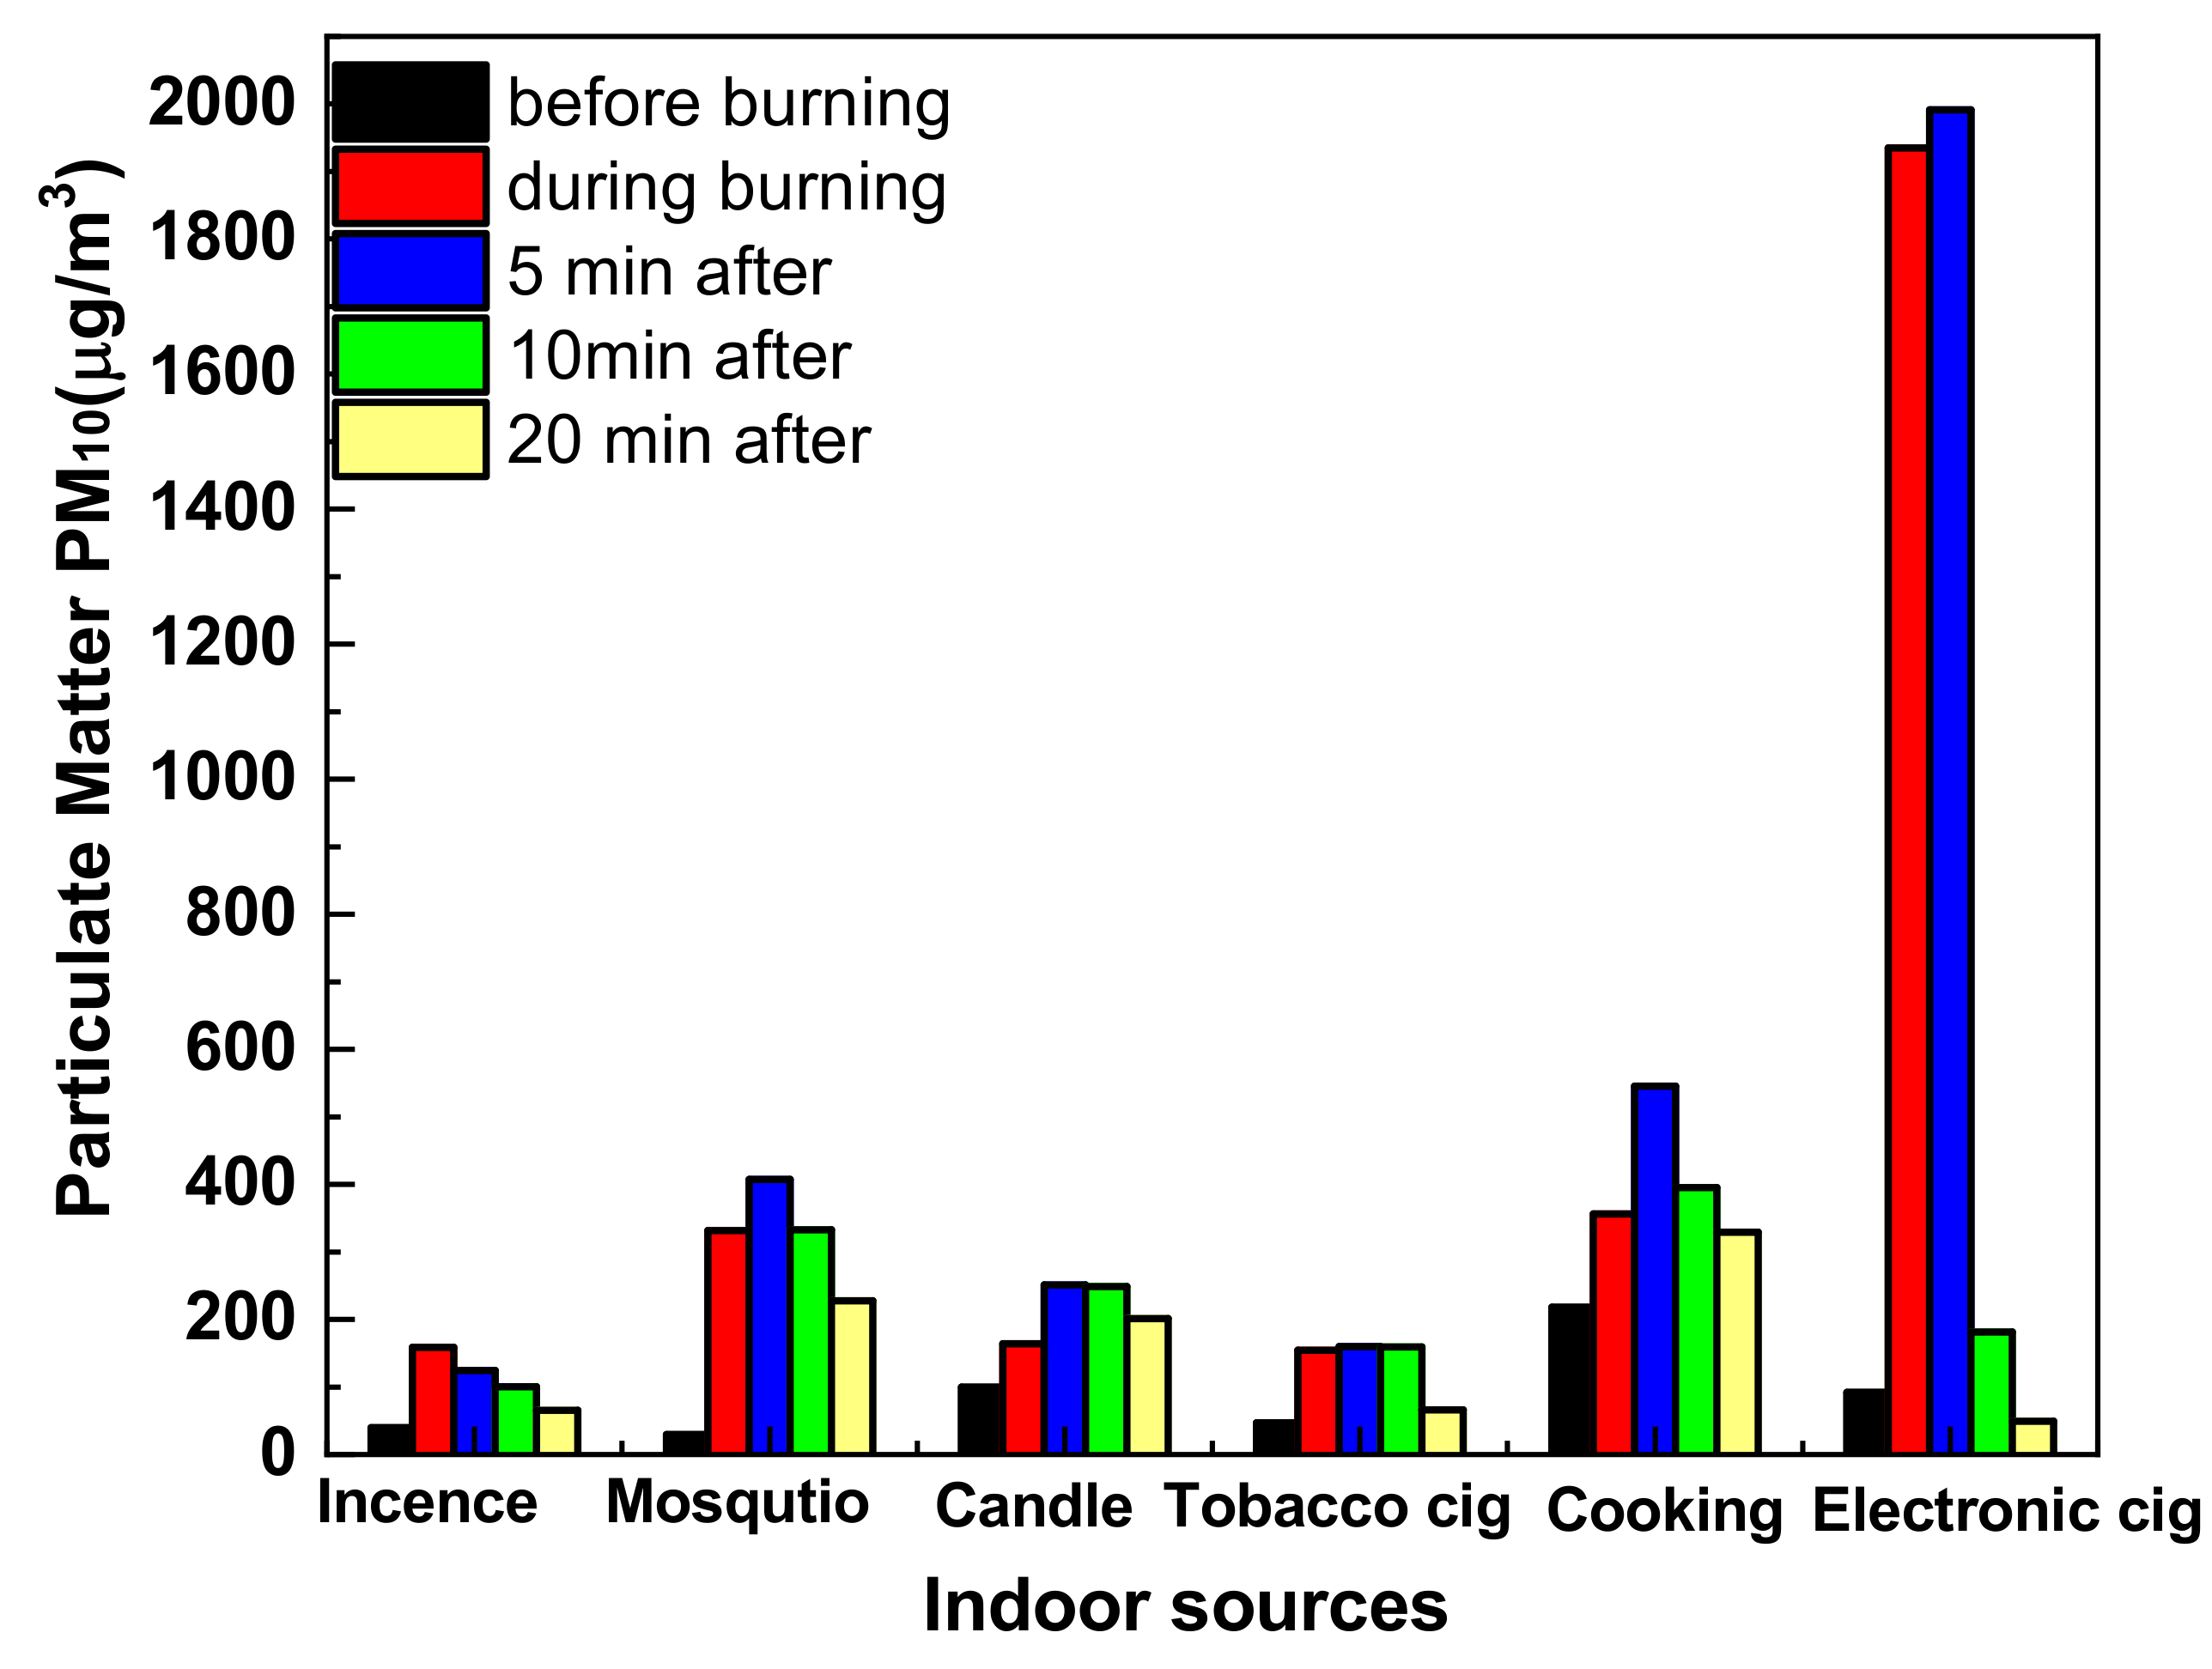
As shown in Figure 4, Figure 5 and Figure 6, the highest mass concentrations for PM1.0, PM2.5 and PM10 were recorded for the electronic cigarettes (or, more precisely, for 5 min after switching off the source). These mass concentrations dispersed very quickly after switching off the source, within only 5 min (unlike cooking, which produced PM concentrations that remained for longer). In the present study, the electronic cigarettes raised the indoor PM2.5 level more than 100 times, while the PM1 and PM10 concentrations were nearly 55 times and 30 times higher than the background levels, respectively.
Comparing the present results regarding candles with other results in the literature, they agree. As shown in Figure 3 and Figure 4, candles are identified as a source of ultrafine particles. This fact is confirmed by [7,55,73]. Long (2000) and Ogulei (2006) present candles as major emitters of particles [74,75]. LaRosa et al. (2002), Sørensen et al. (2005) and Afshari et al. (2005) consider them to sbe major contributors to PM2.5 concentrations [76,77,78]. In the present study, the total numerical concentration for candles was 140,000 particles/cm−3 in a room 65 m3 in volume; however, the maximum numerical concentration emitted from two scented candles in a 32 m3 room was 69,000 particles/cm−3 [55].
4. Discussion
Two of the most significant indoor combustion activities and PM2.5 sources are environmental tobacco smoke (ETS) and food cooking [34,79,80]. In the present study, the PM2.5 indoor particle mass concentration was found to increase the background level 3 to 90 times during smoking and frying [81].
Incense burning, which is an incomplete combustion process, is known to emit fine and ultrafine particles in large quantities [42,82]. Incense burning leads to the production of particulate matter, out of which PM2.5 is the most released pollutant: this is more hazardous and causes adverse health effects [62]. The present average total numerical concentration for incense was 140,000 particles/cm−3; however, the maximum numerical concentration emitted from the three different types of incenses can range from 126 to 173 × 103 particles/cm−3 [83].
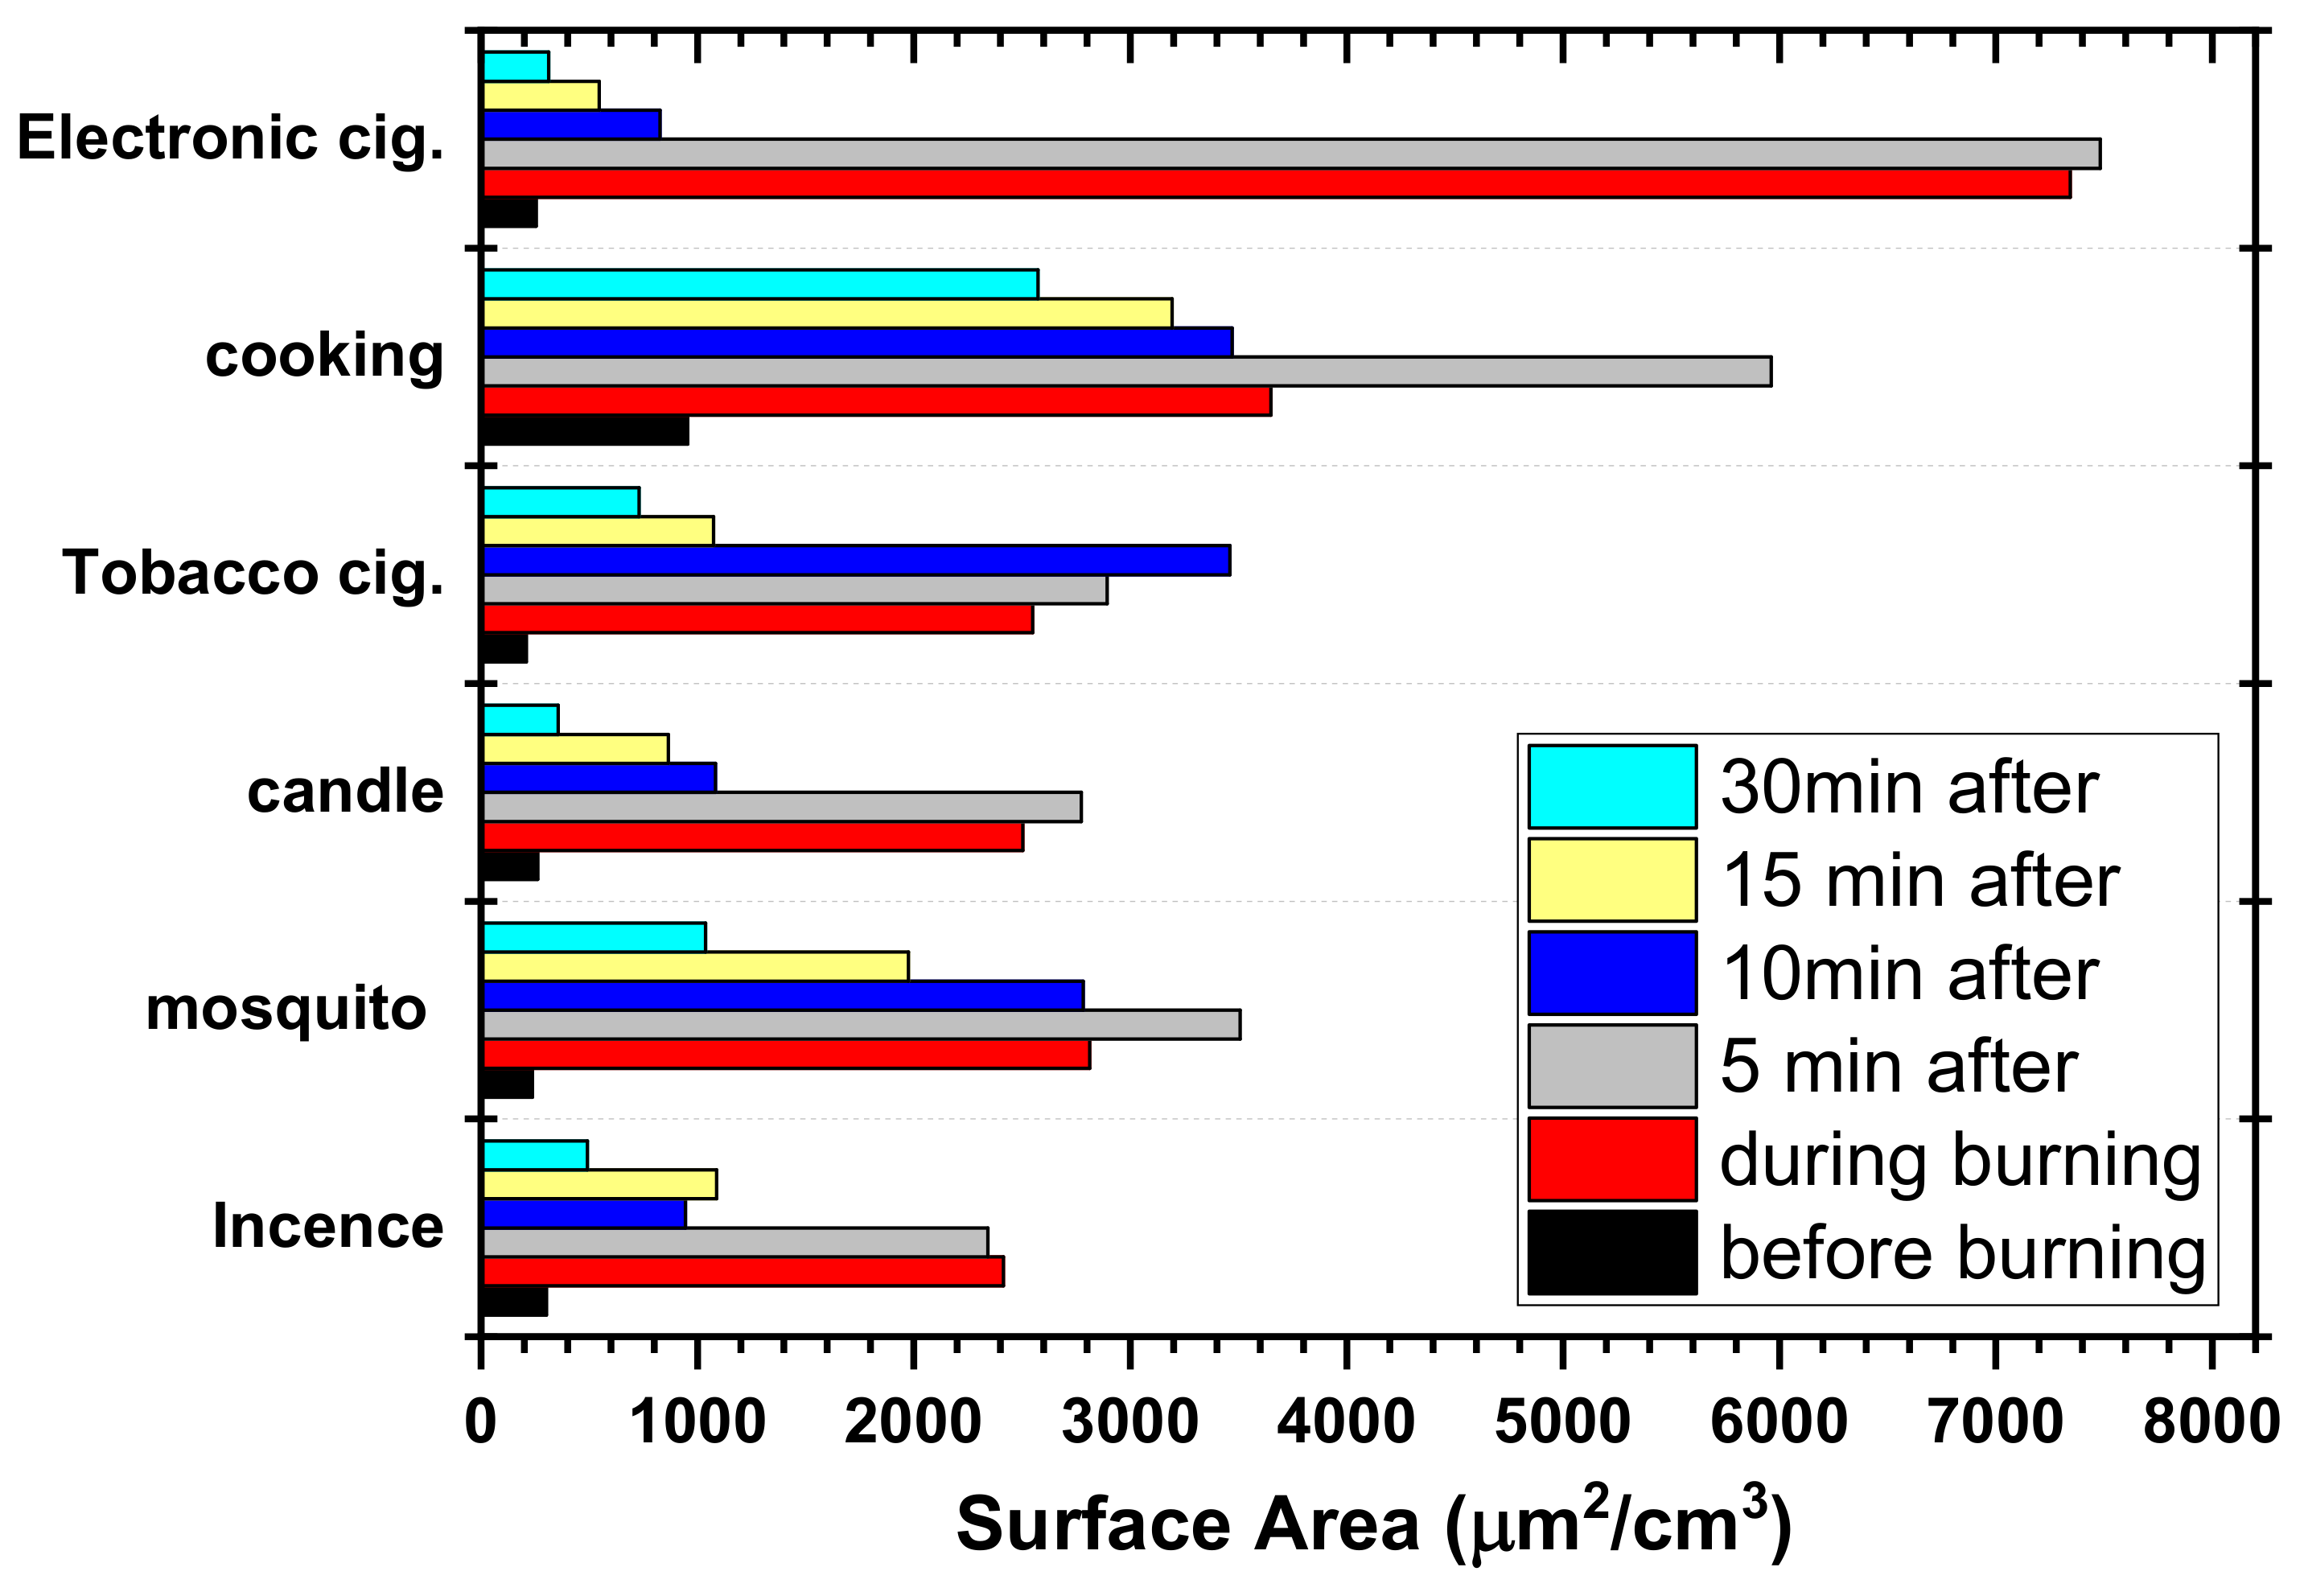
Since the electronic cigarettes emitted the highest numerical concentration and particulate matter concentration, it also achieved the highest result in terms of surface area, especially in the first five minutes after the device was turned off (see Figure 7). The difference in specific surface area is explained by the higher concentration of medium and small-sized aerosol particles in the smoke of an electronic cigarette (see Table 2).
Regarding the toxic effects of UFPs, the relatively high concentration of particles and a large surface area allow for a greater proportion of absorbed or condensed particles to enter into tissues and the bloodstream [71,85,86,87].
For indoor aerosol sources utilizing high temperatures, the aerosol mass concentration of particles varies during the operation of the source and after nearly 10 min of its termination. The maximum mass concentration of aerosol particles formed during the operation of household aerosol sources corresponds to a particle diameter of 2–5 microns [87].
5. Conclusions
The study suggests that the combustion of six different indoor sources (candles, cooking, electronic cigarettes, tobacco cigarettes, mosquito coils and incense) in an indoor environment emits quite high levels of respirable PM, which may accumulate and lead to prolonged exposure. Households should have better ventilation in order to avoid a buildup of PM. Residing in a place with such a high particulate concentration may lead to serious respiratory health concerns.
- The particulate matter concentration from incense, candles and tobacco cigarettes achieved the highest level at the end of the combustion period. The highest initial concentration of particles was emitted by the tobacco cigarettes.
- The highest concentrations of PM1, PM2.5 and PM10 were recorded for the electronic cigarettes.
- The study found that electronic cigarettes can raise indoor PM2.5 levels more than 100 times, while PM1 concentrations can be 55 and 30 times higher than the background level during the usage of electronic cigarettes and tobacco cigarettes, respectively.
Author Contributions
Conceptualization, M.Y.A.M. and M.V.Z.; methodology, H.N.B.K. and M.V.Z.; software, H.N.B.K.; validation, M.Y.A.M. and H.N.B.K.; formal analysis, M.Y.A.M. and H.N.B.K.; investigation, H.N.B.K. and M.Y.A.M.; resources, H.N.B.K.; data curation, M.Y.A.M.; writing—original draft preparation, H.N.B.K.; writing—review and editing, M.Y.A.M.; visualization, M.Y.A.M. and H.N.B.K.; supervision, M.V.Z.; project administration, M.Y.A.M.; funding acquisition, M.V.Z. All authors have read and agreed to the published version of the manuscript.
Funding
This research received no external funding.
Institutional Review Board Statement
Not applicable.
Informed Consent Statement
Not applicable.
Conflicts of Interest
The authors declare no conflict of interest.
References
- Dockery, D. Acute Respiratory Effects of Particulate Air Pollution. Annu. Rev. Public Health 1994, 15, 107–132. [Google Scholar] [CrossRef]
- Peters, A.; Goldstein, I.F.; Beyer, U.; Franke, K.; Heinrich, J.; Dockery, D.W.; Spengler, J.D.; Wichmann, H.E. Acute health effects of exposure to high levels of air pollution in eastern Europe. Am. J. Epidemiol. 1996, 144, 570–581. [Google Scholar] [CrossRef] [PubMed] [Green Version]
- Hiltermann, T.J.N.; Stolk, J.; Van Der Zee, S.C.; Brunekreef, B.; De Bruijne, C.R.; Fischer, P.H.; Ameling, C.B.; Sterk, P.J.; Hiemstra, P.S.; Van Bree, L. Asthma severity and susceptibility to air pollution. Eur. Respir. J. 1998, 11, 686–693. [Google Scholar] [CrossRef]
- Boezen, H.M.; Van Der Zee, S.C.; Postma, D.S.; Vonk, J.M.; Gerritsen, J.; Hoek, G.; Brunekreef, B.; Rijcken, B.; Schouten, J.P. Effects of ambient air pollution on upper and lower respiratory symptoms and peak expiratory flow in children. Lancet 1999, 353, 874–878. [Google Scholar] [CrossRef]
- Roemer, W.; Hoek, G.; Brunekreef, B.; Clench-Aas, J.; Forsberg, B.; Pekkanen, J.; Schutz, A. PM10 elemental composition and acute respiratory health effects in European children (PEACE project). Eur. Respir. J. 2000, 15, 553–559. [Google Scholar] [CrossRef] [PubMed] [Green Version]
- Pikhart, H.; Bobak, M.; Gorynski, P.; Wojtyniak, B.; Danova, J.; Celko, M.A.; Kriz, B.; Briggs, D.; Elliott, P. Outdoor sulphur dioxide and respiratory symptoms in Czech and Polish school children: A small-area study (SAVIAH). Int. Arch. Occup. Environ. Health 2001, 74, 574–578. [Google Scholar] [CrossRef]
- Hussein, T.; Glytsos, T.; Ondráček, J.; Dohányosová, P.; Ždímal, V.; Hämeri, K.; Lazaridis, M.; Smolík, J.; Kulmala, M. Particle size characterization and emission rates during indoor activities in a house. Atmos. Environ. 2006, 40, 4285–4307. [Google Scholar] [CrossRef]
- Fromme, H.; Twardella, D.; Dietrich, S.; Heitmann, D.; Schierl, R.; Liebl, B.; Rüden, H. Particulate matter in the indoor air of classrooms-exploratory results from Munich and surrounding area. Atmos. Environ. 2007, 41, 854–866. [Google Scholar] [CrossRef]
- Stranger, M.; Potgieter-vermaak, S.S.; Grieken, R. Van Particulate matter and gaseous pollutants in residences in Antwerp, Belgium. Sci. Total Environ. 2008, 407, 1182–1192. [Google Scholar] [CrossRef]
- Fuentes-Leonarte, V.; Tenías, J.M.; Ballester, F. Levels of pollutants in indoor air and respiratory health in preschool children: A systematic review. Pediatr. Pulmonol. 2009, 44, 231–243. [Google Scholar] [CrossRef] [PubMed]
- Strak, M.; Janssen, N.A.H.; Godri, K.J.; Gosens, I.; Mudway, I.S.; Cassee, F.R.; Lebret, E.; Kelly, F.J.; Harrison, R.M.; Brunekreef, B.; et al. Respiratory health effects of airborne particulate matter: The role of particle size, composition, and oxidative potential-the RAPTES project. Environ. Health Perspect. 2012, 120, 1183–1189. [Google Scholar] [CrossRef] [Green Version]
- Jacobs, L.; Buczynska, A.; Walgraeve, C.; Delcloo, A.; Potgieter-Vermaak, S.; Van Grieken, R.; Demeestere, K.; Dewulf, J.; Van Langenhove, H.; De Backer, H.; et al. Acute changes in pulse pressure in relation to constituents of particulate air pollution in elderly persons. Environ. Res. 2012, 117, 60–67. [Google Scholar] [CrossRef]
- Kankaria, A.; Nongkynrih, B.; Gupta, S.K. Indoor air pollution in India: Implications on health and its control. Indian J. Community Med. 2014, 39, 203–207. [Google Scholar] [CrossRef]
- Zwozdziak, A.; Sówka, I.; Willak-Janc, E.; Zwozdziak, J.; Kwiecińska, K.; Balińska-Miśkiewicz, W. Influence of PM1 and PM2.5 on lung function parameters in healthy schoolchildren—A panel study. Environ. Sci. Pollut. Res. 2016, 23, 23892–23901. [Google Scholar] [CrossRef]
- Falcon-Rodriguez, C.I.; Osornio-Vargas, A.R.; Sada-Ovalle, I.; Segura-Medina, P. Aeroparticles, composition, and lung diseases. Front. Immunol. 2016, 7, 1–9. [Google Scholar] [CrossRef] [PubMed] [Green Version]
- Morawska, L.; Ayoko, G.A.; Bae, G.N.; Buonanno, G.; Chao, C.Y.H.; Clifford, S.; Fu, S.C.; Hänninen, O.; He, C.; Isaxon, C.; et al. Airborne particles in indoor environment of homes, schools, offices and aged care facilities: The main routes of exposure. Environ. Int. 2017, 108, 75–83. [Google Scholar] [CrossRef] [PubMed]
- Khandelwal, N.; Tiwari, R.; Saini, R.; Taneja, A. Particulate and trace metal emission from mosquito coil and cigarette burning in environmental chamber. SN Appl. Sci. 2019, 1, 441. [Google Scholar] [CrossRef] [Green Version]
- Delgado-Saborit, J.M.; Aquilina, N.J.; Meddings, C.; Baker, S.; Harrison, R.M. Relationship of personal exposure to volatile organic compounds to home, work and fixed site outdoor concentrations. Sci. Total Environ. 2011, 409, 478–488. [Google Scholar] [CrossRef] [PubMed]
- Sen, T.; Astarcioglu, M.A.; Asarcikli, L.D.; Kilit, C.; Kafes, H.; Parspur, A.; Yaymaci, M.; Pinar, M.; Tüfekcioglu, O.; Amasyali, B. The effects of air pollution and weather conditions on the incidence of acute myocardial infarction. Am. J. Emerg. Med. 2016, 34, 449–454. [Google Scholar] [CrossRef]
- Nawrot, T.S.; Nemmar, A.; Nemery, B. Air pollution: To the heart of the matter. Eur. Heart J. 2006, 27, 2269–2271. [Google Scholar] [CrossRef] [PubMed]
- Nawrot, T.S.; Perez, L.; Künzli, N.; Munters, E.; Nemery, B. Public health importance of triggers of myocardial infarction: A comparative risk assessment. Lancet 2011, 377, 732–740. [Google Scholar] [CrossRef]
- Lee, L.V.; Foody, J.M. Preventive Cardiology. In Cardiology Secrets; Elsevier: Amsterdam, The Netherlands, 2010; pp. 321–325. [Google Scholar] [CrossRef]
- Adams, K.F. New England Journal Medicine. N. Engl. J. Med. 2009, 360, 2605–2615. [Google Scholar]
- Pope, C.A.; Muhlestein, J.B.; May, H.T.; Renlund, D.G.; Anderson, J.L.; Horne, B.D. Ischemic heart disease events triggered by short-term exposure to fine particulate air pollution. Circulation 2006, 114, 2443–2448. [Google Scholar] [CrossRef] [PubMed] [Green Version]
- Bhaskaran, K.; Hajat, S.; Haines, A.; Herrett, E.; Wilkinson, P.; Smeeth, L. Effects of air pollution on the incidence of myocardial infarction. Heart 2009, 95, 1746–1759. [Google Scholar] [CrossRef] [Green Version]
- Ciaula, A. Di Emergency visits and hospital admissions in aged people living close to a gas- fi red power plant. Eur. J. Intern. Med. 2012, 23, e53–e58. [Google Scholar] [CrossRef]
- Buczyńska, A.J.; Krata, A.; Van Grieken, R.; Brown, A.; Polezer, G.; De Wael, K.; Potgieter-Vermaak, S. Composition of PM2.5 and PM1 on high and low pollution event days and its relation to indoor air quality in a home for the elderly. Sci. Total Environ. 2014, 490, 134–143. [Google Scholar] [CrossRef] [PubMed]
- Vu, T.V.; Ondracek, J.; Zdímal, V.; Schwarz, J.; Delgado-saborit, J.M.; Harrison, R.M. Physical properties and lung deposition of particles emitted from five major indoor sources. Air Qual. Atmos. Health 2017, 10, 1–14. [Google Scholar] [CrossRef] [Green Version]
- Wellenius, G.A.; Schwartz, J.; Mittleman, M.A. Air pollution and hospital admissions for ischemic and hemorrhagic stroke among medicare beneficiaries. Stroke 2005, 36, 2549–2553. [Google Scholar] [CrossRef] [Green Version]
- Andersen, Z.J.; Olsen, T.S.; Andersen, K.K.; Loft, S.; Ketzel, M.; Raaschou-Nielsen, O. Association between short-term exposure to ultrafine particles and hospital admissions for stroke in Copenhagen, Denmark. Eur. Heart J. 2010, 31, 2034–2040. [Google Scholar] [CrossRef] [Green Version]
- Larrieu, S.; Jusot, J.F.; Blanchard, M.; Prouvost, H.; Declercq, C.; Fabre, P.; Pascal, L.; Le Tertre, A.; Wagner, V.; Rivière, S.; et al. Short term effects of air pollution on hospitalizations for cardiovascular diseases in eight French cities: The PSAS program. Sci. Total Environ. 2007, 387, 105–112. [Google Scholar] [CrossRef] [PubMed]
- Le Tertre, A.; Medina, S.; Samoli, E.; Forsberg, B.; Michelozzi, P.; Boumghar, A.; Vonk, J.M.; Bellini, A.; Atkinson, R.; Ayres, J.G.; et al. Medina; Samoli; Forsberg; Michelozzi; Boumghar; Vonk; Bellini; Atkinson; Ayres; et al. Short-term effects of particulate air pollution on cardiovascular diseases in eight European cities. J. Epidemiol. Commun. Heath 2002, 56, 773–779. [Google Scholar] [CrossRef]
- Langrish, J.P.; Bosson, J.; Unosson, J.; Muala, A.; Newby, D.E.; Mills, N.L.; Blomberg, A.; Sandström, T. Cardiovascular effects of particulate air pollution exposure: Time course and underlying mechanisms. J. Intern. Med. 2012, 272, 224–239. [Google Scholar] [CrossRef] [PubMed]
- Brauer, M.; Hirtle, R.; Lang, B.; Ott, W. Assessment of indoor fine aerosol contributions from environmental tobacco smoke and cooking with a portable nephelometer. J. Expo. Anal. Environ. Epidemiol. 2000, 10, 136–144. [Google Scholar] [CrossRef] [PubMed] [Green Version]
- Brauer, M.; Avila-Casado, C.; Fortoul, T.I.; Vedal, S.; Stevens, B.; Churg, A. Air Pollution and Retained Particles in the Lung. Environ. Health Perspect. 2001, 109, 1039. [Google Scholar] [CrossRef] [PubMed]
- Brown, J.S.; Zeman, K.L.; Bennett, W.D. Ultrafine particle deposition and clearance in the healthy and obstructed lung. Am. J. Respir. Crit. Care Med. 2002, 166, 1240–1247. [Google Scholar] [CrossRef] [PubMed] [Green Version]
- Brown, D.M.; Wilson, M.R.; MacNee, W.; Stone, V.; Donaldson, K. Size-dependent proinflammatory effects of ultrafine polystyrene particles: A role for surface area and oxidative stress in the enhanced activity of ultrafines. Toxicol. Appl. Pharmacol. 2001, 175, 191–199. [Google Scholar] [CrossRef] [Green Version]
- Daigle, C.C.; Chalupa, D.C.; Gibb, F.R.; Morrow, P.E.; Oberdörster, G.; Utell, M.J.; Frampton, M.W. Ultrafine particle deposition in humans during rest and exercise. Inhal. Toxicol. 2003, 15, 539–552. [Google Scholar] [CrossRef]
- Diffey, B.L. An overview analysis of the time people spend outdoors. Br. J. Dermatol. 2011, 164, 848–854. [Google Scholar] [CrossRef] [PubMed]
- Donaldson, K.; Li, X.Y.; MacNee, W. Ultrafine (nanometre) particle mediated lung injury. J. Aerosol Sci. 1998, 29, 553–560. [Google Scholar] [CrossRef]
- Ibald-Mulli, A.; Wichmann, H.-E.; Kreyling, W.; Peters, A. Epidemiological Evidence on Health Effects of Ultrafine Particles. J. Aerosol Med. 2002, 15, 189–201. [Google Scholar] [CrossRef]
- Ji, X.; Le Bihan, O.; Ramalho, O.; Mandin, C.; D’Anna, B.; Martinon, L.; Nicolas, M.; Bard, D.; Pairon, J.C. Characterization of particles emitted by incense burning in an experimental house. Indoor Air 2010, 20, 147–158. [Google Scholar] [CrossRef]
- Yuness, M.; Mohamed, A.; AbdEl-hady, M.; Moustafa, M.; Nazmy, H. Effect of indoor activity size distribution of222Rn progeny in-depth dose estimation. Appl. Radiat. Isot. 2015, 97, 34–39. [Google Scholar] [CrossRef]
- Yuness, M.; Mohamed, A.; Nazmy, H.; Moustafa, M.; Abd El-hady, M. Indoor activity size distribution of the short-lived radon progeny. Stoch. Environ. Res. Risk Assess. 2016, 30, 167–174. [Google Scholar] [CrossRef]
- Nazmy, H.; Khalaf, B.; Yuness, M.; Mostafa, A.; Zhukovsky, M. Radiometric efficiency of analytical filters at different physical conditions. J. Radioanal. Nucl. Chem. 2019, 319, 347–355. [Google Scholar] [CrossRef]
- Khalaf, H.N.B.; Mostafa, M.Y.A.; Zhukovsky, M. A combined system for radioactive aerosol size distribution measurements of radon decay products. Radiat. Phys. Chem. 2019, 165, 108402. [Google Scholar] [CrossRef]
- Khalaf, H.N.; Mostafa, M.Y.A.; Zhukovsky, M. Effect of electronic cigarette (EC) aerosols on particle size distribution in indoor air and in a radon chamber. Nukleonika 2019, 64, 31–38. [Google Scholar] [CrossRef] [Green Version]
- Nazmy, H.; Khalaf, B.; Yuness, M.; Mostafa, A.; Zhukovsky, M. Radioactive aerosol permeability through Russian radiometric analytical (PF) filters. J. Radioanal. Nucl. Chem. 2019, 319, 1283–1289. [Google Scholar] [CrossRef]
- Schlesinger, R.B.; Kunzli, N.; Hidy, G.M.; Gotschi, T.; Jerrett, M. The health relevance of ambient particulate matter characteristics: Coherence of toxicological and epidemiological inferences. Inhal. Toxicol. 2006, 18, 95–125. [Google Scholar] [CrossRef] [PubMed]
- See, S.W.; Balasubramanian, R.; Man Joshi, U. Physical characteristics of nanoparticles emitted from incense smoke. Sci. Technol. Adv. Materials 2007, 8, 25–32. [Google Scholar] [CrossRef] [Green Version]
- Massey, D.D.; Habil, M.; Taneja, A. Particles in different indoor microenvironments-its implications on occupants. Build. Environ. 2016, 106, 237–244. [Google Scholar] [CrossRef]
- Taneja, A.; Saini, R.; Masih, A. Indoor air quality of houses located in the urban environment of Agra, India. Ann. N. Y. Acad. Sci. 2008, 1140, 228–245. [Google Scholar] [CrossRef] [PubMed]
- Singh, P.; Saini, R.; Taneja, A. Physicochemical characteristics of PM2.5: Low, middle, and high-income group homes in Agra, India-a case study. Atmos. Pollut. Res. 2014, 5, 352–360. [Google Scholar] [CrossRef] [Green Version]
- Vu, T.V.; Delgado-saborit, J.M.; Harrison, R.M. Review: Particle number size distributions from seven major sources and implications for source apportionment studies. Atmos. Environ. 2015, 122, 114–132. [Google Scholar] [CrossRef]
- Pagels, J.; Wierzbicka, A.; Nilsson, E.; Isaxon, C.; Dahl, A.; Gudmundsson, A.; Swietlicki, E.; Bohgard, M. Chemical composition and mass emission factors of candle smoke particles. J. Aerosol Sci. 2009, 40, 193–208. [Google Scholar] [CrossRef] [Green Version]
- Dockery, D.W.; Pope, C.A.; Xu, X.; Dockery, D.W.; Spengler, J.D.; Ware, J.H.; Fay, M.E.; Ferris, G.B., Jr.; Speizer, F.E. An association between air pollution and mortality in six U.S. cities. N. Engl. J. Med. 1993, 329, 1753–1759. [Google Scholar] [CrossRef] [Green Version]
- Morawska, L.; Zhang, J. Combustion sources of particles. 1. Health relevance and source signatures. Chemosphere 2002, 49, 1045–1058. [Google Scholar] [CrossRef] [Green Version]
- Wu, D.; Landsberger, S.; Larson, S.M. Determination of the elemental distribution in cigarette components and smoke by instrumental neutron activation analysis. J. Radioanal. Nucl. Chem. 1997, 217, 77–82. [Google Scholar] [CrossRef]
- Abdel-Salam, M. Aerosol Sampling Methods in Workplace and Ambient Environments. J. Aerosol Med. 2006, 19, 434–455. [Google Scholar] [CrossRef]
- Panas, A.; Comouth, A.; Saathoff, H.; Leisner, T.; Al-Rawi, M.; Simon, M.; Seemann, G.; Dssel, O.; Mlhopt, S.; Paur, H.R.; et al. Health relevance of particulate matter from various sources. Beilstein J. Nanotechnol. 2014, 5, 1590–1602. [Google Scholar] [CrossRef] [Green Version]
- Sheng, Z.; Wang, S.; Zhang, X.; Li, X.; Li, B.; Zhang, Z. Long-Term Exposure to Low-Dose Lead Induced Deterioration in Bone Microstructure of Male Mice. Biol. Trace Elem. Res. 2020, 195, 491–498. [Google Scholar] [CrossRef]
- Apte, K.; Salvi, S. Household air pollution and its effects on health. F1000Research 2016, 5, 2593. [Google Scholar] [CrossRef] [PubMed]
- Jilla, A. Particulate Matter and Carbon Monoxide Emission Factors from Incense Burning; University of New Orleans: New Orleans, LA, USA, 2017; Volume 1. [Google Scholar]
- Oberdörster, G. Toxicology of ultrafine particles: In vivo studies. Philos. Trans. R. Soc. A 2000, 358, 2719–2740. [Google Scholar] [CrossRef]
- Lison, D.; Lardot, C.; Huaux, F.; Zanetti, G.; Fubini, B. Influence of particle surface area on the toxicity of insoluble manganese dioxide dusts. Arch. Toxicol. 1997, 71, 725–729. [Google Scholar] [CrossRef] [PubMed]
- Maynard, A.D. Estimating Aerosol Surface Area from Number and Mass Concentration Estimating Aerosol Surface Area from Number and Mass Concentration Measurements. Ann. Occup. Hyg. 2003, 47, 123–144. [Google Scholar] [CrossRef] [PubMed] [Green Version]
- Xu, B.; Zhu, Y. Quantitative analysis of the parameters affecting in-cabin to on-roadway (I/O) ultrafine particle concentration ratios. Aerosol Sci. Technol. 2009, 43, 400–410. [Google Scholar] [CrossRef] [Green Version]
- Liu, S.; Zhu, Y. A case study of exposure to ultrafine particles from secondhand tobacco smoke in an automobile. Indoor Air 2010, 20, 412–423. [Google Scholar] [CrossRef] [PubMed]
- Gong, L.; Xu, B.; Zhu, Y. Ultrafine particles deposition inside passenger vehicles. Aerosol Sci. Technol. 2009, 43, 544–553. [Google Scholar] [CrossRef]
- Géhin, E.; Ramalho, O.; Kirchner, S. Size distribution and emission rate measurement of fine and ultrafine particle from indoor human activities. Atmos. Environ. 2008, 42, 8341–8352. [Google Scholar] [CrossRef]
- Rim, D.; Choi, J.I.; Wallace, L.A. Size-Resolved Source Emission Rates of Indoor Ultrafine Particles Considering Coagulation. Environ. Sci. Technol. 2016, 50, 10031–10038. [Google Scholar] [CrossRef]
- Zhang, Q.; Gangupomu, R.H.; Ramirez, D.; Zhu, Y. Measurement of ultrafine particles and other air pollutants emitted by cooking activities. Int. J. Environ. Res. Public Health 2010, 7, 1744–1759. [Google Scholar] [CrossRef]
- Matson, U. Indoor and outdoor concentrations of ultrafine particles in some Scandinavian rural and urban areas. Sci. Total Environ. 2005, 343, 169–176. [Google Scholar] [CrossRef] [PubMed]
- Long, C.M.; Suh, H.H.; Koutrakis, P. Characterization of indoor particle sources using continuous mass and size monitors. J. Air Waste Manag. Assoc. 2000, 50, 1236–1250. [Google Scholar] [CrossRef]
- Ogulei, D.; Hopke, P.K.; Wallace, L.A. Analysis of indoor particle size distributions in an occupied townhouse using positive matrix factorization. Indoor Air 2006, 16, 204–215. [Google Scholar] [CrossRef] [PubMed]
- Afshari, A.; Matson, U.; Ekberg, L.E. Characterization of indoor sources of fine and ultrafine particles: A study conducted in a full-scale chamber. Indoor Air 2005, 15, 141–150. [Google Scholar] [CrossRef] [PubMed]
- LaRosa, L.E.; Buckley, T.J.; Wallace, L.A. Real-time indoor and outdoor measurements of black carbon in an occupied house: An examination of sources. J. Air Waste Manag. Assoc. 2002, 52, 41–49. [Google Scholar] [CrossRef]
- Sørensen, M.; Loft, S.; Andersen, H.V.; Raaschou-Nielsen, O.; Skovgaard, L.T.; Knudsen, L.E.; Nielsen, I.V.; Hertel, O. Personal exposure to PM2.5, black smoke and NO2 in Copenhagen: Relationship to bedroom and outdoor concentrations covering seasonal variation. J. Expo. Anal. Environ. Epidemiol. 2005, 15, 413–422. [Google Scholar] [CrossRef] [Green Version]
- Özkaynak, H.; Xue, J.; Spengler, J.; Wallace, L.; Pellizzari, E.; Jenkins, P. Personal exposure to airborne particles and metals: Results from the particle team study in Riverside, California. J. Expo. Anal. Environ. Epidemiol. 1996, 6, 57–78. [Google Scholar]
- Kamens, R.; Lee, D.; Wiener, R.; Leith, D. A study of characterize indoor particles in three non-smoking homes. Atmos. Environ. Part A Gen. Top. 1991, 25, 939–948. [Google Scholar] [CrossRef]
- He, C.; Morawska, L.; Hitchins, J.; Gilbert, D. Contribution from indoor sources to particle number and mass concentrations in residential houses. Atmos. Environ. 2004, 38, 3405–3415. [Google Scholar] [CrossRef]
- Goel, A.; Wathore, R.; Chakraborty, T.; Agrawal, M. Characteristics of exposure to particles due to incense burning inside temples in Kanpur, India. Aerosol Air Qual. Res. 2017, 17, 608–615. [Google Scholar] [CrossRef] [Green Version]
- Tirler, W.; Settimo, G. Incense, sparklers and cigarettes are significant contributors to indoor benzene and particle levels. Ann. Ist Super Sanità 2015, 51, 28–33. [Google Scholar] [CrossRef]
- Mostafa, M.Y.A.; Khalaf, H.N.B.; Zhukovsky, M. Attachment rate characteristics of different wide used aerosol sources in indoor air. J. Environ. Health Sci. Eng. 2021, 19, 867–879. [Google Scholar] [CrossRef] [PubMed]
- Verma, A.; Stellacci, F. Effect of surface properties on nanoparticle-cell interactions. Small 2010, 6, 12–21. [Google Scholar] [CrossRef]
- Bakand, S.; Hayes, A.; Dechsakulthorn, F. Nanoparticles: A review of particle toxicology following inhalation exposure. Inhal. Toxicol. 2012, 24, 125–135. [Google Scholar] [CrossRef] [PubMed]
- Nel, A.; Xia, T.; Mädler, L.; Li, N. Toxic potential of materials at the nanolevel. Science 2006, 311, 622–627. [Google Scholar] [CrossRef] [PubMed] [Green Version]
Figure 1.
The size and dynamics of particulate matter (PM)in the lungs and others tissues [7].
Figure 1.
The size and dynamics of particulate matter (PM)in the lungs and others tissues [7].

Figure 2.
UFP (<200 nm) and fine particle concentration generated by six different aerosol sources (burning duration means when the aerosol source was on), as measured by the DAS. Left Y-axis for UFP (<200 nm) and right Y-axis for other sizes.
Figure 2.
UFP (<200 nm) and fine particle concentration generated by six different aerosol sources (burning duration means when the aerosol source was on), as measured by the DAS. Left Y-axis for UFP (<200 nm) and right Y-axis for other sizes.

Figure 3.
Ultrafine particle number concentration (<200 nm) for six indoor aerosol sources (candles, cooking, electronic cigarettes, tobacco cigarettes, mosquito coils and incense) at different times (before being turned on, during operation and after being stopped).
Figure 3.
Ultrafine particle number concentration (<200 nm) for six indoor aerosol sources (candles, cooking, electronic cigarettes, tobacco cigarettes, mosquito coils and incense) at different times (before being turned on, during operation and after being stopped).

Figure 4.
Particulate matter mass concentration (PM1) for six indoor aerosol sources (incense, mosquito coils, candles, tobacco cigarettes, cooking and electronic cigarettes) at different times (before being turned on, during operation and after being stopped).
Figure 4.
Particulate matter mass concentration (PM1) for six indoor aerosol sources (incense, mosquito coils, candles, tobacco cigarettes, cooking and electronic cigarettes) at different times (before being turned on, during operation and after being stopped).

Figure 5.
Particulate matter mass concentration (PM2.5) for six indoor aerosol sources (incense, mosquito coils, candles, tobacco cigarettes, cooking and electronic cigarettes) at different times (before being turned on, during operation and after being stopped).
Figure 5.
Particulate matter mass concentration (PM2.5) for six indoor aerosol sources (incense, mosquito coils, candles, tobacco cigarettes, cooking and electronic cigarettes) at different times (before being turned on, during operation and after being stopped).

Figure 6.
Particulate matter mass concentration (PM10) for six indoor aerosol sources (incense, mosquito coils, candles, tobacco cigarettes, cooking and electronic cigarettes) at different times (before being turned on, during operation and after being stopped).
Figure 6.
Particulate matter mass concentration (PM10) for six indoor aerosol sources (incense, mosquito coils, candles, tobacco cigarettes, cooking and electronic cigarettes) at different times (before being turned on, during operation and after being stopped).

Figure 7.
Surface area for six indoor aerosol sources (candles, cooking, electronic cigarettes, tobacco cigarettes, mosquito coils and incense) at different times (before being turned on, during operation and after being stopped).
Figure 7.
Surface area for six indoor aerosol sources (candles, cooking, electronic cigarettes, tobacco cigarettes, mosquito coils and incense) at different times (before being turned on, during operation and after being stopped).


Table 1.
Description of the six different types for indoor aerosol sources.
| Indoor Sources | Burning Time | Amount of Source | Source Location |
|---|---|---|---|
| Candles | 40 min | Four scented candles | In the centre of the room |
| Cooking | 30 min | 15 min for heating and 15 min for cooking | In the centre of the room |
| Electronic cigarette (Pone type) | 10 min | One cigarette | In the centre of the room |
| Tobacco cigarette | 10 min | One cigarette | In the centre of the room |
| Mosquito coil | 60 min | One mosquito coil but not finished | In the centre of the room |
| Incense | 20 min | Three popular and usable brands of incense | In the centre of the room |
Table 2.
Number size distribution parameters of ultrafine particles for different aerosol sources, Adapted from [84].
Table 2.
Number size distribution parameters of ultrafine particles for different aerosol sources, Adapted from [84].
| Aerosol Sources | Background | During Source On | 10 min after Stop | 60 min after Stop | ||||
|---|---|---|---|---|---|---|---|---|
| NMD (nm) | GSD | NMD (nm) | GSD | NMD (nm) | GSD | NMD (nm) | GSD | |
| T-cig. | 54.6 | 1.73 | 92.1 | 1.85 | 115.8 | 1.43 | 57.1 | 1.86 |
| E-cig. | 54.5 | 1.84 | 71.3 | 2.22 | 39.4 | 2.06 | 50.1 | 1.83 |
Publisher’s Note: MDPI stays neutral with regard to jurisdictional claims in published maps and institutional affiliations. |
© 2021 by the authors. Licensee MDPI, Basel, Switzerland. This article is an open access article distributed under the terms and conditions of the Creative Commons Attribution (CC BY) license (https://creativecommons.org/licenses/by/4.0/).
Share and Cite
MDPI and ACS Style
Mostafa, M.Y.A.; Khalaf, H.N.B.; Zhukovsky, M.V. Dynamic of Particulate Matter for Quotidian Aerosol Sources in Indoor Air. Atmosphere 2021, 12, 1682. https://0-doi-org.brum.beds.ac.uk/10.3390/atmos12121682
AMA Style
Mostafa MYA, Khalaf HNB, Zhukovsky MV. Dynamic of Particulate Matter for Quotidian Aerosol Sources in Indoor Air. Atmosphere. 2021; 12(12):1682. https://0-doi-org.brum.beds.ac.uk/10.3390/atmos12121682
Chicago/Turabian StyleMostafa, Mostafa Yuness Abdelfatah, Hyam Nazmy Bader Khalaf, and Michael V. Zhukovsky. 2021. "Dynamic of Particulate Matter for Quotidian Aerosol Sources in Indoor Air" Atmosphere 12, no. 12: 1682. https://0-doi-org.brum.beds.ac.uk/10.3390/atmos12121682
Note that from the first issue of 2016, this journal uses article numbers instead of page numbers. See further details here.