
A Satellite Data Based Detailed Study of the Aerosol Emitted from Open Biomass Burning in Northeast China


1
State Key Laboratory of Remote Sensing Science, Aerospace Information Research Institute, Chinese Academy of Sciences, Beijing 100094, China
2
Institute of Atmospheric Environment, China Meteorological Administration, Shenyang 110166, China
3
Department of Earth and Space Sciences, Southern University of Science and Technology, Shenzhen 518055, China
*
Author to whom correspondence should be addressed.
Atmosphere 2021, 12(12), 1700; https://0-doi-org.brum.beds.ac.uk/10.3390/atmos12121700
Submission received: 24 November 2021
/
Revised: 10 December 2021
/
Accepted: 16 December 2021
/
Published: 18 December 2021
(This article belongs to the Special Issue Emissions from Biomass Burning)
Abstract
:Due to its unique natural conditions and agricultural tradition, northeast China (NEC) has formed a distinctive open biomass burning habit with local-specific biomass burning aerosol features. In this research, with the help of a newly optimized biomass burning aerosol identification method, which combines satellite aerosol and fire observational products with the HYSPLIT model forward trajectories, a systematic and quantitative analysis of aerosol emitted from open biomass burning in the NEC region are conducted to determine in detail its local-specific features, such as influence region, aging characteristics, and seasonal variation. During the 72-h aging process after biomass burning emission, aerosol particle size growth found with the Angstrom exponent declines from 1.6 to 1.54. Additionally, the volume fraction of black carbon decreases from 4.5% to 3.1%, leading to the Single Scattering Albedo (SSA) increasing from the fresh state of 0.84 to the aged state of 0.89. The cooling effect at TOA, due to the existence of aerosol, is enhanced by more than 70%, indicating its severe and dynamic influence on climate change. The average AOD in spring is 0.63, which is higher than autumn’s value of 0.52, indicating that biomass burning is more intensive in spring. Compared to autumn, aerosols emitted from spring biomass burning in the NEC region have lower sphere fraction, smaller particle size, higher volume fraction of black carbon, higher absorbability, and weaker cooling effect at TOA, which can be partly explained by the drier ambient environment and lower water content of the burned crop straw in spring.
1. Introduction
Biomass burning can release massive aerosol into the earth’s atmosphere, causing air pollution [1,2], damaging human health [3], and influencing the world climate [4,5,6]. Down through the ages, northeast China (NEC) has maintained a unique open biomass burning tradition as part of its long agricultural history [7]. Due to the cold weather, winter is not suitable for agriculture in NEC; thus, crops are planted in spring and reaped in autumn [8]. After harvest, the remaining residue in the field is unable to decompose due to the cold winter climate [9], therefore, the open burning of straw is one of the only possible options left for farmers [10].
Due to the region’s unique natural conditions, agricultural tradition, and the mixing process with other types of aerosols during transportation, the aerosol emitted from open biomass burning in NEC has its unique characteristics [11,12,13,14,15]. Scholars have studied biomass burning and the resulting aerosol using various methods, focusing either on the NEC region or other regions worldwide.
Ojha et al. [16] simulated O3 in the Doon Valley of the Himalayan foothills, based on the Copernicus Atmosphere Monitoring Service (CAMS) model forecast. The CAMS simulation shows an enhancement of O3 in the range of 10–65% in the vicinity of the biomass burning area, varying with transport effects and the extent of photochemical processing. Smith et al. [17] constructed an indoor smog chamber for measuring the optical and physicochemical properties of aging biomass burning aerosols. The result showed that SSA increased with aging and particle size, nearly independent of wavelength. Yang et al. [18] elucidated the sources and formation mechanisms of severe haze pollution in a megacity cluster over NEC, using the Nested Air Quality Prediction Modeling System (NAQPMS). The model demonstrated that biomass burning, stagnant meteorological conditions, energy combustion, and illegal emission were main drivers of strong haze formation and spatial distribution in megacity clusters over NEC.
Fang et al. [19] used an indoor chamber to investigate primary emissions from open biomass burning of crop straws and their photochemical aging. Emission factors, including black carbon, under ambient dilution conditions were determined. Li et al. [20] also applied an aerosol chamber system combined with various measurement techniques to identify and quantify multi-pollutants in smoke particulate matter from biomass burning in China. The content of organic carbon, elemental carbon, water-soluble inorganics, water-soluble organic acids, water-soluble amine salts, trace mineral elements, polycyclic aromatic hydrocarbons, and phenols in smoke were measured.
Pani et al. [21] estimated the radiative effect of biomass burning aerosols in northern Indochina during the campaign of 7-SEAS/BASELInE in spring 2013. Notably, absorbing aerosols were measured with an average SSA of 0.89. The overall mean radiative forcing was estimated as −8.0 W/m2 at Top Of Atmosphere (TOA). Reid and Hobbs [22] also used aircraft to measure the physical and optical properties of smoke particles from 19 fires in the Amazon Basin and Cerrado regions of Brazil during the burning season. The smoke optical properties from biomass burning in Brazil differed significantly from those from biomass fires in North America. J. Abel et al. [23] measured the biomass burning plumes during the campaign of the Southern AFricAn Regional science Initiative (SAFARI 2000). An increase in the SSA with aerosol aging was found, from 0.84 in the source region to 0.90 in the aged region. During the field-based combustion experiments in NEC, Wang et al. [11] studied the carbonaceous aerosols emitted from main types of crop residue burning to characterize the particle number concentration, chemical components of fine particulate matter and optical properties, using a suite of fast-response online portable instruments. The result revealed that local combustion conditions can influence the optical properties of emitted aerosols.
Sharma et al. [24] used ground-based data to study the post-harvest biomass burning aerosol in India. The measured SSA varied from 0.76 to 0.88 and the atmospheric radiative forcing varied from +43.0 to +86.5 W/m2, indicating a high BC concentration produced by paddy residue burning in the fields. Chen et al. [12] used the ground measurement data of CIMEL sun-photometer from May 2016 to March 2017 to analyze local aerosol properties, discovering that the aerosol biomass burning, and urban industry accounted for 31% of the total measurement. The research indicated that Harbin was strongly affected by a large number of anthropogenic aerosols due to local and transported pollutants. Additionally, the agricultural crop-residue burning is a main category.
Papanikolaou et al. [25] studied the spatio-temporal evolution of a long-lasting Canadian biomass burning event that affected Europe in August 2018 using active remote sensing data from the space-borne system Cloud-Aerosol Lidar and Infrared Pathfinder Satellite Observation (CALIPSO). The Angstrom exponent was found to range between 0.9 and 1.5, indicating aerosols of different sizes. They also fund that when the smoke was mixed with dessert dust, the mean linear particle depolarization ratio may reach values up to 0.20 ± 0.04, especially close to the African continent. In the study of Fu et al. [14], NEC was selected as the representative of cropland biomass burning. The emissions of aerosols and trace gases and their direct shortwave radiative forcing (DSRF) at the top of atmosphere were studied using multiple satellite observations. The results highlighted the large variability of emission rate and relative chemical composition but similar DSRF efficiencies among wildfires, providing valuable information for understanding the impact of fire on air quality and climate.
Markowicz et al. [26] simulated the climatic effect of intensive biomass burning, finding that signs of aerosol radiative forcing at Top of Atmosphere (TOA) could change during the transport process after being emitted from the source region. Andreae [27] conducted a thorough review of the emission of trace gases and aerosols from biomass burning, concluding that it would be of great benefit for testing and improving fire emission models, which offer divergent results and find it difficult to capture interannual variations and temporal trends at that time. Brown et al. [28] related aerosol absorption relative to extinction and carbonaceous aerosol composition from 12 observational datasets to nine state-of-the-art Earth system models/chemical transport models, identifying varying degrees of overestimation in BB aerosol absorptivity by these models. Modifications to biomass burning aerosol refractive index, size, and mixing state can improve the model’s simulation agreement with observations. Cheng et al. [29] compared the fine particulate matter pollution from field observation with air quality modeling from mid-October 2018 to mid-April 2019 in the NEC city of Harbin. The research found that the model significantly underpredicted PM2.5 and organic carbon, while also overpredicting elemental carbon. The large gaps were attributed to an underestimation of open burning emissions and an overestimation of vehicle emissions by the model.
The discrepancy reveals that, although scholars have used various methods to focus on the biomass burning aerosol worldwide and around the NEC region, the current shortage of necessary information on aerosol emitted from open biomass burning still exists. Additionally, a real-world, large-scale, and long-time-sequence study of biomass burning aerosol around NEC is needed. Therefore, in this research, to determine local-specific features, such as influence region, aging characteristics, and seasonal variation, we conducted a deep quantitative analysis of aerosol emitted from open biomass burning in the NEC region, using a long-time series of satellite observational data with the help of a series of auxiliary data and models.
The rest of the paper is organized as follows. Section 2 gives a brief introduction to NEC and its long-standing biomass burning tradition. Section 3 shares the studied architecture as well as the satellite dataset and models used in this research. Section 4 presents detailed analyses of the aerosol emitted from open biomass burning in NEC, including its influence region, aging effect and seasonal variation. Finally, Section 5 summarizes this research and draws a conclusion.
2. Geographical Scope of Northeast China and Biomass Burning Tradition
Northeast China, shown in Figure 1, is one of the main Chinese geographical regions in which similar climate condition, social culture, economic activity, and living habits are shared. In general, NEC is considered to be composed of three entire provinces: Liaoning, Jilin, and Heilongjiang, in addition to the eastern portion of the Inner Mongolia autonomous region (including four prefecture-level cities: Chifeng, Tongliao, Hinggan League, and Hulun Buir). In addition, the Xilingol League of the Inner Mongolia autonomous region is also included in the geographical scope of NEC in the Northeast Revitalization Plan [30,31]. According to the Sixth National Census of China [32], the total population in the above defined NEC region is about 122 million.
NEC is one of the coldest regions in China. The monthly mean temperature in NEC can reach −28.9 °C in January [33]. The cold weather in NEC has resulted in the adoption of unique agriculture cultivation and living habits. In NEC, spring, especially from late April to mid-May, is the dominant farming season, in which maize, japonica and soybean are planted and sown. Meanwhile, autumn is the harvest season. Additionally, almost all agricultural crops are reaped in October. NEC has a considerable quantity of crop residue owing to its vast agricultural productivity. However, the cold weather prevents residue in the field from decomposing after harvest. Additionally, there is exists a long held tradition of biomass burning in NEC [34]. The burning of corn, rice, and soybean residues mainly occurs before spring ploughing (March and April) or after harvest (October and November) [8].
3. Studying Architecture, Dataset and Models
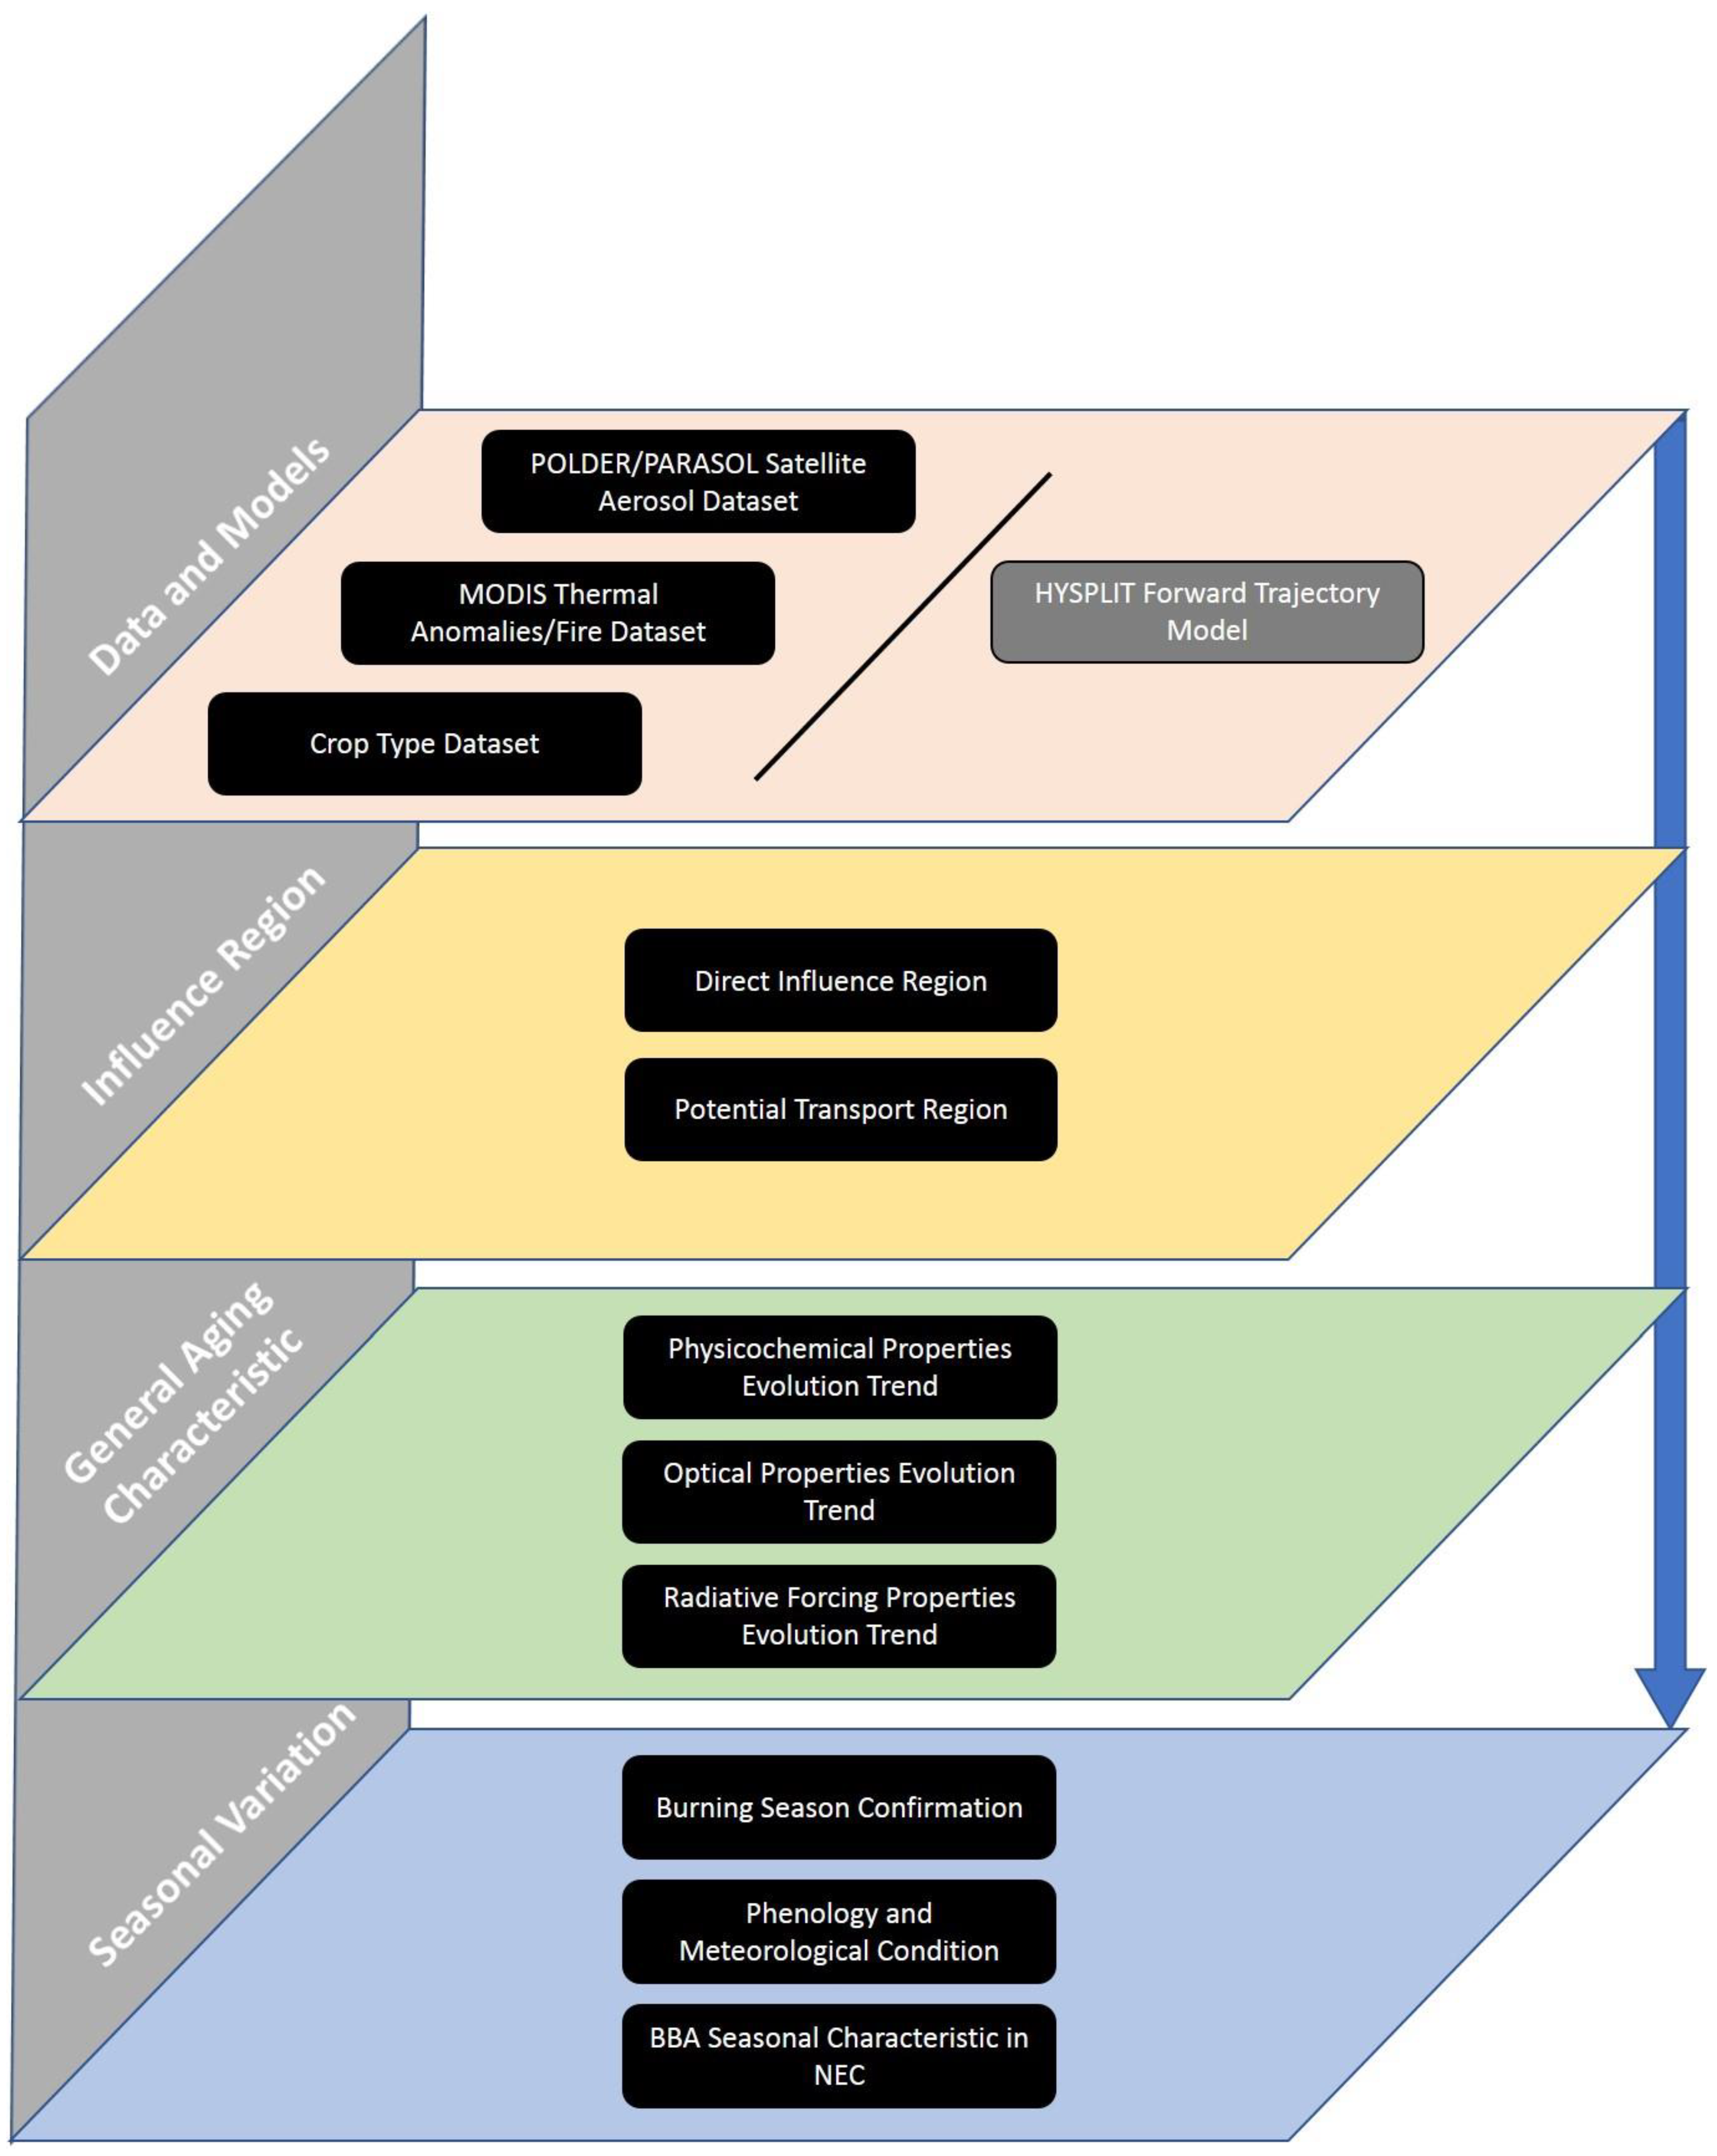
To determine local-specific features, such as influence region, aging characteristics, and seasonal variation, a quantitative analysis of aerosol emitted from open biomass burning in NEC region was conducted using a long-time series of satellite observational data with the help of a series of auxiliary data and models, under a four-level studying architecture. Figure 2 shows the general studying architecture of aerosol emitted from open biomass burning in the NEC region. The data and models are prepared in the first level of the studying architecture to produce the aerosol dataset emitted from open biomass burning in NEC. Based on the dataset we produced, the second study level determines the distribution and influence region of NEC biomass burning. The third study level quantitatively analyzes the general aging characteristics of biomass burning aerosol emitted from NEC. Finally, the last study level aims to specify the seasonal variation of aerosol emitted from NEC biomass burning. A further introduction of data and models are listed in the following subsections.
3.1. POLDER/PARASOL Satellite Aerosol Dataset and Derived Parameters
A Polarization and Directionality of the Earth’s Reflectances (POLDER) sensor is a passive optical imaging radiometer and polarimeter instrument on the board of Polarization and Anisotropy of Reflectances for Atmospheric Sciences, coupled with Observations from a Lidar (PARASOL) satellite. This instrument was launched on 18 December 2004 and began providing operational datasets and products from March 2005. The satellite was first deployed on the Afternoon Constellation (A-train) and later maneuvered out of the A-train in December 2009. The satellite and sensor were shut down permanently in December 2013 [35,36,37].
The official POLDER/PARASOL product can provide series of aerosol and surface parameters. The detailed POLDER/PARASOL product data from 2005 to 2013 that are used in this study are listed in Table 1. The in-depth validation of POLDER/GRASP aerosol product has already been conducted by some scholars [38,39,40,41]. Tan et al. [41] provided the validation of all the POLDER/GRASP aerosol optical properties using ground measurements at 15 AErosol RObotic NETwork (AERONET) stations over China. The comparison showed that the correlation coefficient was 0.9530/0.6371/0.5835/0.6834 between POLDER/GRASP AOD/AAOD/imaginary part of the complex refractive index/SSA and that of AERONET stations. For Angstrom exponent, about 97.7% of the scatter points fall in the EE lines (±(0.11 + 0.44 × AEAERONET)). The moderate correlation coefficient is 0.7041 with RMSE of 0.2699 and MAE of 0.203. The results indicate that the POLDER/GRASP aerosol product is more sensitive to fine aerosol types, such as the aerosol originating from biomass burning in this research.
Some aerosol products can only be calculated when there is some aerosol loading (otherwise it is difficult to measure them). Uncertainty may occur in low AOD conditions, therefore, we abandon the POLDER/GRASP aerosol dataset with AOD less than 0.5. Besides, BBA is a type of fine particle aerosol. In order to remove potential cases of certain uninterested and insensitive aerosol types, such as mineral dust, we narrowed down the search scope by filtering out the POLDER/GRASP aerosol dataset, the Angstrom parameter of which is greater than 1.4. Such relative stringent criteria, referred by Sayer et al. [42], is used in this research in order to ensure only the most reliable and demanded data are picked.
Besides the primary parameters provided by the official product, we can further calculate some secondary parameters, such as volume fraction of black carbon and aerosol radiative forcing efficiency, providing additional aerosol information. The volume fractions of black carbon in the aerosol mixture can be retrieved from the complex refractive index using the Maxwell-Garnett effective medium approximation [43]. The calculated black carbon is validated in our previous work [44,45,46]. The validation of BC concentration retrievals indicated an encouraging consistency with a correlation (R) of 0.71, mean bias of 3.55, and root-mean-square error (RMSE) of 3.75 when compared against the in situ observations over South Asia. Higher accuracy was found in biomass burning seasons (R = 0.75, RMSE = 4.04, Bias = 3.27). The clear-sky shortwave aerosol radiative forcing at Top of Atmosphere (TOA) level, surface level, and atmosphere level were calculated using the SBDART (Santa Barbara DISORT Atmospheric Radiative Transfer) model [47]. The inputs of the SBDART model, including aerosol optical depth of extinction (AOD), angstrom exponent, single scattering albedo (SSA), and surface albedo, can be obtained from the POLDER/GRASP dataset. The aerosol radiative forcing at TOA can be calculated by subtracting the net radiative flux at TOA with and without the existence of aerosol, respectively. Similarly, the aerosol radiative forcing at surface level or Bottom of Atmosphere (BOA) can be calculated by subtracting the net radiative flux at BOA with and without the existence of aerosol, respectively. The atmosphere aerosol radiative forcing can be further calculated by subtracting the aerosol radiative forcing at the surface level from the aerosol radiative forcing at the TOA level. Aerosol radiative forcing efficiency is defined as the ratio of aerosol radiative forcing to AOD in order to rule out the influence of the aerosol load on radiative forcing [26]. Aruna et al. [48] estimated the shortwave aerosol radiative forcing calculated by SBDART model over a semi urban coastal environment in south-east India and performed validation with surface flux measurements. The result showed a very good linear fit with a high degree of correlation. The linear slopes are 0.99 and 1.05 for without and with aerosols, respectively, indicating a very good agreement between the model estimated fluxes and the measured fluxes. The detailed secondary parameters that are studied in this research are also listed in Table 1, together with the primary parameters.
3.2. MODIS Thermal Anomalies/Fire Dataset
Open biomass burning phenomena can be cached by the infrared band of the satellite sensor. The MODIS Thermal Anomalies/Fire Dataset [49,50,51] adopted from the Fire Information for Resource Management System (FIRMS) (https://firms.modaps.eosdis.nasa.gov/, accessed on 24 November 2021) is used in this research to provide the possible source information of biomass burning aerosol. The fire dataset can be combined either with crop type data to determine the biomass types or with the aerosol property dataset to extract the biomass burning aerosol characteristics. Validation of the MODIS Thermal Anomalies/Fire Product from a general validation process was performed using coincident observations from ASTER (Advanced Spaceborne Thermal Emission and Reflection Radiometer) [52,53,54,55]. To reduce the misjudgement of a biomass burning event, the low-confidence fire data were excluded. This research only reserved and used the high-confidence and nominal-confidence fire data.
3.3. Crop Type Data of Northeast China
The major crop types of Northeast China are rice, maize, and soybean, which have their distinct distribution patterns after a long history of agriculture activities. You et al. [56] have published the reliable crop type map of Northeast China from 2017 to 2019 to provide the main crops’ distribution detail with high overall accuracies. The crop type map was generated using Sentinel-2A/B (S2) Multi-Spectral Instrument (MSI) reflectance data, enabling a 10 m map resolution. In this research, the crop type map is used to further obtain the major crop burning types and analyze their variation in different seasons.
3.4. Biomass Burning Aerosol Identifying and HYSPLIT
As mentioned above, the biomass burning aerosol can be identified and its characteristics can be extracted by the combination usage of POLDER/PARASOL Satellite Aerosol Dataset as well as MODIS Thermal Anomalies/Fire Dataset. However, the two datasets are, respectively, independent with each other. Fortunately, the HYSPLIT (HYbrid Single-Particle Lagrangian Integrated Trajectory) model can perform as the bridge between the two datasets. The HYSPLIT model was developed by the Air Resources Laboratory (ARL) of NOAA [57,58,59,60]. The trajectory analysis of HYSPLIT model is helpful for ascertaining the origins and sources of pollutants, which is most useful for air quality forecasting. Additionally, in this research, we used this tool to depict the transmission path of the satellite observed aerosol and find the potential burning source (i.e., the traced backfire point) along the path from the thermal anomalies/fire dataset. The detailed procedure of biomass burning aerosol identification and aging time determination can be found in our previous study [45]. However, in previous biomass burning aerosol identification procedures, the backward trajectories for all potential aerosol pixels were calculated, leading to a huge computational cost. In contrast, the number of potential fire point data is an order of several magnitude smaller in the NEC region. Thus, in this research, we have changed the identification method from backward to forward to optimize and speed up the identification process. A brief introduction of the biomass burning aerosol identifying process can be described as follows. After preliminary screening of the POLDER/GRASP aerosol dataset mentioned in Section 3.1, the geolocation and time information from the potential MODIS Thermal Anomalies/Fire points were entered into the HYSPLIT model to calculate the forward trajectories. We trace back the aerosol pixels within the distance of 50 km and the time difference of 15 min from the forward trajectory. If a POLDER/GRASP aerosol pixel is traced back successfully, it is identified as the biomass burning aerosol and the corresponding fire point is defined as traced back fire point. Moreover, the aging time of the biomass burning aerosol is determined by the nearest node of the forward trajectory.
4. Characteristic of the Aerosol Emitted from Open Biomass Burning in Northeast China
Based on the studying architecture, we can qualitatively and quantitatively investigate the characteristics of aerosol emitted from open biomass burning in NEC.
4.1. Influence Region
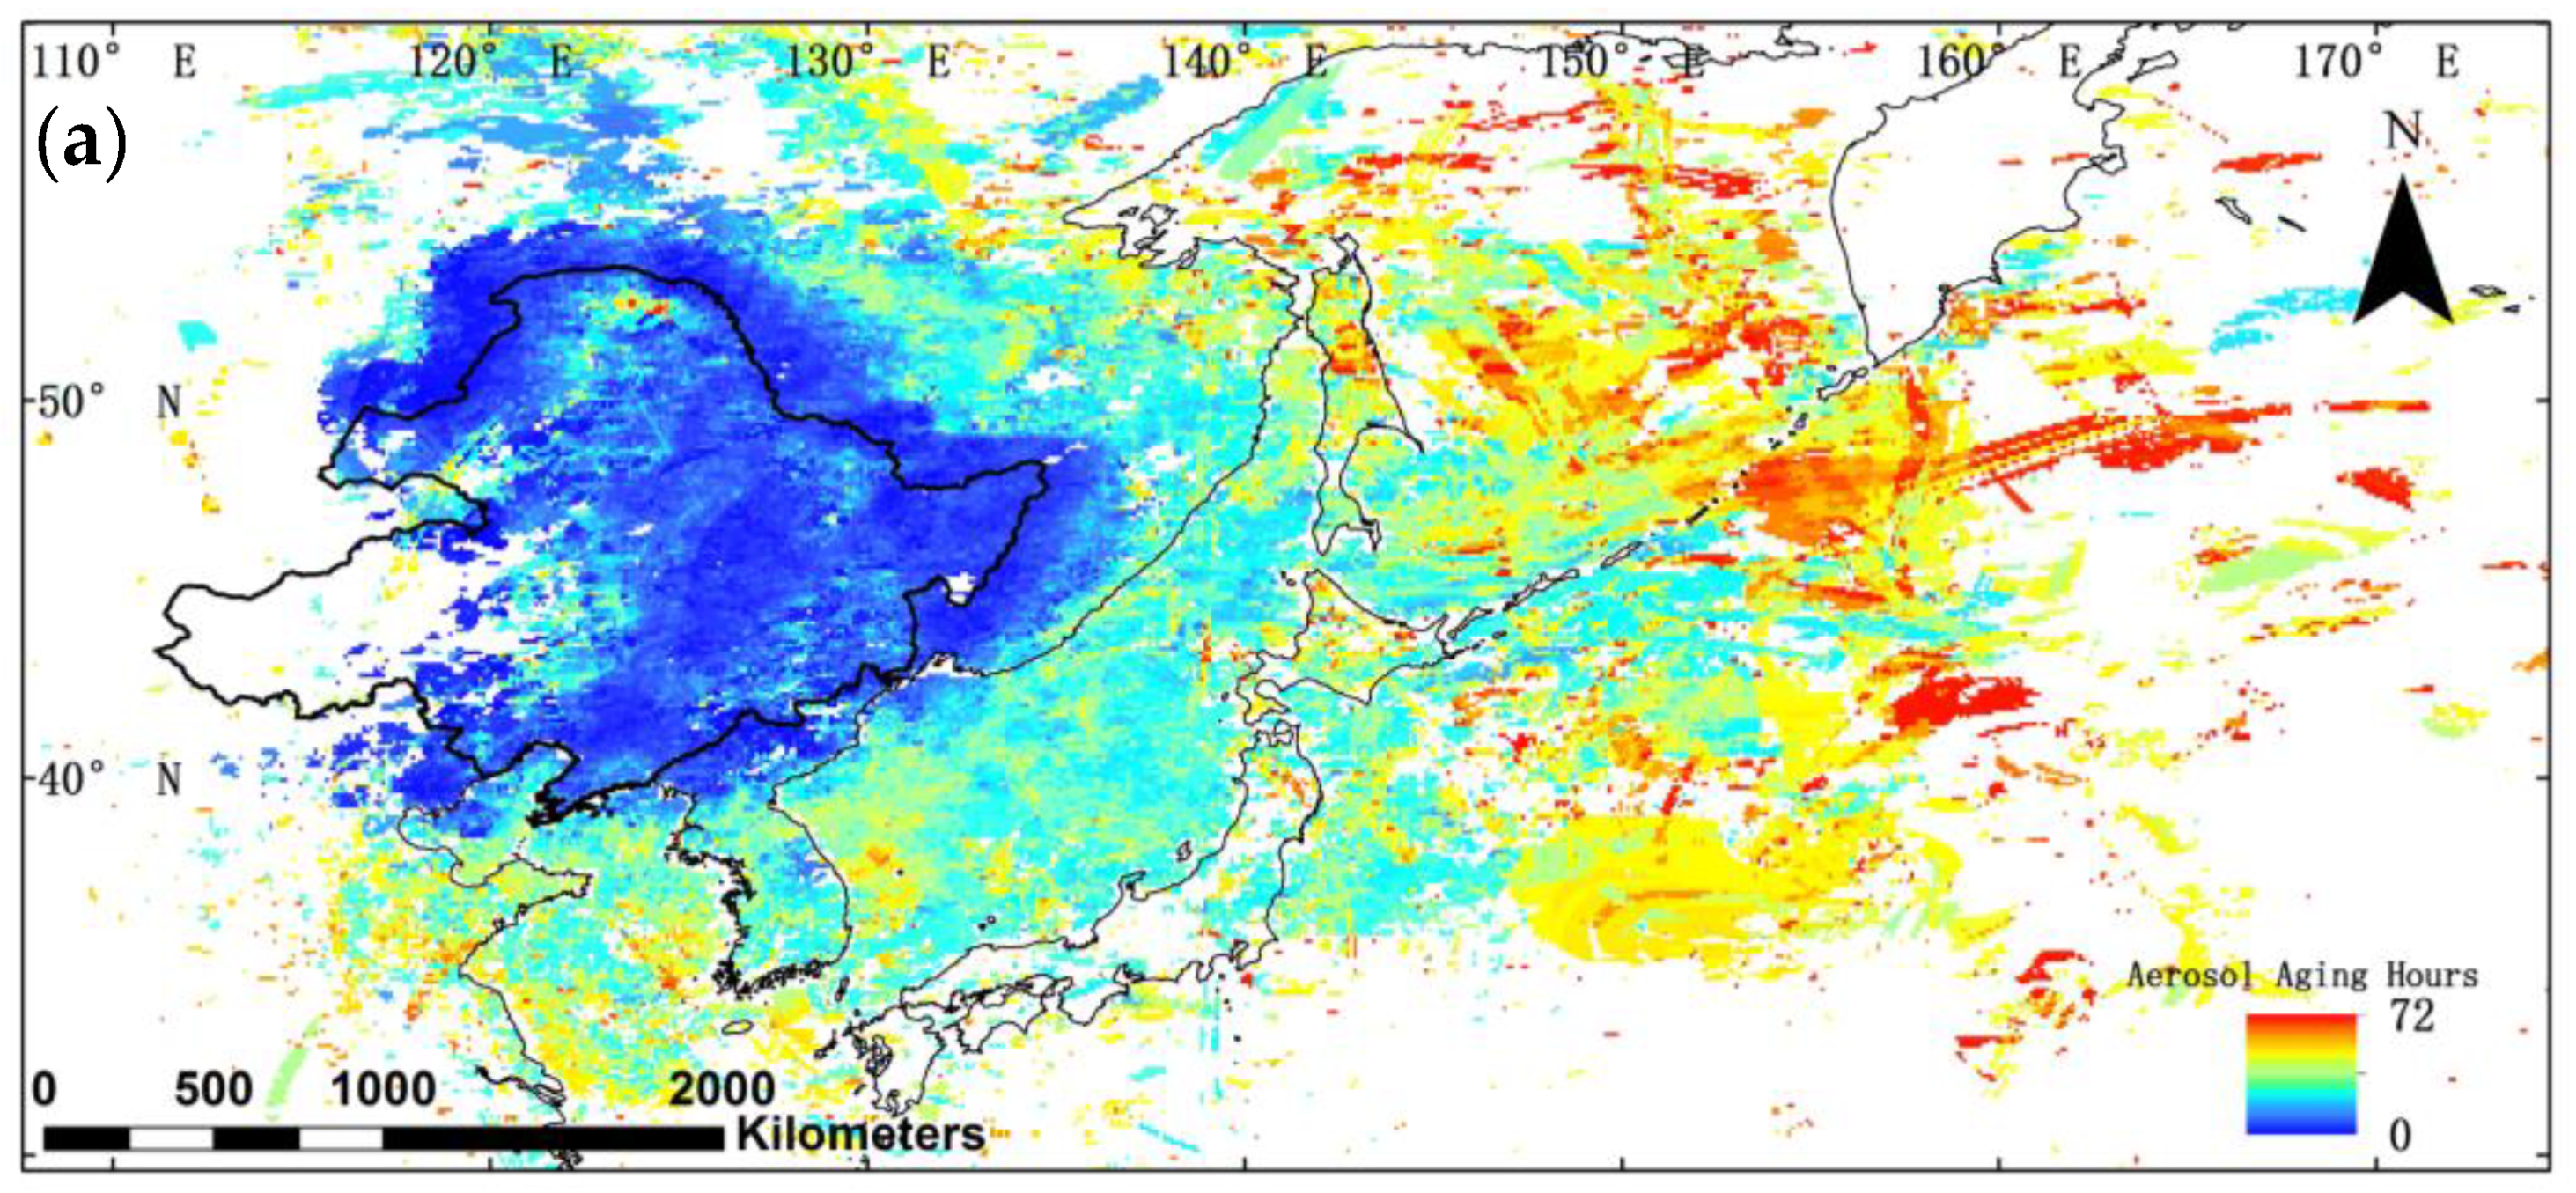
Using the identified aerosol data, the influence region of aerosol emitted from open biomass burning in NEC are studied. Figure 3a, b are two subfigures showing the influence region of aerosol emitted from open biomass burning in NEC. The only difference between (a) and (b) lies in the fire point that the aerosol traced back in the trajectory. Figure 3b represents the identified aerosols, which only have traced back fire point(s) in the NEC region. Meanwhile, Figure 3a contains the identified aerosols for as long as the fire point(s) in the NEC region can be traced back, regardless of whether the fire points outside the NEC region are traced back successfully. The average aging time is also shown in the figures.
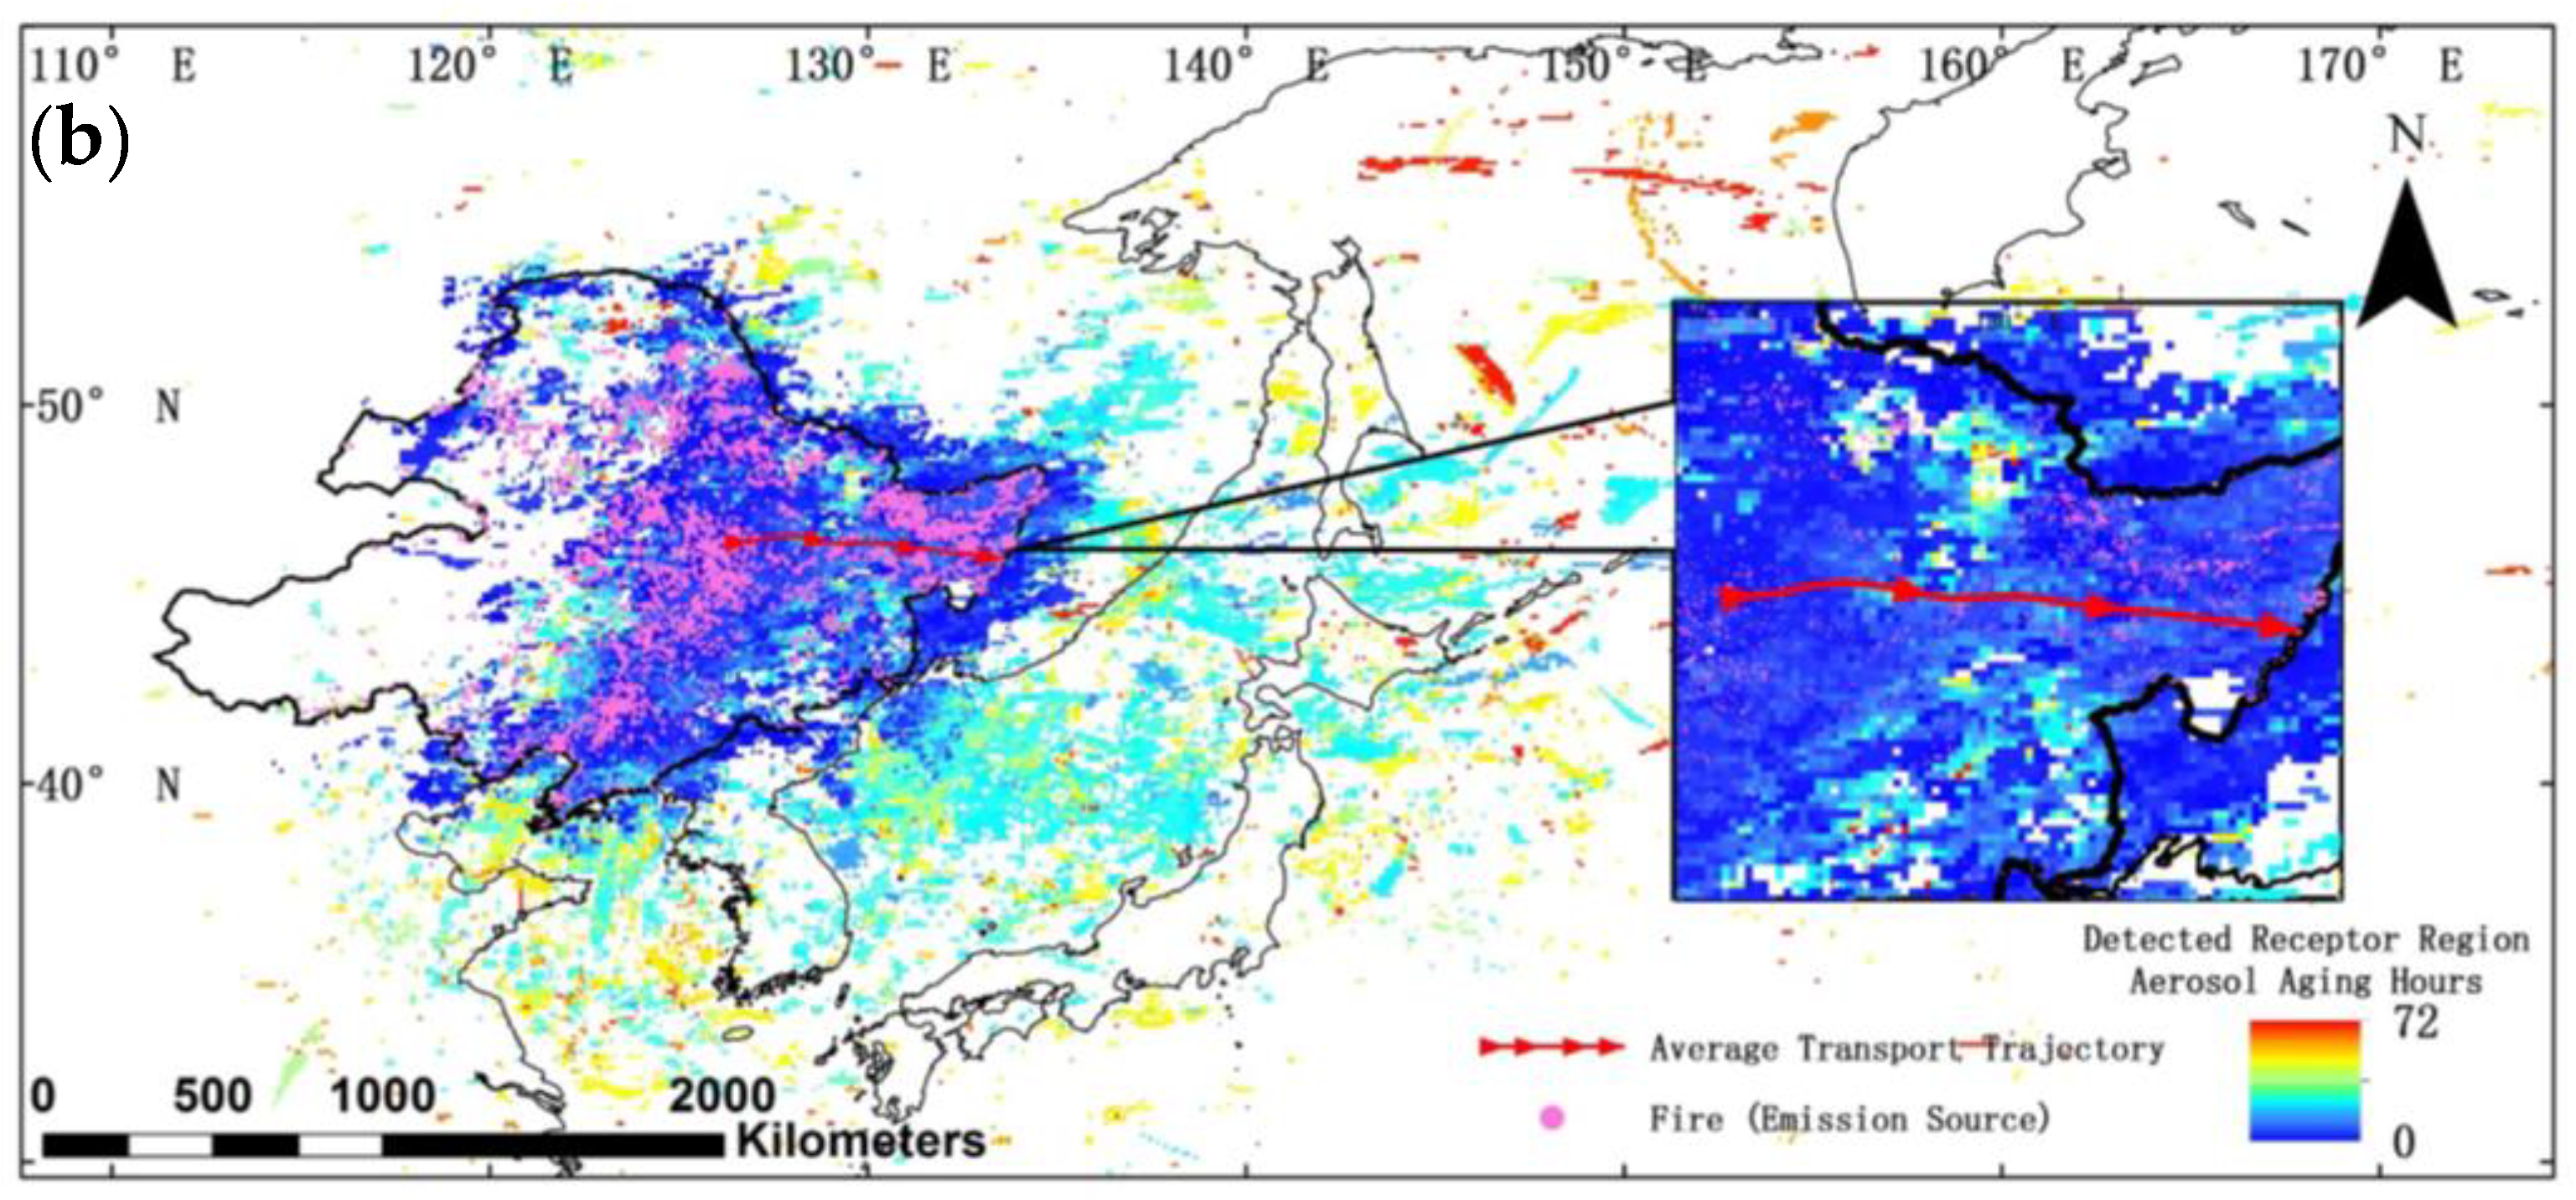
As we can see from Figure 3a, except for the source region of NEC, the biomass burning aerosol can be transported to the land areas of the Circum-Bohai-Sea region of China, the far east of Russia, the Korean Peninsula, and Japanese Islands; as well as the ocean area of the Bohai Sea, Yellow Sea, Sea of Okhotsk, Sea of Japan, and east of Japan over the North Pacific. However, in Figure 3a, the biomass burning aerosol emitted in the transmission path outside the NEC region, which is a significant emission source of pollution, cannot be filtered out in such area. Thus we further narrow down the aerosol identification criteria to fire points traced back only in the NEC region. Except for NEC itself, the direct influence region of NEC open biomass burning that we can confirm is confined to the Bohai Sea, Yellow Sea, Sea of Japan, and the adjacent land area near the eastern boarder of NEC, which is shown in Figure 3b. The reduced identified pixels from Figure 3a to Figure 3b indicate that such regions are influenced by biomass burning outside the NEC region. Thus, in the following sections, the study focuses on the aerosols which have only been traced back to fire point(s) in the NEC region, i.e., corresponding to the aerosols in Figure 3b.
In addition to the influence region, which represents the identified receptor regions of the biomass burning aerosol, the identified fire points are added to Figure 3b to represent the source of open biomass burning aerosol in NEC. Moreover, the average transport trajectory calculated from the identified HYSPLIT trajectories, which only have traced back fire point(s) in the NEC region, is also added to Figure 3b to represent the general trajectory of the aerosol emitted from open biomass burning in northeast China. As can be seen from the average transport trajectory, a general eastward transportation of aerosol emitted from open biomass burning in NEC can be concluded.
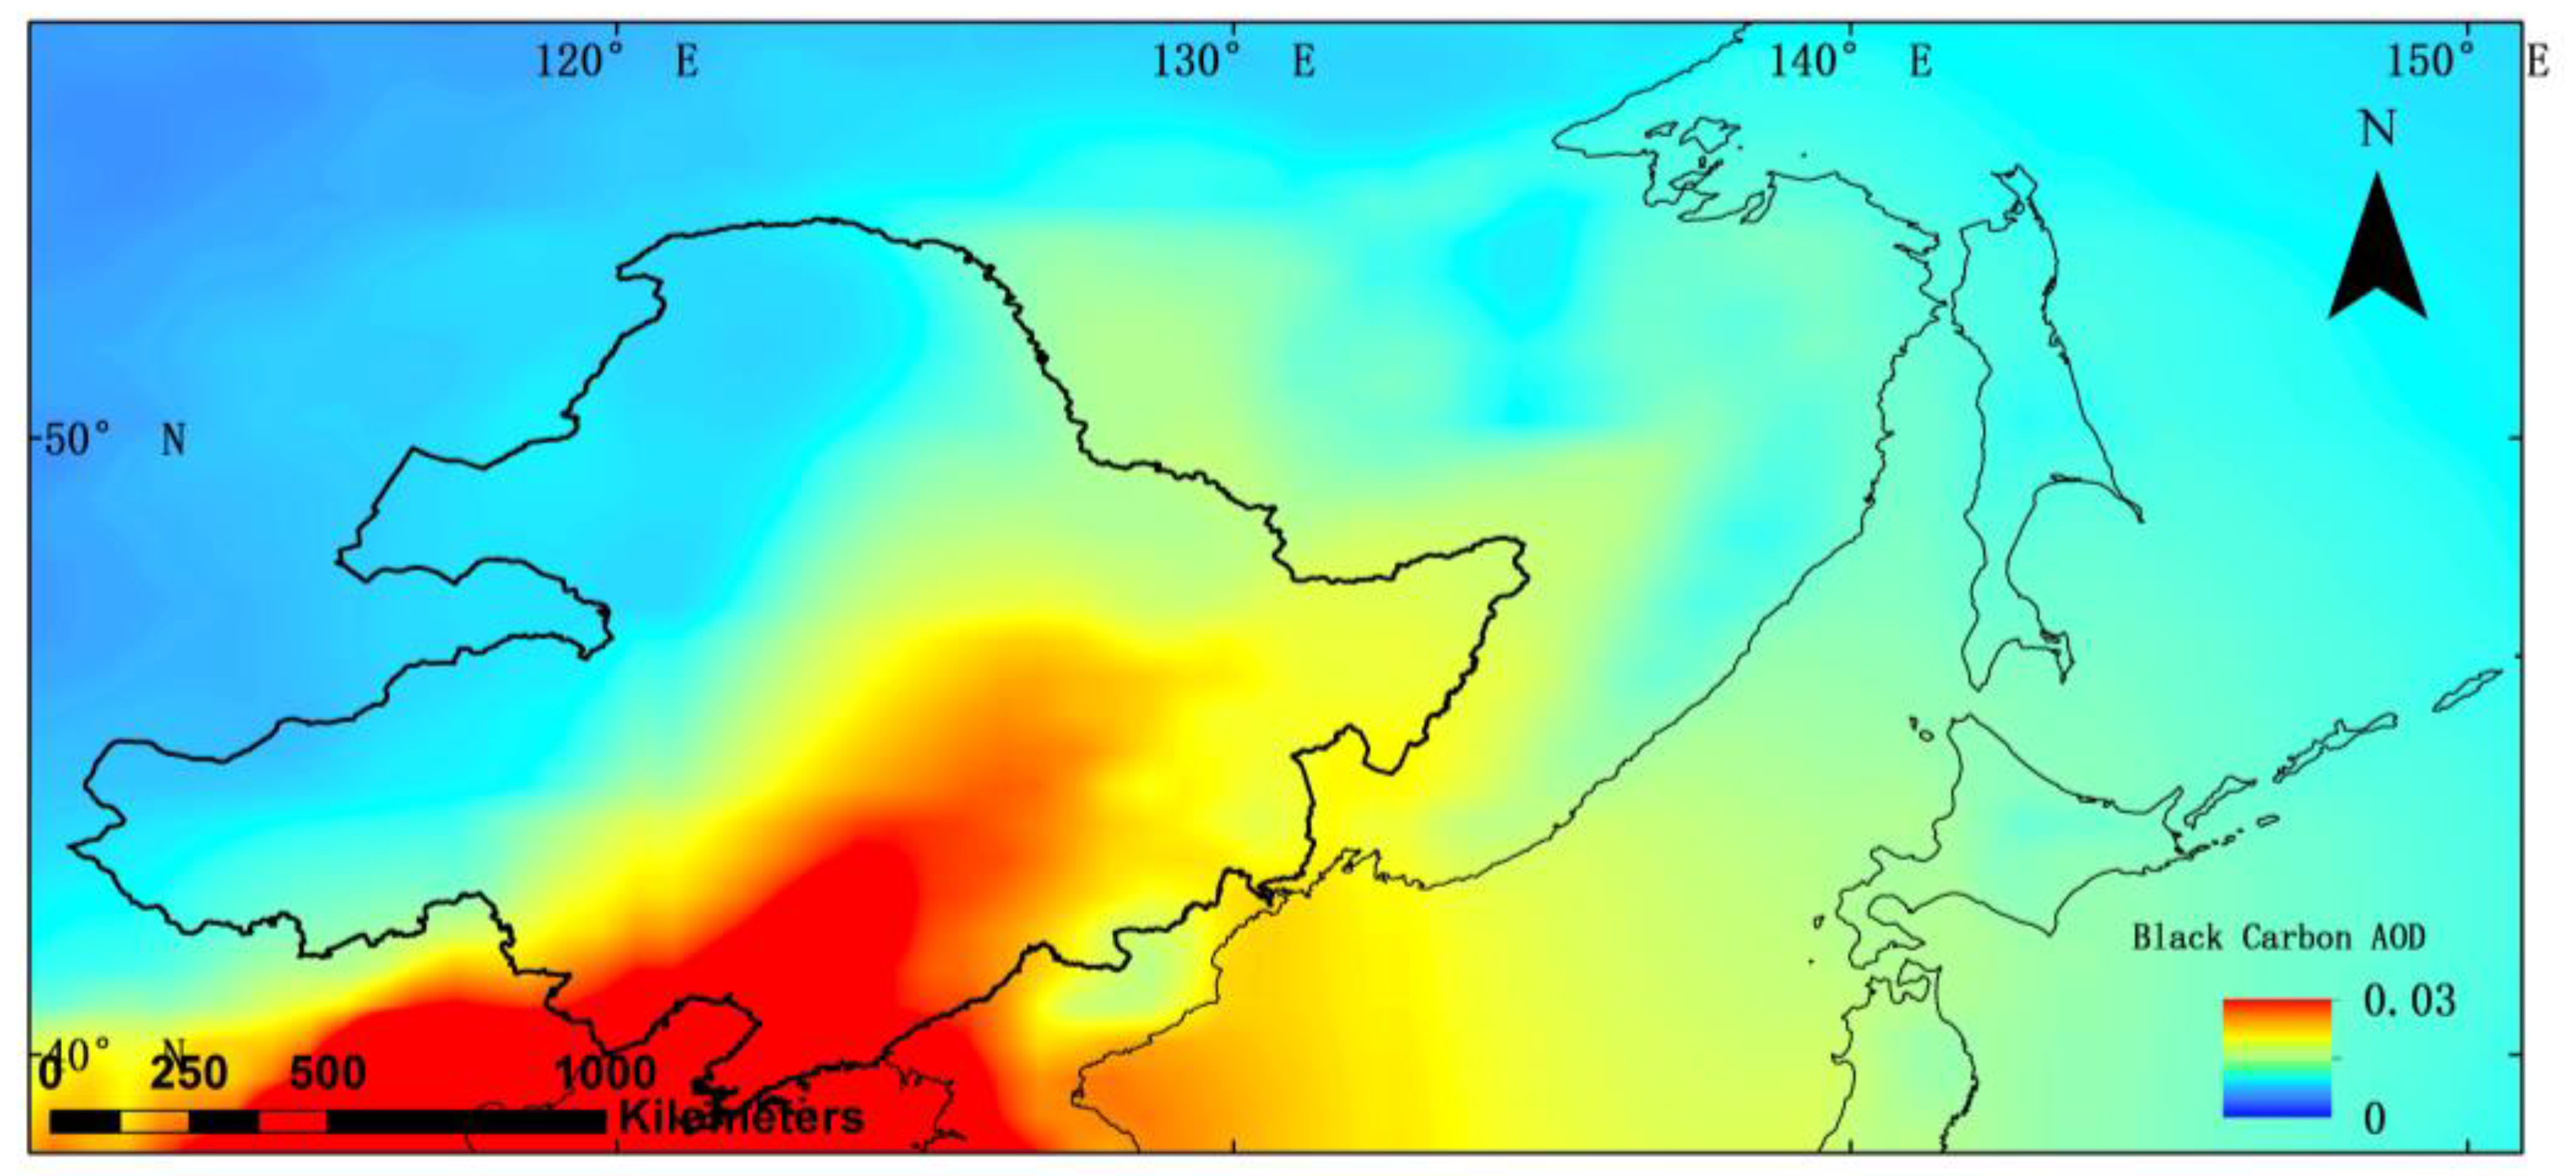
We further included the model data of Modern-Era Retrospective analysis for Research and Applications version 2 (MERRA-2) black carbon AOD [61] and calculated the average map from 2005 to 2013, which is shown in Figure 4, to compare with our influence region identified in this research from satellite observation. Black carbon aerosol is mainly produced by biomass burning and fossil fuel combustion. The average black carbon AOD map can represent how the aerosol distribution is impacted by the biomass burning to some extent. However, in view of the nonnegligible black carbon produced by fossil fuel combustion, the distribution of black carbon AOD may also reflect the emission of fossil fuel combustion, especially in urban areas. Thus, the black carbon AOD distribution in non-urban areas should be primarily focused on the comparison. A significant black carbon plume transporting eastward from the middle of NEC region can be clearly seen in Figure 4, which is consistent with the influence region identified in this research from satellite observation.
4.2. General Aging Characteristic
For the filtered aerosol in Figure 3b. The primary and secondary aerosol properties listed in Table 1 are combined with the identified aerosol aging time to study the general aging characteristics of the aerosol emitted from open biomass burning in NEC.
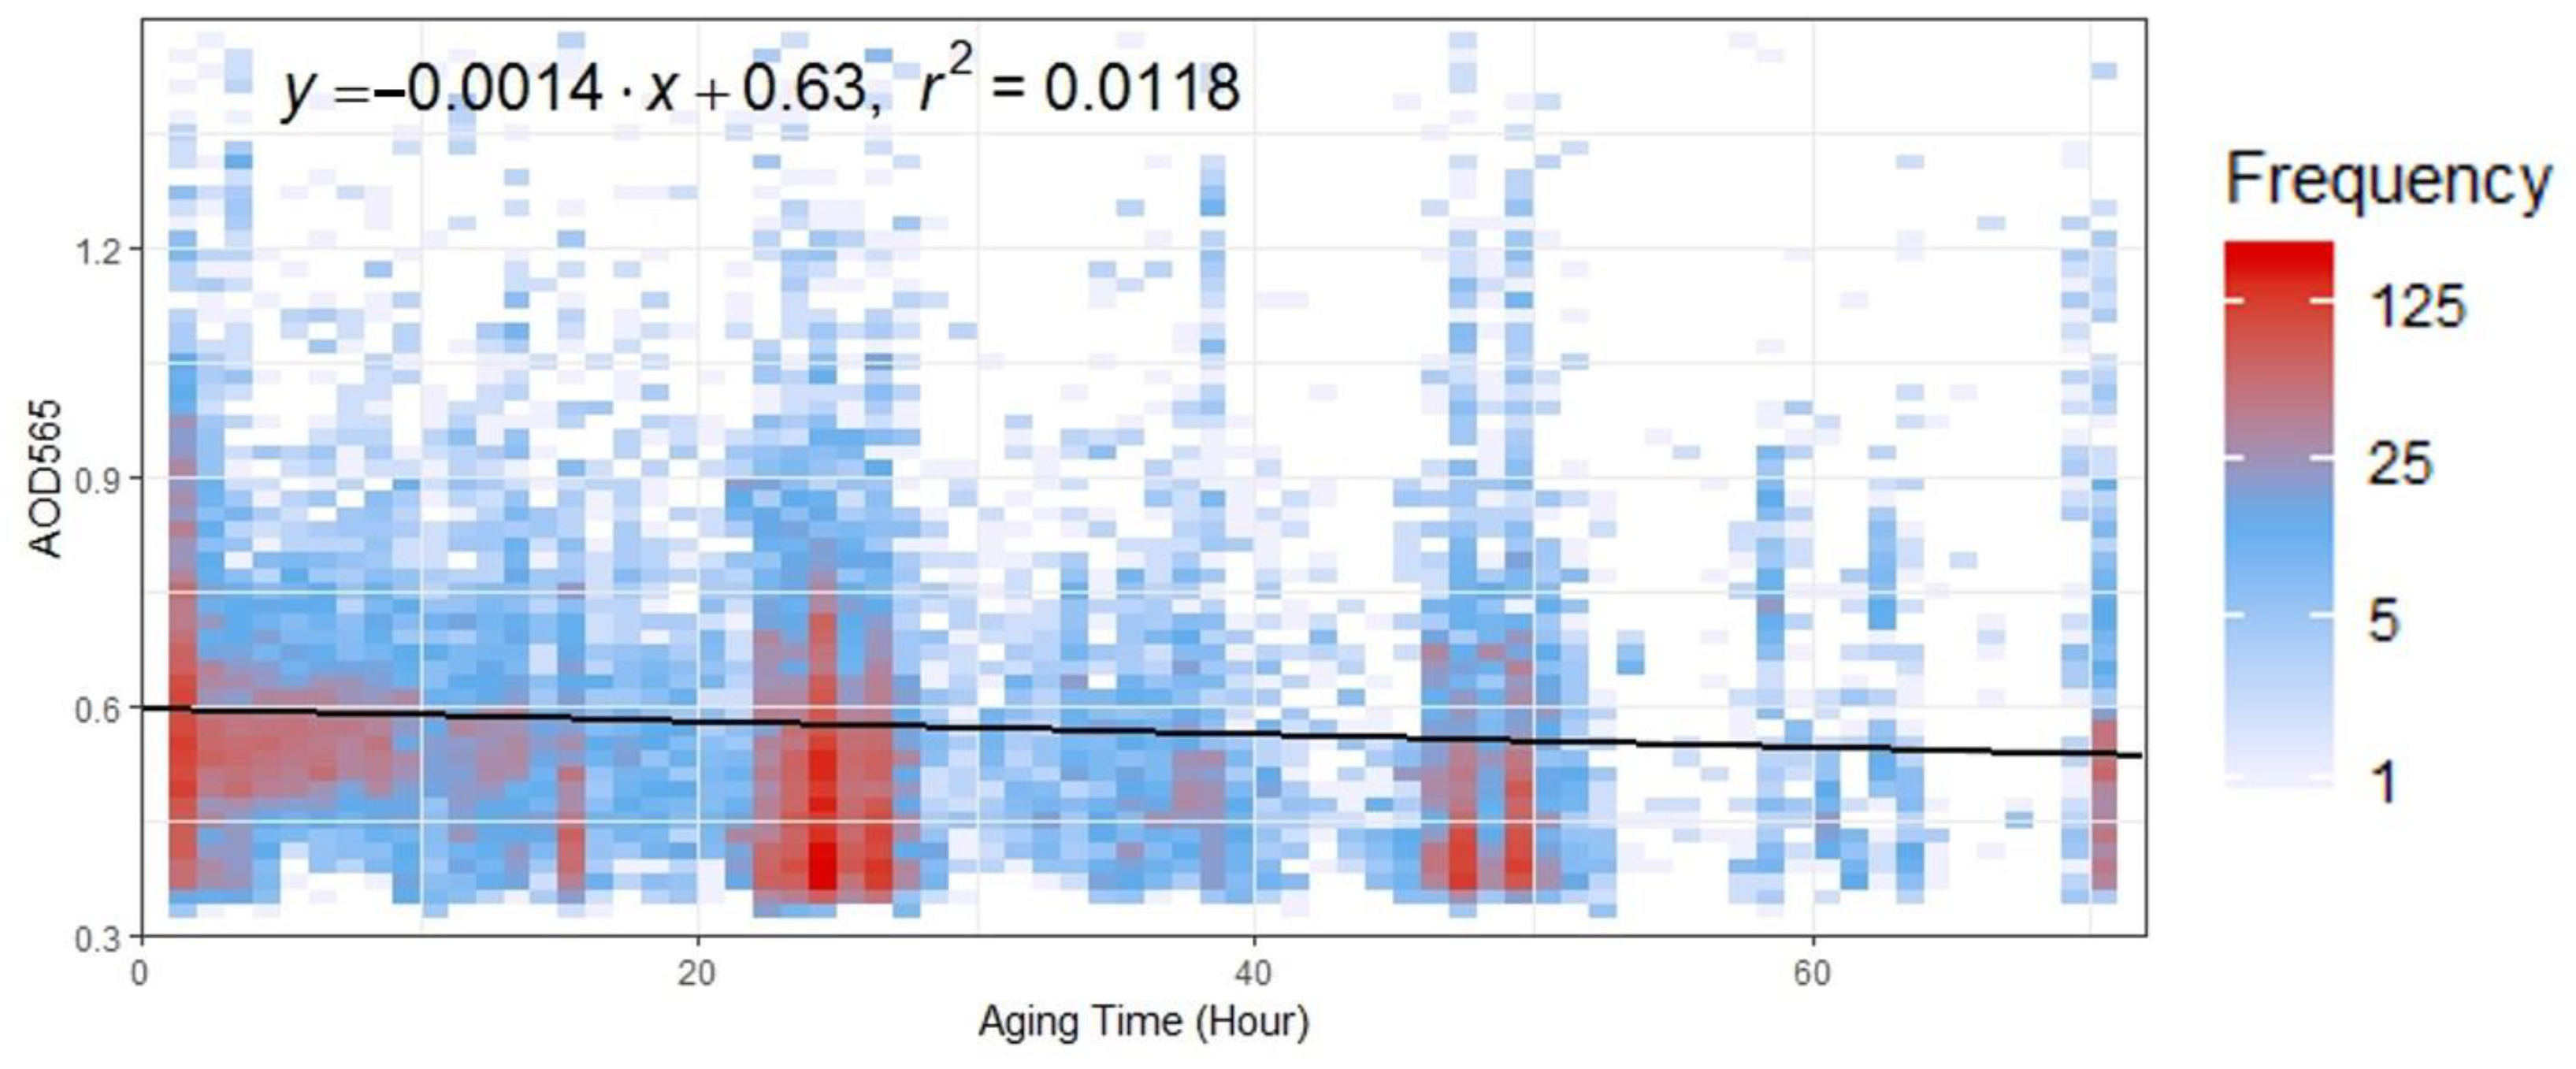
The change of AOD at 565 nm with aging time is shown in Figure 5. In general, a decline in AOD during the transport process is found. According to the linear regression result, during the 72-h aging process after biomass burning emission, the AOD at 565 nm drops from 0.63 to 0.53, with a 16% decline.
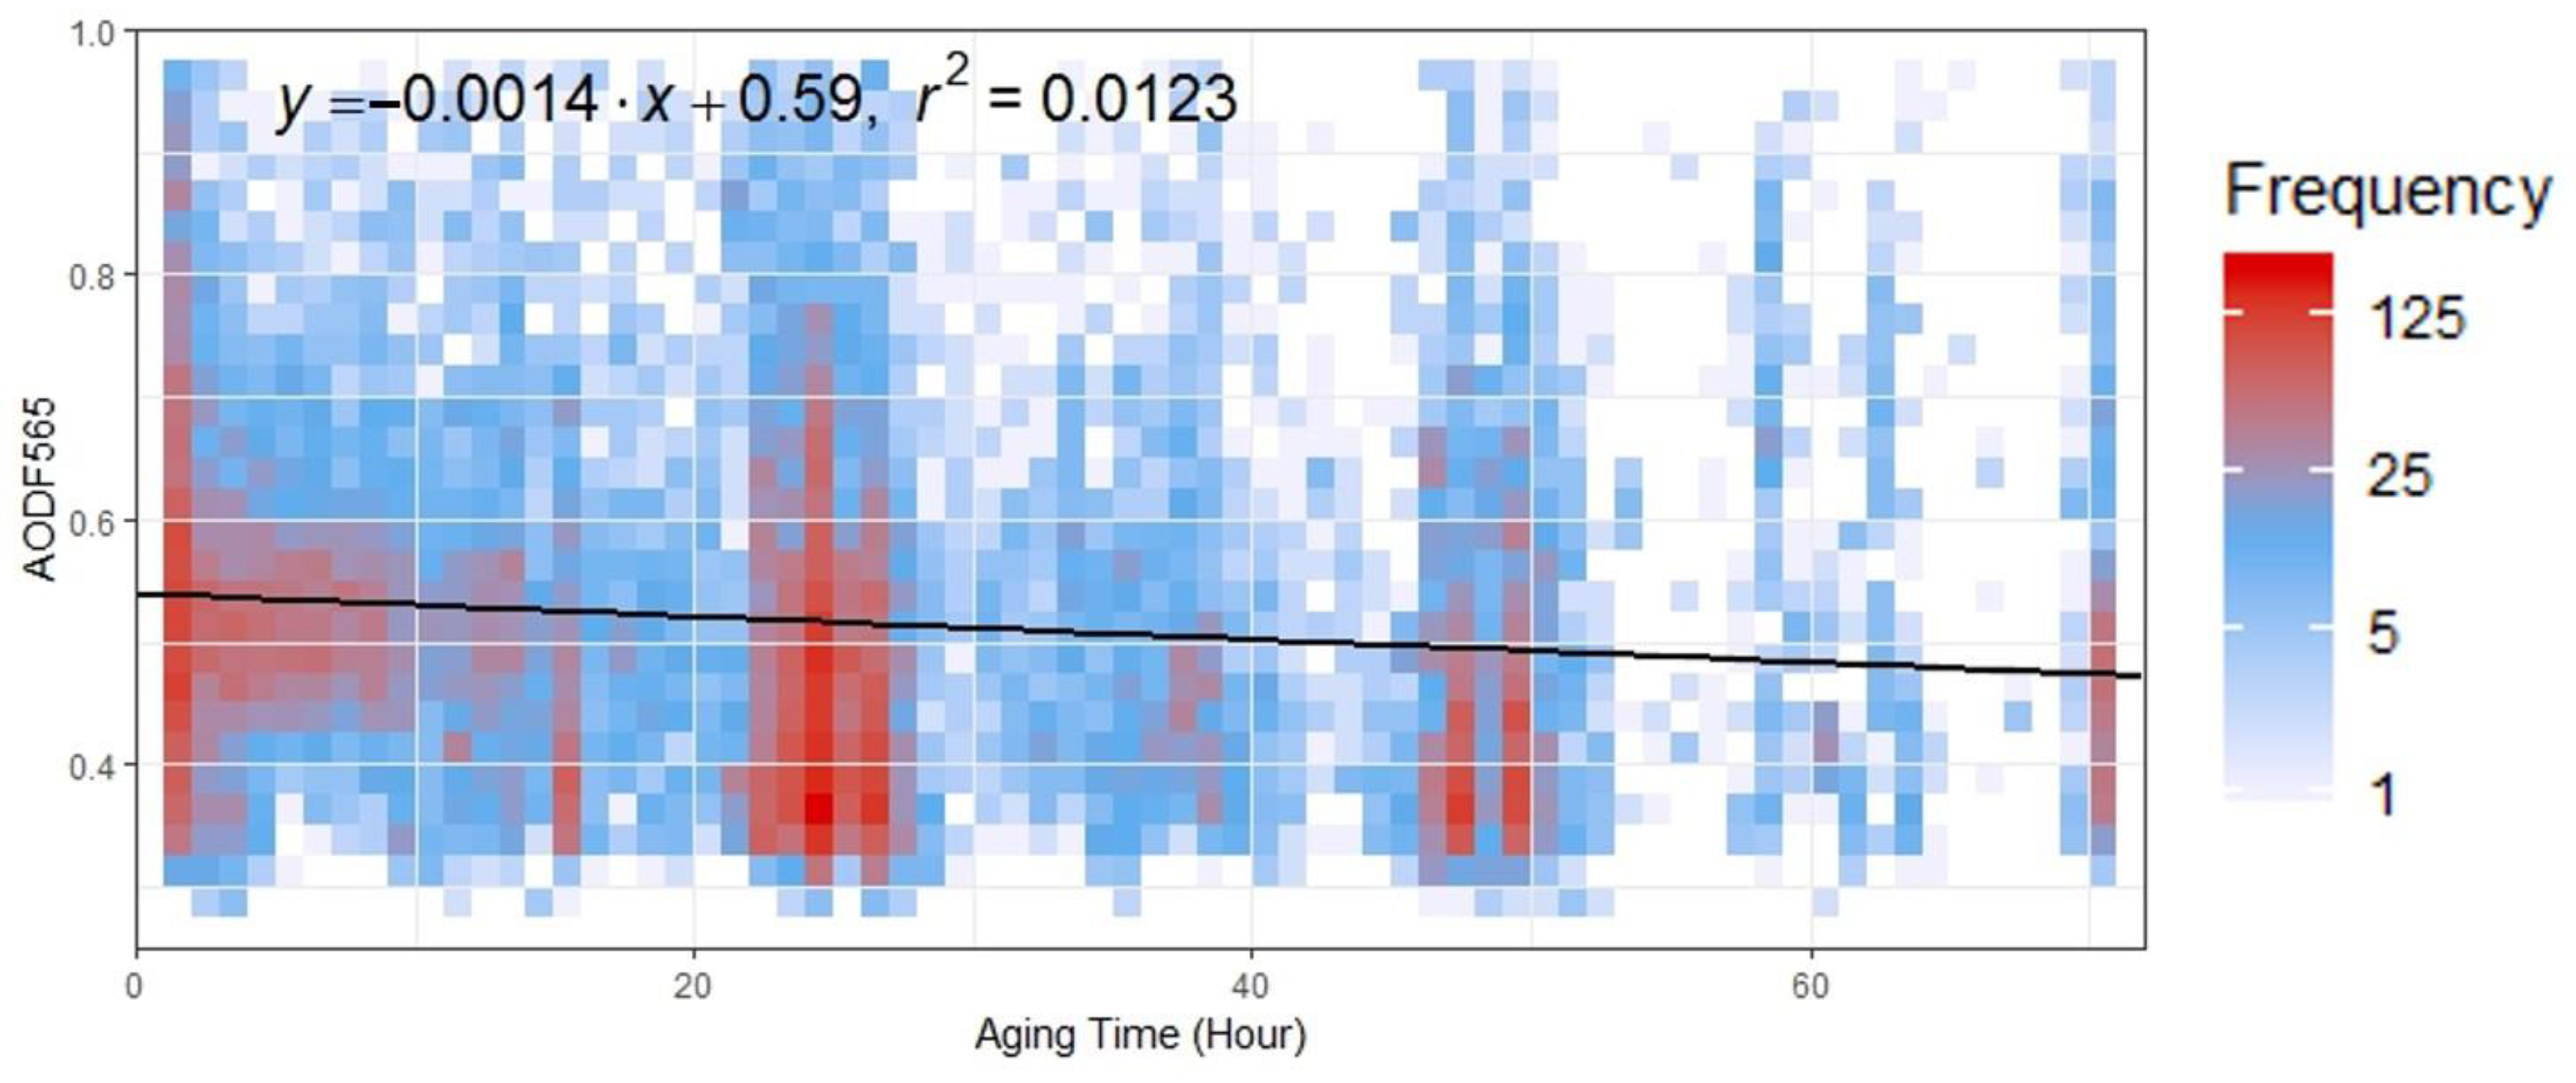
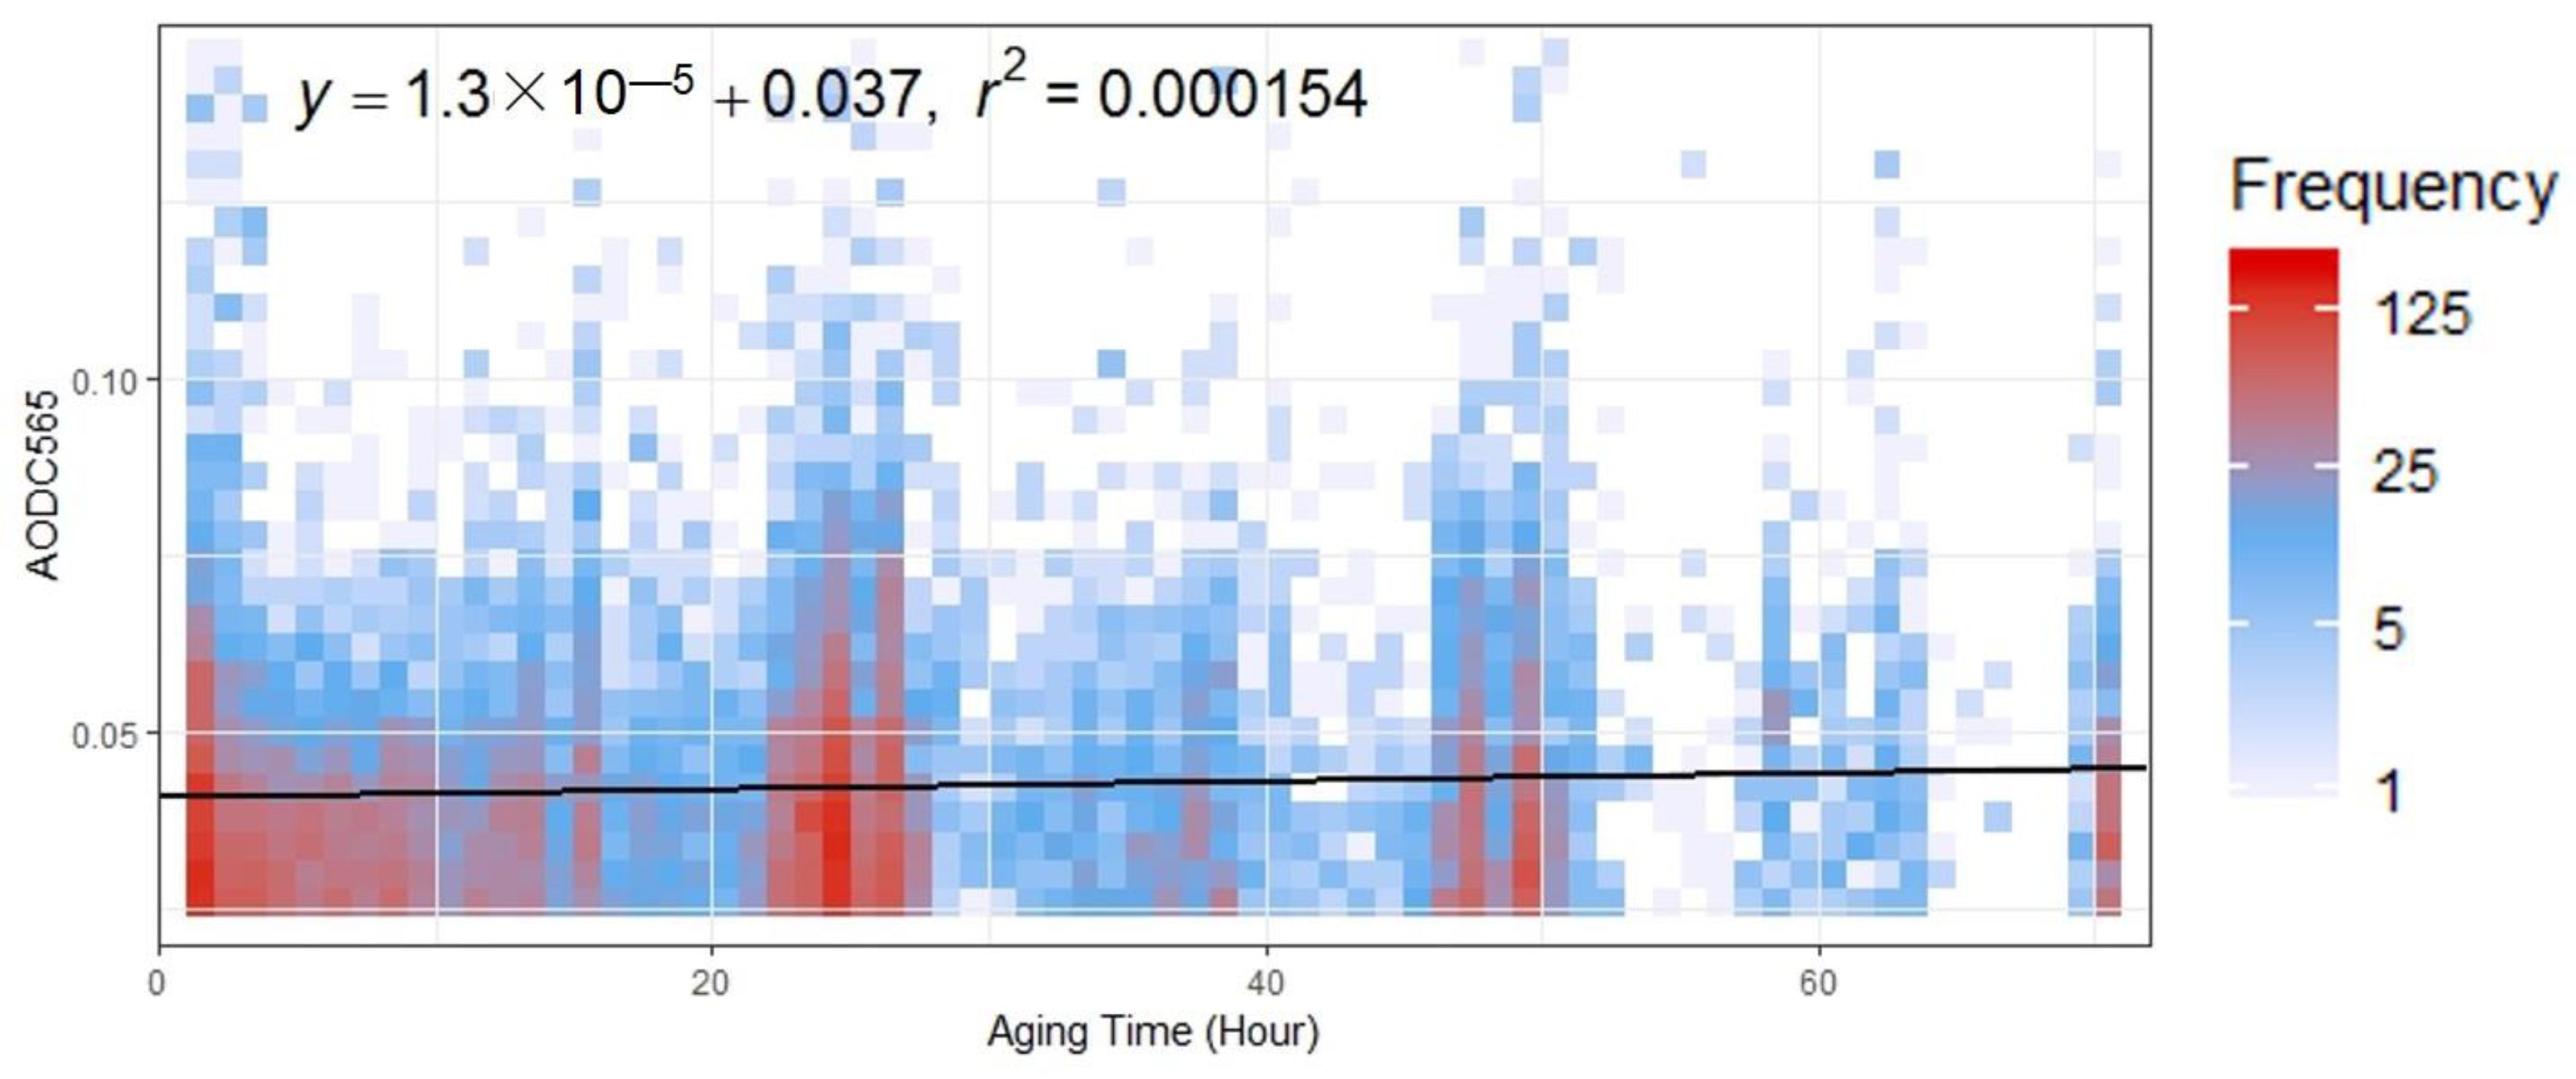
We further investigated the change of fine-model AOD and coarse-model AOD at 565 nm during the aging process. For fine-model AOD in Figure 6, A similar decline trend as Figure 5 was found, which dropped from 0.59 to 0.49 (nearly 17% decline) during the 72 h aging process after biomass burning emission. However, although the AOD and fine-model AOD decreased, a slight increase trend of coarse-model AOD at 565 nm during the 72 h aging process after biomass burning emission was found, which is shown in Figure 7.
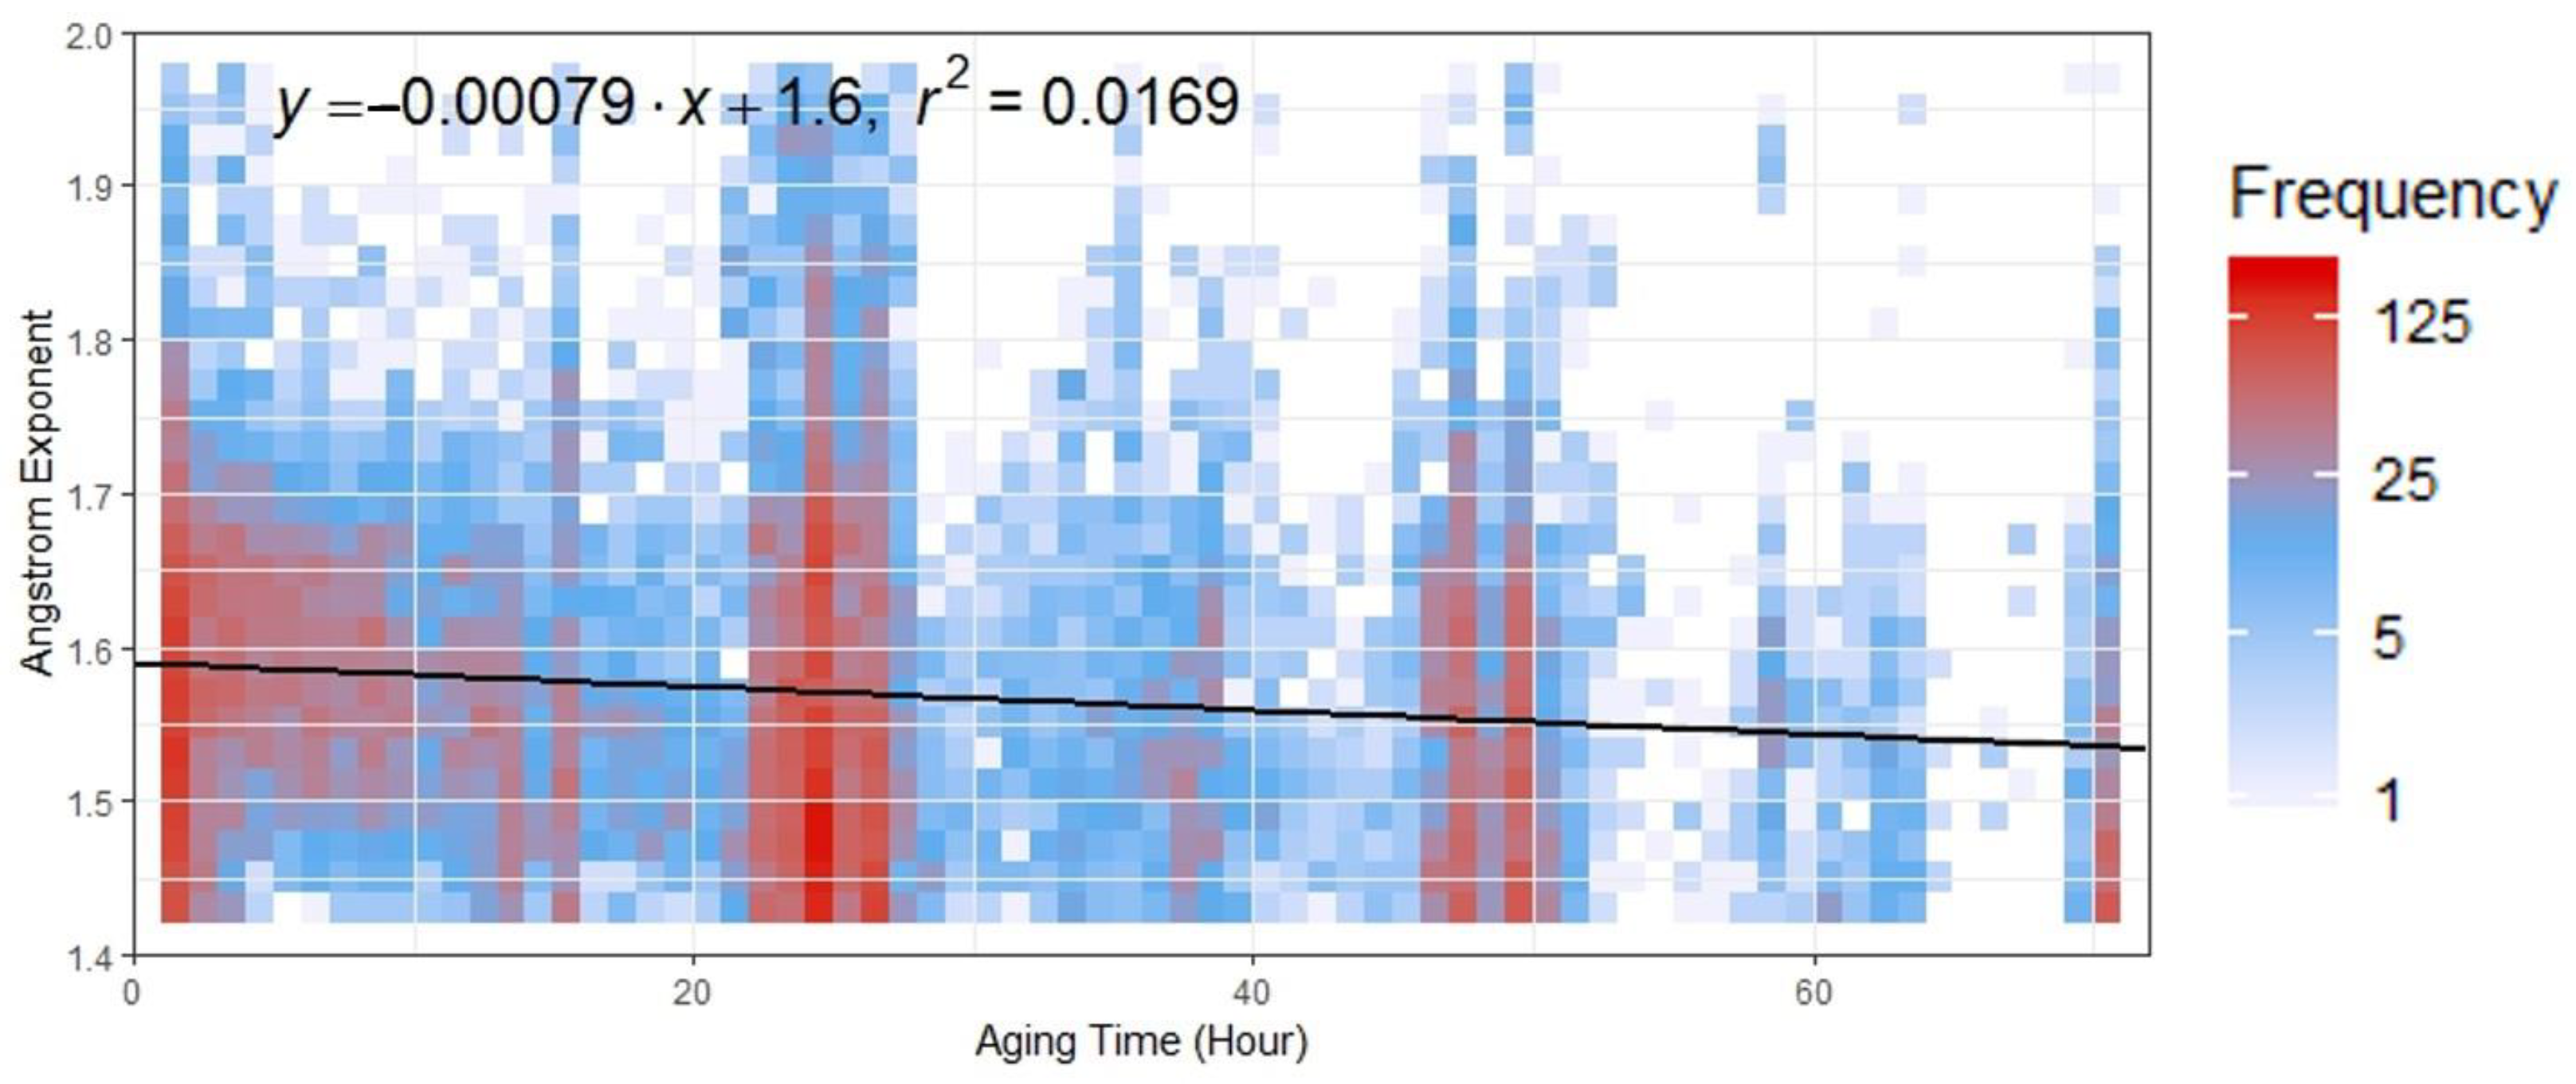
After combining Figure 6 and Figure 7, we can infer a particle size growth during the aging process after biomass burning emission. Moreover, the density scatter plot of Angstrom Exponent with aging time for the aerosol emitted from open biomass burning in NEC is given in Figure 8. A foreseeable decline from 1.6 to 1.54 was found, also proving the growth trend of particle size during the aging process after biomass burning emission.
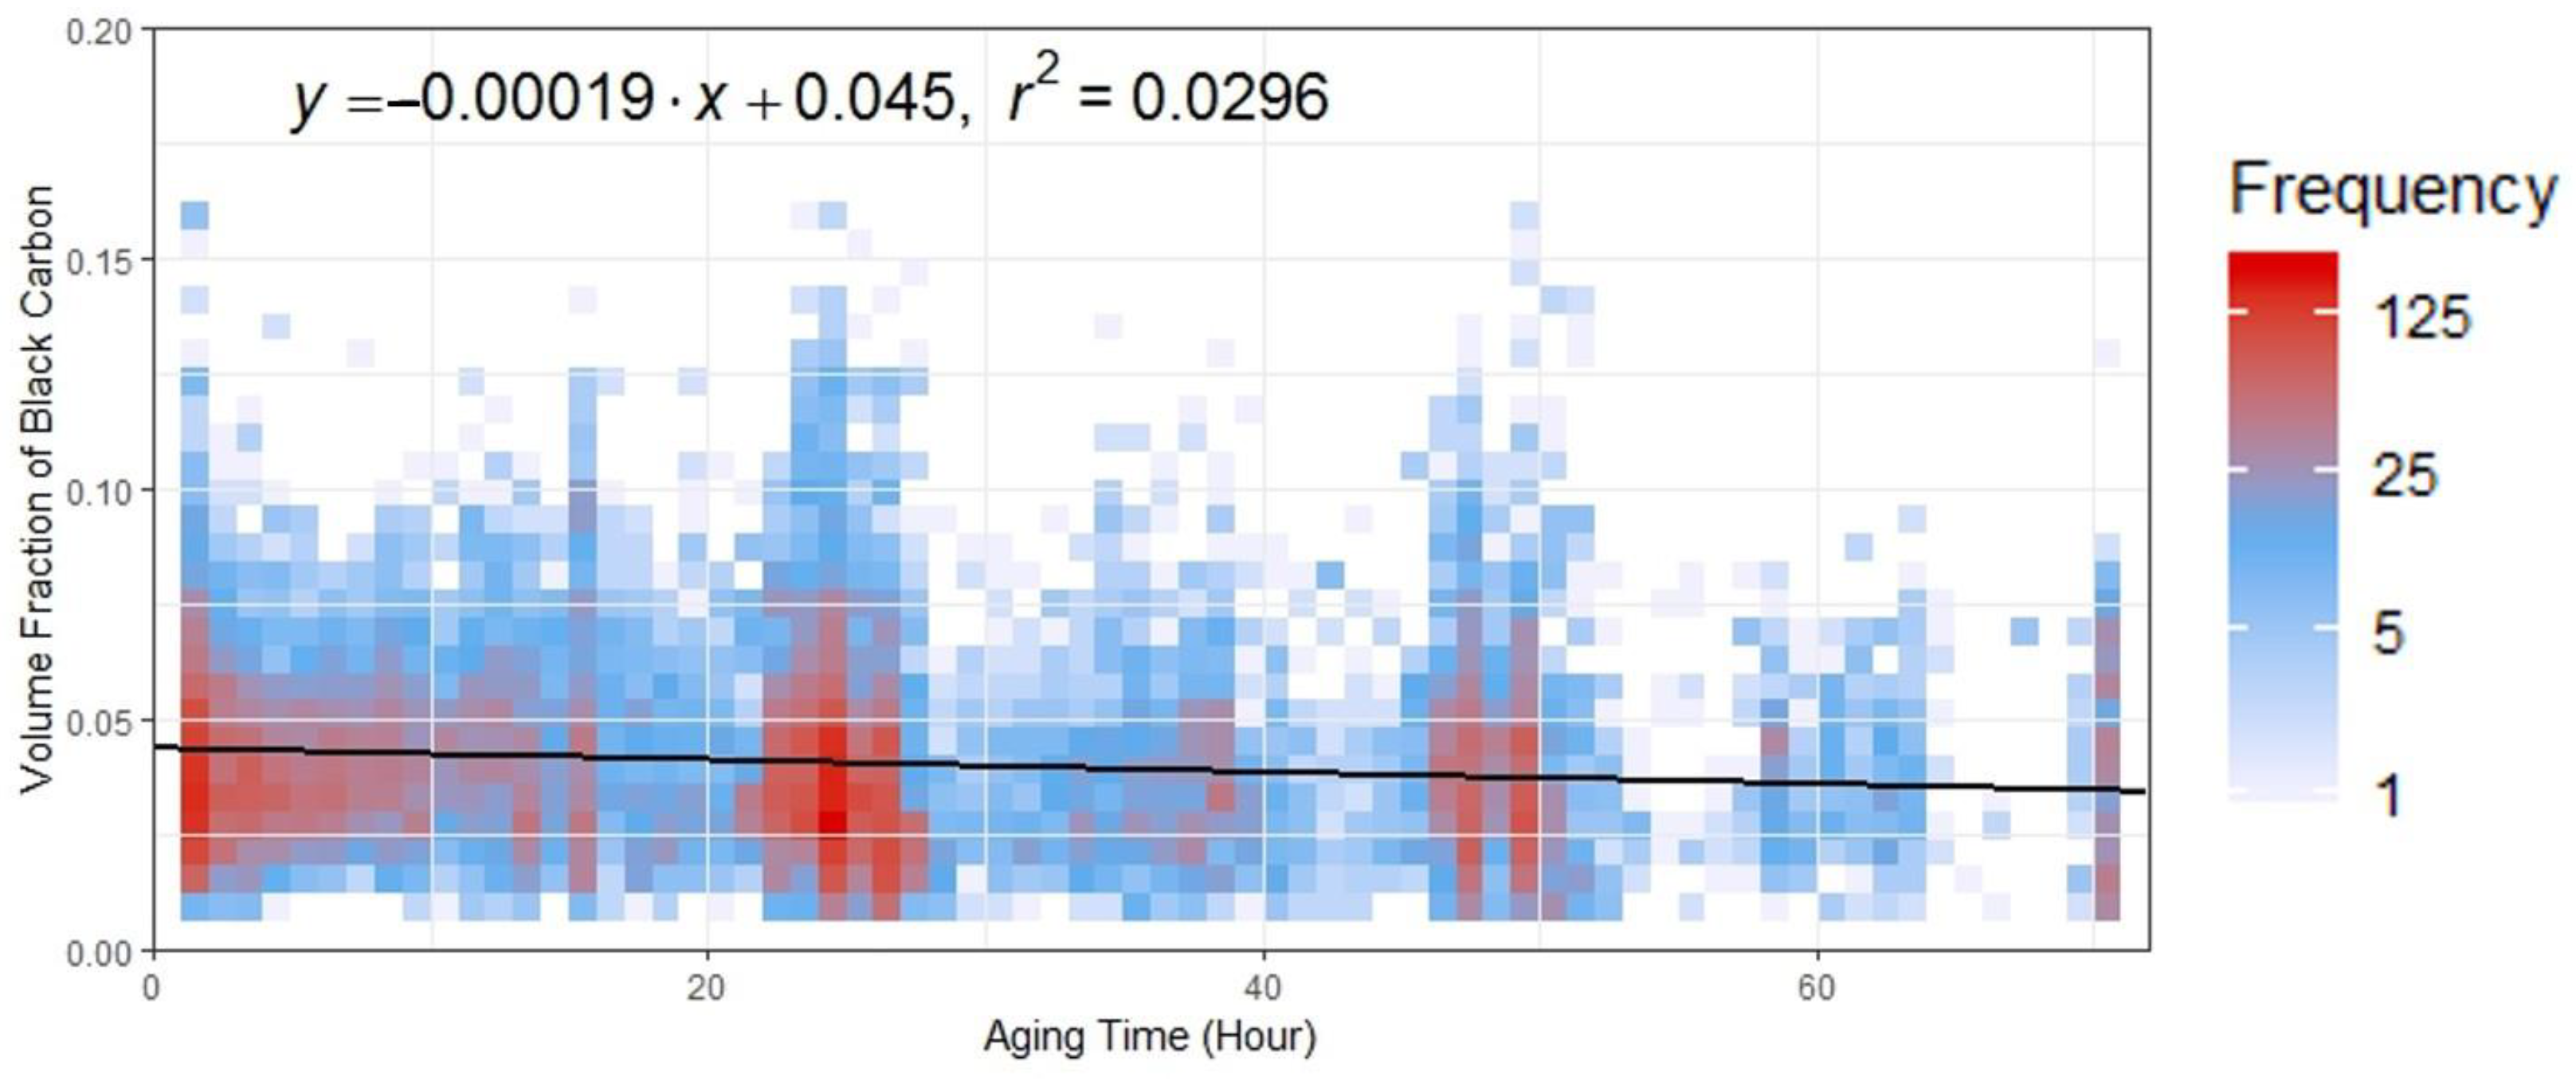
A decrease trend was found in the volume fraction of black carbon in Figure 9. The volume fraction of black carbon decreased from the value of 4.5% after releasing to the value of 3.1% after 72 h’ aging. Thus, a total 30% decrement occurs for the black carbon content in the aerosol during the 72 h aging process after biomass burning emission. Besides, the decrease trend of black carbon AOD along the direction of transmission plume in the average map of MERRA-2 model result shown in Figure 4 further proves our finding in Figure 9.
Black carbon is the most important absorption content in the aerosol, especially for biomass burning aerosol. The obvious decrement in the volume fraction of black carbon leads to a series of consequences. One of the results reflect on the single scattering albedo of the aerosol. Figure 10 gives the evolution of SSA in the 72-h aging process after biomass burning emission, which increases from the fresh state of 0.84 to the 72 h aging state of 0.89. Although some reversed patterns are reported [62], our finding is in accordance with most research results around the world [63]. The increment of SSA further affect the climate effect of the biomass burning aerosol, which is analyzed in detail in Figure 11, Figure 12 and Figure 13.
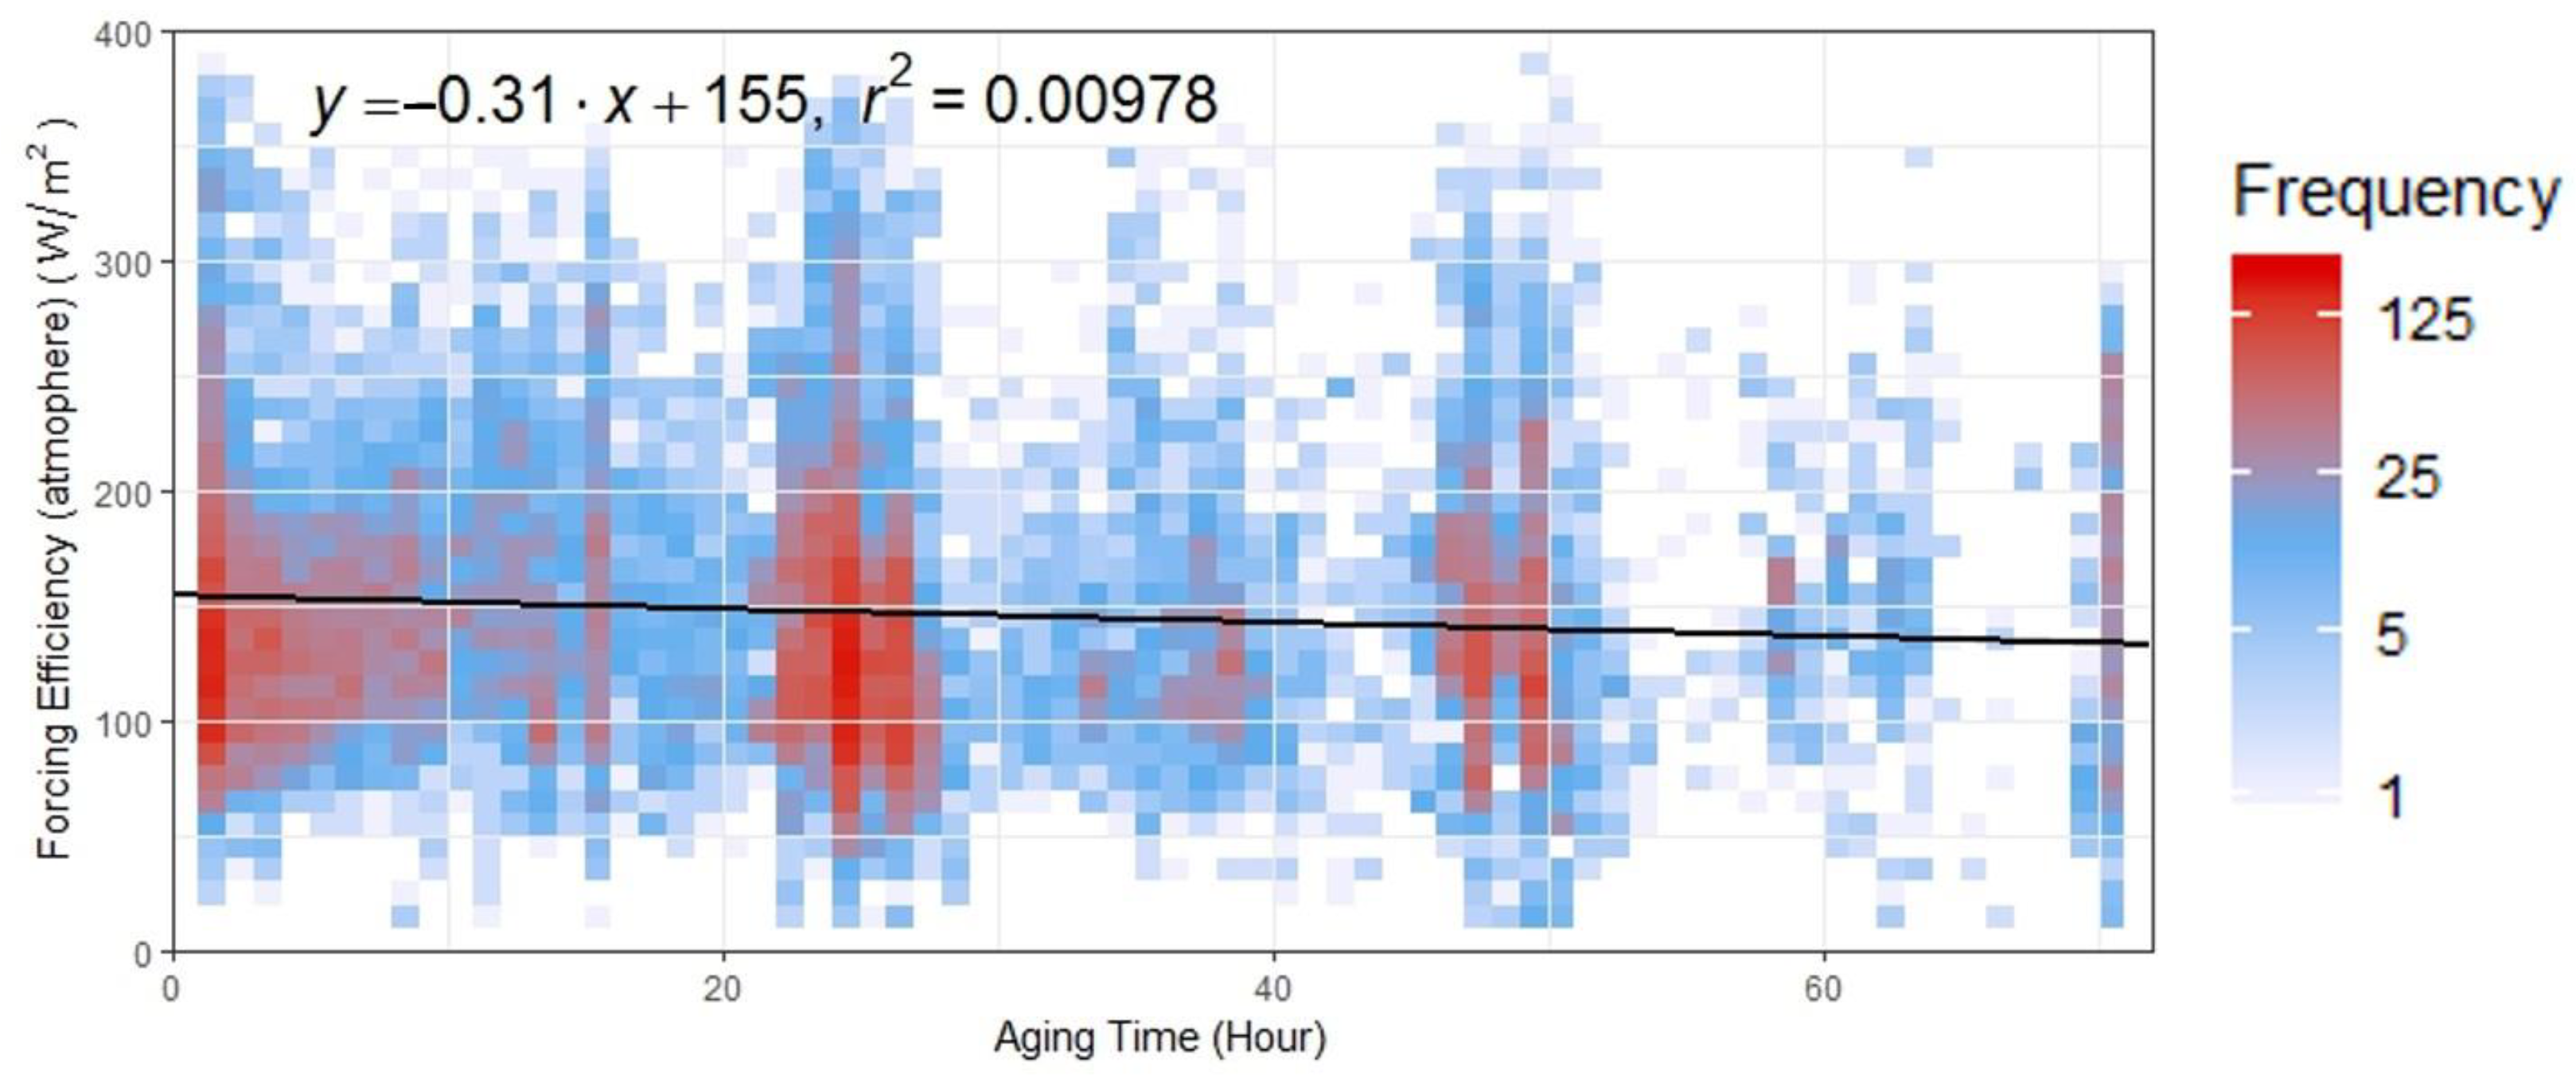
Figure 11 shows the aerosol forcing efficiency at atmosphere level. This aerosol property can reflect the influence on the radiation energy absorbed by the whole atmosphere, due to the existence of aerosol. A general 14% weaker trend of positive forcing efficiency from 155 W/m2 to 133 W/m2 occurs during the 72-h aging process after biomass burning emission. That means, during the aging process, the warming effect in the whole atmosphere is reduced.
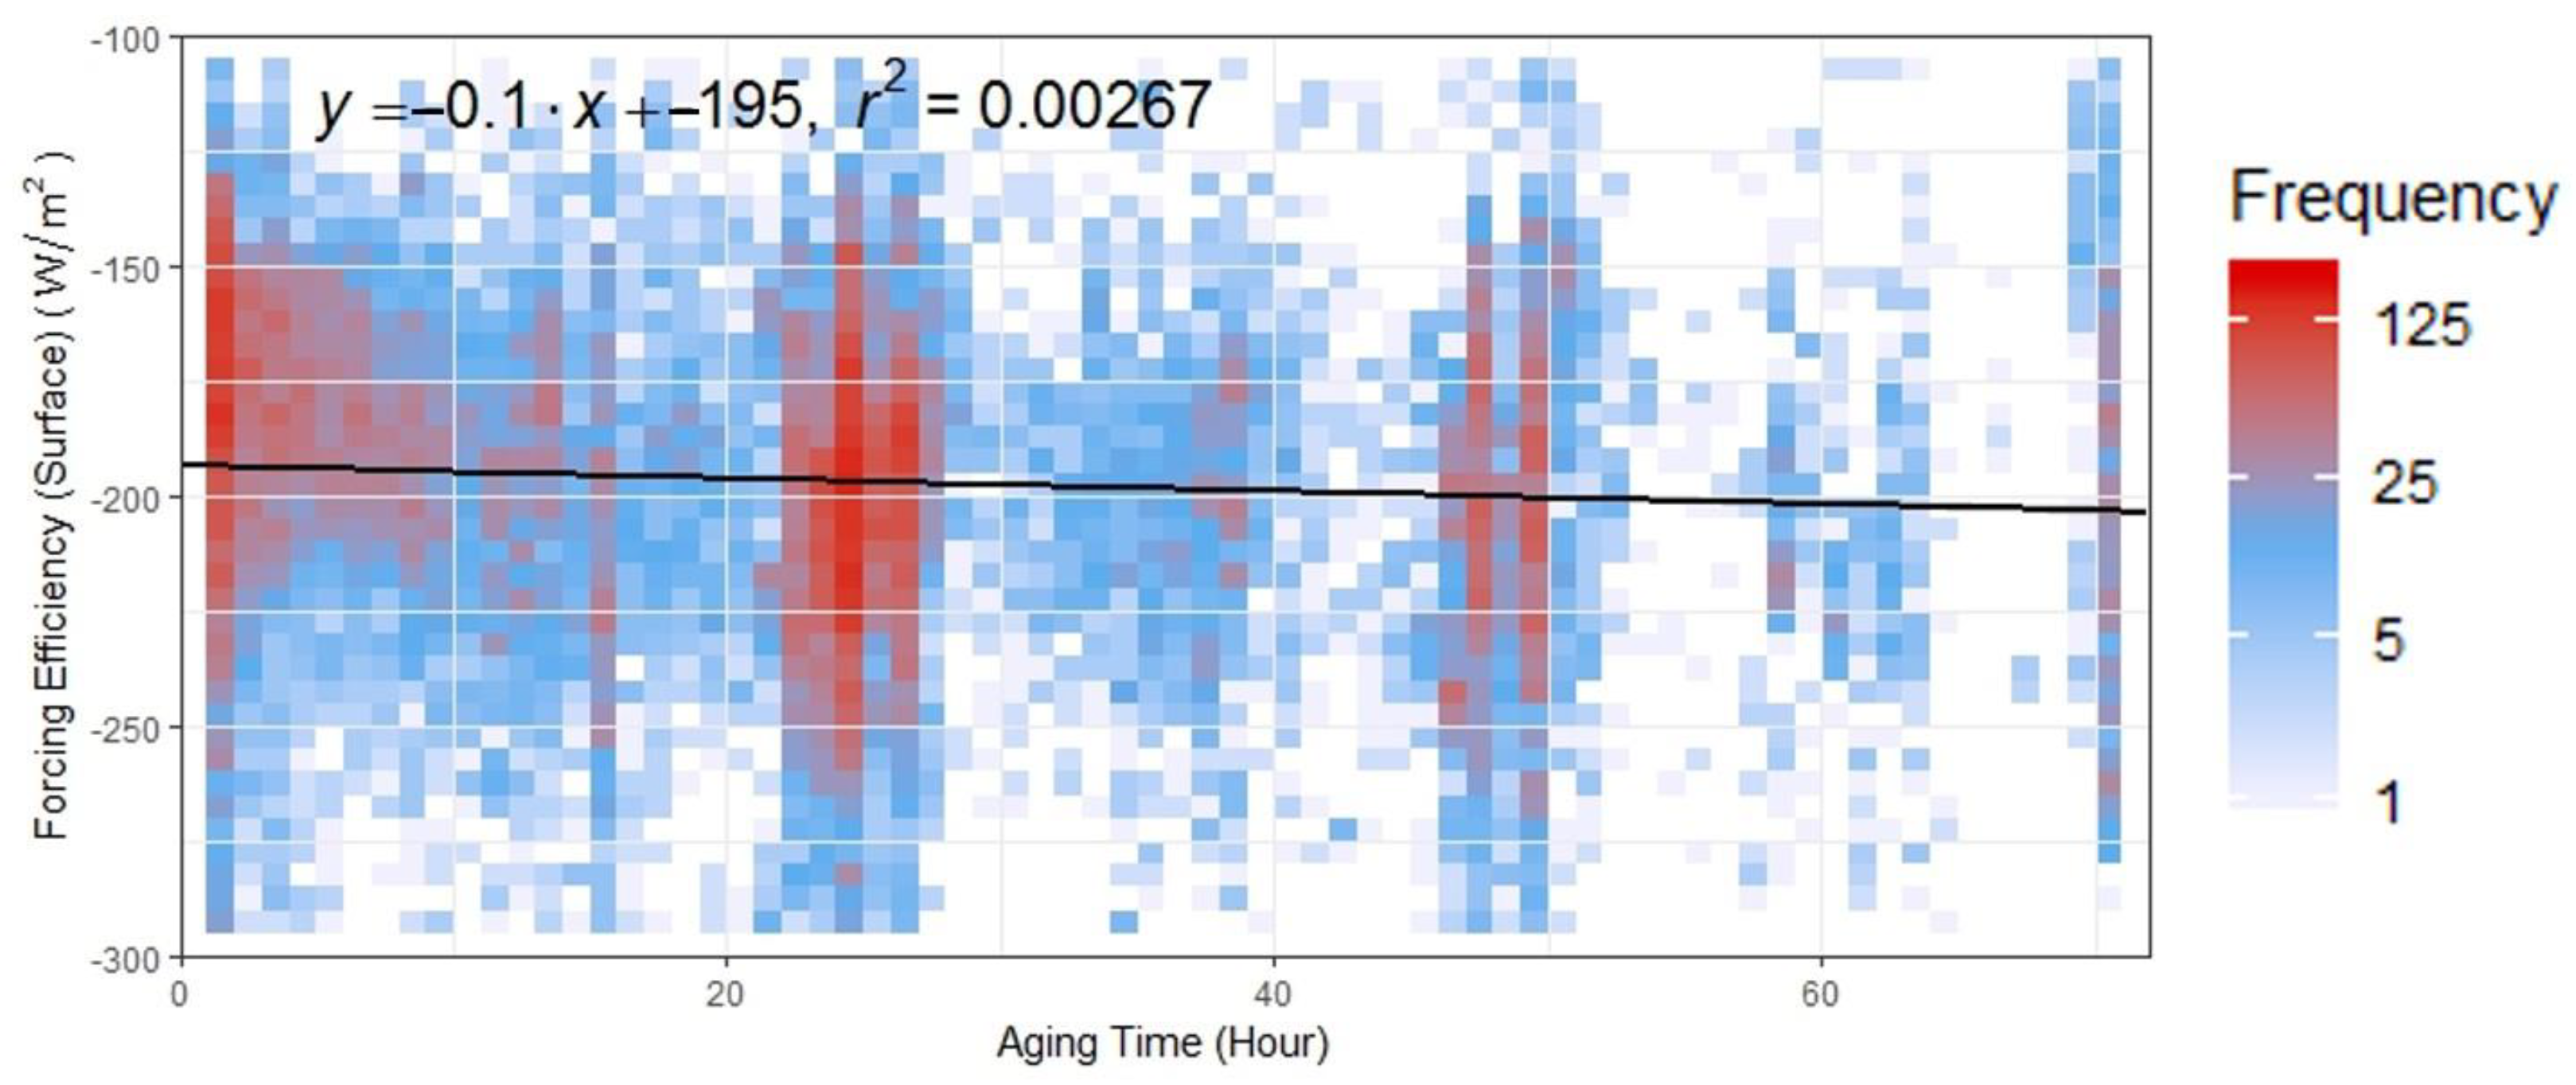
As for the aerosol forcing efficiency at surface level. A slight enhancement of negative forcing efficiency from −195 W/m2 to −202 W/m2 was found in Figure 12. That means, during the aging process, the cooling effect on the surface due to the existence of aerosol is strengthened.
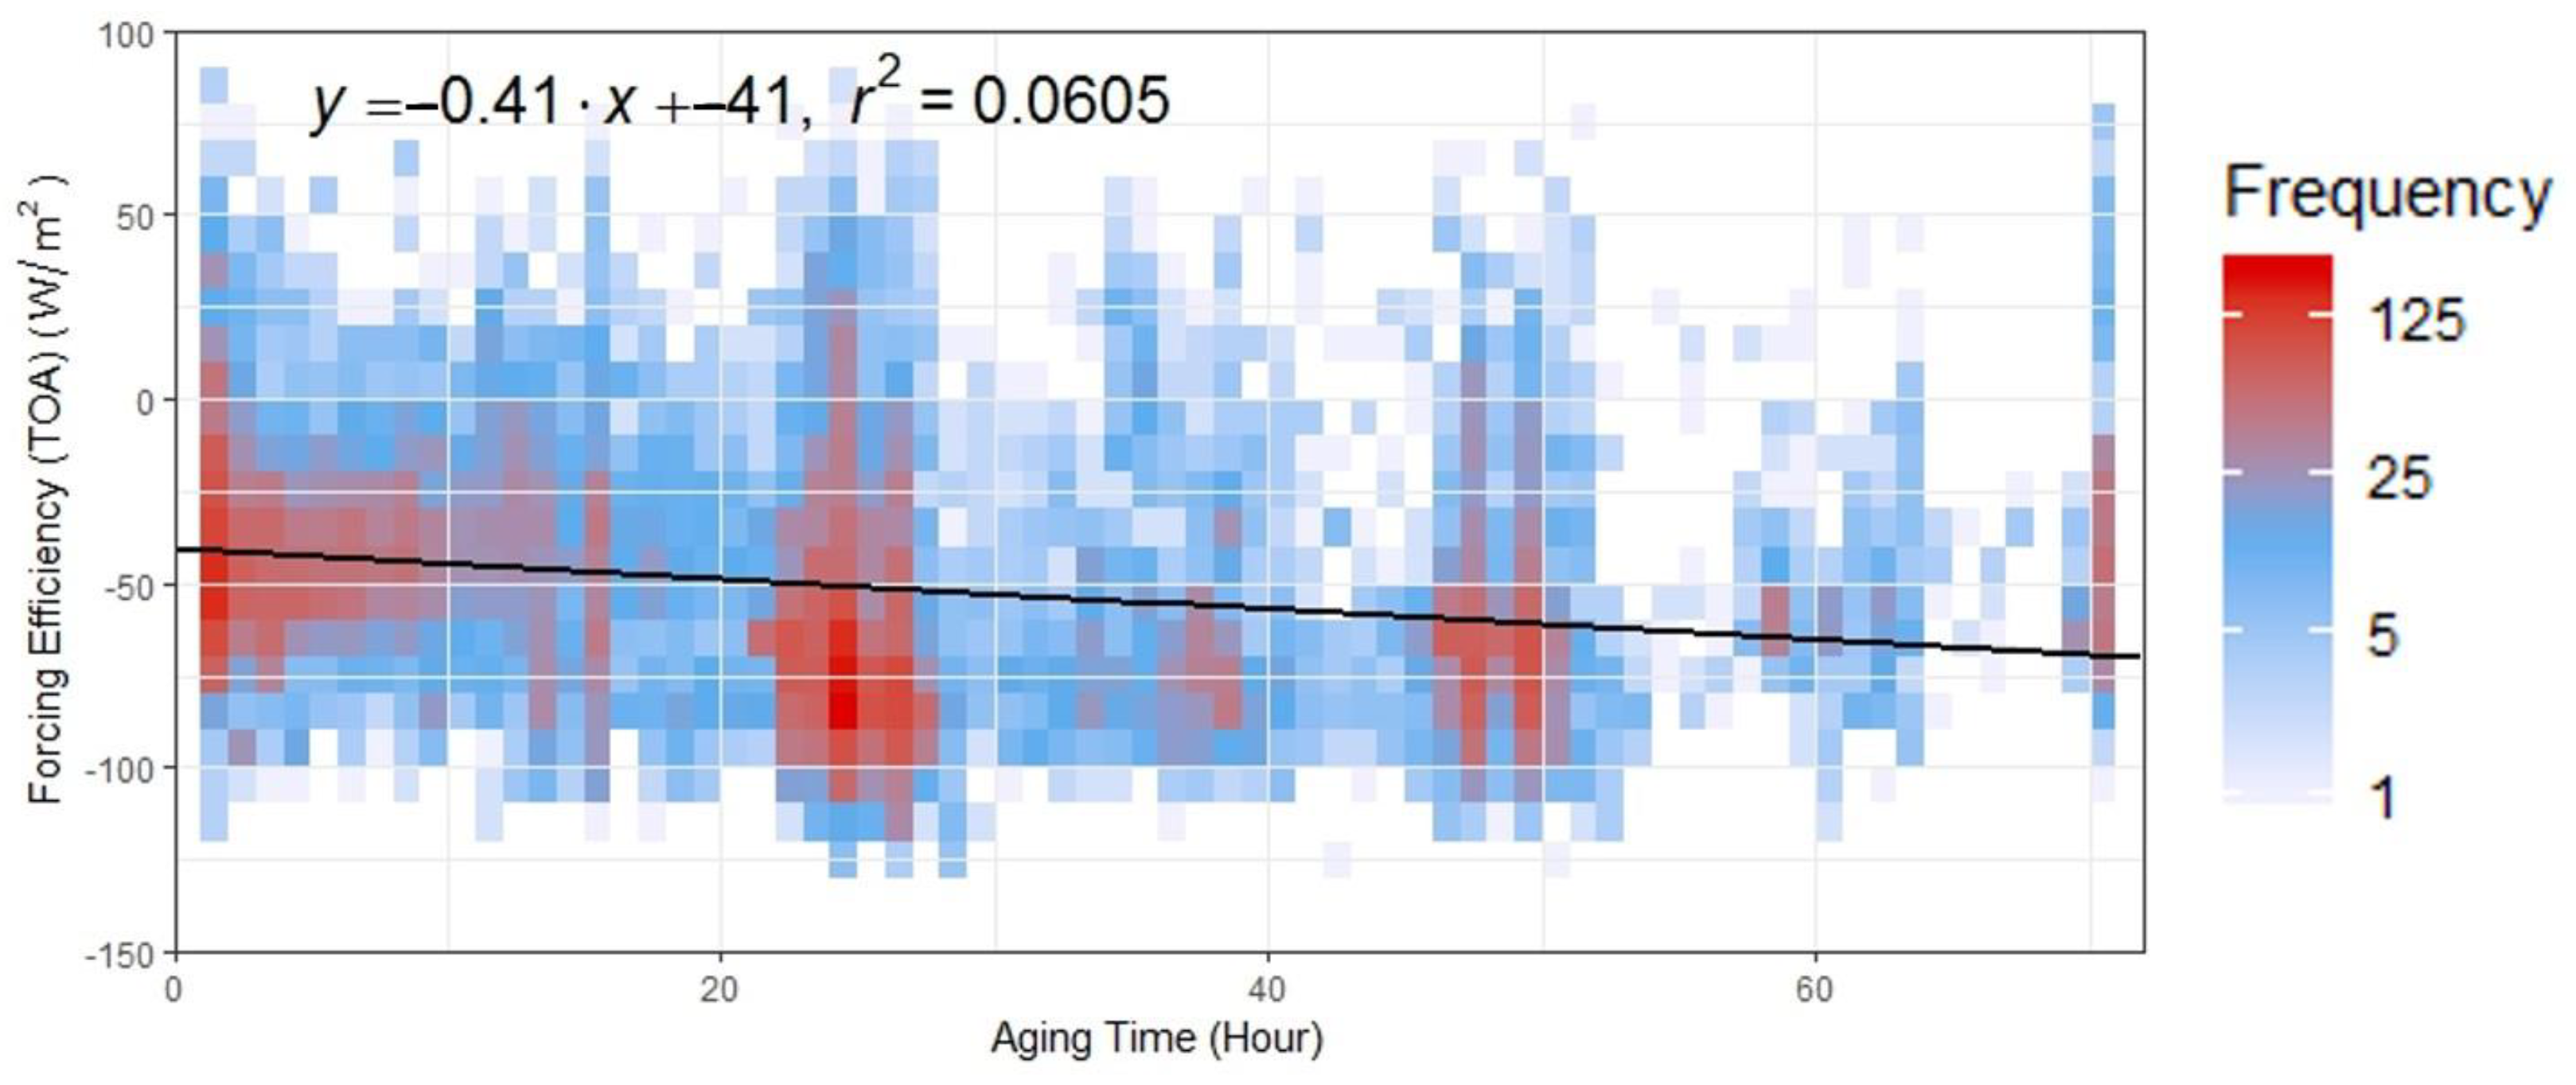
Considering the aerosol forcing efficiency at atmosphere level and surface level together, we can finally calculate the aerosol forcing efficiency at TOA level. A significant strengthening from −41 W/m2 to −71 W/m2 during the 72 h’ aging process after biomass burning emission can be observed. That means, during the aging process, the cooling effect at the TOA level due to the existence of aerosol is enhanced by more than 70%, which may severely influence the climate change procedure of our planet.
4.3. Seasonal Difference and Variation
By combining the Thermal Anomalies/Fire Dataset and Crop Type Data, the main burning season in the NEC region can be confirmed and the statistics for different burning seasons can be further collected. After investigating the long time series of fire dataset, two main burning seasons in NEC were determined. One is the harvest season in autumn and the other is the ploughing season in spring. After projecting the fire point data to the crop type map, the proportion for the burning of the three main crop types (rice, maize, and soybean) are calculated for different burning seasons. In autumn, the proportions are 36.3%, 42.9%, and 20.9%, respectively, for rice, maize, and soybean residue burning. Meanwhile in spring, the proportions are 34.4%, 38.1%, and 27.5%, respectively, for rice, maize, and soybean residue burning. Compared to autumn, in spring, the proportion of soybean residue increased and the proportion of the other two residue types, especially the maize residue, decreased. Niu et al. [64] analyzed the spatiotemporal variations in monthly relative humidity for different regions of China, showing that non-negligible humidity difference existed between the two main biomass burning seasons in NEC. In general, spring is drier than autumn, with lower relative humidity. Besides, the crop residue in autumn is burned just after harvest with high water content. When it comes to the ploughing season of spring, in which the remaining crop residue has to be burned, the water content in the burned crop residue has reduced significantly after a long winter exposure in the air. Thus, it is necessary to study the seasonal differences in the aerosol emitted from open biomass burning in NEC.
To study the seasonal difference, the identified biomass burning aerosols are further screened and categorized into two main biomass burning seasons (i.e., autumn and spring). Table 2 summarizes the characteristics of aerosol emitted from biomass burning in NEC for autumn and spring. Foreseeable differences can be observed. The average AOD of spring is 0.63, higher than the autumn value of 0.52, proving that biomass burning is more intensive in spring [34]. The slightly higher Angstrom Exponent value of 1.56 indicates a slightly smaller particle size of biomass burning aerosol in spring. Besides, the biomass burning aerosol in spring has lower single scattering albedo (0.84 vs. 0.88) and a higher volume fraction of black carbon (4.5% vs. 3.3%). The sphere fraction of biomass burning aerosol in spring is 0.46, lower than the value of 0.59 in autumn. In terms of radiative forcing, different from the bidirectional-possible forcing effect in the northern peninsular southeast Asia in an urban atmosphere [65], the aerosol forcing efficiency at Top of Atmosphere (TOA) level is normally negative (cooling effect) in NEC. A weaker cooling effect of −40.76 W/m2 is found in spring compared to −70.78 W/m2 in autumn. The aerosol forcing efficiency at TOA level represents the overall aerosol effect on the planetary climate, which can be separated into two parts: aerosol forcing efficiency at surface level and aerosol forcing efficiency at atmosphere level. At surface level, the climate impact caused by aerosol is a cooling effect. Meanwhile, the aerosol climate impact at atmosphere level is a warming effect. For both of the two sublevels, a stronger aerosol forcing efficiency is found in spring (−214.77 W/m2 at surface level and 174.01 W/m2 at atmosphere level) than that in autumn (−193.51 W/m2 at surface level and 122.72 W/m2 at atmosphere level).
The abovementioned seasonal differences can be anticipated and partly explained by the ambient environment and the state of the straw. Previous studies have demonstrated the significant influence of water uptake and relative humidity on the properties of aerosol [66]. In autumn, the crop straw is just freshly reaped and rich in moisture. Meanwhile, the air is more humid in autumn than in spring. Thus, the hygroscopic growth and condensation of aerosol after biomass burning emission is more obvious in autumn. In contrast, the aerosol emitted from spring biomass burning is more likely to demonstrate fractal aggregated chain-like structures without being heavily water coated, showing low sphere fraction, small particle size, high volume fraction of black carbon and high absorbability.
5. Conclusions
In this research, a deep and quantitative analysis of aerosol emitted from open biomass burning in the NEC region is conducted with the help of a new optimized biomass burning aerosol identification method, which combines satellite aerosol and fire observational products with the HYSPLIT model forward trajectories. The local-specific features of influence region, aging characteristics, and seasonal variation of the aerosol emitted from open biomass burning in the NEC region are quantitatively and systematically investigated.
Owing to the meteorological condition, the aerosol emitted from open biomass burning in NEC can potentially be transported to an extensive area in the north, in the south, and especially in the east. However, the biomass burning aerosol emitted in the transmission path outside the NEC region can mix into the atmosphere and impede the study of the aerosol emitted from open biomass burning in NEC. After filtering out the potential contamination of the biomass burning aerosol emitted in the transmission path outside the NEC region, except for NEC itself, the direct influence regions of NEC open biomass burning that we can confirm are Bohai Sea, Yellow Sea, Sea of Japan, and the adjacent land area near the eastern boarder of NEC.
Based on the filtered biomass burning aerosol emitted in the NEC region, the general aging characteristics for the aerosol emitted from biomass burning in the NEC region are discussed. In general, a 16% decline in 565 nm AOD during the 72-h transport process was found. However, we found that the decline mainly happened in the fine-model part of AOD. Additionally, a slight increase trend on the 565 nm coarse-model AOD can even be found. We further investigated the evolution of the Angstrom exponent, finding that during the 72-h aging process after biomass burning emission, the Angstrom exponent declined from 1.6 to 1.54. Combining the above phenomenon together, we can conclude that the particle size growth occurs during the aging process after biomass burning emission. In addition, the volume fraction of black carbon decreased from the value of 4.5% after releasing to the value of 3.1% after 72 h’ aging, with a total 30% decrement. The obvious decrement in the volume fraction of black carbon further influences the single scattering albedo of the aerosol, which increases from the fresh state of 0.84 to the 72 h aging state of 0.89. Moreover, the climate effect of the biomass burning aerosol is also influenced. A general weakened trend of positive forcing efficiency at atmosphere level and a slight enhancement of negative forcing efficiency at surface level jointly led to the significant strengthening of the general negative forcing efficiency at the TOA level during the 72 h’ aging process after biomass burning emission, which change from −41 W/m2 to −71 W/m2. That means, during the aging process, the cooling effect at the TOA level due to the existence of aerosol is enhanced by more than 70%, indicating its severe influence on climate change.
There are two main burning seasons in NEC. One is the harvest season in autumn and the other is the ploughing season in spring. The average AOD of spring is 0.63, higher than the autumn value of 0.52, indicating that biomass burning is more intensive in spring. The ambient environment and the state of the straw is different in the two burning seasons. In autumn, the crop straw is just freshly reaped and rich in moisture. At the same time, the air is more humid in autumn than in spring. Thus, the hygroscopic growth and condensation of aerosol after biomass burning emission is more obvious in autumn. In contrast, the aerosol emitted from spring biomass burning is more likely to demonstrate fractal aggregated chain-like structures without being heavily water coated. Thus, compared to autumn, the aerosols emitted from spring biomass burning in the NEC region have a lower sphere fraction (spring: 0.46, autumn: 0.59), smaller particle size (spring Angstrom exponent: 1.56, autumn Angstrom exponent: 1.54), higher volume fraction of black carbon (spring: 4.5%, autumn: 3.3%), higher absorbability (spring: 0.84, autumn: 0.88), and weaker cooling effect at TOA level (spring: −40.76 W/m2, autumn: −70.78 W/m2).
Author Contributions
Conceptualization, S.S. and F.B.; methodology, S.S.; software, S.S.; validation, S.S., F.B. and F.M.; formal analysis, S.S.; investigation, S.S.; writing—original draft preparation, S.S.; writing—review and editing, F.M. and Y.M.; visualization, S.S.; supervision, F.B. All authors have read and agreed to the published version of the manuscript.
Funding
This work was supported by the National Natural Science Foundation of China (grant number 42005104, 42105124) and the National Key Research and Development Program of China (2020YFE0200700, 2017YFC0212300).
Institutional Review Board Statement
Not applicable.
Informed Consent Statement
Not applicable.
Data Availability Statement
Not applicable.
Acknowledgments
We want to express the appreciation for the useful POLDER/PARASOL Level-3 dataset available for us, which was originally provided by CNES (http://www.icare.univ-lille1.fr/, accessed on 24 November 2021) and processed at AERIS/ICARE Data and Services Center with GRASP software (https://www.grasp-open.com/, accessed on 24 November 2021) developed by Dubovik et al. [67,68]. The HYSPLIT model was acquired online by courtesy of the NOAA Air Resources Laboratory (ARL) (https://www.ready.noaa.gov/HYSPLIT.php/, accessed on 24 November 2021). The Fire Information for Resource Management System (FIRMS) (https://firms.modaps.eosdis.nasa.gov//, accessed on 24 November 2021) is gratefully appreciated for the provision of the MODIS Thermal Anomalies/Fire product. The Global Modeling and Assimilation Office (GMAO) and Goddard Earth Sciences Data and Information Services Center (GES DISC) are gratefully appreciated for the production and provision of MERRA-2 model data. Finally, we want to thank the generous offering of the Northeast China crop type data providers [56], who make the dataset publicly available.
Conflicts of Interest
The authors declare no conflict of interest. The funders had no role in the design of the study; in the collection, analyses, or interpretation of data; in the writing of the manuscript, or in the decision to publish the results.
References
- Al-Saadi, J.; Szykman, J.; Pierce, R.B.; Kittaka, C.; Neil, D.; Chu, D.A.; Remer, L.; Gumley, L.; Prins, E.; Weinstock, L.; et al. Improving National Air Quality Forecasts with Satellite Aerosol Observations. Bull. Am. Meteorol. Soc. 2005, 86, 1249–1261. [Google Scholar] [CrossRef]
- Wang, Z.Z.; Zhao, J.J.; Xu, J.W.; Jia, M.R.; Li, H.; Wang, S.J. Influence of Straw Burning on Urban Air Pollutant Concentrations in Northeast China. Int. J. Environ. Res. Public Health 2019, 16, 1379. [Google Scholar] [CrossRef] [PubMed] [Green Version]
- Johnston, F.H.; Henderson, S.B.; Chen, Y.; Randerson, J.T.; Marlier, M.; Defries, R.S.; Kinney, P.; Bowman, D.M.; Brauer, M. Estimated global mortality attributable to smoke from landscape fires. Environ. Health Perspect. 2012, 120, 695–701. [Google Scholar] [CrossRef] [PubMed] [Green Version]
- IPCC. Changes in Atmospheric Constituents and in Radiative Forcing, in Climate Change 2007; Cambridge University Press: Cambridge, UK, 2007. [Google Scholar]
- Bond, T.C.; Doherty, S.; Fahey, D.W.; Forster, P.; Berntsen, T.; DeAngelo, B.; Flanner, M.G.; Ghan, S.; Kärcher, B.; Koch, D.; et al. Bounding the role of black carbon in the climate system: A Scientific assessment. J. Geophys. Res. Atmos. 2013, 118, 5380–5552. [Google Scholar] [CrossRef]
- Jacobson, M.Z. Strong radiative heating due to the mixing state of black carbon in atmospheric aerosols. Nature 2001, 409, 695–697. [Google Scholar] [CrossRef]
- He, J.B.; Gao, C.Y.; Cong, J.X.; Zhong, J.J.; Han, D.X.; Wang, G.P. Historical pyrogenic sources of black carbon during the last 150 years in the Great Hinggan Mountains, Northeast China. J. Soils Sediments 2018, 18, 708–717. [Google Scholar] [CrossRef]
- Wang, L.; Jin, X.; Wang, Q.; Mao, H.; Liu, Q.; Weng, G.; Wang, Y. Spatial and temporal variability of open biomass burning in Northeast China from 2003 to 2017. Atmos. Ocean. Sci. Lett. 2020, 13, 240–247. [Google Scholar] [CrossRef] [Green Version]
- Cai, A.; Liang, G.; Zhang, X.; Zhang, W.; Li, L.; Rui, Y.; Xu, M.; Luo, Y. Long-term straw decomposition in agro-ecosystems described by a unified three-exponentiation equation with thermal time. Sci. Total Environ. 2018, 636, 699–708. [Google Scholar] [CrossRef] [PubMed]
- Xu, Y.; Huang, Z.; Jia, G.; Fan, M.; Cheng, L.; Chen, L.; Shao, M.; Zheng, J. Regional discrepancies in spatiotemporal variations and driving forces of open crop residue burning emissions in China. Sci. Total Environ. 2019, 671, 536–547. [Google Scholar] [CrossRef]
- Wang, Q.; Wang, L.; Li, X.; Xin, J.; Liu, Z.; Sun, Y.; Liu, J.; Zhang, Y.; Du, W.; Jin, X.; et al. Emission characteristics of size distribution, chemical composition and light absorption of particles from field-scale crop residue burning in Northeast China. Sci. Total Environ. 2020, 710, 136304. [Google Scholar] [CrossRef]
- Chen, Q.X.; Yuan, Y.; Huang, X.; He, Z.H.; Tan, H.P. Assessment of column aerosol optical properties using ground-based sun-photometer at urban Harbin, Northeast China. J. Environ. Sci. 2018, 74, 50–57. [Google Scholar] [CrossRef]
- Flanner, M.G.; Zender, C.S.; Randerson, J.T.; Rasch, P.J. Present-day climate forcing and response from black carbon in snow. J. Geophys. Res.-Atmos. 2007, 112, D11202. [Google Scholar] [CrossRef] [Green Version]
- Fu, Y.; Li, R.; Huang, J.; Bergeron, Y.; Fu, Y.; Wang, Y.; Gao, Z. Satellite-Observed Impacts of Wildfires on Regional Atmosphere Composition and the Shortwave Radiative Forcing: A Multiple Case Study. J. Geophys. Res.-Atmos. 2018, 123, 8326–8343. [Google Scholar] [CrossRef]
- Xu, L.; Liu, L.; Zhang, J.; Zhang, Y.; Ren, Y.; Wang, X.; Li, W. Morphology, Composition, and Mixing State of Individual Aerosol Particles in Northeast China during Wintertime. Atmosphere 2017, 8, 47. [Google Scholar] [CrossRef] [Green Version]
- Ojha, N.; Girach, I.; Sharma, K.; Nair, P.; Singh, J.; Sharma, N.; Singh, N.; Flemming, J.; Inness, A.; Subrahmanyam, K.V. Surface ozone in the Doon Valley of the Himalayan foothills during spring. Environ. Sci. Pollut. Res. 2019, 26, 19155–19170. [Google Scholar] [CrossRef] [PubMed]
- Smith, D.M.; Fiddler, M.N.; Sexton, K.G.; Bililign, S. Construction and Characterization of an Indoor Smog Chamber for Measuring the Optical and Physicochemical Properties of Aging Biomass Burning Aerosols. Aerosol Air Qual. Res. 2019, 19, 467–483. [Google Scholar] [CrossRef]
- Yang, T.; Gbaguidi, A.; Yan, P.; Zhang, W.; Zhu, L.; Yao, X.; Wang, Z.; Chen, H. Model elucidating the sources and formation mechanisms of severe haze pollution over Northeast mega-city cluster in China. Environ. Pollut. 2017, 230, 692–700. [Google Scholar] [CrossRef]
- Fang, Z.; Deng, W.; Zhang, Y.; Ding, X.; Tang, M.; Liu, T.; Hu, Q.; Zhu, M.; Wang, Z.; Yang, W.; et al. Open burning of rice, corn and wheat straws: Primary emissions, photochemical aging, and secondary organic aerosol formation. Atmos. Chem. Phys. 2017, 17, 14821–14839. [Google Scholar] [CrossRef] [Green Version]
- Li, C.; Hu, Y.; Zhang, F.; Chen, J.; Ma, Z.; Ye, X.; Yang, X.; Wang, L.; Tang, X.; Zhang, R.; et al. Multi-pollutant emissions from the burning of major agricultural residues in China and the related health-economic effects. Atmos. Chem. Phys. 2017, 17, 4957–4988. [Google Scholar] [CrossRef] [Green Version]
- Pani, S.K.; Wang, S.-H.; Lin, N.-H.; Lee, C.-T.; Tsay, S.-C.; Holben, B.N.; Janjai, S.; Hsiao, T.-C.; Chuang, M.-T.; Chantara, S. Radiative Effect of Springtime Biomass-Burning Aerosols over Northern Indochina during 7-SEAS/BASELInE 2013 Campaign. Aerosol Air Qual. Res. 2016, 16, 2802–2817. [Google Scholar] [CrossRef] [Green Version]
- Reid, J.S.; Hobbs, P.V. Physical and optical properties of young smoke from individual biomass fires in Brazil. J. Geophys. Res. Atmos. 1998, 103, 32013–32030. [Google Scholar] [CrossRef]
- Abel, S.J.; Haywood, J.; Highwood, E.; Li, J.; Buseck, P.R. Evolution of biomass burning aerosol properties from an agricultural fire in southern Africa. Geophys. Res. Lett. 2003, 30, 1783. [Google Scholar] [CrossRef] [Green Version]
- Sharma, D.; Singh, M.; Singh, D. Impact of Post-Harvest Biomass Burning on Aerosol Characteristics and Radiative Forcing over Patiala, North-West region of India. J. Inst. Eng. 2011, 8, 11–24. [Google Scholar] [CrossRef]
- Papanikolaou, C.-A.; Giannakaki, E.; Papayannis, A.; Mylonaki, M.; Soupiona, O. Canadian Biomass Burning Aerosol Properties Modification during a Long-Ranged Event on August 2018. Sensors 2020, 20, 5442. [Google Scholar] [CrossRef]
- Markowicz, K.M.; Lisok, J.; Xian, P. Simulations of the effect of intensive biomass burning in July 2015 on Arctic radiative budget. Atmos. Environ. 2017, 171, 248–260. [Google Scholar] [CrossRef]
- Andreae, M.O. Emission of trace gases and aerosols from biomass burning—An updated assessment. Atmos. Chem. Phys. 2019, 19, 8523–8546. [Google Scholar] [CrossRef] [Green Version]
- Brown, H.; Liu, X.; Pokhrel, R.; Murphy, S.; Lu, Z.; Saleh, R.; Mielonen, T.; Kokkola, H.; Bergman, T.; Myhre, G.; et al. Biomass burning aerosols in most climate models are too absorbing. Nat. Commun. 2021, 12, 277. [Google Scholar] [CrossRef]
- Cheng, Y.; Yu, Q.Q.; Liu, J.M.; Zhu, S.; Zhang, M.; Zhang, H.; Zheng, B.; He, K.B. Model vs. observation discrepancy in aerosol characteristics during a half-year long campaign in Northeast China: The role of biomass burning. Environ. Pollut. 2021, 269, 116167. [Google Scholar] [CrossRef] [PubMed]
- Hao, W.S.W. Scientific Vision on Development Guiding the Regional Socio-Economic Development—Studies on Guidance Thoughts and Policy Tendency of “Planning for Revitalization in Northeast China”. Northeast Asia Forum 2007, 5. [Google Scholar] [CrossRef]
- Zhu, J.; Xiu, C. The Evolutionary Pattern and Contributing Factor of Administrative Division Adjustment in Northeast China Since 1949. Sci. Geogr. Sin. 2019, 39, 606–615. [Google Scholar]
- NBS. Bulletin of the Sixth National Population Census; National Bureau of Statistics: Beijing, China, 2010.
- Yang, Y.Z.; Cai, W.H.; Yang, J. Evaluation of MODIS Land Surface Temperature Data to Estimate Near-Surface Air Temperature in Northeast China. Remote Sens. 2017, 9, 410. [Google Scholar] [CrossRef] [Green Version]
- Zhang, J.; Yang, X.; Tu, X.; Ning, K.; Luan, X. Spatio-temporal change of straw burning fire points in field of China from 2014 to 2018. Trans. Chin. Soc. Agric. Eng. 2019, 35, 191–199. [Google Scholar] [CrossRef]
- Deschamps, P.-Y.; Breon, F.-M.; Leroy, M.; Podaire, A.; Bricaud, A.; Buriez, J.-C.; Seze, G. The POLDER mission: Instrument characteristics and scientific objectives. IEEE Trans. Geosci. Remote Sens. 1994, 32, 598–615. [Google Scholar] [CrossRef]
- Kramer, H.J. Observation of the Earth and Its Environment: Survey of Missions and Sensors; Springer Science & Business Media: Berlin/Heidelberg, Germany, 2002. [Google Scholar]
- Lier, P.; Bach, M. PARASOL a microsatellite in the A-Train for Earth atmospheric observations. Acta Astronaut. 2008, 62, 257–263. [Google Scholar] [CrossRef]
- Popp, T.; De Leeuw, G.; Bingen, C.; Brühl, C.; Capelle, V.; Chedin, A.; Clarisse, L.; Dubovik, O.; Grainger, R.; Griesfeller, J.; et al. Development, Production and Evaluation of Aerosol Climate Data Records from European Satellite Observations (Aerosol_cci). Remote Sens. 2016, 8, 421. [Google Scholar] [CrossRef] [Green Version]
- Chen, C.; Dubovik, O.; Henze, D.K.; Lapyonak, T.; Chin, M.; Ducos, F.; Litvinov, P.; Huang, X.; Li, L. Retrieval of desert dust and carbonaceous aerosol emissions over Africa from POLDER/PARASOL products generated by the GRASP algorithm. Atmos. Chem. Phys. 2018, 18, 12551–12580. [Google Scholar] [CrossRef] [Green Version]
- Chen, C.; Dubovik, O.; Henze, D.K.; Chin, M.; Lapyonok, T.; Schuster, G.L.; Ducos, F.; Fuertes, D.; Litvinov, P.; Li, L.; et al. Constraining global aerosol emissions using POLDER/PARASOL satellite remote sensing observations. Atmos. Chem. Phys. 2019, 19, 14585–14606. [Google Scholar] [CrossRef] [Green Version]
- Tan, Y.; Li, E.; Zhang, Z.; Lin, X.; Chi, Y.; Zhou, L.; Wu, C.; Wang, Q. Validation of POLDER-3/GRASP aerosol products using AERONET measurements over China. Atmos. Environ. 2019, 215, 116893. [Google Scholar] [CrossRef]
- Sayer, A.M.; Hsu, N.C.; Eck, T.F.; Smirnov, A.; Holben, B.N. AERONET-based models of smoke-dominated aerosol near source regions and transported over oceans, and implications for satellite retrievals of aerosol optical depth. Atmos. Chem. Phys. 2014, 14, 11493–11523. [Google Scholar] [CrossRef] [Green Version]
- Bohren, C.F.; Huffman, D.R. Absorption and Scattering of Light by Small Particles; John Wiley & Sons: Hoboken, NJ, USA, 2008. [Google Scholar]
- Bao, F.; Cheng, T.; Li, Y.; Gu, X.; Guo, H.; Wu, Y.; Wang, Y.; Gao, J. Retrieval of black carbon aerosol surface concentration using satellite remote sensing observations. Remote Sens. Environ. 2019, 226, 93–108. [Google Scholar] [CrossRef]
- Shi, S.; Cheng, T.; Gu, X.; Guo, H.; Wu, Y.; Wang, Y.; Bao, F.; Zuo, X. Probing the dynamic characteristics of aerosol originated from South Asia biomass burning using POLDER/GRASP satellite data with relevant accessory technique design. Environ. Int. 2020, 145, 106097. [Google Scholar] [CrossRef]
- Shi, S.; Cheng, T.; Gu, X.; Guo, H.; Wu, Y.; Wang, Y. Biomass burning aerosol characteristics for different vegetation types in different aging periods. Environ. Int. 2019, 126, 504–511. [Google Scholar] [CrossRef]
- Ricchiazzi, P.; Yang, S.R.; Gautier, C.; Sowle, D. SBDART: A research and teaching software tool for plane-parallell radiative transfer in the Earth’s atmosphere. Bull. Am. Meteorol. Soc. 1998, 79, 2101–2114. [Google Scholar] [CrossRef] [Green Version]
- Aruna, K.; Kumar, T.V.L.; Murthy, B.V.K.; Babu, S.S.; Ratnam, M.V.; Rao, D.N. Short wave Aerosol Radiative Forcing estimates over a semi urban coastal environment in south-east India and validation with surface flux measurements. Atmos. Environ. 2016, 125, 418–428. [Google Scholar] [CrossRef]
- Justice, C.O.; Giglio, L.; Korontzi, S.; Owens, J.; Morisette, J.T.; Roy, D.; Descloitres, J.; Alleaume, S.; Petitcolin, F.; Kaufman, Y. The MODIS fire products. Remote Sens. Environ. 2002, 83, 244–262. [Google Scholar] [CrossRef]
- Shi, S.; Cheng, T.; Gu, X.; Guo, H.; Wu, Y.; Wang, Y.; Bao, F.; Zuo, X. Monitoring global fires from EOS-MODIS. J. Geophys. Res. 1998, 102, 611–624. [Google Scholar]
- Oliveira, S.L.J. Seasonal differences in fire activity and intensity in tropical savannas of northern Australia using satellite measurements of fire radiative power. Int. J. Wildland Fire 2015, 24, 249–260. [Google Scholar] [CrossRef]
- Csiszar, I.A.; Morisette, J.T.; Giglio, L. Validation of active fire detection from moderate-resolution satellite sensors: The MODIS example in northern Eurasia. IEEE Trans. Geosci. Remote Sens. 2006, 44, 1757–1764. [Google Scholar] [CrossRef]
- Morisette, J.T.; Giglio, L.; Csiszar, I.; Justice, C.O. Validation of the MODIS active fire product over Southern Africa with ASTER data. Int. J. Remote Sens. 2005, 26, 4239–4264. [Google Scholar] [CrossRef]
- Morisette, J.T.; Giglio, L.; Csiszar, I.; Setzer, A.; Schroeder, W.; Morton, D.; Justice, C.O. Validation of MODIS active fire detection products derived from two algorithms. Earth Interact. 2005, 9, 1–25. [Google Scholar] [CrossRef] [Green Version]
- Giglio, L.; Schroeder, W.; Justice, C.O. The collection 6 MODIS active fire detection algorithm and fire products. Remote Sens. Environ. 2016, 178, 31–41. [Google Scholar] [CrossRef] [Green Version]
- You, N.; Dong, J.; Huang, J.; Du, G.; Xiao, X. The 10-m crop type maps in Northeast China during 2017–2019. Sci. Data 2021, 8, 41. [Google Scholar] [CrossRef] [PubMed]
- Stein, A.F.; Draxler, R.R.; Rolph, G.D.; Stunder, B.J.B.; Cohen, M.D.; Ngan, F. NOAA’s HYSPLIT Atmospheric Transport and Dispersion Modeling System. Bull. Am. Meteorol. Soc. 2015, 96, 2059–2077. [Google Scholar] [CrossRef]
- Rolph, G.; Stein, A.; Stunder, B. Real-time Environmental Applications and Display sYstem: READY. Environ. Model. Softw. 2017, 95, 210–228. [Google Scholar] [CrossRef]
- Draxler, R.R.; Hess, G. Description of the HYSPLIT 4 Modelling System. 1997. Available online: https://www.arl.noaa.gov/documents/reports/arl-224.pdf (accessed on 15 December 2021).
- Draxler, R.R.; Stunder, B.; Rolph, G.; Taylor, A. HYSPLIT 4 Users’ Guide; US Department of Commerce, National Oceanic and Atmospheric Administration, Environmental Research Laboratories, Air Resources Laboratory: Silver Spring, MD, USA, 1999.
- Gelaro, R.; McCarty, W.; Suárez, M.J.; Todling, R.; Molod, A.; Takacs, L.; Randles, C.; Darmenov, A.; Bosilovich, M.G.; Reichle, R.; et al. The Modern-Era Retrospective Analysis for Research and Applications, Version 2 (MERRA-2). J. Clim. 2017, 30, 5419–5454. [Google Scholar] [CrossRef]
- Denjean, C.; Bourrianne, T.; Burnet, F.; Mallet, M.; Maury, N.; Colomb, A.; Dominutti, P.; Brito, J.; Dupuy, R.; Sellegri, K.; et al. Overview of aerosol optical properties over southern West Africa from DACCIWA aircraft measurements. Atmos. Chem. Phys. 2020, 20, 4735–4756. [Google Scholar] [CrossRef] [Green Version]
- Kleinman, L.I.; Sedlacek III, A.J.; Adachi, K.; Buseck, P.R.; Collier, S.; Dubey, M.K.; Hodshire, A.L.; Lewis, E.; Onasch, T.B.; Pierce, J.R.; et al. Rapid evolution of aerosol particles and their optical properties downwind of wildfires in the western US. Atmos. Chem. Phys. 2020, 20, 13319–13341. [Google Scholar] [CrossRef]
- Niu, Z.; Wang, L.; Fang, L.; Li, J.; Yao, R. Spatiotemporal variations in monthly relative humidity in China based on observations and CMIP5 models. Int. J. Climatol. 2020, 40, 6382–6395. [Google Scholar] [CrossRef]
- Pani, S.K.; Lin, N.-H.; Chantara, S.; Wang, S.-H.; Khamkaew, C.; Prapamontol, T.; Janjai, S. Radiative response of biomass-burning aerosols over an urban atmosphere in northern peninsular Southeast Asia. Sci. Total Environ. 2018, 633, 892–911. [Google Scholar] [CrossRef] [PubMed]
- Reddington, C.L.; Morgan, W.T.; Darbyshire, E.; Brito, J.; Coe, H.; Artaxo, P.; Scott, C.E.; Marsham, J.; Spracklen, D.V. Biomass burning aerosol over the Amazon: Analysis of aircraft, surface and satellite observations using a global aerosol model. Atmos. Chem. Phys. 2019, 19, 9125–9152. [Google Scholar] [CrossRef] [Green Version]
- Dubovik, O.; Herman, M.; Holdak, A.; Lapyonok, T.; Tanré, D.; Deuzé, J.L.; Ducos, F.; Sinyuk, A.; Lopatin, A. Statistically optimized inversion algorithm for enhanced retrieval of aerosol properties from spectral multi-angle polarimetric satellite observations. Atmos. Meas. Tech. 2011, 4, 975–1018. [Google Scholar] [CrossRef] [Green Version]
- Dubovik, O.; Lapyonok, T.; Litvinov, P.; Herman, M.; Fuertes, D.; Ducos, F.; Lopatin, A.; Chaikovsky, A.; Torres, B.; Derimian, Y.; et al. GRASP: A versatile algorithm for characterizing the atmosphere. SPIE Newsroom 2014, 25. [Google Scholar] [CrossRef]
Figure 1.
The geographical scope of NEC.

Figure 2.
The studying architecture of aerosol emitted from open biomass burning in NEC region.

Figure 3.
The influence region with average aging time of aerosol emitted from open biomass burning in NEC. (a) From the identified aerosols having traced back fire point in NEC region. (b) From the identified aerosols only having traced back fire point in NEC region. The fire points and average transport trajectory in (b) represent the sources and the general trajectory of the aerosol emitted from open biomass burning in NEC.


Figure 4.
Average map of MERRA-2 models result of black carbon AOD from 2005 to 2013 around NEC region.
Figure 4.
Average map of MERRA-2 models result of black carbon AOD from 2005 to 2013 around NEC region.

Figure 5.
Density scatter plot with linear fitting result showing general changing of AOD at 565 nm with aging time for the aerosol emitted from open biomass burning in NEC.
Figure 5.
Density scatter plot with linear fitting result showing general changing of AOD at 565 nm with aging time for the aerosol emitted from open biomass burning in NEC.

Figure 6.
Density scatter plot with linear fitting result showing general changing of fine-model AOD at 565 nm with aging time for the aerosol emitted from open biomass burning in NEC.
Figure 6.
Density scatter plot with linear fitting result showing general changing of fine-model AOD at 565 nm with aging time for the aerosol emitted from open biomass burning in NEC.

Figure 7.
Density scatter plot with linear fitting result showing general changing of coarse-model AOD at 565 nm with aging time for the aerosol emitted from open biomass burning in NEC.
Figure 7.
Density scatter plot with linear fitting result showing general changing of coarse-model AOD at 565 nm with aging time for the aerosol emitted from open biomass burning in NEC.

Figure 8.
Density scatter plot with linear fitting result showing general changing of Angstrom Exponent with aging time for the aerosol emitted from open biomass burning in NEC.
Figure 8.
Density scatter plot with linear fitting result showing general changing of Angstrom Exponent with aging time for the aerosol emitted from open biomass burning in NEC.

Figure 9.
Density scatter plot with linear fitting result showing general changing of volume fraction of black carbon with aging time for the aerosol emitted from open biomass burning in NEC.
Figure 9.
Density scatter plot with linear fitting result showing general changing of volume fraction of black carbon with aging time for the aerosol emitted from open biomass burning in NEC.

Figure 10.
Density scatter plot with linear fitting result showing general changing of single scattering albedo at 565 nm with aging time for the aerosol emitted from open biomass burning in NEC.
Figure 10.
Density scatter plot with linear fitting result showing general changing of single scattering albedo at 565 nm with aging time for the aerosol emitted from open biomass burning in NEC.

Figure 11.
Density scatter plot with linear fitting result showing general changing of forcing efficiency at atmosphere level with aging time for the aerosol emitted from open biomass burning in NEC.
Figure 11.
Density scatter plot with linear fitting result showing general changing of forcing efficiency at atmosphere level with aging time for the aerosol emitted from open biomass burning in NEC.

Figure 12.
Density scatter plot with linear fitting result showing general changing of forcing efficiency at surface level with aging time for the aerosol emitted from open biomass burning in NEC.
Figure 12.
Density scatter plot with linear fitting result showing general changing of forcing efficiency at surface level with aging time for the aerosol emitted from open biomass burning in NEC.

Figure 13.
Density scatter plot with linear fitting result showing general changing of forcing efficiency at top of atmosphere with aging time for the aerosol emitted from open biomass burning in NEC.
Figure 13.
Density scatter plot with linear fitting result showing general changing of forcing efficiency at top of atmosphere with aging time for the aerosol emitted from open biomass burning in NEC.


Table 1.
Detailed primary (P) and secondary (S) parameters used in this study.
| Parameters | Description | |
|---|---|---|
| P | AOD (565 nm) | Aerosol Optical Depth at 565 nm |
| P | AAOD (565 nm) | Aerosol Absorption Optical Depth at 565 nm |
| P | AODF (565 nm) | Fine mode Aerosol Optical Depth at 565 nm |
| P | AODC (565 nm) | Coarse mode Aerosol Optical Depth at 565 nm |
| P | SSA (565 nm) | Single Scattering Albedo at 565 nm |
| P | Angstrom Exponent | Describing how the optical thickness of an aerosol typically depends on the wavelength of the light |
| P | Sphere Fraction | Representing an estimate of the percentage of spherical particle scattering |
| P | Complex Refractive Index | Real part: refractive index. Imaginary part: absorption coefficient. Used to calculate volume fraction of black carbon |
| P | Surface Directional Hemispherical Reflectance | Used to calculate aerosol radiative forcing efficiency |
| S | Volume Fraction of Black Carbon | The volume fraction of black carbon in aerosol |
| S | Forcing Efficiency (Atmosphere) | Aerosol radiative forcing efficiency in atmosphere |
| S | Forcing Efficiency (Surface) | Aerosol radiative forcing efficiency at surface level |
| S | Forcing Efficiency (TOA) | Aerosol radiative forcing efficiency at TOA |
Table 2.
Seasonal differences of the aerosol emitted from open biomass burning in NEC.
| Parameters | Autumn | Spring |
|---|---|---|
| Angstrom Exponent | 1.54 | 1.56 |
| AOD (565 nm) | 0.52 | 0.63 |
| AAOD (565 nm) | 0.060 | 0.098 |
| Forcing Efficiency (Atmosphere) (W/m2) | 122.72 | 174.01 |
| Forcing Efficiency (Surface) (W/m2) | −193.51 | −214.77 |
| Forcing Efficiency (TOA) (W/m2) | −70.78 | −40.76 |
| Sphere Fraction | 0.59 | 0.46 |
| SSA (565 nm) | 0.88 | 0.84 |
| Volume Fraction of Black Carbon | 3.3% | 4.5% |
Publisher’s Note: MDPI stays neutral with regard to jurisdictional claims in published maps and institutional affiliations. |
© 2021 by the authors. Licensee MDPI, Basel, Switzerland. This article is an open access article distributed under the terms and conditions of the Creative Commons Attribution (CC BY) license (https://creativecommons.org/licenses/by/4.0/).
Share and Cite
MDPI and ACS Style
Shi, S.; Ma, Y.; Bao, F.; Mumtaz, F. A Satellite Data Based Detailed Study of the Aerosol Emitted from Open Biomass Burning in Northeast China. Atmosphere 2021, 12, 1700. https://0-doi-org.brum.beds.ac.uk/10.3390/atmos12121700
AMA Style
Shi S, Ma Y, Bao F, Mumtaz F. A Satellite Data Based Detailed Study of the Aerosol Emitted from Open Biomass Burning in Northeast China. Atmosphere. 2021; 12(12):1700. https://0-doi-org.brum.beds.ac.uk/10.3390/atmos12121700
Chicago/Turabian StyleShi, Shuaiyi, Yanjun Ma, Fangwen Bao, and Faisal Mumtaz. 2021. "A Satellite Data Based Detailed Study of the Aerosol Emitted from Open Biomass Burning in Northeast China" Atmosphere 12, no. 12: 1700. https://0-doi-org.brum.beds.ac.uk/10.3390/atmos12121700
Note that from the first issue of 2016, this journal uses article numbers instead of page numbers. See further details here.