Next Article in Journal
Taking the Convergent Close-Coupling Method beyond Helium: The Utility of the Hartree-Fock Theory
Next Article in Special Issue
Extending Our Knowledge about the 229Th Nuclear Isomer
Previous Article in Journal
Quantum Dynamics of Hydrogen-like Ions in a Spatially Nonuniform Magnetic Field: A Possible Application to Fusion Plasma
Previous Article in Special Issue
Structure Calculations in Nd III and U III Relevant for Kilonovae Modelling
 
 
atoms-logo
Article Menu

Article Menu

Article

First Offline Results from the S3 Low-Energy Branch

by
Jekabs Romans
1,*,†,
Anjali Ajayakumar
2,
Martial Authier
3,
Frederic Boumard
4,
Lucia Caceres
2,
Jean-François Cam
4,
Arno Claessens
1,
Samuel Damoy
2,
Pierre Delahaye
2,
Philippe Desrues
4,
Antoine Drouart
3,
Patricia Duchesne
5,
Rafael Ferrer
1,
Xavier Fléchard
4,
Serge Franchoo
5,
Patrice Gangnant
2,
Ruben P. de Groote
1,
Sandro Kraemer
1,
Nathalie Lecesne
2,
Renan Leroy
2,
Julien Lory
4,
Franck Lutton
2,
Vladimir Manea
5,
Yvan Merrer
4,
Iain Moore
6,
Alejandro Ortiz-Cortes
2,
Benoit Osmond
2,
Julien Piot
2,
Olivier Pochon
5,
Blaise-Maël Retailleau
2,
Hervé Savajols
2,
Simon Sels
1,
Emil Traykov
7,
Juha Uusitalo
6,
Christophe Vandamme
4,
Marine Vandebrouck
3,
Paul Van den Bergh
1,
Piet Van Duppen
1,
Matthias Verlinde
1,
Elise Verstraelen
1 and
Klaus Wendt
8
add Show full author list remove Hide full author list
1
KU Leuven, Instituut voor Kern- en Stralingsfysica, B-3001 Leuven, Belgium
2
GANIL, CEA/DRF-CNRS/IN2P3, B.P. 55027, F-14076 Caen, France
3
IRFU, CEA, Université Paris-Saclay, F-91191 Gif sur Yvette, France
4
Normandie Université, ENSICAEN, UNICAEN, CNRS/IN2P3, LPC Caen, F-14000 Caen, France
5
IJCLab, Université Paris-Saclay, CNRS/IN2P3, F-91405 Orsay, France
6
Department of Physics, University of Jyväskylä, P.O. Box 35 (YFL), FI-40014 Jyväskylä, Finland
7
IPHC, Université de Strasbourg, CNRS, F-67037 Strasbourg, France
8
Institut für Physik, Johannes Gutenberg-Universität Mainz, 55128 Mainz, Germany
*
Author to whom correspondence should be addressed.
Current address: Bd Henri Becquerel, B.P. 55027, CEDEX 05, F-14076 Caen, France.
Submission received: 7 January 2022 / Revised: 3 February 2022 / Accepted: 3 February 2022 / Published: 9 February 2022
(This article belongs to the Special Issue Atomic Structure of the Heaviest Elements)

Abstract

:
We present the first results obtained from the S 3 Low-Energy Branch, the gas cell setup at SPIRAL2-GANIL, which will be installed behind the S 3 spectrometer for atomic and nuclear spectroscopy studies of exotic nuclei. The installation is currently being commissioned offline, with the aim to establish optimum conditions for the operation of the radio frequency quadrupole ion guides, mass separation and ion bunching, providing high-efficiency and low-energy spatial spread for the isotopes of interest. Transmission and mass-resolving power measurements are presented for the different components of the S 3 -LEB setup. In addition, a single-longitudinal-mode, injection-locked, pumped pulsed-titanium–sapphire laser system has been recently implemented and is used for the first proof-of-principle measurements in an offline laser laboratory. Laser spectroscopy measurements of erbium, which is the commissioning case of the S 3 spectrometer, are presented using the 4 f 12 6 s 2 3 H 6 4 f 12 ( 3 H ) 6 s 6 p optical transition.

1. Introduction

The Super Separator Spectrometer (S 3 ) [1] is a fusion–evaporation recoil separator, which is currently under construction at the SPIRAL2 facility in GANIL, aiming to study exotic neutron-deficient isotopes in the actinide and super-heavy element regions, and in the N = Z region around 100 Sn [2]. The fusion–evaporation reactions will be produced by an intense heavy ion beam, impinging on a thin target. The low-production cross-sections and the available primary beam intensities at various facilities worldwide limits the production rates, and thus the amount of experimental data of very exotic nuclear systems. To overcome this obstacle, the superconducting LINAC of the SPIRAL2 facility has been developed to produce stable ion beams from He to U with energies from 0.75 up to 14.5 MeV/u, and intensities from 1p μ A up to Ni [1]. Primary beams of such high intensities will make SPIRAL2-S 3 and its low-energy branch (S 3 -LEB) a prominent place to study the ground and isomeric state properties of exotic nuclei [3]. For a detailed description of the SPIRAL2 project, one can refer to [4].
The S 3 -LEB will be installed at the S 3 final focal plane for some of the first experimental campaigns, and it will deploy a variety of low-energy measurement techniques (laser spectroscopy, decay spectroscopy and mass spectrometry). The underpinning working principle of the S 3 -LEB setup is the in-gas laser ionization and spectroscopy (IGLIS) technique [5,6], which aims to perform laser spectroscopy measurements to extract the isotope shifts and hyperfine parameters of radioactive isotopes. This experimental data can give access to differences in mean square charge radii δ r 2 〉, magnetic dipole μ and electrical quadrupole Q moments, as well as nuclear spins I, which are crucial for validating atomic and nuclear models, and for improving our understanding of the atomic and nuclear structure in poorly explored regions of the nuclear chart. However, the access to I and Q can be highly case-dependent, due to line-broadening mechanisms. One such example is the predicted existence of the island of stability of super-heavy elements [7].
Together with the hot-cavity laser ion sources used at ISOL facilities [8,9], IGLIS belongs to the broader class of laser ion source and laser spectroscopy techniques which probe the radioisotopes very close to the production or stopping area. These techniques allow the production of element-selective ion beams with high efficiencies. Nevertheless, their spectral resolution is typically limited by broadening mechanisms. The hot-cavity spectroscopy is dominated by a large Doppler broadening, induced by the T 2000 °C temperature of the laser beam–atom interaction region. At ISOL facilities, it is thus common to study radioactive beams after reacceleration and mass separation using high-resolution collinear fluorescence [10,11] or resonance ionization spectroscopy (RIS) [12]. Recently, new approaches for improving the spectral resolution of hot-cavity laser spectroscopy have also been explored, with promising results (such as the use of perpendicular illumination [13] and Doppler-free, two-photon spectroscopy [14]).
With the IGLIS method, one first thermalizes and neutralizes the reaction products in the buffer gas of a gas cell that is kept under a constant gas flow. Performing laser ionization spectroscopy in such an environment results in spectral line widths of several GHz, due to collisional broadening. A crucial upgrade for the IGLIS technique has been the use of a de Laval nozzle at the exit of the gas cell, which creates a collimated and homogeneous hypersonic gas jet of low temperature T and low density ρ [6], containing the products of interest. Such an environment allows for laser spectroscopy with reduced broadening mechanisms by about an order of magnitude, while maintaining a high selectivity and efficiency [5].
The S 3 -LEB setup has been developed by a collaboration between KU Leuven, SPIRAL2-GANIL, LPC Caen, IJCLab, University of Jyväskylä and University of Mainz. The setup is currently being commissioned at the GANIL Ion Source using Electron Laser Excitation (GISELE) [15] and LPC Caen. In this paper, the S 3 -LEB setup will be described and some first results from the offline commissioning tests will be presented.

2. The S 3 Low-Energy Branch

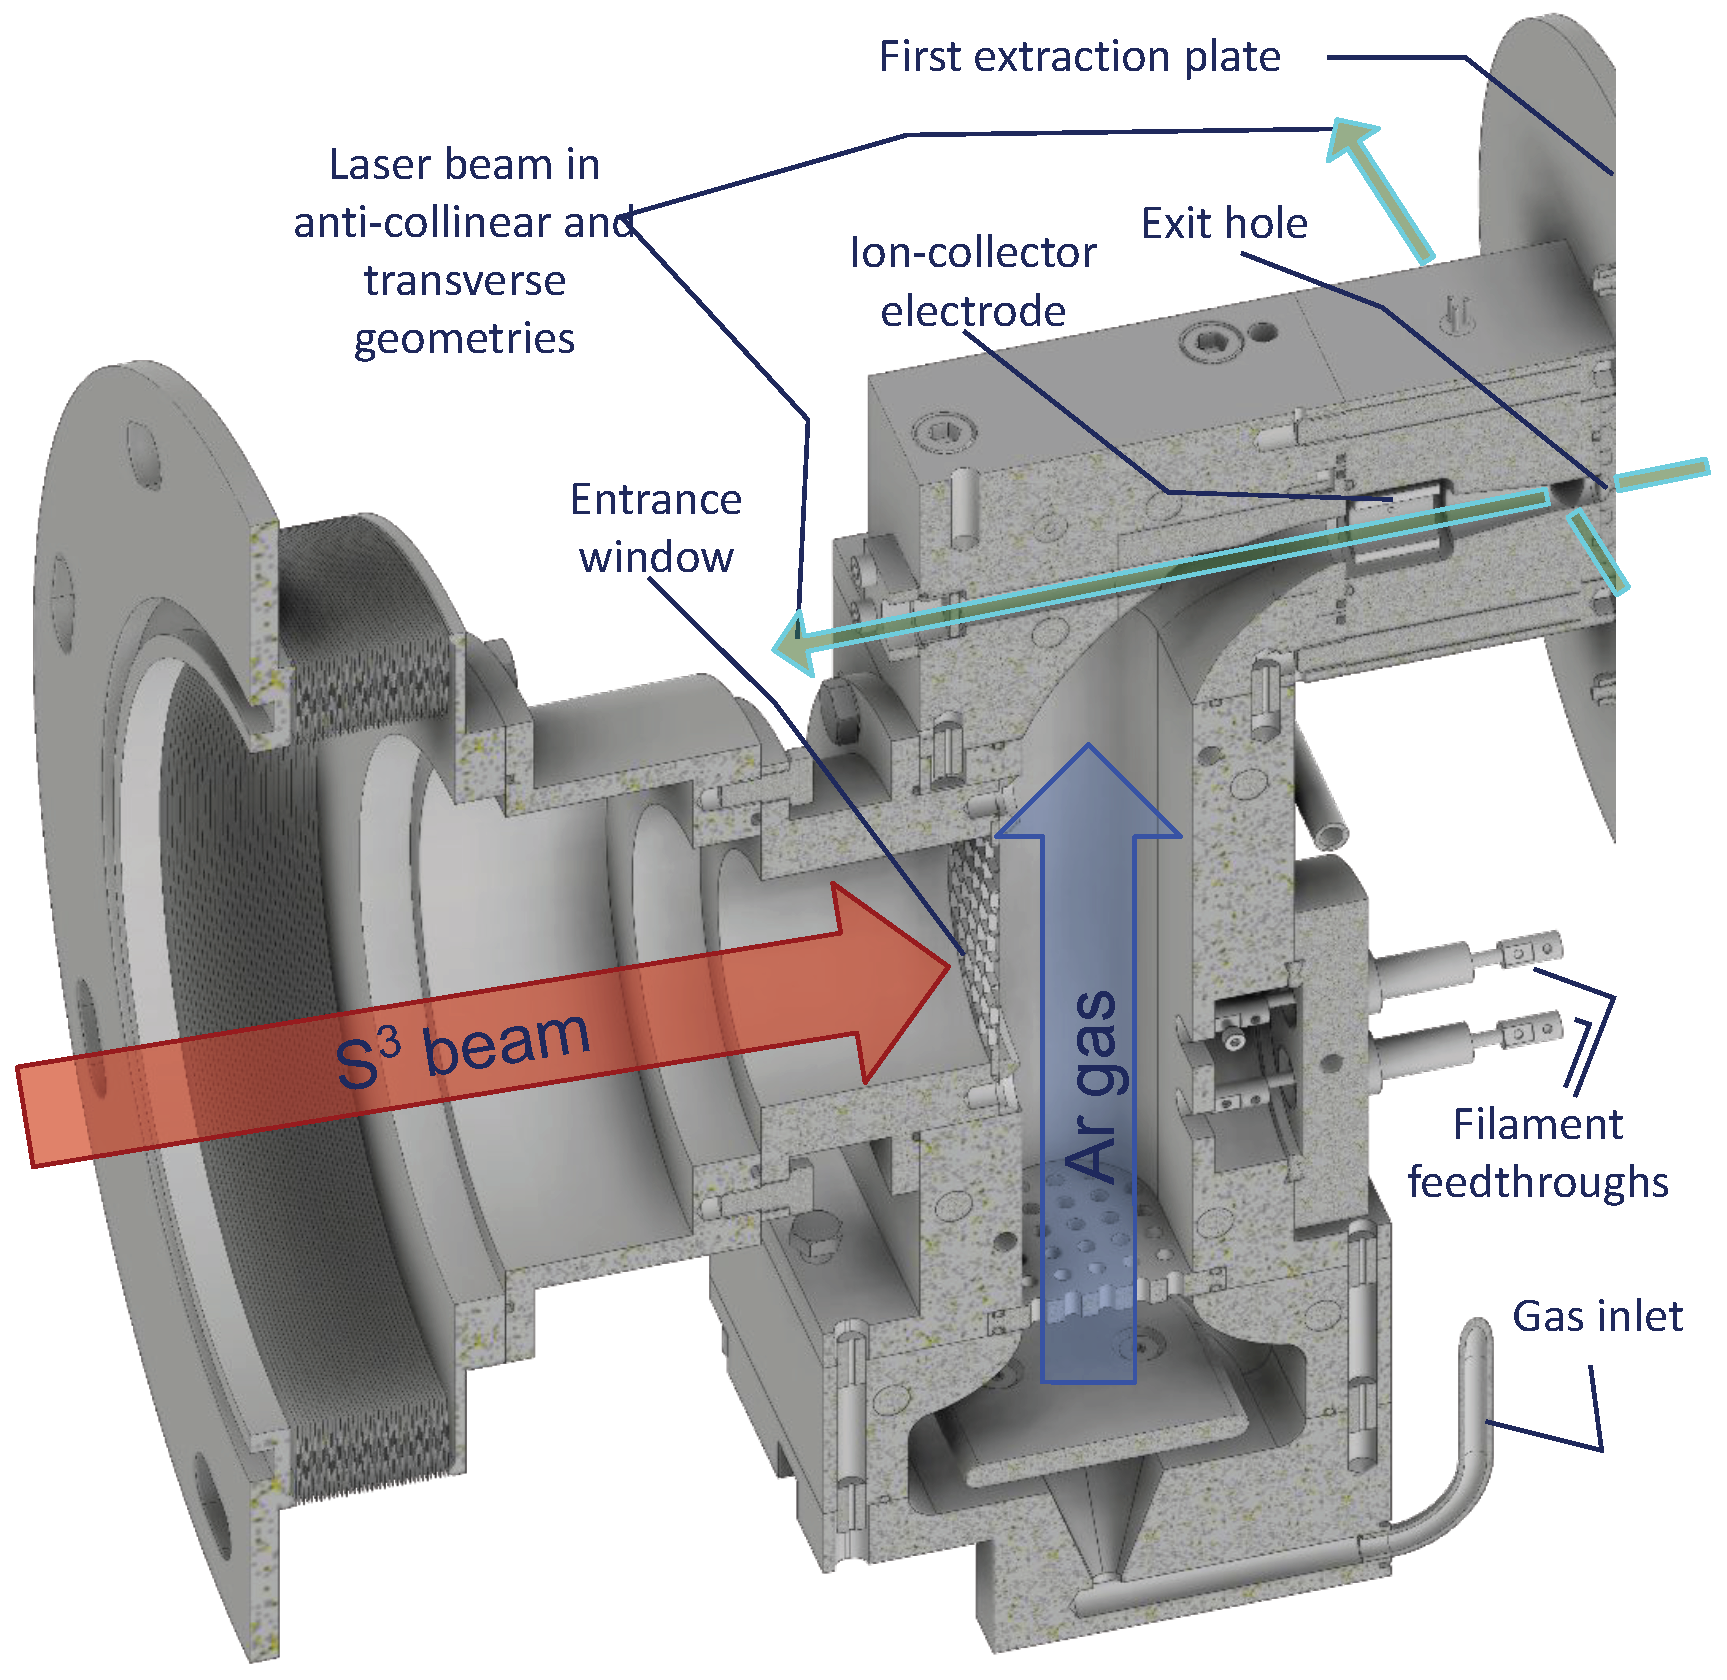
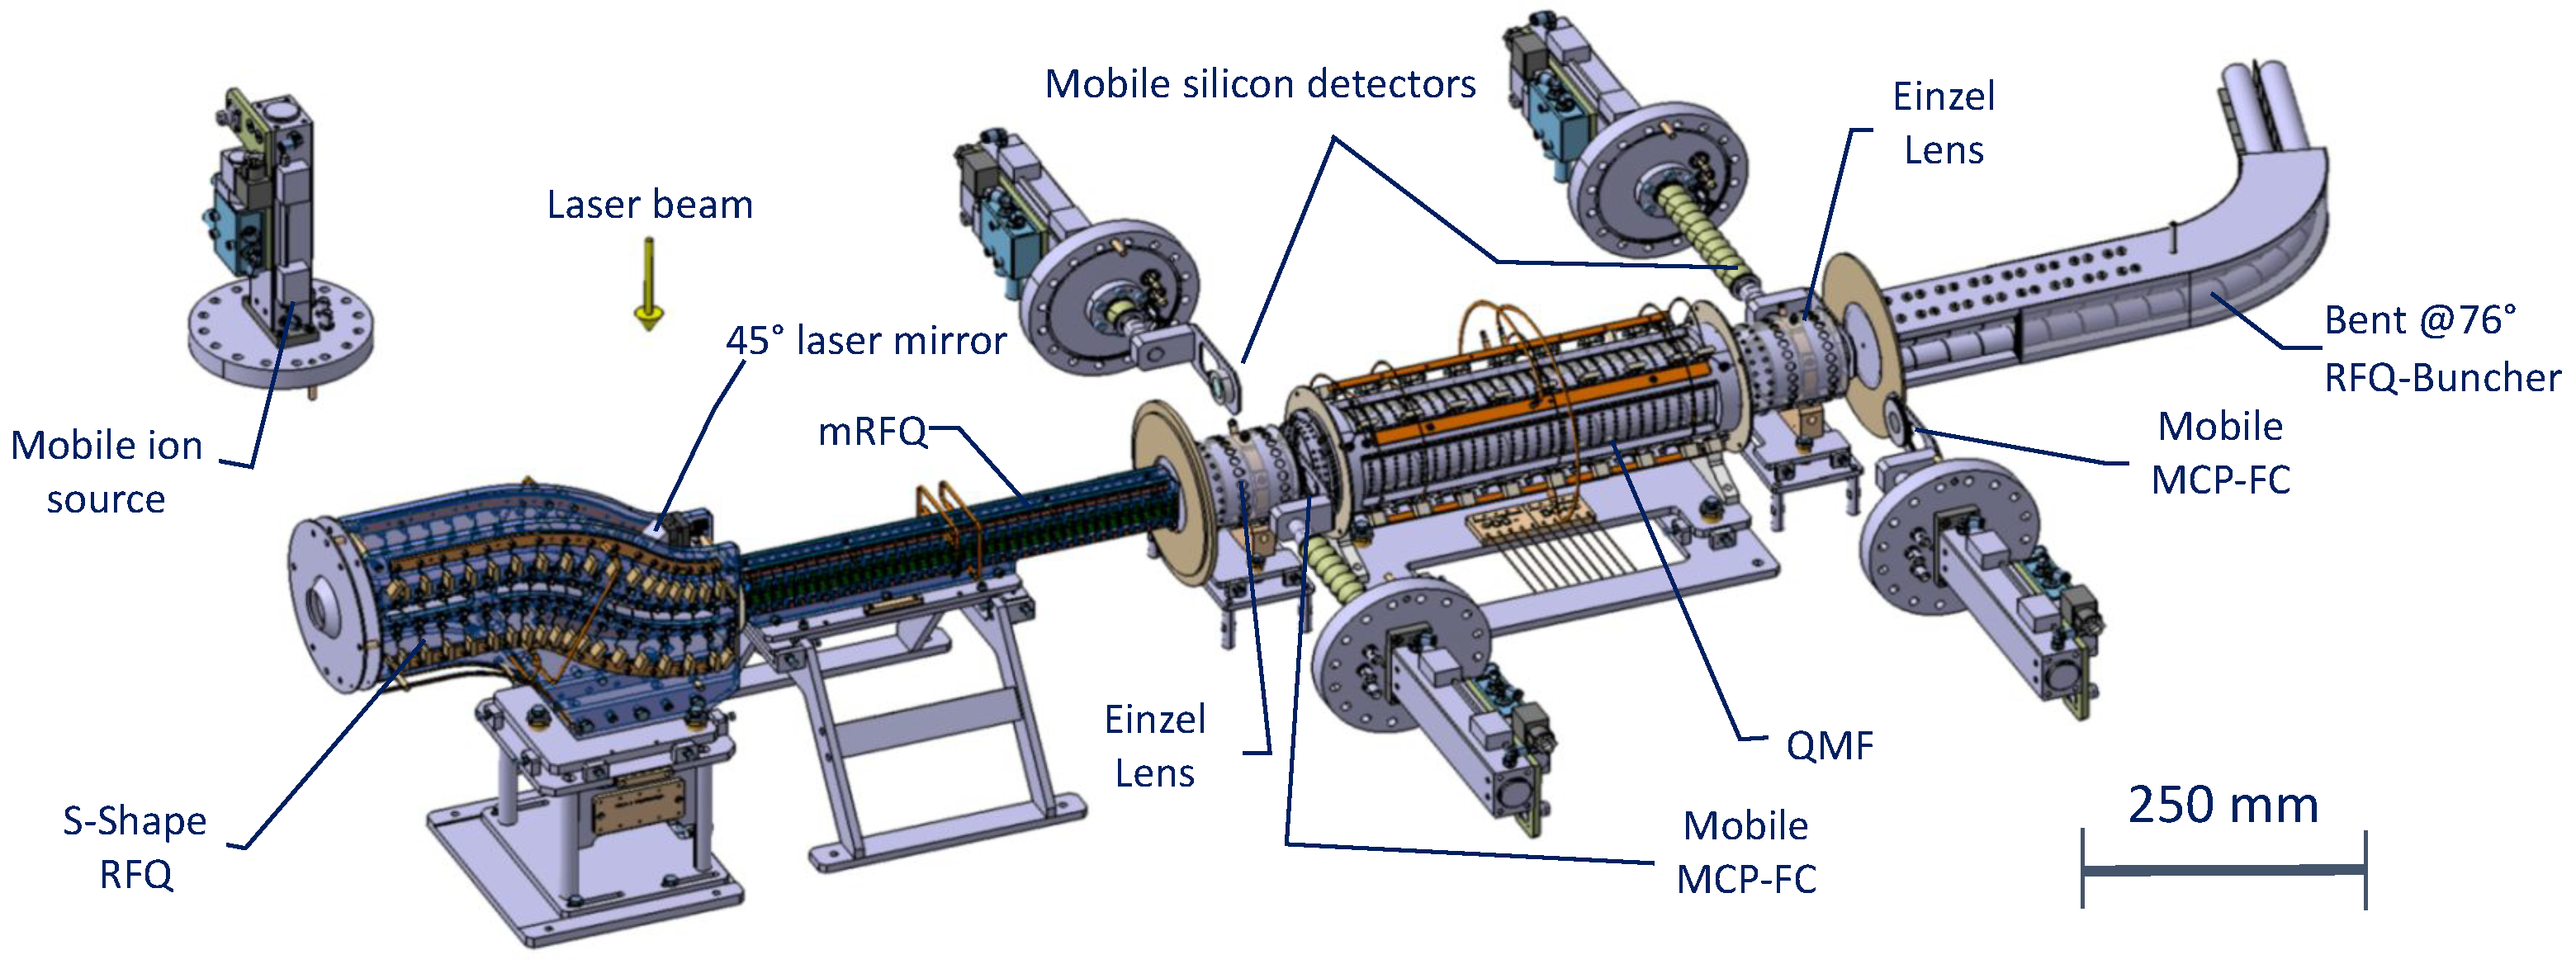
2.1. Gas Cell, RFQ Ion Guides and Mass Spectrometer

The starting point of the S 3 -LEB setup is a gas cell, in which the S 3 fusion–evaporation recoils will enter via a thin window. A 3D image of the gas cell is presented in Figure 1. The next point of the setup is the beam transport, mass separation, bunching and cooling stages. This is achieved by the static and alternating electric fields created by a set of radio frequency quadrupole (RFQ) structures. An image of the full RFQ chain is presented in Figure 2.
Once stopped in the buffer gas environment, neutralization and thermalization of recoils will occur by interactions with the gas atoms and the electron density created by the stopped ion beam. The gas cell follows closely the design currently used at KU Leuven [16]. It is designed to be operated with argon gas at 200–500 mbar under constant flow, which exits the cell through a de Laval nozzle, having typically a 1 mm throat diameter. Gas flow simulations using COMSOL [16,17] have been performed in order to optimize the gas cell geometry and find an optimal volume providing an efficient stopping and extraction of the S 3 beam, while maintaining minimal extraction time. The resulting internal cross-section of the gas cell has a 30 mm depth and a 70 mm width. With this geometry, simulations give an average extraction time from the stopping area to the exit hole of about 500 ms for a 1 mm throat diameter.
A feedthrough in the gas cell body allows the insertion of two filaments that are resistively heated for evaporating an element used in the offline tests or as an online reference. The gas cell body and filament holder flange are water-cooled and the entire gas cell can be baked by resistively heated cartridges inserted in the gas cell body. The temperature is monitored by PT100 sensors. Just before the exit of the gas cell, two ion-collector electrodes are installed for removing non-neutralized ions in online experiments.
The gas cell has three laser windows, two just before the exit, facing each other, and one opposite and concentric to the exit hole. At the gas cell exit, a de Laval nozzle is installed, the geometry of which is optimized using the calculations performed by the Von Karman Institute for Fluid Dynamics (VKI, Belgium) [18]. On the exit side of the gas cell, aligned with the nozzle, two extraction plates—one on ground potential and the other on a slightly positive potential—provide an initial guiding field for the ions towards the RFQ chain.
The RFQ design follows the initial concept from KU Leuven [19], with further adaptations. For each RFQ, the RF voltage is impedance-matched using a specially designed transformer with a tunable capacitor connected to the secondary circuit. DC voltage gradients are applied via voltage divider resistor chains across the RFQs.
First, the ions enter a segmented S-shape RFQ (SRFQ), which has the purpose of extracting the ions from the jet and decoupling the laser and ion beam axes. The SRFQ is located in the same vacuum chamber as the gas cell; thus, it is in a relatively high-pressure environment for RFQ operation (∼10 2 –10 1 mbar). The SRFQ has two injection plates that can be biased, and a linear DC gradient is applied on top of the RF voltage, to drag the ions through it. At the end of the first straight section of the SRFQ, a mirror fixed on top of the structure guides the laser light longitudinally into the gas cell.
After the SRFQ, the ions enter the mini-RFQ (mRFQ), which serves as a differential pumping stage and hence stands between two areas of approximately two orders of magnitude different vacuum levels. The vacuum chambers of the SRFQ and of the mRFQ only communicate through a 3 mm-radius bore of the latter. The gas load in the SRFQ area is pumped by an Edwards GXS450 screw pump, while in the mRFQ area, a Pfeiffer STPiXA3306C turbo pump, coupled to an Edwards GXS160F screw pump for pre-vacuum, are used to remove the remaining gas.
Next, ions enter the quadrupole mass filter (QMF), which was designed to reach a mass-resolving power m / ( 2 Δ m ) of ∼50. The first and last QMF segments can be DC biased independently from the rest, allowing it to act as a Brubaker lens [20].
After the QMF, the ions enter the cooler–buncher RFQ (RFQ c b ), which is a two-section system. In the cooler section, which is surrounded by a metallic housing, the ions are cooled by helium gas, which is injected at the center of the RFQ. This minimizes the longitudinal and transversal emittance of the beam. In the following buncher section, the ions are bunched using a potential well created by a series of segments that are connected to high-voltage switches. After a predefined trapping time in the buncher, the extraction takes place by switching the trapping voltages to an extraction ramp, which accelerates the ions out of the RFQ c b . Differential pumping stages separate the QMF from the poor intermediate pressure areas of both the mRFQ and the cooler.
Once the cooled and bunched ion beam leaves the RFQ chain, it enters the pulse up (PU) drift tube. The tube is used for ion beam reacceleration up to ∼3–3.5 keV kinetic energy, which is the design voltage for the final point of the S 3 -LEB setup, consisting of a multi-reflection, time-of-flight (MR-TOF) mass spectrometer. When the ions enter the PU drift tube, its electrode is biased at ∼−1.5 kV. When the ions are at its center (typical flight times from the buncher are between 5 and 10 μ s), the electrode voltage is switched to ∼+1.5 kV. This gives the ions a relative kinetic energy gain of ∼3 keV.
Further beam purification and detection will be performed by the MR-TOF mass spectrometer, called Piège à Ions Linéaire du GANIL pour la Résolution des Isobares et la mesure de Masse (PILGRIM). In this device, the ion beam is reflected between two electrostatic mirrors until it is separated in time of flight, leading to a mass-resolving power R = m / ( 2 Δ m ) ≈ 10 5 [21]. The setup will expand in its capabilities by a decay spectroscopy setup called Spectroscopy Electron Alpha in Silicon bOx couNter (SEASON). In a later phase, a transport line to the future DESIR facility [22] is foreseen.
The ion beam detection is performed at multiple locations using micro-channel plate detectors (MCP 1 , 2 ) at the QMF entrance and exit, and after the PU electrode (MCP 3 ). All 3 MCPs have 10 % transmission grids allowing attenuation of intense beams and also detection of ion currents. The MCP 3 detector has an additional phosphor screen for ion beam imaging. Additional detection sites are located around the MR-TOF mass spectrometer [23]. It is also possible to install silicon detectors on linear actuators at the QMF entrance and exit.
The S 3 -LEB setup with the gas cell, ion guides and PILGRIM mass spectrometer is currently installed in a test room at the LPC Caen institute. All components have been coupled and aligned.

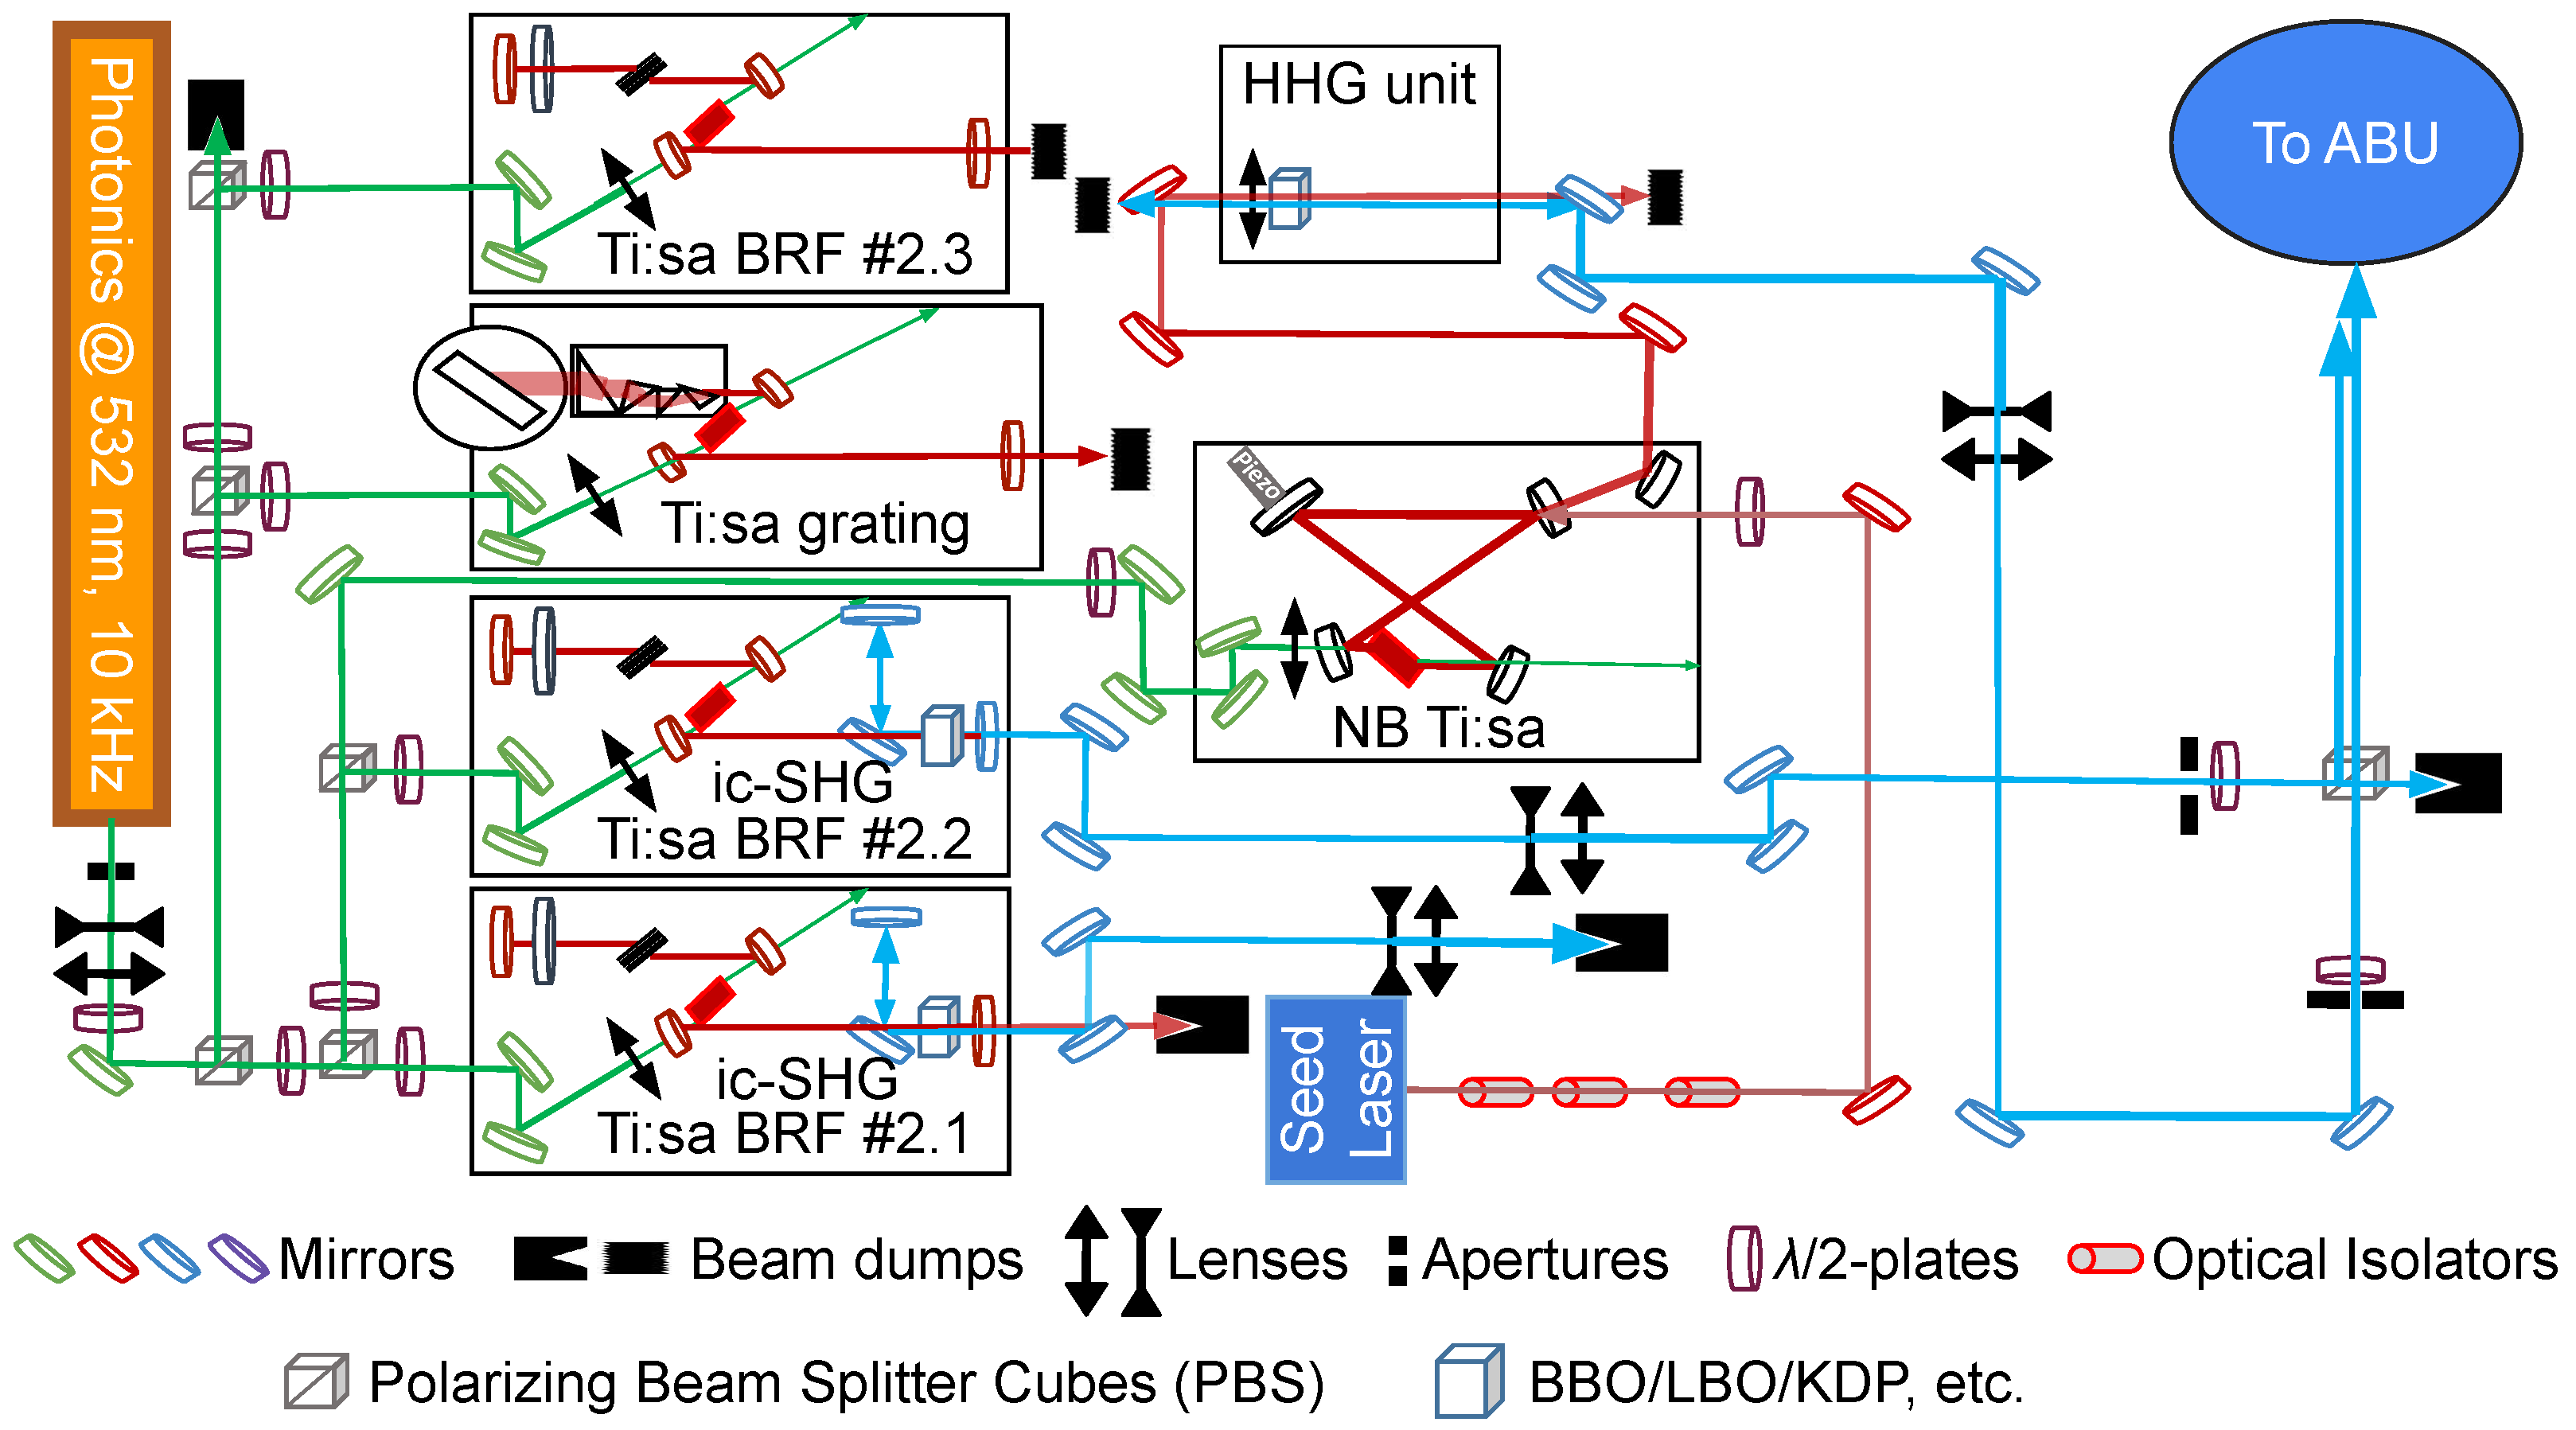
2.2. The GISELE Laser Laboratory

The purpose of the GISELE laboratory is to perform offline laser ionization and spectroscopy experiments with the elements of interest for the S 3 -LEB facility. A part of the GISELE laser system has been coupled to the S 3 -LEB setup at LPC where it is currently being tested. The layout of the full GISELE laser system can be seen in Figure 3. An Nd:YAG laser, working at 10 kHz repetition rate and in the second harmonic, pumps several titanium:sapphire (Ti:sa) lasers with a power distribution achieved by implementing λ /2 retardation plates and polarizing beam splitter (PBS) cubes. Intra-cavity and extra-cavity higher harmonic generation can be achieved using nonlinear crystals. The Ti:sa laser beams are overlapped and guided towards an atomic beam unit (ABU) with a high-temperature oven ( T m a x 2000 °C).
In the future, a dye laser system is foreseen to be implemented to complement the Ti:sa wavelength coverage [24]. Recently, studies of a single-longitudinal-mode, pumped pulsed-dye amplifier have been carried out for high-resolution and high repetition rate spectroscopy applications, when using the dye laser system [25].
Monitoring and synchronizing the laser pulse time profiles is ensured by picking up a reflection or a fraction of each output laser beam and detecting it with a photodiode, the output of which is connected to an oscilloscope. The temporal overlap of the different Ti:sa laser beams can be controlled either by modifying the gain using the focusing of the pump light into the crystal, or by Pockels cells. The wavelength is measured using a HighFinesse WS7 wavemeter. A Labview control and acquisition system is used to operate the lasers, record power and wavelength values, count ions in the ABU and perform wavelength scans.
The Z-type Ti:sa cavities of GISELE (see Figure 3) are broadband (BB) cavities, having either a birefringent filter (BRF) plus etalon, or grating as wavelength selective elements and achieving a typical linewidth Δ f l a s e r f u n d of 5–10 GHz of the fundamental output frequency [26,27]. A Z-type cavity using two etalons is available, for achieving a narrower linewidth Δ f l a s e r f u n d of 1.5–2 GHz [28]. For narrowband (NB) spectroscopy, an injection-locked pulsed-Ti:sa ring laser is available, seeded by an external cavity diode laser (ECDL), achieving linewidths, Δ f l a s e r f u n d , of ≤50 MHz [29]. The ECDL system requires feedback protection, which is provided by optical isolators. Typical output powers with standard 10 W pumping power of these Ti:sa systems are 2.2–2.7 W.
The design of the resonators is optimized so that any astigmatism from the surfaces of the Ti:sa crystal and the curved mirrors at both sides of the crystal cancel each other. The resonator is designed for high repetition rate operation (up to 10–15 kHz).
The ABU consists of an oven, apertures, ion optics and a MCP detector that is kept under vacuum. The atomic beam diffuses in the upward direction and it is collimated by multiple apertures before it reaches the photon–atom interaction region. This helps to minimize the transverse Doppler width of the atomic ensemble, as well as to constrain the interaction volume. To deflect the surface ions, two electrode pairs, located below the photon–atom interaction region, can be biased.
Once ions are created by the photon–atom interaction, an electric field gradient guides the ions towards an MCP located ∼50 cm away from the interaction region. The gradient is optimized in order to obtain a time focus on the MCP allowing mass resolving powers on the order of R = 200.
The MCP signal is pre-amplified, then sent to a constant fraction discriminator and, finally, a time to digital converter (TDC) with maximum resolution of 4 ns/bin. The TDC is triggered by a TTL signal synchronized to the Q-switch trigger of the pump laser. The obtained TDC signal is sent to the Labview acquisition system.

3. Results

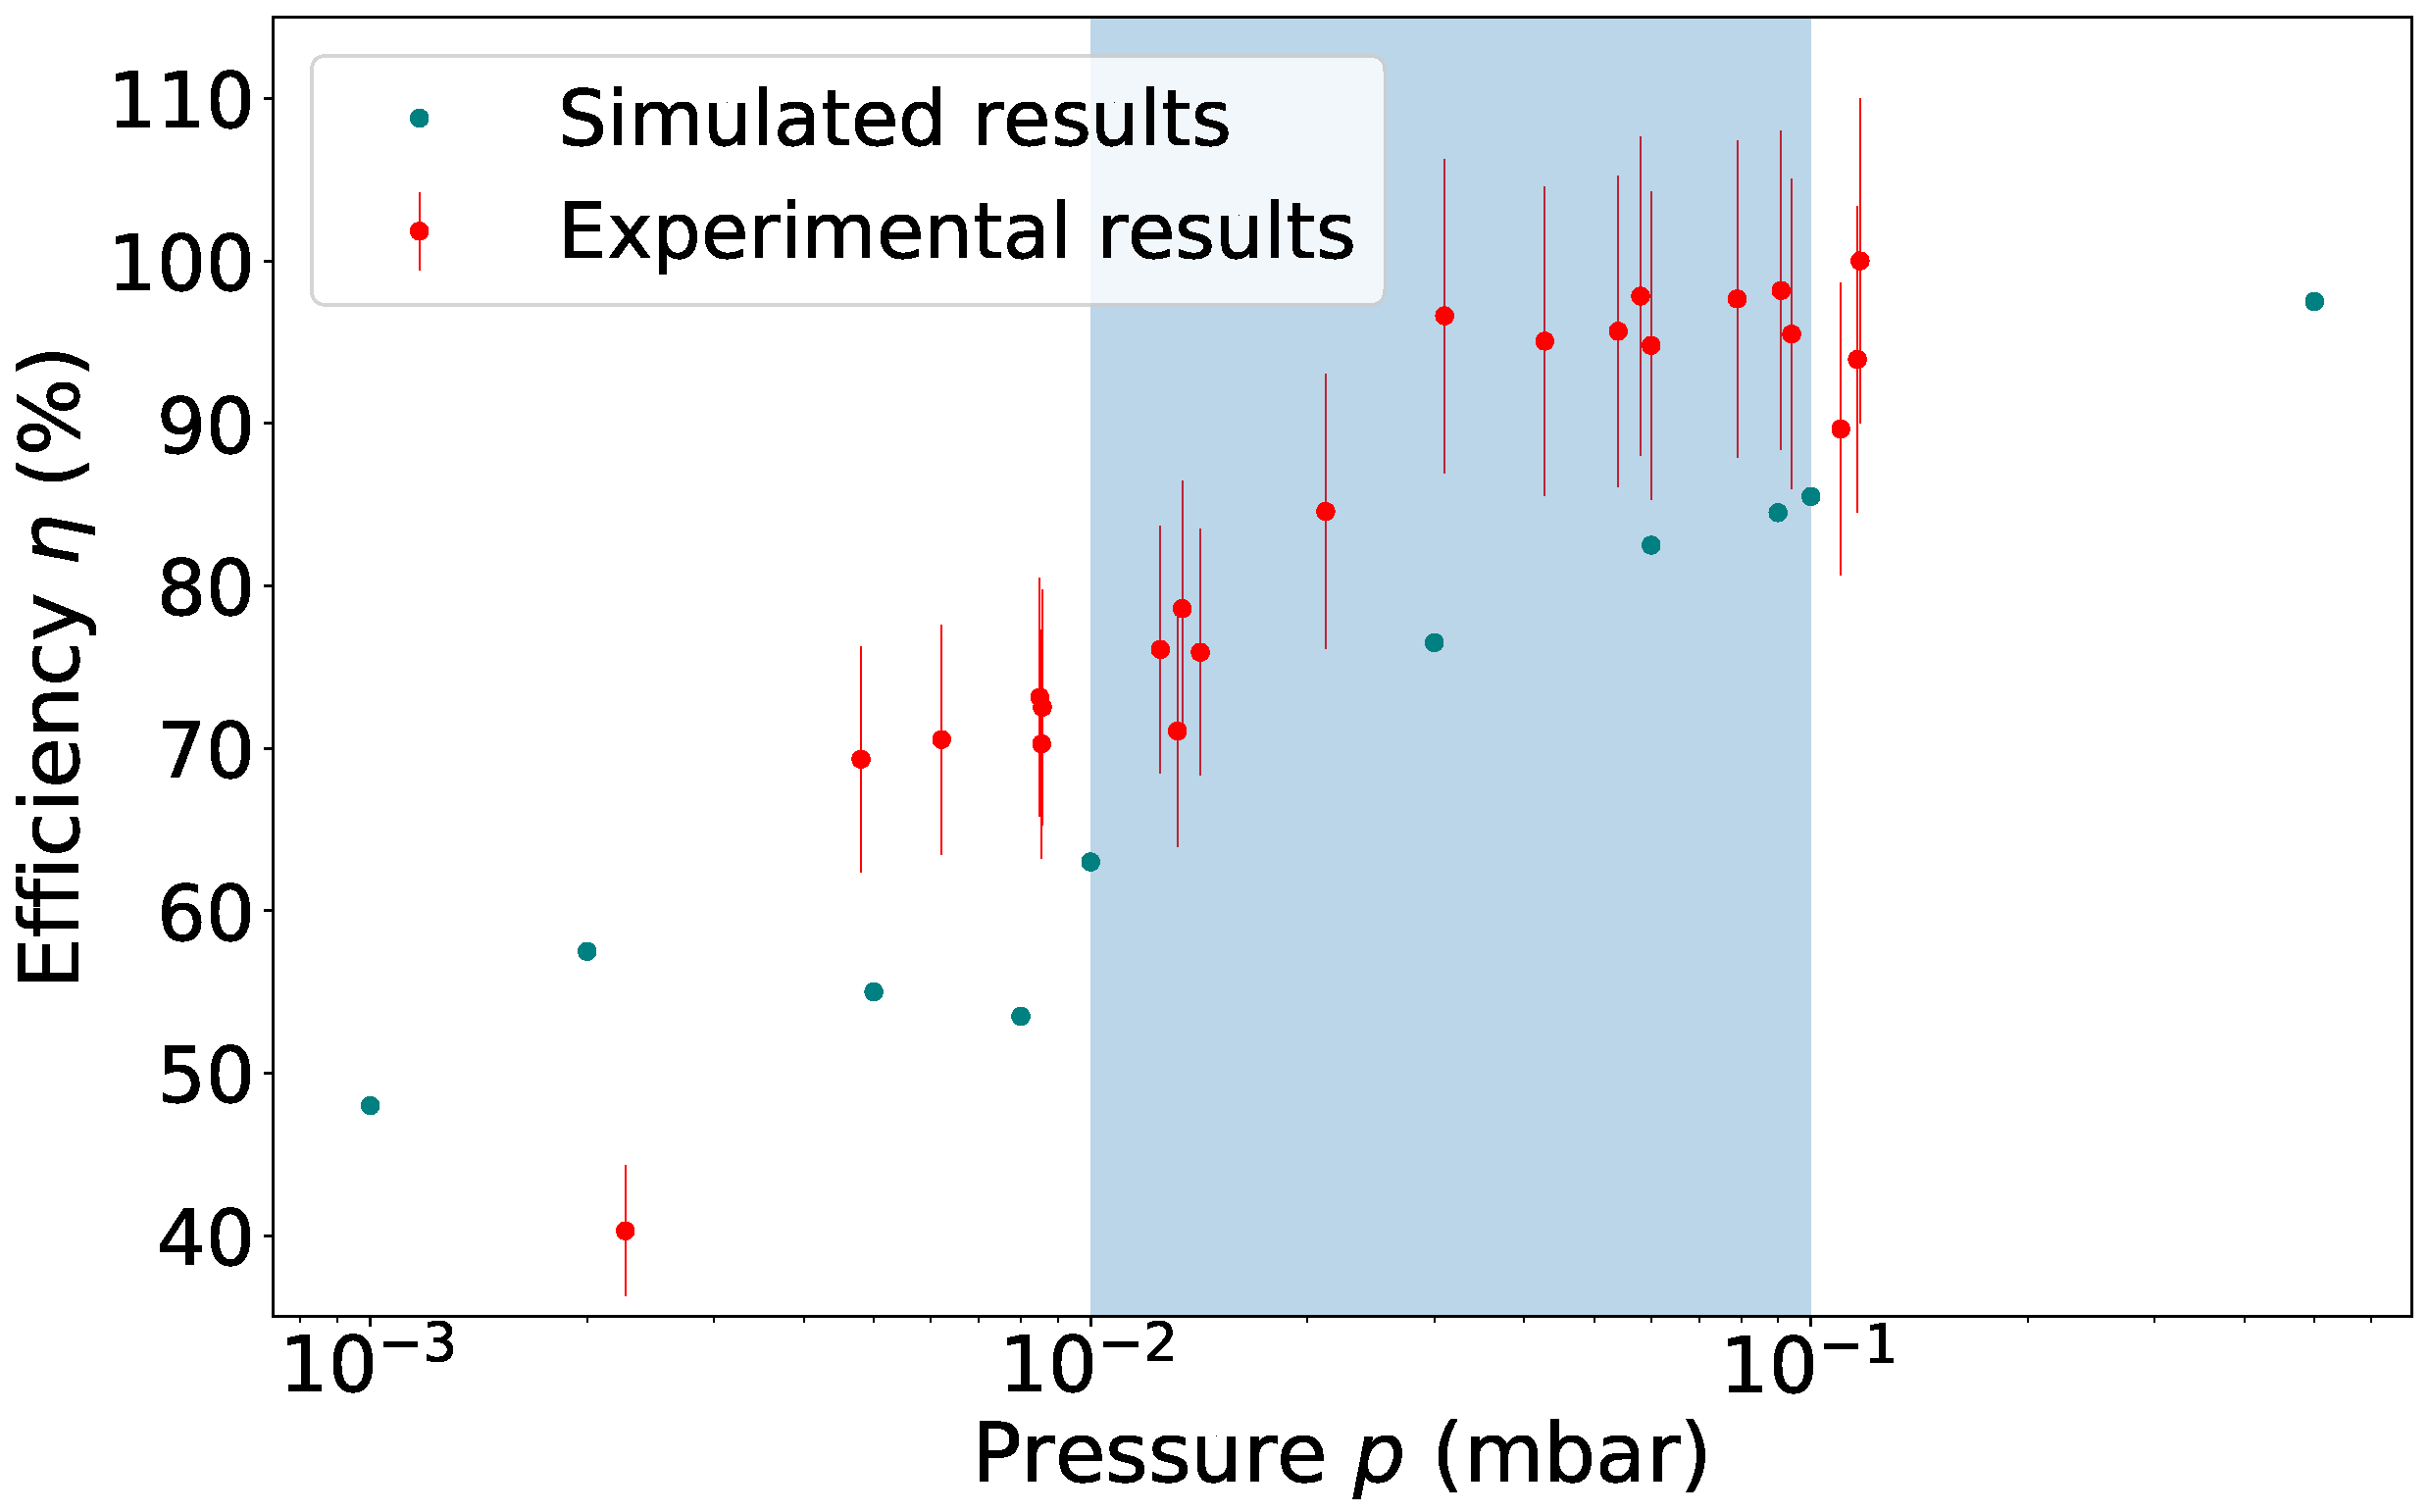
3.1. RFQ Offline Tests

The voltage optimization and the transmission and resolution tests were performed separately for the SRFQ/mRFQ and QMF/buncher. To set the voltages and monitor/control vacuum parameters, a CVI control system with Python interfaces was used. The MCP signals were recorded by a National Instruments 9402 counter and the ion currents by a Keithley 6487 picoampere meter unit.
For the tests of the SRFQ/mRFQ section, a 133 Cs source was inserted on a linear actuator in the designed area for the gas jet formation (in front of the SRFQ entrance). The total source current could be measured on a 10% transmission grid covering the source emission area. To achieve the operating pressure in online conditions, argon was injected directly in the gas cell vacuum chamber. The RF driving frequency of the ion guiding RFQs was set to 500 kHz, to allow operation with lower RF amplitudes and avoid discharges. The DC voltages on the mRFQ and SRFQ electrodes were then optimized to enhance transmission. The beam was detected on a Faraday cup placed behind the mRFQ. The transmission tests were performed aiming for the range of background pressures between 10 2 mbar and 10 1 mbar, that would correspond to online conditions for the creation of a matched jet of Mach number ∼ 8 by the corresponding nozzles operated at different stagnation pressure regimes.
The optimum SRFQ and mRFQ settings result in a transmission of ≥80(15)% after mRFQ for more than an order of magnitude change in pressure p, centered around the region of interest for S 3 -LEB experiments (see Figure 4). The error bars have been fixed to a 10% value, which is typical beam current uncertainty obtained in our measurements with a picoampere meter. In the same figure a comparison with SIMION simulations [30], using the hard-sphere (HS1) collision model and the same RF, DC and p settings, is presented. For these simulations, the ion source was assumed to be a 2 π emitter from a disk, having 6.5 mm diameter of the used 133 Cs source and the energy distribution compatible to the thermal energy of a T ≈ 1000 °C ensemble. The collisional cross-section σ c o l with argon atoms was estimated from the ionic radius of 133 Cs and the Van der Waals radius of argon to be 4.25 × 10 19 m 2 . The experiments revealed that the SRFQ and mRFQ have a very high transmission efficiency (75–100(10)%) within the pressure region of interest for creating a matched hypersonic jet of Mach number 7–8. The simulations indicate 60–85% transmission efficiency. The underestimation in the simulations for high pressures can be explained by the limitations of the HS1 collision model or an inaccuracy in the chosen collision cross section. The qualitative trend is nevertheless reproduced well.
The QMF/buncher ensemble was tested with a rubidium surface ion source installed in front of the QMF, providing a mixture of 85 , 87 Rb with the natural abundance. In ion guide mode (no quadrupole DC field), the transmission was close to 100%. When a DC voltage in combination with the RF voltage was applied (filtering mode), the QMF transmission efficiency was checked by a 2D scan of the DC and RF voltages leading to a resolving power on the order of m / ( 2 Δ m F W H M ) 40 and a transmission of about 40%. For lower resolving powers, the transmission efficiency is above 80%.
In order to give a more explicit estimate of the mass resolving power, a series of scans were performed also while keeping a constant DC to RF voltage ratio, the so-called load–line scan. Knowing the inner radius r 0 = 10 mm of the QMF, it was possible to calculate for each RF amplitude the optimal ion mass corresponding to a Mathieu q parameter of 0.706 (the tip of the stability diagram). The load–line scan was thus converted into a mass scan, for different DC-RF ratios. In Figure 5, we present one such scan performed with a DC/RF amplitude ratio of 0.166. The mass axis is recalibrated so that the left peak corresponds to 85 Rb. This configuration shows a complete separation of 85 Rb + and 87 Rb + and allows the possibility of also separating the intermediate mass A = 86 , with a suppression factor of the side bands, which remains to be determined experimentally. This resolving power is, however, limiting for the separation of heavier masses. With the first production of ions in the gas cell or jet, which will have a different emittance from the beam used in this test, the resolving power figure will be updated. Further improvements can be achieved by a better control of the symmetry of the RF field between the positive and negative phase, which is currently on the order of 1%.
In the same figure SIMION simulations of the QMF transmission are performed with the same settings as in the experiments. The incident ion beam is modeled as a cone matching the diameter of the ion-source collimator of 6 mm and having a half-angle of 2.5°, which leads to the experimental transmission efficiency through the QMF with a DC voltage of 100 V and optimal RF amplitude (which are the standard settings). One notices that the experimental resolving power is well reproduced.
The transmission through the RFQ c b was tested under the same conditions as during the QMF tests, being optimized both in continuous and bunching mode. The helium flow rate injected in the buncher was from 75 to 105 mL/min, the latter being the limit due to the resulting pressure of 1 × 10 5 mbar in the PU electrode area, preventing the proper operation of MCP 3 . However, an increase in flow rate from 75 to 105 mL/min achieved only 25% relative increase in the transport efficiency, making 75 mL/min already close to the optimal pressure. A comparison of ion spots on the phosphor screen showed similar radial distributions between 75 mL/min and 90 mL/min; however, for flow rates < 75 mL/min, a significant degradation of the ion spatial distribution was observed.
The 10% transmission grid on MCP3 was hardwired to the ground potential; therefore, it did not allow us to measure the continuous ion beam through the buncher in continuous mode. For this type of measurement, the beam was collected on the negatively biased PU electrode and read out with the picoampere meter. With the optimum RF, DC and He injection settings, a transport efficiency of the buncher in continuous mode of about 85% was measured on the PU electrode with an uncertainty ∼ 10%. In order to test the buncher in pulsed mode, it was necessary to accelerate the ion bunches to MCP 3 using the PU electrode, thus giving them sufficient energy for efficient detection.
The bunched-mode efficiency was tested both in continuous accumulation mode and using a beam gate (BG) to limit the number of ions per bunch and ensure the same cooling time for all ejected ions. A BG was created by switching the injection electrode of the QMF, in order to block the ion beam, with the exception of a short time, controlled by a TTL trigger. The transport efficiency was tested using a BG of 1 ms and a cooling time of 10 ms, leading to a transmission value of 30(10)%. This value was, however, obtained with a low-resolution (50 ns) ion-counting system with an average intensity of one ion per bunch or less. A test with a high-resolution counting system will allow eliminating any potential pile-up effects.
In addition to the transport efficiency, the bunch TOF distribution was recorded using an oscilloscope and its averaging function with 75 mL/min flow rate. This result is presented in Figure 6, left panel, where one observes two overlapping bunches corresponding to the two Rb isotopes already separated in TOF on the MCP 3 . The fact that the double-peak structure corresponds to the two isotopes was validated by using the QMF at a DC voltage of 100 V and suitably chosen RF amplitude, to select one or the other isotope. The heights of the two individual peaks were normalized to match the corresponding isotopic abundances.
Simulations of the RFQ c b using the SIMION software and the HS1 algorithm were carried out following the same principles as those described for the SRFQ, mRFQ and QMF. Simple conductance calculations knowing the aperture diameters, the pumping power and some of the gauge pressures (corrected for helium) were performed to estimate the true pressure in the buncher. The simulations were started in front of the QMF extraction lens. The ion energy distribution chosen was identical to the one giving the best reproduction of the QMF behavior. For the entire simulation, the experimental voltages were used as input. Two helium flow rates were tested: one set to the experimental value most commonly used (75 mL/min) and one set to a slightly higher value (125 mL/min). The ions were injected all at once, allowed to cool for either 2, 5 or 10 ms, and then extracted towards the MCP 3 . The simulations showed transmission efficiencies in the experimental pressure range of 20–40%, compatible with the experimental findings.
Furthermore, the simulated TOF distribution of a mixture of 85 Rb + and 87 Rb + with the correct elemental abundance was compared to the measurement using the same helium flow rate, and is presented in the right panel of Figure 6. The TOF offset was not measured experimentally with the oscilloscope and thus the simulation TOF was shifted by an arbitrary amount to match the centroid of the experimental spectrum. However, one notes that the experimental width and separation of the peaks is well described.
One must note, however, that all the values described in this section are obtained for the alkali ion source, the emittance (and divergence) of which should be significantly larger than that of the laser-ionized beam.

3.2. Laser Ion Source Offline Tests

Erbium atoms were chosen for the offline studies based on the fact that during the S 3 commissioning it is planned to use 152 Er. The goal of the Er I RIS offline measurements at GISELE is to measure the isotope shift (IS) and hyperfine structure (HFS) by a two step RIS scheme of stable erbium isotopes ( 164 , 166 , 167 , 168 , 170 Er), and to compare these results with the literature in order to quantify the performance of the equipment and the expected online performance. Stable erbium atoms are deposited in solution form (Er 2 O 3 in 5 % HNO 3 ) on a tantalum foil, which then is placed inside the ABU oven.
The left panel of Figure 7 shows the ionization scheme used in the presented study. The excitation step (415.2 nm) was reported in [31] and, recently, precise Rydberg and auto-ionizing state, and ionization potential measurements, were carried out, starting from the same level at 24,083.2 cm 1 [32]. From the latter work, the most efficient A.I. state transition of 25,210.4 cm 1 was chosen for the ionization energy. Moreover, the strength of the excitation step has been determined to be A ki = 9.6 × 10 7 s 1 [33].
In these measurements, the NB Ti:sa system with a fundamental output linewidth 20 ≤ Δ f 50 MHz was used for the excitation step and a BB Z-type Ti:sa cavity was used for the ionization step. The ABU TOF resolution with stable erbium atoms was R = TOF / ( 2 × FWHM ) 260 , with TOF = 21.4 μ s and FWHM 170 Er = 40 ns. An acquired TOF spectrum resolving all stable Er isotopes following their natural abundances is shown in the right panel of Figure 7.
The wavelength adjustment of the excitation step was performed using the Labview control and acquisition system, which adjusts the ECDL master laser output wavelength. For each scan step the corresponding TOF spectra is saved. An individual resonance of each isotope can then be extracted from the full TOF spectra by choosing a region of interest.
After the frequency doubling stage, once the NB Ti:sa system beam reached the ABU, the measured full power after the two ABU windows varied between 30 and 100 mW. The Z-type Ti:sa BRF cavity used intra-cavity second harmonic generation and produced 40–100 mW of power at the ABU.
Before the IS and HFS measurements, the saturation power level P 0 of the excitation step was measured. In these measurements, both lasers were on resonance and the ionization step was kept at full power. Neutral density filters were used to reduce the laser power. The spatial alignment of both beams was performed by using the TDC count rate and a pair of ABU entrance/exit window apertures. The results are represented in Figure 8. The data set has been fitted by using the following equation:
I ( P ) = A + C × ( P / P 0 ) / ( 1 + ( P / P 0 ) ) ,
with A , C , P and P 0 being an offset describing influence from surface- and non-resonant ionization, the maximum resonant ionization rate, measured power and saturation power, respectively. The fit results were: A = 0.5(10) cps, C = 110(10) cps. The extracted saturation power P 0 was 145(40) μ W. The beam spot diameter was about 1 mm.
Moreover, to observe the saturation effect more precisely, scans at several excitation step powers P were performed. In the measurements shown here the power was reduced until no more influence on the full-width at half-maximum (FWHM) was observed. This was the case at about 10–20 μ W resulting in a resonance linewidth Δ f r e s of ∼120 MHz. The expected natural linewidth is ∼15 MHz. The saturation power from previous work [32] was 2.1(1) mW, compared with the present result of 0.145(40) mW. The reduction of the saturation power in our case can be explained by the reduced linewidth of the NB Ti:sa system (20 ≤ Δ f 50 MHz) in comparison to the BB Z-type Ti:sa cavity ( Δ f 5 GHz) and by possible differences in beam spot diameter used in [32].
IS and HFS measurements were performed for the different stable erbium isotopes. A detailed analysis of the data will be presented in a forthcoming paper [34], where the IS and HFS parameters will be represented.
Fitting of the raw data was carried out by a χ 2 procedure in SATLAS [35]. An IS result from a single scan of 166 , 170 Er is presented in the left panel of Figure 9. The RIS measurements were performed with 10–20 μ W power levels for the excitation step and at 20–90 mW for the ionization step.
A scatter of the IS data from 20 measurements is presented in the right panel of Figure 9, with the weighted average subtracted from all values. The individual uncertainties of the data points represent statistical uncertainties, multiplied by χ r e d 2 to correct for non-statistical scattering effects. The source of the larger data scattering is still under investigation.
Owing to the narrow spectral linewidth of the NB Ti:sa system, the HFS spectra of the odd–even 167 Er isotope could also be measured. The total angular momentum of the ground state (g.s.) J g . s . = 6 and nuclear spin I = 7 / 2 , results in 8 g.s. HFS components ranging from F = 5 / 2 to 19 / 2 . The excited state (e.s.) has angular momentum of J e . s . = 5 , also with 8 HFS components ranging from F = 3 / 2 to 17 / 2 (all J values taken from [33]). By applying selection rules, this results in 21 possible transitions. The splitting of the g.s. components has been measured by A. Frisch et al. [36]. The e.s. hyperfine constants A and B are unknown.
The HFS information was extracted from 11 scans, performed below the saturation power level. The g.s. A l and B l coefficients were fixed to the the literature values −120.487(1) and −4552.984(10) MHz [36], respectively. The nuclear magnetic octupole moment coefficients C l and C l for the g.s. and e.s. were set to 0. The fit result for a single scan is represented in Figure 10. The spectrum corresponding to all 21 HFS components has been recorded and fitted. In the presented fitting procedure, the peak intensities are left as free variables.

4. Outlook and Conclusions

The commissioning of the S 3 -LEB setup is entering the offline test phase of the entire installation, in which the the gas cell, RFQ chain and the MR-TOF mass spectrometer are connected and the laser system is coupled to the gas cell.
The commissioning tests performed separately for the RFQ tandems of the setup (SRFQ/mRFQ and QMF/RFQ c b ) have shown promising results, both in terms of transmission and resolving power/bunching capability. Work is ongoing with the cooling and bunching section to improve the performance before the first ion injection into the MR-TOF mass spectrometer will take place.
The Ti:sa-based GISELE offline laser laboratory at GANIL has been successfully developed for the high-resolution spectroscopy requirements of S 3 -LEB. The laser systems are adapted for both in-gas-cell and in-gas-jet spectroscopy methods. Using one of the possible Er I RIS schemes, new narrowband IS measurements of 164 , 166 , 168 170 Er have been performed, and the stability of the system between different measurements has been illustrated. With the same RIS scheme, first high-resolution HFS spectra with stable 167 Er has been measured.

Author Contributions

Conceptualization, J.R., A.A., M.A., F.B., L.C., J.-F.C., A.C., S.D., P.D. (Pierre Delahaye), P.D. (Philippe Desrues), A.D., P.D. (Patricia Duchesne), R.F., X.F., S.F., P.G., R.P.d.G., S.K., N.L., R.L., J.L., F.L., V.M., Y.M., I.M., A.O.-C., B.O., J.P., O.P., B.-M.R., H.S., S.S., E.T., J.U., C.V., M.V. (Marine Vandebrouck), P.V.d.B., M.V. (Matthias Verlinde), E.V. and K.W; methodology, J.R., A.A., P.D. (Pierre Delahaye), R.F., X.F., S.F., V.M., P.V.D. and A.O.-C.; software, V.M. and C.V.; validation, J.R., A.A., L.C., R.F., X.F., S.F., N.L., V.M., H.S., S.S., P.V.D. and A.O.-C.; formal analysis, J.R., A.A., V.M. and A.O.-C.; investigation, J.R., L.C., R.F., X.F., N.L. and V.M.; resources, R.F., N.L. and P.V.D.; data curation, J.R., A.A., V.M. and A.O.-C.; writing—original draft preparation, J.R.; writing—review and editing, L.C., R.P.d.G., R.F., X.F., N.L., V.M., I.M., H.S., P.V.D. and K.W.; visualization, J.R. and V.M.; supervision, N.L., R.F. and P.V.D.; project administration, N.L., R.F., V.M. and P.V.D.; funding acquisition, N.L. and P.V.D. All authors have read and agreed to the published version of the manuscript.

Funding

S 3 has been funded by the French Research Ministry, National Research Agency (ANR), through the EQUIPEX (EQUIPment of EXcellence) reference ANR-10EQPX- 46, the FEDER (Fonds Europeén de Developpement Economique et Reǵional), the CPER (Contrat Plan Etat Reǵion), and supported by the U.S. Department of Energy, Office of Nuclear Physics, under contract No. DE-AC02-06CH11357 and by the E.C.FP7-INFRASTRUCTURES 2007, SPIRAL2 Preparatory Phase, Grant agreement No.: 212692. S 3 -LEB: This project has received funding from the French Research Ministry through the ANR-13-B505-0013, the Research Foundation—Flanders (FWO)—under the International Research Infrastructure program (nr. I002219N), the Research Coordination Office—KU Leuven—-the European Research Council (ERC-2011-AdG-291561-HELIOS) and the European Union’s Horizon 2020 research and innovation program under grant agreement No 654002.

Institutional Review Board Statement

Not applicable.

Informed Consent Statement

Not applicable.

Data Availability Statement

The data presented in this study are available on request from the corresponding author.

Acknowledgments

This setup results from the collaborative work of the IGLIS newtork, grouping many research centers and universities such as CEA-Saclay (IRFU), CERN (CRIS), GANIL, IBS-RISP, IJCLab, IMP, JAEA, Johannes Gutenberg-Universität Mainz (Institut für Physik/LARISSA), JINR (GALS), JYFL (IGISOL/MARA), KEK (KISS), KU Leuven, MSU, Nagoya University, Normandie Université (LPC Caen), Peking University, RIKEN (SLOWRI/PALIS), TRIUMF (TRILIS), Université de Strasbourg (IPHC), University of Manchester, University of Tsukuba and Laboratoire de Physique des 2 infinis Irène Joliot-Curie (IJCLab) (for more details about IGLIS collaboration please refer to our network page [37]).

Conflicts of Interest

The authors declare no conflict of interest.

References

  1. Déchery, F.; Savajols, H.; Authier, M.; Drouart, A.; Nolen, J.; Ackermann, D.; Amthor, A.M.; Bastin, B.; Berryhill, A.; Boutin, D.; et al. The Super Separator Spectrometer S3 and the associated detection systems: SIRIUS & LEB-REGLIS3. Nucl. Instruments Methods Phys. Res. Sect. B Beam Interact. Mater. Atoms 2016, 376, 125–130. [Google Scholar] [CrossRef]
  2. Savajols, H.; Drouart, A.; Nolen, J. Physics avenue with the super separator spectrometer (S3) at the SPIRAL2 facility. In Proceedings of the 6th Workshop on Nuclear Fission and Spectroscopy of Neutron-Rich Nuclei, Chamrousse, France, 20–24 March 2017. [Google Scholar]
  3. Ferrer, R.; Bastin, B.; Boilley, D.; Creemers, P.; Delahaye, P.; Liénard, E.; Fléchard, X.; Franchoo, S.; Ghys, L.; Huyse, M.; et al. In gas laser ionization and spectroscopy experiments at the Superconducting Separator Spectrometer (S3): Conceptual studies and preliminary design. Nucl. Instruments Methods Phys. Res. Sect. B Beam Interact. Mater. Atoms 2013, 317, 570–581. [Google Scholar] [CrossRef] [Green Version]
  4. Déchery, F.; Drouart, A.; Savajols, H.; Nolen, J.; Authier, M.; Amthor, A.M.; Boutin, D.; Delferriére, O.; Gall, B.; Hue, A.; et al. Toward the drip lines and the superheavy island of stability with the Super Separator Spectrometer S3. Eur. Phys. J. A 2015, 51, 1–16. [Google Scholar] [CrossRef]
  5. Ferrer, R.; Barzakh, A.; Bastin, B.; Beerwerth, R.; Block, M.; Creemers, P.; Grawe, H.; de Groote, R.; Delahaye, P.; Fléchard, X.; et al. Towards high-resolution laser ionization spectroscopy of the heaviest elements in supersonic gas jet expansion, 1–9. Nat. Commun. 2017, 8. [Google Scholar] [CrossRef] [Green Version]
  6. Kudryavtsev, Y.; Ferrer, R.; Huyse, M.; Van den Bergh, P.; Van Duppen, P. The in-gas jet laser ion source: Resonance ionization spectroscopy of radioactive atoms in supersonic gas jets. Nucl. Instruments Methods Phys. Res. Sect. B Beam Interact. Mater. Atoms 2013, 297, 7–22. [Google Scholar] [CrossRef] [Green Version]
  7. Chapman, K. The transuranic elements and the island of stability. Philosophical Trans. R. Soc. A Math. Phys. Eng. Sci. 2020, 378. [Google Scholar] [CrossRef]
  8. Marsh, B.A.; Andel, B.; Andreyev, A.N.; Antalic, S.; Atanasov, D.; Barzakh, A.E.; Bastin, B.; Borgmann, C.; Capponi, L.; Cocolios, T.E.; et al. New developments of the in-source spectroscopy method at RILIS/ISOLDE. Nucl. Instruments Methods Phys. Res. Sect. B Beam Interact. Mater. Atoms 2013, 317, 550–556. [Google Scholar] [CrossRef]
  9. Prime, E.J.; Lassen, J.; Achtzehn, T.; Albers, D.; Bricault, P.; Cocolios, T.; Dombsky, M.; Labrecque, F.; Lavoie, J.P.; Pearson, M.R.; et al. TRIUMF resonant ionization laser ion source: Ga, Al and Be radioactive ion beam development. Hyperfine Interact. 2006, 171, 127–134. [Google Scholar] [CrossRef]
  10. Neugart, R.; Billowes, J.; Bissell, M.L.; Blaum, K.; Cheal, B.; Flanagan, K.T.; Neyens, G.; Nörtershäuser, W.; Yordanov, D.T. Collinear laser spectroscopy at ISOLDE: New methods and highlights. J. Phys. G Nucl. Part. Phys. 2017, 44, 064002. [Google Scholar] [CrossRef]
  11. Cheal, B.; Forest, D.H. Collinear laser spectroscopy techniques at JYFL. Hyperfine Interact. 2014, 223, 63–71. [Google Scholar] [CrossRef]
  12. Cocolios, T.E.; Al Suradi, H.H.; Billowes, J.; Budinčević, I.; De Groote, R.P.; De Schepper, S.; Fedosseev, V.N.; Flanagan, K.T.; Franchoo, S.; Ruiz, R.F.G.; et al. The Collinear Resonance Ionization Spectroscopy (CRIS) experimental setup at CERN-ISOLDE. Nucl. Instruments Methods Phys. Res. Sect. B Beam Interact. Mater. Atoms 2013, 317, 565–569. [Google Scholar] [CrossRef] [Green Version]
  13. Heinke, R.; Kron, T.; Raeder, S. High-resolution in-source laser spectroscopy in perpendicular geometry: Development and application of the PI-LIST. Hyperfine Interact. 2017, 238, 6. [Google Scholar] [CrossRef]
  14. Chrysalidis, K.; Wilkins, S.G.; Heinke, R.; Koszorus, A.; De Groote, R.; Fedosseev, V.N.; Marsh, B.; Rothe, S.; Garcia Ruiz, R.; Studer, D.; et al. First demonstration of Doppler-free 2-photon in-source laser spectroscopy at the ISOLDE-RILIS. Nucl. Instruments Methods Phys. Res. Sect. B Beam Interact. Mater. Atoms 2020, 463, 476–481. [Google Scholar] [CrossRef]
  15. Lecesne, N.; Alvès-Condé, R.; Coterreau, E.; De Oliveira, F.; Dubois, M.; Flambard, J.L.; Franberg, H.; Gottwald, T.; Jardin, P.; Lassen, J.; et al. GISELE: A resonant ionization laser ion source for the production of radioactive ions at GANIL. Rev. Sci. Instruments 2010, 81, 02A910. [Google Scholar] [CrossRef]
  16. Kudryavtsev, Y.; Creemers, P.; Ferrer, R.; Granados, C.; Gaffney, L.P.; Huyse, M.; Mogilevskiy, E.; Raeder, S.; Sels, S.; Van Den Bergh, P.; et al. A new in-gas-laser ionization and spectroscopy laboratory for off-line studies at KU Leuven. Nucl. Instruments Methods Phys. Res. Sect. B Beam Interact. Mater. Atoms 2016, 376, 345–352. [Google Scholar] [CrossRef]
  17. COMSOL-Software for Multiphysics Simulation. Available online: https://www.comsol.com/ (accessed on 6 January 2022).
  18. Ferrer, R.; Verlinde, M.; Verstraelen, E.; Claessens, A.; Huyse, M.; Kraemer, S.; Kudryavtsev, Y.; Romans, J.; Van den Bergh, P.; Van Duppen, P.; et al. Hypersonic nozzle for laser-spectroscopy studies at 17 K characterized by resonance-ionization-spectroscopy-based flow mapping. Phys. Rev. Res. 2021, 3, 043041. [Google Scholar] [CrossRef]
  19. Sels, S.; Ferrer, R.; Dockx, K.; Buitrago, C.G.; Huyse, M.; Kudryavtsev, Y.; Kraemer, S.; Raeder, S.; Van Den Bergh, P.; Van Duppen, P.; et al. Design and commissioning of an ion guide system for In-Gas Laser Ionization and Spectroscopy experiments. Nucl. Instruments Methods Phys. Res. Sect. B Beam Interact. Mater. Atoms 2020, 463, 148–153. [Google Scholar] [CrossRef]
  20. Brubaker, W.M. An Improved Quadrupole Mass Analyzer. Adv. Mass Spectrosc. 1968, 4, 293–299. [Google Scholar]
  21. Retailleau, B.M. PILGRIM: Un Spectromètre de Masse Par Temps de vol Pour S3, et Brisure de Symétrie D’isopin Dans le 38K. Ph.D. Dissertation, Normandie Université, Paris, France, 2021. [Google Scholar]
  22. Thomas, J.-C.; Blank, B. The DESIR facility at SPIRAL2. Nucl. Struct. Probl. 2012, 224–229. [Google Scholar] [CrossRef]
  23. Chauveau, P.; Delahaye, P.; De France, G.; El Abir, S.; Lory, J.; Merrer, Y.; Rosenbusch, M.; Schweikhard, L.; Wolf, R.N. PILGRIM, a Multi-Reflection Time-of-Flight Mass Spectrometer for Spiral2-S3 at GANIL. Nucl. Instruments Methods Phys. Res. Sect. B Beam Interact. Mater. Atoms 2016, 376, 211–215. [Google Scholar] [CrossRef]
  24. Raeder, S.; Ferrer, R.; Granados, C.; Huyse, M.; Kron, T.; Kudryavtsev, Y.; Lecesne, N.; Piot, J.; Romans, J.; Savajols, H.; et al. Performance of Dye and Ti: Sapphire laser systems for laser ionization and spectroscopy studies at S3. Nucl. Inst. Methods Phys. Res. B 2020, 463, 86–95. [Google Scholar] [CrossRef]
  25. Verlinde, M.; Ferrer, R.; Claessens, A.; Granados, C.A.; Kraemer, S.; Kudryavtsev, Y.; Li, D.; Van Den Bergh, P.; Van Duppen, P.; Verstraelen, E. Single-longitudinal-mode pumped pulsed-dye amplifier for high-resolution laser spectroscopy. Rev. Sci. Instrum. 2020, 91, 103002. [Google Scholar] [CrossRef] [PubMed]
  26. Mattolat, C.; Rothe, S.; Schwellnus, F.; Gottwald, T.; Raeder, S.; Wendt, K. An all-solid-state high repetiton rate titanium: Sapphire laser system for resonance ionization laser ion sources. AIP Conf. Proc. 2009, 1104, 114–119. [Google Scholar] [CrossRef]
  27. Moore, I.D.; Nieminen, A.; Billowes, J.; Campbell, P.; Geppert, C.; Jokinen, A.; Kessler, T.; Marsh, B.; Penttilä, H.; Rinta-Antila, S.; et al. Development of a laser ion source at IGISOL. J. Phys. G Nucl. Part. Phys. 2005, 31, S1499. [Google Scholar] [CrossRef]
  28. Rothe, S.; Fedosseev, V.N.; Kron, T.; Marsh, B.A.; Rossel, R.E.; Wendt, K.D. Narrow linewidth operation of the RILIS titanium: Sapphire laser at ISOLDE/CERN. Nucl. Instruments Methods Phys. Res. Sect. B Beam Interact. Mater. Atoms 2013, 317, 561–564. [Google Scholar] [CrossRef]
  29. Sonnenschein, V.; Moore, I.D.; Raeder, S.; Reponen, M.; Tomita, H.; Wendt, K. Characterization of a pulsed injection-locked Ti: Sapphire laser and its application to high resolution resonance ionization spectroscopy of copper. Laser Phys. 2017, 27, 085701. [Google Scholar] [CrossRef]
  30. Dahl, D.A. SIMION for the personal computer in reflection. Int. J. Mass Spectrom. 2000, 200, 3–25. [Google Scholar] [CrossRef]
  31. Meggers, W.F.; Corliss, C.H.; Scribner, B.F. Tables of Spectral-Line Intensities Part I—Arranged by Elements Part II—Arranged by Wavelengths, 2nd ed.; National Bureau of Standards: Washington, DC, USA, 1975; pp. 65–75.
  32. Studer, D. Resonanzionisationsspektroskopie Hochliegender Zustände in Dysprosium und Erbium zur Entwicklung effizienter Anregungsschemata und Bestimmung des Ersten Ionisationspotentials. Master’s Thesis, Johannes Gutenberg-Universitat Mainz, Mainz, Germany, 2015. [Google Scholar]
  33. Kramida, A.; Ralchenko, Y.; Reader, J.; NIST ASD Team. NIST Atomic Spectra Database (ver. 5.9), [Online]. National Institute of Standards and Technology: Gaithersburg, MD, 2021. Available online: https://physics.nist.gov/asd (accessed on 21 November 2021).
  34. Romans, J. Commissioning of the S3-LEB. Bd Henri Becquerel, B.P. 55027, Caen, France. 2022; Manuscript in preparation. [Google Scholar]
  35. Gins, W.; de Groote, R.P.; Bissell, M.L.; Buitrago, C.G.; Ferrer, R.; Lynch, K.M.; Neyens, G.; Sels, S. Analysis of counting data: Development of the SATLAS Python package. Comput. Phys. Commun. 2018, 222, 286–294. [Google Scholar] [CrossRef]
  36. Frisch, A.; Aikawa, K.; Mark, M.; Ferlaino, F.; Berseneva, E.; Kotochigova, S. Hyperfine structure of laser-cooling transitions in fermionic erbium-167. Phys. Rev. A 2013, 88, 032508. [Google Scholar] [CrossRef] [Green Version]
  37. In-Gas Laser Ionization and Spectroscopy NETwork (IGLIS-NET) Home Page. 2021. Available online: https://research.kek.jp/group/wnsc/iglis-net/ (accessed on 3 November 2021).
Figure 1. 3D cross-sectional view of the S 3 -LEB gas cell.
Atoms 10 00021 g001
Figure 2. Full S 3 -LEB ion guide layout. From left to right: mobile ion source, SRFQ, mRFQ, QMS and RFQ c b . See text for details.
Atoms 10 00021 g002
Figure 3. Typical GISELE laboratory layout. See text for details.
Atoms 10 00021 g003
Figure 4. Experimental and simulated SRFQ and mRFQ transmission efficiency as a function of pressure p. Necessary p conditions for a matched hypersonic jet of Mach number 7–8 are highlighted by the region of interest in light blue.
Atoms 10 00021 g004
Figure 5. Experimental load–line scan of the QMF for a fixed DC to RF amplitude ratio of 0.166, compared with a SIMION simulation performed with the same parameters. The mass axis is calibrated so that the left peak corresponds to 85 Rb.
Atoms 10 00021 g005
Figure 6. (Left) Time-of-flight distribution of rubidium ions behind the RFQ c b in three configurations: without any selection from the QMF (green); with QMF selecting 85 Rb + (blue); with QMF selecting 87 Rb + (red). The blue and red curves are normalized to 85 , 87 Rb relative abundance. (Right) Comparison of the simulated (red) TOF distribution of a 85 Rb + - 87 Rb + mixture with 75 mL/min helium flow rate to the experimentally measured one (black).
Atoms 10 00021 g006
Figure 7. (Left) Er I two-step ionization scheme used for NB RIS measurements [32]. On the left hand side of the diagram, the excited state, the ionization potential (I.P.) energy and the populated auto-ionizing (A.I.) state levels are presented, on the right hand side, electron configuration and total angular momentum J are shown. (Right) TOF spectrum of the Er ions observed with the NB Ti:sa system using the scheme shown in the left panel.
Atoms 10 00021 g007
Figure 8. Measured count rate I as a function of excitation step power P for the RIS scheme presented in Figure 7. The orange curve represents a fit to the measured data.
Atoms 10 00021 g008
Figure 9. (Left) Normalized IS measurements of 166 170 Er I (red/orange curve—SATLAS [35] χ 2 fit of the data; f 0 = 721.9966 THz; excitation and ionization step powers are represented in the text box). (Right) Scattering of individual IS ( Δ f ) measurements around the weighted average IS ( Δ f W A ) from all NB RIS measurements. The used RIS scheme is presented in Figure 7.
Atoms 10 00021 g009
Figure 10. Normalized single HFS measurement of 167 Er I with an inset in the top left corner containing details of the least intense/clearly resolved HFS components a f (red/green curve—SATLAS [35] χ 2 data fit/atomic resonance positions based on input parameters; the weakest peaks according to atomic theory have been magnified for visualization purpose and are presented in the insets, with a multiplication factor added to the HFS component; f 0 = 721.9966 THz; text box presents the used excitation and ionization step powers P e x and P i o n ; the used RIS scheme is presented in Figure 7).
Atoms 10 00021 g010
Publisher’s Note: MDPI stays neutral with regard to jurisdictional claims in published maps and institutional affiliations.

