
Triply Differential Positron and Electron Impact Ionization of Argon: Systematic Features and Scaling


1
Department of Physics, Missouri University of Science and Technology, Rolla, MO 65409, USA
2
Departamento de Física, Experimental Instituto de Física, Universidad Nacional Autónoma de México, Apartado Postal 20-364, Ciudad de México 01000, Mexico
*
Authors to whom correspondence should be addressed.
Atoms 2021, 9(4), 78; https://0-doi-org.brum.beds.ac.uk/10.3390/atoms9040078
Submission received: 25 August 2021
/
Revised: 28 September 2021
/
Accepted: 7 October 2021
/
Published: 11 October 2021
(This article belongs to the Special Issue Interaction of Electrons with Atoms, Molecules and Surfaces)
Abstract
:Triply differential data are presented for the 200 eV positron and electron impact ionization of argon. Six electron emission energies between 2.6 and 19 eV, and for scattering angles of 2, 3, and 4 degrees cover a momentum transfer range of 0.16 to 0.31 a.u. The binary and recoil intensities are fitted using a double peak structure in both regions, which, for the present kinematic conditions, are unresolved. The fitted peak intensities and angular positions are shown to have systematic dependences as a function of the momentum transfer and kinematic emission angle, respectively, and illustrate projectile charge effects. A comparison with available theories is made where it is seen that the most notable differences include the fact that for the binary lobe, the observed intensity for emission angles around 100° is absent in the theories, and the theoretical predications overestimate the importance of recoil interactions.
1. Introduction
Inelastic atomic collisions have been studied since the advent of atomic physics. One topic of interest concerns how the projectile charge and mass influence the interaction probabilities as well as the energy and momentum transfer. Since fully differential data provide the maximum possible information for testing our theoretical understanding of these processes, many triply differential studies have been performed using electron and proton impact. However, a comparison of electron and proton impact data involves both charge and mass effects. To isolate these from each other, antiparticle and particle impact data, e.g., positron–electron and antiproton–proton data, can be used to study charge effects and both positron–proton and antiproton–electron can be compared to reveal mass effects. Unfortunately, few studies of this type exist, particularly on the differential level.
In 2010 we reported triply differential data for the 200 eV positron and electron impact ionization of argon [1]. Since the same apparatus and techniques were used for both projectiles, a direct comparison of the data was possible. This comparison confirmed predictions of an enhanced/reduced probability for binary/recoil interactions for the positron impact with respect to those for the electron impact. They also confirmed predictions that due to post-collision interactions, the binary lobe for the positron impact was more forward-directed than the lobe for the electron impact. However, because of the low positron beam current available, specifically ~ 0.1 fA, a large diameter beam of ~6 mm was required and the data were binned considering a range of emission angles and energies contributed to each data point. Therefore, to compare with theoretical CDW calculations [1], a computer model was used to convolute the theory over the experimental range of emission angles and energies, as well as over the beam-target gas overlap volume. The model also accounted for altered emitted electron trajectories due to the weak electric field applied to extract target ions, which were used to isolate and identify single ionization events.
Although qualitative agreement between experiment and theory was found, no further comparison was made because research efforts either underway or planned in Germany and Australia using much larger beam intensities and, hence, much improved data was anticipated. However, only limited results [2] from those efforts have been reported. Since our original publication, subsequent studies have allowed us to acquire an understanding of how to extract emission energy and angle information for our measured data. Here, we present an improved analysis of the original data files and the results for six emission energies between 2.6 and 19 eV, and three scattering angles, namely for 2, 3 and 4 degrees. Considering the small beam currents used, these data have limited statistics. Therefore, based on existing electron impact TDCS studies, which show a double peak structure contributing to both the binary and recoil lobes, each angular distribution is fit with an empirical model consisting of two peaks contributing to each lobe. Since the entire dataset for each projectile is internally consistent and both the positron and electron data have been normalized to each other, the fit parameters are used to investigate scaling properties for binary and recoil interactions for both positron and electron impact. The scaling properties are then used to generate “most likely” TDCS data for 4.4 eV electron emission and a 3° scattering angle.
2. Materials and Methods
The experimental setup has been described in References [3,4,5], thus only essential details are presented here. The collision energy was 200 eV. The scattered projectiles and the ejected electrons were both detected by channel plates equipped with 2D position sensitive anodes. Thus, projectiles scattered within an angular range of −5 to +5 degrees in θ and less than 2.4 degrees in φ were detected after being energy-analyzed. This allowed all energy losses between 0 and ~60 eV for scattering within this angular range to be simultaneously measured. Note that in our notation, negative angles imply scattering into the same hemisphere as the ejected electron detector, i.e., a signature of recoil interactions and positive angles imply scattering away from the electron detector, which implies binary interactions. The ejected electron detector was sensitive to geometric emission angles between 30° and 150° along the beam direction and between ±60° perpendicular to the beam direction. As a weak electric field (~1.25 V/cm) and time-of-flight was used to extract and identify singly charged target ions, depending on the electron emission energy, some electrons emitted towards the detector in angles smaller and larger than these geometric angles were detected. Additionally, some electrons with energies less than 1.5 eV that were emitted away from the detector were turned around by the electric field and detected. This results in some “contamination” of the binary/recoil lobes by recoil/binary events. The reader was directed to [3,5], which contain figures illustrating these features and geometry.
List mode data for coincidence detection of the ejected electrons, scattered projectiles and recoil ions within these energy, and angle ranges were collected and sorted to provide triply differential information for both the ejected electrons and the scattered projectiles. To improve statistics, the sorting procedure binned the scattered projectile data for a range of detector pixels in both the energy loss and the scattering angle directions. The ejected electron data were also binned for a range of pixels along the beam direction. This resulted in a range of emission angles and energies that contributed to each bin. As described below, SIMION modeling of the apparatus and electric fields was used to “calibrate” the emission angles and energies contributing to each sorting bin, as well as to determine any contribution of low energy electrons leading to “contamination” of the binary and recoil lobes. The overall binning produces data within a scattering angle range of ±1° and energy loss ranges listed in Table 1.
As stated, initially, to compare experiment and theory, a computer model was used to convolute the theoretical cross-sections over the contributing energies and angles, and to account for trajectory effects. Later, a method for converting the physical axes of the 2D detector images to energy losses and scattering angles for the projectile detector, and to emission angles for the electron detector was developed [3,4,5]. This method yielded good agreement with the 250 eV electron-N2 triply differential measurements of Avaldi et al. [6] for 10 eV electron emissions. However, applying the same procedure to the present argon data and comparing with theoretical results [7] obtained using methods described in [8] again showed good agreement for our ~15–20 eV data, but with decreasing agreement at lower energies, e.g., agreement at ~2 eV was poor.
To investigate whether these discrepancies indicate problems with theory or with the data analysis, our method of converting the measured 2D detector information to ejected electron energies and angles was assessed in more detail. Regarding the energy conversion, as shown in [3,5], the physical beam profile combined with the source energy profile, i.e., a Gaussian or cosine beam intensity profile combined with an exponential source intensity profile, leads to a range of emission energies contributing to each scattered projectile energy loss pixel. The analysis applied in [3,4,5] used the combined profile to calculate an average energy for which ionization was possible for each pixel within the sorting bins and this information was used to determine both an overall average energy and energy spread for each energy loss bin used. This resulted in a Gaussian energy distribution [5] with a truncated lower energy tail for smaller energy loss data.
However, because of the range of energies contributing to each bin, our present analysis also takes into account that the ionization probability decreases with energy loss. By including this “weighting factor” with the energy profile information and SIMION studies for an extensive grid of emission energies and angles, the number of ejected electrons for each emission energy, which contribute to each TDCS sorting bin, was determined and used to calculate energy profiles as well as for each entire sorting bin, rather than for each pixel within the bin. This improved method produces a skewed energy profile consisting of two Gaussian components where, because of the decreasing ionization probability, the higher energy component was smaller. From these profiles, the mean energy and 2σ range contained were determined. Table 1 shows the values obtained using our previous method [3,4,5], shown with the two columns in blue, and the values based on our present analysis, shown with the columns in black. Additionally, the parameters for the two Gaussian components for the energy profiles in our present analysis are shown. As seen, except for sorting bin Loss1, the mean bin energies obtained using the present method, compared to the values obtained using our previous method, are smaller (because of the inclusion of the energy loss probability), with the deviation increasing with increasing energy loss.
These new energy distributions were then combined with SIMION trajectory information for the ejected electrons to calibrate the electron emission angular scale. Here, trajectories were calculated for a grid of emission energies between 0 and 30 eV, and for emissions starting from the center of the beam-target overlap, plus 1 mm offsets perpendicular, upstream, and downstream from the center. The centered and off-center results were weighted by the transmitted beam intensity profile and by the energy distribution profiles. Finally, these fully weighted results were combined and averaged for each range of detector pixels used for sorting the electron emission data in order to obtain information about both the average emission angle and the relative detection efficiency for each energy loss bin.
As will be shown in Figure 1, Figure 2, Figure 3 and Figure 4, compared to the detection efficiencies and emission angle calibrations determined using our previous method, the present analysis yields larger TDCS for smaller (larger) emission angles, i.e., in the forward (backward) directions, which shift the binary peak to smaller angles, exactly what was needed to reduce the discrepancies we found in our first comparison with the present theoretical predictions. Additionally, as seen in Table 1, it also resulted in smaller ejected electron energies, particularly for the larger energies studied. Finally, our new SIMION modeling provided information about the contribution to the detected signal produced by low energy electrons originally emitted in angles away from the electron detector, but which were turned around by the electric field used to extract target ions. This was used to estimate and subtract such contributions, with a couple of examples being shown in the following section.
3. Results and Discussion
3.1. Triply Differential Cross Sections
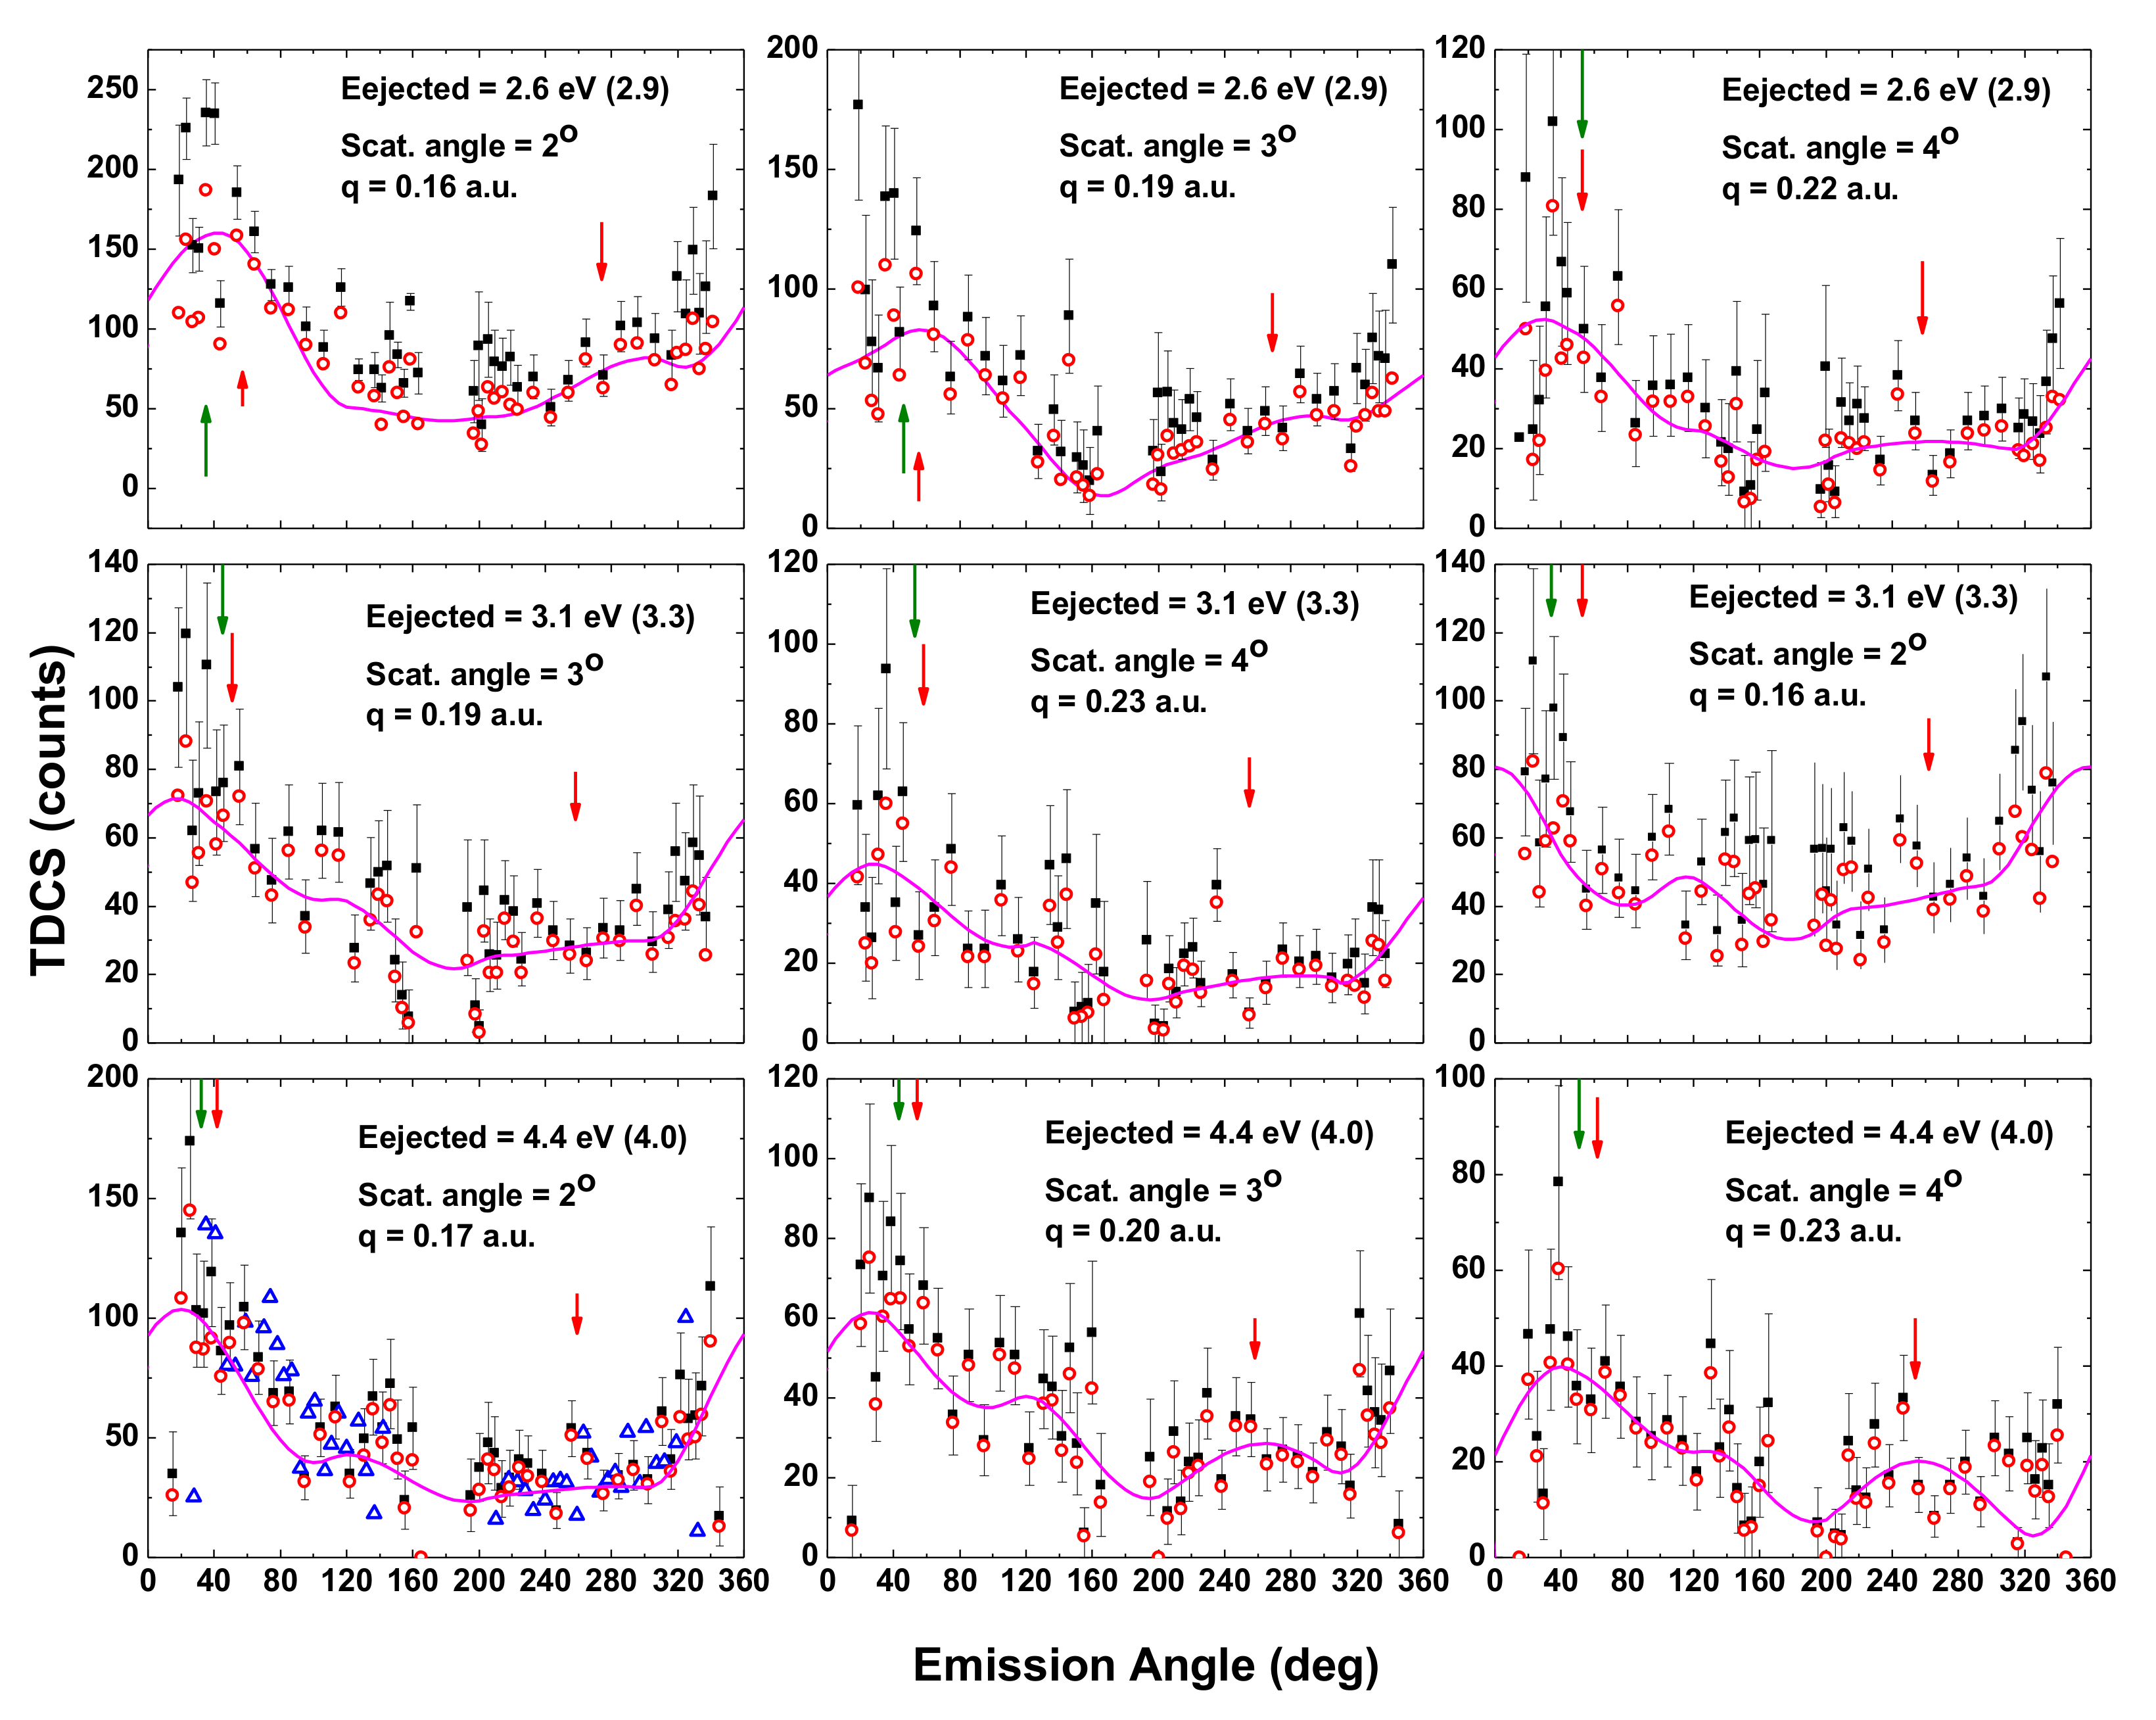
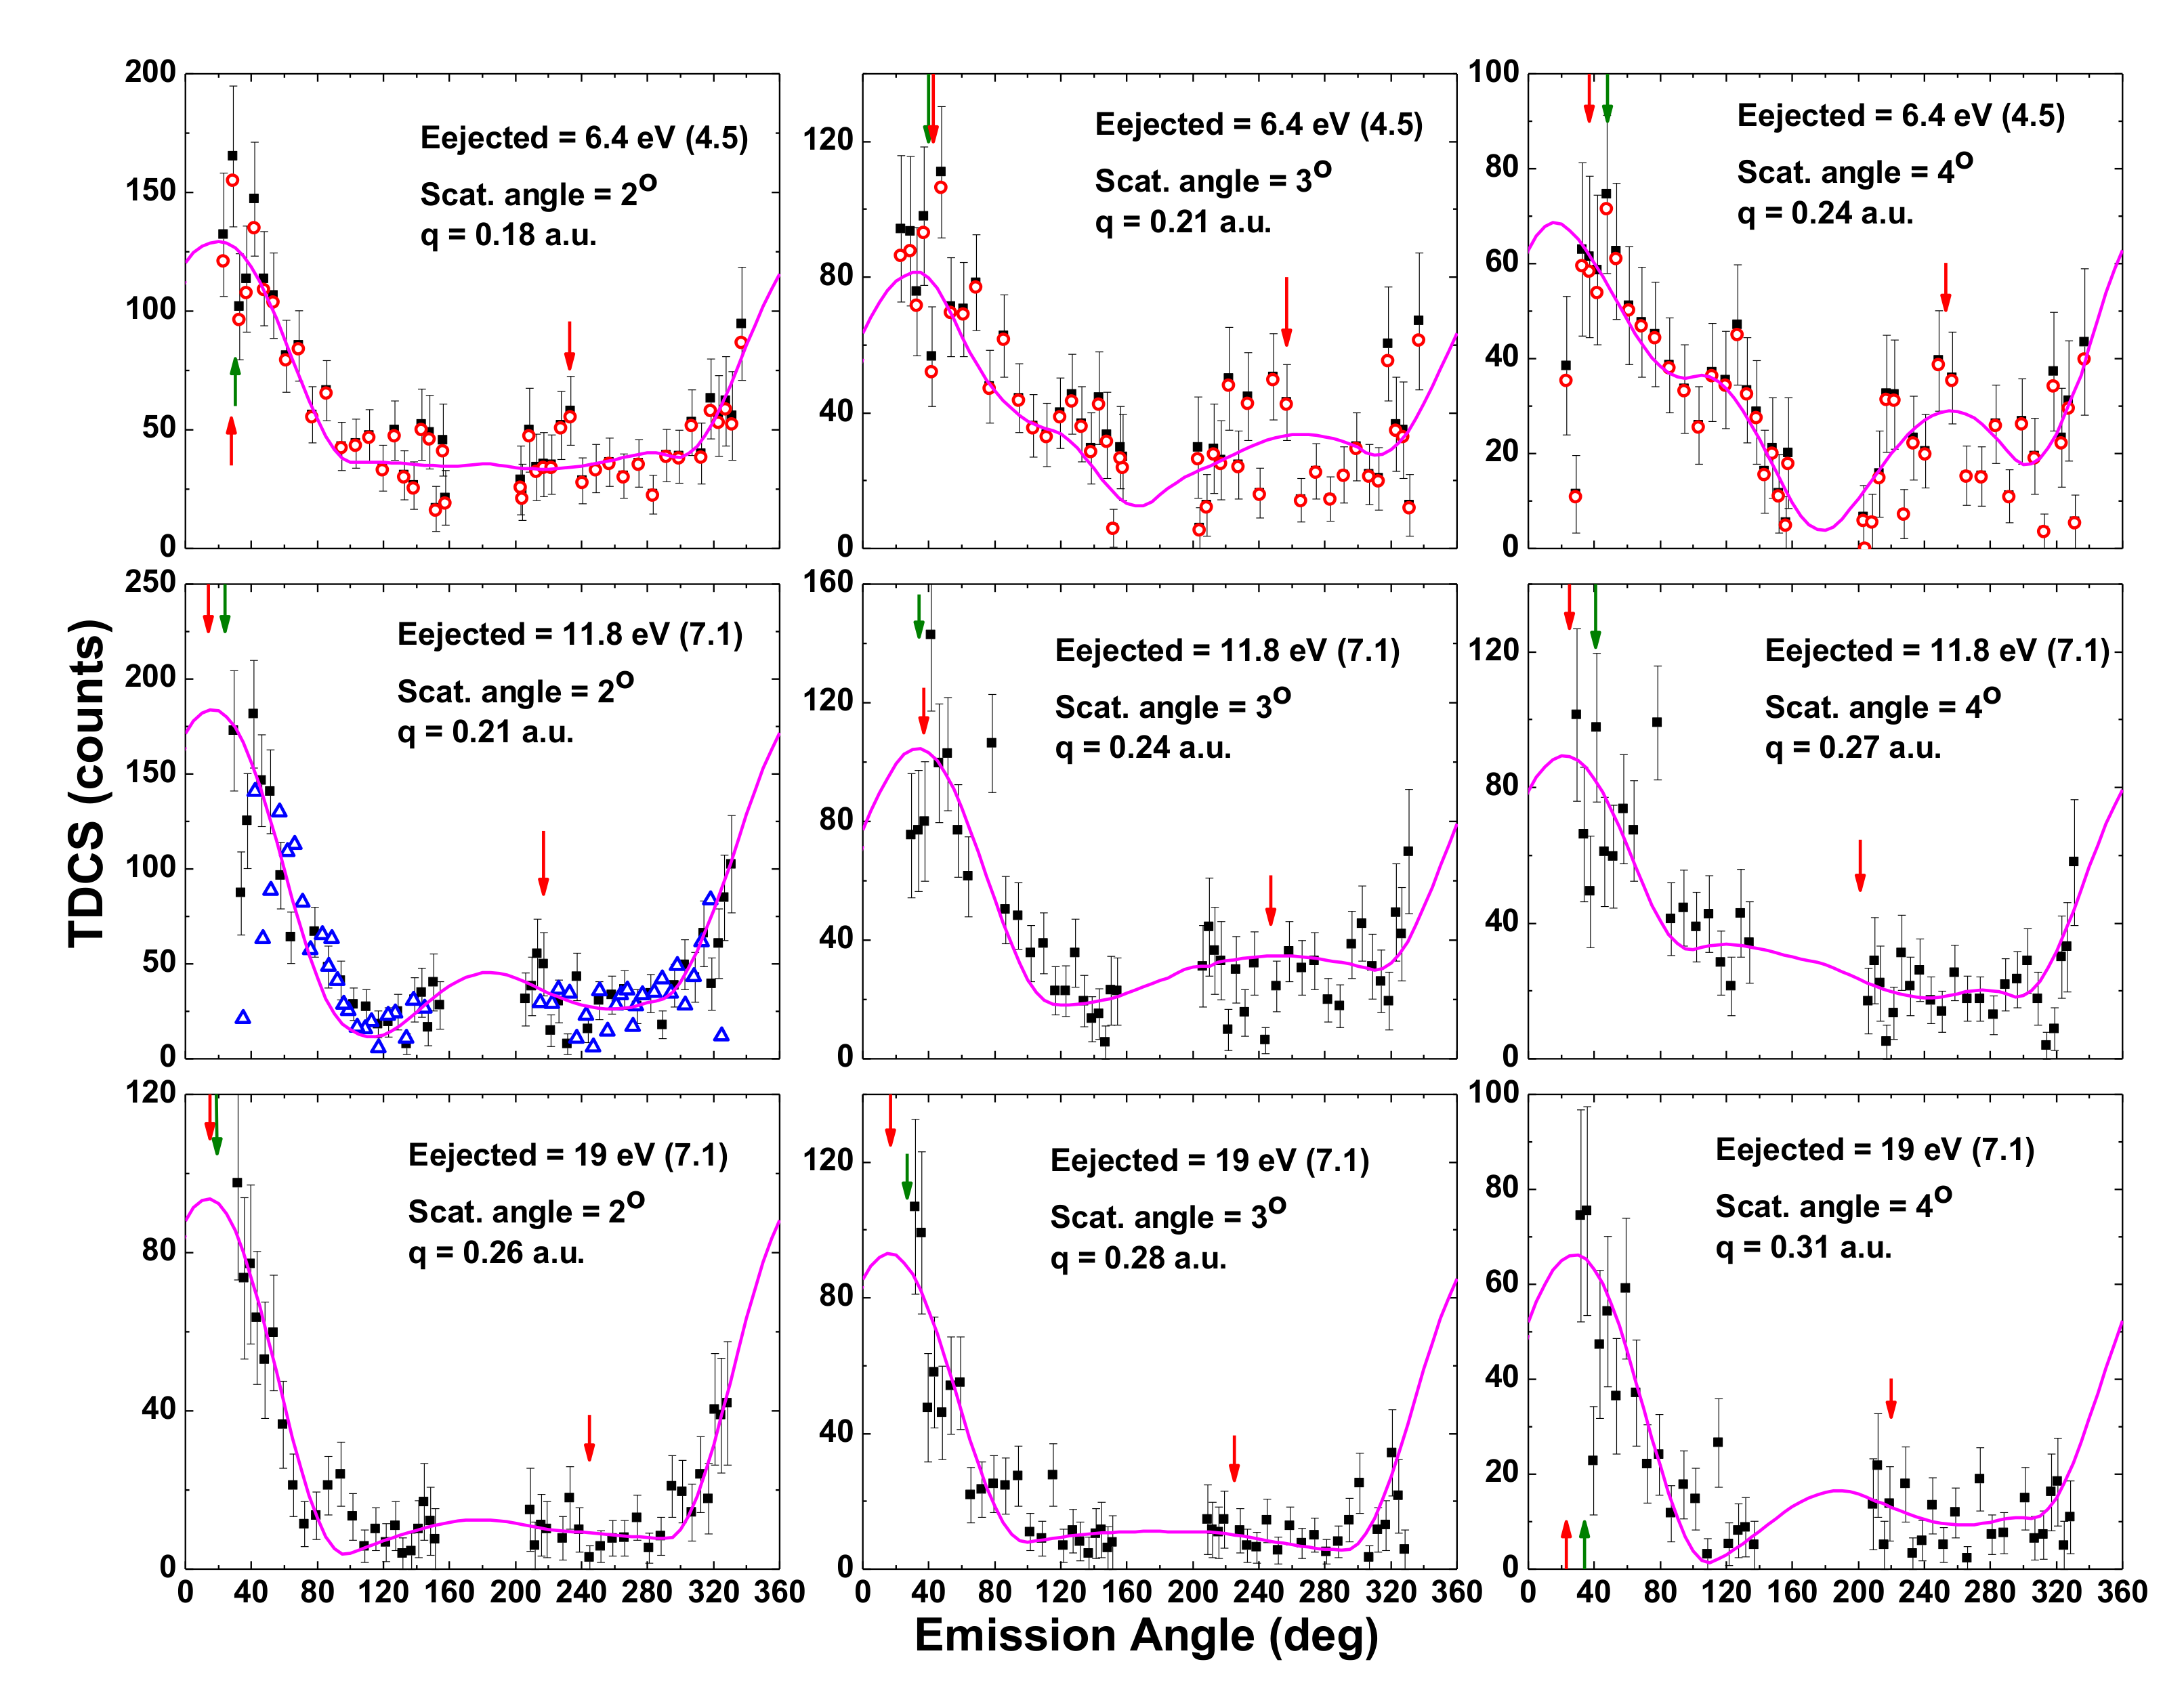
Figure 1, Figure 2, Figure 3 and Figure 4 show TDCS for the six emission energies listed in Table 1 and the scattering angles of 2, 3, and 4 ± 1 degrees, thus giving 18 kinematic values of momentum transfer, or q, between 0.16 and 0.31 a.u. The reader should note that the electron and positron data are each internally consistent since all data for each projectile were collected simultaneously and both the positron and electron data have been normalized to each other. The normalization was done using the total number of scattered projectile-Ar+ recoil ion coincidences measured for scattering angles less than 5°, the emission energies between 0 and ~50 eV, and total single ionization cross-section information [9]. Thus, all TDCS were on a single relative scale. Comparison to theory then requires only a single overall normalization once the different energy bin widths for each emission energy are accounted for.
In the figures, the numbers in parenthesis are the emission energy ranges listed in Table 1. The black solid squares show the measured TDCS signal with their statistical uncertainties. The red open circles show adjusted TDCS values after subtracting any contributions due to electrons which were ejected in directions away from the detector but whose trajectories were altered by the electric field such that they were detected. Fits to the data, as described in following section, are shown by the solid magenta lines. From these fits, the mean angles for the binary and recoil intensities were determined and are shown by the red arrows. For comparison, the kinematic angles for binary interactions are shown by the green arrows. Lastly, to illustrate how the present analysis based on a complete emission energy/pixel picture (the solid squares and open circles) differs from our previous analysis based on an average emission energy/emission energy bin picture (the open blue triangles), a few examples are provided. As seen, our re-analysis increases the TDCS signal at the extreme angles in the forward and backward directions, and shifts the binary peak to slightly smaller angles.
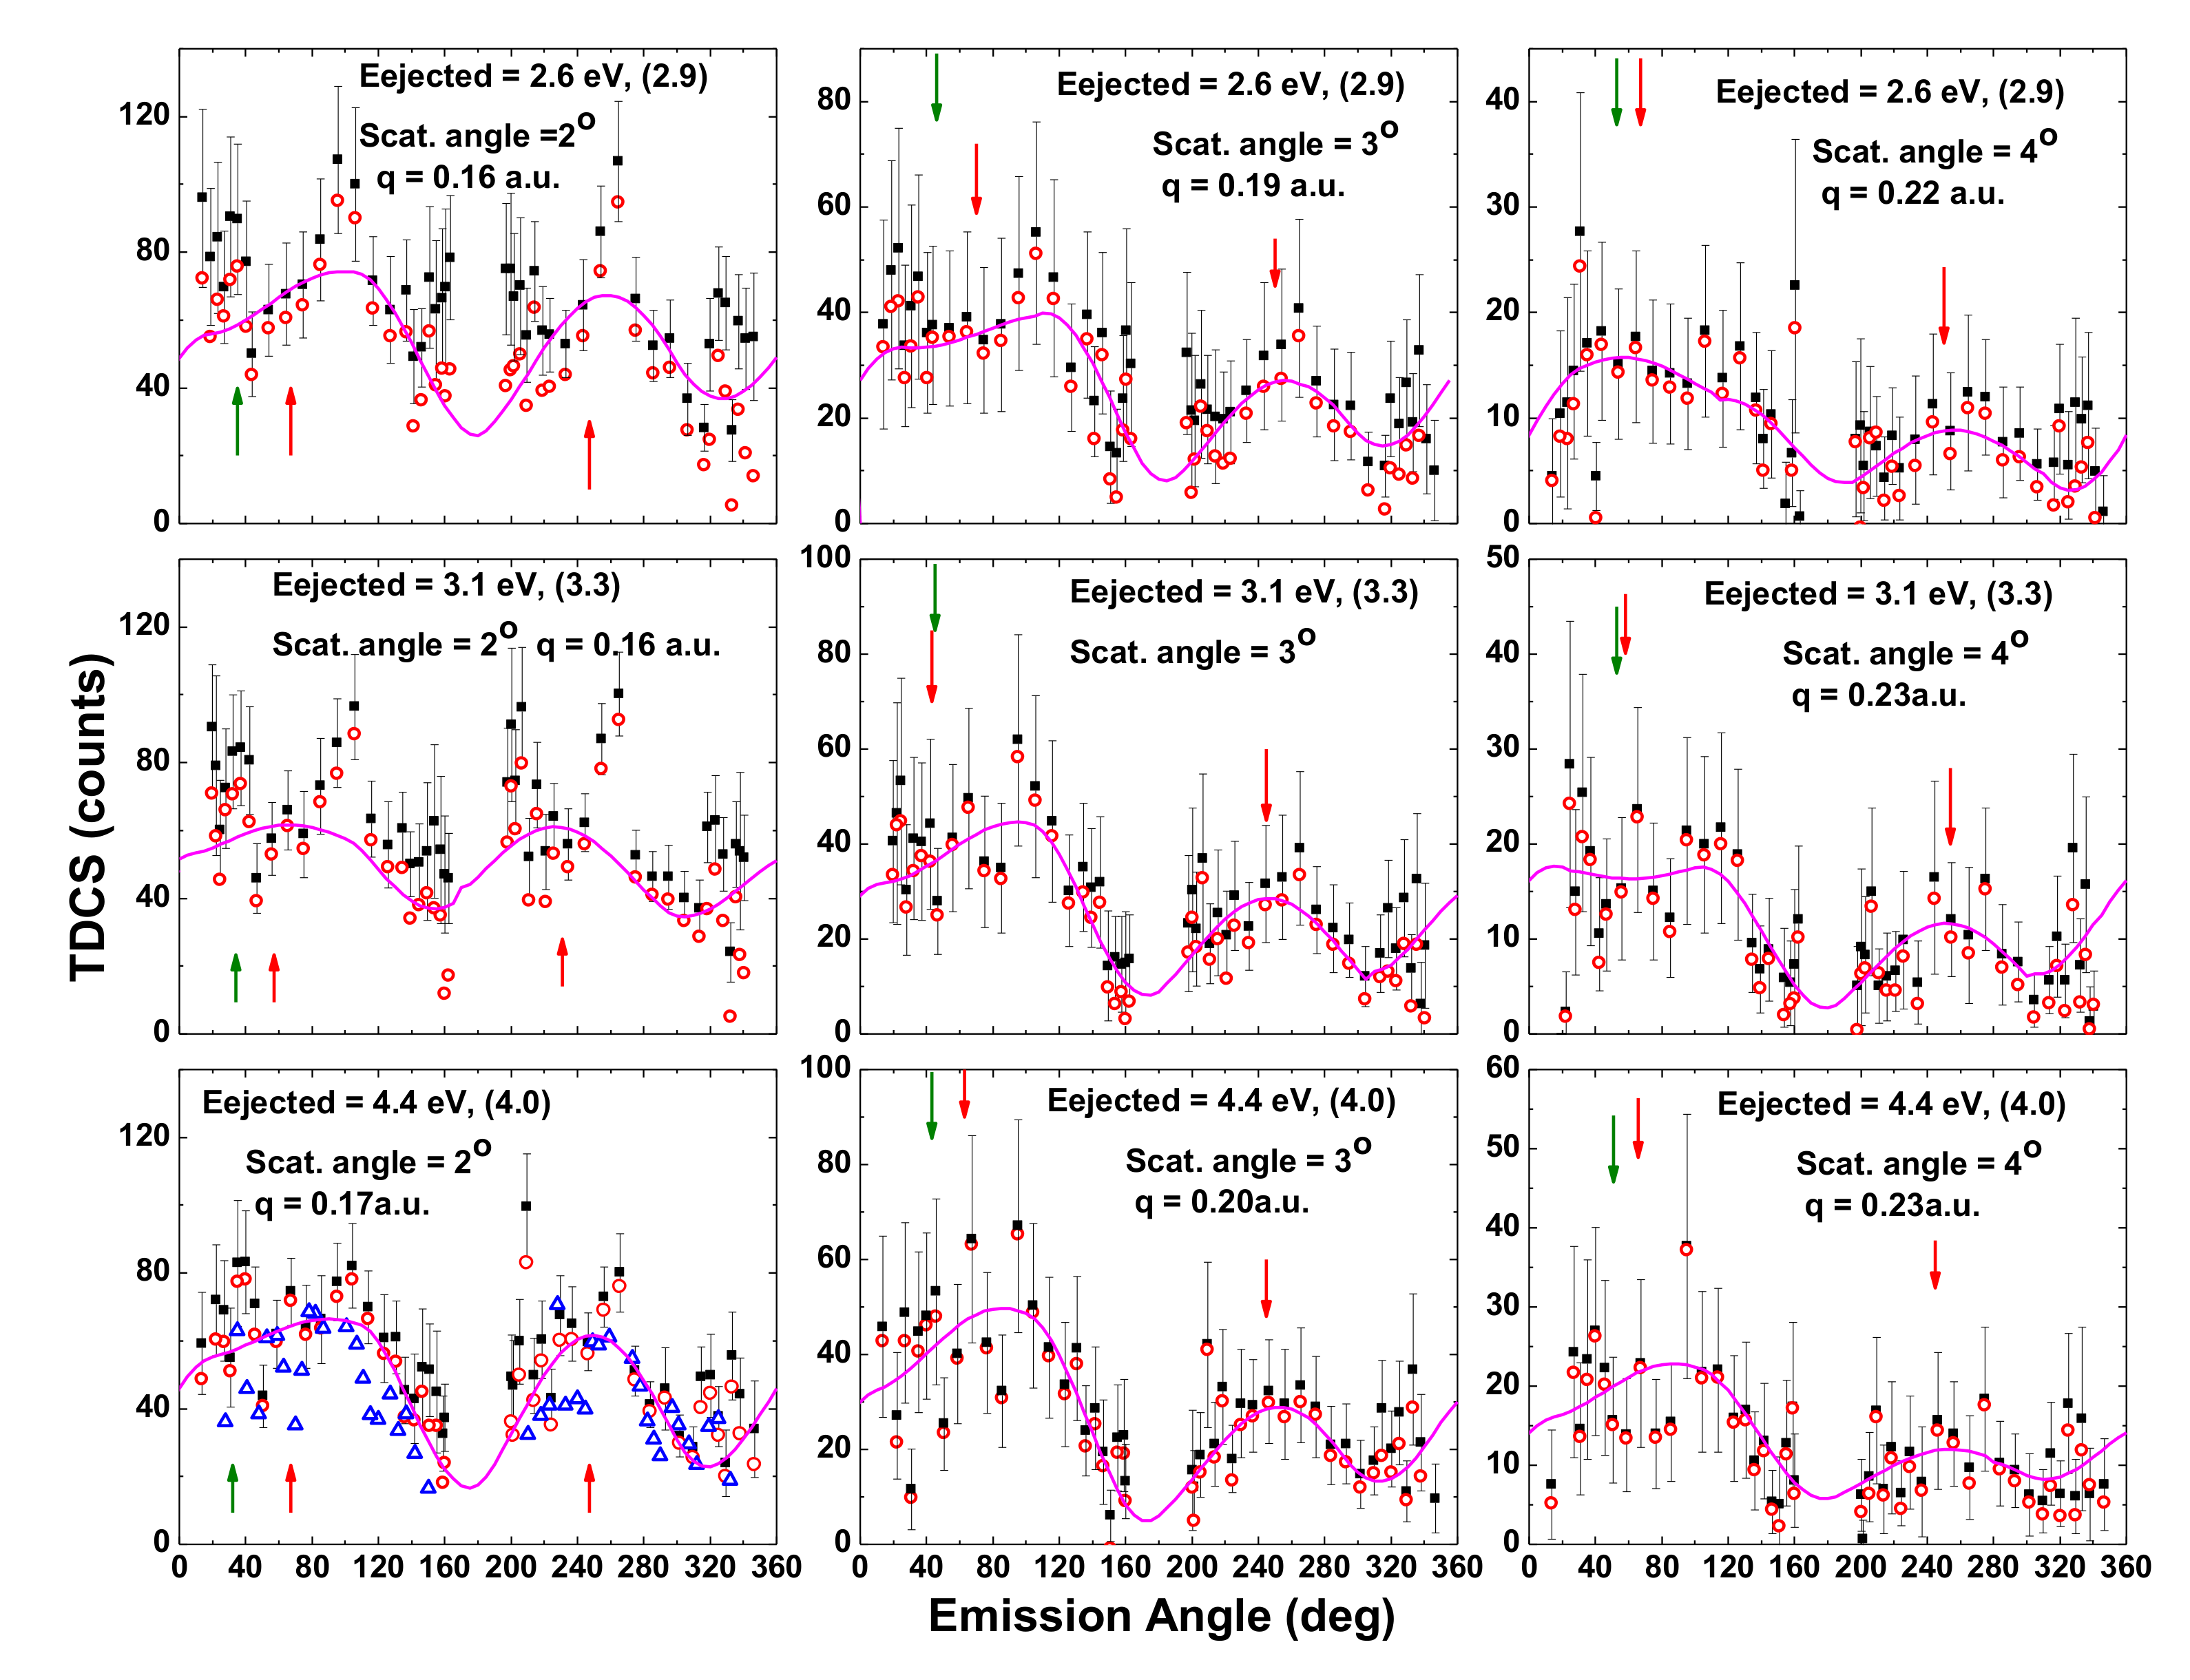
Although the data collection time was approximately 2000 h, the statistical uncertainties were significant. This results in data scatter. In spite of this, the data demonstrate the following general features. On an absolute scale, binary interactions were more probable for the positron impact, whereas recoil interactions tend to be more probable for the electron impact. On a relative scale and in particular for the higher emission energies, the relative importance of recoil interactions was considerably larger for electron impact compared to positron impact. For positron impact, the binary lobe was located at approximately the kinematic angle, whereas for electron impact, it was shifted to larger angles.
3.2. Data Fits
Considering very weak beams were used, our TDCS have large statistical uncertainties and there is data scatter. To aid in comparing with theory and in interpreting the data, the data were fitted with an empirical model using a double peak structure that was first noted by Ehrhardt et al. [10] in TDCS data for argon and was later observed in other electron impact studies [11,12,13,14], as well as in a higher energy study we reported [5]. The two peak structures were attributed to the p outer-shell structure of argon. We applied the model, which consisted of two binary and two recoil components, by fitting experimental data [11,12,13] and theoretical DWBA and CDW predictions [1,8,14,15,16], where a double peak structure was resolved or nearly resolved, and also by fitting to kinematic conditions, where only a single broad lobe was observed. Fits to the theoretical calculations, where the components were resolved, showed that the FWHM for the two binary components systematically decreased as a function of momentum transfer, e.g., for q = 0.2 a.u., the FWHM was ~90°; for q = 0.75 a.u., it was ~50°. Although broader, the FWHM for the two recoil components decreased in a similar fashion; in this case, ranging from approximately 98 to 60 degrees.
Therefore, the present data were fit with two binary and two recoil components given by Aicos[wi(θ − θi)]2, where Ai is the peak magnitude, wi is the peak width consistent with the FWHM values given above, θi is the peak location, and θ is the emission angle. Due to the data scatter, the number of fitting parameters was reduced by using fixed binary and recoil widths of 84° and 94°, and the best visual fit compatible with the data was used. Fitting the data in this manner provides a cleaner picture of the experimental results as well as a condensed method of presenting and comparing data for a range of kinematic conditions. Another advantage is that the fits provide TDCS information outside the experimentally accessible angular range.
3.3. Triply Differential Cross-Section Scaling
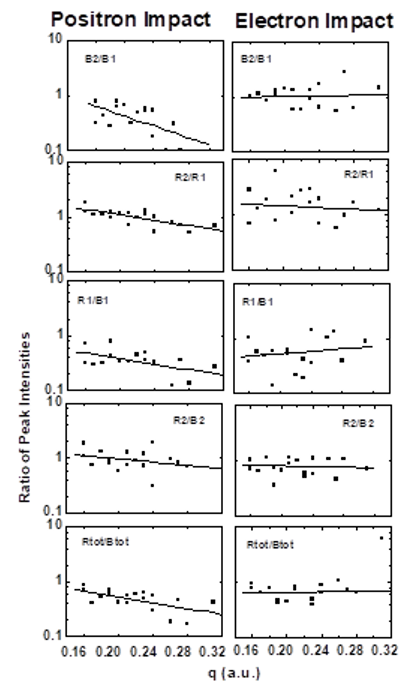
The fitting parameters were then used to investigate any possible TDCS scaling. Two properties, namely the peak intensities and the peak positions, were studied. In principle, for the intensity investigation, relative cross-sections can be used. However, since measured and calculated TDCS studies typically present results using arbitrary intensity scales for each kinematic condition, we also investigated various ratios of the peak areas. The quantities investigated were: (a) the relative importance of the two components contributing to the binary and recoil lobes, e.g., B2/B1 and R2/R1; (b) the overall recoil/binary probabilities, namely Rtot/Btot; and (c) the relative importance of the smaller and larger angle binary and recoil components, e.g., R1/B1 and R2/B2. Here, the letter, e.g., B or R, refers to binary or recoil, while the number refers to the smaller angle or larger angle peak.
The results are shown in Figure 5. As seen, for binary interactions, the B2/B1 ratios show that the two components have nearly the same intensity for electron impact throughout the entire momentum transfer region studied, whereas for positron impact, the B2 intensity was roughly a factor of two smaller and decreased in relative importance with the increasing momentum transfer. The roughly equal intensities for electron impact results in the binary lobe being broader than for positron impact. For recoil interactions, the behaviors were similar, with the main difference being an increased importance of the R2 peak for both positron and electron impact. Overall, the Rtot/Btot ratios, i.e., (R1 + R2)/(B1 + B2) dependence with momentum transfer, were similar to that seen for R1/B1, which results in recoil interactions having a greater relative importance, particularly for higher momentum transfer collisions, as is the case for positron impact.
As will be shown in Figure 6, peaks B1 and R1, and peaks B2 and R2 were separated by approximately 180°. This implies that the lower angle recoil and binary peaks are associated with each other, the same being true for the higher angle peaks. Therefore, the relative importance between these binary and recoil components was assessed. As seen, the R1/B1 and R2/B2 ratios again decreased with the increasing momentum transfer for the positron impact but appear to be relatively constant for the electron impact.
Thus, these data illustrate how post collision interactions lead to greater probabilities for recoil events for the electron impact. The R1/B1 and R2/B2 data also imply that the post-collision interactions are more important for the higher angle contribution.
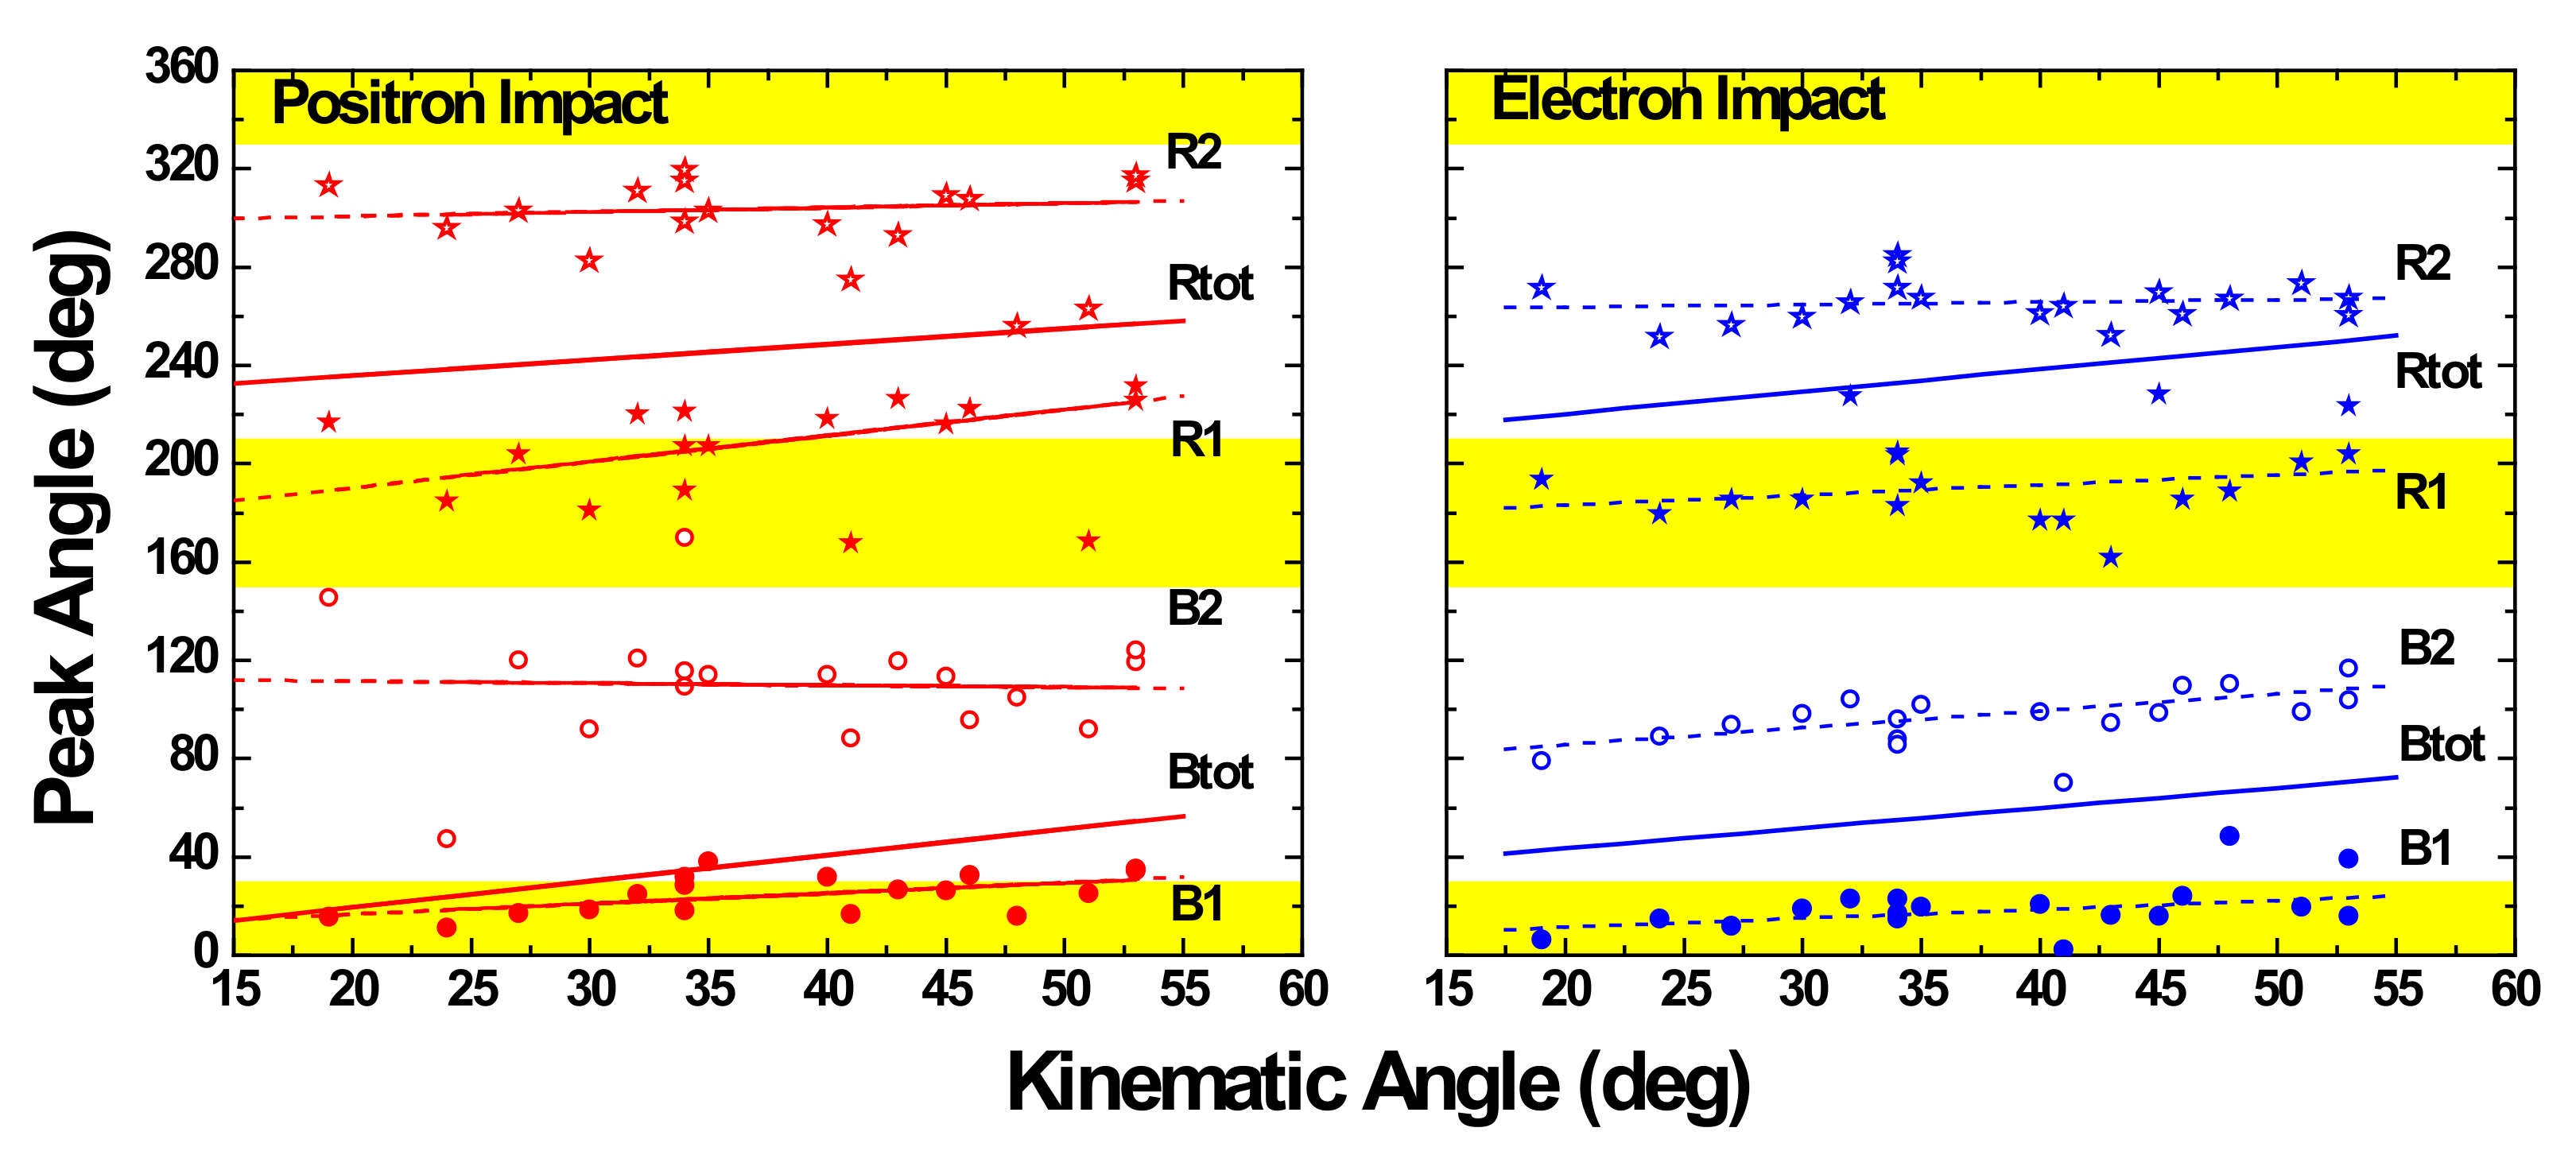
The other scaling aspect that was investigated was the angular positions of the various component peaks. Here, the kinematic angle, i.e., the direction rather than the magnitude, of momentum transfer was found to produce a better scaling. The angular behavior of the component peaks as well as the entire binary and recoil lobes are shown in Figure 6. The lines are fits to the data. In all cases, the peaks moved to larger angles as the kinematic angle increased. This was also the case for the directions of the overall binary and recoil lobes, shown by the solid lines without the associated data points. The reader is reminded that our fitting yields positions of some of the peaks in regions we could not access experimentally. These regions are indicated by the yellow bands.
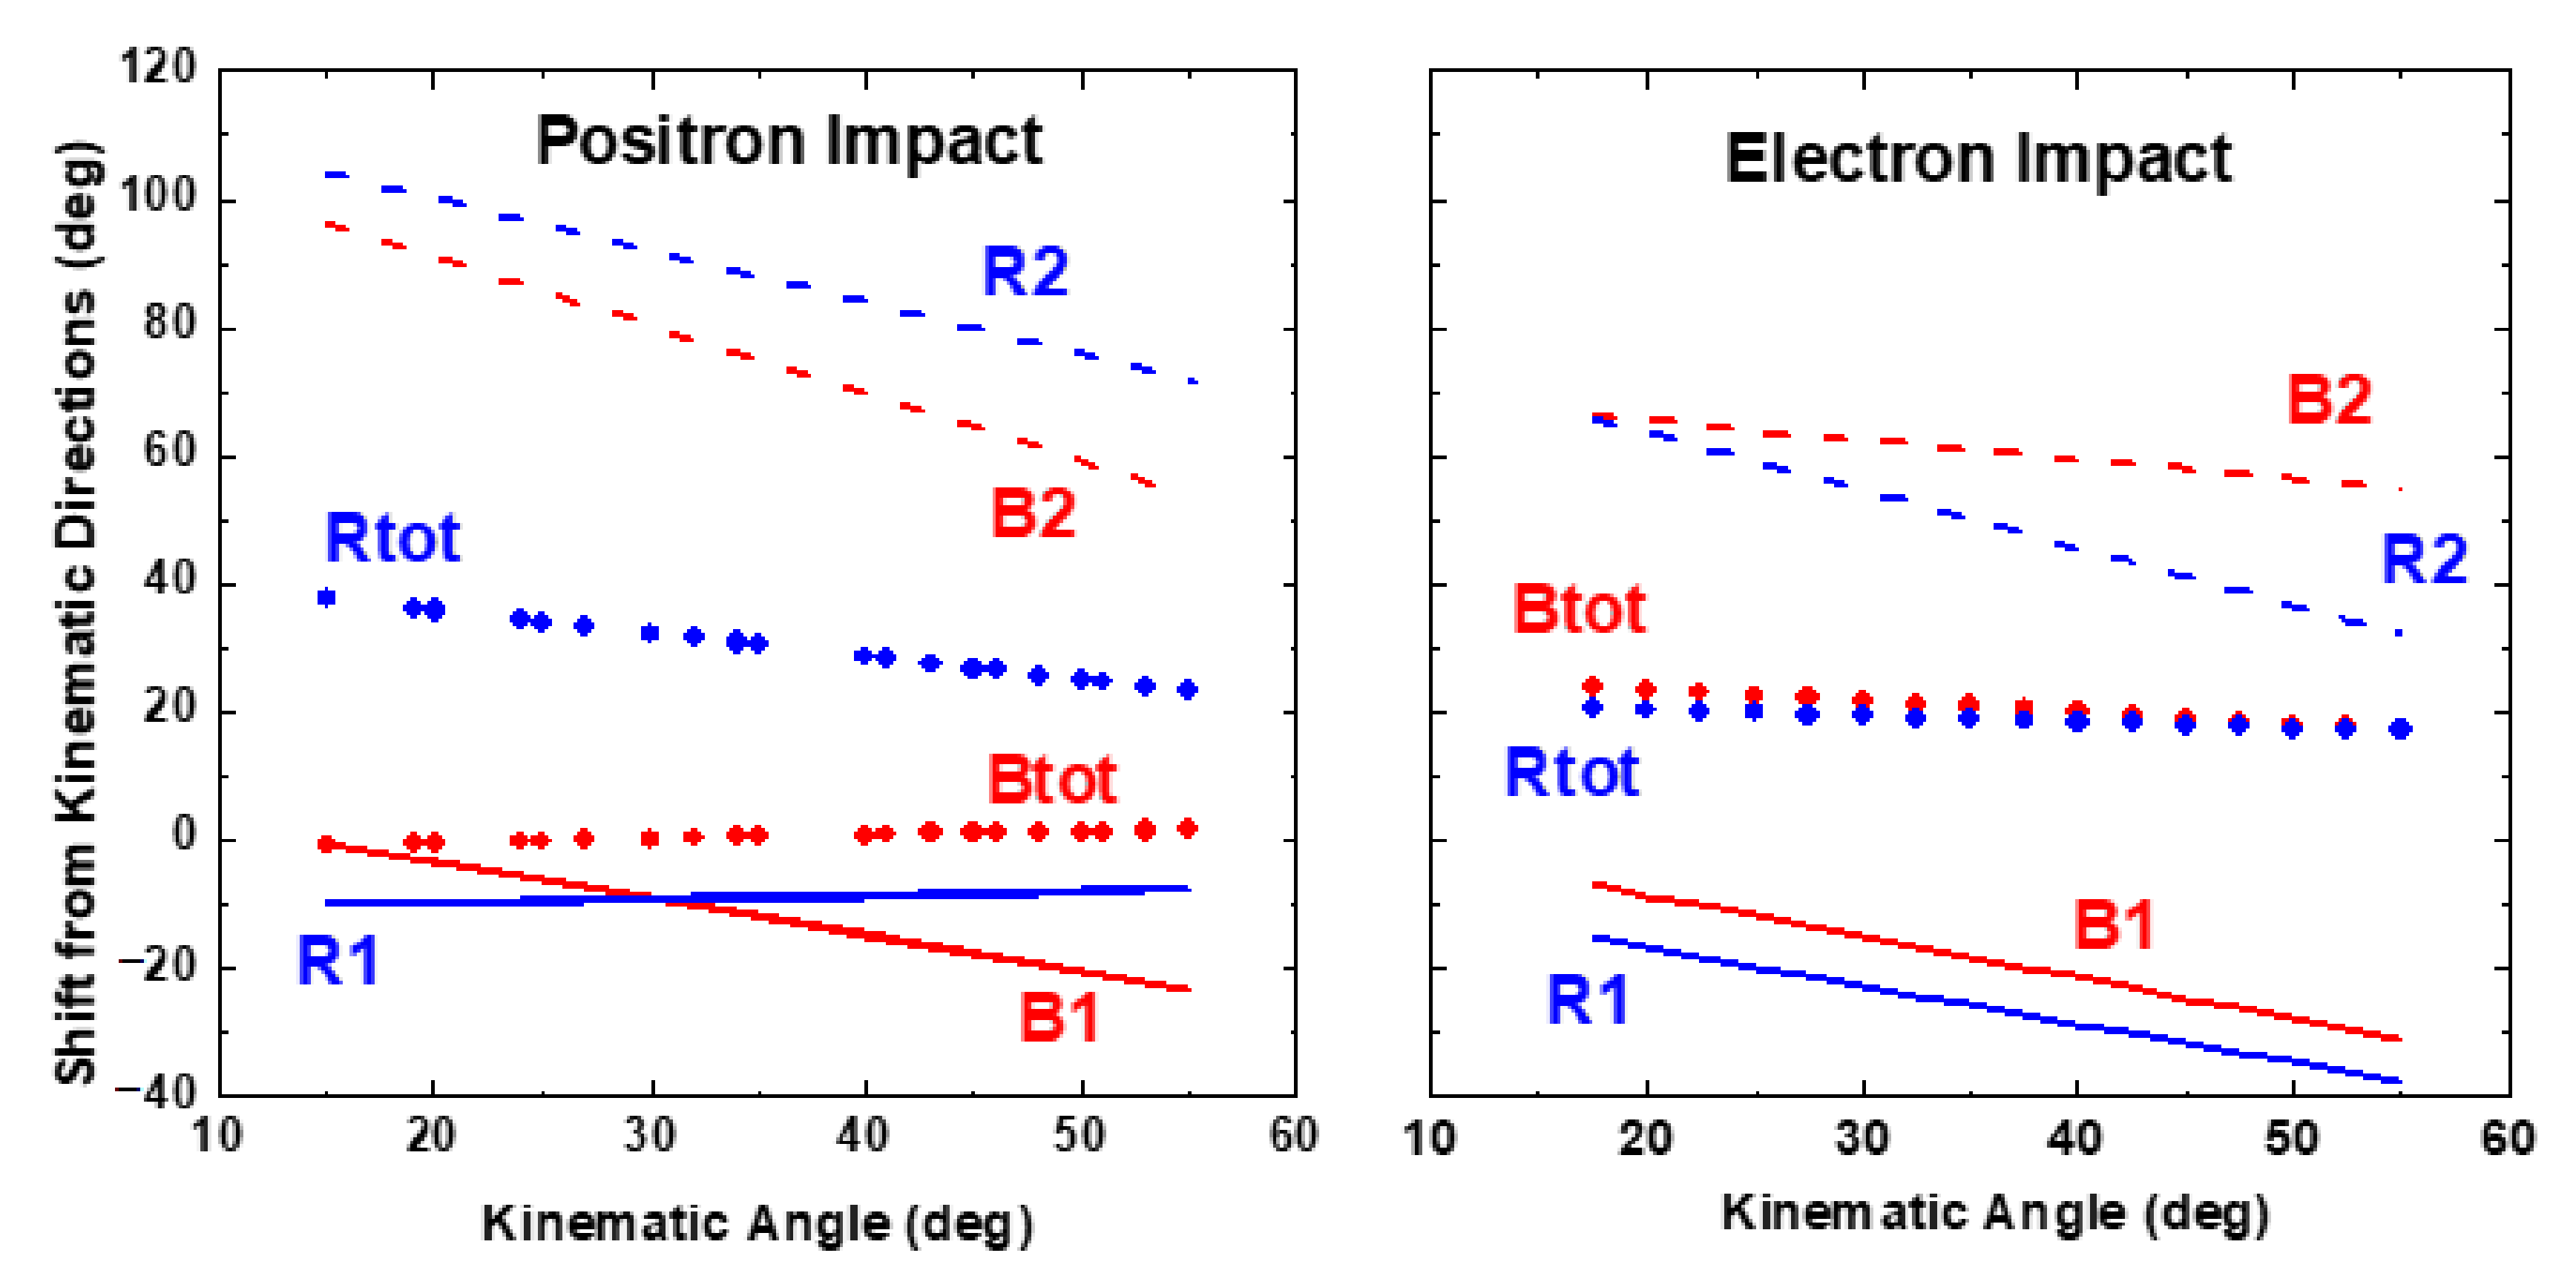
The relationship between the peak positions and the kinematic angle was used in Figure 7 to provide more insight. Here, the kinematic angle, or the kinematic angle plus 180°, has been subtracted from the various fitted curves in Figure 6. This illustrates deviations from the kinematically predicted directions. For binary interactions, the B1 and B2 components showed an ever-increasing shift in the forward direction as the kinematic angle increased. This moves the B1 peak away from the kinematic angle and the B2 peak toward it. Except for the positron R1 peak, the same was seen for recoil interactions. The exception may be associated with problems in fitting the positron data as indicated by the considerable scatter. Fitting the R1 peak accurately is difficult as much of the peak lies within our experimentally inaccessible region. As for the mean directions of the binary and recoil lobes, for positron impact, the mean direction was in alignment with the kinematic direction for small kinematic angles and slightly shifted towards larger angles as the kinematic angle increased. In contrast, the recoil peak was at a more backward direction for small kinematic angles but gradually approached the kinematically predicted direction as the kinematic angle increased. For electron impact, the situation was quite different. Here, the direction for both the binary and recoil lobes was approximately 35–40 degrees larger than the kinematically predicted directions for the entire range of parameters investigated here.
We again stress that these observations are subject to the accuracy of our fittings, which extrapolate into regions outside our detection capabilities. In addition, they are dependent on our SIMION modeling in the extreme forward and backward angles.
3.4. Comparison with Theory
As stated earlier, a detailed analysis of these data was undertaken because of inconsistencies with recent theoretical predictions [7] for different emission energies. As mentioned above, each emission energy bin had a range of emission energies’ contributions. Therefore, for a proper comparison with theory, a convolution of theoretical predictions for a range of energies is required. However, as the necessary theoretical information is not available, a comparison using existing theoretical predictions for a single emission energy is shown in Figure 8. The theories are for 5.4 eV emission, corresponding to the emission energy obtained using our previous analysis method, and for a 3° scattering angle. Therefore, for the comparison in Figure 8, we show the 4.4 and 6.4 eV TDCS obtained using the present method.
For positron impact, theoretical curves obtained using distorted wave Born approximation (DWBA) models [7,14,15] and using a continuum distorted wave (CDW) model [1] are shown. For electron impact, only the CDW model prediction is shown. We note that these theories include polarization and post-collision effects. All curves have been normalized to unity at the binary maximum. Again, we indicate our experimentally inaccessible regions with yellow bands.
For positron impact, this comparison shows that (a) all but one theory predicts a binary emission maximum at a larger angle than was observed; (b) the observed B2 intensity was not evident in any of the theoretical predictions; (c) for recoil emission, all theories predict higher probabilities than was observed; and (d) the predicted recoil lobe was at a smaller angle than was observed.
For electron impact, our present analysis produces a binary lobe that is much broader and maximizes at a larger angle than the predicted lobe. The broader width is because the B1 component was more forward-directed than the theoretically predicted peak and because of a significant B2 component, which, again, was very weak or absent in the theoretical prediction. For recoil interactions, the predicted intensity was larger and the angle was smaller than that observed. However, for electron impact, the locations of the predicted and observed binary lobes were in agreement. For electron impact, the CDW theory predicted a binary peak maximum roughly in accordance with that observed but with a significantly smaller width. For recoil interactions, the predicted and observed peak positions were in rather good agreement; however, as was seen for the positron impact, theory again overestimates the magnitude.
3.5. Polar Plots
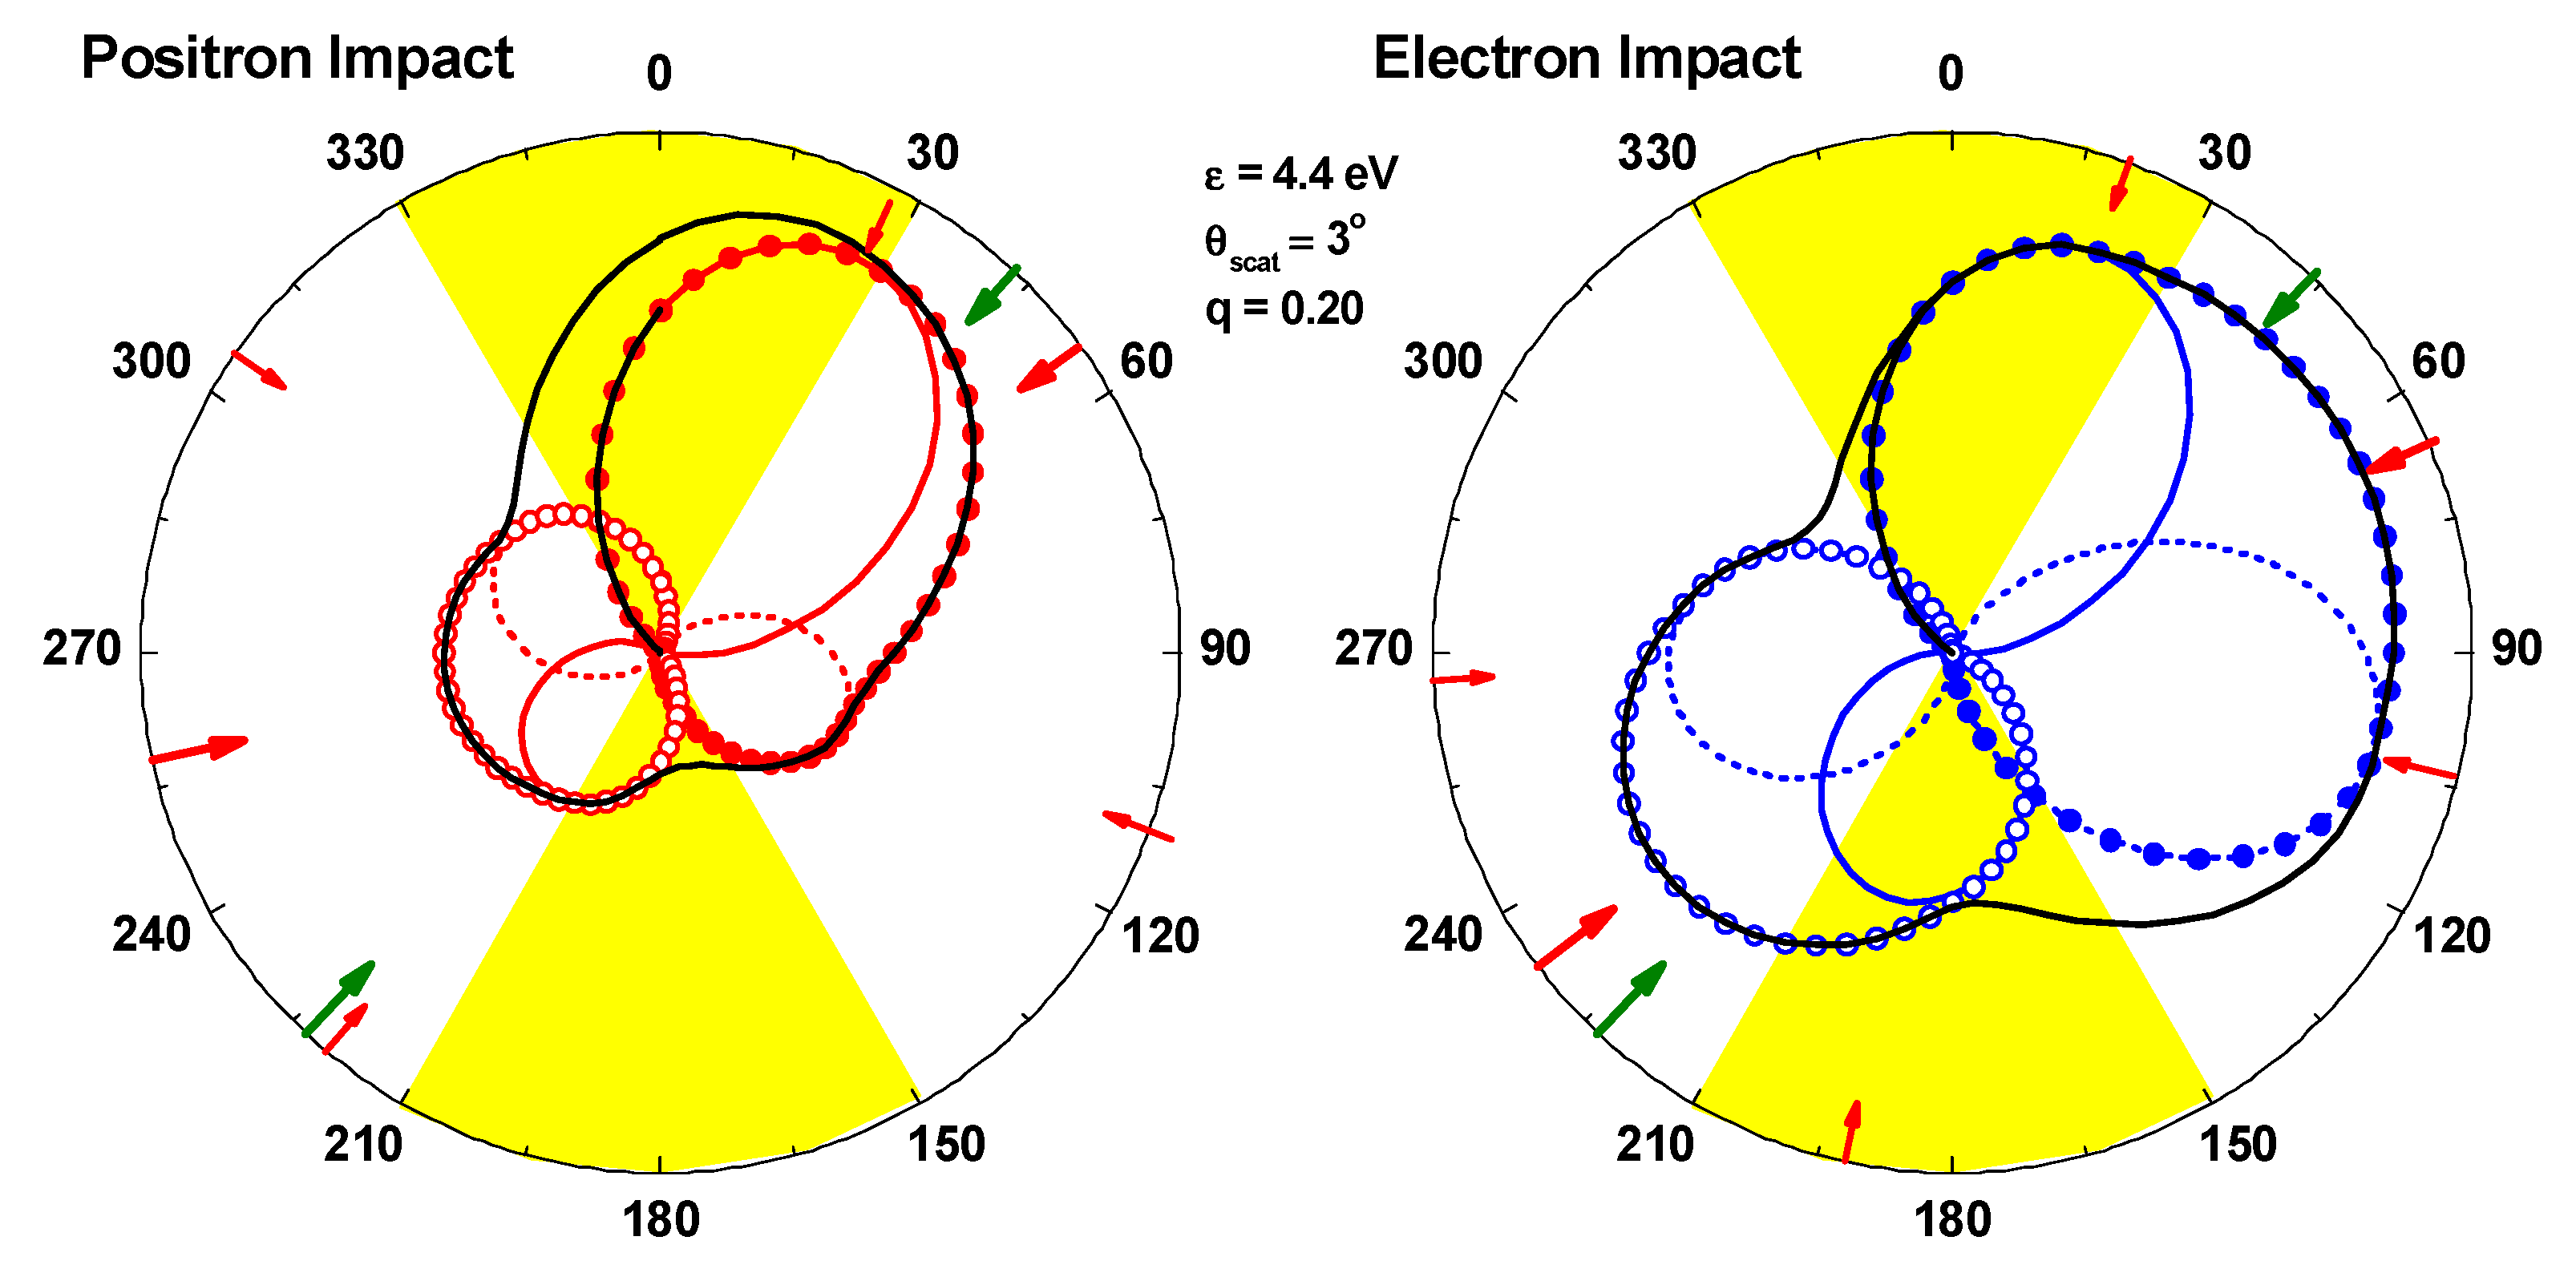
To help understand these differences, parameters for the fitted curves in Figure 5 and Figure 6 were used to generate polar plots of the measured TDCS for 4.4 eV electron emission and a 3° scattering angle. Figure 9 shows (a) the component peaks, namely B1, B2, R1, and R2; (b) their sum for both binary and recoil interactions, namely B1 + B2 and R1 + R2; and (c) the overall sum, i.e., the magenta curves in Figure 1 and Figure 3. The red and blue solid curves show the B1 and R1 components, the dashed curves show the B2 and R2 components, and the open symbols show their sum, i.e., the binary and recoil lobes, and the solid black curve is the overall sum. The direction and opposite direction of the momentum transfer are shown by the green arrows, while the narrow and broad red arrows show the directions of the binary and recoil components as well as their overall sum. The scattering angle is not shown, which would be at 357° in these polar plots.
Features associated with the magnitudes and directions of the various components and their sums were discussed in a previous section, thus, comments will be restricted to using this figure to interpret the comparison with theory. For positron impact, Figure 9 shows that the deviation between the experiment and the black theoretical curve (the DWBA theory by Campeanu and Alam [15]) in the 330°–30° region is due to contributions from the higher angle recoil peak, specifically R2, which was either underestimated or predicted to be at a much smaller angle. Otherwise, that theory appears to predict the B1 contribution quite accurately. Figure 9 also implies that the differences between the experiment and the same theory, between 60 and 150 degrees, are because theory greatly underestimates the B2 contribution. Between 180° and 300°, Figure 9 implies that theory predicts the position of the R1 component fairly accurately, but also greatly overestimates the magnitude or predicts too small of an angle for the R2 component.
Turning our attention to the electron impact data, the CDW theory produces the B1 peak at too large of an angle and fails to describe the strong B2 component that was observed. Underestimating the B2 component may suggest pre-collision problems, such as target polarization. The theory shows evidence of the R1 peak at about 190° and clearly shows the R2 peak at 240°, both agreeing reasonably well with the positions indicated in Figure 9. Regarding their intensities, the R1 intensity appears to agree with the data but the R2 intensity was overestimated.
4. Summary and Conclusions
TDCS data for the ionization of argon by positrons and electrons for 18 different combinations of emission energies and scattering angles covering a range of momentum transfers between 0.16 and 0.31 a.u. were measured and fit using an empirical model consisting of two binary and two recoil peaks. By fitting the data, TDCS information in regions not experimentally accessible was obtained. In addition, the fitting parameters were used to investigate TDCS scaling properties and to provide insight pertaining to pre and post-collision processes as well as agreements/disagreements between these experimental data and various theoretical predictions.
The major findings from this study are as follows: (1) For the kinematic conditions of the present work, both the binary and recoil lobes are comprised of two unresolved components attributed to the p outer-shell structure of argon. (2) For electron impact, the components have approximately the same intensity, whereas for positron impact, the higher angle component is less intense than the lower angle component. This results in broader lobes for electron impact and also influences the lobe directions with respect to the kinematically predicted directions. Both of these features are signs of projectile charge effects either in the incoming channel via target polarization or associated with post-collision effects in the outgoing channel. (3) As the kinematic angle increases, the lower angle binary component shifts away from the kinematic direction, whereas the larger angle component moves closer to the kinematic angle. For recoil interactions, both components are at larger angles than directly opposite to the kinematic angle, and move closer in that direction as the kinematic angle increases. We emphasize that these features, which are subject to statistical limitations, and the accuracy of our analysis, need to be tested experimentally or theoretically. (4) Comparison with available DWBA and CDW theoretical predictions showed three main inconsistencies, namely that the observed binary lobe direction disagrees with that predicted by theory; the observed binary lobe contribution centered around 120°, the B2 component, is totally absent or severely underestimated in the theoretical predictions; and all the theories significantly overestimate the recoil lobe intensity. We note that these theories include both polarization and post-collision effects, and that two recent theoretical studies [7,8] have shown that inclusion of post-collision effects produced much better agreement with the data. Perhaps similar effects may be associated and should be studied for the incoming channel.
A major open question from this work is as follows: “is the B2 component truly absent in the calculations or does most of the intensity in this channel end up in the R2 peak due to the post-collision models used?” Other aspects worth theoretical investigation include: (1) investigation of the scaling dependences illustrated in Figure 5 and Figure 6; (2) clarifying the interactions that produce the lower and higher angle contributions to the binary and recoil lobes; and what causes the different intensities. In these suggested investigations, we wish to emphasize that agreement between experiment and theory in a single case does not imply agreement in all cases, as exemplified by the comparison using our earlier analysis method with preliminary theoretical predictions, which resulted in the present study. Experimentally, higher statistical quality data are needed in order to confirm the present observations and to better test theory.
Author Contributions
Investigation, O.G.d.L. and R.D.D.; analysis and writing, R.D.D. and O.G.d.L. All authors have read and agreed to the published version of the manuscript.
Funding
The original data accumulation was supported by the National Science Foundation and by UNAM-DGAPA-PAPIIT, contract IN105510. The current analysis was supported in part by UNAM-DGAPA-PAPIIT, contracts TA100213 and IN116916.
Institutional Review Board Statement
Not applicable.
Informed Consent Statement
Not applicable.
Data Availability Statement
Conflicts of Interest
The authors declare no conflict of interest and the funding agency had no role in the design of the study; in the collection, analyses, or interpretation of data; in the writing of the manuscript, or in the decision to publish the results.
References
- De Lucio, O.G.; Otranto, S.; Olson, R.E.; DuBois, R.D. Triply Differential Single Ionization of Argon: Charge Effects for Positron and Electron Impact. Phys. Rev. Lett. 2010, 104, 163201. [Google Scholar] [CrossRef] [PubMed]
- Ren, X.; Senftleben, A.; Pflüger, T.; Dorn, A.; Bartschat, K.; Ullrich, J. Low-energy Electron-impact Ionization of Argon: Three-dimensional Cross Section. Phys. Rev. A 2012, 85, 032702. [Google Scholar] [CrossRef] [Green Version]
- DuBois, R.D. Doubly and Triply Differential Ionization Measurements Using Femtoamp Beams of Positrons and Electrons. New J. Phys. 2012, 14, 025004. [Google Scholar] [CrossRef] [Green Version]
- De Lucio, O.G.; DuBois, R.D. Differential Studies and Projectile Charge Effects in Ionization of Molecular Nitrogen by Positron and Electron Impact. Phys. Rev. A 2016, 93, 032710. [Google Scholar] [CrossRef] [Green Version]
- Gavin, J.; de Lucio, O.G.; DuBois, R.D. Triply Differential Measurements of Single Ionization of Argon by 1-keV Positron and Electron Impact. Phys. Rev. A 2017, 95, 062703. [Google Scholar] [CrossRef] [Green Version]
- Avaldi, L.; Camilloni, R.; Fainelli, E.; Stefani, G. Ionization of the N2 3Σg Orbital by Electron Impact Studied by Asymmetric (e,2e) Experiments. J. Phys. B At. Mol. Opt. Phys. 1992, 25, 3551. [Google Scholar] [CrossRef]
- Campeanu, R.I.; Walters, J.H.R.; Whelan, C.T. A coincidence study of electron and positron impact ionization of Ar (3p) at 1 keV. Eur. Phys. J. D. 2015, 69, 235. [Google Scholar] [CrossRef]
- Campeanu, R.I.; Whelan, C. Few Body Effects in the Electron and Positron Impact Ionization of Atoms. Atoms 2021, 9, 33. [Google Scholar] [CrossRef]
- Knudsen, H.; Brun-Nielsen, L.; Charlton, M.; Poulsen, M.R. Single Ionization of H2, He, Ne and Ar by Positron Impact. J. Phys. B At. Mol. Opt. Phys. 1990, 23, 3955. [Google Scholar] [CrossRef]
- Ehrhardt, H.; Hesselbacher, K.-H.; Jung, K.; Schubert, E.; Willmann, K. Electron Impact Ionization of Argon: Measurements of Triple Differential Cross Sections. J. Phys. B At. Mol. Phys. 1974, 7, 69. [Google Scholar] [CrossRef]
- Stevenson, M.; Leighton, G.J.; Crowe, A.; Bartschat, K.; Vorov, O.-K.; Madison, D.H. Experimental and Theoretical (e,2e) Studies of Argon (3p) Ionization in Asymmetric Geometry. J. Phys. B At. Mol. Opt. Phys. 2005, 38, 433. [Google Scholar] [CrossRef]
- Lahmam-Bennani, A.; Wellenstein, H.F.; Duguet, A.; Rouault, M. Absolute Triple Differential Cross Sections for the 3p Ionisation of Argon by Electron Impact. J. Phys. B At. Mol. Phys. 1983, 16, 121. [Google Scholar] [CrossRef]
- Catoire, F.; Staicu-Casagrande, E.M.; Nekkab, M.; Dal Cappello, C.; Bartschat, K.; Lahmam-Bennani, A. Investigation of the (e,2e) Single Ionization of He and Ar at Large Energy Loss Close to Minimum Momentum Transfer. J. Phys. B At. Mol. Opt. Phys. 2006, 39, 2827. [Google Scholar] [CrossRef]
- Purohit, G.; Patidar, V.; Sud, K.K. Differential Cross Section Calculations of Positron and Electron Impact Ionization of Ar (3p). Nucl. Inst. Meth. Phys. Res. B 2011, 269, 745. [Google Scholar] [CrossRef]
- Campeanu, R.I.; Alam, M. DWBA Calculation of Positron Impact Ionization of Argon. J. Phys. Conf. Ser. 2011, 262, 012010. [Google Scholar] [CrossRef]
- Otranto, S. Initial-state Correlation in the Electron-Impact Ionization of Argon. Phys. Rev. A 2009, 79, 012705. [Google Scholar] [CrossRef]
Figure 1.
TDCS for 200 eV positron–argon collisions. Kinematic information is listed in each example, where, for each subfigure, the numbers in parenthesis are the emission energy uncertainties; see text for details. The black solid squares show the measured TDCS signal with the red open circles, showing values after the “turn around component” has been subtracted. The solid magenta lines are fits to the data, as described in the following text. Mean angles for the binary and recoil intensities are shown by the red arrows. Kinematic angles for binary interactions are shown by the green arrows. The open blue triangles show values obtained using a previous method based on an average emission energy/emission energy bin.

Figure 2.
Same as for Figure 1 but with higher emitted electron energies.
Figure 2.
Same as for Figure 1 but with higher emitted electron energies.

Figure 3.
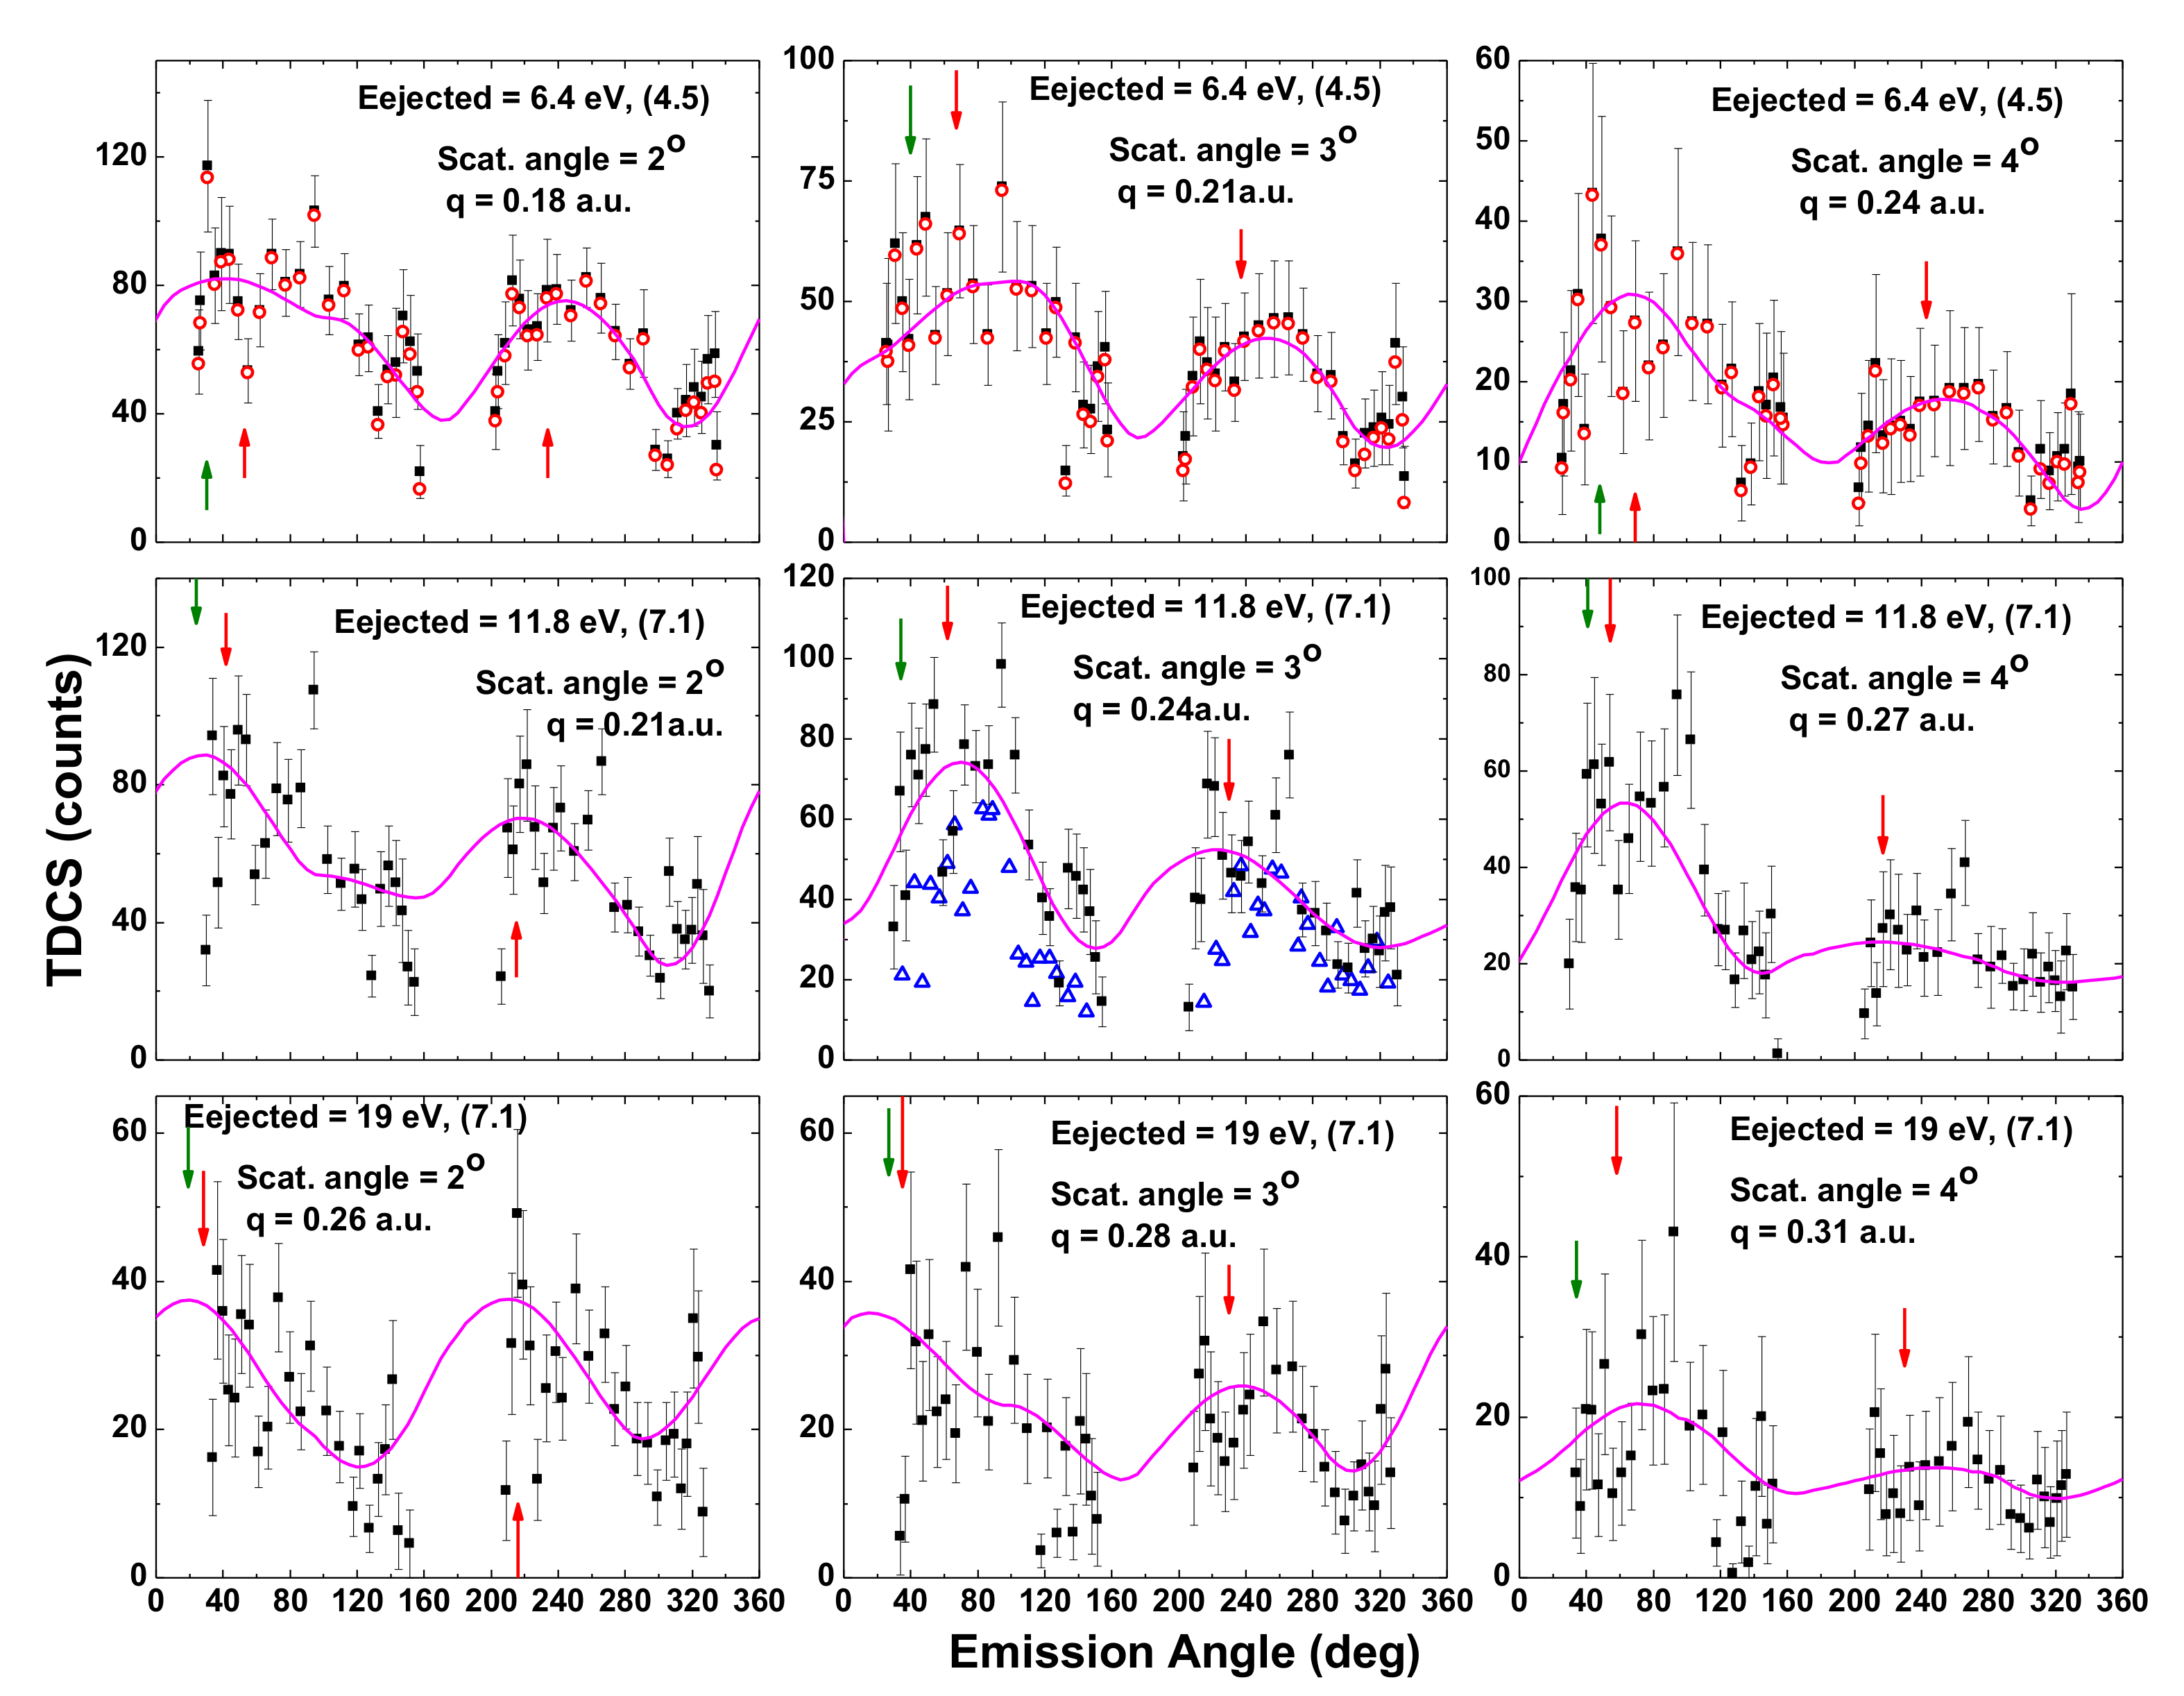
TDCS for 200 eV electron–argon collisions. Symbols are the same as in Figure 1 and Figure 2.

Figure 4.
Same as for Figure 3 but for higher emitted electron energies.
Figure 4.
Same as for Figure 3 but for higher emitted electron energies.

Figure 5.
As a function of momentum transfer, ratios of the various component intensities from fits to the TDCS data are shown in Figure 1, Figure 2, Figure 3 and Figure 4. Positron impact, left figure; electron impact, right figure. As stated in the text, the letters B and R, and numbers refer to the smaller and larger angle peaks contributing to the binary and recoil lobes. The lines are linear fits to the data.

Figure 6.
Directions of the various component peaks from fits to the TDCS data shown in Figure 1, Figure 2, Figure 3 and Figure 4. Positron impact, left figure; electron impact, right figure. Note: filled circles, B1; open circles, B2; filled stars, R1; and open stars, R2. Dashed lines are linear fits and solid lines are fits for the total binary and recoil lobes.

Figure 7.
Deviations from the kinematic direction or directly opposite for the binary and recoil peaks as well as for the entire lobes.
Figure 7.
Deviations from the kinematic direction or directly opposite for the binary and recoil peaks as well as for the entire lobes.

Figure 8.
Comparisons of our re-analyzed TDCS and theoretical predictions. The DWBA theories are from [7,13,14], and the CDW theory from [1]. The yellow rectangles show the geometrically inaccessible angles.

Figure 9.
Polar plots of the 4.4 eV, 3°, TDCS, for positron (left figure) and electron (right figure) single ionization of argon. The radius scale is linear and arbitrarily scaled for visual purposes. The solid and dashed red and blue curves, representing the obtained fit parameters from Figure 5 and Figure 6, show the individual components to binary and recoil interactions. The open symbols show their sums, i.e., the binary and recoil lobes, and the solid black curve shows the sum, i.e., the 4.4 eV experimental curve in the previous figure. The red arrows show the directions for the various components and for their sum. The green arrows indicate the momentum transfer direction and opposite direction; see text for details. Regions we could not access experimentally are shown in yellow.


Table 1.
Mean electron emission energies and widths contributing to each energy loss bin, determined using our previous and present methods, shown in blue and black, respectively. Parameters for components contributing in our new analysis are show in columns 4 and 5. For all sorting bins, the width of Gaussian component 1 was 5.5 eV; for component 2, the width was 4.5 eV for Loss 1–Loss 4 and 7 eV for Loss 5 and 6.
| Sorting Bin | Old Method | Present Method | ||||
|---|---|---|---|---|---|---|
| Gaussian ½ | Full Distribution | |||||
| Mean eV | 2σ eV | Relative Magnitude | Center eV | Mean eV | 2σ eV | |
| Loss 1 | 1.9 | 4 | 0.0325/0.012 | −1.0/5.0 | 2.6 | 2.9 |
| Loss 2 | 3.2 | 6 | 0.0232/0.008 | 1.2/6.5 | 3.1 | 3.3 |
| Loss 3 | 5.4 | 6 | 0.017/0.0057 | 3.25/8.5 | 4.4 | 4.0 |
| Loss 4 | 8.2 | 6 | 0.0125/0.0045 | 5.5/11.0 | 6.4 | 4.5 |
| Loss 5 | 14.2 | 8 | 0.0059/0.0023 | 10.5/17.0 | 11.8 | 7.1 |
| Loss 6 | 21.7 | 8 | 0.0021/0.00085 | 17.5/24.0 | 19.0 | 7.1 |
Publisher’s Note: MDPI stays neutral with regard to jurisdictional claims in published maps and institutional affiliations. |
© 2021 by the authors. Licensee MDPI, Basel, Switzerland. This article is an open access article distributed under the terms and conditions of the Creative Commons Attribution (CC BY) license (https://creativecommons.org/licenses/by/4.0/).
Share and Cite
MDPI and ACS Style
DuBois, R.D.; de Lucio, O.G. Triply Differential Positron and Electron Impact Ionization of Argon: Systematic Features and Scaling. Atoms 2021, 9, 78. https://0-doi-org.brum.beds.ac.uk/10.3390/atoms9040078
AMA Style
DuBois RD, de Lucio OG. Triply Differential Positron and Electron Impact Ionization of Argon: Systematic Features and Scaling. Atoms. 2021; 9(4):78. https://0-doi-org.brum.beds.ac.uk/10.3390/atoms9040078
Chicago/Turabian StyleDuBois, R. D., and O. G. de Lucio. 2021. "Triply Differential Positron and Electron Impact Ionization of Argon: Systematic Features and Scaling" Atoms 9, no. 4: 78. https://0-doi-org.brum.beds.ac.uk/10.3390/atoms9040078
Note that from the first issue of 2016, this journal uses article numbers instead of page numbers. See further details here.