1. Introduction
Nowadays, renewable energy sources (RESs) have been widely connected to distribution networks according to the advantage of electricity generation from RESs, which is clean energy, to respond to the high increasing demand in electrical power. However, RESs also consist of a major drawback, which is a fluctuation of power generation, due to the uncertainty of natural sources that cannot be controlled, causing an imbalance between the supply and demand of electrical power. As a result, electrical power flows in a reverse way and power loss occurs in distribution networks [
1,
2,
3,
4], especially the connection of privately-owned RESs to the distribution network systems of distribution network operators (DNO). Owners of RES companies usually sell electrical energy to the distribution networks based on electricity generation depending on the natural sources at that time. In particular, photovoltaics (PVs) can generate electricity only during the daytime, which is an example of the above-mentioned problem.
The important factors for a distribution network is the reliability of the power system and that the power quality meets the standards. Therefore, energy storage systems (ESSs) have an important role and have been used in distribution networks with the connected RESs to overcome the drawbacks of RES. Additionally, the ESS can balance the electrical power supply and demands [
5], improve voltage deviation [
6,
7], reduce power loss [
8,
9,
10,
11], reduce peak demand by storing electrical energy during an off-peak time and supplying electric power during peak time [
12,
13], and use for many objectives including voltage deviation improvement, power loss reduction, and peak demand reduction [
14,
15,
16].
The optimal location and sizing of an ESS installation can improve the power system’s efficiency and reliability [
17]. I. Naidji et al. proposed the optimal sizing of an ESS installation that considered the minimum cost at the weakest position by considering the contingency sensitivity index (CSI) [
18]. M. Nick et al. introduced the minimum investment cost of an ESS together with the optimal siting and sizing of an ESS to reduce the expenses incurred in the power system by using second-order cone programming (SOCP) [
19]. The installation of a battery energy storage system (BESS) cannot only improve the power system efficiency, but also increase the flexibility of dealing with the management (purchase and sell) of electric power for the maximum profit of an electricity supplier [
20]. The installation of a BESS, together with the connection of RESs to manage power systems, can support the increasing electricity consumption [
21,
22,
23,
24]. In addition to the installation of the ESS in the optimal siting and sizing, the appropriate schedule control of an ESS plays an important role in improving the efficiency of power systems and is also able to increase the profits from the sale of electricity for the electricity seller [
25,
26,
27].
N. Jayasekara et al. proposed an appropriate method to find the optimal siting, sizing, and operation pattern of a BESS [
14]. However, the costs—consisting of the battery cost, installation cost and maintenance cost of the BESS—are included in the objective function. Therefore, the obtained siting and sizing of the BESS are not truly appropriate in the aim of improving the efficiency such as minimizing voltage deviation, power loss, and peak demand of the distribution network. Moreover, the comparison of different optimization algorithms has not been investigated to verify the obtained simulation results. Hence, this work aimed to find the optimal siting and sizing of a BESS in distribution networks with the connected RES where the load demand is varied across a day. The objective function was to minimize costs incurred in the distribution networks including the costs of voltage deviation, power loss, and peak demand. Therefore, the truly appropriate optimal siting and sizing of the BESS in distribution networks can be provided. The BESS installation was evaluated in the IEEE 33-bus distribution network. The simulation results were provided by two algorithms comprising of the genetic algorithm (GA) and particle swarm optimization (PSO) and were compared to both verify the simulation results and obtain the appropriate algorithm.
The main contribution of this work includes:
The optimal siting and sizing of a BESS in distribution networks with the connected RESs can be provided when the objective function is to minimize the costs incurred in distribution networks that comprise of the costs of voltage deviation, power loss, and peak demand.
A performance comparison between the genetic algorithm (GA) and particle swarm optimization (PSO) was undertaken to verify the simulation results and choose the appropriate algorithm.
2. Battery Energy Storage Systems Formulation
ESS technology can store electrical energy in several forms. For instance, electrical energy can be stored in the mechanical form such as pumped hydro, compressed air and flywheel; in the electromagnetic form such as a supercapacitor; in the thermal form such as steam accumulator, molten salt storage, and liquid nitrogen engine; and in the electrochemical form such as flow battery, rechargeable battery, and ultra-battery. The selection of each ESS technology depends on the purpose and physical suitability. In this work, the BESS was chosen to be installed in the distribution network with RESs, and the operation of the BESS was simulated by using the Fourier series.
2.1. Battery Energy Storage Systems (BESSs)
Various types of BESSs such as lead-acid, UltraBattery, NaS, Li-ion, Ni-Cd, and vanadium redox batteries have been widely used for storing electrical energy [
28,
29,
30,
31]. Li-ion batteries are more popularly used to store electrical energy in many countries such as Germany [
32]. Additionally, the price of Li-ion batteries has tended to decrease due to the development of their use in electric vehicles (EVs) [
33]. The important characteristics of Li-ion batteries are their high capacity and energy per volume, fast charge and discharge, and low self-discharge rate. From the characteristics of the Li-ion battery above-mentioned, it requires less installation space, has a rapid response to supply or store the electrical energy, and has low energy loss rate from self-discharging. Therefore, this work applied a Li-ion battery as the BESS.
Several factors affecting the lifespan of a Li-ion battery that should be considered include the temperature, number of duty cycles of the battery, and depth of discharge (DOD). Therefore, for a long life Li-ion battery, good heat dissipation is required where the optimum temperature for the Li-ion battery is around 15–35 °C. Frequent charging and discharging should be avoided, and the a suitable value of DOD is 80% of the total capacity of the battery. Charging or discharging rates should not be too high because the higher charging or discharging rates cause a higher battery temperature, which results in the short lifespan of the battery [
34]. In addition, the imbalance charging of each battery cell of the BESS due to the initial unequal state of charge (SOC), which is defined by the battery’s present amount of charge divided by its rated charge capacity, may cause some damage to the BESS, a capacity reduction of the BESS, and the deterioration of the BESS. However, this can be avoided by using battery charge equalization systems (BCEs) [
35].
2.2. Battery Energy Storage System Simulation
The BESS simulation presented in this work considered the rates of charge or discharge of the BESS at equal intervals within the considered period of 24 h. These 24 h can be equally divided such as 1 h, 30 min, or 15 min, which can obtain the rate of charge or discharge of BESS at
values including 24, 48, and 96, respectively. Therefore, the rates of charge and discharge in the considered period
can be formulated as the following equation.
where
is the electrical energy in BESS (MWh) at time
.
To find the values of
at each time
, the Fourier series is applied to express the state of energy (SOE) in the total considered intervals. The state of energy of the BESS can be obtained by substituting the Fourier coefficient
from Equation (2) into Equation (3) to find the values of
.
where
,
,
,
, and
are the constant Fourier coefficient, Fourier cosine coefficients, Fourier sine coefficients, the number of Fourier coefficients (set to 8 [
14]), and total period, respectively.
The constant Fourier coefficient () does not affect the charge or discharge power of BESS due to its constant value. It can be added after calculating the Fourier coefficients to ensure that the SOE of BESS is not negative or lower than the minimum depth of discharge ().
To compute the rate of charge and discharge from the SOE of BESS (
) at each time
t, Equations (4)–(6) are calculated. Suppose
is the charge rate or discharge rate at time
. The positive value of
means the BESS is charging while a negative value means the BESS is discharging.
where
=
=
,
= 0.9 (the total efficiency of the BESS),
,
are battery charging efficiency, battery discharging efficiency, battery round trip cycling efficiency, battery power (MW), and sampling time interval, respectively.
The optimal size of the BESS can be found by Equation (7).
where
= 0.8 is the maximum depth of discharge value; and
and
are the maximum and minimum battery energy values, respectively. The unit of the energy capacity of the BESS depends on the unit of
and
.
Generally, each round of battery discharge where the energy discharging is equal to the battery capacity is called one operation cycle of a battery. However, to simply calculate the battery cycle, the summation of both charging and discharging energies for all considered time intervals are included, and its average value is instead computed by dividing by 2 (charging and discharging) as in Equation (8) [
14]. The lifespan of the BESS can then be evaluated from Equation (9) [
14].
where
is the daily cycles of BESS;
CycleLife = 3221 is the nominal cycles life of the Li-ion battery [
34];
= 365 is the number of operating days of BESS; and
Lifespan is the lifespan of the BESS (years).
3. Problem Formulation
The installation of the BESS in distribution networks with RESs can improve the efficiency, reliability, and power quality of the distribution networks. The considered objective functions to be minimized include voltage deviation, power loss, and peak demand for providing the optimal siting and sizing of thee BESS under the constraints of distribution networks.
3.1. Objective Functions
The major objective function of this work was to minimize several costs incurred in distribution networks (
) consisting of voltage regulation cost (
), power loss cost (
), and peak demand cost (
) in terms of infrastructure development deferrals. Equation (10) represents the objective function and several costs can be found by Equations (11)–(14).
where
,
,
,
,
,
,
,
, and
are total bus number, voltage magnitude (per unit) at the
th bus, reference voltage which is equal to 1 p.u., total branch number, active power loss in each branch, maximum active power at slack bus over the considered period, rate of voltage regulation cost, rate of power loss cost, and rate of peak demand cost (
$/p.u. [
15],
$/kWh [
14],
$/kWh/year [
14]), respectively.
3.2. Constraints
(1) Voltage Constraint: Voltage of each bus must be limited within the lower and upper limit throughout the consideration period set at ±5% of the reference voltage as the expressed equation.
where
and
are the lower bound and upper bound of voltage at
th bus, respectively, and
is the voltage magnitude at
th bus in time
.
(2) Battery Constraint: The power and capacity of the battery are bounded to ensure that the battery operation does not exceed the boundary limits during charging or discharging, which can be presented as the equation below.
where
,
are the minimum and maximum power of BESS, respectively.
,
are the power charge rate and power discharge rate of BESS at time
, respectively.
,
are the minimum and maximum capacity of BESS, respectively.
4. Methodology
The optimal siting and sizing of the BESS in distribution networks with RESs are presented in this work. The simulation of distribution networks was conducted in MATLAB and MATPOWER was also adopted. For the optimization process, genetic algorithm (GA) and particle swarm optimization (PSO) were both applied to find the minimum value of the objective function for finding the optimal siting and sizing of BESS and the performance of these algorithms were compared.
4.1. Test System
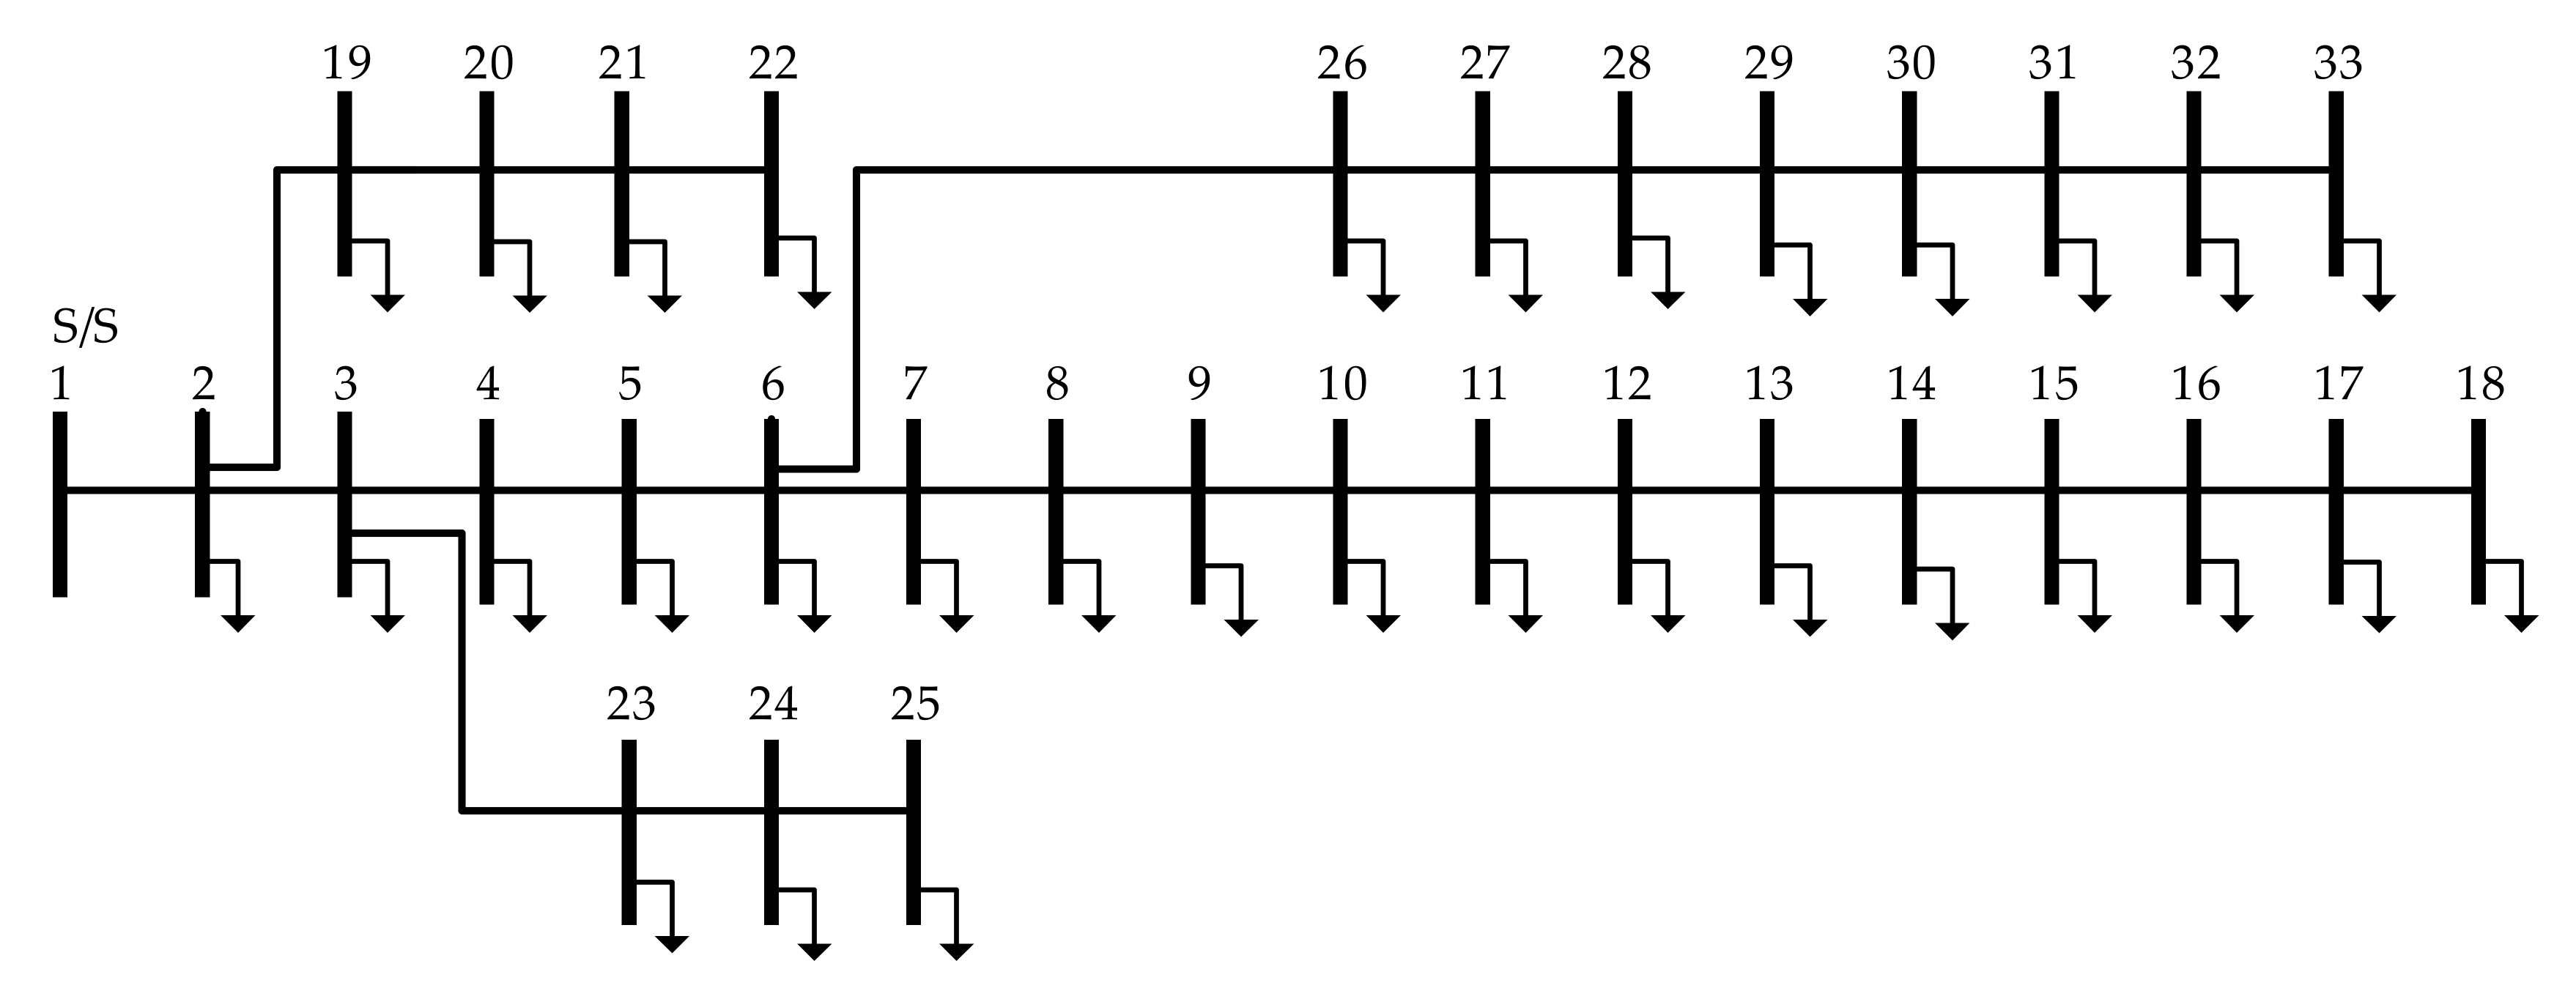
The distribution network used to evaluate the optimal siting and sizing of the BESS was the IEEE 33-bus distribution network shown in
Figure 1, and the detailed data can be obtained from [
14]. The values of load power at each bus can be obtained from the voltage magnitude at each bus (in per unit) without any RES connection according to Equations (18) and (19).
where
,
are the active power and reactive power at the
th bus, respectively.
,
are the initial active power and reactive power at the
th bus, respectively,
,
, base voltage
, base power
. The two types of RESs, wind turbines (WTs) and photovoltaics (PVs), were connected in the distribution network. Two WTs (1 MW) were each located at buses 18 and 24, three PVs (400 kVA) each were installed at buses 5, 21, and 31, and four PVs (500 kVA) each were installed at buses 8, 12, 28, and 33. In this test system, the parameters were set as
,
, and
. Peak active and reactive powers of the test system were 3.556 MW and 2.191 MVar, respectively. The detailed data of load magnitude and the output generations of WTs and PVs can be found in [
14,
21].
4.2. Genetic Algorithm (GA)
Genetic algorithm is inspired and operated by mimicking Charles Darwin’s evolution method. First, the initial populations are randomly generated, which are binary numbers. Each population has equal binary numbers to the decision variables (
) multiplied by the bit number (
) assigned for each decision variable. The binary numbers for each population are then converted to decimal numbers. Following this, the decimal numbers are compared with the range of each decision variable (
lb,
ub) to obtain the real values for each decision variable and then substituting them to find the objective function. After that, three main steps comprising of population selection, cross over, and mutation are considered. In the first step, two populations are randomly selected from the parents’ generation, and the cross over is operated between the selected populations in step two where the number of cross over is according to the cross over percentage (
pc). In the last step, the mutation is proceeded based on the mutation rate (
mu), and binary numbers are converted to decimal numbers to evaluate the objective function. The best fitness value is updated until the max iteration (
) is reached [
36].
4.3. Particle Swarm Optimization (PSO)
Particle swarm optimization is inspired by the behavior of bird flocking and fish schooling [
36]. Initially, the particles are generated with random positions and zero velocity, and the objective function is then evaluated. In the next step, the best positions of each particle, which is called the personal best position (
), are updated and the best position among all particles, which is called the global best position, is updated (
). The velocity and position of each particle can be updated according to the
and the
by the following equations.
where
is the velocity of the
particle;
is the current position of the
particle;
is the personal best position of the
particle;
is the global best position among all particles;
is the updated position of the
particle,
;
is the
itth iteration;
and
,
are random numbers randomly generated between 0 and 1.
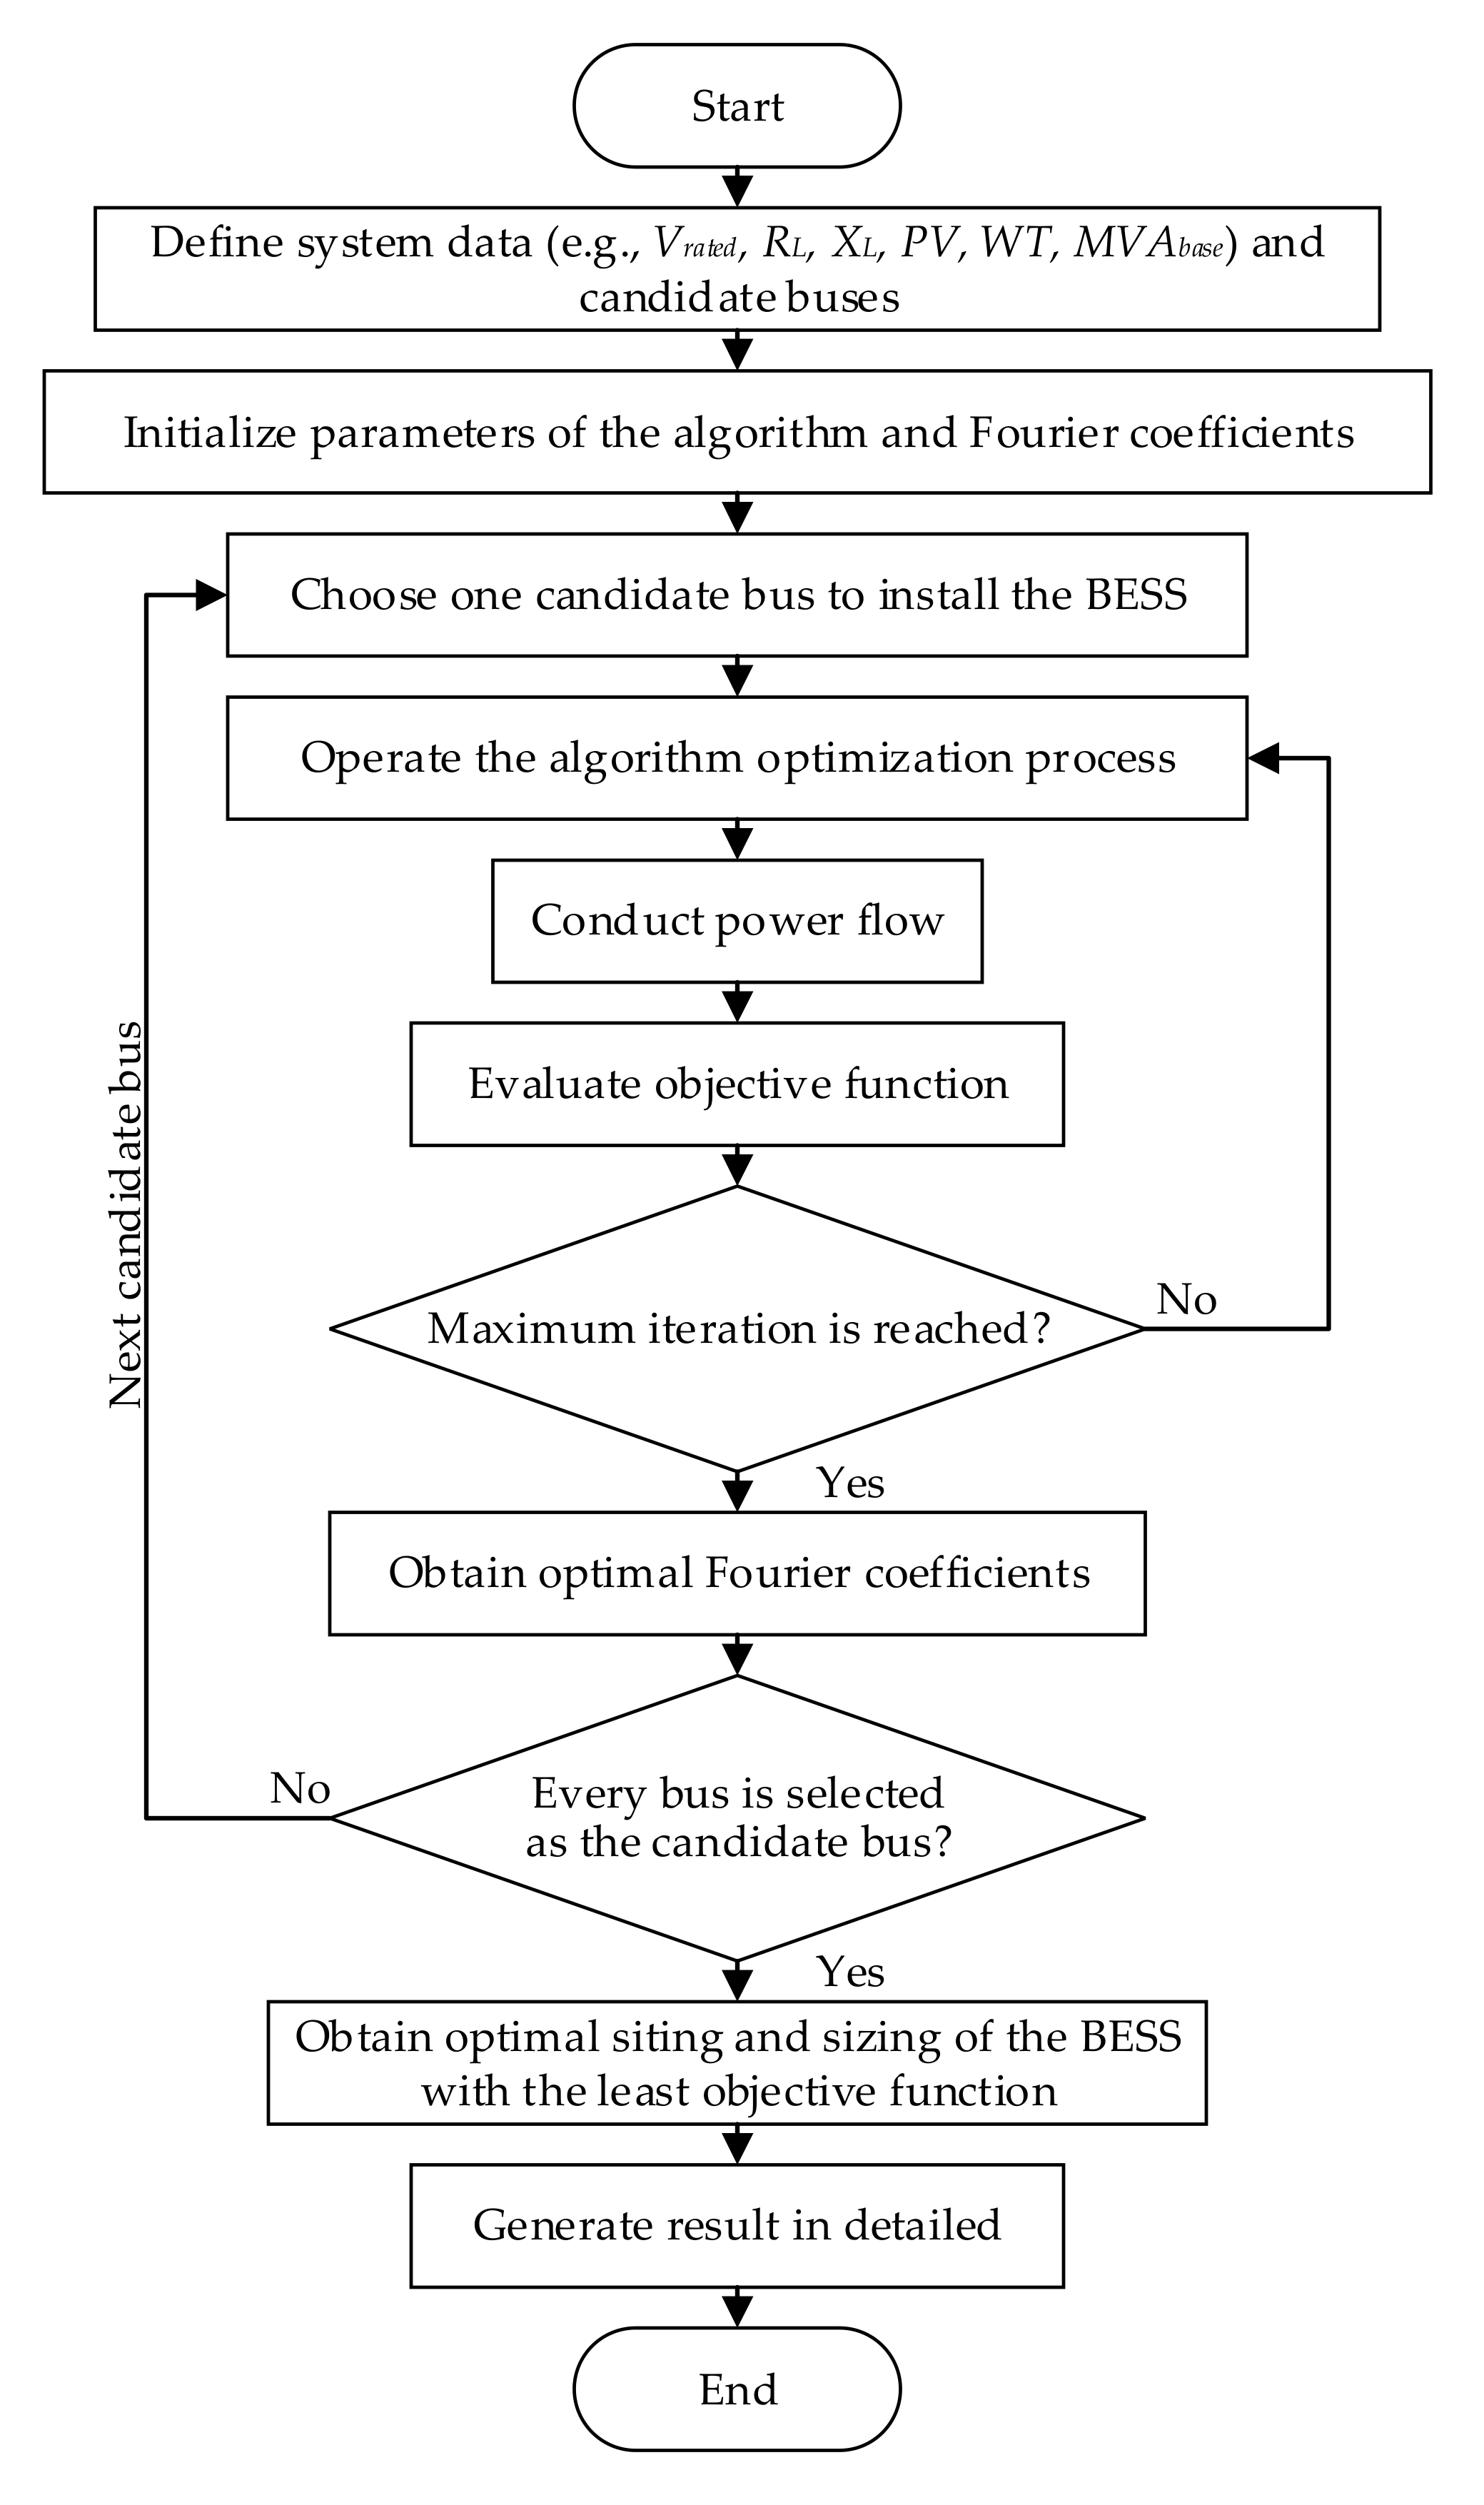
4.4. Application of the Optimal Siting and Sizing of the Battery Energy Storage System (BESS)
The application of the optimal siting and sizing of BESS in this work consisted of the following steps.
Define the input data comprising of
Vrated,
RL,
XL,
PV,
WT, and
MVAbase to simulate the considered distribution network in MATPOWER [
37,
38], and impose candidate buses to find the best location of the BESS installation.
Initialize parameters of the algorithm (GA or PSO) and Fourier coefficients, where
and
of the Fourier coefficients are proportionally reduced with the rate
[
39] (
n is the number of Fourier coefficients).
Choose one candidate bus as the location of the BESS installation.
Conduct power flow where the BESS is installed at one candidate bus.
Evaluate the objective function and update the best solution.
If the maximum iteration is reached, go to step 8; otherwise, go to step 4.
Obtain optimal Fourier coefficients where the BESS is installed at the chosen candidate bus from step 3.
If the candidate bus is the last candidate, go to step 10; otherwise, go to step 3.
Obtain the optimal siting of the BESS installation, which is the candidate bus providing the minimum value of the objective function.
Provide the information of the BESS by substituting the obtained Fourier coefficients in Equations (1)–(9).
The flowchart of the optimal siting and sizing of the BESS method is shown in
Figure 2.
4.5. System Performance Evaluation
To evaluate the system performance after the BESS installation based on the objective function, voltage deviation, power loss, and peak demand were investigated. The details are as follows.
4.5.1. Voltage Deviation Index (VDI)
To evaluate the voltage profile improvement, the VDI was applied to represent the voltage deviation of each case. The VDI compared the voltage level of each bus (
in p.u.) with the reference voltage (
p.u.) and is presented in percent (%
VDI). The VDI can be calculated by the expressed equations.
where
is the VDI of the
ith bus, and
is the total VDI of the distribution network.
4.5.2. Power losses
Power losses including real, reactive, and apparent power losses of the distribution network were compared in the cases with BESS and without BESS. The following equations are computed.
where
,
, and
are the active power loss, reactive power loss, and apparent power loss, respectively.
is the number of branches.
is the total period.
is the total number of branches.
4.5.3. Peak Demand Comparison
In this research, the direction of the active power flow at the slack bus of the distribution network was investigated. If the active power flow is positive, the power flows into the distribution network while the negative active power flow represents the power flow flowing out from the distribution network.
5. Simulation Results
This work aimed to find the optimal siting and sizing of the BESS for a distribution network by minimizing the costs incurred in the distribution network, consisting of voltage regulation costs, costs due to power losses, and peak demand costs within 24 h. The simulation was operated in MATLAB interfaced with MATPOWER 7.0, and the computer specification was an Intel® Core™ i3-6100U 2.30 GHz, RAM 8 GB, Windows 10 Pro 64-bit Operating System. GA and PSO were applied to solve the optimization problems, and their performance was compared. The parameters of the algorithms were as follows: population = 60, maximum iterations = 1000, crossover percentage = 50%, and mutation rate = 0.02. The simulation results are provided in the following subsections.
5.1. Comparison of the Optimal Siting and Sizing of the BESS Installation
The BESS was chosen to be installed at one bus from the 2nd to 33rd bus to find the best location of the BESS installation providing the minimum objective function value. After the BESS installation simulation, three locations providing the minimum objective function values of the GA and PSO are shown in
Table 1. It can be seen that the best location of the BESS installation of both GA and PSO was the 6th bus. The power of the BESS of GA was more than that of PSO of about 0.01 MW while the energy capacity of GA was less than that of PSO at around 0.75 MWh. The lifetime of the BESS of each algorithm was equal to 8.8 years.
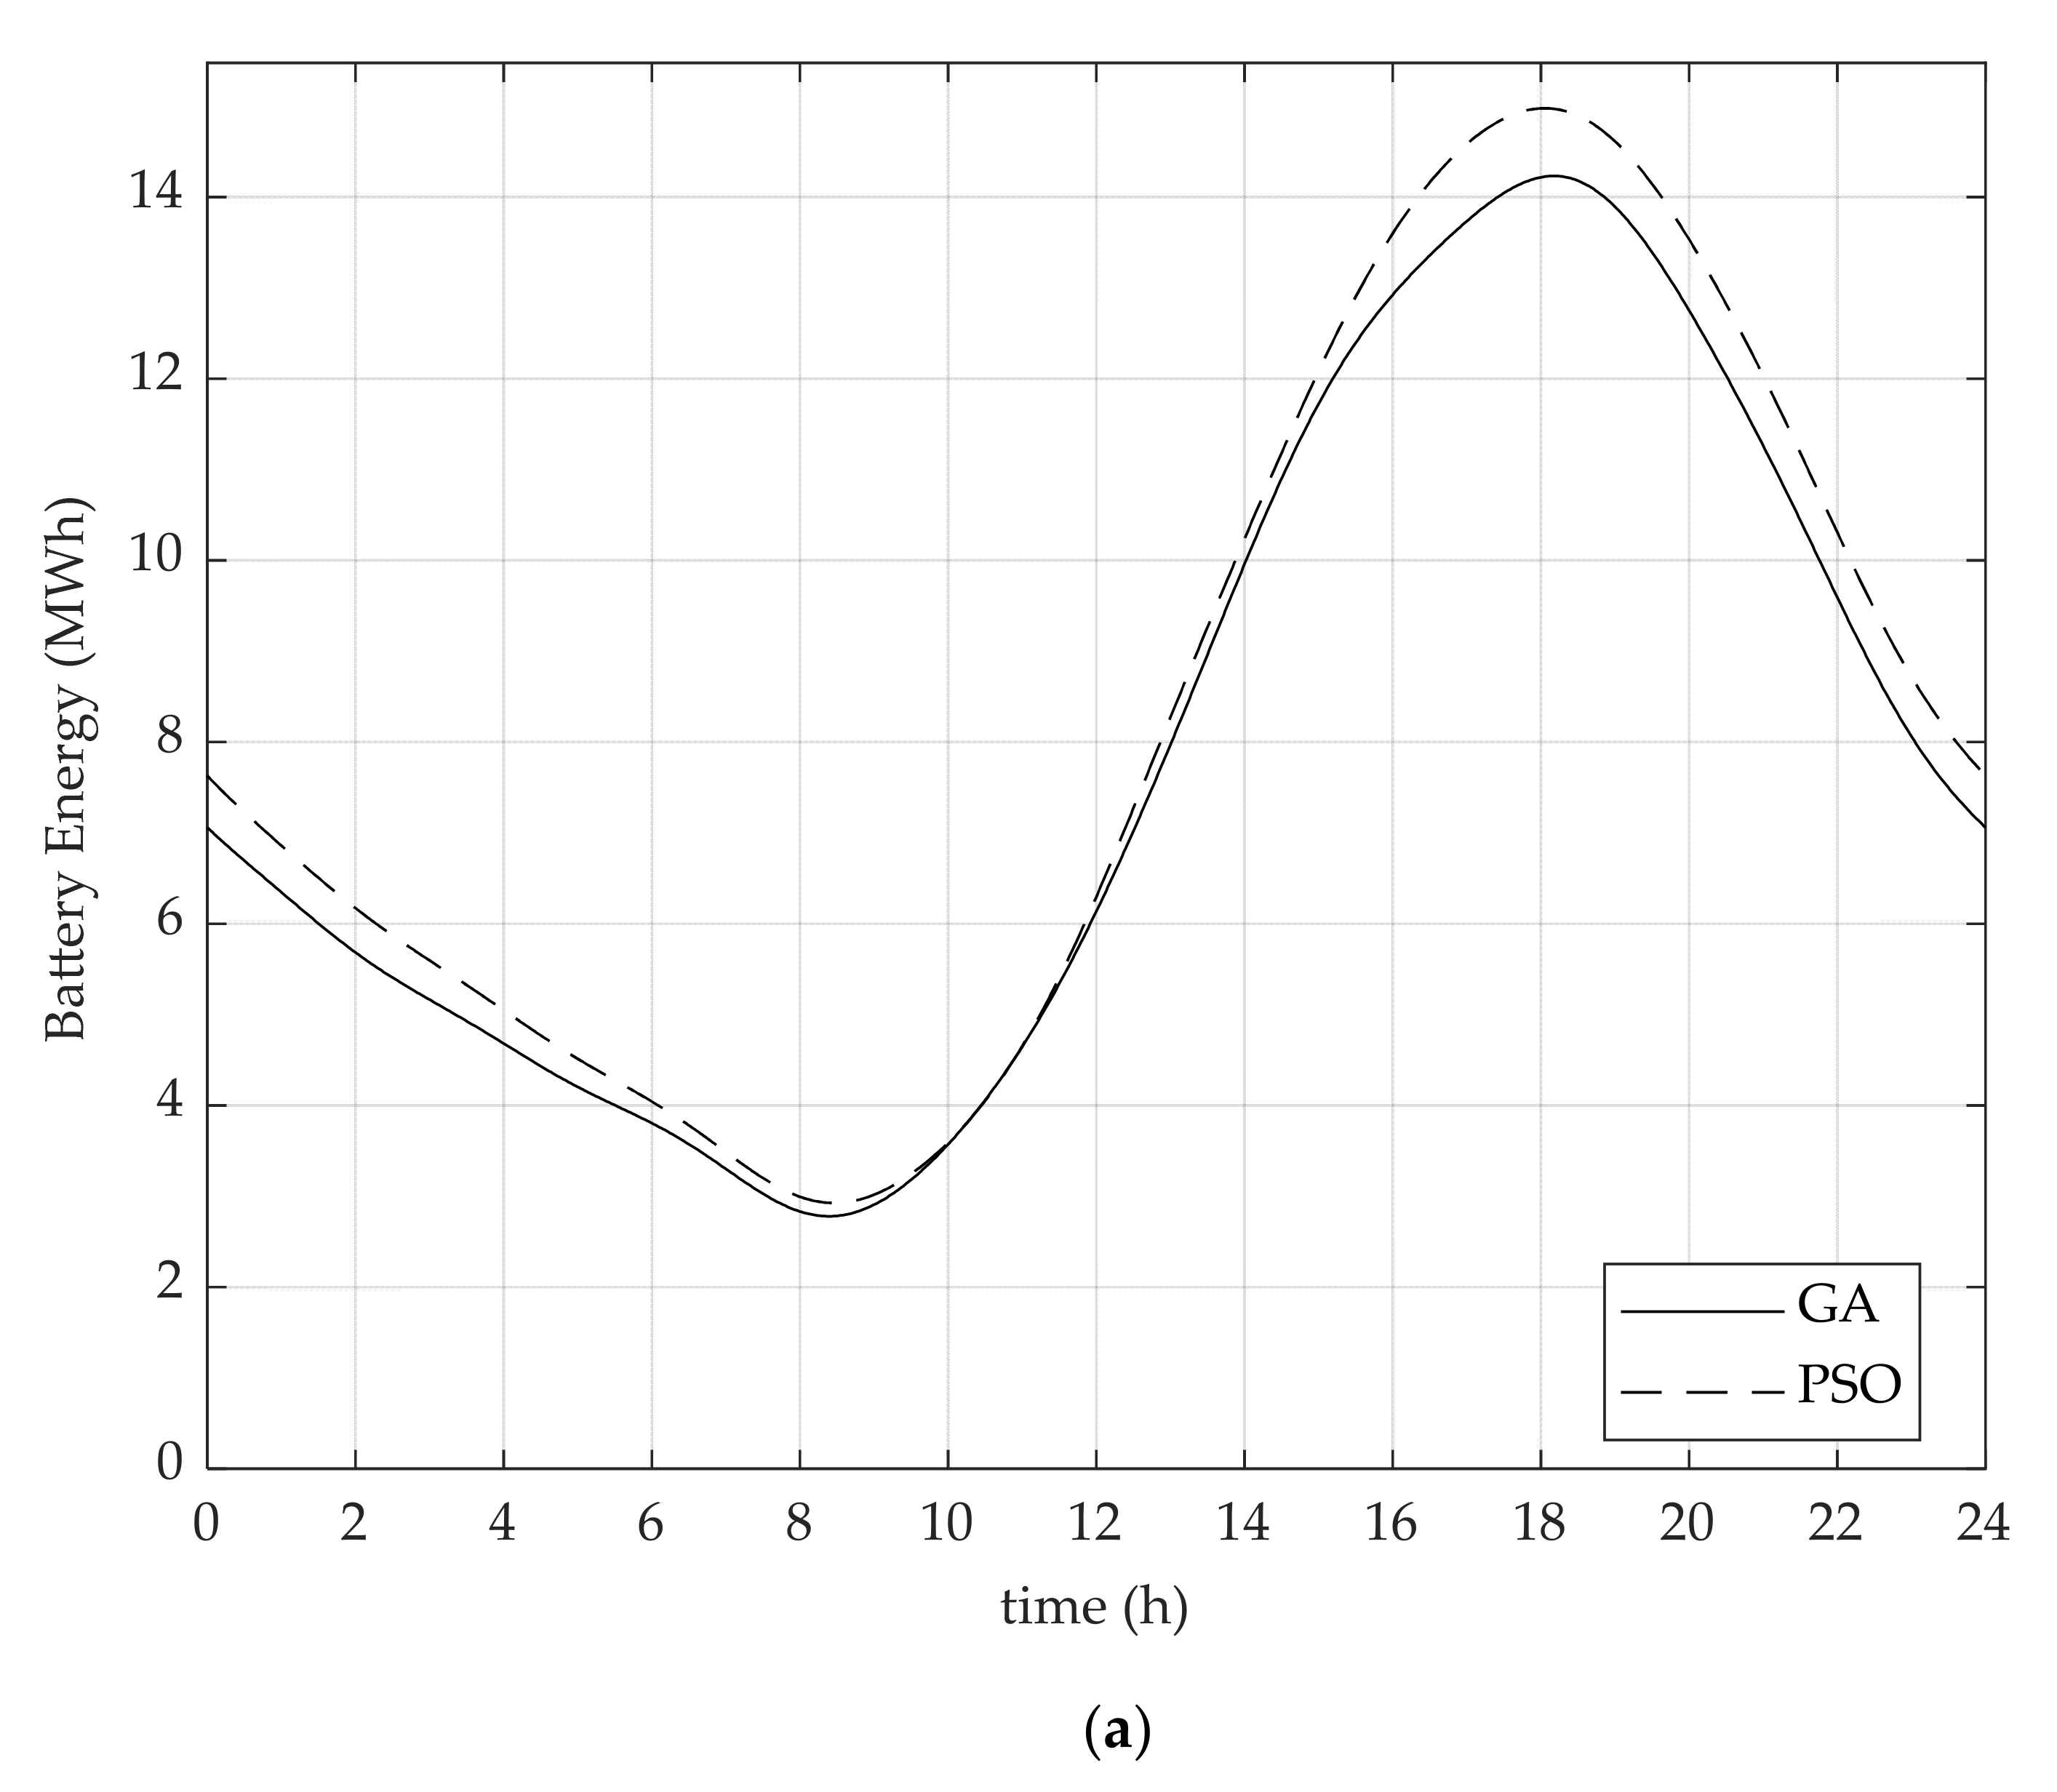
In addition to obtaining the optimal siting and sizing of the BESS, the appropriate operation of the BESS is also important to consider. From
Figure 3a, the state of energy (SOE) of the BESS indicating the stored energy in the BESS for 24 h is illustrated. The power of the BESS is shown in
Figure 3b, presenting the charging rate or discharging rate of the BESS at each hour. It was noticeable that from 1 a.m. to 8 a.m., the energy of thee BESS gradually decreased because the BESS was in a discharging state at a low rate, and energy was at the minimum capacity from 8 a.m. to 9 a.m. From 9 a.m. to 6 p.m., the BESS changed status from discharging state to charging state, and during this time, the BESS had a maximum charging rate that was equal to 1.99 MW at 2 p.m. for GA and 1.98 MW at 1 p.m. for PSO. The BESS changed status again from 6 p.m. to 12 p.m. where a maximum discharging rate occurred at 10 p.m. for both GA and PSO that was equal to 1.67 MW for GA and 1.73 MW for PSO.
5.2. Comparison of Voltage Deviation and Power Losses before and after the BESS Installation
After the BESS installation at the 6th bus, it was found that the value of
%VDI was maximum at the 33rd bus for the base case (without BESS), GA, and PSO at 6.50%, 4.23%, and 4.22%, respectively. The
%VDI values of the overall distribution network for all three cases are expressed in
Table 2. The BESS installation by using PSO gave the minimum
%VDI value, which means that PSO could better improve the voltage profile in the distribution network than those of the base case and GA. In
Figure 4, the voltage profiles at the 33rd bus for 24 h for all three cases are presented to show how the voltage profile was improved when the BESS was installed by comparing the performance of GA and PSO to the base case. It was observed that the voltage profile of the distribution network was below the lower limit for the base case while it was improved to be within the constraint after the installation of the BESS for both GA and PSO. For the power losses shown in
Table 2, it was noticed that power losses could be significantly reduced after the BESS installation compared to the base case. It could also be noticed that the BESS installation by GA provided the minimum values of active power and apparent power while the reactive power loss obtained from GA was equal to that of PSO. However, the power losses obtained from GA and PSO after the BESS installation were slightly different.
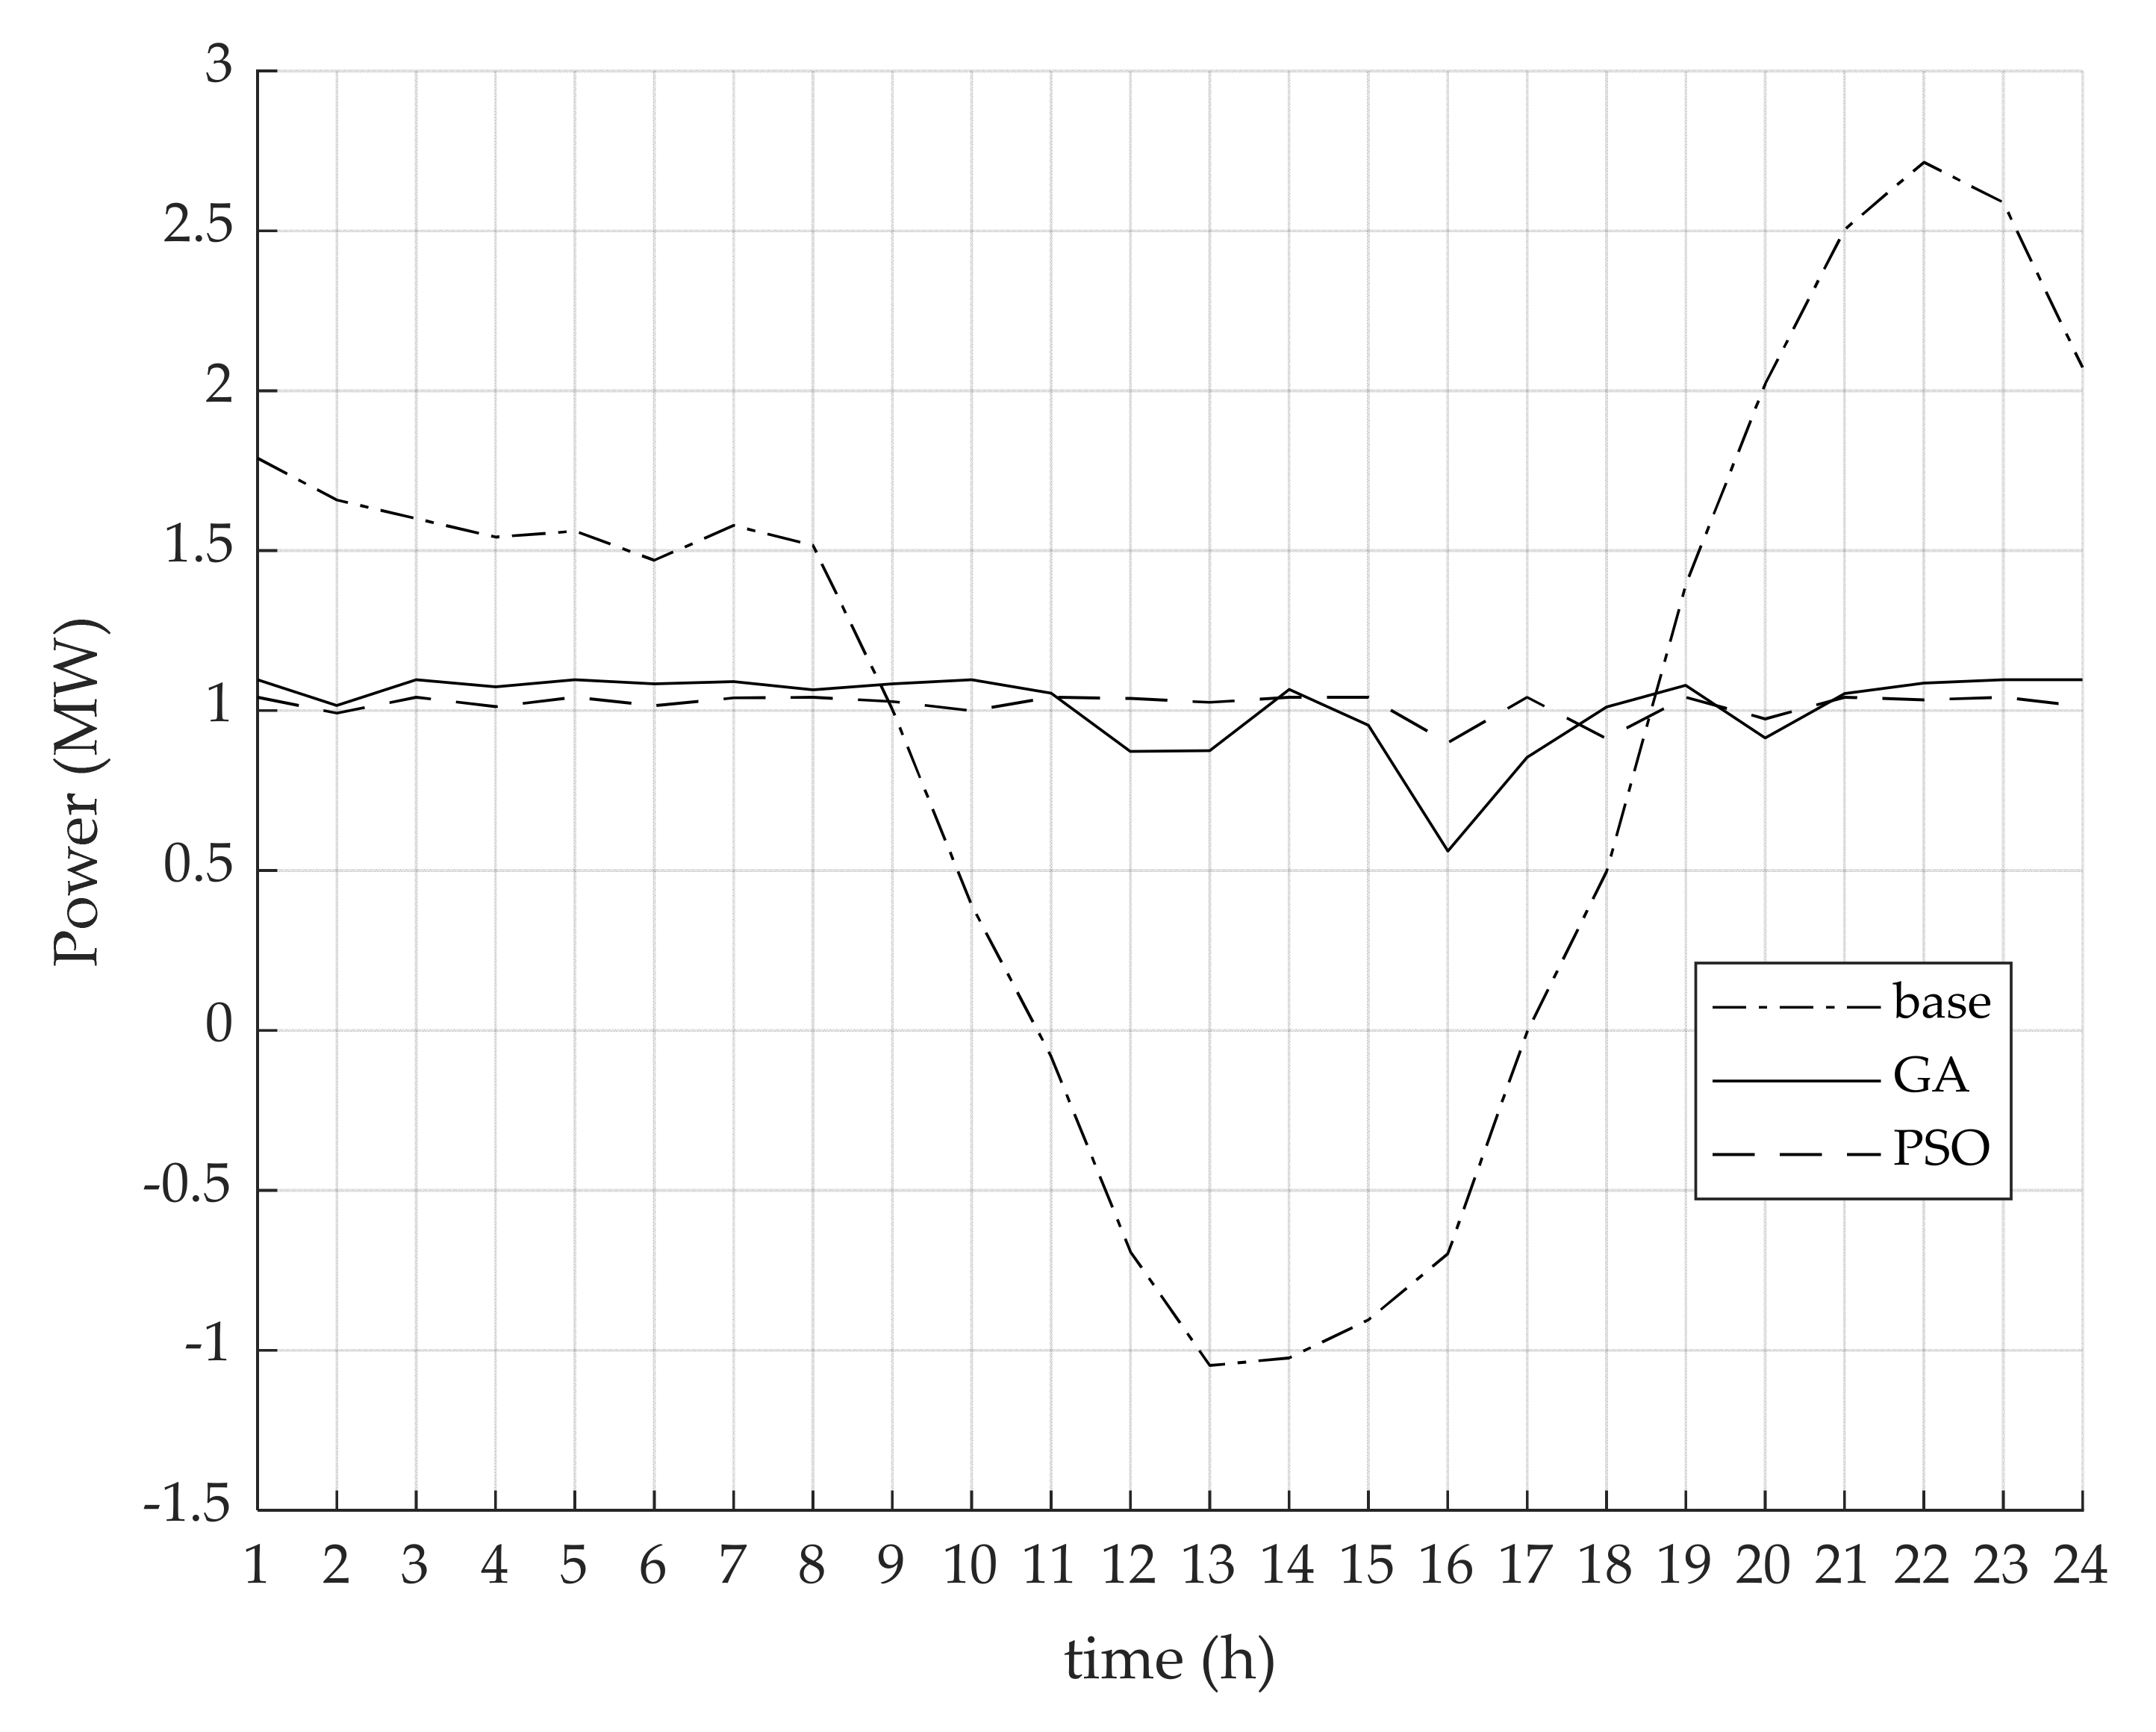
5.3. Comparison of Peak Demand
In this work, the peak demand was considered in terms of the active power flowing at the slack bus. The higher peak demand represents the higher power flow in the transmission line, so the transmission line of the distribution network needs to be able to support the high power flow in the transmission line. However, if the peak demand can be reduced, the power flow in the transmission line is also decreased. This results in a longer time to improve the transmission line for supporting the higher peak demand in the future.
Figure 5 compares the peak demand provided by the base case and presents how the peak demand can be improved after installing a BESS by using GA and PSO. It can be seen in
Figure 5 that power flowed in both directions (into and out from the network) for the base case. The maximum active power that was equal to 2.71 MW at 10 p.m. flows into the network, and the maximum active power which was equal to −1.05 MW at 1 p.m. flowed out from the network. After the BESS installation, the active power flow had only one direction (only positive value), which flowed into the distribution network for all 24 h for both GA and PSO. The maximum active power provided by GA was 1.10 MW at 10 a.m. and 1.04 MW at 7 p.m. for PSO, which is depicted in
Figure 5. Thus, the BESS installation by using PSO could reduce the peak demand more than that of the GA.
5.4. The Efficiency Comparison between GA and PSO for the Objective Function Optimization
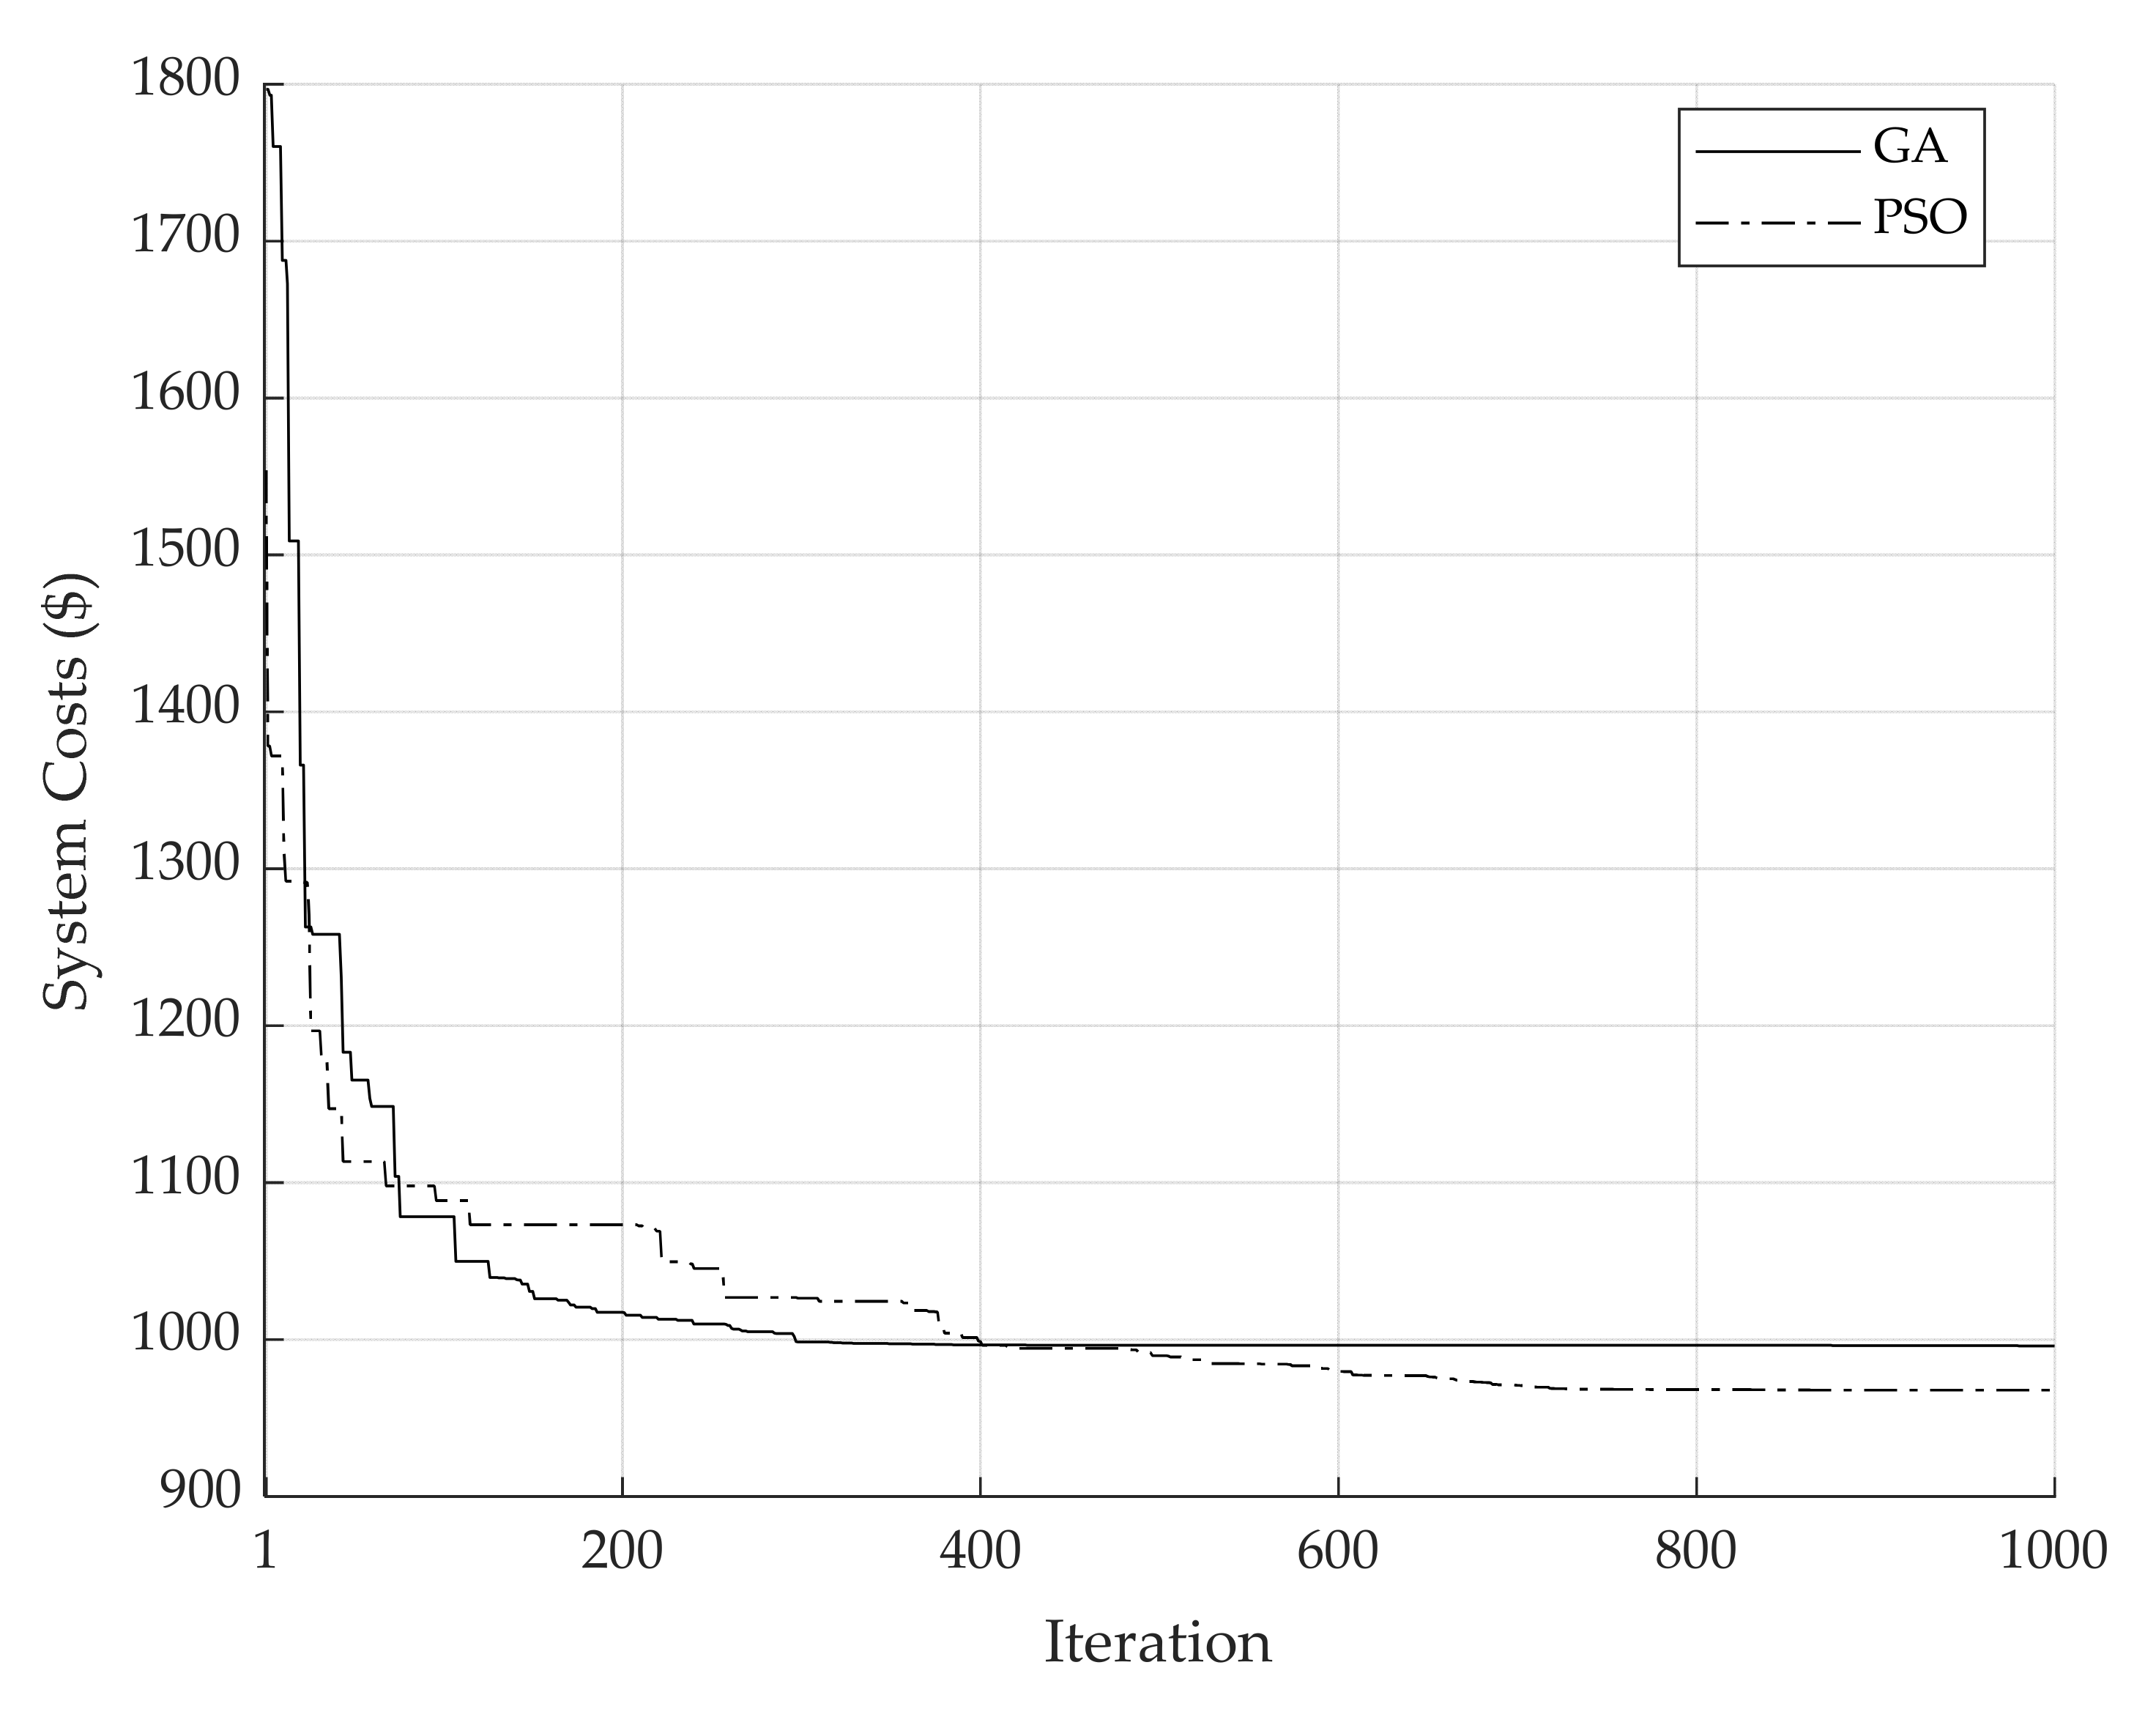
The result comparison of the efficiency for providing the minimum value of the objective function between GA and PSO are shown as the iteration curves in
Figure 6. It was observed that during the 0–400 iterations, GA could more quickly find the less objective function value than PSO, but the values were slightly different. After that, the objective value of GA almost remained constant while the objective value of PSO continued decreasing until the 800th iteration before facing a very small decrease until the maximum iteration. At the maximum iteration, PSO could obtain a superior objective value to that of GA, as evident in
Table 3. When comparing the number of iterations and the operation time of each algorithm used for the optimization process, it was found that PSO took less time than that of GA, as presented in
Table 3. Thus, regarding the overall efficiency for providing the minimum value of the objective function for the considered problem, PSO is more appropriate than GA in terms of both objective value and operation time.
After the simulation of the BESS installation in the IEEE 33-bus distribution network with RES by using GA and PSO, the optimal siting of the BESS installation was the 6th bus obtained by both GA and PSO. The size of the BESS was 1.99 MW power and 14.23 MWh capacity provided by GA and 1.98 MW power and 14.98 MWh capacity provided by PSO. It could be observed that the size of the electric power and electric power capacity of the BESS provided by both algorithms had similar values. Thus, the optimal siting and sizing of the BESS for the distribution networks could be chosen by considering the minimum objective value that PSO can find as a better objective value than that of GA. For the BESS operation, it was noticeable that charging and discharging statuses given by GA and PSO for all 24 h were similar, and the electric powers of charging or discharging provided by GA and PSO were slightly different in each time duration.
After the BESS installation by using GA or PSO, it was found that the voltage level in the system could be improved to be in the range of the constraint (±5%), and the voltage deviation was enhanced compared to the base case. Additionally, power losses including active, reactive, and apparent power losses were significantly decreased when compared with the base case. In terms of the peak demand by considering power flow at the slack bus, it could be seen that after the installation of BESS, the power only flowed into the distribution network (one direction) while the power flowed into and out from the network for the base case. This is because the charging and discharging operations of the BESS could balance between the electricity generation and demand. Therefore, the investment in the distribution network expansion to support the increasing electricity demands in the future can be retarded by using the BESS installation.
To compare the efficiency of GA and PSO to solve the problem, the minimum objective function value and operation time were evaluated. From the simulation results, it was found that PSO could provide better objective value than that of GA. PSO also spent less optimization operation time than that of GA to provide the better final solution at the maximum iteration. Therefore, PSO is more appropriate than GA for solving the problem in this work.
6. Conclusions
The optimal siting and sizing of BESS in the distribution network with RESs was presented. The objective function considered to be minimized is the total costs incurred in the distribution network consisting of the costs of voltage deviations, power losses, and peak demands. The BESS installation was operated in an IEEE 33-bus distribution network by using the GA and PSO algorithm for optimizing the objective function, and the results received from both algorithms were compared to verify the accuracy. The results provided by both GA and PSO showed that the BESS installation could improve the efficiency of the distribution network in terms of cost minimization, the reduction of voltage deviations, power losses, and peak demand. It can also well support the RES connection that has a fluctuation in electricity generations. It was also found that PSO is more efficient than GA in terms of the objective function optimization for this problem.
Author Contributions
Conceptualization, P.B., A.S., P.F., and S.K.; Software, P.B.; Validation, P.B., A.S., and S.K.; Formal Analysis, P.B. and S.K.; Investigation, P.B. and S.K.; Resources, P.B.; Data Curation, P.B.; Writing—Original Draft Preparation, P.B. and S.K.; Writing—Review & Editing, P.B., A.S., and S.K.; Visualization, P.B.; Supervision, A.S. and S.K.; Project Administration, A.S. All authors have read and agreed to the published version of the manuscript.
Funding
This research was funded by the Provincial Electricity Authority (PEA) of Thailand.
Acknowledgments
Authors would like to acknowledge Pradit Fuangfoo for his helpful technical discussions.
Conflicts of Interest
The authors declare no conflict of interest.
References
- Yi, W.; Zhang, Y.; Zhao, Z.; Huang, Y. Multiobjective Robust Scheduling for Smart Distribution Grids: Considering Renewable Energy and Demand Response Uncertainty. IEEE Access 2018, 6, 45715–45723. [Google Scholar] [CrossRef]
- Mortazavi, H.; Mehrjerdi, H.; Saad, M.; Lefebvre, S.; Asber, D.; Lenoir, L. A Monitoring Technique for Reversed Power Flow Detection with High PV Penetration Level. IEEE Trans. Smart Grid 2015, 6, 2221–2232. [Google Scholar] [CrossRef]
- Khani, H.; El-Taweel, N.; Farag, H.E.Z. Real-time optimal management of reverse power flow in integrated power and gas distribution grids under large renewable power penetration. IET Gener. Transm. Distrib. 2018, 12, 2325–2331. [Google Scholar] [CrossRef]
- Méndez Quezada, V.H.; Rivier Abbad, J.; Gómez San Román, T. Assessment of energy distribution losses for increasing penetration of distributed generation. IEEE Trans. Power Syst. 2006, 21, 533–540. [Google Scholar] [CrossRef]
- Laugs, G.A.H.; Benders, R.M.J.; Moll, H.C. Balancing responsibilities: Effects of growth of variable renewable energy, storage, and undue grid interaction. Energy Policy 2020, 139. [Google Scholar] [CrossRef]
- Krata, J.; Saha, T.K. Real-Time Coordinated Voltage Support with Battery Energy Storage in a Distribution Grid Equipped with Medium-Scale PV Generation. IEEE Trans. Smart Grid 2019, 10, 3486–3497. [Google Scholar] [CrossRef]
- Zhang, Y.; Meng, K.; Luo, F.; Yang, H.; Zhu, J.; Dong, Z.Y. Multi-agent-based voltage regulation scheme for high photovoltaic penetrated active distribution networks using battery energy storage systems. IEEE Access 2020, 8, 7323–7333. [Google Scholar] [CrossRef]
- Alzahrani, A.; Alharthi, H.; Khalid, M. Minimization of power losses through optimal battery placement in a distributed network with high penetration of photovoltaics. Energies 2019, 13, 140. [Google Scholar] [CrossRef] [Green Version]
- Wong, L.A.; Ramachandaramurthy, V.K.; Walker, S.L.; Taylor, P.; Sanjari, M.J. Optimal placement and sizing of battery energy storage system for losses reduction using whale optimization algorithm. J. Energy Storage 2019, 26, 100892. [Google Scholar] [CrossRef]
- Da Costa, J.A.; Branco, D.A.C.; Filho, M.C.P.; De Medeiros, M.F.; da Silva, N.F. Optimal sizing of photovoltaic generation in radial distribution systems using Lagrange multipliers. Energies 2019, 12, 1728. [Google Scholar] [CrossRef] [Green Version]
- Nor, N.M.; Ali, A.; Ibrahim, T.; Romlie, M.F. Battery Storage for the Utility-Scale Distributed Photovoltaic Generations. IEEE Access 2017, 6, 1137–1154. [Google Scholar] [CrossRef]
- Zhang, Y.; Campana, P.E.; Lundblad, A.; Yan, J. Comparative study of hydrogen storage and battery storage in grid connected photovoltaic system: Storage sizing and rule-based operation. Appl. Energy 2017, 201, 397–411. [Google Scholar] [CrossRef]
- Sardi, J.; Mithulananthan, N.; Gallagher, M.; Hung, D.Q. Multiple community energy storage planning in distribution networks using a cost-benefit analysis. Appl. Energy 2017, 190, 453–463. [Google Scholar] [CrossRef]
- Jayasekara, N.; Member, S.; Masoum, M.A.S.; Member, S.; Wolfs, P.J.; Member, S. Optimal Operation of Distributed Energy Storage Systems to Improve Distribution Network Load and Generation Hosting Capability. IEEE Trans. Sustain. Energy 2016, 7, 250–261. [Google Scholar] [CrossRef]
- Das, C.K.; Bass, O.; Kothapalli, G.; Mahmoud, T.S.; Habibi, D. Optimal placement of distributed energy storage systems in distribution networks using artificial bee colony algorithm. Appl. Energy 2018, 232, 212–228. [Google Scholar] [CrossRef]
- Das, C.K.; Bass, O.; Mahmoud, T.S.; Kothapalli, G.; Mousavi, N.; Habibi, D.; Masoum, M.A.S. Optimal allocation of distributed energy storage systems to improve performance and power quality of distribution networks. Appl. Energy 2019, 252, 113468. [Google Scholar] [CrossRef]
- Awad, A.S.A.; EL-Fouly, T.H.M.; Salama, M.M.A. Optimal ESS Allocation for Benefit Maximization in Distribution Networks. IEEE Trans. Smart Grid 2017, 8, 1668–1678. [Google Scholar] [CrossRef]
- Naidji, I.; Ben Smida, M.; Khalgui, M.; Bachir, A.; Li, Z.; Wu, N. Efficient allocation strategy of energy storage systems in power grids considering contingencies. IEEE Access 2019, 7, 186378–186392. [Google Scholar] [CrossRef]
- Nick, M.; Cherkaoui, R.; Paolone, M. Optimal allocation of dispersed energy storage systems in active distribution networks for energy balance and grid support. IEEE Trans. Power Syst. 2014, 29, 2300–2310. [Google Scholar] [CrossRef]
- Zheng, Y.; Dong, Z.Y.; Luo, F.J.; Meng, K.; Qiu, J.; Wong, K.P. Optimal allocation of energy storage system for risk mitigation of discos with high renewable penetrations. IEEE Trans. Power Syst. 2014, 29, 212–220. [Google Scholar] [CrossRef]
- Atwa, Y.M.; El-Saadany, E.F. Optimal allocation of ESS in distribution systems with a high penetration of wind energy. IEEE Trans. Power Syst. 2010, 25, 1815–1822. [Google Scholar] [CrossRef]
- Zhang, B.; Dehghanian, P.; Kezunovic, M. Optimal Allocation of PV Generation and Battery Storage for Enhanced Resilience. IEEE Trans. Smart Grid 2019, 10, 535–545. [Google Scholar] [CrossRef]
- Fernández-Blanco, R.; Dvorkin, Y.; Xu, B.; Wang, Y.; Kirschen, D.S. Optimal Energy Storage Siting and Sizing: A WECC Case Study. IEEE Trans. Sustain. Energy 2017, 8, 733–743. [Google Scholar] [CrossRef]
- Khaboot, N.; Srithapon, C.; Siritaratiwat, A.; Khunkitti, P. Increasing benefits in high PV penetration distribution system by using battery enegy storage and capacitor placement based on salp swarm algorithm. Energies 2019, 12, 4817. [Google Scholar] [CrossRef] [Green Version]
- Gong, Q.; Wang, Y.; Fang, J.; Qiao, H.; Liu, D. Optimal configuration of the energy storage system in ADN considering energy storage operation strategy and dynamic characteristic. IET Gener. Transm. Distrib. 2020, 14, 1005–1011. [Google Scholar] [CrossRef]
- Zheng, Y.; Zhao, J.; Song, Y.; Luo, F.; Meng, K.; Qiu, J.; Hill, D.J. Optimal Operation of Battery Energy Storage System Considering Distribution System Uncertainty. IEEE Trans. Sustain. Energy 2018, 9, 1051–1060. [Google Scholar] [CrossRef]
- Luo, L.; Abdulkareem, S.S.; Rezvani, A.; Miveh, M.R.; Samad, S.; Aljojo, N.; Pazhoohesh, M. Optimal scheduling of a renewable based microgrid considering photovoltaic system and battery energy storage under uncertainty. J. Energy Storage 2020, 28, 101306. [Google Scholar] [CrossRef]
- International Renewable Energy Agency (IRENA). Electricity Storage and Renewables: Costs and Markets to 2030; IRENA: Abu Dhabi, UAE, 2017; ISBN 978-92-9260-038-9. [Google Scholar]
- De Lorenzo, G.; Andaloro, L.; Sergi, F.; Napoli, G.; Ferraro, M.; Antonucci, V. Numerical simulation model for the preliminary design of hybrid electric city bus power train with polymer electrolyte fuel cell. Int. J. Hydrogen Energy 2014, 39, 12934–12947. [Google Scholar] [CrossRef]
- De Luca, D.; Fragiacomo, P.; De Lorenzo, G.; Czarnetski, W.T.; Schneider, W. Strategies for Dimensioning Two-Wheeled Fuel Cell Hybrid Electric Vehicles Using Numerical Analysis Software. Fuel Cells 2016, 16, 628–639. [Google Scholar] [CrossRef]
- Fragiacomo, P.; Astorino, E.; Chippari, G.; De Lorenzo, G.; Czarnetzki, W.T.; Schneider, W. Dynamic modeling of a hybrid electric system based on an anion exchange membrane fuel cell. Cogent Eng. 2017, 4, 1357891. [Google Scholar] [CrossRef]
- Figgener, J.; Stenzel, P.; Kairies, K.P.; Linßen, J.; Haberschusz, D.; Wessels, O.; Angenendt, G.; Robinius, M.; Stolten, D.; Sauer, D.U. The development of stationary battery storage systems in Germany—A market review. J. Energy Storage 2020, 29, 101153. [Google Scholar] [CrossRef]
- Tsiropoulos, I.; Tarvydas, D.; Lebedeva, N. Li-Ion Batteries for Mobility and Stationary Storage Applications; Publications Office of the European Union: Luxembourg, 2018; ISBN 978-92-79-97254-6. [Google Scholar]
- Lu, L.; Han, X.; Li, J.; Hua, J.; Ouyang, M. A review on the key issues for lithium-ion battery management in electric vehicles. J. Power Sources 2013, 226, 272–288. [Google Scholar] [CrossRef]
- Han, W.; Zou, C.; Zhou, C.; Zhang, L. Estimation of Cell SOC Evolution and System Performance in Module-based Battery Charge Equalization Systems. IEEE Trans. Smart Grid 2018, 10, 4717–4728. [Google Scholar] [CrossRef]
- Boeringer, D.W.; Werner, D.H. Particle swarm optimization versus genetic algorithms for phased array synthesis. IEEE Trans. Antennas Propag. 2004, 52, 771–779. [Google Scholar] [CrossRef]
- Zimmerman, R.D.; Murillo-Sánchez, C.E. Matpower User’s Manual; Power Systems Engineering Research Center: Tempe, AZ, USA, 2019. [Google Scholar]
- Zimmerman, R.D.; Murillo-Sánchez, C.E. Matpower Optimal Scheduling Tool MOST 1.0.2 User’s Manual; Power Systems Engineering Research Center: Tempe, AZ, USA, 2019. [Google Scholar]
- Wolfs, P.; Jayasekera, N.; Subawickrama, S. A Fourier series based approach to the periodic optimisation of finely dispersed battery storage. In Proceedings of the AUPEC 2011, Brisbane, Australia, 25–28 September 2011; pp. 1–6. [Google Scholar]
| Publisher’s Note: MDPI stays neutral with regard to jurisdictional claims in published maps and institutional affiliations. |
© 2020 by the authors. Licensee MDPI, Basel, Switzerland. This article is an open access article distributed under the terms and conditions of the Creative Commons Attribution (CC BY) license (http://creativecommons.org/licenses/by/4.0/).


