Article

Incremental Capacity Analysis as a State of Health Estimation Method for Lithium-Ion Battery Modules with Series-Connected Cells

1
DLR Institute of Networked Energy Systems, Carl-von-Ossietzky-Str. 15, 26129 Oldenburg, Germany
2
Department of Chemistry and uYilo, e-Mobility Technology Innovation Programme, Nelson Mandela University, P.O. Box 77000, Port Elizabeth 6001, South Africa
*
Author to whom correspondence should be addressed.
Submission received: 22 October 2020 / Revised: 14 December 2020 / Accepted: 15 December 2020 / Published: 30 December 2020
(This article belongs to the Special Issue Lithium-Ion Batteries Aging Mechanisms)

Abstract

:
Incremental capacity analysis (ICA) has proven to be an effective tool for determining the state of health (SOH) of Li-ion cells under laboratory conditions. This paper deals with an outstanding challenge of applying ICA in practice: the evaluation of battery series connections. The study uses experimental aging and characterization data of lithium iron phosphate (LFP) cells down to 53% SOH. The evaluability of battery series connections using ICA is confirmed by analytical and experimental considerations for cells of the same SOH. For cells of different SOH, a method for identifying non-uniform aging states on the modules’ IC curve is presented. The findings enable the classification of battery modules with series and parallel connections based on partial terminal data.

1. Introduction

In view of global initiatives to control the effects of greenhouse gas emissions, there have been considerable efforts to reduce the use of fossil fuels as an energy source and to lower carbon dioxide emissions. One of the main initiatives to do this involves switching to a more sustainable energy supply using renewable energy systems. This has become a political, scientific, and social focus-point for many countries. With the increase in the use of renewable energy, there are significant demands for long-term and cost-effective means of not only storing the energy but being able to supply it reliably into the national grid electricity system. Lithium-ion battery storage systems have become one of the important emerging energy storage solutions, used within a diverse field of applications ranging from electric vehicles to smart grid systems [1,2]. Since the storage system or battery is probably the most expensive part of an application, it is important to optimize its lifetime usage as far as possible. Over the lifetime of a battery, its electrochemical properties degrade due to aging mechanisms such as electrolyte decomposition, lithium deposition, or loss of electrical contact in the electrode’s active material. These in turn lead to aging modes that are described in the literature as loss of lithium inventory (LLI), loss of active material (LAM), and resistance increase (RI) [3,4]. In order to estimate the remaining operating time of a battery storage system and to ensure safety and efficiency, it is necessary to determine its state of health (SOH). The SOH refers to the remaining electrical capacity that a battery can achieve at a certain rate and is calculated by the ratio of the actual battery or cell capacity to the nominal capacity. For most applications, the end of life (EOL) of a battery is usually a pre-defined minimum that is specified as an achievable capacity that allows the battery to still meet and maintain the system’s working requirements before the lower voltage limit is reached. For example, in electric vehicle applications 80% SOH is defined as the EOL [5]. In second life applications, which are usually for stationary type systems, an EOL of 60% is sometimes set as the requirement. Lower EOLs are also conceivable, provided that battery failure does not result in a critical thermal event. These events can be unpredictable and be reached relatively quickly, especially in a system in which there are unbalanced cells at various SOHs [6]. It is therefore essential to reliably determine the SOH of a battery module in real-time use and to access to some degree the variations in the single cells’ SOH.
There are currently no uniform opinions in industry and the scientific community as to how best to identify the SOH of batteries in real-time online applications [5]. An experimental method for SOH determination is the incremental capacity analysis (ICA). The incremental capacity (IC) is defined by the derivative of the capacity dQ with respect to the voltage dV:
IC = d Q d V Δ Q Δ V .
In practice, larger voltage and capacity intervals Δ V and Δ Q are often utilized to calculate the IC from measured data. In general, a fixed voltage interval is used for this purpose [7,8,9,10,11]. The evaluation of the IC transforms plateaus observed in the voltage curve into characteristic, clearly identifiable peaks. These peaks represent phase equilibria in both the anode and cathode and thus the chemical processes within the battery. The IC peaks therefore provide information about the electrochemical processes within the cells, which are closely linked to their aging behavior. For this reason, the occurrence of the aging modes RI, LLI, and LAM can be determined, qualified, and quantified by analyzing the incremental capacity curves obtained from a set of cells [3,12,13,14]. Furthermore, the evaluation of the features of interest (FOI) of the IC peaks, which include peak height, area, and position, allows conclusions to be made regarding the capacity and changes in the internal resistance of a battery cell. ICA is suitable for non-destructive SOH determination as it only needs the current, voltage, and temperature data of battery cells or modules. The calculation of the IC curve and the evaluation of the battery SOH also require a low computing effort, which is an advantage over model-based methods like equivalent circuit models that are obtained using electrochemical impendence spectroscopy (EIS). More information about alternative SOH estimation techniques can be found, for example, in an article by Berecibar et al. [5].
Various articles in the literature deal with the implementation of ICA for online applications. Weng et al. [15] used support vector regression (SVR) to generate the IC curves of lithium iron phosphate (LFP) cells and determined the correlation of the peak height with the SOH for eight equally aged cells. The SOHs of seven of these cells were determined based on the reference data obtained from one cell with less than one percent absolute error. Lin et al. [16] first smoothed the data by means of a proposed cubic smoothing spline method, which was further compared to other filtering methods under different voltage window sizes. Subsequently, they demonstrated a SOH estimation method evaluating the IC peak height of LFP cells. In the given examples, the processing and smoothing of the measurement data needed little computational effort, and the limitations of the regions of interest on both the charge and discharge curves in online applications were taken into consideration. Unfortunately, the application of ICA in larger-scale real applications faces further challenges that include the influence of the variation of temperature, which has already been shown multiple times [9,17,18,19] and the evaluation of battery modules. Within modules, cells are always coupled in parallel and/or series in order to meet the energy and power density requirements of the system. Their evaluation poses a challenge since the battery’s SOH is only a collective average of all cells within the module and often relies on the performance of the weakest cell or group of cells. In parallel connections, the unequal distribution of currents between the non-uniform cells affects the formation of the module’s IC peaks since the single cell current could vary over the charging process, even if the total module current remains constant. In a series connection, the individual cell voltages are superimposed onto the overall module’s voltage, which makes it difficult to obtain the true IC curve characteristics of a weaker or stronger cell, respectively. Nevertheless, it is reasonable to aim for the evaluation of the module and single-cell SOH via module data due to time savings, reduction of computational effort or lack of access to single-cell data. Therefore, various studies have investigated the application of ICA for SOH determination on battery modules. Weng et al. [10] showed by means of simulations and experimental investigations that the evaluation of single-cell correlations was also possible in their parallel configuration of LFP batteries. Jiang et al. [20] examined LFP modules consisting of five cells connected in parallel from an aged electric vehicle battery. They found that the height and area of the third IC peak show a linear correlation with the capacity, which was then used for the SOH determination of the modules. Lee et al. [21] applied a single cell linear regression model based on the correlation of the SOH with an appropriate IC curve peak point to the serially connected battery stages of a 12S28P NCA battery. The SOH of the individual series connections could be determined with less than 1% error. The individual evaluation of serially connected batteries or battery packs using ICA is therefore possible. However, the processing and evaluation of the IC curves of each serially connected pack requires a high level of computing effort, especially for large battery packs. Furthermore, it is not always possible to access this data, e.g., in third-party second life modules. Kalogiannis et al. [22] reported on a battery with cells connected in series. They observed that the scaled incremental capacity of a module consisting of series-connected cells with identical capacity corresponded to the average of the IC of the individual cells. However, the influence of different aging states of the cells on the overall module’s ICA remains an open question.
In this work, the evaluation of a module with series-connected cells based on the module data is examined in more detail. On the one hand, the aim is to determine the SOH of a module including cells connected in series by only having to evaluate data within a short specific state of charge (SOC) range, thereby reducing processed data and time. On the other hand, qualitative and quantitative SOH analyses of single-cell SOH differences using the module ICA are discussed. For this purpose, an extensive experimental study was carried out on LFP single cells and their connection within a 12V module. Different single-cell states of health were generated through cyclization with various current rates. The applicability of ICA to modules consisting of cells connected in series was first analytically and then experimentally investigated. Based on these results, a method to classify modules on the basis of their partial terminal data is presented.

2. Experimental

2.1. Cell Specification and Testing System

The cells investigated were prismatic LiFePO4 cells made by the manufacturer Winston with a nominal capacity of 40 Ah. In the module, they were assembled into a 12 V battery consisting of four cells in series. The corresponding cell specifications are listed in Table 1.
Single-cell measurements were performed using a Maccor 4000 series battery tester with measuring channels having 0 A–150 A current and 0 V–8 V voltage range capabilities. During the measurements, the cells were acclimatized at a constant temperature in a Vötsch VC 7018 climatic chamber for three hours before testing. Since the Maccor measuring system is only designed for voltages up to 8 V, a module measuring station was set up. It consisted of a DC-source sink NL1V80C40 from Höcherl & Hackl (Konzell, Germany), having a voltage range of 0 V to 80 V and current range of −40 A to 40 A for cyclization and a suitable battery management system (BMS) for monitoring each cell’s data with the necessary safety limit switches specific for LFP type batteries. Data acquisition was done using a high-resolution data logger 34972A from Keysight Technologies (Santa Rosa, CA, USA). All measured data were recorded with a sampling rate of 1 s.

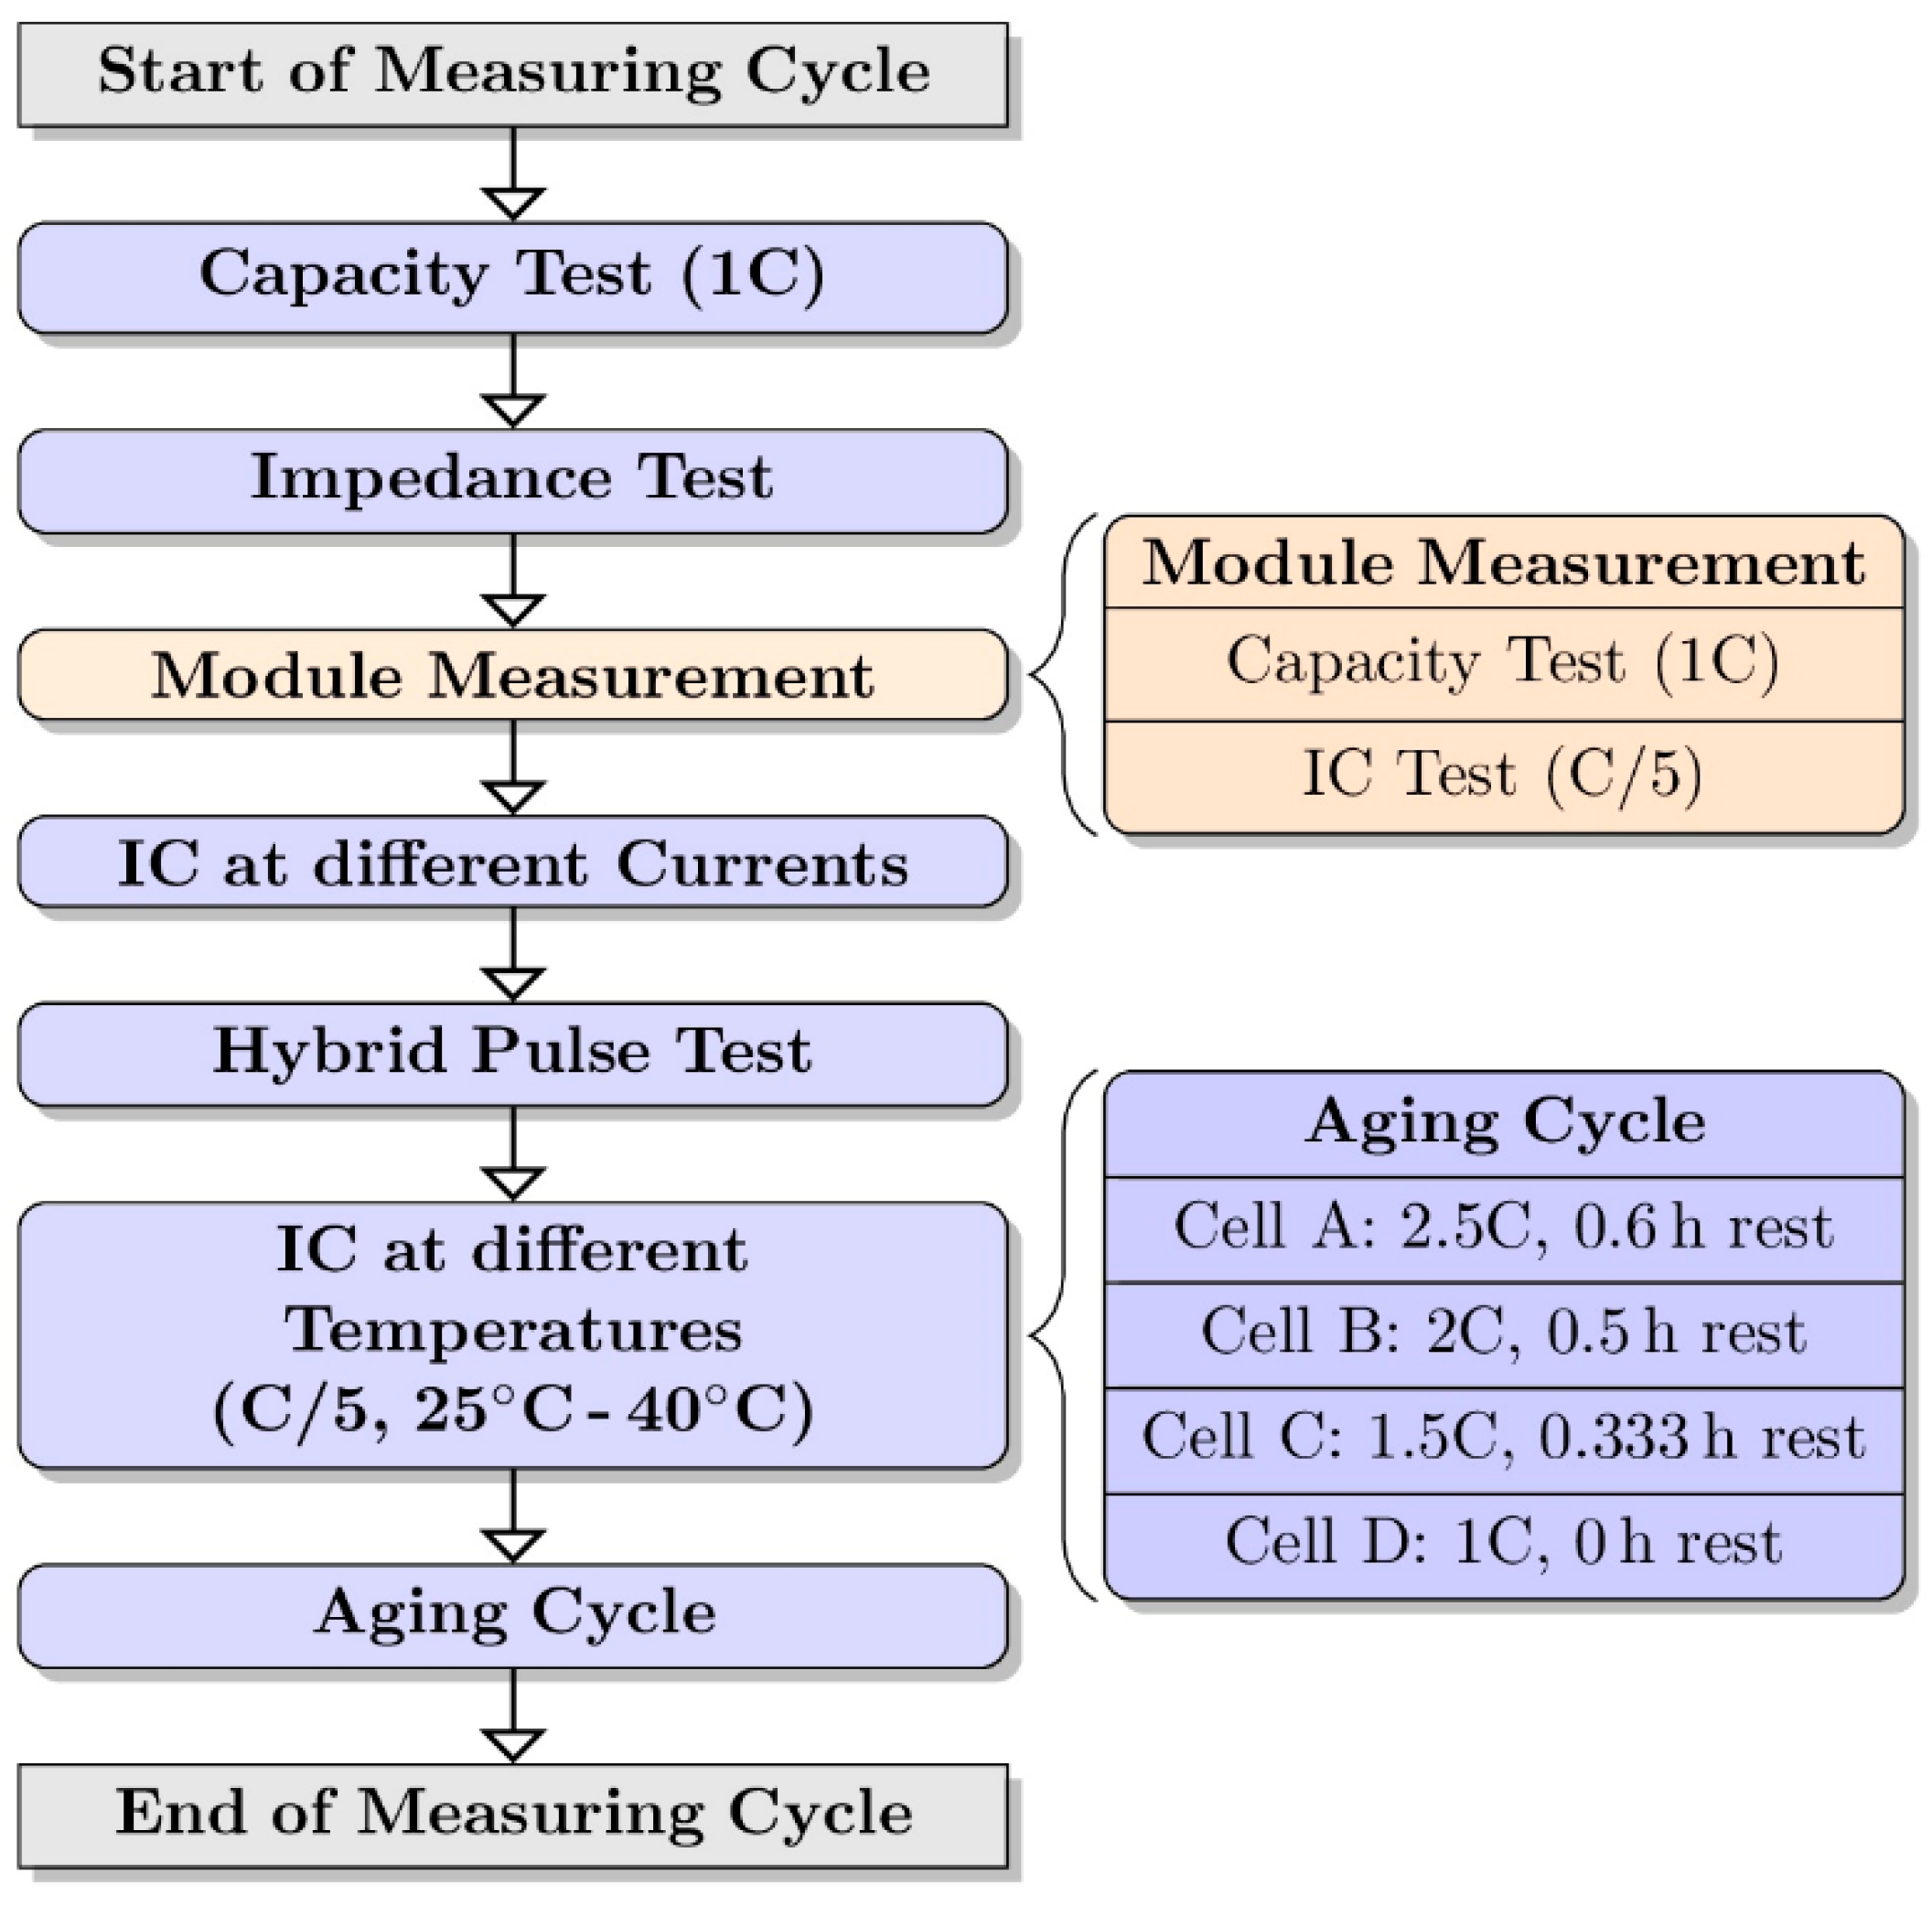
2.2. Cell and Module Characterization

The measuring procedure was divided into three steps: single-cell characterization, module characterization, and single-cell cycle aging. First, the four LFP cells were individually characterized. As part of the single-cell characterization step, an EIS measurement, a capacity test, a hybrid pulse test, and a measurement of the IC at different currents and temperatures were carried out respectively. Second, the single cells were connected in series for the module measurement. The module characterization step was limited to a capacity measurement and an IC measurement at C/5. Finally, the module was disassembled again and the single cells were aged individually. This procedure, henceforth called the measuring cycle, was repeated four times. All tests were done within single-cell voltage ranges between 2.8 V and 3.7 V at ambient temperature (25 °C).
In the results of this article, only the change in capacity and incremental capacity are further evaluated. The details of the considered characterization steps are as follows. The capacity test includes a constant current (CC) charge and discharge cycle at a 1C current rate (40 A) based on the nominal capacity of the battery provided by the supplier. The 12 V module characterization is divided into a measurement of the capacity at 1C and the incremental capacity at C/5. The module measurement was stopped as soon as a single cell reached the voltage limits of 2.8 V upon discharge or 3.7 V upon charge. The voltage limits were maintained throughout the testing and were not adjusted for any temperature variations or current rates. The constant current/constant voltage (CC/CV) step was not used in the recharge steps because in CV mode drifting of the cell voltages would occur, which should be avoided. These limits and conditions were chosen in order to mimic the use of a battery in real life applications that is managed by a simple passive balancing voltage-limiting BMS.

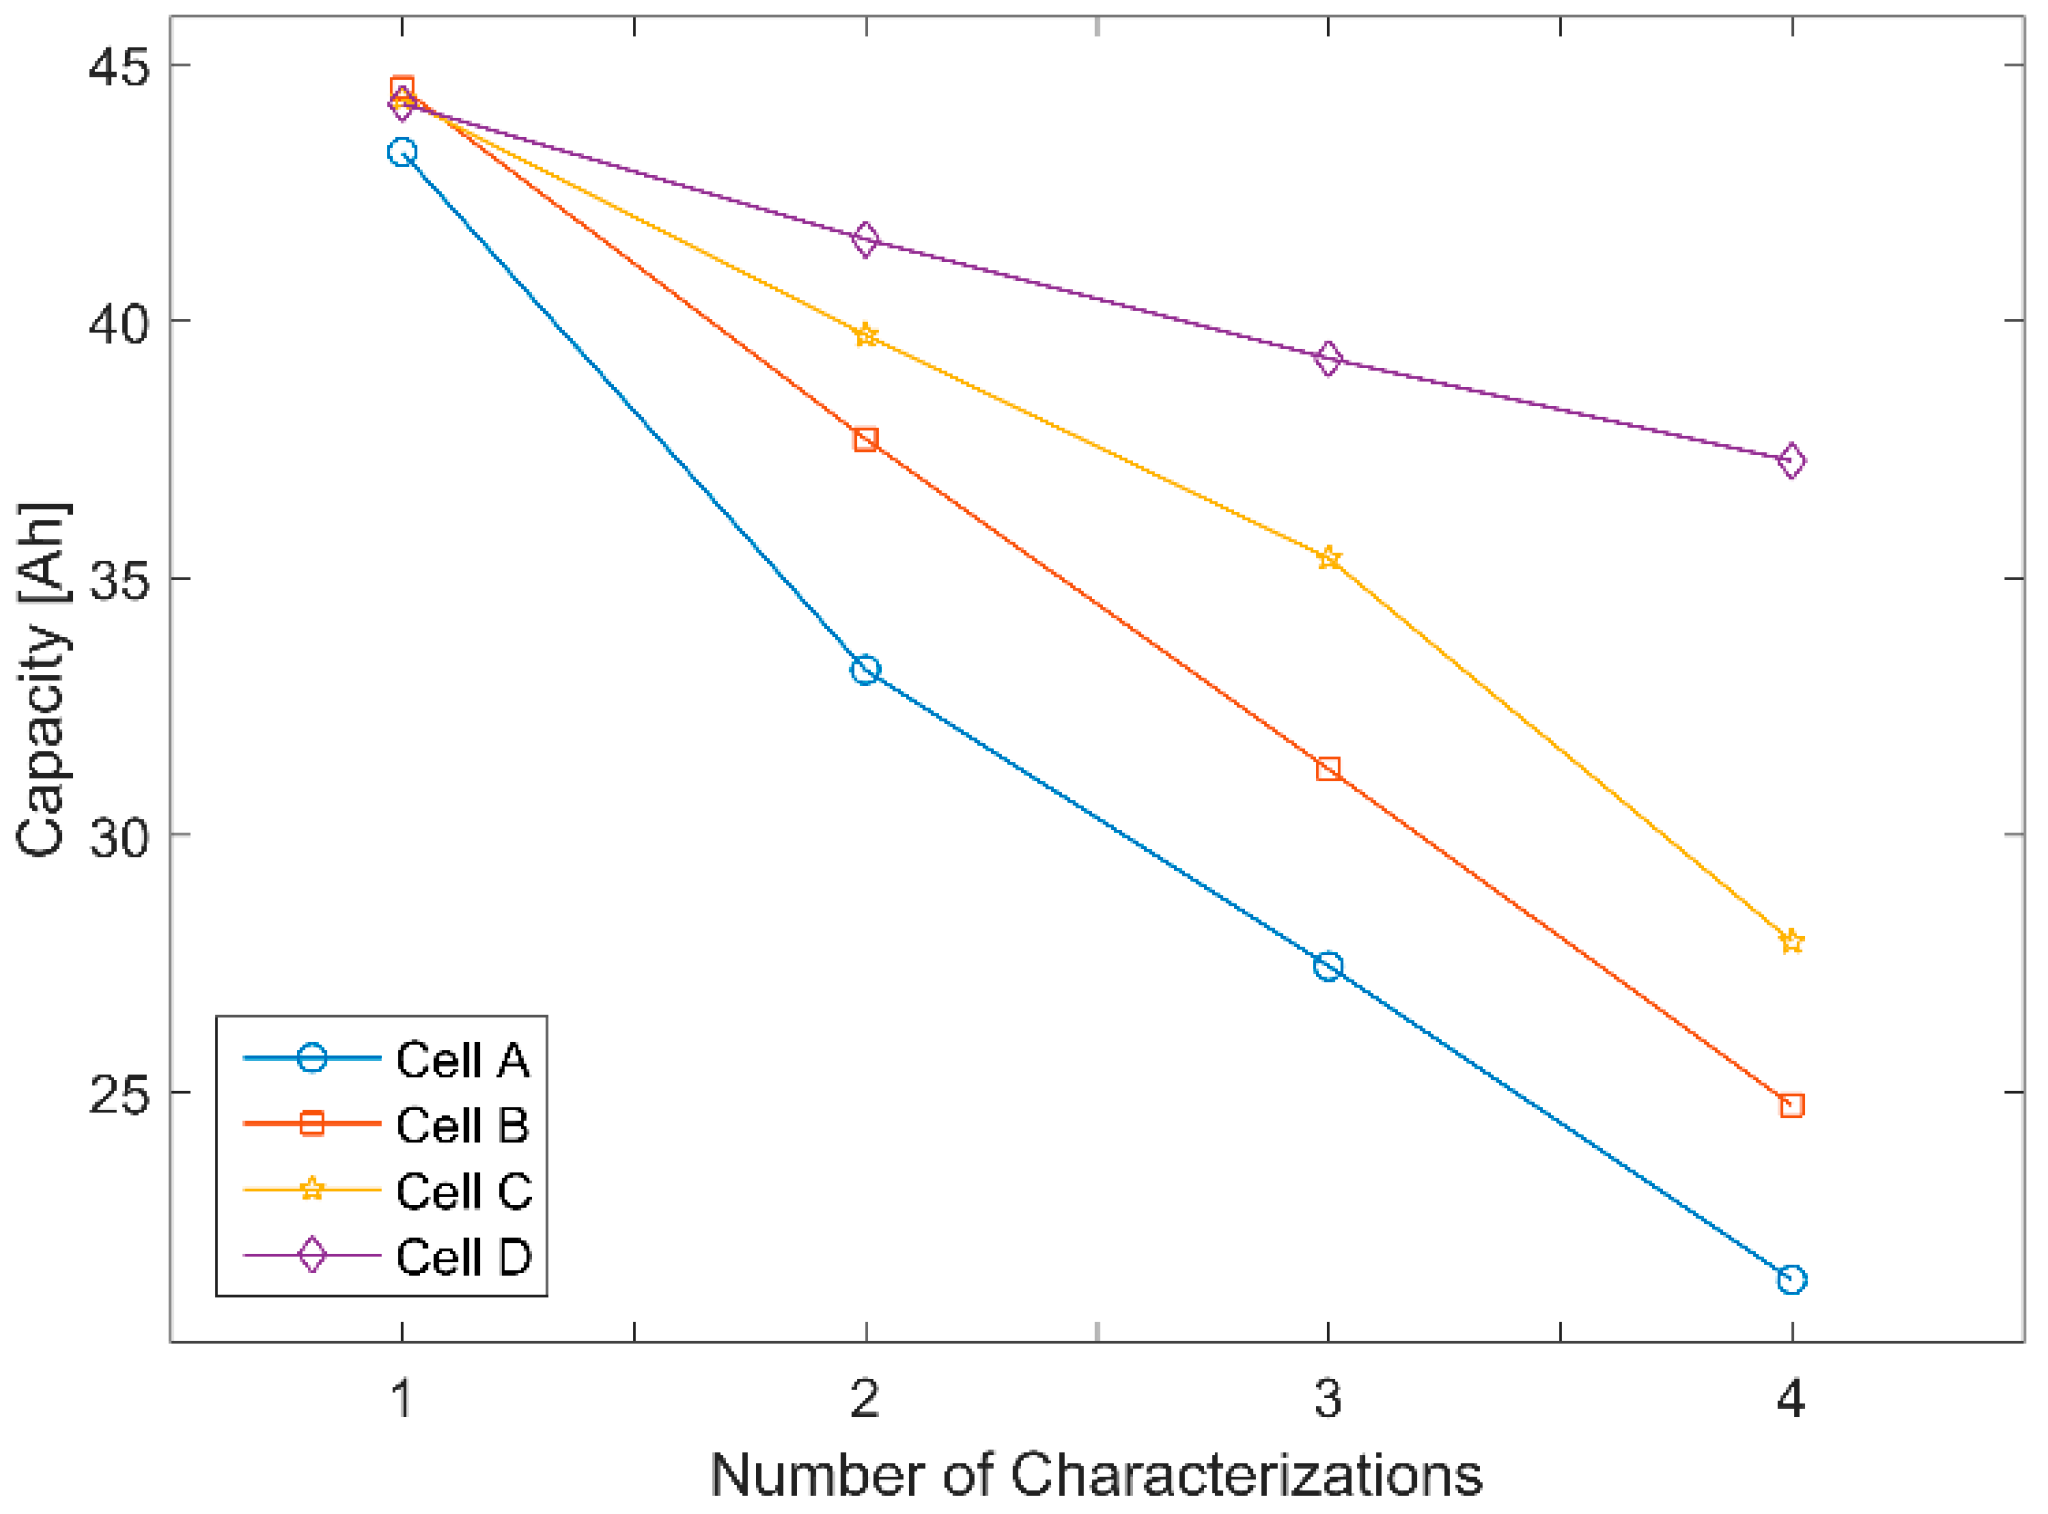
2.3. Cycle Aging Procedure

The aging of batteries depends on many different stress factors, such as the depth of discharge (DOD), the average SOC, the current rate, and the temperature. In this work, the cells were aged using different current rates. Within one aging cycle unit, the cells were charged and discharged at different current rates of 2.5C, 2C, 1.5C, and 1C, respectively. The current rates were chosen to cause fast aging in order to be able to generate significant aging variations in the planned test time. The cells were labeled with the letters A to D (Figure 1). Cell A, with the highest current, could be considered the cell that aged the most and cell D would age the slowest, with the lowest current rate. As the cells A, B, and C heated up to almost 40 °C during discharge, a pause was implemented after each discharge step to enable cooling. The rest periods were adjusted so that the measurements that were performed at the specific current rate end at the same time for all cells studied. The temperature of cell D remained almost constant at 30 °C during the aging sequence, so no pause was inserted between the discharge and the charge step. One aging cycle unit lasted 100 cycles or until a total capacity drop of more than 7 Ah was recorded. The capacity limit was introduced to protect the cell from uncontrolled aging in case of a significant loss of capacity. An overview of the measuring procedure is shown in Figure 1.

3. Results and Discussion

The evaluation of the data was carried out using MatLab®. A fixed voltage interval of 5 mV was used to calculate the single cell IC.

3.1. Incremental Capacity

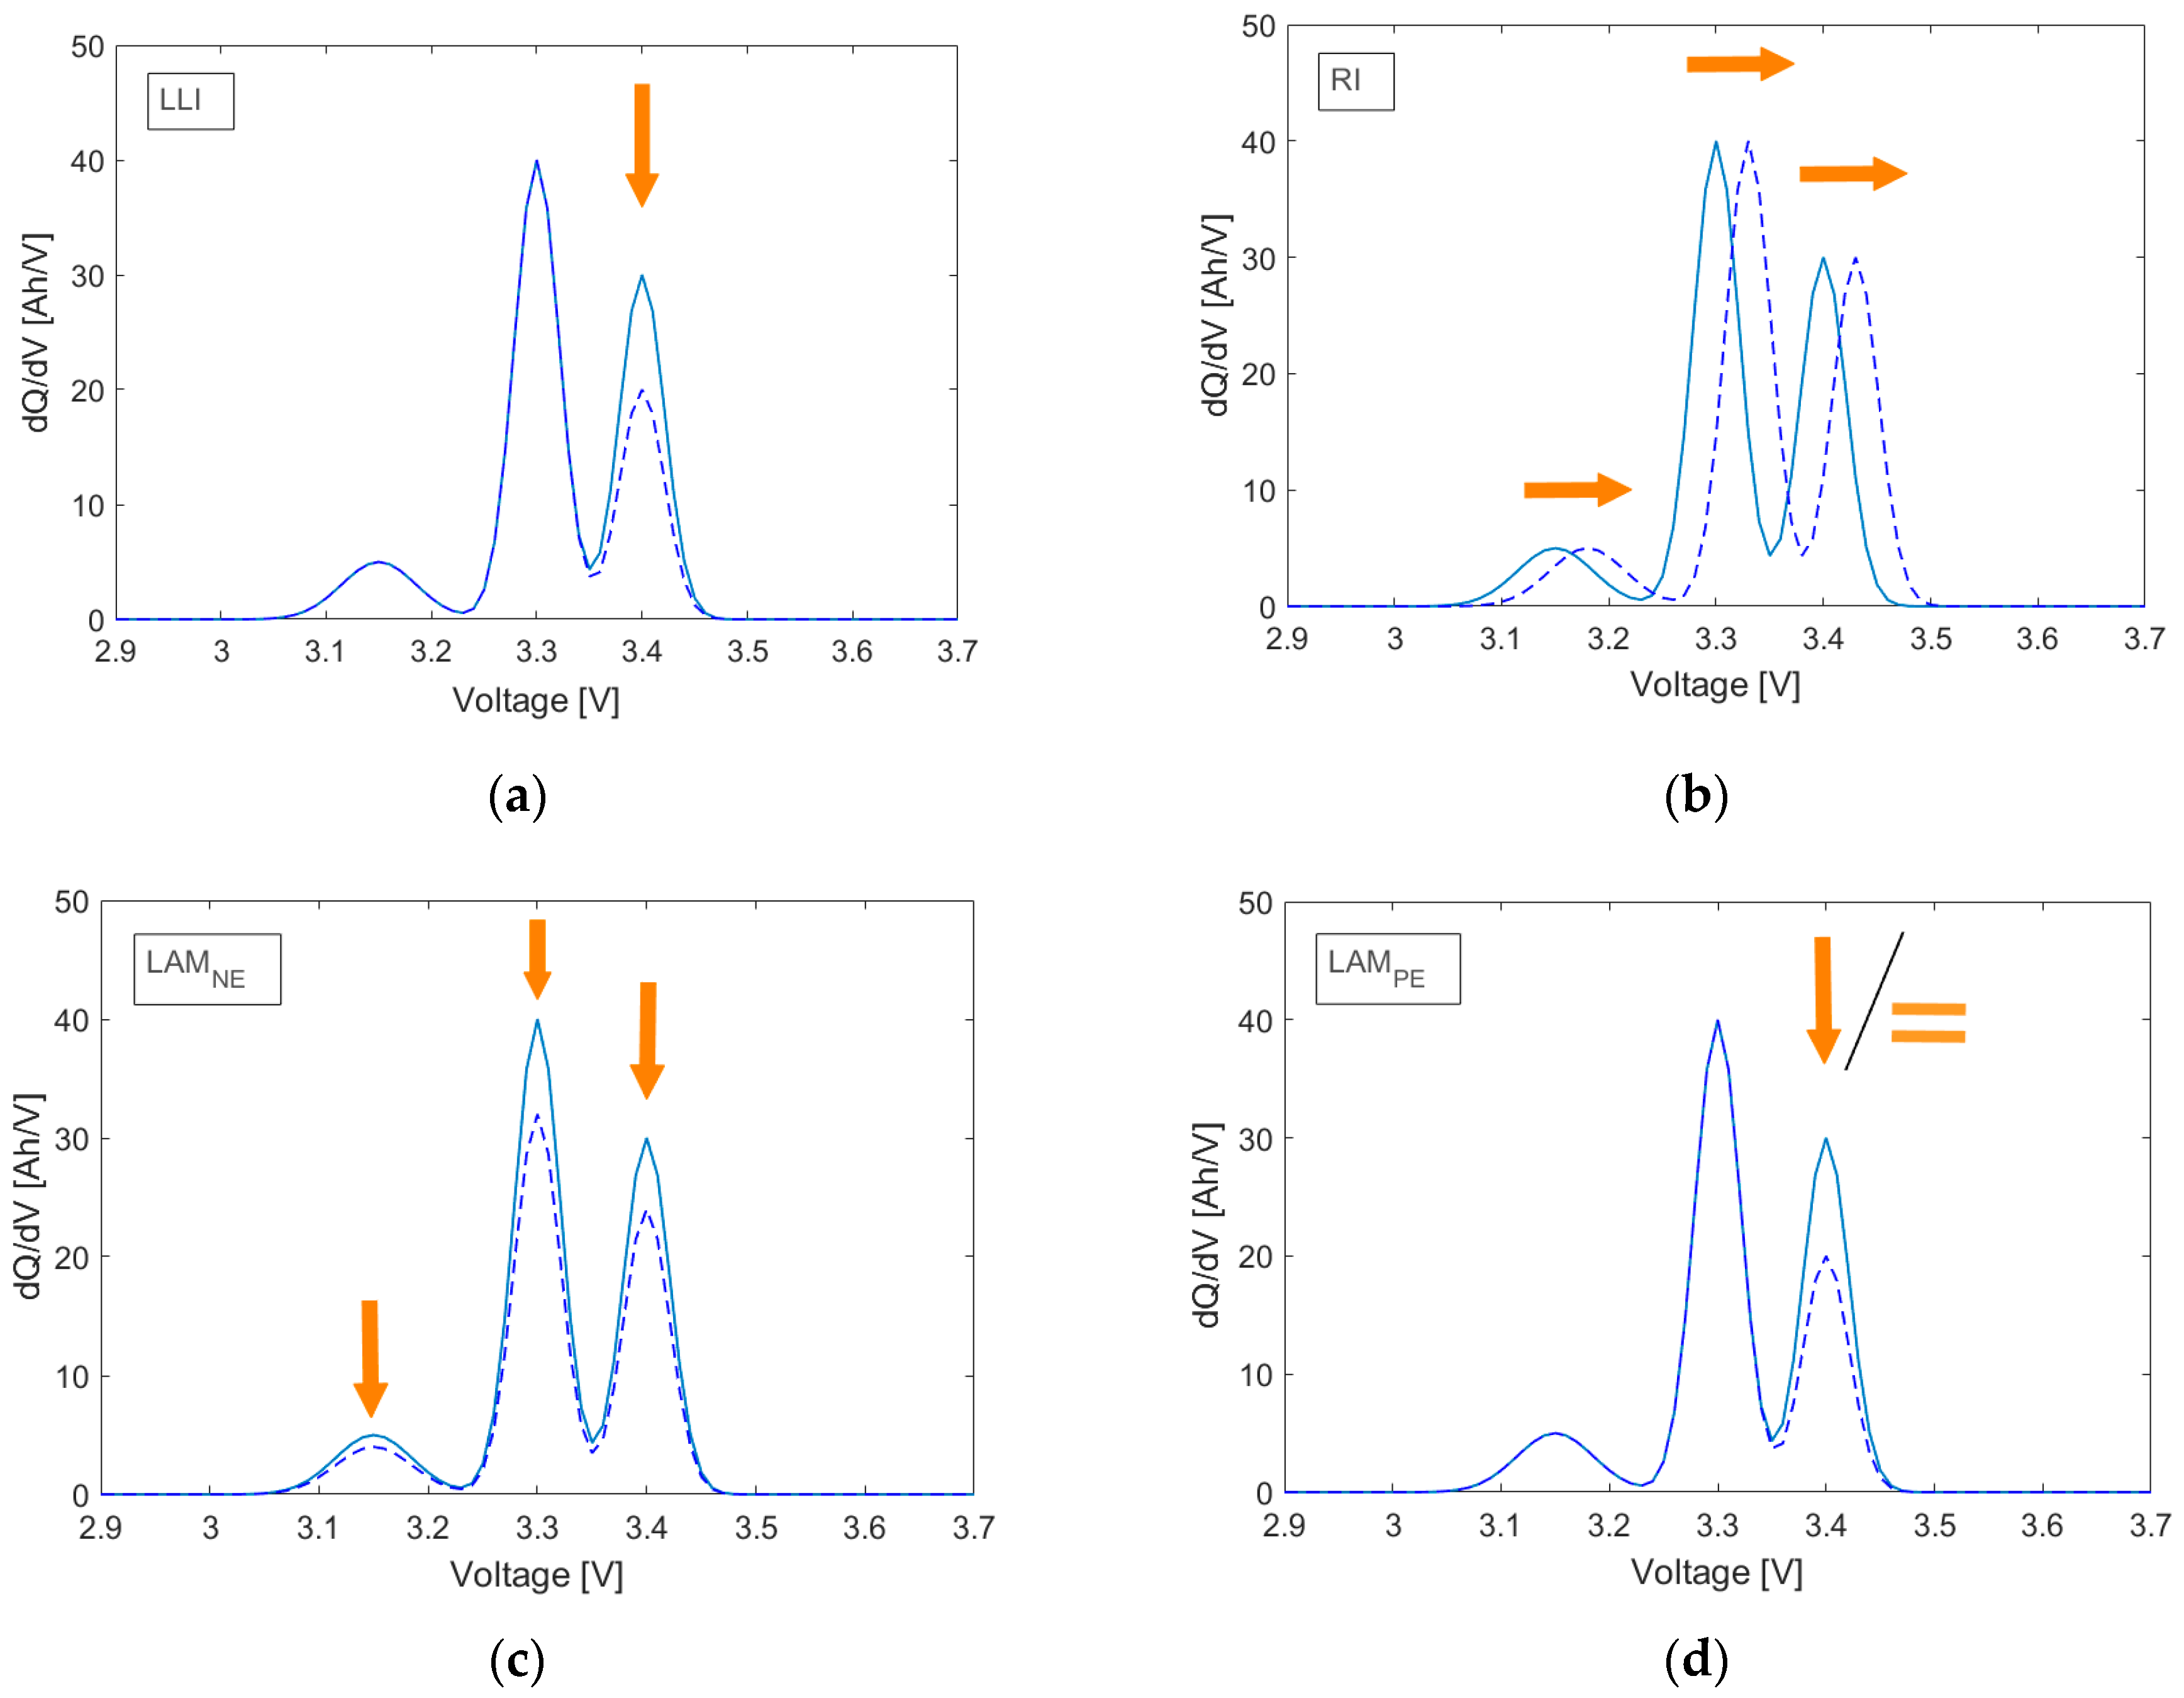
3.1.1. Origin of IC Peaks

An example of the LFP cells’ IC curves and the corresponding voltage curves for both discharging and charging are shown in Figure 2. The peaks of interest are marked with the numbers 1, 2, and 3. There are two other smaller peaks that can be observed between peak 1 and 2, but they are not clear enough for further evaluation. The same set of peaks appears in the charging (positive) and discharging (negative) section of the IC curves, with a slight off-set along the voltage axis. The peaks correspond to the phase equilibria between individual graphite intercalation stages of the anode, since in the LFP battery the potential curve of the iron phosphate electrode is flat because it only belongs to one transition between a lithiated and a delithiated phase [23]. The graphite intercalation stages are well described in the literature. The first IC peak can be related to the coexistence of pure graphite and graphite of the stage 4 phase. Peak 2 corresponds to the continuing transition of the liquid-like phase 2L into the stage 3 phase and vice versa. The equilibrium between stage 2 phase and stage 1 phase is characterized by the third peak [24,25]. During discharging, the change in voltage is negative and the peaks in the graph are shifted to lower potentials due to the overvoltage caused by the polarization resistance. However, in practical applications, the recharge step is usually used for IC studies, since there are typically sufficiently small and constant current conditions over a longer period of time [19,20,26]. Hence, the results in this study consider only the charge IC measurements.

3.1.2. Change in the IC Peaks with Aging

Various aging modes have different effects on the three analyzable peaks shown in Figure 2b. The qualitative effects of the aging modes LAM at anode (NE) and cathode (PE), LLI and RI on the IC curves are summarized in Figure 3a–d, respectively. They are described in more detail in the works of Dubarry et al. [3] and Birkl et al. [14].
The LLI region, for example, is caused by parasitic reactions such as the formation of a solid electrolyte interface (SEI). Fewer lithium ions can intercalate into the anode during charging, causing a delay in the voltage plateau of the third peak, which is then seen as a decrease in the peak area (Figure 3a). As the third peak disappears, the same reasoning holds for the decrease in the second peak. In the case of LAM, there are basically fewer sites available for lithium ions to intercalate in the active material. Even though all the phase equilibria still occur, but with a lower capacity for each individual process, LAMNE at the anode correspondingly reflects in a decrease of all the peak areas (Figure 3c). In contrast, due to the characteristic flat half-cell potential of the iron phosphate cathode, LAMPE shows no effect on the IC peaks, provided that the anode is the electrode that is limiting the capacity of the battery. If this was not the case, when the capacity of the anode is greater than that of the cathode, LAMPE would cause the anode to be “less filled” with lithium ions, which leads to a reduction in the third peak only. Consequently, the LAM at the cathode shows either a decrease of the third peak or does not show any change at all (Figure 3d). It is important to note that this is a special behavior of the iron phosphate electrode and does not apply to all Li-ion cell-type chemistries. The increase in polarization resistance has no effect on the area of the peaks. RI shifts the charge IC curves towards higher potentials (Figure 3b). As the polarization resistance depends on the SOC, this shift does not have to be symmetrical.

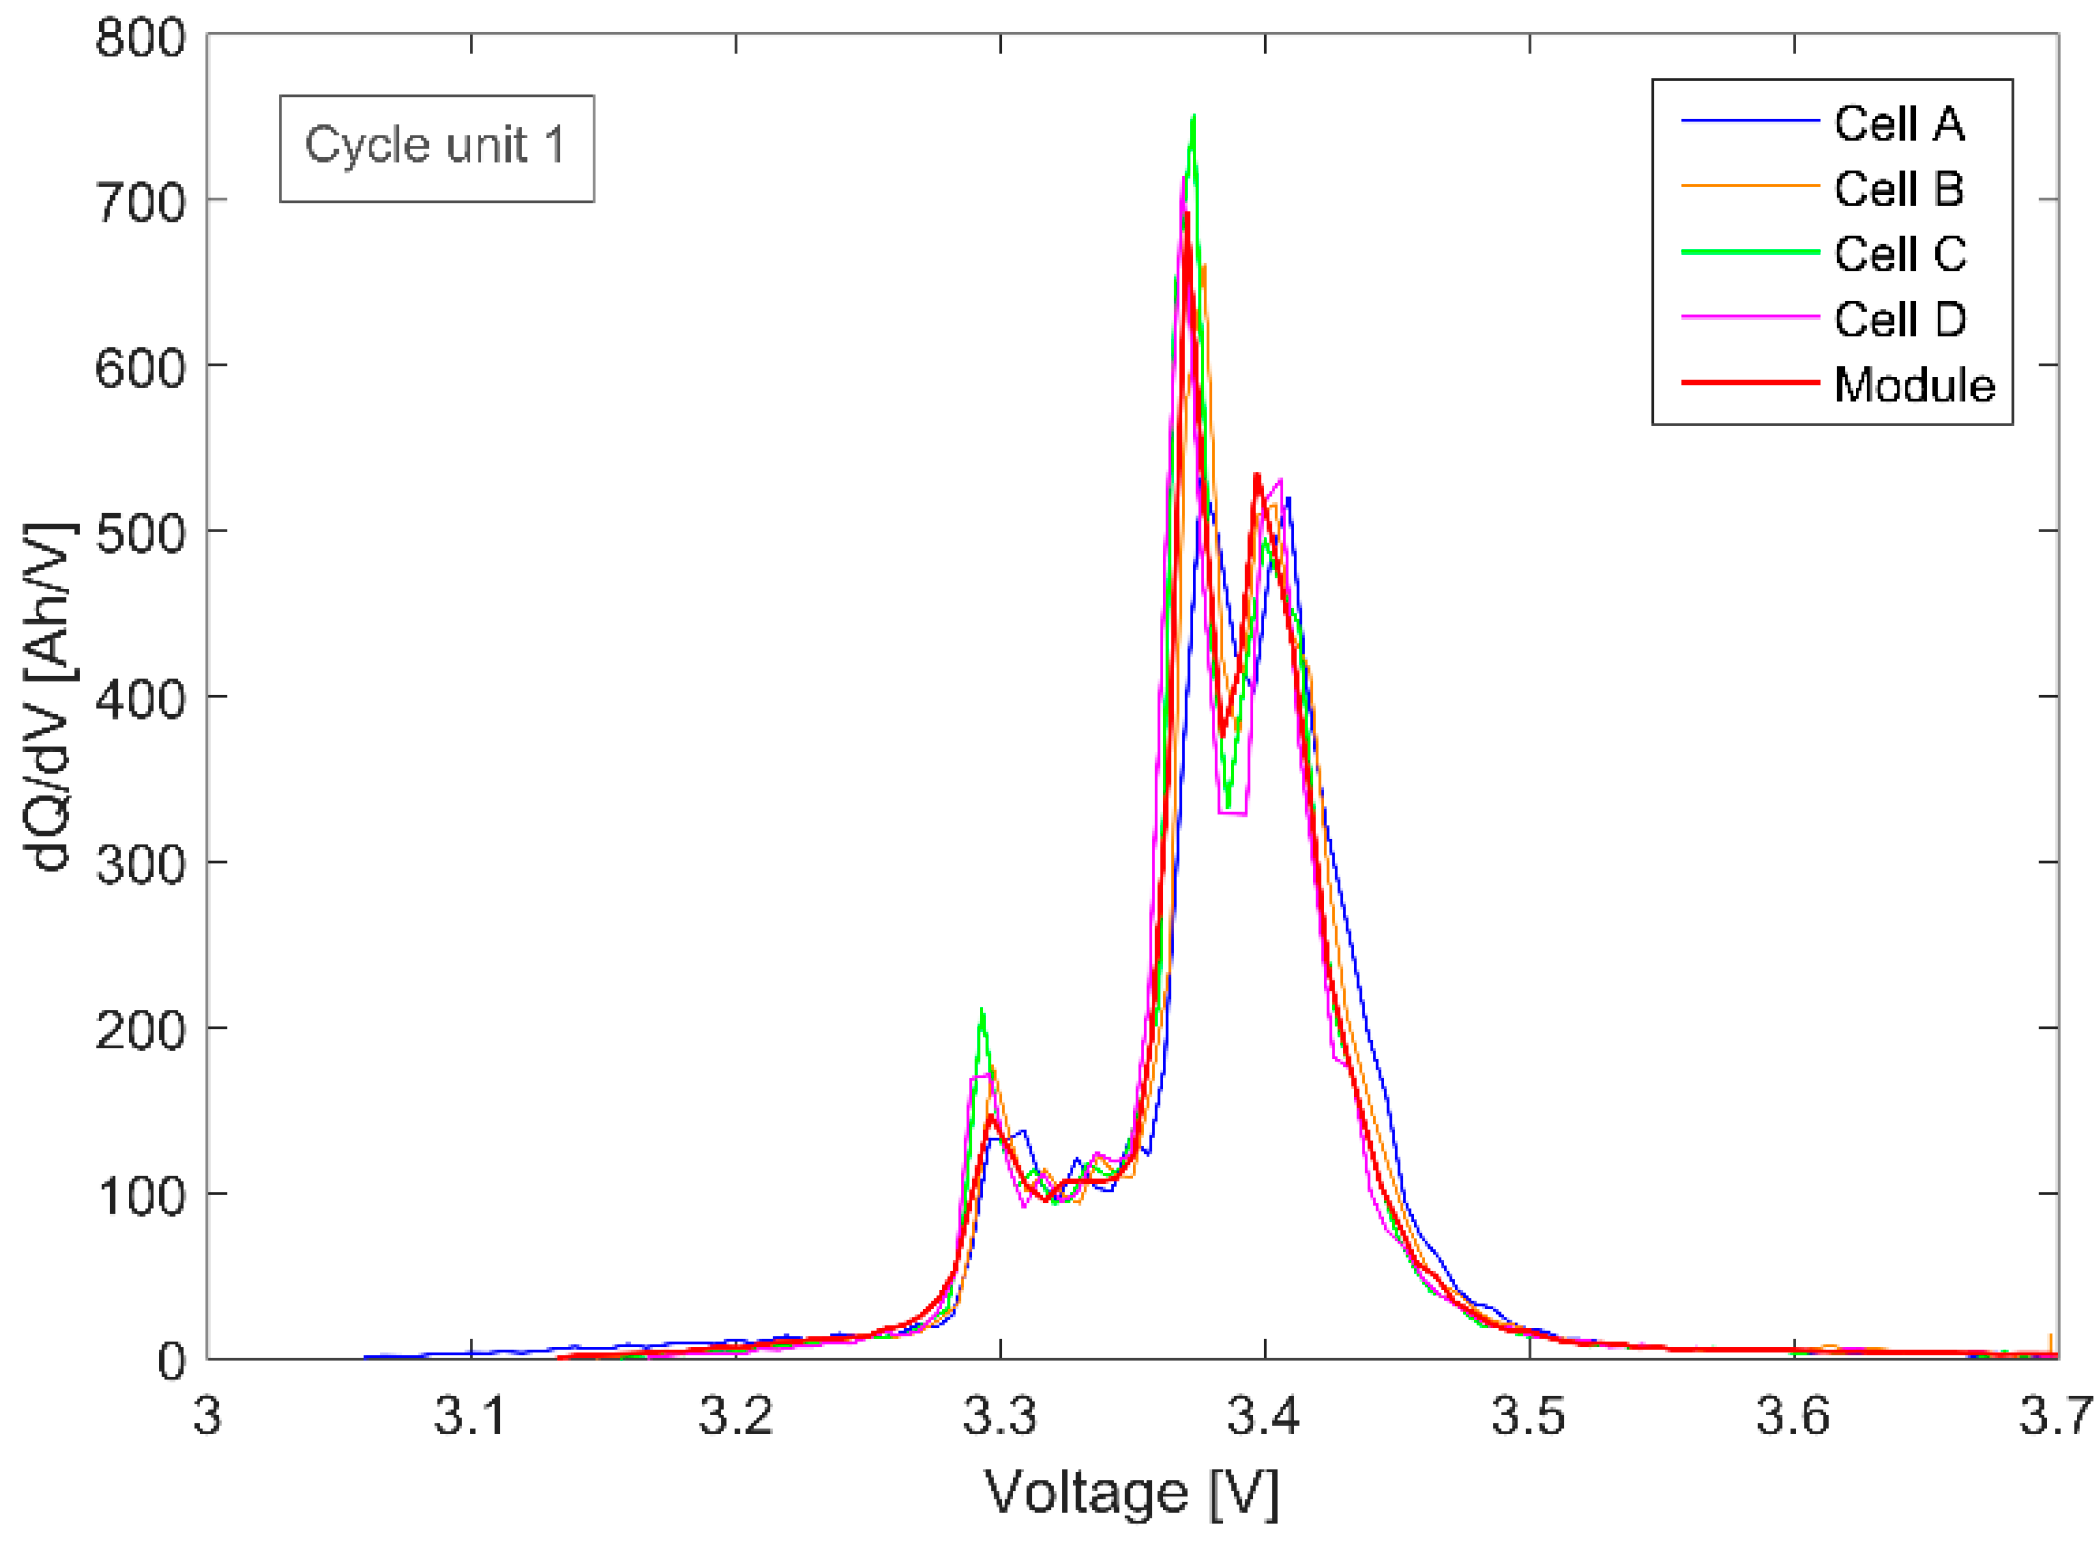
3.2. ICA for Battery Modules with Series-Connected Cells

ICA has already proven to be a powerful tool for SOH determination of single cells and modules with parallel connected cells [4,10,15,20]. The following section examines the IC curve evaluation for a module consisting of cells connected in series.

3.2.1. Analytical Consideration of the Module IC

The incremental capacity is determined for each cell k = 1, …, n, k , at time t by the quotient of the difference of two capacity measurements ΔQt = QtQt − 1, and the difference of two voltage measurements ΔVt = VtVt − 1 (see Equation (1)). According to Kirchhoff’s laws, the changes in capacity for series-connected cells over a period of time are identical: ΔQt,1 = … = ΔQt,n. It can therefore be considered that
ΔVt,j ≠ ΔVt,k   | unequal SOH,
ΔVt,j = ΔVt,k   | equal SOH,
is valid for the cells with indices j = 1, …, n and kj. Since the voltages of the batteries in the series connection add up to the module voltage V t , M , the incremental capacity of the module M with n cells connected in series satisfies:
Δ Q t Δ V t , M = Δ Q t k = 1 n Δ V t = equal   SOH Δ Q t n   ×   Δ V t .
This means that the module IC is n times smaller than the incremental capacity of the individual cells, while the cells have the same SOH. The mean value x of the incremental capacity of the individual cells with the single cell voltage V t , S is
x ¯ S = k = 1 n Δ Q t Δ V t , k n = equal   SOH n   ×   Δ Q t n   ×   Δ V t , S .
To allow for direct comparison, the incremental capacity of the module is scaled to that of the single-cell IC. For this purpose, the module IC is multiplied by the number of cells. In the case of cells that have an equal SOH, the result is as follows:
n × Δ Q t Δ V t , M = equal   SOH Δ Q t Δ V t , S .
For cells of the same SOH, the scaled IC of the module corresponds to the incremental capacity of the individual cells. In the case of equal cell capacity, the development of the single-cell voltages over time can be assumed to be identical. Hence, the correlation between the single-cell mean value and scaled module IC is also valid when plotting the incremental capacity as a function of voltage, as long as the cells have the same SOH. If the cells have not aged equally, the mean value of the single cell IC no longer corresponds to the module IC and the difference or imbalance is then an indication that there are cells at different SOH (Equations (4) and (5)).

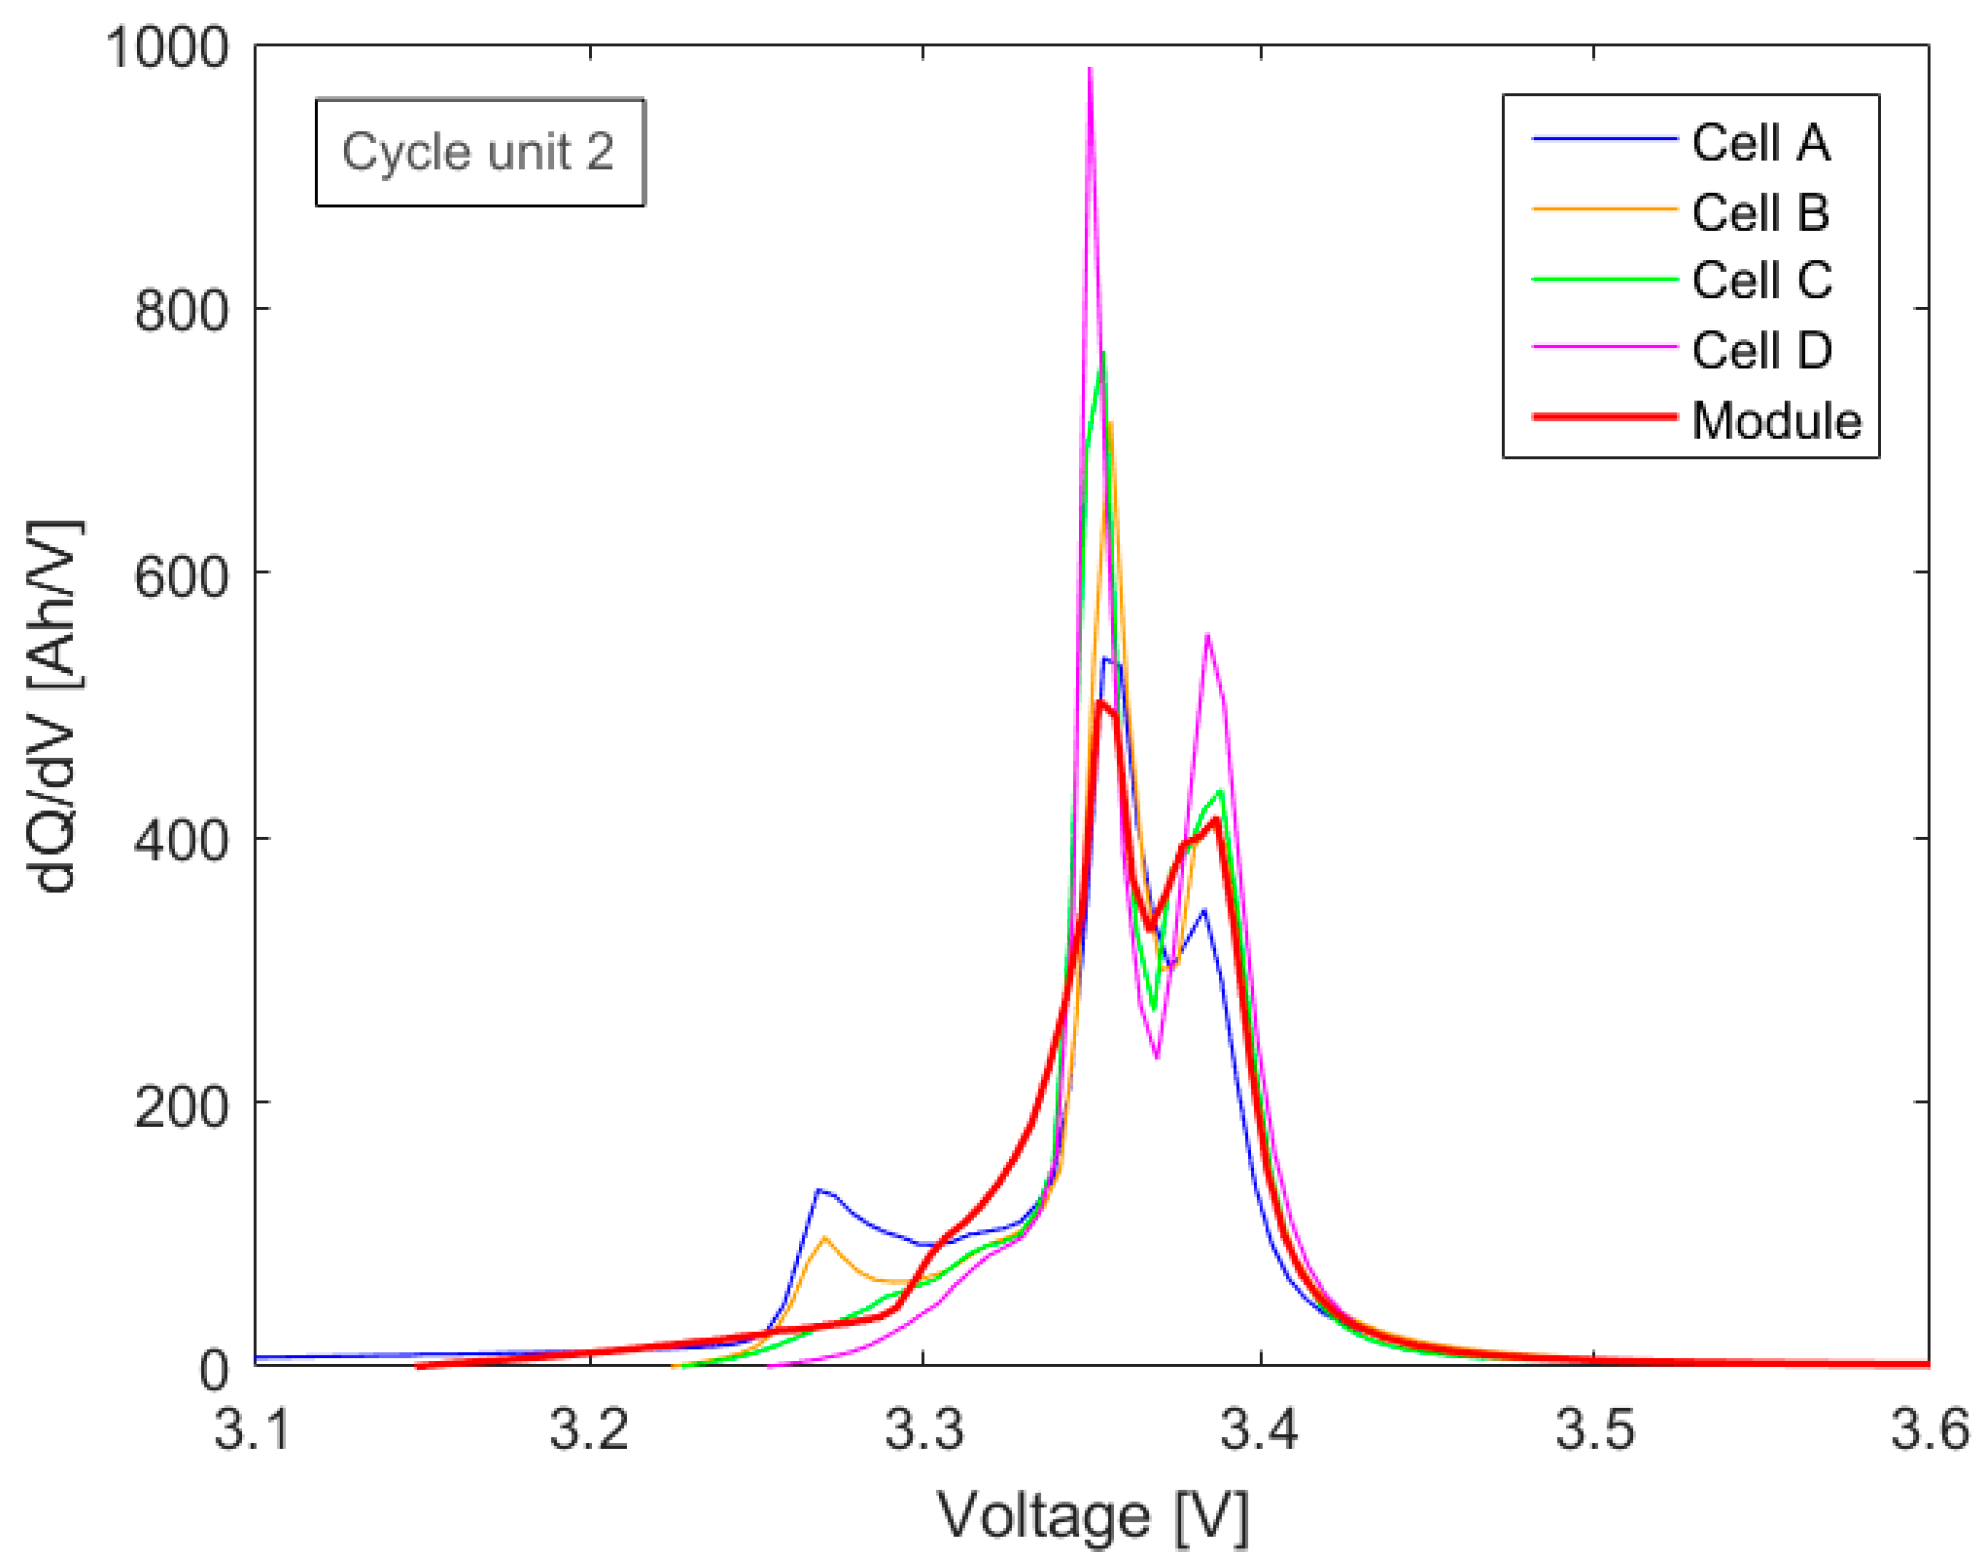
3.2.2. Experimental Results: Influence of SOH Uniformity on Applying ICA to a Module

To validate the results of the analytical investigation for cells of the same SOH, the experimental data from the module characterization of the first measuring cycle were used. The new LFP cells had capacities that varied between 43.2 Ah and 44.3 Ah. Thus, they all had a similar SOH, with a maximum capacity deviation of 2.5%. The change in their respective capacities over the four measuring cycle units is illustrated in Figure 4.
Figure 5 shows the overlay of the single cells’ IC and module’s IC for the first cycle unit. Since the module voltage in the series connection resulted from the sum of the individual voltages, the voltage interval for the calculation of the incremental capacity was set to 20 mV, four times larger than for the single cells. To allow for a direct comparison, the module’s IC curve was scaled as described in the previous section by multiplying the incremental capacity by the number of individual cells in the module. In addition, the voltage over which the IC was determined was divided by four.
The resolution of the voltage measurement that was determined directly from the BMS was relatively noisy, with fluctuations of up to 6 mV. For this reason, the measurement data obtained from BMSs are typically smoothed before further evaluation. Despite the noise, the results show that the IC curves of the individual cells and the module superimpose reasonably well. Hence, the resulting comparison, as expressed in Equation (6), was confirmed by the experimental analysis. The single cells’ and scaled module’s IC curves match well if the series-connected cells have a similar SOH. Therefore, in this case the module’s SOH can then be evaluated using single-cell correlations of the FOI with the SOH.

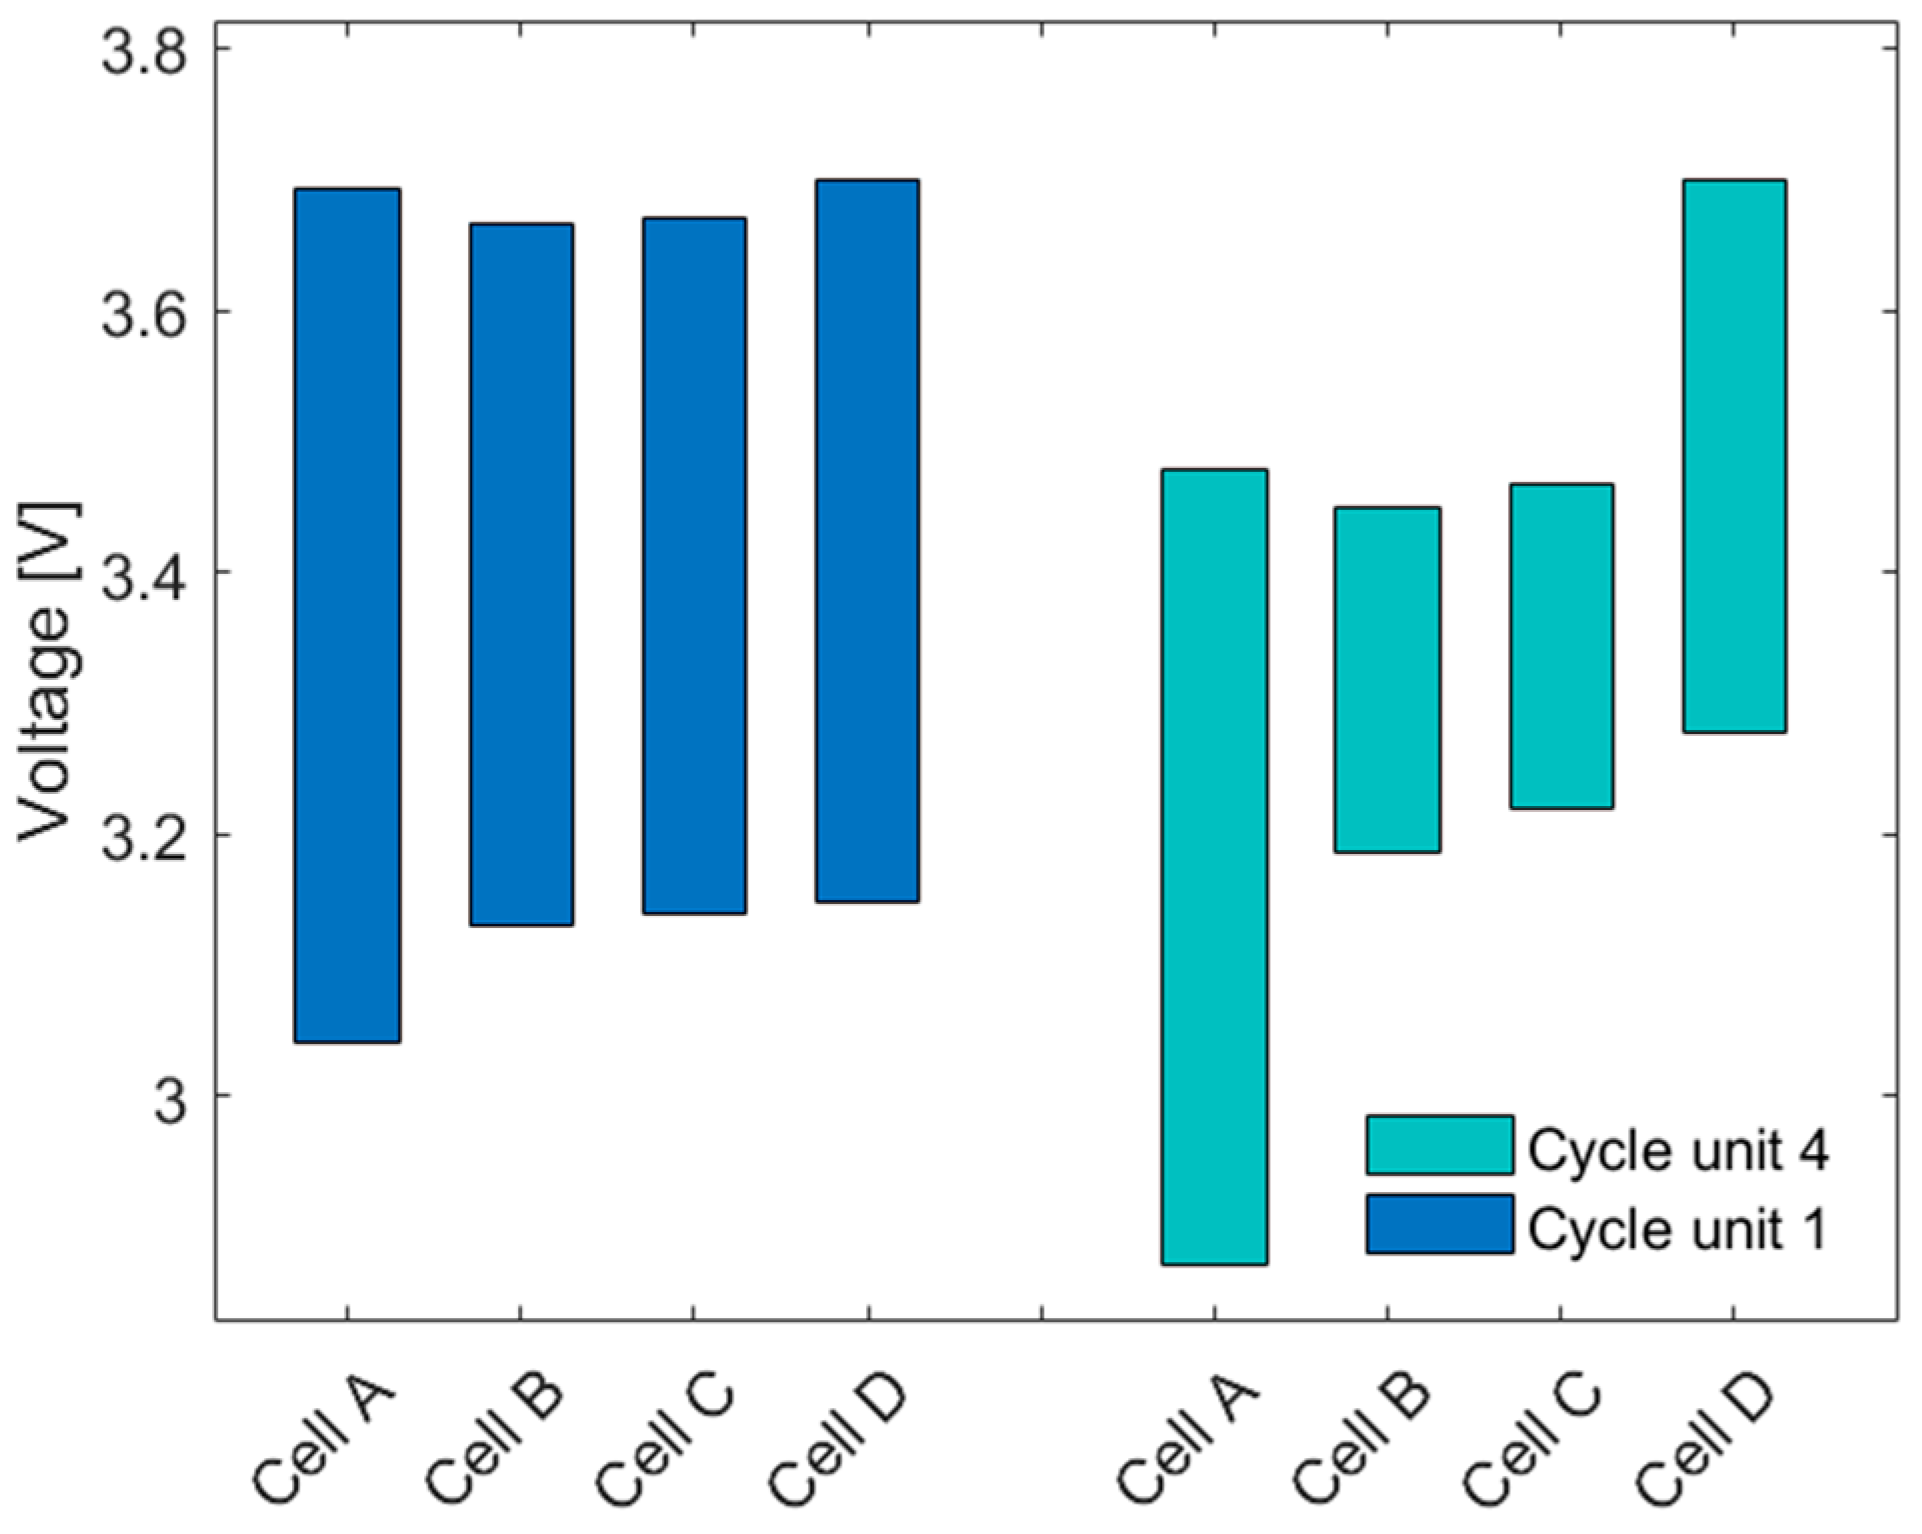
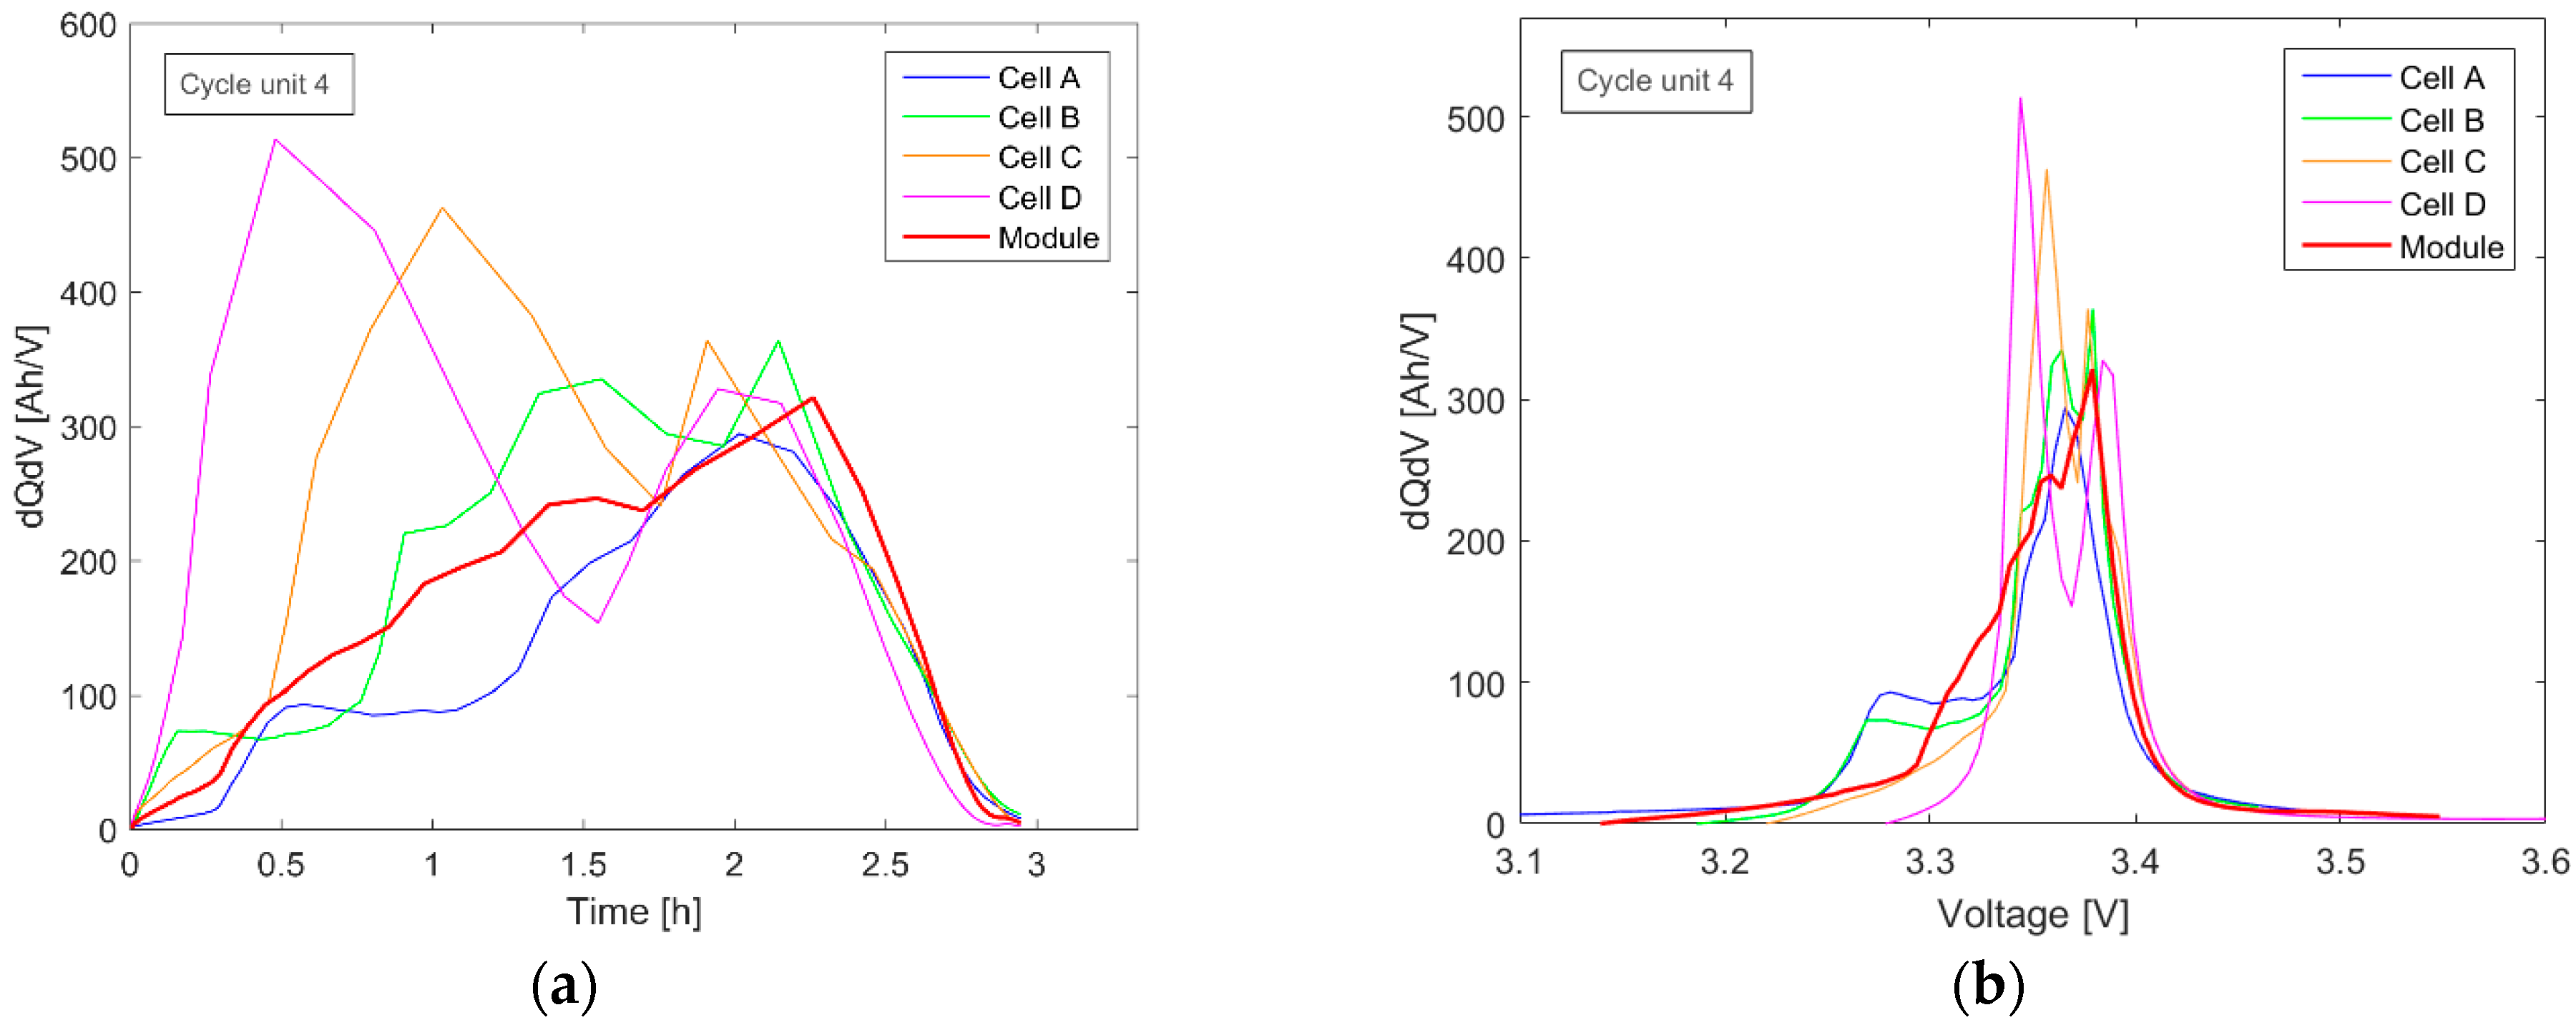
3.2.3. Experimental Results: Influence of SOH Non-Uniformity on Applying ICA to a Module

To investigate the influence of SOH variations within the group of single cells in series on the module’s incremental capacity, the IC curves of the module of the second to the fourth cycle unit were analyzed. During aging in the individual measuring cycles, differences in capacity between the cells became larger (Figure 4). The resulting variations in module measurement of the second measuring cycle unit can be seen in Figure 6. Since the focus of this work was not on the post-processing of online data, these data were acquired with a high-resolution multi-meter and are therefore free of measurement noise.
Examining the IC curve of the module only, the results show that the first peak in the module curve is no longer clearly distinguishable. Comparing the overlaying single cells’ IC curves, the first peak is only observed for cells A and B. However, the peak is no longer visible for cells C and D and therefore is not detectable in the IC curve of the module. Note that cells A and B are the ones that had aged the most after the first two aging cycle sequences (Figure 4). This behavior cannot be explained by the aging of a single cell (Section 3.1.2), but is related to the SOC of the cells during the charging sequence of the module. Since the module is discharged before charging, the weakest cell A reaches the final discharge voltage first and thus stops the measurement and determines the capacity of the module. At this point in time, the remaining cells have higher cell voltages and therefore are at a higher SOC, depending on their individual SOH. This effect became even more prominent after the cells were subjected to four aging cycle sequences. In particular, cell A achieved only around 23 Ah in discharge capacity in the fourth cycle unit. To illustrate this process, the development of the individual cell voltages during a charge cycle within the module over the first (new) and the fourth (aged) module IC measurements are compared and shown in Figure 7.
A module with four new cells shows a reasonably good distribution of the voltages over the charge for all the cells (cycle unit 1 in Figure 7). In the first module measurement, the cell voltages at the beginning of charging are noticeably higher than the lower cut-off voltage (2.8 V), which might be due to a longer relaxation time in the first module’s measuring cycle. Cell A was the limiting cell, triggering the BMS to terminate the discharge when it reached the lower cut-off voltage. Upon recharging, the cell D reached the upper voltage limit first, thereby stopping the charging process. In cycle four, in which the cells had significantly aged, cell A reached the lower cut-off voltage a lot sooner. The other cells maintained at relatively high cell voltages, showing that they had limited their discharge capacity. Upon recharging, cell D again reached the upper cell voltage limit a lot sooner, thereby terminating the charging process and limiting the recharge conditions of the other cells in the module, including the limited recharging of cell A in particular. The BMS used had a passive charge controller that would balance the cell voltages during charging through discharging the cell with the highest SOC by connecting a resistor in parallel. Since the balancing process in this study was not relevant, it was deactivated in the BMS.
Due to the different SOC values of the cells, the IC single-cell peaks were broadly distributed at different time periods, as shown in Figure 8a. The result is a deformation of the module IC plotted against time and voltage (Figure 8).
The module IC peaks are dependent on the SOH and SOC of each cell in the series connection and are no longer attributable only to the chemistry changes and FOI of the individual cells. This means that single-cell correlations cannot be applied to the module if the single cells differ in their SOH significantly. In the example under consideration, it is therefore not possible to infer the SOH of individual cells or the module from only the module measurement or vice versa. However, the deformation effect of the IC graphs for a module can be used to identify whether there are cells within the module that are aging differently in relation to each other, thereby giving a qualitative indication that changes between certain cells within the module have occurred. In an application, the BMS can monitor the module IC curve and, for example, regulate the aging of the weakest cell through active balancing as soon as the module IC deviates from the behavior of a single cell. The weakest cell would not have to be identified until the module IC deviates from the single cell IC significantly and in a predetermined order. In the case of investigating LFP cell chemistry, the first module peak would be a suitable measurement for this type of analysis. Subsequently, the success of the BMS control can be measured by the renewed formation of the first module peak. Since the evaluation of parallel connected cells is possible [10,20], this method can also be applied to series-connected packs of parallel connected cells. Furthermore, this method is also well suited for classifying modules based on terminal measurements without needing to have access to individual cell data. In addition, measuring time would be saved since only a partial measurement of the first module peak is needed for this type of characterization. This offers a promising approach for the initial classification of second life modules, which in future will increasingly have to be transferred to new types of applications, such as grid storage systems. The quantification of the SOH of a module would still have to be done by the evaluation of the weakest cell within the module, for example, by measuring the changes in the IC curves’ peaks relative to a new cell.

3.3. Future Work

The changes of the FOI with aging are determined by the different aging modes that occur in the respective cells. These in turn depend on cell chemistry, cell geometry, and the operating stress factors. In order to avoid or reduce the extensive experimental investigations that are necessary to determine the interrelationships of the FOI with the cell SOH under certain aging conditions, the method in the future should be linked to aging models to predict the change in the FOI of a single cell. Based on this, a module model can be used to simulate the effect of different single-cell SOH on the module’s ICA. The model results can provide reference values for the evaluation of the IC of different module configurations in applications. Furthermore, a frequent adjustment of the FOI correlation with the SOH based on the actual stress on the battery is conceivable. In the development of a suitable aging model, it is important to ensure that the method of model parameterization is efficient, cost-effective, and minimally complex. This will form part of ongoing work.

4. Conclusions

The ICA is a simple and versatile method and thus represents a promising approach for SOH estimation in Li-ion battery modules. This study focused on the implementation of ICA as a SOH-monitoring method for modules, including series-connected cells or packs. For this purpose, the extension of single-cell analysis to multi-cell battery modules was discussed. The investigations were based on extensive experimental studies on LFP batteries. Thereby different single-cell aging states were induced by cyclization with different current rates. The results showed that the capacity loss of battery modules can be determined from the single-cell IC data, provided that the single cells have a similar SOH. In the case of significant SOH deviations, a method to identify the different aging of single cells based on terminal data from the first module IC peak was presented. This method offers the possibility of saving computing capacity in the BMS and can be used for the initial classification of second life modules. In order to be able to flexibly use the method in various online applications, we intend to perform further research on modeling the temperature and aging dependence of ICA.

Author Contributions

Conceptualization, A.K., E.F., F.S., and C.A.; data curation, A.K., E.F., and K.D.; formal analysis, A.K.; investigation, A.K., E.F., and K.D.; methodology, A.K.; resources, F.S.; software, A.K.; supervision, E.F., K.D., and C.A.; validation, A.K.; visualization, A.K.; writing—original draft, A.K.; writing—review and editing, E.F., K.D., F.S., and C.A. All authors have read and agreed to the published version of the manuscript.

Funding

This research received no external funding.

Data Availability Statement

The data presented in this study are available on request from the corresponding author.

Acknowledgments

The authors thank the Hanse Wissenschaft Kolleg (HWK), the center for advanced studies in Delmenhorst Germany, for their financial contribution towards the fellowship of E. Ferg.

Conflicts of Interest

The authors declare no conflict of interest.

References

  1. Scrosati, B.; Garche, J. Lithium batteries: Status, prospects and future. J. Power Sources 2010, 195, 2419–2430. [Google Scholar] [CrossRef]
  2. Malhotra, A.; Battke, B.; Beuse, M.; Stephan, A.; Schmidt, T.S. Use cases for stationary battery technologies: A review of the literature and existing projects. Renew. Sustain. Energy Rev. 2016, 56, 705–721. [Google Scholar] [CrossRef]
  3. Dubarry, M.; Truchot, C.; Liaw, B.Y. Synthesize battery degradation modes via a diagnostic and prognostic model. J. Power Sources 2012, 219, 204–216. [Google Scholar] [CrossRef]
  4. Li, Y.; Abdel-Monem, M.; Gopalakrishnan, R.; Berecibar, M.; Nanini-Maury, E.; Omar, N.; Bossche, P.V.D.; Van Mierlo, J. A quick on-line state of health estimation method for Li-ion battery with incremental capacity curves processed by Gaussian filter. J. Power Sources 2018, 373, 40–53. [Google Scholar] [CrossRef]
  5. Berecibar, M.; Gandiaga, I.; Villarreal, I.; Omar, N.; Van Mierlo, J.; Bossche, P.V.D. Critical review of state of health estimation methods of Li-ion batteries for real applications. Renew. Sustain. Energy Rev. 2016, 56, 572–587. [Google Scholar] [CrossRef]
  6. Casals, L.C.; García, B.A.; Canal, C. Second life batteries lifespan: Rest of useful life and environmental analysis. J. Environ. Manag. 2019, 232, 354–363. [Google Scholar] [CrossRef]
  7. Han, X.; Ouyang, M.; Lu, L.; Li, J.; Zheng, Y.; Li, Z. A comparative study of commercial lithium ion battery cycle life in electrical vehicle: Aging mechanism identification. J. Power Sources 2014, 251, 38–54. [Google Scholar] [CrossRef]
  8. Zheng, L.; Zhu, J.; Lu, D.D.-C.; Wang, G.; He, T. Incremental capacity analysis and differential voltage analysis based state of charge and capacity estimation for lithium-ion batteries. Energy 2018, 150, 759–769. [Google Scholar] [CrossRef]
  9. Riviere, E.; Sari, A.; Venet, P.; Meniere, F.; Bultel, Y. Innovative Incremental Capacity Analysis Implementation for C/LiFePO4 Cell State-of-Health Estimation in Electrical Vehicles. Batteries 2019, 5, 37. [Google Scholar] [CrossRef] [Green Version]
  10. Weng, C.; Feng, X.; Sun, J.; Peng, H. State-of-health monitoring of lithium-ion battery modules and packs via incremental capacity peak tracking. Appl. Energy 2016, 180, 360–368. [Google Scholar] [CrossRef] [Green Version]
  11. Han, X.; Ouyang, M.; Lu, L.; Li, J. Cycle Life of Commercial Lithium-Ion Batteries with Lithium Titanium Oxide Anodes in Electric Vehicles. Energies 2014, 7, 4895–4909. [Google Scholar] [CrossRef] [Green Version]
  12. Berecibar, M.; Dubarry, M.; Omar, N.; Villarreal, I.; Van Mierlo, J. Degradation Mechanism Detection for NMC Batteries based on Incremental Capacity Curves. World Electr. Veh. J. 2016, 8, 350–361. [Google Scholar] [CrossRef] [Green Version]
  13. Dubarry, M.; Baure, G.; Devie, A. Durability and Reliability of EV Batteries under Electric Utility Grid Operations: Path Dependence of Battery Degradation. J. Electrochem. Soc. 2018, 165, A773–A783. [Google Scholar] [CrossRef]
  14. Birkl, C.R.; Roberts, M.R.; McTurk, E.; Bruce, P.G.; Howey, D.A. Degradation diagnostics for lithium ion cells. J. Power Sources 2017, 341, 373–386. [Google Scholar] [CrossRef]
  15. Wang, L.; Pan, C.; Liu, L.; Cheng, Y.; Zhao, X. On-board state of health estimation of LiFePO4 battery pack through differential voltage analysis. Appl. Energy 2016, 168, 465–472. [Google Scholar] [CrossRef]
  16. Lin, C.P.; Cabrera, J.; Yu, D.Y.W.; Yang, F.; Tsui, K.L. SOH Estimation and SOC Recalibration of Lithium-Ion Battery with Incremental Capacity Analysis & Cubic Smoothing Spline. J. Electrochem. Soc. 2020, 167, 090537. [Google Scholar] [CrossRef]
  17. Dubarry, M.; Liaw, B.; Chen, M.-S.; Chyan, S.-S.; Han, K.-C.; Sie, W.-T.; Wu, S.H. Identifying battery aging mechanisms in large format Li ion cells. J. Power Sources 2011, 196, 3420–3425. [Google Scholar] [CrossRef]
  18. Weng, C.; Sun, J.; Peng, H. A unified open-circuit-voltage model of lithium-ion batteries for state-of-charge estimation and state-of-health monitoring. J. Power Sources 2014, 258, 228–237. [Google Scholar] [CrossRef]
  19. Weng, C.; Cui, Y.; Sun, J.; Peng, H. On-board state of health monitoring of lithium-ion batteries using incremental capacity analysis with support vector regression. J. Power Sources 2013, 235, 36–44. [Google Scholar] [CrossRef]
  20. Jiang, Y.; Jiang, J.; Zhang, C.; Zhang, W.; Gao, Y.; Guo, Q. Recognition of battery aging variations for LiFePO4 batteries in 2nd use applications combining incremental capacity analysis and statistical approaches. J. Power Sources 2017, 360, 180–188. [Google Scholar] [CrossRef]
  21. Lee, H.; Park, J.; Kim, J. Incremental Capacity Curve Peak Points-Based Regression Analysis for the State-of-Health Prediction of a Retired LiNiCoAlO2 Series/Parallel Configured Battery Pack. Electronics 2019, 8, 1118. [Google Scholar] [CrossRef] [Green Version]
  22. Kalogiannis, T.; Stroe, D.I.; Nyborg, J.; Nørregaard, K.; Christensen, A.E.; Schaltz, E. Incremental Capacity Analysis of a Lithium-Ion Battery Pack for Different Charging Rates. ECS Trans. 2017, 77, 403–412. [Google Scholar] [CrossRef]
  23. Hou, P.; Chu, G.; Gao, J.; Zhang, Y.; Zhang, L. Li-ion batteries: Phase transition. Chin. Phys. B 2016, 25, 016104. [Google Scholar] [CrossRef]
  24. Ohzuku, T.; Iwakoshi, Y.; Sawai, K. Formation of Lithium-Graphite Intercalation Compounds in Nonaqueous Electrolytes and Their Application as a Negative Electrode for a Lithium Ion (Shuttlecock) Cell. J. Electrochem. Soc. 1993, 140, 2490–2498. [Google Scholar] [CrossRef]
  25. Dahn, J.R. Phase diagram ofLixC6. Phys. Rev. B 1991, 44, 9170–9177. [Google Scholar] [CrossRef]
  26. Wang, Z.; Ma, J.; Zhang, L. State-of-Health Estimation for Lithium-Ion Batteries Based on the Multi-Island Genetic Algorithm and the Gaussian Process Regression. IEEE Access 2017, 5, 21286–21295. [Google Scholar] [CrossRef]
Figure 1. Flow chart of the measurement procedure. In the module measurement (orange), cells A, B, C, and D were connected in series. In the other measurements they were tested separately.
Batteries 07 00002 g001
Figure 2. (a) Charge and discharge voltage curve versus state of charge (b) incremental capacity (IC) curve versus cell voltage for a fresh lithium iron phosphate (LFP) cell cycled at C/20 and 25 °C.
Batteries 07 00002 g002
Figure 3. Influence of loss of lithium inventory (LLI) (a), resistance increase (RI) (b), loss of active material at anode (LAMNE) (c), and loss of active material at cathode (LAMPE) (d) on the charge IC peaks of a typical LFP cell.
Batteries 07 00002 g003
Figure 4. Capacity of the individual cells plotted over the four life cycle units.
Batteries 07 00002 g004
Figure 5. Single cells’ and scaled module’s IC graphs of the first cycle unit measured by the battery management system (BMS).
Batteries 07 00002 g005
Figure 6. Single-cell and scaled module IC in the second measuring cycle unit.
Batteries 07 00002 g006
Figure 7. Distribution of the cell voltages of the module IC measurements during a C/5 charge for new cells in the first cycle unit and aged cells in the fourth cycle unit.
Batteries 07 00002 g007
Figure 8. IC curves of the module measurement in the fourth measuring cycle unit plotted over time (a) and voltage (b).
Batteries 07 00002 g008
Table 1. Main specifications of the Winston batteries according to the manufacturer data sheet.
ParameterValue
Positive electrode materialLiFePO4
Negative electrode materialGraphite
Nominal Capacity40 Ah ± 5%
Voltage range2.5 V–4.0 V
Publisher’s Note: MDPI stays neutral with regard to jurisdictional claims in published maps and institutional affiliations.

