
The Influence of Li4Ti5O12 Preparation Method on Lithium-Ion Capacitor Performance


1
Department of Electrical and Computer Engineering, Florida A&M University-Florida State University, Tallahassee, FL 32310-6046, USA
2
Aero-Propulsion, Mechatronics and Energy (AME) Center, Florida State University, Tallahassee, FL 32310, USA
3
Department of Industrial and Manufacturing Engineering, Florida A&M University-Florida State University, Tallahassee, FL 32310-6046, USA
4
High-Performance Materials Institute, Tallahassee, FL 32310, USA
5
Department of Electrical Engineering, University of Buffalo, The State University of New York, Buffalo, NY 14260, USA
*
Author to whom correspondence should be addressed.
Batteries 2021, 7(2), 33; https://0-doi-org.brum.beds.ac.uk/10.3390/batteries7020033
Submission received: 3 March 2021
/
Revised: 12 April 2021
/
Accepted: 26 April 2021
/
Published: 20 May 2021
Abstract
:In this study, the importance of the preparation technique of Li4Ti5O12 (LTO) anode on its performance in a lithium-ion capacitor (LIC) application was investigated. These desired characteristics include energy density, rate capability, and cycle life. The samples were prepared using three approaches, and the same sol-gel synthesis procedure is applied to obtain phase-pure samples and keep the structural properties similar. The influence of these methods on the LTO anodes was then explored in both half-cell and full-cell LIC devices with an activated carbon (AC) cathode. It was observed that the samples had similar specific capacities and energy densities at low specific currents. However, significant differences were observed in the samples’ morphological properties, the rate capability, and the full-cell cycle life performance. Electrochemical impedance spectroscopy was used to identify the electrochemical kinetics and revealed that the LIC with the best performance was influenced by the LTO anode having the least charge transfer and diffusion resistances prepared using a surfactant. This was due to the small particle size, good particle dispersion, and high specific surface area of the LTO anode. This result points to the importance of the choice of synthesis technique in LIC material’s overall performance.
1. Introduction
The commercialization of lithium-ion capacitors (LICs) in recent years has led to a wide range of applications such as automotive, emergency power backup, security equipment, and military equipment, therefore underlining the importance of improving this energy storage device [1,2,3]. LICs bridge the electrochemical gap between a traditional electric double-layer capacitor (EDLC) and lithium-ion battery (LIB) by combining the fast discharge features and long cycle in EDLC with the high capacity and high cell voltage of LIB. Therefore, LIC can deliver higher energy densities than the EDLCs while maintaining high power densities and long cycle life. In a typical LIC system, the positive electrode (cathode) is usually a capacitive-type material (e.g., activated carbon, AC) having a surface charge storage mechanism and a battery-type material (e.g., graphite, metal oxides) that store charges using an insertion mechanism as the negative electrode (anode) [4,5,6]. Therefore, the power density and cycle life are always limited by the battery-type anode material, whereas the capacitive cathode material limits the energy density.
Recently, many studies have been done to further improve the LIC’s power density, cycle life, and safety. Since the limiting electrode is the battery-type material, many studies are focused on enhancing the anode material for use in the LIC system. The conventional material is still the carbonaceous anode material: graphite and hard carbon (HC) [7,8,9,10]. These materials are used because of their attractive features, including high specific capacities, low working potential (~0.01 V), environmentally friendly and cheap costs. However, these materials pose a significant safety problem when used as an anode in LIC because of the low Li insertion potential, close to lithium’s electrochemical plating potential (Li), thereby leading to dendrite formation and short-circuit of the cell, especially during high rate applications. In addition, because of the structure of the carbonaceous materials that allows Li to be inserted into its interplanar spacing, there is severe volume expansion and contraction during cycling of the material (>10%), thus leading to structural degradation and subsequent capacity failure [8,11,12]. Therefore, in commercial LICs, the anode-to-cathode balance is very high, e.g., 7:1 for an HC anode LIC cell and 10:1 for a graphite anode LIC cell to compensate for the anode’s capacity degradation by reducing the depth of insertion/extraction of Li in the anode material [9]. Hence, the specific energy density is reduced as the manufacturing cost is increase. Another potential solution is replacement with alternative anode material for LIC devices. Therefore, it is essential to study potential anodes that could satisfy the LIC system’s requirements (power, cycle, and safety).
One promising candidate as an alternative anode in LIC is Li4Ti5O12 (LTO). LTO possesses attractive properties, which are suitable for use as an anode in LIC. These features include (i) zero-strain ability, which is due to little volume expansion (<0.2%) during Li insertion/extraction from the crystal structure, and therefore provides excellent extended cycling capability [13,14,15]; (ii) high working potential (Li insertion/extraction) that occurs typically at about ~1.55 V vs. Li/Li+, which is way above the dendrite formation potential, and therefore provides excellent safety; (iii) absence of solid electrolyte interface (SEI) layer, therefore providing a reduced pre-lithiation cost; and (iv) high thermal stability, low cost, and nontoxicity [16]. However, there are some fundamental problems: low Li+ diffusion (~10−8 to 10−13 cm2 s−1) and low electronic conductivity (~10−8 to 10−13 S cm−1), which limit the use of LTO as an anode material in LIC [15,17].
Various ways to improve the performance of LTO have been studied and reported by multiple works in literature. These methods include reducing the particle size (nanostructuring), surface coating with conductive materials (e.g., carbon black, silver), conductive polymers (e.g., PEDOT, PAN), doping (e.g., V5+, Cr3+), and compositing (e.g., graphene, carbon nanotube) [15]. Reducing the particle size is one of the easiest, cheapest, and most commonly reported methods, and many synthesis procedures have been proposed and investigated. The sol-gel process is a facile synthesis method employed to reduce particle size because of the ease in obtaining a phase-pure product, reasonable morphological control, narrow particle size distribution, and low cost [18,19]. However, because of the high-temperature heat treatment involved in obtaining a phase-pure product, it is challenging to achieve nanoparticles without high aggregation. Therefore, synthesis preparation assistance, e.g., ball-mill, is always employed to help prevent aggregation and obtain reduced particle size.
Earlier reports have studied the preparation of LTO using different synthesis methods and reported its structural and electrochemical half-cell performance. For instance, Khomane et al. and Sandhya et al. [20,21] used CTAB surfactant as preparation assistance in a sol-gel procedure to obtain dispersed LTO product and evaluated its electrochemical performance in a half-cell system. Yan et al. and Wang et al. [22,23] used the ball-milling approach to prepare pure LTO products and demonstrated improved electrochemical performance. Jamin et al. [24] employed freeze-drying as the synthesis assistance and reported performance improvement. Mahmoud et al. [25] used three different synthesis procedures and reported the differences in the electrochemical performance in a LIB cell with a LiCo2/3Ni1/6Mn1/6O2 cathode. However, the majority of these reports did not go beyond the electrochemical testing in half-cell configuration or LIB full cell at a low rate and at low cycles. Moreover, the LIC device requirements are different than a LIB device because of the high rate and long cycle performance desired in a LIC device.
There is no comprehensive study reporting on the influence of these preparation methods of LTO on essential characteristics such as energy, power, and cycle life desired in LIC devices, to the best of our knowledge. Some of these methods have been reported in a half-cell and three-electrode cell format in separate literature works [22,26]. Still, they cannot provide a deep comparative understanding needed in selecting the better synthesis technique to obtain a high-performing LTO anode when designing LIC device. As a result of this, we investigated the preparation methods’ influence on LIC characteristics comparatively. Two commonly reported techniques that were also used in [22,26] were selected and analyzed: ball-mill and surfactant. To ensure we only studied the effect of the method on the performance, we kept other factors (i.e., structural purity, crystallinity, and crystallite sizes) similar by using the same sol-gel synthesis process and the same starting materials. The effect of the preparation method on the LIC performance is analyzed and discussed.
2. Experimental
2.1. Synthesis of LTO
The sol-gel method used for the synthesis of LTO is similar to the one reported in [22,26]. Tetrabutyl titanate [Ti(OC4H9)4] (Sigma Aldrich, St. Louis, MO, USA) was used as the Ti source, and lithium acetate dihydrates (CH3COOLi·2H2O) (Sigma Aldrich, St. Louis, MO, USA) as the Li source for all the samples. The precursors were prepared at a Li:Ti ratio of 1:1. The ratio was chosen to compensate for lithium loss during calcination, which might have subsequently led to impurities phase formation in the final LTO sample. The sol was aged and then dried at 80 °C for 12 h to form the precursor. The resultant precursor was calcined in a tube furnace at 350 °C for 4 h with a ramp rate of 5 °C min−1, followed by calcination at 800 °C for 12 h in air. The sample is referred to as sol-gel no-assistance (SG-NA).
For the surfactant prepared LTO, a triblock copolymer (HO(CH2CH2O)20(CH2CH(CH3)O)70(CH2CH2O)20H) (P123) (Sigma Aldrich, St. Louis, MO, USA) was dissolved in ethanol in the desired P123:Ti ratio (1:2) and was added during the precursor mixing.
For the ball-mill prepared LTO, the precursor was placed in a sealed jar with agate balls and ball-milled in a planetary ball mill (MTI) with a speed of 250 rpm. The sample was further heat-treated using the procedure mentioned earlier. The samples prepared with ball-mill and surfactant are referred to as SG-BM and SG-S, respectively.
2.2. Material Characterization
X-ray diffraction (XRD, Rigaku D/max-γB) was done with monochromated Cu Kα radiation at a step size of 2° min−1 and a counting time of 2 s step−1 in a range of 15–80°. The morphology and the particle size of the samples were examined using a transmission electron microscope (TEM) and scanning electron microscope (SEM). The particle distribution was obtained using the commercial imaging software ImageJ on the micrographs taken from the analysis. Surface analysis was done using a surface analyzer (Quantachrome, Autosorb-iQ, VA, USA) using the nitrogen gas adsorption–desorption isotherms at 77 K, and the sample was outgassed before analysis at 150 °C for 4 h.
2.3. Electrochemical Measurements
The samples’ electrochemical properties were studied in a two-electrode Li metal vs. LTO half-cell format using a coin-cell (CR2032) and a full-cell pouch configuration with activated carbon (AC) cathode. The AC preparation was described in our previous reports [3,5], and the mass loading was 6 mg cm−2 for all full LIC cells. The LTO electrode was prepared using the wet method, and the composition was 83:10:7 (by wt%) of LTO, conductive carbon (TIMICAL super C65), and polyvinylidene fluoride (PVDF) binder, respectively, blended using N-methyl-2-pyrrolidine (NMP) solvent. The electrodes were roll-pressed to similar thicknesses with a mass loading between 2–3 mg cm−2 and were punched into an area of 1.27 cm2 for the half-cell and 24 cm2 for the full. It was subsequently dried in a vacuum oven at 120 °C overnight before assembling. The coin cell was made in an argon atmosphere glovebox (0.1 ppm H2O, 0.1 ppm O2) by stacking a Li metal anode (0.025 cm, MTI), a porous separator (Celgard 2400, 25 µm), and an LTO cathode in sequence into a 2032-type coin cell. Good interfacial contacts were ensured by pressing the sandwich between two metallic plates with a spring. The electrolyte solution used for all the cells was 1M LiPF6 in 1:1 ethylene carbonate (EC) and dimethyl carbonate (DMC) (Sigma Aldrich, St. Louis, MO, USA). The assembled LIC cells are referred to as LIC-SG-NA, LIC-SG-BM, and LIC-SG-S.
The electrochemical characterization was done at room temperature (25 ± 1 °C). The galvanostatic charge/discharge studies were done at a constant charge/discharge in a potential range of 1.0–2.5 V (vs. Li/Li+) for the half-cell and a voltage range of 2.5 to 0.9 V for the LIC full cell. The synthesized samples’ initial capacity was obtained after three cycles at a specific current of 17 mA g−1 using a Neware test system. A rate capability study on the LIC cell was done at a specific current range of 17 to 3500 mA g−1. The LIC full cell electrochemical impedance spectroscopy (EIS) measurement was conducted at a fully charged state of 2.5 V in the frequency range of 0.1 Hz to 1 MHz with an AC amplitude of 5 mV using Gamry Instruments. All EIS spectra were fitted using the Zview software. The specific energy and maximum specific power were obtained using the equations below [27]:
where i is the current (A), V is the cell voltage (V), td is the discharge time (s), Vmax is the maximum operating cell voltage of 2.5 V, ESR is the equivalent series resistance of the LIC cell, and mactive is the total mass of the cathode and anode excluding the electrode additives, i.e., binder and conductive carbon, current collectors, separators, electrolytes, and cell packages.
3. Results and Discussion
3.1. Structural and Morphological Characterization
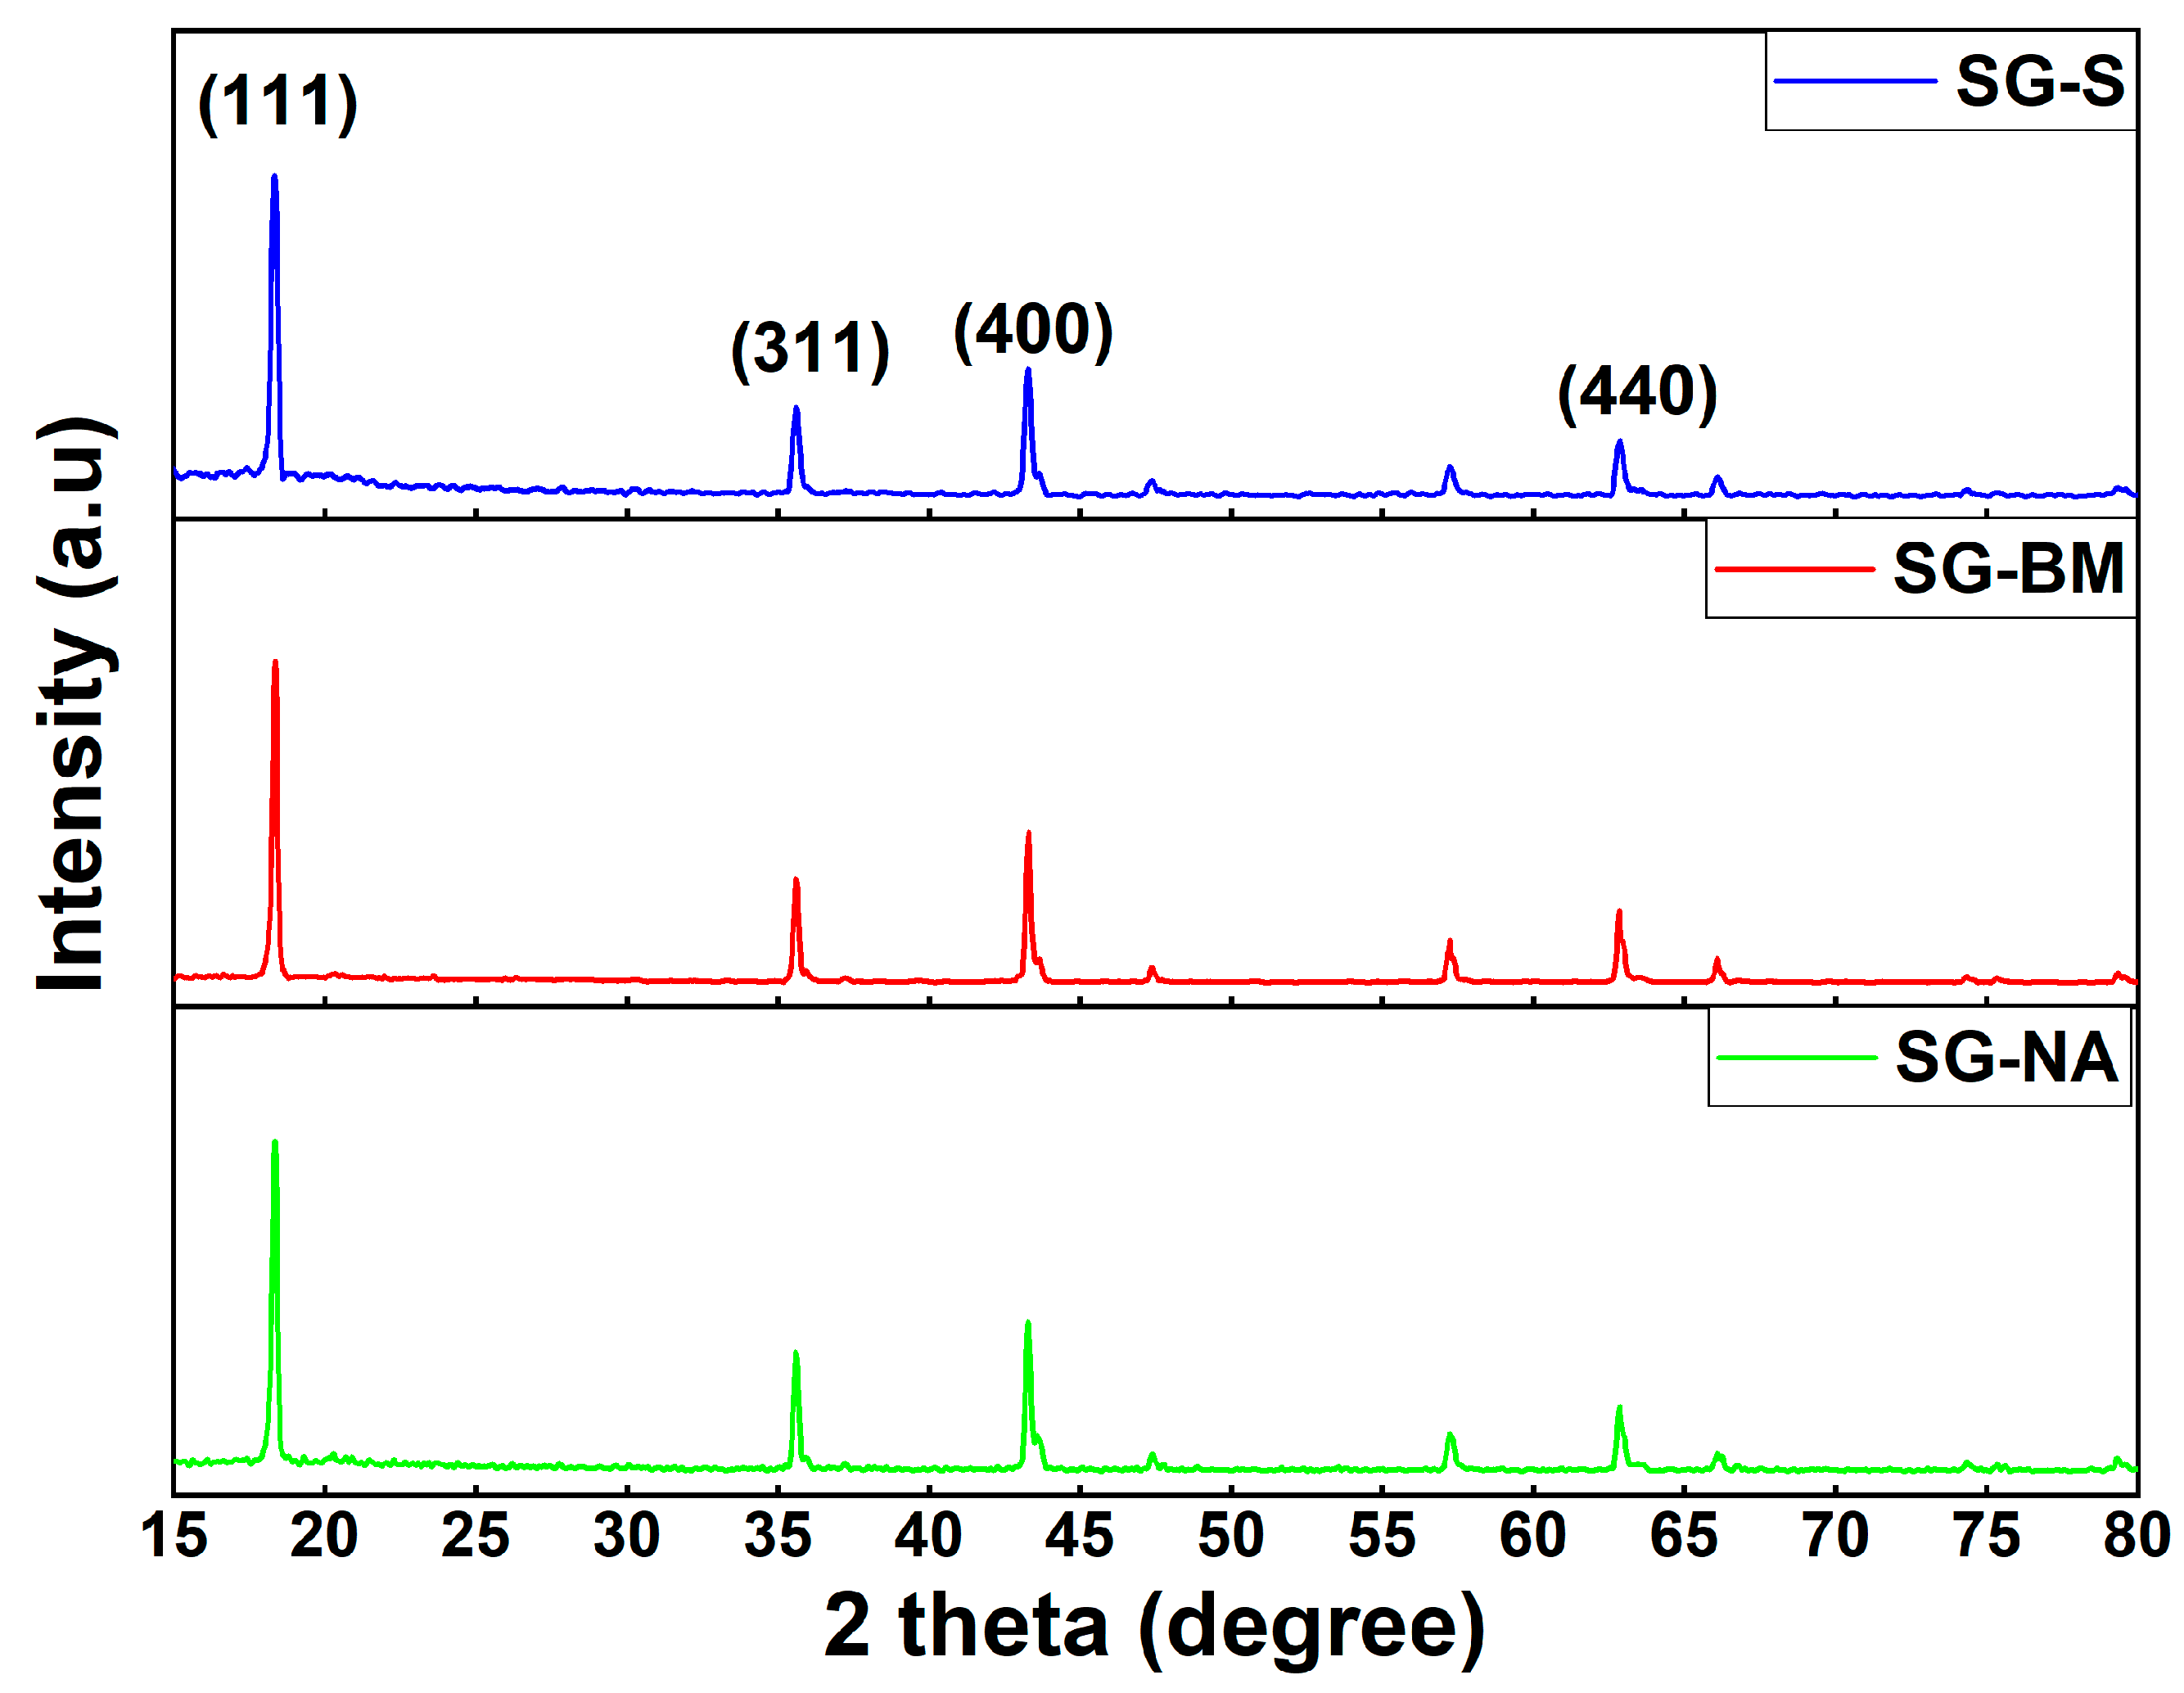
The first major determining factor on how well an anode material will perform in the LIC system is its structural properties, and it significantly depends on the synthesis process. Hence, the same synthesis process was employed to keep the structural properties’ effect constant on all the prepared LTO samples. Figure 1 shows the XRD patterns of the samples. All the diffraction peaks of the samples were indexed as a cubic spinel structure with Fd-3m space group [14,28,29,30] with ions located at the tetrahedral 8a sites, and tetravalent ions and lithium-ions (Li+) were randomly distributed at octahedral 16d sites, whereas oxygen ions were located at the 32e sites [Li]8a[Li1/3Ti5/3]16d[O4]32e. The major diffraction peaks at 2θ = 18°, 35°, 43°, and 63° corresponded to (111), (311), (400), and (440) planes, respectively, which are well in accordance with those in JCPDS card No. 26-1198, confirming the formation of pure LTO samples. The sharp peaks detected were indicative of the formation of a pure crystalline LTO sample. No other peaks that might correspond to impurity peaks, e.g., TiO2 or Li2TiO3, were detected.
The unit cell parameter (ac) of the LTO crystal was obtained from the XRD result and is listed in Table 1. The obtained cell parameters were within the range reported for LTO crystal lattice, between 0.8352 and 0.8370 nm [15,25]. The average crystallite size was calculated from the XRD line broadening using Scherer’s equation, below:
where d is the average crystallite size, k is a constant of 0.9, λ is the X-ray wavelength of Cu, which is 0.1541 nm, B is the full width at half maximum (FWHM) of the peak; and θ is the Bragg angle. The peaks were fitted using the Gaussian fit, and the full width at half maximum (FWHM) was calculated and used to estimate the average crystallite sizes, which is summarized in Table 1. It was observed from Table 1 that all LTO samples had similar crystallite sizes. This was to be expected since the crystallite size is dependent on the calcination time and temperature used to obtain the samples. In this case, the processing step was the same for all the samples, hence the similarity. The samples’ crystal structure was also investigated using TEM analysis, and the result further confirmed similarity in the structure of the samples prepared (see Figure S1). Therefore, it was expected that the effect of structural properties on the performance would be similar for all the prepared LTO samples, hence ensuring a fair and reasonable conclusion.
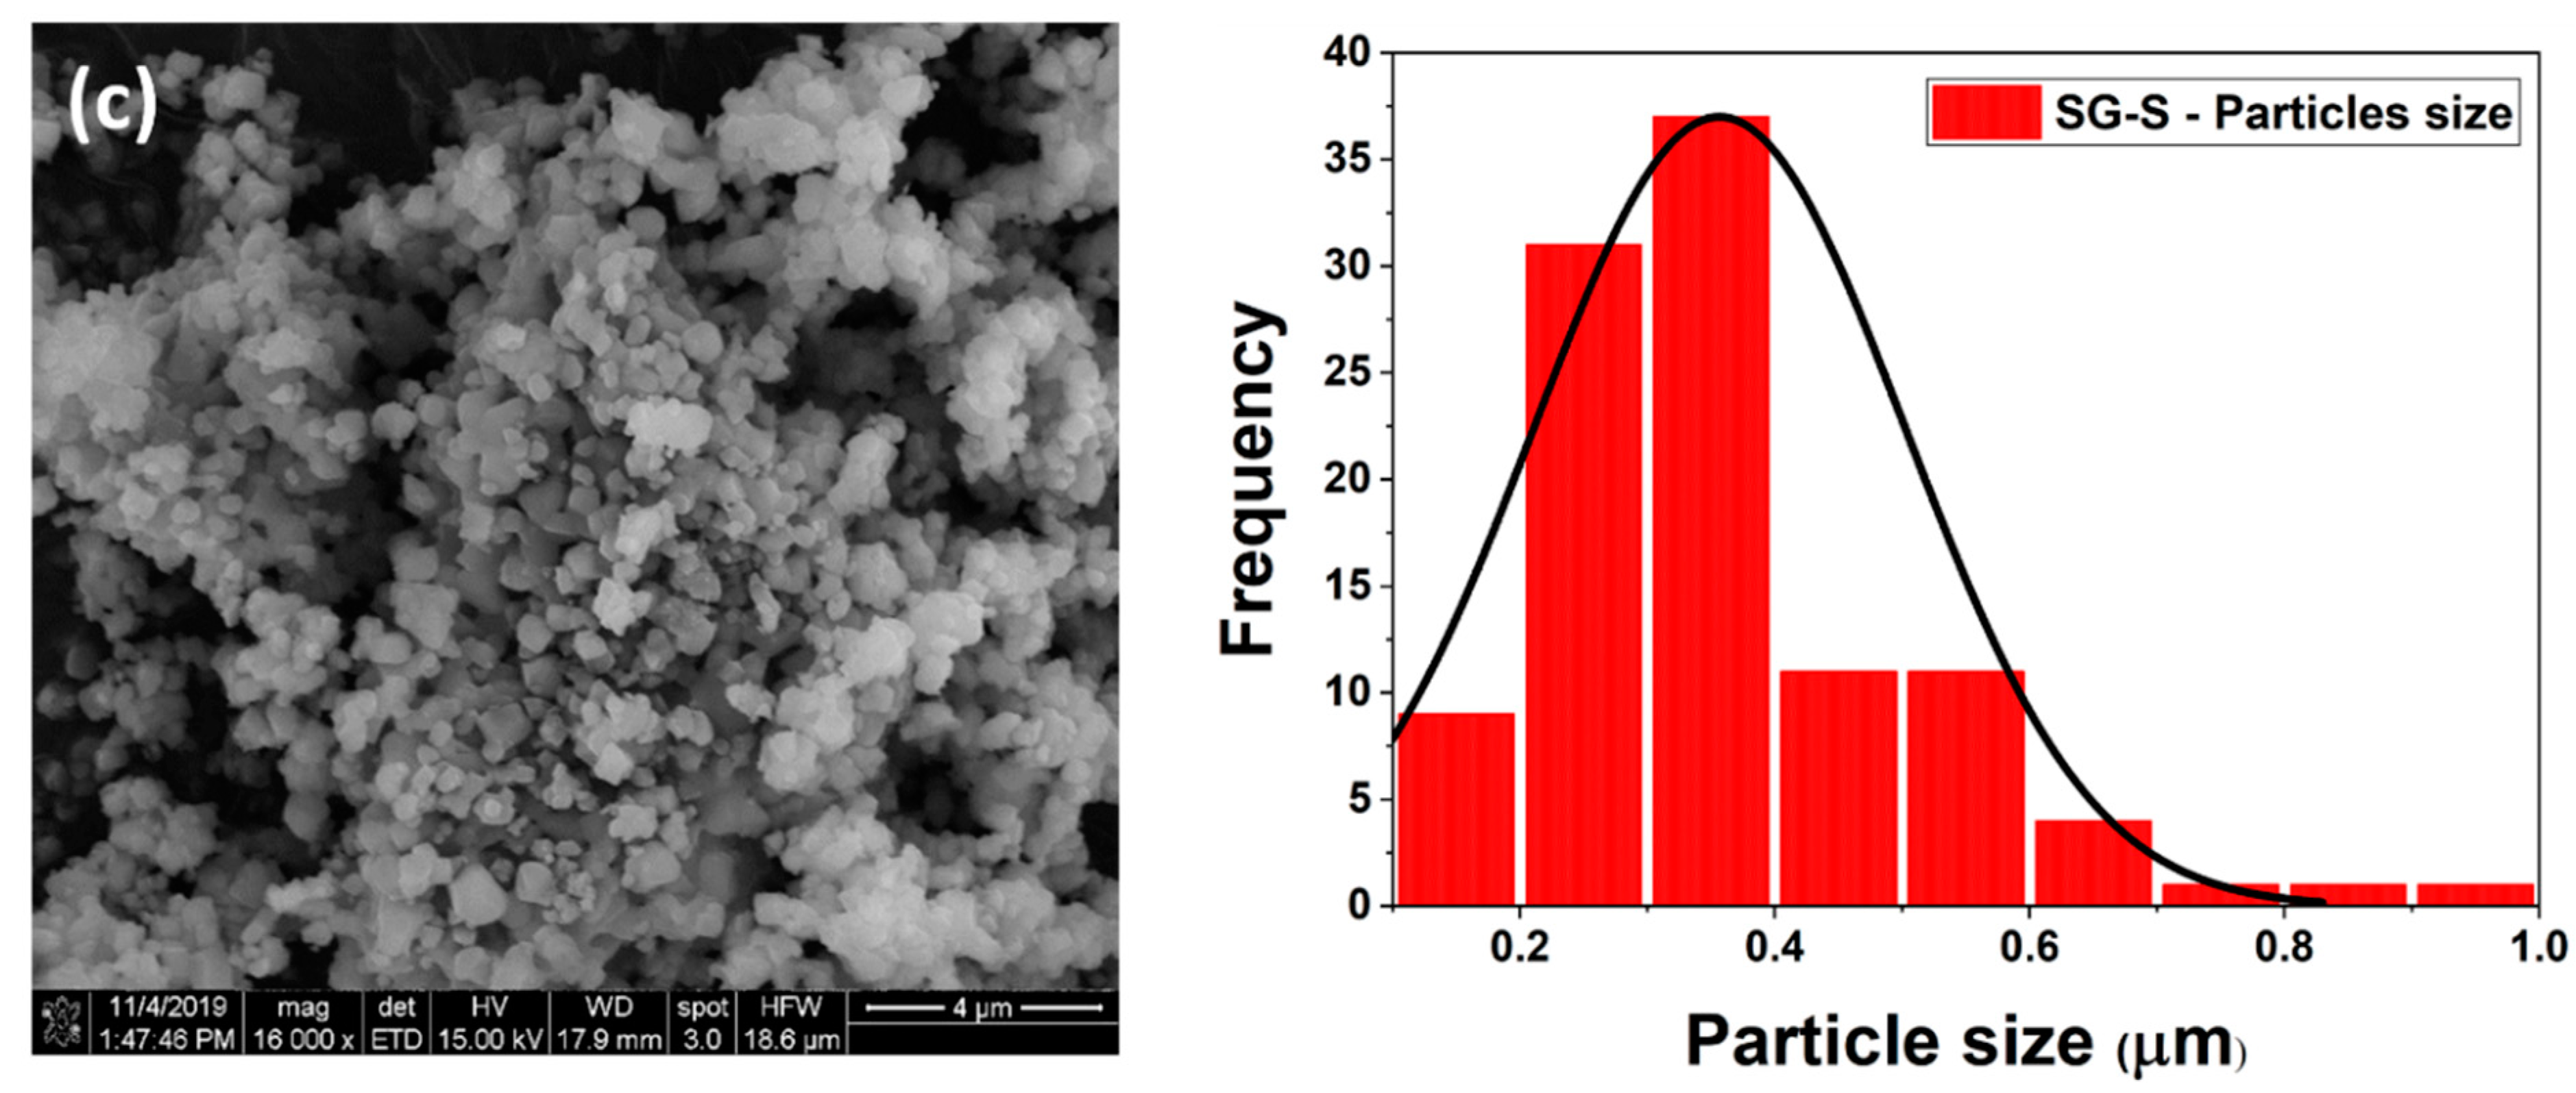
The anode material’s morphological properties are important parameters that were needed to understand the anode performance in the LIC device. The morphological properties of the samples were investigated by TEM and SEM analysis. Figure 2 shows the prepared sample’s SEM images and the particle size distribution histogram. The samples possessed a typical cubic morphology with faceted particles of well-defined edges. The SEM image shown in Figure 2a for SG-NA shows densely aggregated particles. The TEM image (Figure S2) also shows dark images, indicating the electron beams’ inability to penetrate through the LTO sample because of the massive aggregation. The particle size distribution histogram for SG-NA shows a broad particle distribution with a large number of micron-sized particles and few nano-sized particles. The average particle size for SG-NA was calculated to be 900 nm (Table 1). Figure 2b shows the SG-BM sample with irregular particle size distribution with a varied range from nanometers to micrometers. The TEM image shows observable particle edges that formed together due to aggregation, with micro-sized particles that seemed to be surrounded by nanoparticles. Obtaining a uniform and narrow particle size distribution is a challenge due to the limitation on the ball-milling time, energy, and sample purity requirement. Increasing the ball-milling time may lead to the formation of unwanted surface effects (e.g., surface amorphization) or the appearance of impurity phases due to the milling balls, which was also observed in previous literature reports [31,32,33]. Therefore, keeping the milling time short prevented the appearance of impurity phases. The presence of nanoparticles surrounding micron-sized particles reduced the average particle size to 600 nm. For the SG-S sample, small, well-defined particle edges with light contact were observed. This indicated the formation of small particle sizes with good dispersion and uniformity. The particle distribution curve (Figure 2c) showed a large number of nano-sized particles.
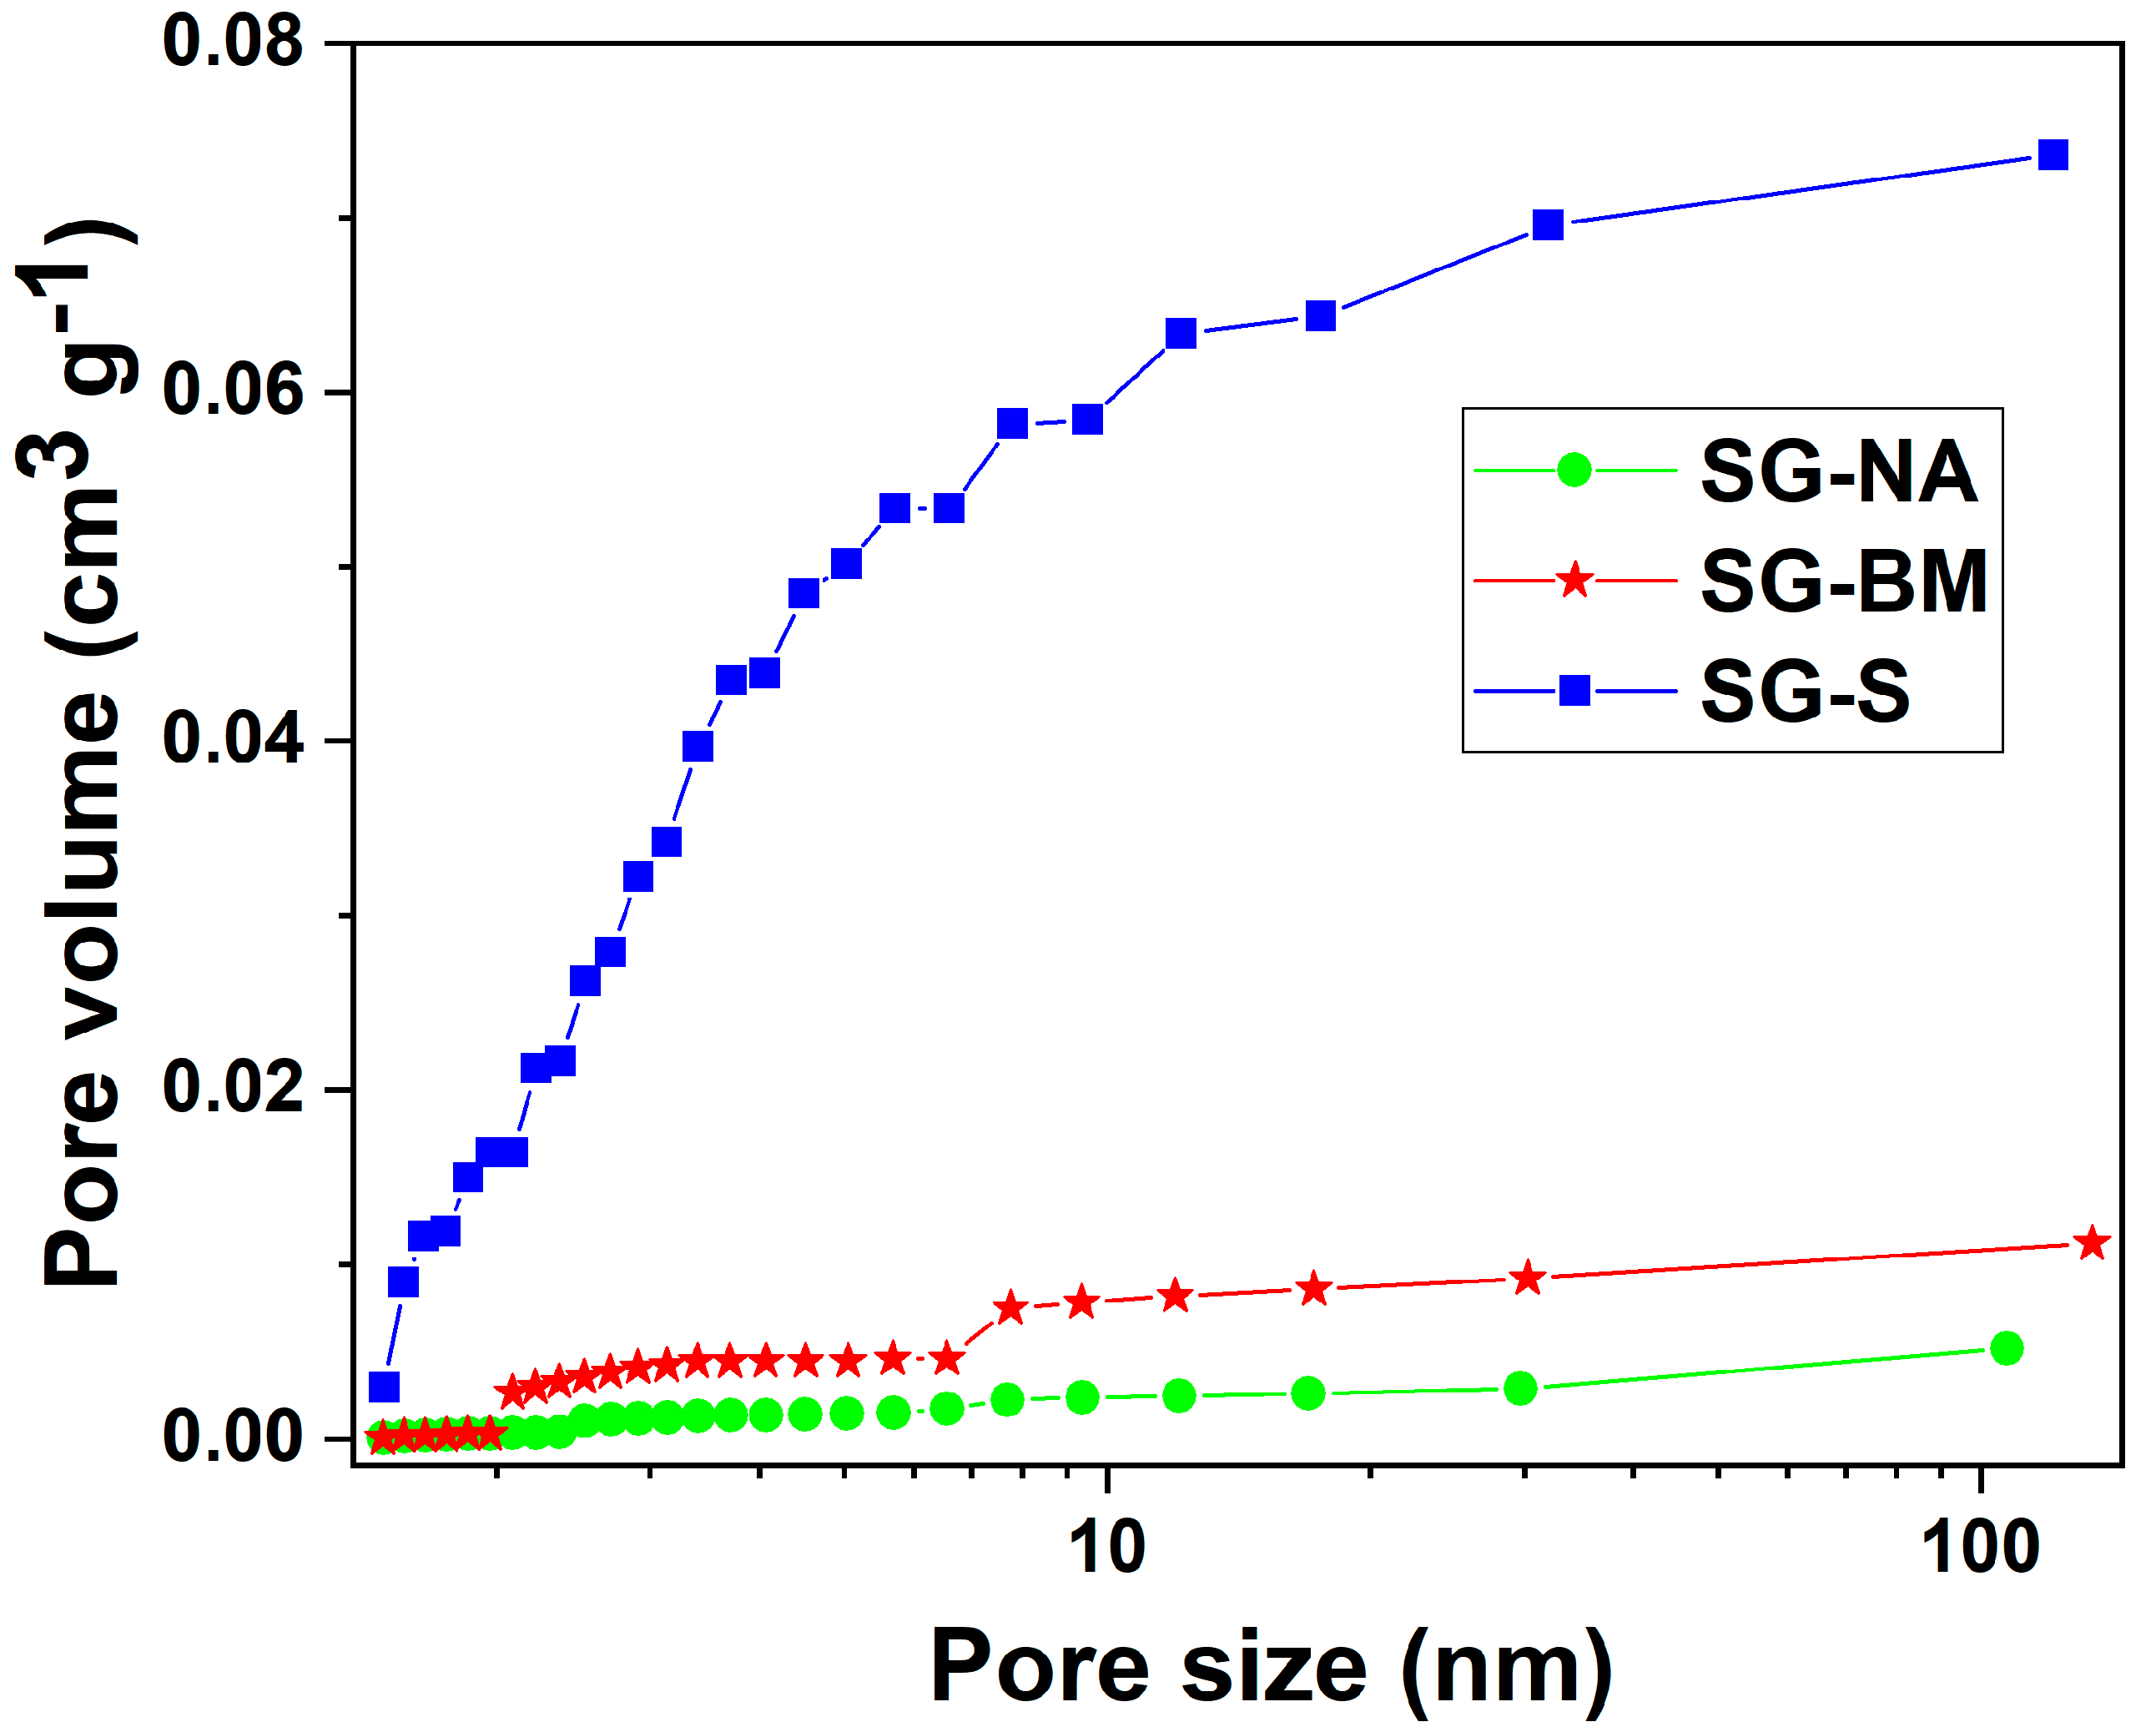
The specific surface area was determined using the BET analysis method (Figure S3), and pore size distribution was obtained from the Barrett–Joyner–Halenda (BJH) method for the samples (Figure 3). All the LTO samples’ pores were mesoporous, with SG-S having a little distribution of micropores and a larger pore volume compared to other samples (Table 1). This was because the P123 surfactant acted as a structure-directing agent to obtain mesoporous materials owing to the PEO–metal complexation interactions [34]. In addition, the presence of P123 during the calcination process led to the creation of pores in the samples, leading to the larger pore volume of the SG-S sample. Although the crystallite sizes were similar, the specific surface area measured was different (Table 1), with the SG-S sample having the highest value of 55 m2 g−1. This can be explained by the fact that the SG-S sample had the smallest particle size, the least aggregation, and the presence of micropores and mesopores. Therefore, more surface was exposed to the adsorption and desorption of N2, hence a higher surface area. The SG-BM specific surface area increased compared to SG-NA because of the larger number of nano-sized particles surrounding the micro-sized particles, as seen from the particle size distribution curve. Hence, it can be observed that the preparation method affected the physical properties of the prepared LTO samples. Therefore, the first difference in the prepared samples was observed.
3.2. Electrochemical Characterization
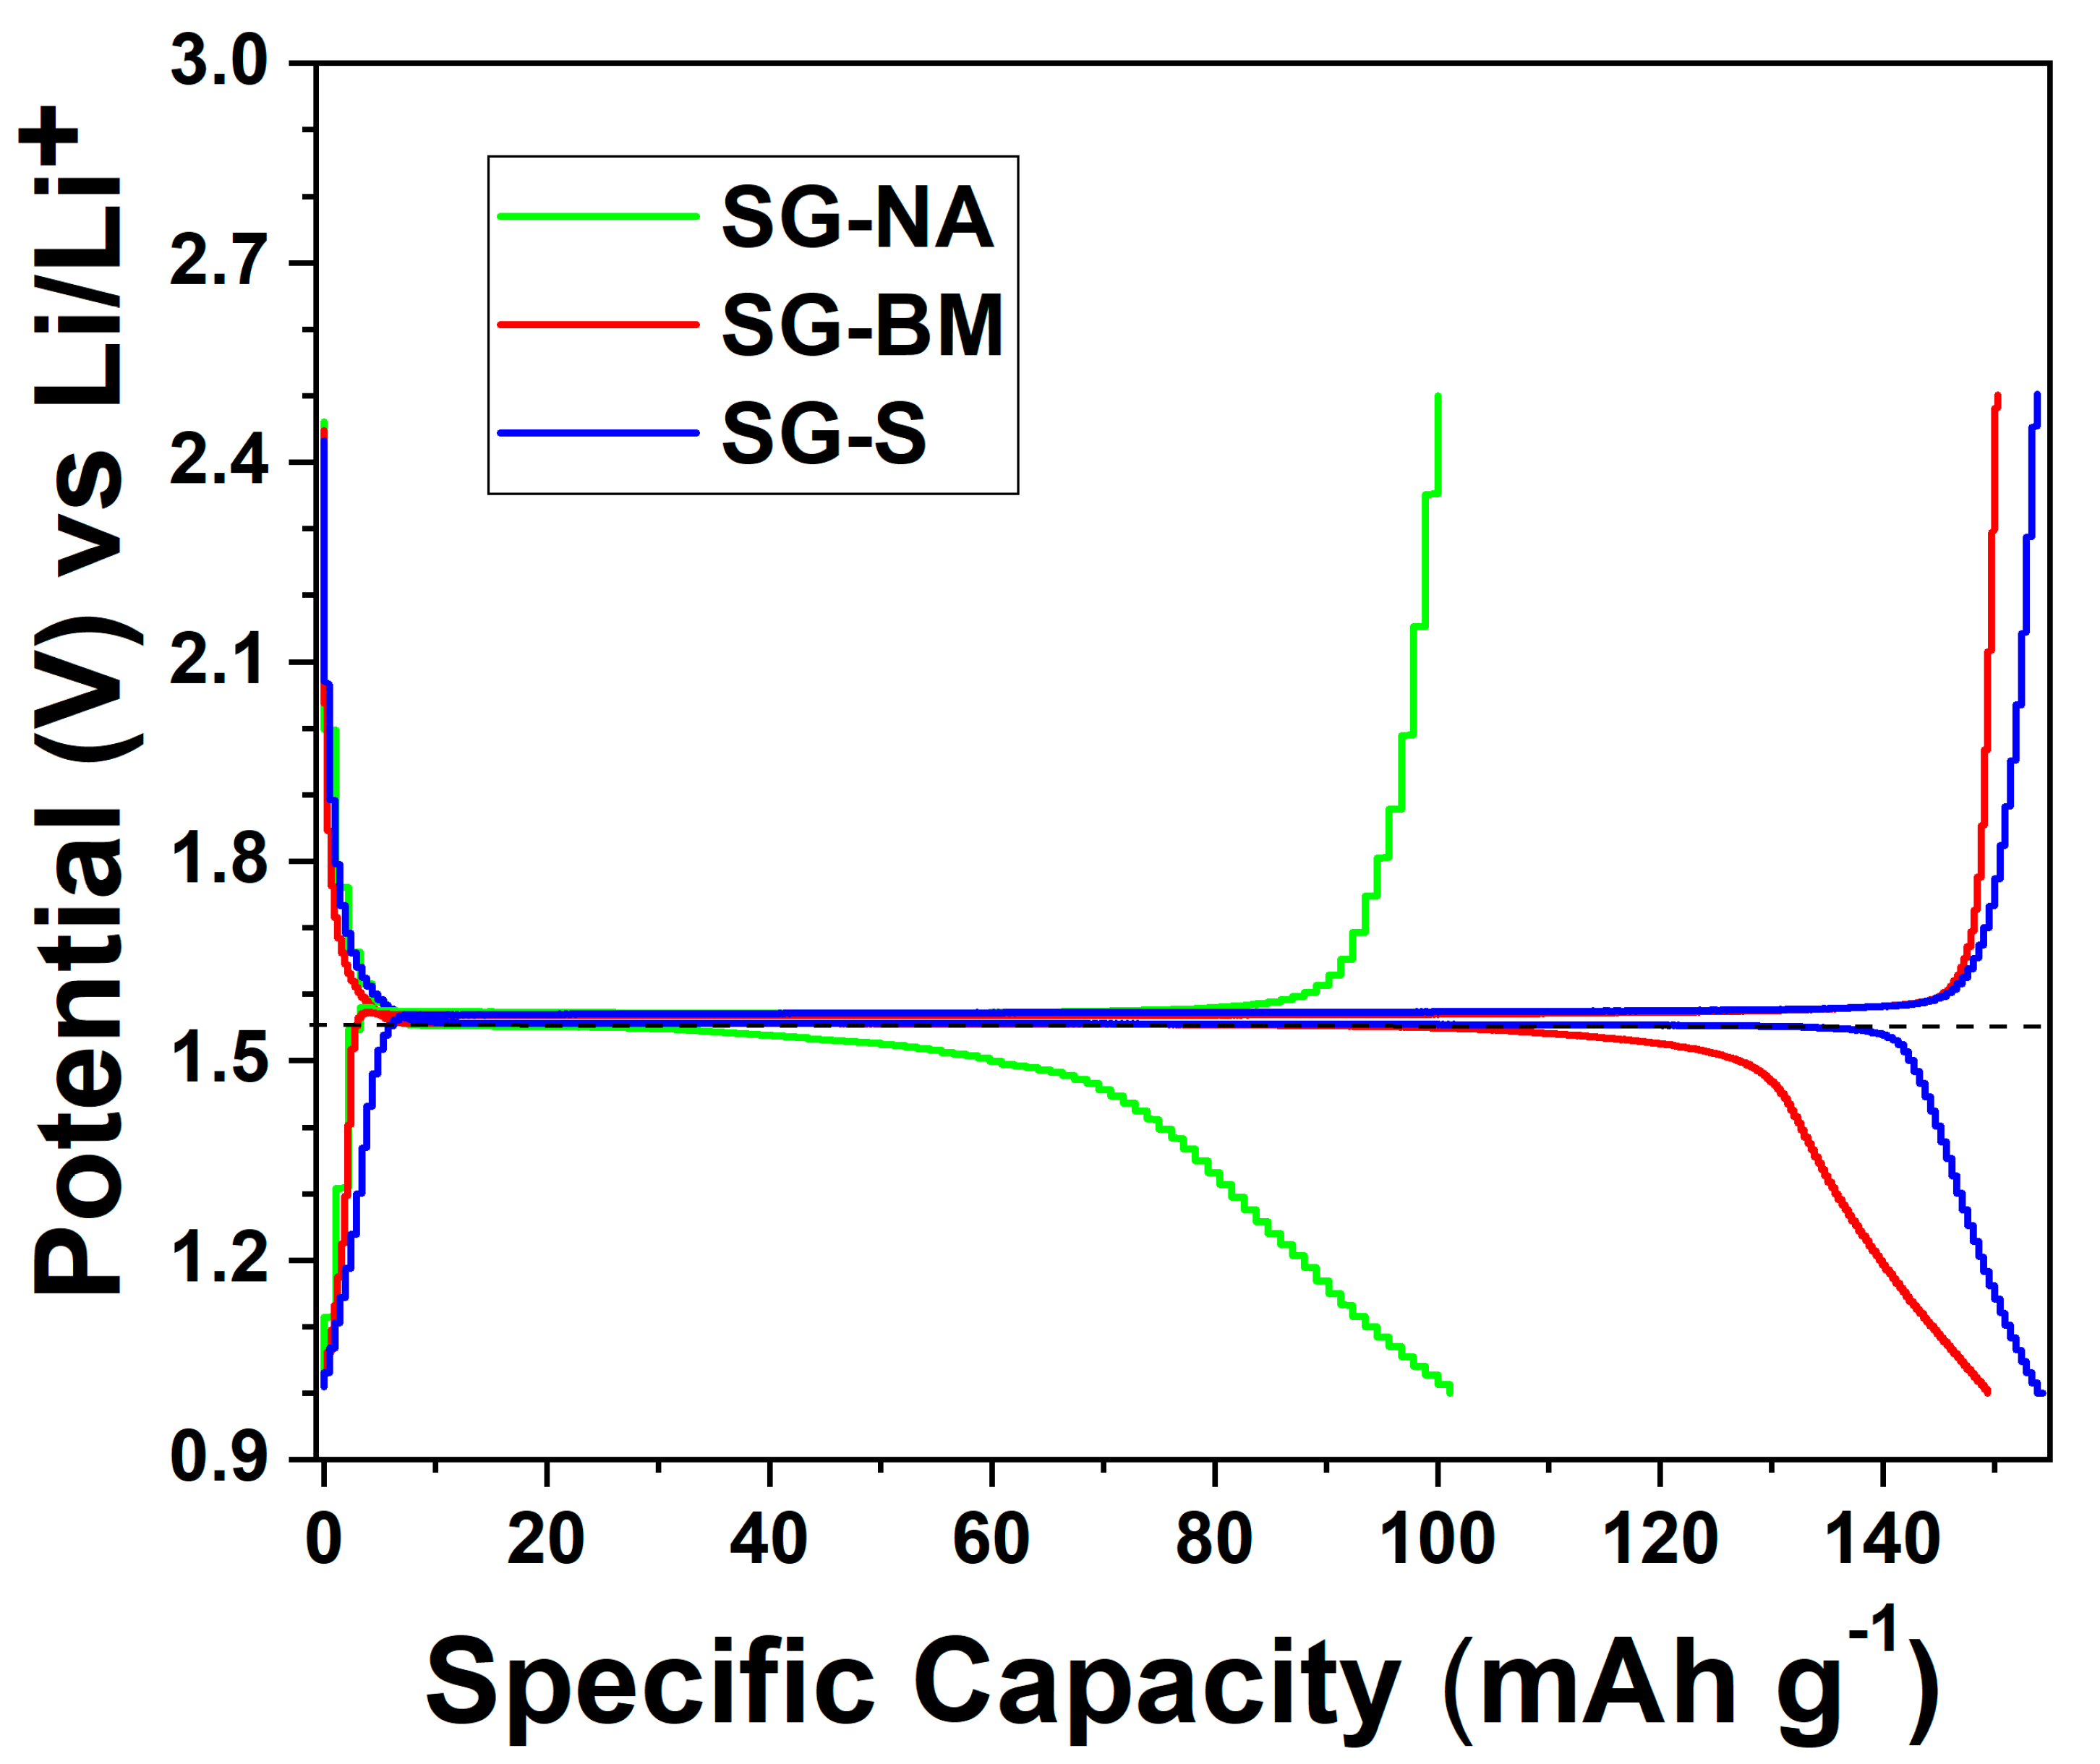
The first performance desired in an anode material for a LIC device is its Li storage capacity, which will determine its final energy density. Before assembling the LIC cells, the samples’ electrochemical performance was studied in a half-cell setup vs. Li/Li+. Figure 4 shows the charge/discharge profile of the LTO samples recorded at a low specific current (17 mA g−1). In all the samples, the voltage dropped rapidly below 2 V until it reached ~1.55 V vs. Li/Li+, where it then proceeded at a constant flat region until it reached another smooth potential drop towards the end of discharge (1.0 V). This has been explained as a single phase–two phase–single phase discharge mechanism typically exhibited by LTO [14]. This process occurs in a reverse manner during the charging state. The discharge specific capacity (based on active material) obtained for the samples is listed in Table 1. The SG-NA sample had a low specific capacity and a high polarization towards the end of charge, and is believed to be due to the aggregation and a large number of micron-sized particles in the sample. Hence, irregular mixing of the active material with conductive carbon occurred during the electrode fabrication process (Figure S4). The performance of SG-BM and SG-S were similar at low specific current. This excellent performance at low specific current is believed to be related to the increased distribution of small particles, reducing Li’s diffusion length in the bulk active material, and facilitating Li storage and less possibility for structural distortions at the surface. In addition, the high specific surface area measured for SG-BM and SG-S compared to SG-NA meant a larger reaction site available for electrode/electrolyte contact and better mixing with conductive carbon to reduce the interparticle resistance, and hence, reduced polarization.
In the LIC device, the volumetric capacity is an important property desired in anode material to achieve a high energy density. The samples’ volumetric capacity was calculated using the electrode’s tap density obtained during fabrication (Table 1). Although the SG-BM sample outperformed SG-NA in terms of the specific capacity, the volumetric capacity was lower than the SG-NA sample. This high tap density resulted from the high packing of the particles observed for SG-NA because of the larger particle size and aggregation, unlike SG-BM and SG-S. The SG-S electrode had a slightly higher tap density compared to SG-BM. Therefore, it edged out as the best sample in terms of the volumetric capacity.
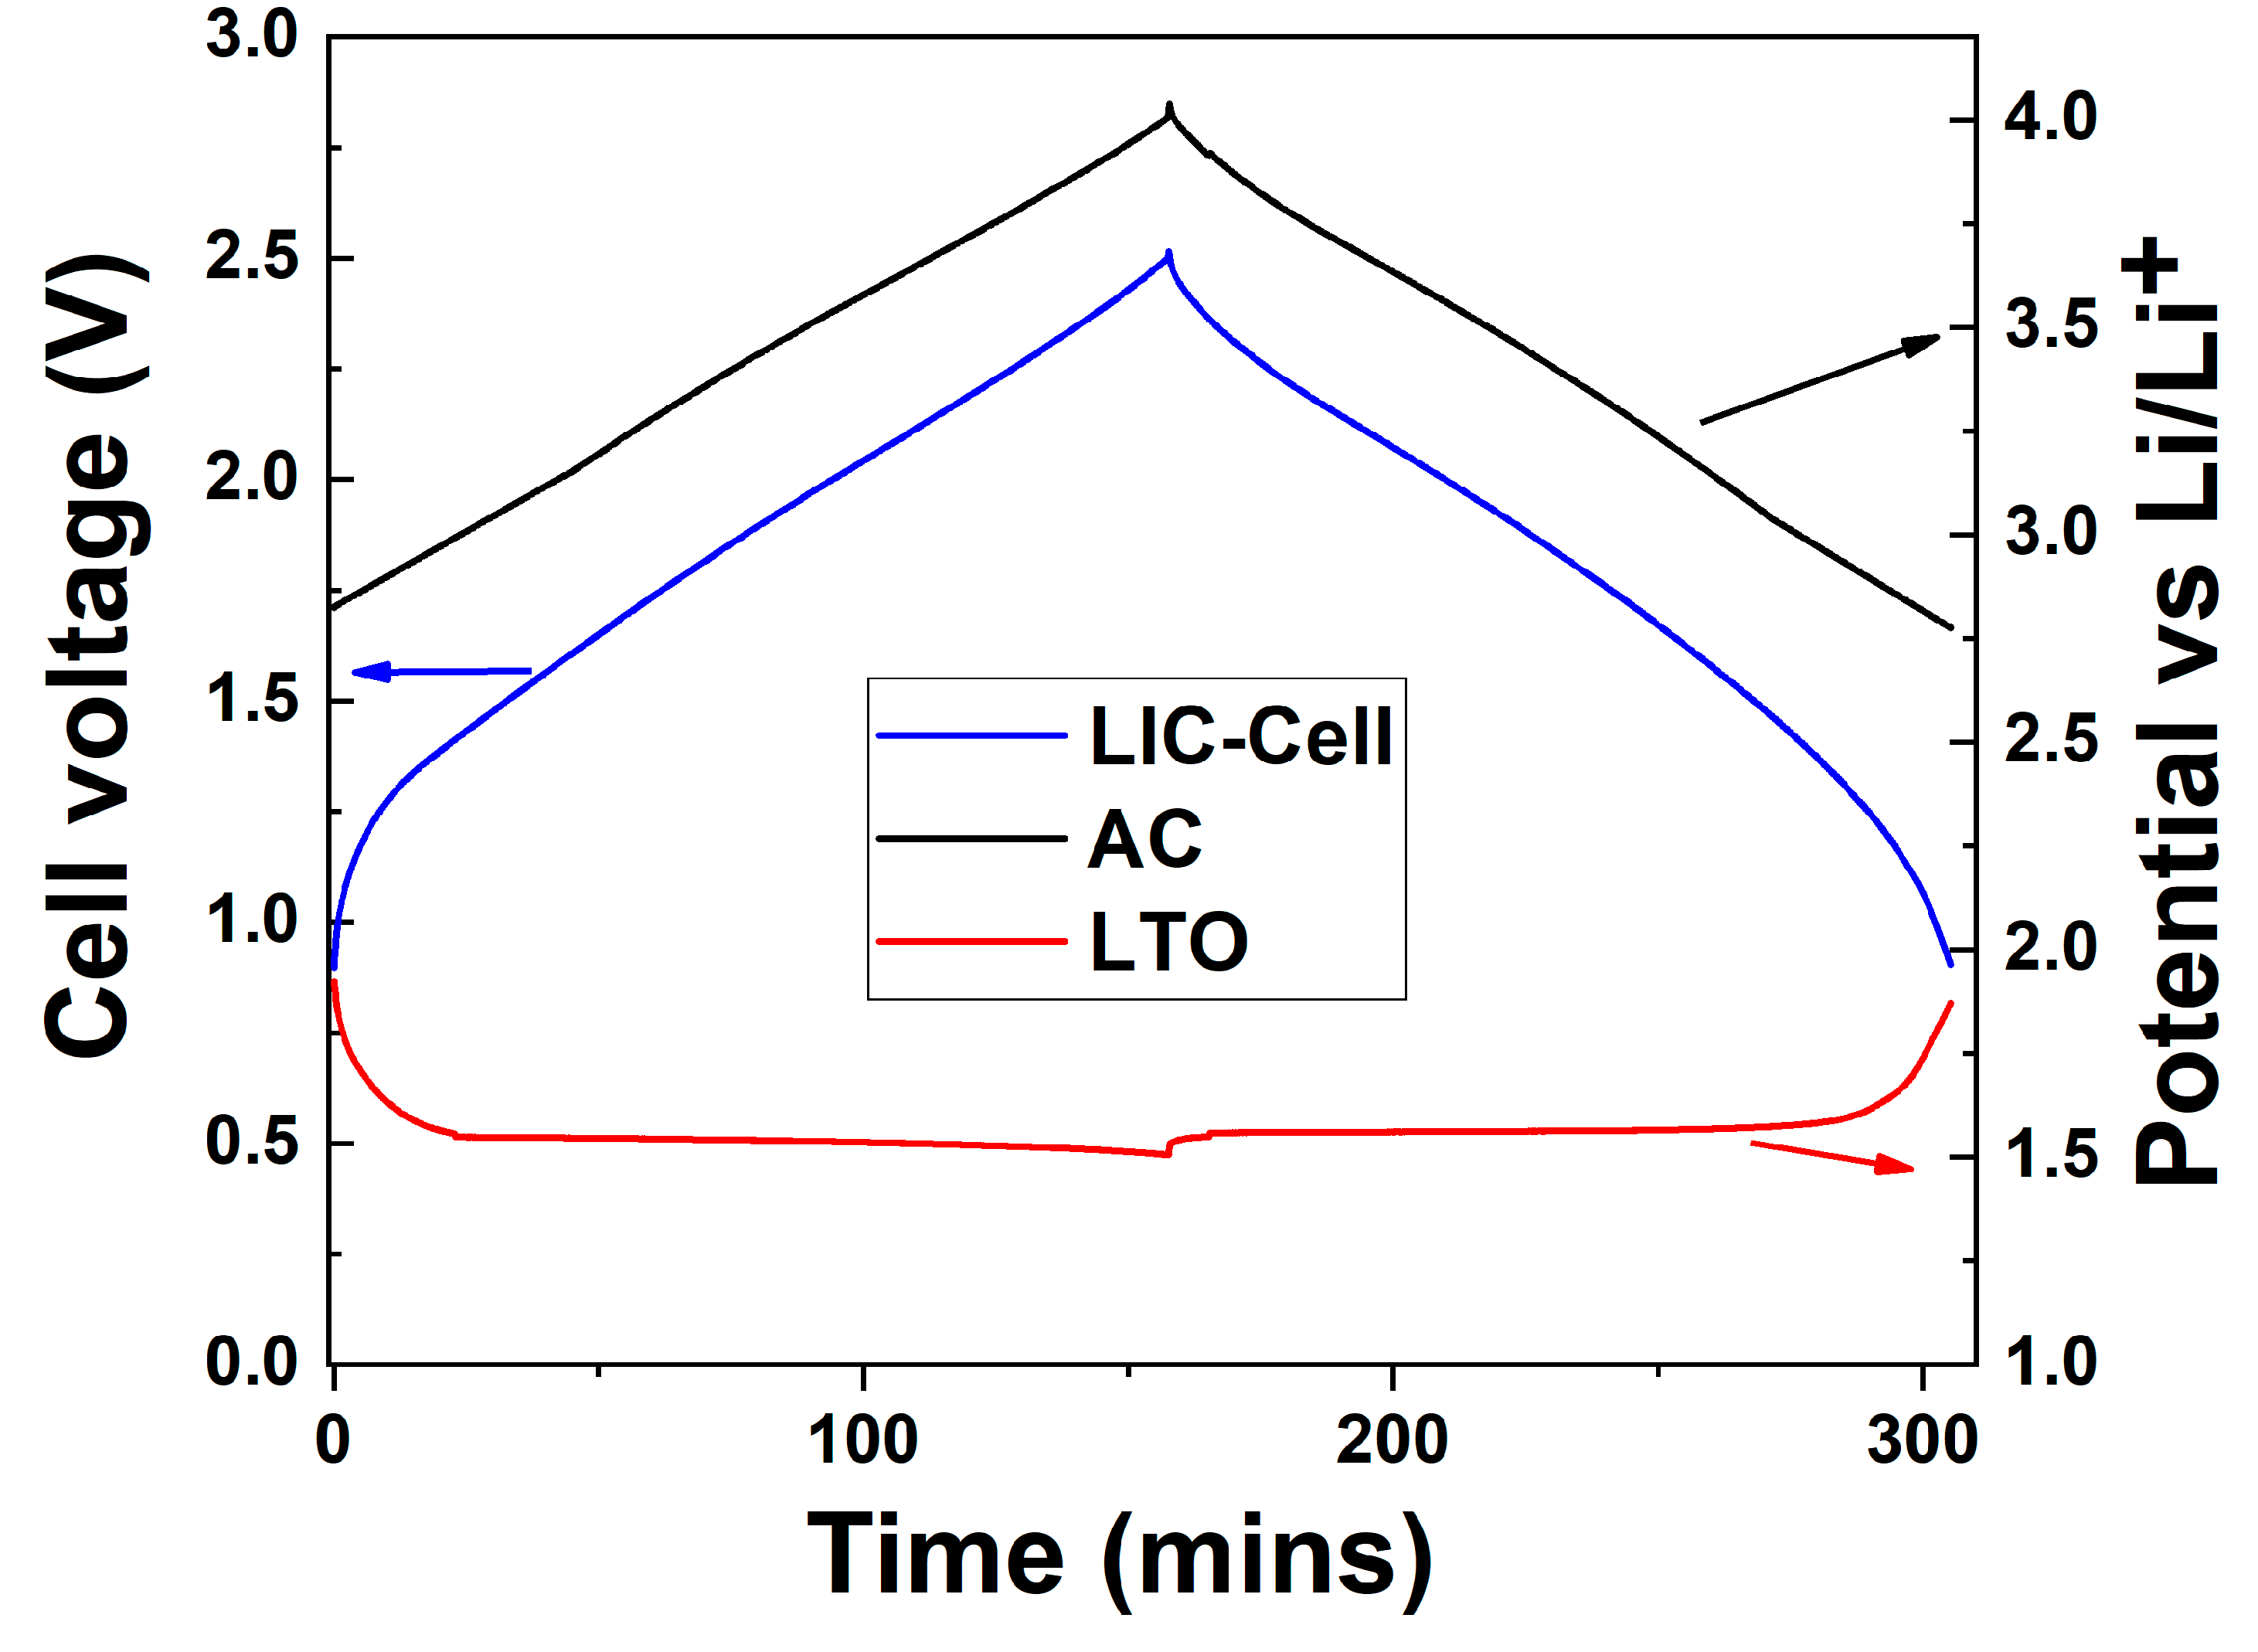
So far, the prepared LTO samples using the ball-mill and the surfactant exhibited similar electrochemical performance in half-cell configuration. Reporting only the specific capacity would not fully explain how the material would perform in a LIC cell configuration. Hence, the materials’ performance needed to be studied in a LIC cell configuration with the cathode, and the electrodes’ capacity ratio all fixed to a similar value for all the samples. In a LIC device, it is well known that the rate-limiting electrode is the anode material due to the faradaic reaction, unlike the surface charge adsorption on the high surface area of AC [5]. Therefore, all the LIC cells assembled with the AC cathode were balanced in a classical way (i.e., AC/LTO capacity ratio: 1). Figure 5 shows the LIC voltage and the electrodes’ potential change for LIC-SG-S at a low specific current. The cathode worked at a safe potential region (2.78–4.0 V), whereas the LTO anode was almost fully lithiated (1.9–1.50 V). A similar profile was exhibited by the other LIC cells, and the cell voltages are shown in Figure S5. The cell voltage showed a curve that deviated from the capacitive response at the beginning of charge and towards the LIC cell’s end-of-discharge. This was due to the LTO anode’s influence with a sharp potential drop in the regions observed from the half-cell performance in Figure 4. The calculated specific energy based on the active material was 26 Wh kg−1, 36 Wh kg−1, and 39 Wh kg−1 for LIC-SG-NA, LIC-SG-BM, and LIC-SG-S, respectively, at 87 mA g−1. The specific energy of LIC-SG-BM and LIC-SG-S was similar because of the high specific capacity obtained from the half-cell testing result. However, the specific energy of LIC-SG-NA was much lower than the rest of the samples.
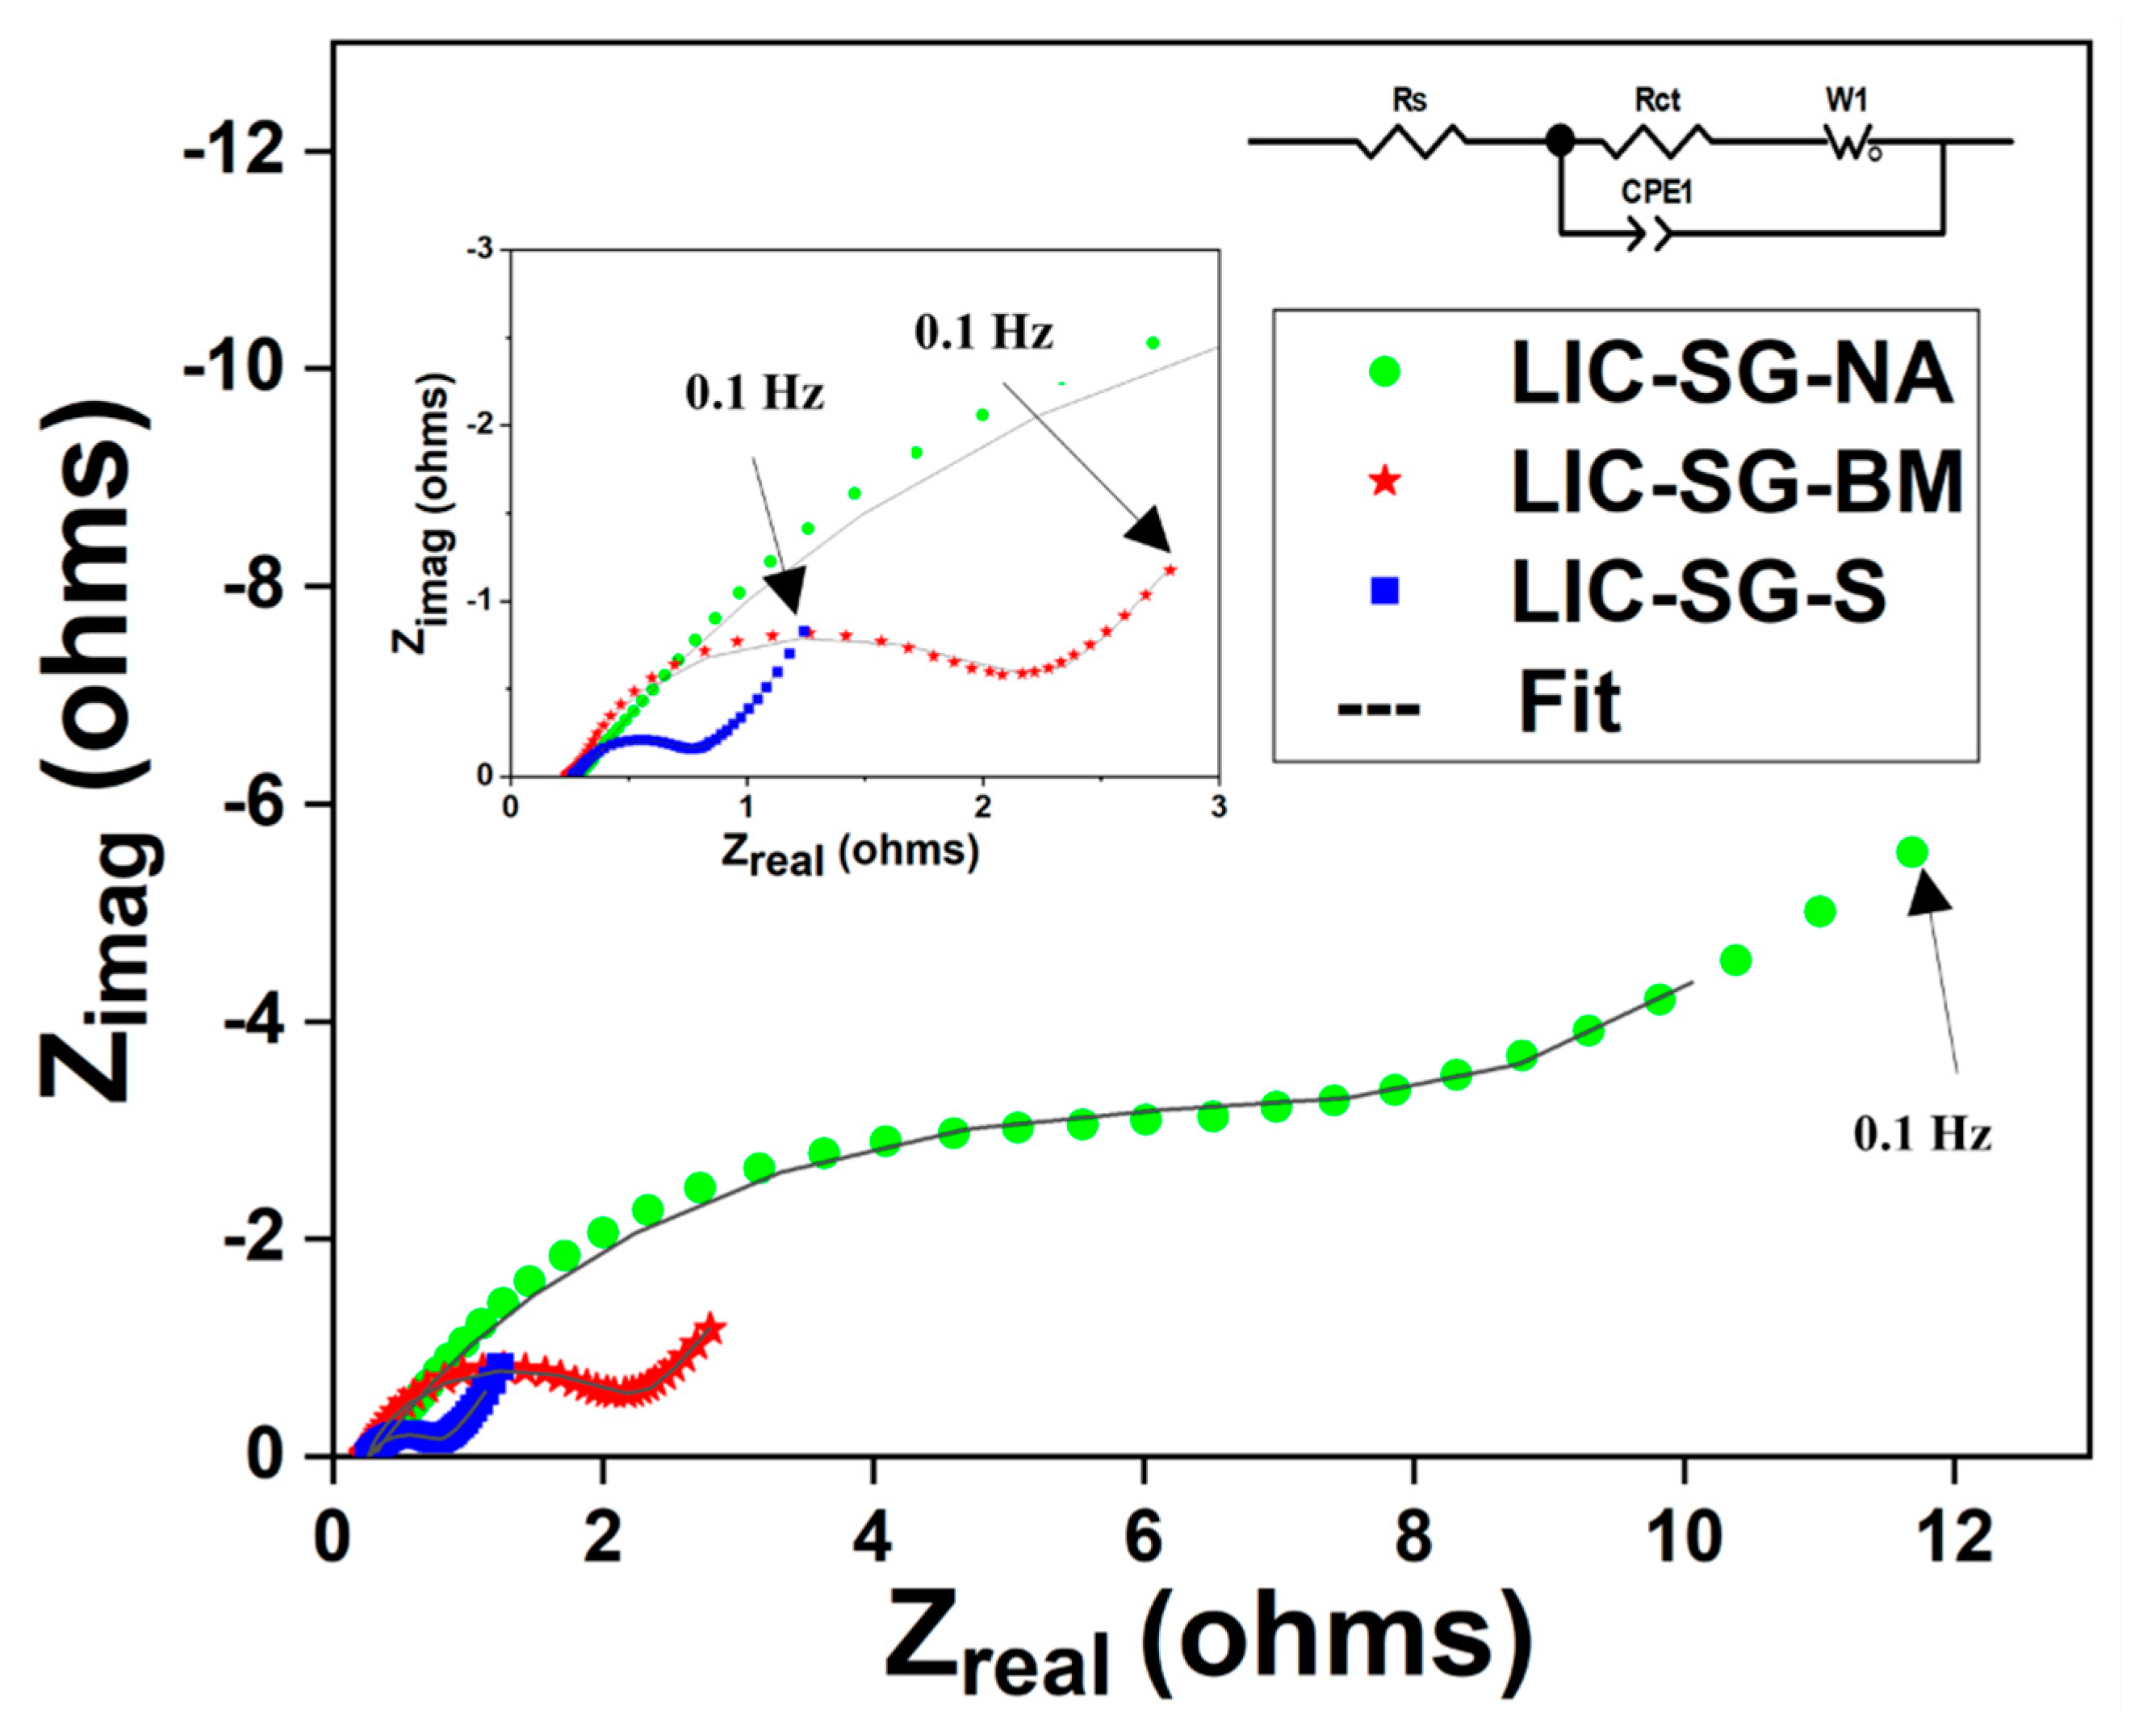
An electrochemical impedance test was performed to better understand the assembled LIC’s electrochemical kinetics with the prepared LTO anodes. The EIS measurement was done in the lithiated state of the prepared LTO anode. All the curve shown in Figure 6 possessed a depressed semi-circle in the high- to middle-frequency region, which corresponded to the charge transfer resistance, Rct. This was due to the charge exchange at the electrode particles’ interface with the electrolyte during the insertion/extraction process that happened at the anode material. A 45° straight line was observed in the low-frequency region, which corresponded to Warburg (Zw) impedance. It was the Li diffusion process in the bulk of the active electrode material (solid-phase diffusion). The x-axis intercept on the EIS spectra corresponded to the ohmic and ionic resistances, Rs, due to the separator’s contributions, electrode contact resistance, and ion concentration in electrolytes [35]. From the observed EIS spectra, all the LIC cells had similar contact resistance (Rs). However, all the LIC cells’ charge transfer resistances (the depressed semi-circle) differed significantly according to the prepared LTO anode since the faradaic process only contributed to the charge transfer resistance. LIC-SG-S had the lowest charge transfer resistance, and this was because of the small particle size, good particle dispersion, and large surface area exhibited by the SG-S anode. This high surface area increased the electrode/electrolyte contact area, ensuring more charge transfer processes could occur at multiples points on the active material’s surface. Hence, more charge exchange could take place during high rate operation at a short charge/discharge time. LIC-SG-BM had a slightly larger depressed semi-circle, indicating higher charge transfer resistance compared to LIC-SG-S. This was because of the large particles present in the SG-BM anode sample with more particle aggregation and a lower specific surface area compared to the SG-S anode. Therefore, fewer reaction sites to facilitate the charge transfer process, hence the increased charge transfer resistance. The LIC-SG-NA had a significantly large depressed semi-circle in the high- to medium-frequency region, suggesting higher charge transfer resistance compared to the rest of the LIC cells. This was because of the high particle aggregation and low specific surface area observed for the SG-NA anode compared to the SG-BM and SG-S anodes. Also, is a result of poor mixing with conductive carbon (Figure S4b), which increased its interparticle resistance, increasing the charge transfer resistance. Moreover, the low-frequency tail was different for all the cells, which was a major contribution from the LTO anode material. The tail for the LIC-SG-S cell was shorter compared to the LIC-SG-BM and LIC-SG-NA cells. This indicates reduced diffusion resistance of Li in the bulk of the SG-S anode. This was due to the small particle size reducing the diffusion length for Li. The LIC-SG-NA had the largest diffusion resistance due to the massive aggregation and larger particle size. Therefore, LIC-SG-S exhibited the least electrochemical impedance that would help facilitate the LIC device’s rate capability.
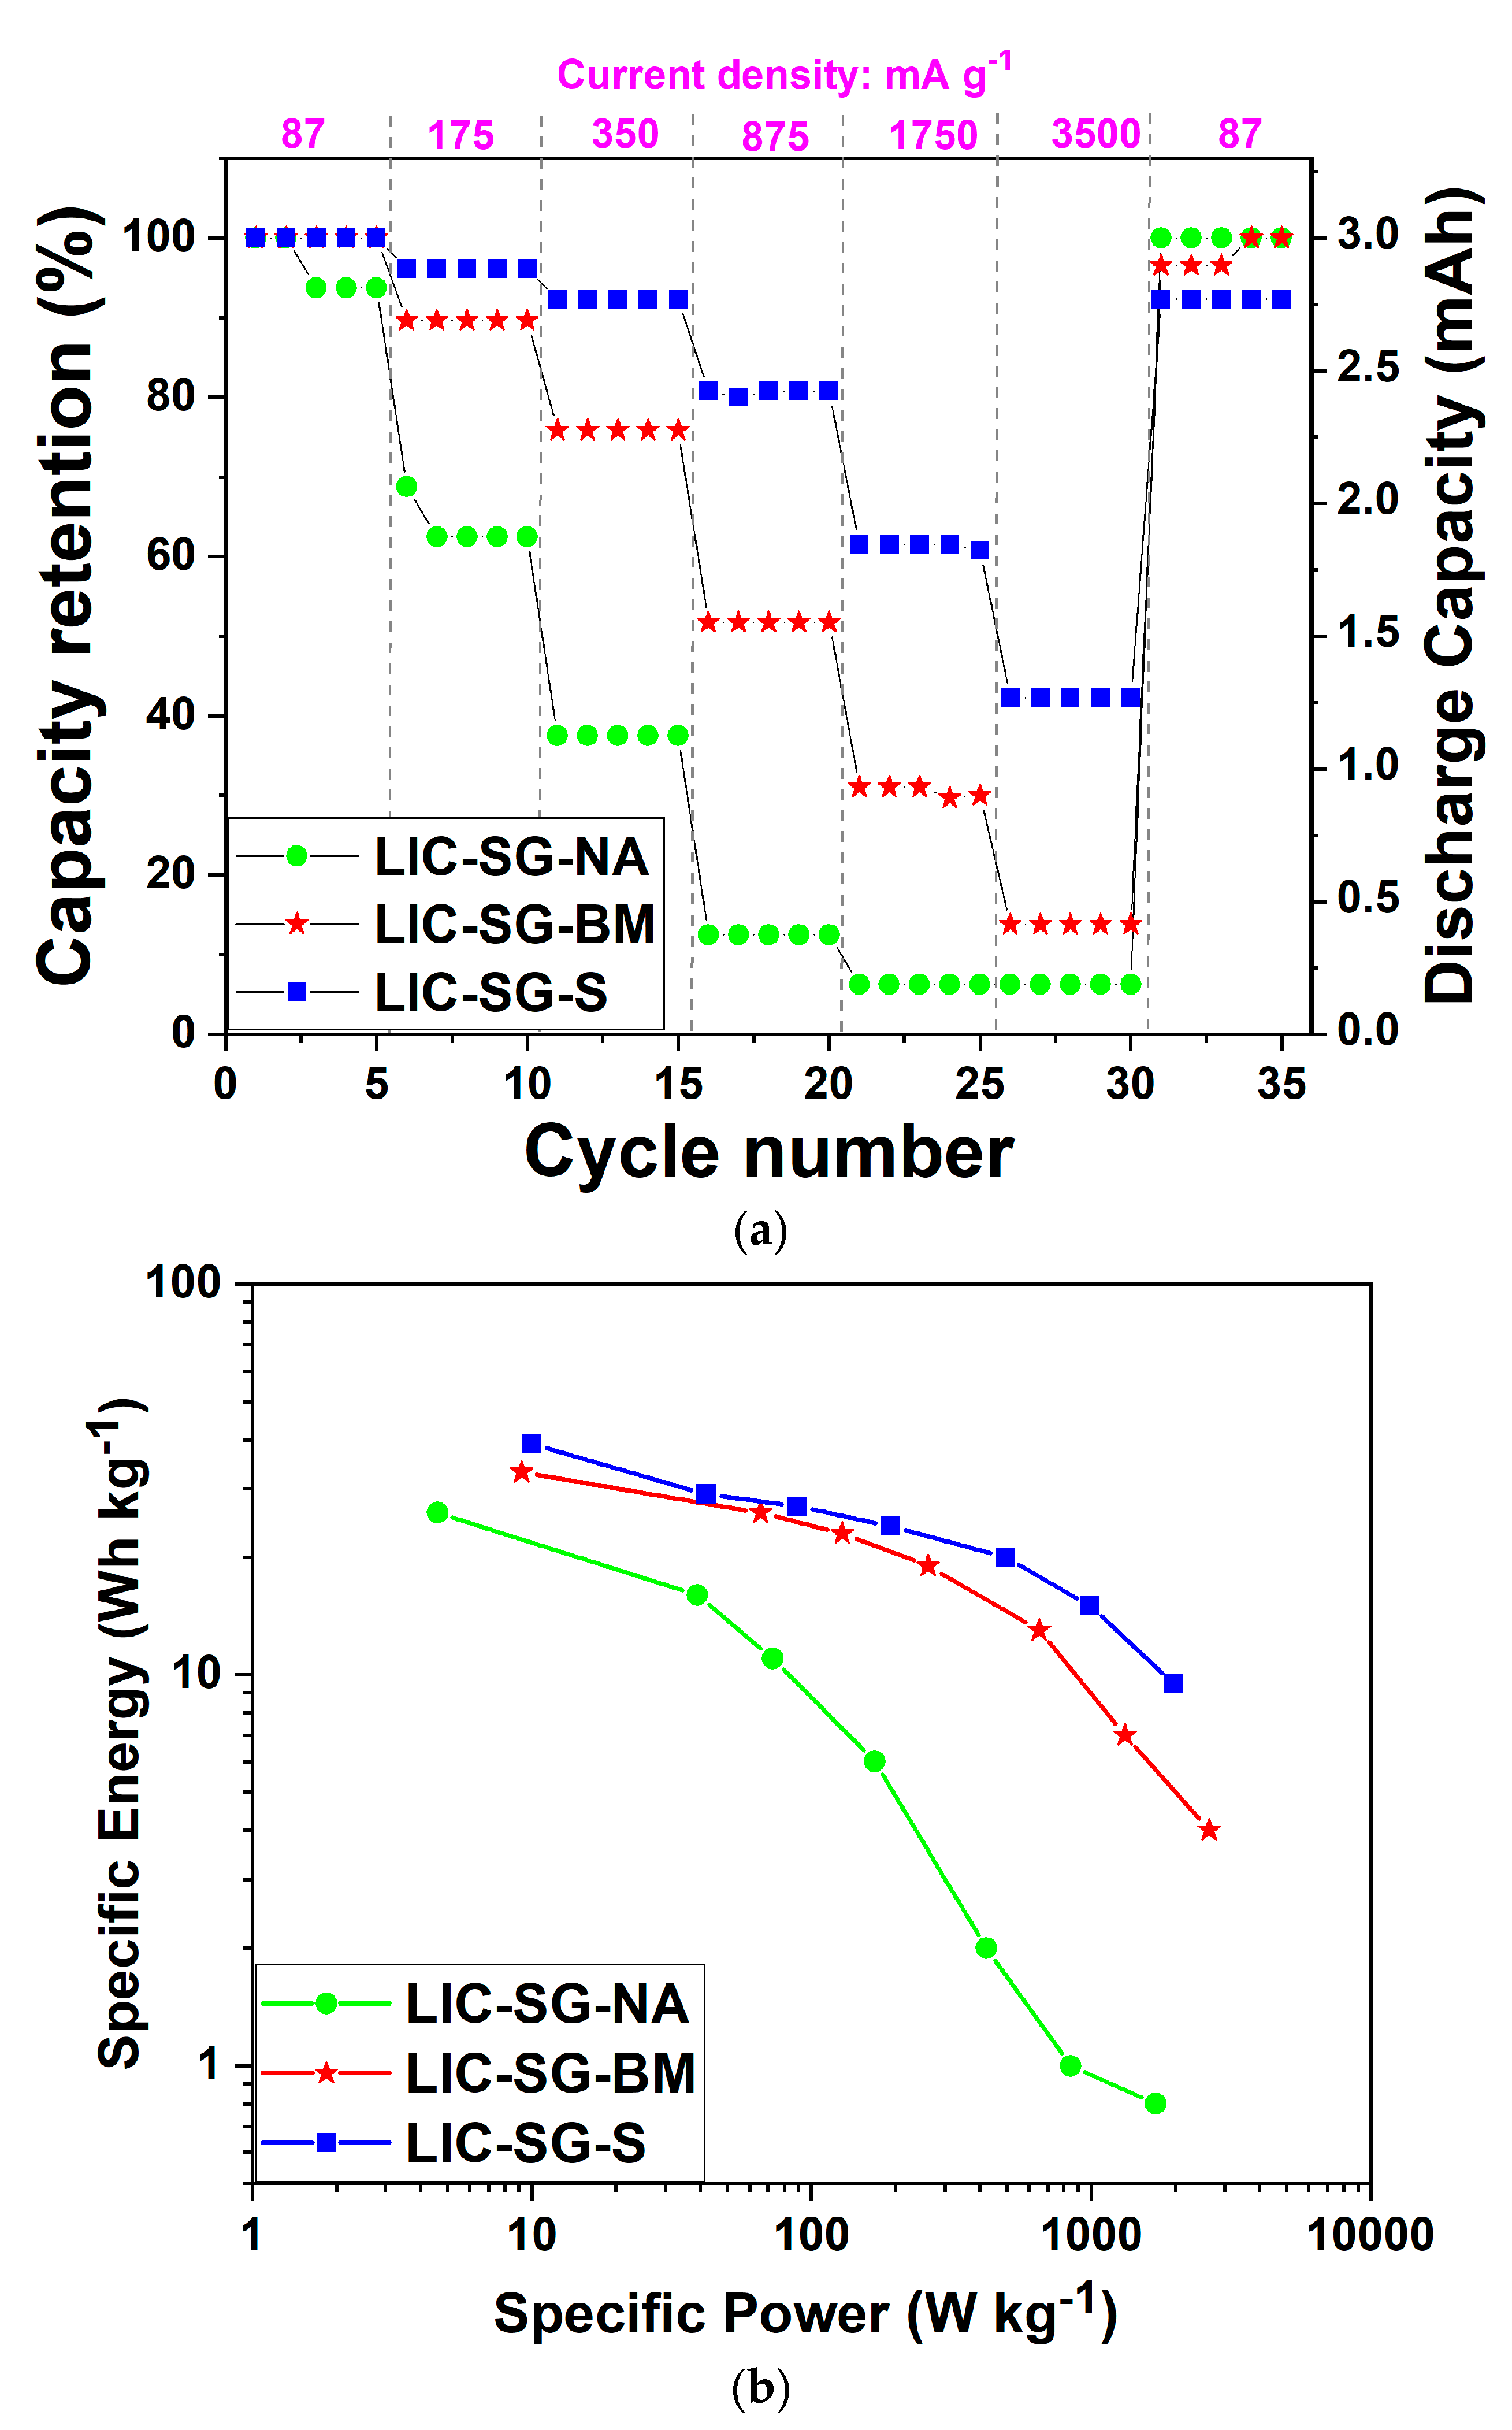
The LIC cells’ rate capability was carried out at different specific currents and is presented in Figure 7. When the specific current was increased from 87 mA g−1 to 1750 mA g−1 and 3500 mA g−1, the LIC-SG-BM, LIC-SG-S had capacity retention of 18% and 55% of the initial capacity, respectively, whereas the LIC-SG-NA discharge capacity retention dropped rapidly to 3%. It is believed that the source of this poor performance was the LTO anode due to less surface area that could facilitate charge transfer at high discharge current, which was also backed up by the EIS measurement. This markedly low-rate performance of LIC-SG-NA was due to the increased cell resistance as a result of the morphological properties obtained for the SG-NA anode, i.e., large particle size, particle aggregation, and small surface area, which was also reflected in the IR-drop measured (Figure S6b). The constant capacity retention at 1750 and 3500 mA g−1 is believed to have resulted from the conductive carbon’s surface adsorption added during the anode fabrication. This was evident from the cell voltage profile deviating from the curved shape to a more linear form, indicating adsorption was the main charge storage process at high specific current with less insertion process by the anode material (Figure S6a). LIC-SG-S had the best retention at a very high rate, indicating the LIC cell’s excellent power capability assembled with a surfactant prepared anode. Although the LIC-SG-BM cell had a similar energy density with LIC-SG-S at a low rate, the material performance differences began to appear in the high-rate performance test. This was due to the significant difference in the material morphological properties obtained with different preparation methods.
Figure 7b presents the Ragone plot of the energy density (E, Wh kg−1) and power density (W kg−1) of the LIC full cells assembled using the obtained LTO anodes. It can be seen that at all power densities, the LIC cell based on SG-S delivered higher energy density than the other anode materials, hence indicating the suitability of the synthesis process for LIC applications. There is still potential for further improvement in the investigation of different mass ratio balancing between the anode and cathode.
The LIC cells’ maximum power density was calculated based on a matched load at a maximum voltage using the AC-ESR, which is the x-axis intercept value at the low-frequency region measured from the EIS spectra (Table 2). The LIC-SG-S had the highest maximum power density based on active material weight due to the low AC-ESR value compared to the LIC-SG-NA and LIC-SG-BM cells. This low ESR value was due to the morphological properties exhibited by the SG-S anode in the cell, hence the suitability of SG-S anode to achieve a high power density LIC device.
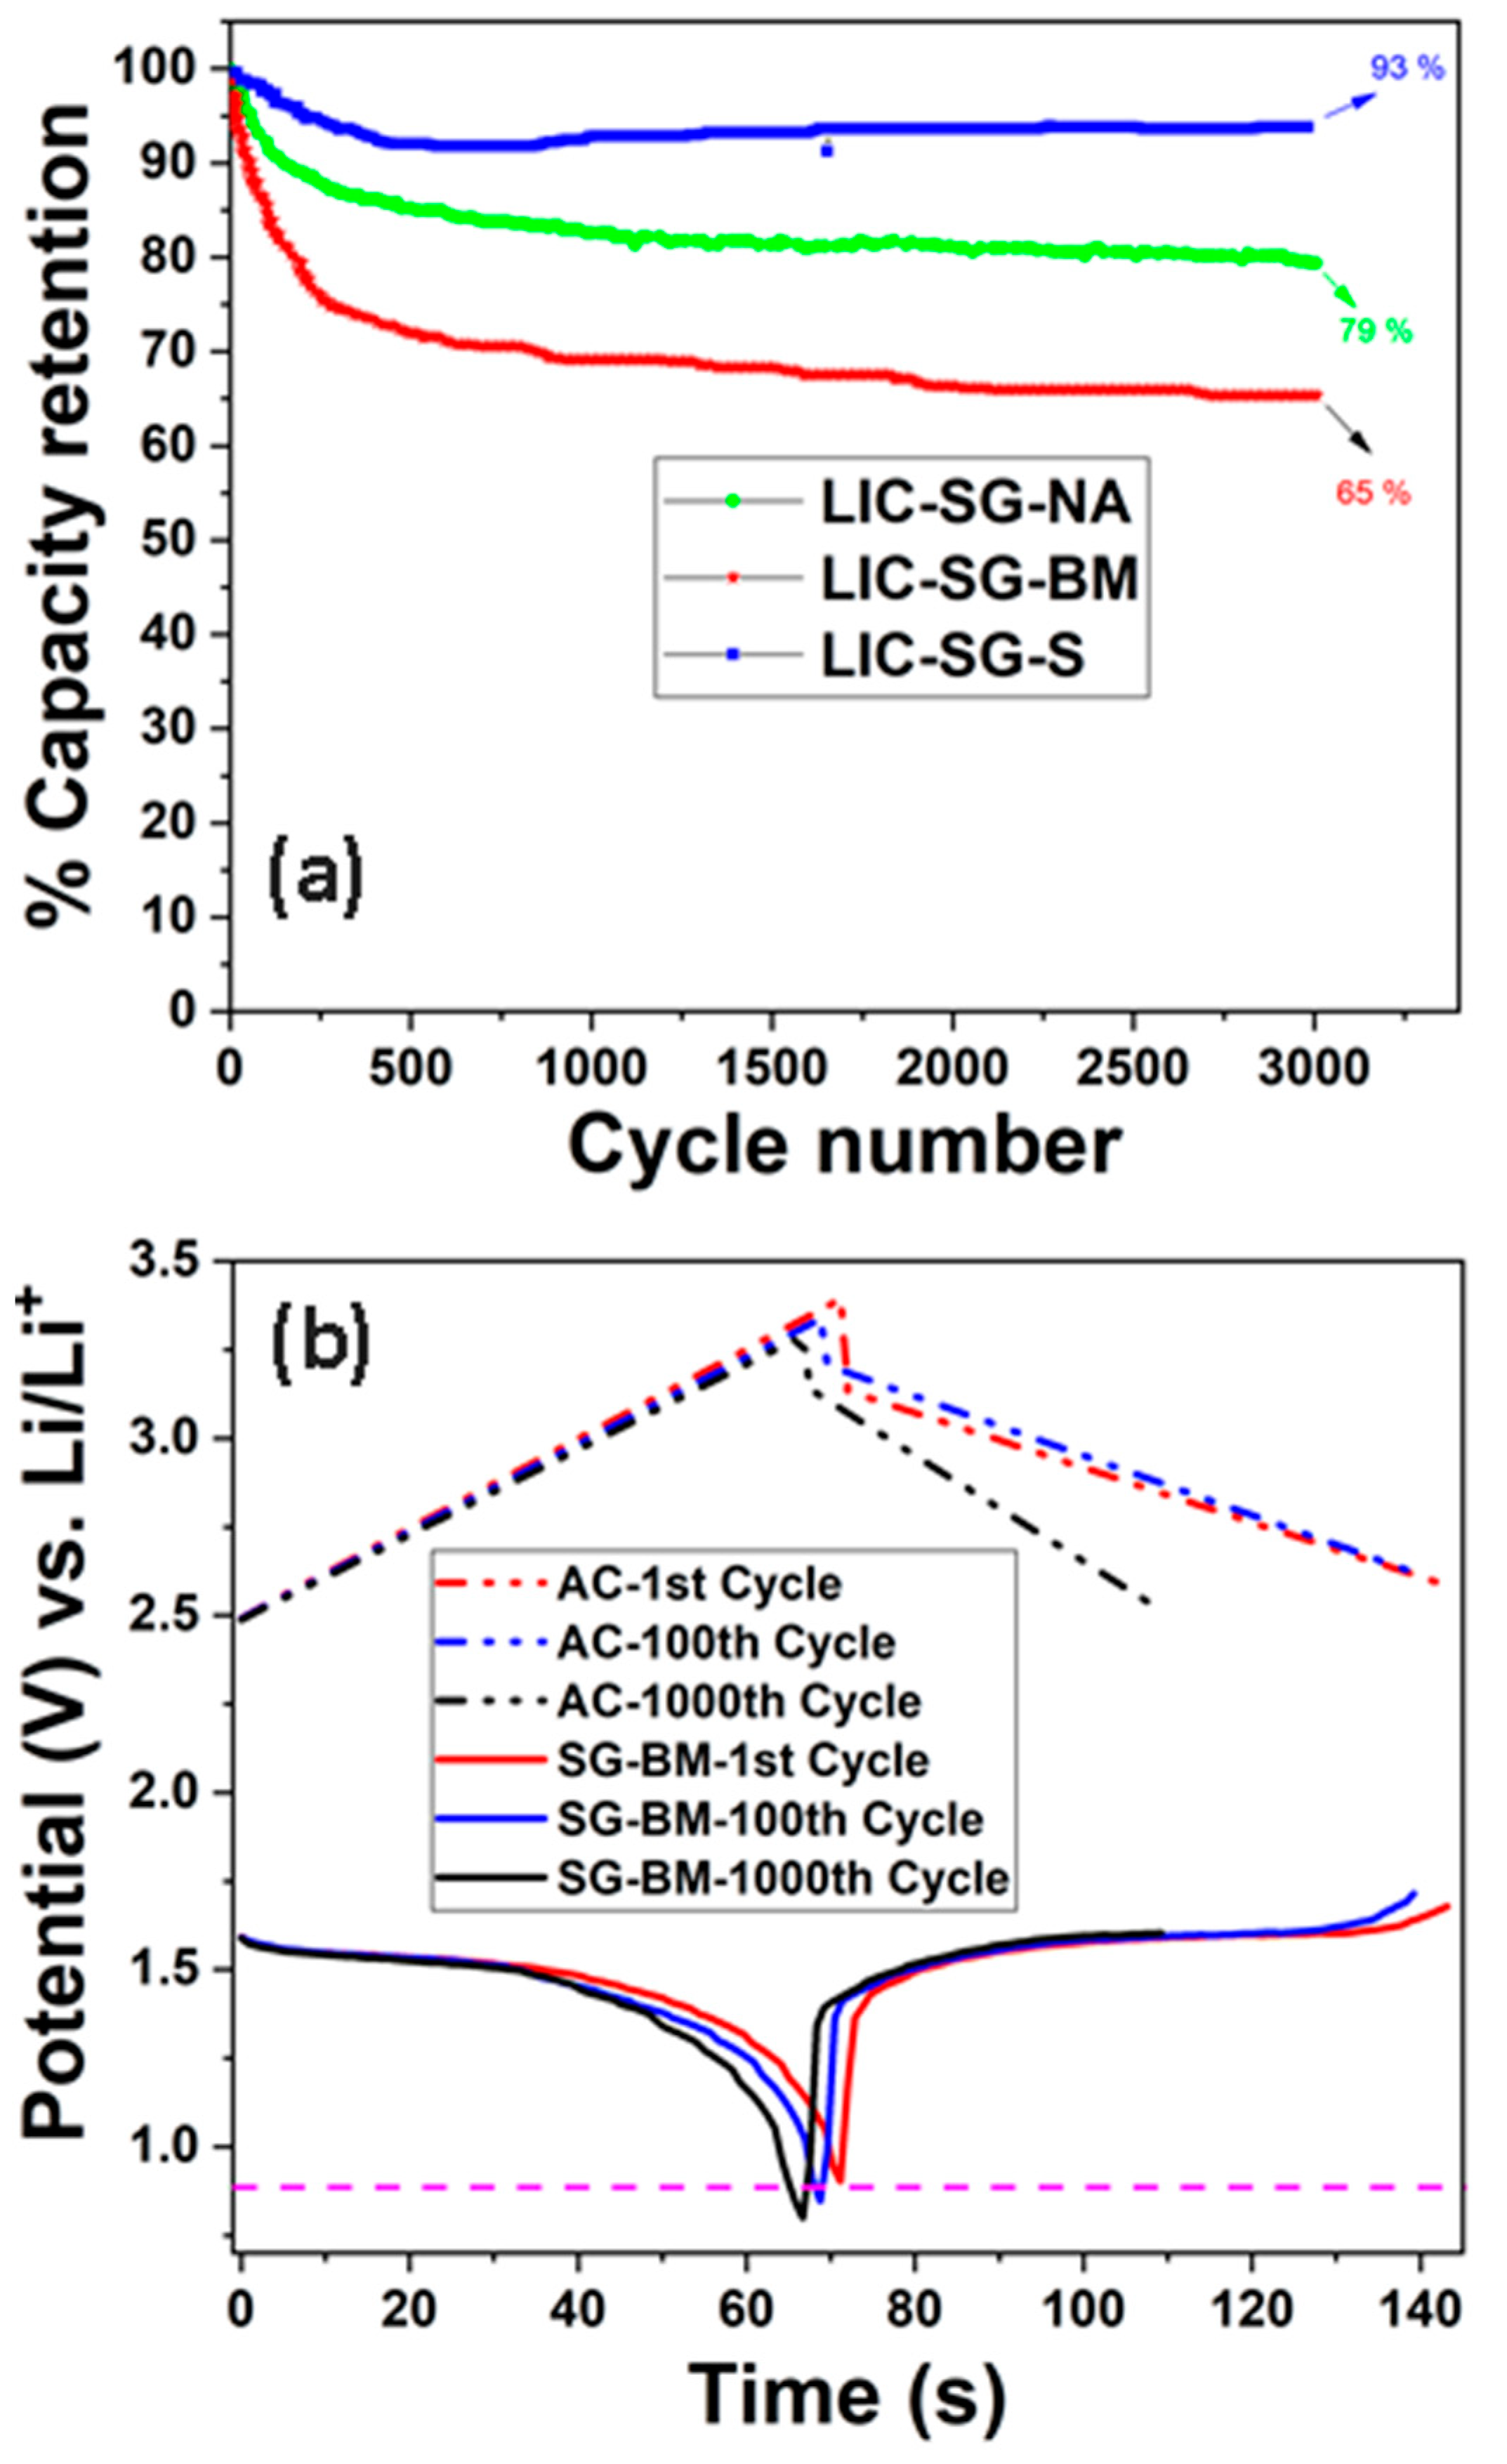
The LIC cells’ cycling performance at a high specific current of 875 mA g−1 is shown in Figure 8a. After 3000 cycles, the capacity retention of the LIC cells with SG-NA, SG-BM, and SG-S anodes was 79%, 65%, and 93%, respectively. The LIC-SG-S had a drop in capacity to around 500 cycles, then picked back up and subsequently leveled out. This was due to a small variation in the room temperature during cycling. The LIC cell with the SG-BM anode showed a rapid drop in capacity retention, and it was already below 80% capacity after 250 cycles. Based on our paper reviews, there are no reports on the long cycle performance of the LTO anode prepared by ball-milling and surfactant in LIC. Most of the synthesis papers only reported the LTO material’s electrochemical performance in half-cell configuration and a full-cell lowcycling current. For example, Zukalova et al. [33] reported a ball-milling prepared LTO with only 50 cycles at 5 C. Lai et al. [36] reported ball-mill prepared LTO performance characterization in half-cell, and only 50 cycles were reported. Sandhya et al. [21] did a comparative study of the type of surfactant, but no cycle performance was reported. Zhang et al. [37] reported a surfactant prepared LTO with 250 cycles at varying current rates. Therefore, our work is the first to comparatively study the influence of these preparation methods on the LIC device’s long cycle stability.
The three-electrode profile was obtained to distinguish the anode and cathode potential swing during cycling for LIC-SG-BM. Figure 8b shows the AC cathode swing and the SG-BM anode swing. It was observed that at the first cycle, the LTO anode potential was around the region where electrolyte decomposition starts (0.8 V vs. Li/Li+) and was pushed below the region after 100 cycles. Therefore, the rapid drop in cycle performance at high discharge current was due to increased cell resistance caused by electrolyte decomposition when the SG-BM potential was pushed below the electrolyte decomposition potential. Hence, the surfactant prepared anode exhibited more stable cycling performance at a high cycling current.
In summary, the preparation method of the LTO anode had a significant effect on LIC device characteristics. Although the structural properties, specific capacity, and energy density of LIC cells made with SG-BM and SG-S anode were similar, the performance differences showed up in the rate capability, electrochemical impedances, and the long cycle stability. This was observed to be due to the differences in the morphological properties of the samples.
4. Conclusions
We have demonstrated that the preparation method of the LTO anode has a significant impact on lithium-ion capacitor (LIC) device characteristics. To ensure a meaningful and fair comparative study, the crystallite domain sizes were kept similar by using the same sol-gel synthesis process. Hence, only the influence of the preparation method i.e. ball-mill and surfactant were studied. The samples had similar specific capacities of 150 and 154 mAh g−1 when measured in a half-cell configuration. The LIC cell assembled using the same cathode, and the same AC/LTO capacity ratio had similar energy density based on active material weight at low specific current, suggesting the excellent performance of the anode using the preparation method. However, the first difference was found to be the morphological properties i.e., particle size, particle dispersion, and specific surface area. The next differences were found in the rate capability performance, maximum power density, and long cycle stability. Electrochemical impedance analysis helped us identify the source of the performance differences. The main contributions were identified as (i) the difference in charge-transfer resistance and (ii) the difference in the diffusion resistance, which were because of the differences in particle size, particle aggregation, and surface area of the LTO anodes prepared.
Therefore, this study demonstrates the significance of selecting a suitable preparation method in preparing LTO anode material to achieve a high-performing LIC device. Although most methods may have good specific capacity at a low rate, not all methods can achieve the LIC properties desired, i.e., energy density, power density, and long cycle stability.
Supplementary Materials
The following are available in the https://0-www-mdpi-com.brum.beds.ac.uk/article/10.3390/batteries7020033/s1, Figure S1: TEM diffraction of a single crystallite of (a) SG-NA, (b) SG-BM, and (c) SG-S samples. (inset STEM image), Figure S2: TEM images of the synthesized LTO samples: (a) SG-NA, (b) SG-BM, and (c) SG-S, Figure S3: Nitrogen adsorption-desorption isotherm of the synthesized LTO samples, Figure S4: SEM image of the fabricated LTO anode electrodes: (a) SG-S, (b) SG-NA. Red circle indicates active material with no contact with the red arrow (carbon black), Figure S5: Voltage profile of LIC full cell balanced with a cathode to anode capacity ratio of 1, and Figure S6: (a) Rate performance of the LIC cell with SG-NA anode, (b) IR drops of LIC cells.
Author Contributions
Conceptualization, methodology, software, execution, analysis, investigation and original draft writing: T.A. (Taofeek Akintola); materials characterization, analysis, and investigation: T.A. (Tawakalt Akintola); validation, formal analysis, review, discussion, and editing: A.S. and J.P.Z. All authors have read and agreed to the published version of the manuscript.
Funding
This work is supported by the Office of Naval Research under contract No. N00014-17-1-2650.
Institutional Review Board Statement
Not applicable.
Informed Consent Statement
Not applicable.
Data Availability Statement
The data presented in this study are available on request from the corresponding author.
Conflicts of Interest
The authors declare no conflict of interest.
References
- Li, B.; Zheng, J.; Zhang, H.; Jin, L.; Yang, D.; Lv, H.; Shen, C.; Shellikeri, A.; Zheng, Y.; Gong, R.; et al. Electrode Materials, Electrolytes, and Challenges in Nonaqueous Lithium-Ion Capacitors. Adv. Mater. 2018, 30, e1705670. [Google Scholar] [CrossRef]
- Han, P.; Xu, G.; Han, X.; Zhao, J.; Zhou, X.; Cui, G. Lithium Ion Capacitors in Organic Electrolyte System: Scientific Problems, Material Development, and Key Technologies. Adv. Energy Mater. 2018, 8, 1–30. [Google Scholar] [CrossRef]
- Cao, W.J.; Luo, J.F.; Yan, J.; Chen, X.J.; Brandt, W.; Warfield, M.; Lewis, D.; Yturriaga, S.R.; Moye, D.G.; Zheng, J.P. High Performance Li-Ion Capacitor Laminate Cells Based on Hard Carbon/Lithium Stripes Negative Electrodes. J. Electrochem. Soc. 2016, 164, A93–A98. [Google Scholar] [CrossRef]
- Amatucci, G.G.; Badway, F.; Du Pasquier, A.; Zheng, T. An Asymmetric Hybrid Nonaqueous Energy Storage Cell. J. Electrochem. Soc. 2001, 148, A930–A939. [Google Scholar] [CrossRef]
- Cao, W.; Zheng, J. Li-ion capacitors with carbon cathode and hard carbon/stabilized lithium metal powder anode electrodes. J. Power Sources 2012, 213, 180–185. [Google Scholar] [CrossRef]
- Zheng, J.P. High Energy Density Electrochemical Capacitors without Consumption of Electrolyte. J. Electrochem. Soc. 2009, 156, A500–A505. [Google Scholar] [CrossRef]
- Nitta, N.; Yushin, G. High-capacity anode materials for lithium-ion batteries: Choice of elements and structures for active particles. Part. Part. Syst. Charact. 2014, 31, 317–336. [Google Scholar] [CrossRef]
- Nitta, N.; Wu, F.; Lee, J.T.; Yushin, G. Li-ion battery materials: Present and future. Mater. Today 2015, 18, 252–264. [Google Scholar] [CrossRef]
- Cao, W.; Li, Y.; Fitch, B.; Shih, J.; Doung, T.; Zheng, J. Strategies to optimize lithium-ion supercapacitors achieving high-performance: Cathode configurations, lithium loadings on anode, and types of separator. J. Power Sources 2014, 268, 841–847. [Google Scholar] [CrossRef]
- Hagen, M.; Yan, J.; Cao, W.; Chen, X.; Shellikeri, A.; Du, T.; Read, J.; Jow, T.; Zheng, J. Hybrid lithium-ion battery-capacitor energy storage device with hybrid composite cathode based on activated carbon/LiNi0.5Co0.2Mn0.3O2. J. Power Sources 2019, 433, 126689. [Google Scholar] [CrossRef]
- Bolufawi, O.; Shellikeri, A.; Zheng, J.P. Lithium-Ion Capacitor Safety Testing for Commercial Application. Batteries 2019, 5, 74. [Google Scholar] [CrossRef] [Green Version]
- Naderi, R.; Shellikeri, A.; Hagen, M.; Cao, W.; Zheng, J.P. The Influence of Anode/Cathode Capacity Ratio on Cycle Life and Potential Variations of Lithium-Ion Capacitors. J. Electrochem. Soc. 2019, 166, 2610–2617. [Google Scholar] [CrossRef]
- Ohzuku, T.; Ueda, A.; Nagayama, M. Electrochemistry and Structural Chemistry of LiNiO2 (R3m) for 4 Volt Secondary Lithium Cells. J. Electrochem. Soc. 1993, 140, 1862–1870. [Google Scholar] [CrossRef]
- Ohzuku, T.; Ueda, A.; Yamamota, N. Zero-Strain Insertion Material of Li[Lil/3Ti5/3]O4 for Rechargeable Lithium Cells. J. Electrochem. Soc. 1995, 142, 1431. Available online: http://jes.ecsdl.org/content/142/5/1431.full.pdf (accessed on 2 February 2019). [CrossRef]
- Zhao, B.; Ran, R.; Liu, M.; Shao, Z. A comprehensive review of Li4Ti5O12-based electrodes for lithium-ion batteries: The latest advancements and future perspectives. J. Gen. Microbiol. 2015, 128, 2165–2177. [Google Scholar] [CrossRef]
- Allen, J.; Jow, T.; Wolfenstine, J. Low temperature performance of nanophase Li4Ti5O12. J. Power Sources 2006, 159, 1340–1345. [Google Scholar] [CrossRef]
- Yi, T.-F.; Yang, S.-Y.; Xie, Y. Recent advances of Li4Ti5O12 as a promising next generation anode material for high power lithium-ion batteries. J. Mater. Chem. A 2015, 3, 5750–5777. [Google Scholar] [CrossRef]
- Hao, Y.-J.; Lai, Q.-Y.; Liu, D.-Q.; Xu, Z.-U.; Ji, X.-Y. Synthesis by citric acid sol–gel method and electrochemical properties of Li4Ti5O12 anode material for lithium-ion battery. Mater. Chem. Phys. 2005, 94, 382–387. [Google Scholar] [CrossRef]
- Brinker, C.J.; Scherer, G.W. Sol-Gel Science: The Physics and Chemistry of Sol-Gel Processing; Academic Press: Cambridge, MA, USA, 1990. [Google Scholar]
- Khomane, R.B.; Prakash, A.; Ramesha, K.; Sathiya, M. CTAB-assisted sol–gel synthesis of Li4Ti5O12 and its performance as anode material for Li-ion batteries. Mater. Res. Bull. 2011, 46, 1139–1142. [Google Scholar] [CrossRef]
- Sandhya, C.; John, B.; Gouri, C. Surfactant-assisted solegel route to lithium titanate and its electrochemical properties. J. Alloys Compd. 2016, 655, 238–243. [Google Scholar] [CrossRef]
- Yan, G.; Fang, H.; Zhao, H.; Li, G.; Yang, Y.; Li, L. Ball milling-assisted sol–gel route to Li4Ti5O12 and its electrochemical properties. J. Alloys Compd. 2009, 470, 544–547. [Google Scholar] [CrossRef]
- Wang, G.; Xu, J.; Wen, M.; Cai, R.; Ran, R.; Shao, Z. Influence of high-energy ball milling of precursor on the morphology and electrochemical performance of Li4Ti5O12-ball-milling time. Solid State Ionics 2008, 179, 946–950. [Google Scholar] [CrossRef]
- Jamin, C.; Traina, K.; Eskenazi, D.; Krins, N.; Cloots, R.; Vertruyen, B.; Boschini, F. Effect of freeze-drying and self-ignition process on the microstructural and electrochemical properties of Li4Ti5O12. Mater. Res. Bull. 2013, 48, 4641–4646. [Google Scholar] [CrossRef]
- Mahmoud, A.; Amarilla, J.M.; Lasri, K.; Saadoune, I. Influence of the synthesis method on the electrochemical properties of the Li4Ti5O12 spinel in Li-half and Li-ion full-cells. A systematic comparison. Electrochim. Acta 2013, 93, 163–172. [Google Scholar] [CrossRef]
- Jiang, C.; Ichihara, M.; Honma, I.; Zhou, H. Effect of particle dispersion on high rate performance of nano-sized Li4Ti5O12 anode. Electrochim. Acta 2007, 52, 6470–6475. [Google Scholar] [CrossRef]
- Pohlmann, S.; Balducci, A. A new conducting salt for high voltage propylene carbonate-based electrochemical double layer capacitors. Electrochim. Acta 2013, 110, 221–227. [Google Scholar] [CrossRef]
- Ariyoshi, K.; Yamato, R.; Ohzuku, T. Zero-strain insertion mechanism of Li[Li1/3Ti5/3]O4 for advanced lithium-ion (shuttlecock) batteries. Electrochim. Acta 2005, 51, 1125–1129. [Google Scholar] [CrossRef]
- Deschanvres, A.; Raveau, B.; Sekkal, Z. Mise en evidence et etude cristallographique d’une nouvelle solution solide de type spinelle Li1+xTi2−xO4 0 ≤ x ≤ 0, 333. Mater. Res. Bull. 1971, 6, 699–704. [Google Scholar] [CrossRef]
- Kuo, Y.-C.; Lin, J.-Y. One-pot sol-gel synthesis of Li4Ti5O12/C anode materials for high-performance Li-ion batteries. Electrochim. Acta 2014, 142, 43–50. [Google Scholar] [CrossRef]
- Chauque, S.; Oliva, F.; Visintin, A.; Barraco, D.; Leiva, E.; Cámara, O. Lithium titanate as anode material for lithium ion batteries: Synthesis, post-treatment and its electrochemical response. J. Electroanal. Chem. 2017, 799, 142–155. [Google Scholar] [CrossRef]
- Pohjalainen, E.; Rauhala, T.; Valkeapää, M.; Kallioinen, J.; Kallio, T. Effect of Li4Ti5O12 particle size on the performance of lithium ion battery electrodes at high C-rates and low temperatures. J. Phys. Chem. C 2015, 119, 2277–2283. [Google Scholar] [CrossRef] [Green Version]
- Zukalová, M.; Fabián, M.; Klusáčková, M.; Klementová, M.; Lásková, B.P.; Danková, Z.; Senna, M.; Kavan, L. Li insertion into Li4Ti5O12 spinel prepared by low temperature solid state route: Charge capability vs surface area. Electrochim. Acta 2018, 265, 480–487. [Google Scholar] [CrossRef]
- Zhao, D.; Huo, Q.; Feng, J.; Chmelka, B.F.; Stucky, G.D. Nonionic Triblock and Star Diblock Copolymer and Oligomeric Surfactant Syntheses of Highly Ordered, Hydrothermally Stable, Mesoporous Silica Structures. J. Am. Chem. Soc. 1998, 120, 6024–6036. [Google Scholar] [CrossRef]
- Moss, P.; Au, G.; Plichta, E.; Zheng, J. Investigation of solid electrolyte interfacial layer development during continuous cycling using ac impedance spectra and micro-structural analysis. J. Power Sources 2009, 189, 66–71. [Google Scholar] [CrossRef]
- Lai, C.; Wu, Z.; Zhu, Y.; Wu, Q.; Li, L.; Wang, C. Ball-milling assisted solid-state reaction synthesis of mesoporous Li4Ti5O12 for lithium-ion batteries anode. J. Power Sources 2013, 226, 71–74. [Google Scholar] [CrossRef]
- Zhang, N.; Liu, Z.; Yang, T.; Liao, C.; Wang, Z.; Sun, K. Facile preparation of nanocrystalline Li4Ti5O12 and its high electrochemical performance as anode material for lithium-ion batteries. Electrochem. Commun. 2011, 13, 654–656. [Google Scholar] [CrossRef]
Figure 1.
XRD patterns of LTO samples obtained from the synthesis process.

Figure 2.
SEM micrographs and particle size distribution histogram of (a) SG-NA, (b) SG-BM, (c) SG-S.
Figure 2.
SEM micrographs and particle size distribution histogram of (a) SG-NA, (b) SG-BM, (c) SG-S.


Figure 3.
Pore size distributions of the LTO samples.

Figure 4.
Charge/discharge potential profile of the synthesized LTO anode for LIC cycled at 17 mA g−1.
Figure 4.
Charge/discharge potential profile of the synthesized LTO anode for LIC cycled at 17 mA g−1.

Figure 5.
The LIC-SG-S cell voltage and the potentials of the positive electrode and negative electrodes measured vs. Li/Li+ at 87 mA g−1.
Figure 5.
The LIC-SG-S cell voltage and the potentials of the positive electrode and negative electrodes measured vs. Li/Li+ at 87 mA g−1.

Figure 6.
Electrochemical impedance spectroscopy result of the LIC cells taken at charged state: 2.5 V (inset is the enlarged curve and circuit model used for fitting).
Figure 6.
Electrochemical impedance spectroscopy result of the LIC cells taken at charged state: 2.5 V (inset is the enlarged curve and circuit model used for fitting).

Figure 7.
(a) The rate capability of the LIC cell under different specific current, and (b) Ragone plot of the LICs based on the active material mass of both electrodes.
Figure 7.
(a) The rate capability of the LIC cell under different specific current, and (b) Ragone plot of the LICs based on the active material mass of both electrodes.

Figure 8.
(a) Cycle life performance of LIC cells with LTO anodes prepared, and (b) the cathode and anode potential swing for LIC-SG-BM. The pink dashed line represents the electrolyte decomposition potential limit.
Figure 8.
(a) Cycle life performance of LIC cells with LTO anodes prepared, and (b) the cathode and anode potential swing for LIC-SG-BM. The pink dashed line represents the electrolyte decomposition potential limit.


Table 1.
Unit cell parameter (ac), the average crystallite size (d), average particle size (PS), specific surface area (BET), pore volume, electrode tap density (Td), specific capacity (CSP), and volumetric capacity (CV) of SG-NA, SG-BM, and SG-S LTO.
Table 1.
Unit cell parameter (ac), the average crystallite size (d), average particle size (PS), specific surface area (BET), pore volume, electrode tap density (Td), specific capacity (CSP), and volumetric capacity (CV) of SG-NA, SG-BM, and SG-S LTO.
| Sample | ac (nm) | d (nm) | PS (nm) | BET (m2 g−1) | Pore vol. (cm3 g−1) | Td (g cm−3) | Csp (mAh g−1) | CV (mAh cm−3) |
|---|---|---|---|---|---|---|---|---|
| SG-NA | 0.835 | 32 | 900 | 2.20 | 0.005 | 1.6 | 100 | 160 |
| SG-BM | 0.837 | 40 | 600 | 9.60 | 0.011 | 1.0 | 150 | 150 |
| SG-S | 0.836 | 36 | 350 | 55.7 | 0.074 | 1.2 | 154 | 184 |
Table 2.
Summary of energy density and max. power density of the LIC cells based on active material mass.
Table 2.
Summary of energy density and max. power density of the LIC cells based on active material mass.
| Parameters | LIC-SG-NA | LIC-SG-BM | LIC-SG-S |
|---|---|---|---|
| Specific energy (Wh kg−1) | 26 | 36 | 39 |
| Max. specific power (kW kg−1) | 0.8 | 2.9 | 8.0 |
| AC-ESR (Ω) @ 0.1 Hz | 12 | 2.8 | 1.1 |
Publisher’s Note: MDPI stays neutral with regard to jurisdictional claims in published maps and institutional affiliations. |
© 2021 by the authors. Licensee MDPI, Basel, Switzerland. This article is an open access article distributed under the terms and conditions of the Creative Commons Attribution (CC BY) license (https://creativecommons.org/licenses/by/4.0/).
Share and Cite
MDPI and ACS Style
Akintola, T.; Shellikeri, A.; Akintola, T.; Zheng, J.P. The Influence of Li4Ti5O12 Preparation Method on Lithium-Ion Capacitor Performance. Batteries 2021, 7, 33. https://0-doi-org.brum.beds.ac.uk/10.3390/batteries7020033
AMA Style
Akintola T, Shellikeri A, Akintola T, Zheng JP. The Influence of Li4Ti5O12 Preparation Method on Lithium-Ion Capacitor Performance. Batteries. 2021; 7(2):33. https://0-doi-org.brum.beds.ac.uk/10.3390/batteries7020033
Chicago/Turabian StyleAkintola, Taofeek, Annadanesh Shellikeri, Tawakalt Akintola, and Jim P. Zheng. 2021. "The Influence of Li4Ti5O12 Preparation Method on Lithium-Ion Capacitor Performance" Batteries 7, no. 2: 33. https://0-doi-org.brum.beds.ac.uk/10.3390/batteries7020033
Note that from the first issue of 2016, this journal uses article numbers instead of page numbers. See further details here.