Article

Comparative Study of Equivalent Circuit Models Performance in Four Common Lithium-Ion Batteries: LFP, NMC, LMO, NCA

1
Department of Chemical Engineering, University of Waterloo, 200 University Avenue West, Waterloo, ON N2L 3G1, Canada
2
Department of Mechanical and Mechatronics Engineering, University of Waterloo, 200 University Avenue West, Waterloo, ON N2L 3G1, Canada
*
Authors to whom correspondence should be addressed.
Submission received: 17 June 2021 / Revised: 21 July 2021 / Accepted: 23 July 2021 / Published: 27 July 2021
(This article belongs to the Special Issue Lithium-Ion Batteries: Latest Advances and Prospects II)

Abstract

:
Lithium-ion (Li-ion) batteries are an important component of energy storage systems used in various applications such as electric vehicles and portable electronics. There are many chemistries of Li-ion battery, but LFP, NMC, LMO, and NCA are four commonly used types. In order for the battery applications to operate safely and effectively, battery modeling is very important. The equivalent circuit model (ECM) is a battery model often used in the battery management system (BMS) to monitor and control Li-ion batteries. In this study, experiments were performed to investigate the performance of three different ECMs (1RC, 2RC, and 1RC with hysteresis) on four Li-ion battery chemistries (LFP, NMC, LMO, and NCA). The results indicated that all three models are usable for the four types of Li-ion chemistries, with low errors. It was also found that the ECMs tend to perform better in dynamic current profiles compared to non-dynamic ones. Overall, the best-performed model for LFP and NCA was the 1RC with hysteresis ECM, while the most suited model for NMC and LMO was the 1RC ECM. The results from this study showed that different ECMs would be suited for different Li-ion battery chemistries, which should be an important factor to be considered in real-world battery and BMS applications.

1. Introduction

Over the past 10 years, the annual energy generation has increased over 73 million megawatts per hour, and renewable energy generation such as solar, wind, and tidal increased over 30 million megawatts per hour in Canada [1]. Energy generated from renewable resources cannot be easily stored similarly to fossil fuels. Therefore, energy storage systems such as batteries are required to store the energy and be able to supply to the grid on demand. The acceleration of climate change has accelerated the development of batteries to reduce carbon footprints and encourage the use of renewable energy [2,3].
Lithium-ion (Li-ion) batteries are becoming increasingly common due to their advantages as an energy storage system such as long cycle life, low self-discharge rate, small size, light weight, rapid charging capabilities, and wide temperature range [4,5,6]. With changes to the materials used in anodes and cathodes such as spherical lithium iron phosphate cathodes and lithium-sulfur, Li-ion batteries can have higher power density, higher energy density, and lower costs than competing chemistries, allowing them to be used in applications formerly dominated by other battery types [7]. At the end of 2018, over 90% of large-scale battery storage power capacity was provided by Li-ion batteries in the US [8]. A total of 125 storage systems that held a combined total of 869 MW was reported at the end of 2018, demonstrating exponential growth and doubling the reported value in 2015, just 3 years prior.
Batteries serve critical roles in the daily lives of their users. Therefore, optimization of battery performance via a battery management system (BMS) is called for to further enhance their abilities and longevity. BMS software executes model algorithms, commonly using Equivalent Circuit Models (ECMs), to continuously capture battery dynamics, allowing for the estimation of battery pack information [9]. BMS software can thereby perform the crucial task of maintaining a safe operating area (SOA) for modern electronics equipped with intensive cell arrangements and minimal tolerance for faulty behavior [10]. In the majority of BMS applications, important tasks include (1) the determination of battery states (e.g., state of health (SOH), state of charge (SOC), state of function (SOF), etc.), (2) battery cell and battery pack monitoring, (3) energy management during charging and discharging, and (4) thermal management. To provide a specific example, a BMS in a battery application captures measurable information of current, voltage, power, and battery temperature to make comparisons with predicted values from the corresponding model, allowing the BMS to detect battery faults [11,12]. Among various battery estimation models, the equivalent-circuit-based model is gaining popularity due to its stability on major commercial battery chemistries such as LFP [13].
ECMs simulate the battery’s internal characteristics, which may include the following three major parts: a static representation of battery chemistry properties such as nominal capacity and open-circuit voltage (OCV), a dynamic representation of the cell’s internal operation such as internal resistance and RC time constant, and lastly, a source of potential that drives and completes the simulated circuit [13]. ECMs are constructed based on the physical understanding of the cell configuration and chemistry, and according to the Occam’s razor principle that states that only components that correspond to the physical phenomena should be inserted in an equivalent circuit [14]. Therefore, elements of the ECM circuitry are configured to simulate existing battery chemistries. The ECM can help predict a battery’s states including the SOH, SOC, output power, and transient and dynamic behaviors based on terminal voltage. As mentioned above, ECMs are widely gaining popularity as a cost-efficient and relatively simple model in BMS design. Its suitability is mainly due to the reduced amount of model parameters and the underlying ordinary differential equation model, allowing quick firmware operation during runtime and the ability to make estimations in advance [15].
ECMs have been studied for the purpose of investigating relationships between model accuracy and complexity, thus demonstrating the overall effectiveness of each type of ECM. He et al. [16] compared seven battery models, including three ECMs of zeroth, first, and second-order, using an LFP cell, to find that the second-order ECM had the best performance, and the first-order ECM was the second best. Hu et al. [17] compared the performance of twelve ECMs, under three sets of training data and temperature ranges, for NMC and LFP cells. The study found that the first-order ECM was preferable for NMC cells, while the first-order ECM with hysteresis was better for LFP cells. Zhang et al. [18] tested two ECMs using an LFP cell, under the Urban Dynamometer Driving Schedule (UDDS) current profile and suggested higher efficiency from a second-order ECM for EV applications.
However, there has not been any comparative study on the performance of different ECMs, relatively, in multiple commonly used Li-ion battery types. This study utilizes four commonly used battery chemistries, including lithium iron phosphate (LFP), lithium nickel manganese cobalt oxide (NMC), lithium manganese oxide (LMO), and lithium nickel cobalt aluminum oxide (NCA). The performance of three widely used ECMs, including a first-order ECM, a second-order ECM, and a first-order ECM with hysteresis, are compared among each other as well as in all four of the battery chemistries. The models are built and characterized using MATLAB and validated experimentally using a UDDS current profile and a non-dynamic current profile. The results are analyzed to evaluate model accuracy and model complexity for different battery chemistries and different applications. The rest of the paper is organized as follows. Section 2 outlines some background on the four cell chemistries as well as the three ECMs used in the study. Section 3 describes the experimental setup and procedure for cell characterization and model validation. Section 4 presents some characterization and validation results as well as comparative discussion. Finally, Section 5 provides some concluding remarks.

2. Background

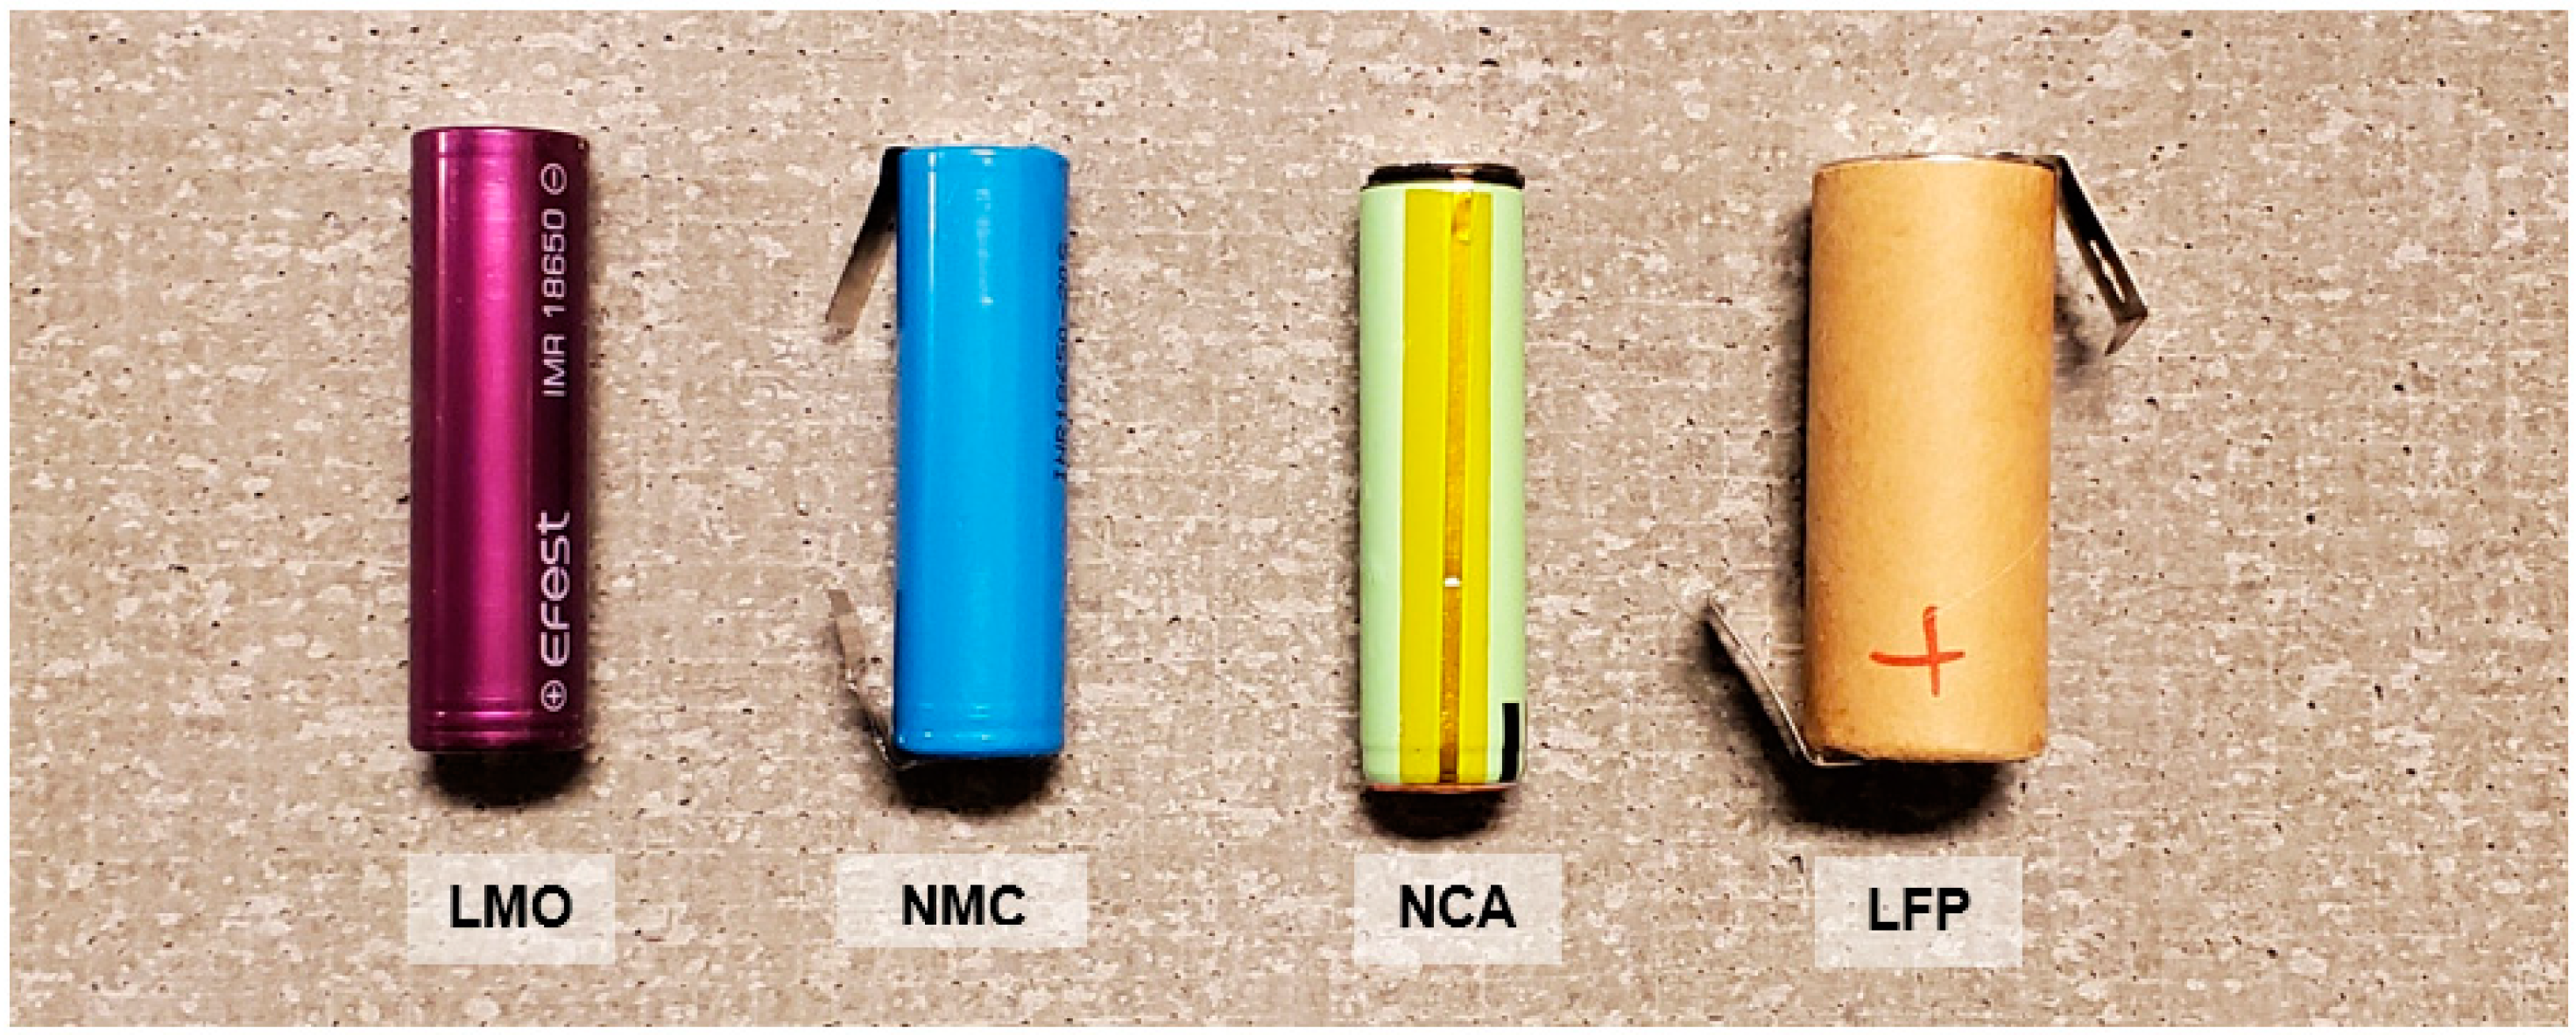
2.1. Lithium-Ion Battery Chemistries

Many battery storage devices are made from electrochemical cells [19]. Electrochemical cells convert chemical potential to electrical potential when discharging and vice versa if the cell is charging. This study will focus on lithium-ion batteries and will exclude other popular battery types such as lead-acid and nickel-metal hydride.
Li-ion batteries have a structured anode and cathode that houses lithium. The cathode can have three different structures that consist of a layered, spinel, or olivine structure. With changes to the cathode materials on Li-ion batteries, the characteristics of energy density and cost effectiveness can be further improved [6,7]. Among the phosphate-based cathode materials, LFP has the highest capacity though a much lower open circuit voltage [20]. However, when Goodenough et al. demonstrated the lithium extraction and insertion stability into FePO4, an olivine structure, LFP solidified its position as the best candidate for phosphate-based cathodes [21].

2.1.1. Lithium Iron Phosphate (LFP) Battery

When LFP batteries discharge, lithium molecules from the negative electrode detach from layered graphene, becoming lithium ions and electrons. The electrons travel out of the battery as lithium ions move across a separator and both integrate into iron phosphates at the positive electrode. During charge, lithium separates from the iron phosphate, generating lithium ions and electrons. The lithium ions and electrons transfer to the positive electrode and integrate into the graphene structure. The reaction occurs from right to left. The electrochemical reactions are shown below [22] (Table 1).

2.1.2. Lithium Nickel Manganese Cobalt Oxide (NMC) Battery

NMC is a Li-ion battery with a different type of cathode. Unlike LFP, which possesses good capacity and stability, NMC demonstrates an improved cycle life, thermal stability, and energy density [23,24]. Its layered cathode structure demonstrates a single-phase intercalation process as opposed to olivine structures with two phases [22]. The cathode of NMC consists of Li(NixMnyCoz)O2, where the sum of the molar fractions (x, y, z) is equal to one [25]. The discharge chemistry of NMC is similar to LFP, as they are both Li-ion batteries [16]. It follows the process of lithium oxidation on the anode and reduces at the cathode. The discharge reaction proceeds from left to right, whilst the charge reaction proceeds from right to left (Table 2).

2.1.3. Lithium Manganese Oxide (LMO) Battery

LMO batteries were first commercialized in 1975 by the Sanyo company, making it one of the first Li-ion batteries to be used commercially [26]. Newer LMO batteries contain a three-dimensional spinel structure to improve the diffusion of lithium ions [27], allowing it to have high thermal stability, low cost, and environmental affinity [28]. However, LMO batteries suffer from severe capacity fading due to the surface dissolution of manganese in the electrolyte at temperatures above 60 °C.
A typical LMO battery provides a working voltage of 3.7 V and a specific capacity of 148 mAh g−1. When compared to the average NMC battery, which has a working voltage of 3.6 V and a specific capacity of 170 mAh g−1, the LMO battery has a slightly higher working voltage but a lower specific capacity.
The discharge chemistry is as follows, with the discharge reaction occurring from left to right and the charge reaction occurring from right to left (Table 3).

2.1.4. Lithium Nickel Cobalt Aluminum Oxide (NCA) Battery

NCA batteries share many similarities with NMC batteries as they both share the layered cathode structure. However, NCA batteries replace the manganese of the NMC batteries with aluminum. This improves the specific energy and lifespan when compared to its NMC counterpart [27]. NCA batteries also have a high gravimetric capacity of 200 mAh·g−1 when compared to the capacities of LMO and LFP batteries at 148 mAh∙g−1 and 170 mAh∙g−1, respectively. Finally, NCA batteries are known to have a long lifespan. The main disadvantage of NCA batteries is that they are not as safe as other battery types. These batteries require special safety monitoring measures for use in applications such as electric vehicles [29].
The discharge chemistry of NCA batteries closely follows that of the other Li-ion batteries listed above. Lithium undergoes oxidation at the anode and reduction at the cathode, with the discharge reaction occurring from left to right and the charge reaction occurring from right to left. The electrochemical reactions can be seen below (Table 4).

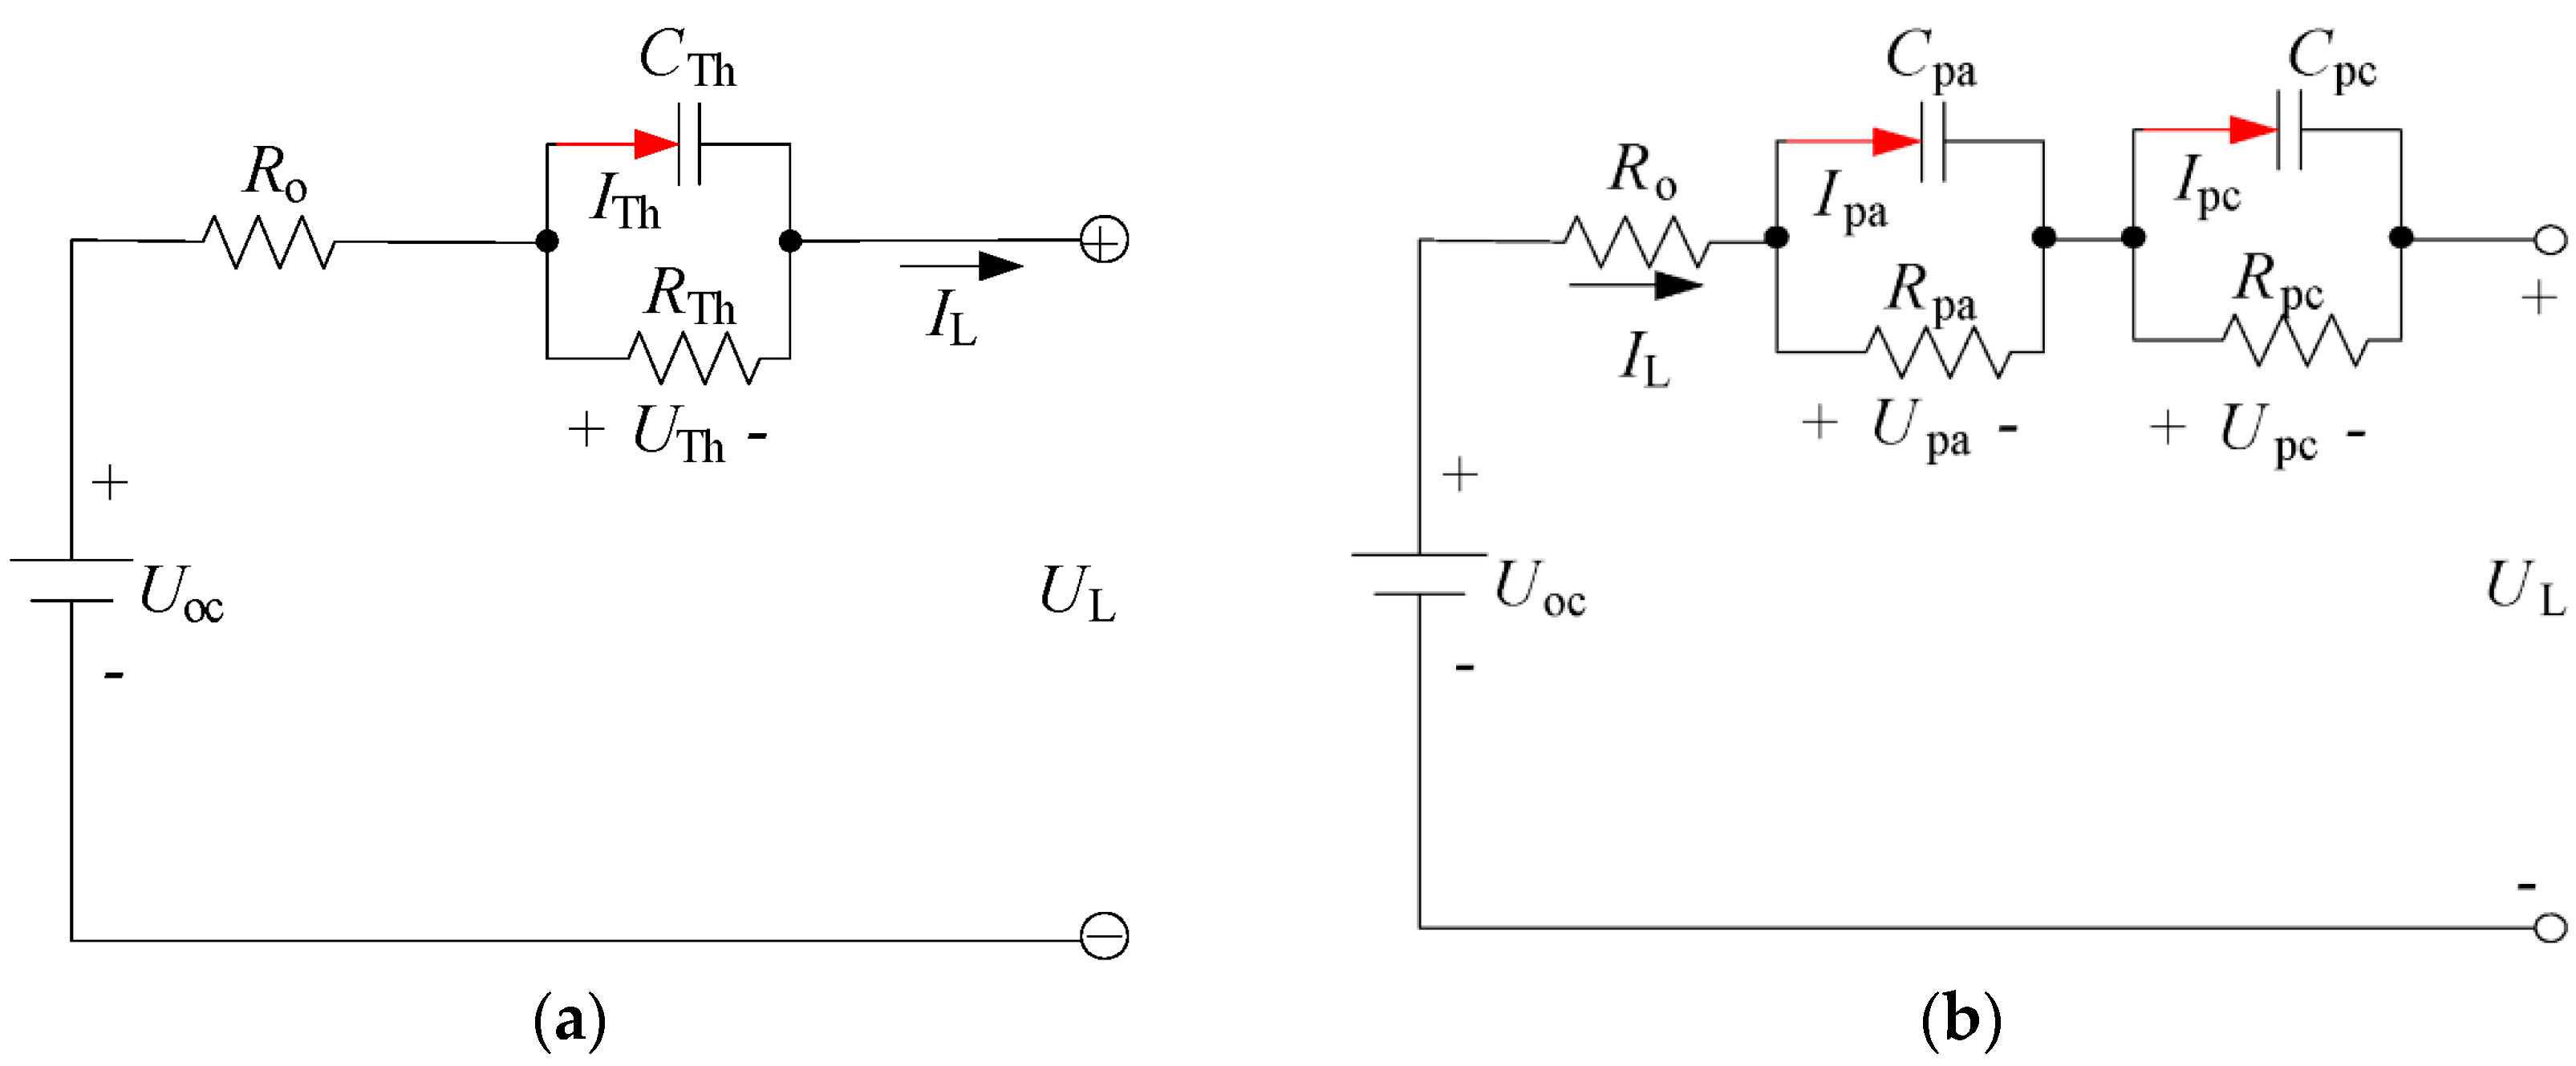
2.2. Equivalent Circuit Models for Lithium-Ion Batteries
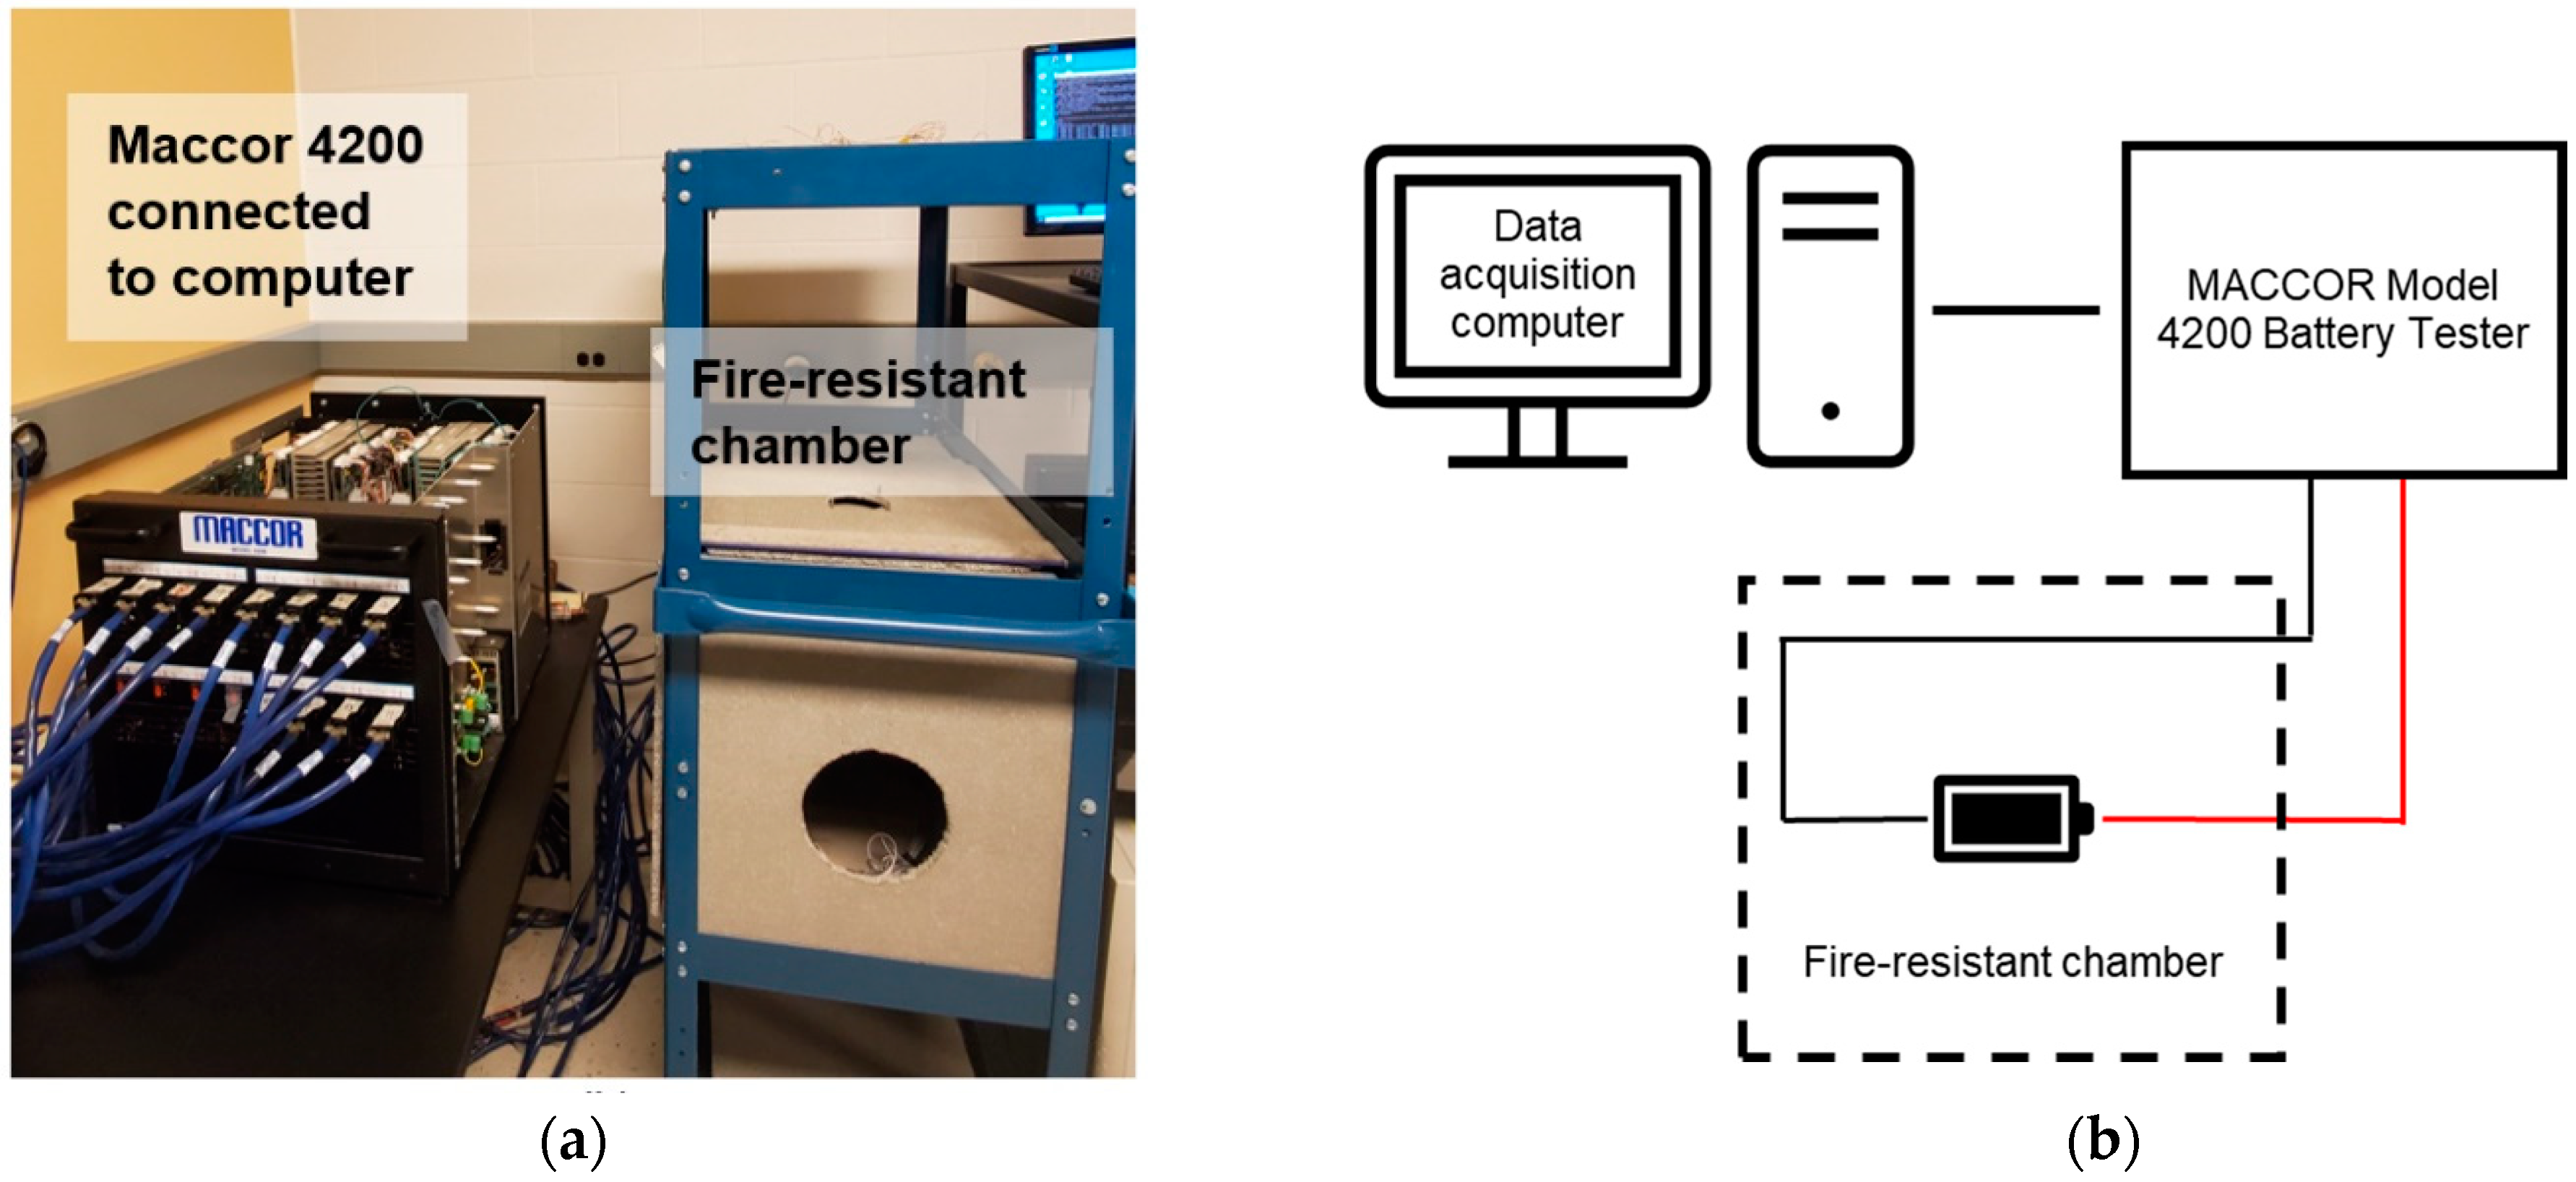
ECMs often use resistor-capacitor (RC) pairs to mimic the phenomenological behavior of a battery’s internal behavior, for example, internal resistance, effective capacitance, and equivalent potential [30]. The commercial RC network model was originally developed by SAFT using the PSpice software platform and was later converted into ADVISOR’s MATLAB-compatible platform [31]. It is designed based on the Thevenin model shown in Figure 1, which connects several parallel RC networks in series to simulate the dynamic characteristics of the battery.
Figure 1a shows a first-order ECM (1RC) that consists of major components including open-circuit voltage (UOC), resistors (Ro, RTh) that are used to represent ohmic resistance and polarization resistance, respectively, and capacitance (CTh) that describes the battery’s transient response during charge and discharge [30]. The second-order ECM (2RC), as represented by Figure 1b, is defined as a dual polarization (DP) model, which can provide refined representation of polarization characteristics, concentration polarization, and electrochemical polarization independently [16]. The 2RC model includes the internal resistance component (Ro) and polarization resistances, Rpa and Rpc, that represent a resistance characterizing electrochemical polarization, and a resistance characterizing concentration polarization, respectively. The second-order ECM also includes effective capacitance, Cpa and Cpc, which represent the transient response of the battery’s charge/discharge process and the polarization characteristic, respectively. Factors including computational time, accuracy, and parameterization are key considerations of a BMS’s efficiency [32,33]. Adding RC networks up to a fifth-order RC model can increase accuracy, but RC networks beyond the second-order model would not achieve an effective balance between computational complexity and accuracy [17].
Hysteresis can be found in modern battery chemistries, which is a phenomenon that affects the cell’s OCV during charging or discharging. Hysteresis can even occur in an idle state known as ‘zero-current hysteresis’, which can cause an OCV response of up to 50 mV or above [34]. Its behavior can depend on factors including charging or discharging relaxation time, battery chemistry, and battery SOC. Prominent hysteresis effects can be found in LFP chemistries, as well as the non-linear regions of SOC for some batteries, between 0–20% and 80–100% [35]. Comparatively, OCV-based estimation algorithms for the estimation models are developed under the combination of a dynamic hysteresis model and an n-RC ECM to further enhance accuracy. For this reason, dedicated circuitry components that represents a battery’s hysteresis behaviors are added to the n-th-order RC model, which are defined as n-th-order RC models with hysteresis [36]. Batteries that exhibit large hysteresis levels would be affected when OCV-based SOC estimation methods are used [37]. The scope of this paper will be limited to the first order ECM with hysteresis.
The equations for the three models discussed in this study are shown below, in discrete form to better suit the MATLAB model construction and calculations.
The first-order ECM is as follows:
V j = O C V R 0 I j U 1 , j
U 1 , j + 1 = exp ( t R 1 C 1 ) U 1 , j + R 1 [ 1 exp ( t R 1 C 1 ) ] I j
the second-order ECM is as follows:
V j = O C V R 0 I j U 1 , j U 2 , j
U 1 , j + 1 = exp ( t R 1 C 1 ) U 1 , j + R 1 [ 1 exp ( t R 1 C 1 ) ] I j
U 2 , j + 1 = exp ( t R 2 C 2 ) U 2 , j + R 2 [ 1 exp ( t R 2 C 2 ) ] I j
and the first-order ECM with hysteresis (ECMwH) is as follows:
V j = O C V R 0 I j U 1 , j + H j
U 1 , j + 1 = exp ( t R 1 C 1 ) U 1 , j + R 1 [ 1 exp ( t R 1 C 1 ) ] I j
H j + 1 = exp ( | k I j t | ) H j + [ 1 exp ( | k I j t | ) ] h
where V is the battery terminal voltage, I is the battery current, OCV is the battery open circuit voltage, R0 is the internal ohmic resistance, U1 and U2 are the voltages of the RC networks, R1C1 and R2C2 are the time constants of the RC networks, H is the hysteresis voltage, k is the hysteresis decaying factor, h is the maximum hysteresis voltage that is positive for charge and negative for discharge, and Δt is the sampling time, with the subscript j being the discrete index. In these equivalent circuit models, V is the output, and I is the input, while OCV, R0, R1, C1, R2, C2, k, and h are the model parameters and are functions of the battery SOC.

3. Experimental

One cell was tested for each of the four chemistries. The four cells, including LFP, NMC, LMO, and NCA, are presented in Figure 2. The specifications of each cell are outlined in Table 5. Experimental testing for all four cells was conducted using a MACCOR Model 4200 battery testing system, with each cell inside a fire-resistant chamber at a room temperature of 23 °C, as shown in Figure 3. All the tests described below were run at a controlled ambient temperature to ensure consistency of the data.

3.1. Cell Characterization Experiments

The characterization of each cell consisted of the following three stages: (1) capacity testing, (2) SOC–OCV testing, and (3) hybrid pulse power characterization (HPPC) testing. Capacity tests consisted of three complete charge/discharge cycles at 1C-rate. SOC–OCV tests consisted of a complete charge/discharge cycle at a C-rate of C/25. Lastly, HPPC tests were performed according to the test profile shown in Figure 4 (for the NCA cell as a representative for all four tested cells). At each SOC level from 0.1 to 0.9 with an interval of 0.1, a one-minute discharge/rest/charge pulse was run. The steps followed in the HPPC test were as follows, beginning at a fully charged state:
(1)
Discharge pulse at 1C for 10 s.
(2)
Rest for 40 s.
(3)
Charge pulse at 0.75C for 10 s.
(4)
Rest for 30 min.
(5)
Discharge at 1C for 6 min (resulting in a 10% drop in the SOC).
(6)
Rest for 1 h.
(7)
Repeat steps (1)–(6) 10 times.
The capacity tests are performed to confirm the rated capacity of the cells, to ensure that the 1C-rate current is accurate. The SOC–OCV tests are conducted to establish the relationship between the SOC and the OCV. The voltage and current data collected from the HPPC tests are used to fit the ECM parameters aside from the OCV, using the ‘nlinfit’ function in MATLAB. It should be noted, about the sign convention, that positive current values indicate discharging and negative current values indicate charging.

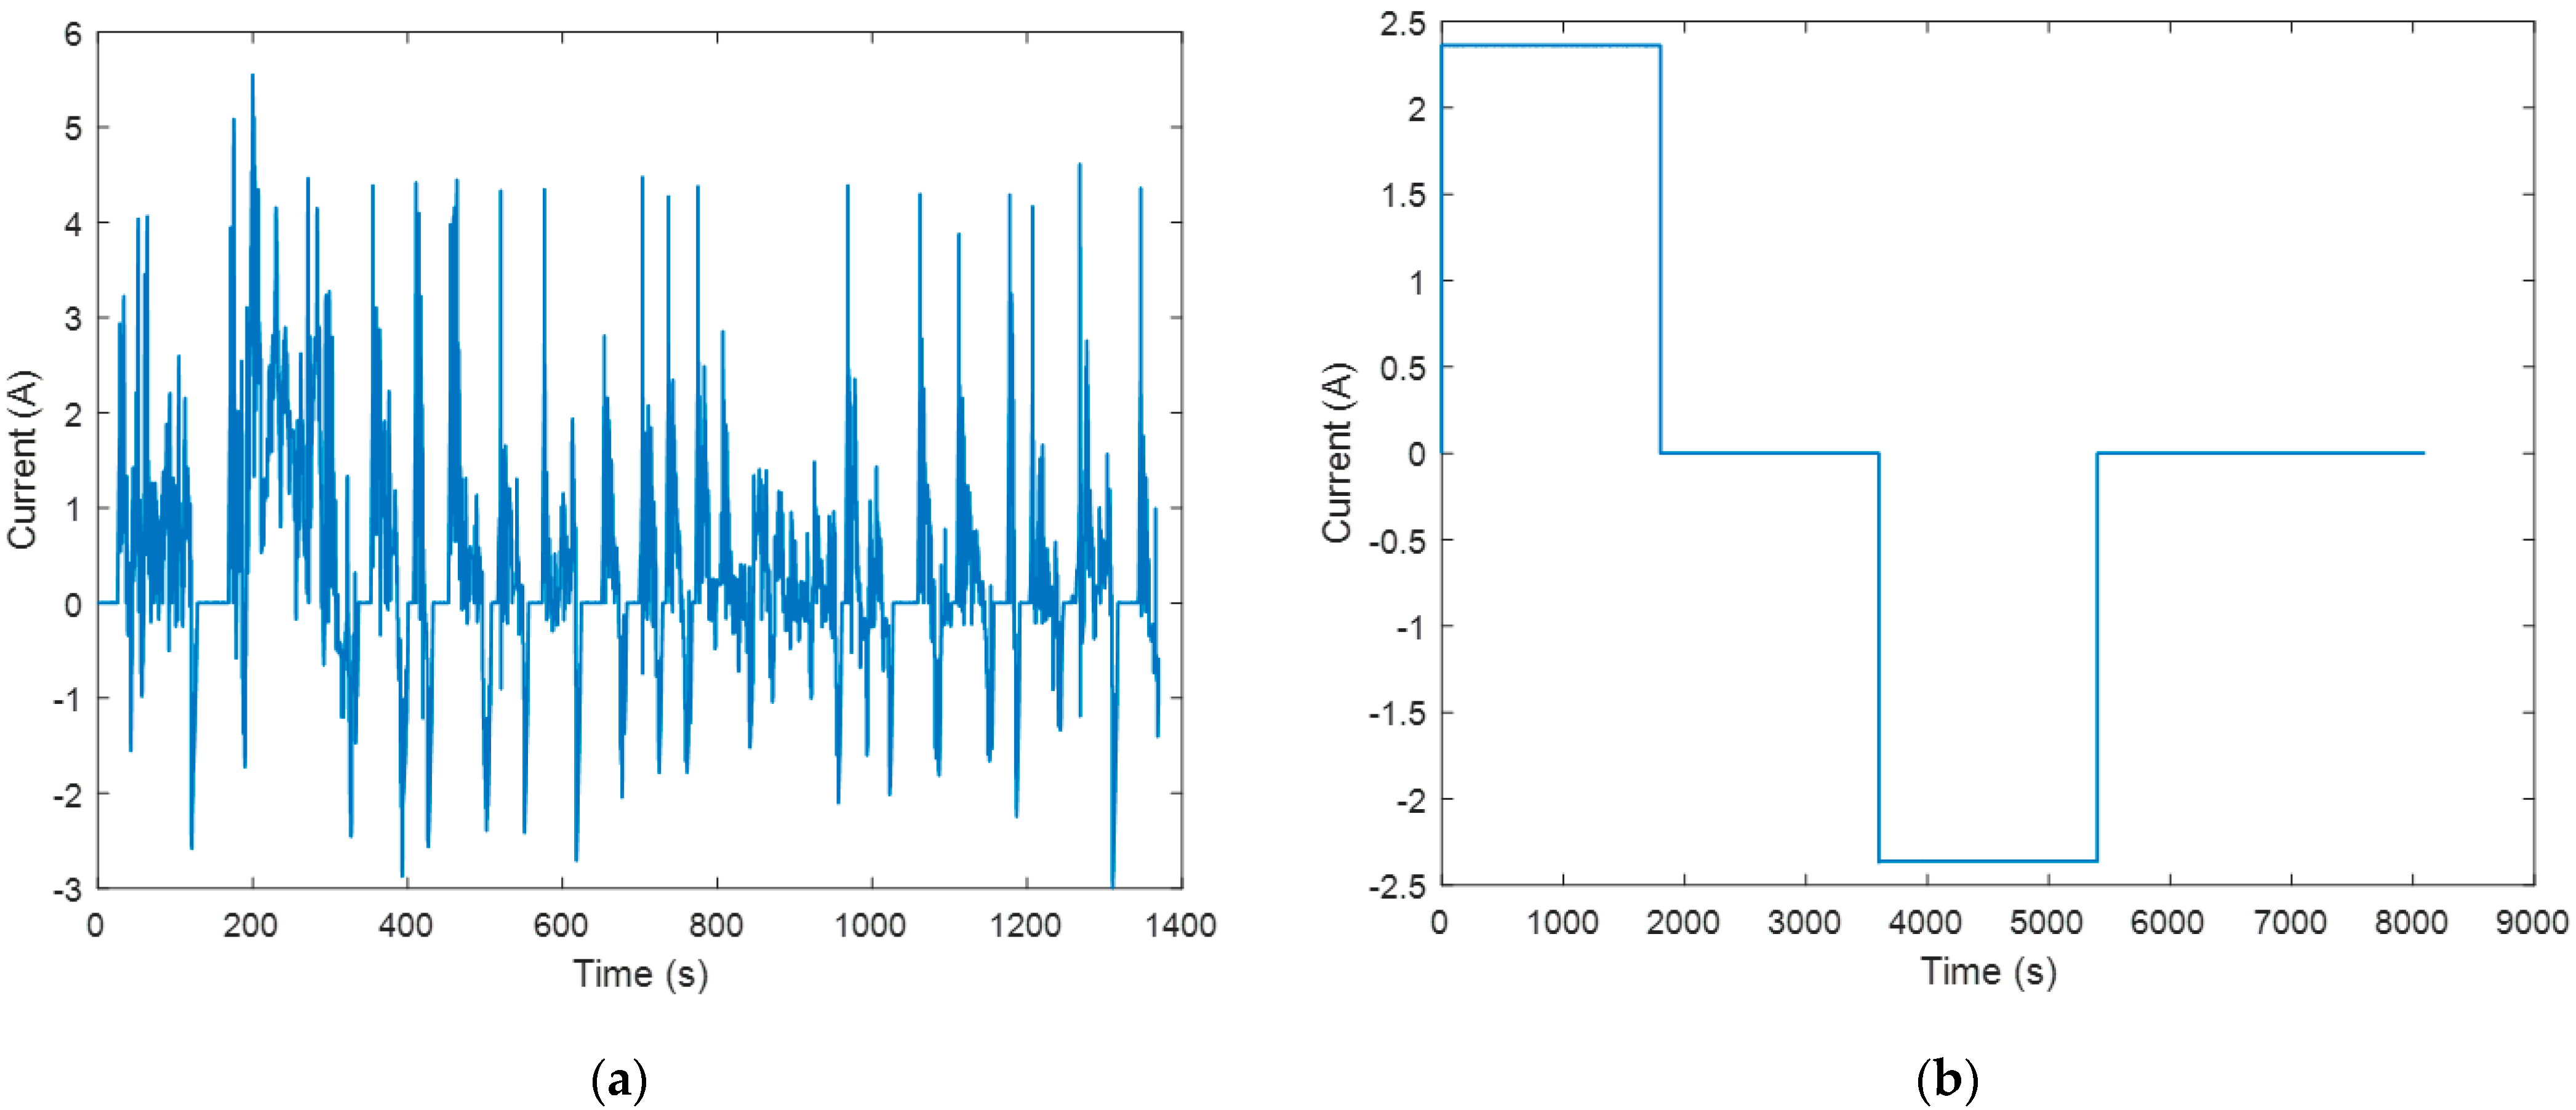
3.2. Model Validation Experiments

To validate the battery models, a dynamic profile and a non-dynamic profile were used, in order to represent different battery applications. A dynamic profile can be described as inconsistent charging and discharging cycles that mimic a real-life application. This is often used in battery testing to obtain real-life simulation data and can validate cell models. For example, UDDS represents general city driving conditions in the United States, established by the United States Environmental Protection Agency (EPA) [38]. The driving conditions can be translated into battery discharge and charge (regenerative braking) patterns. In contrast, a non-dynamic profile consistently performs battery cycles that simulate non-intensive electrical devices such as smartphones and other low usage devices. Figure 5 shows the current profiles for one UDDS drive cycle and a non-dynamic (ND) cycle. The four batteries went through these cycles under the MACCOR, and the experimental voltage and current measurements were collected. The experimental current data were used as the input for the battery models, and the predicted voltage was then calculated as the output using MATLAB. The cycles were run at 11 different initial battery SOC levels, ranging from 0.3 to 0.8 with an increment of 0.05, as this is the normal operating SOC range for many battery applications. The predicted voltage from the models was then compared to the experimental voltage to evaluate the performance of the models.

4. Results

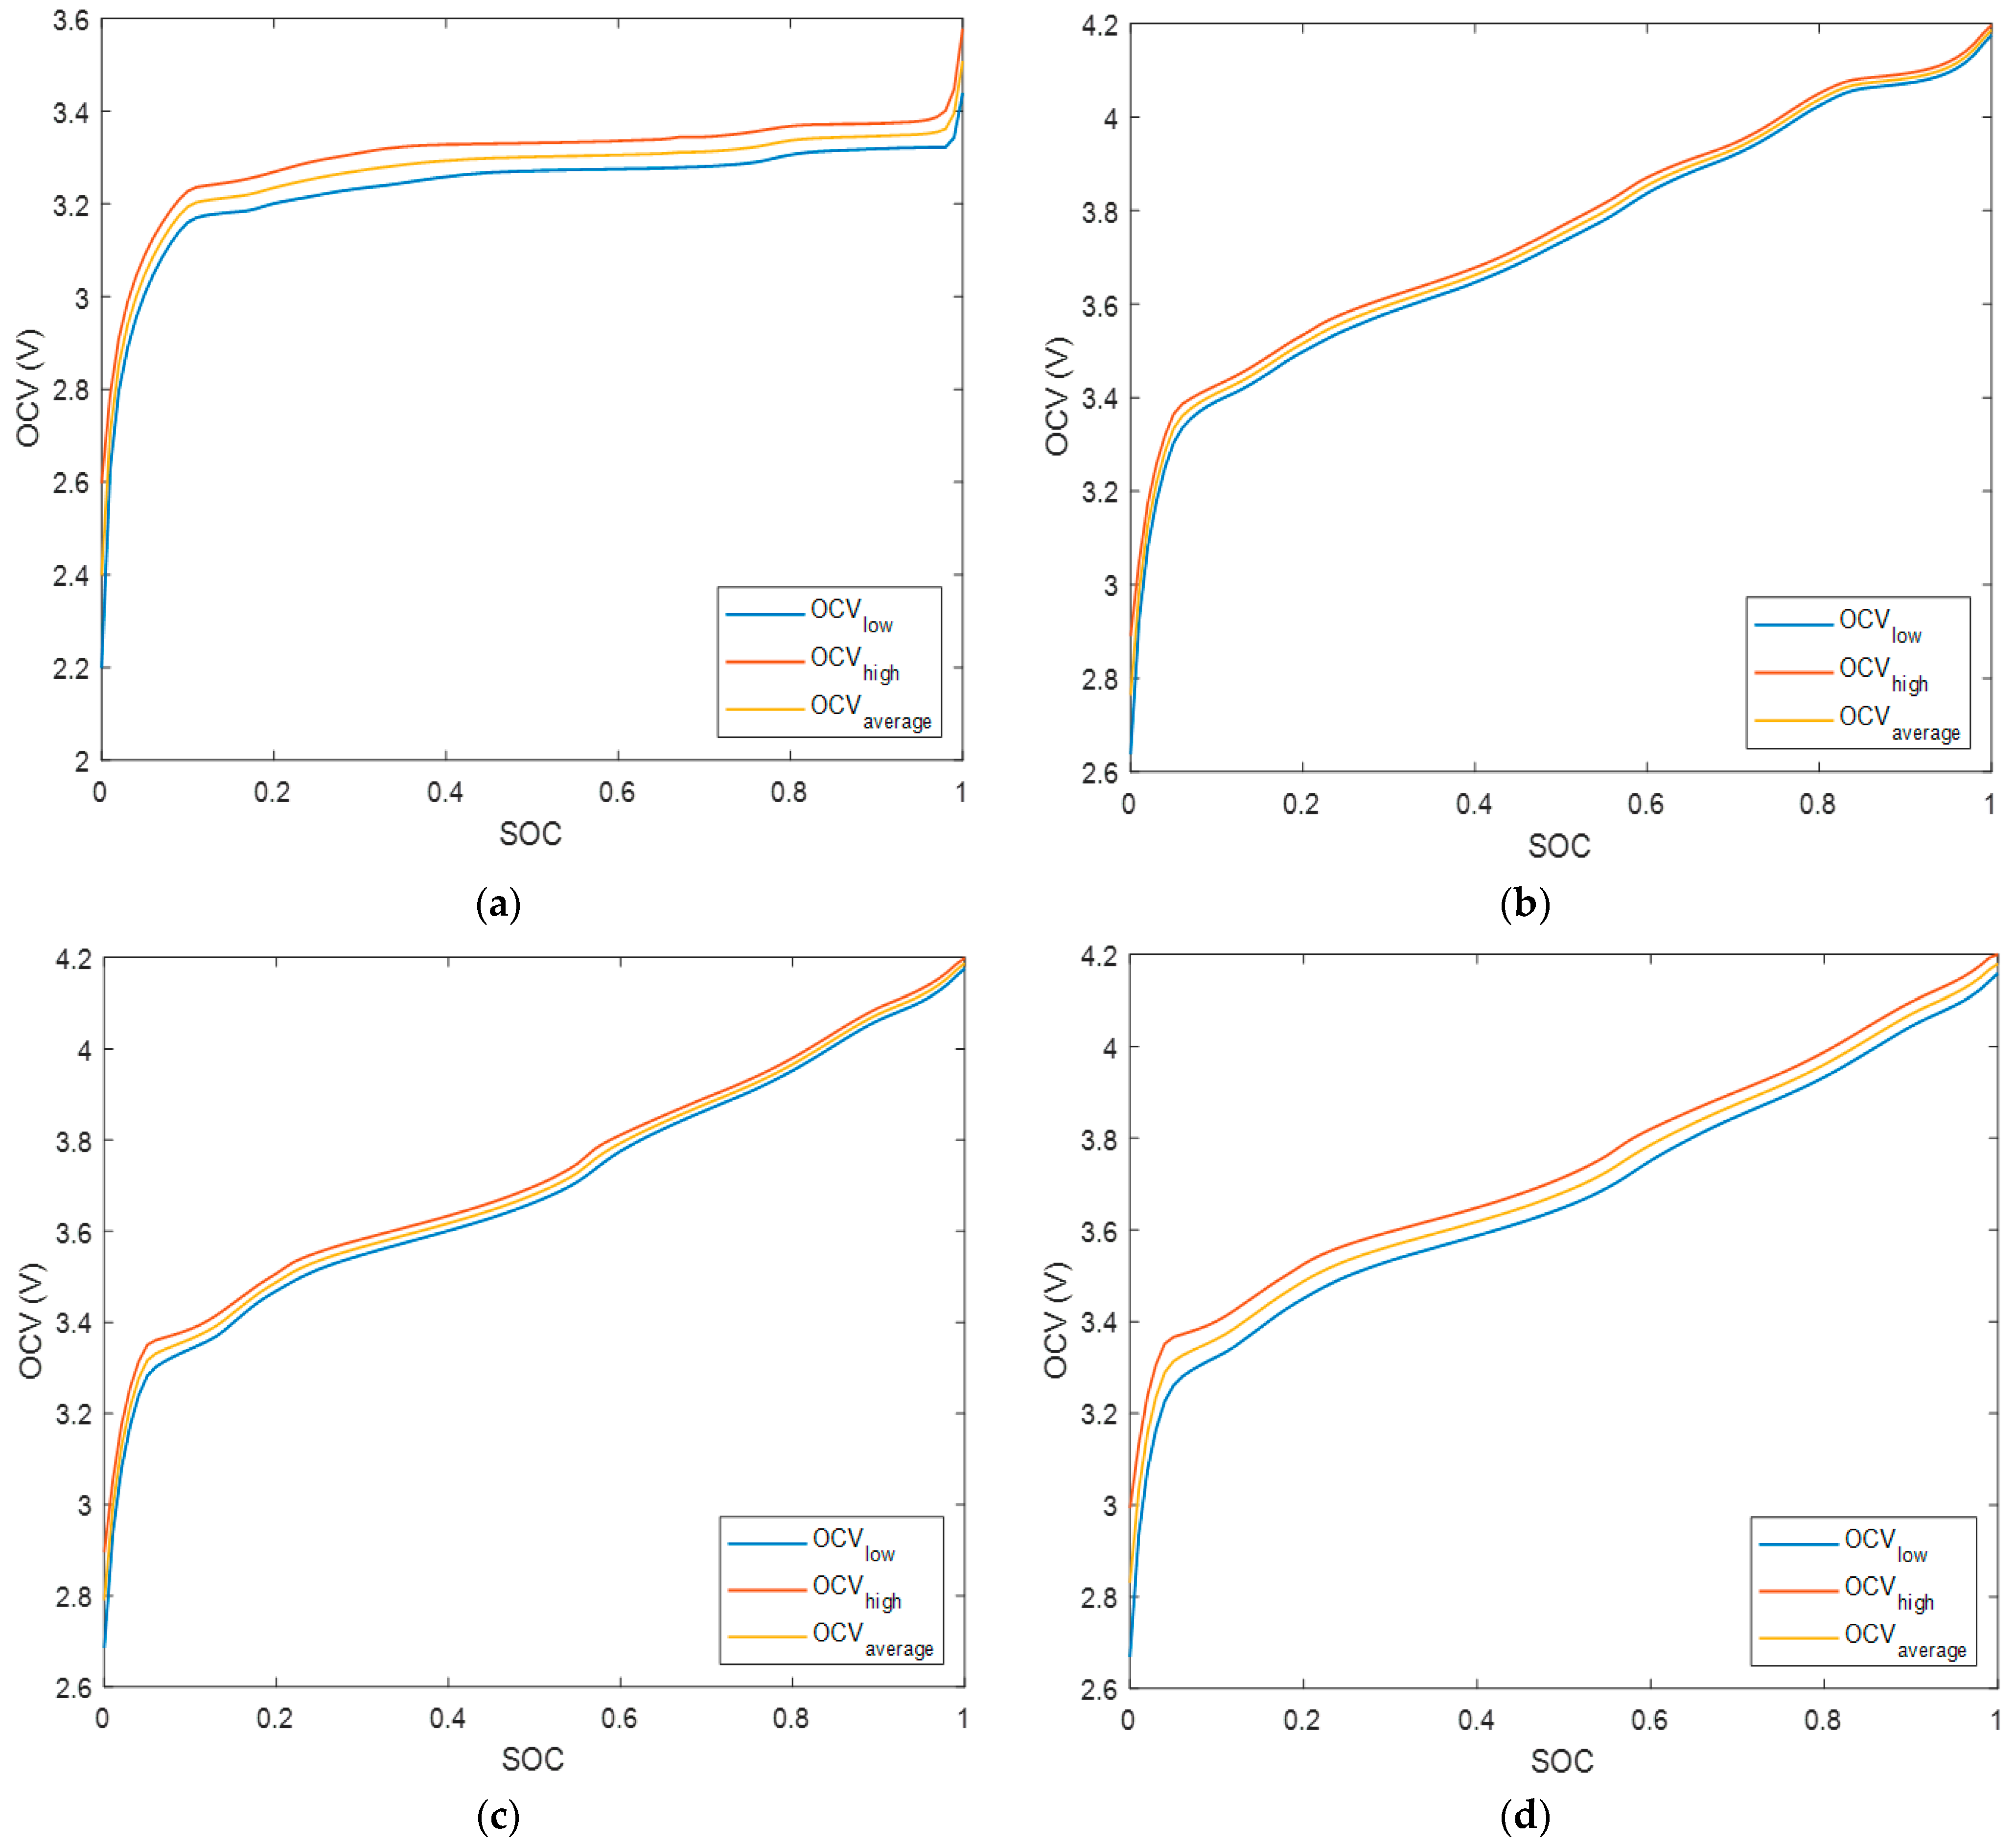
4.1. Cell Characterization Results

The SOC–OCV curves were constructed for each cell chemistry as shown in Figure 6. The lower values of the OCV came from the discharging of the cells, whereas the higher OCV values came from charging. The average OCV values are to be used in the three ECMs as a parameter. From Figure 6, it is observed that there is more variation between the high and low OCV values in LFP and NCA. It is, hence, expected that the 1RC with hysteresis model will perform better in those cells, compared to NMC and LMO.
The data collected from the HPPC runs were fitted with the three ECMs using the ‘nlinfit’ function in MATLAB, which utilizes the Levenberg–Marquardt nonlinear least squares algorithm to fit data to functions. The MATLAB scripts for the model fitting can be found at https://github.com/kmtran95/Battery-HPPC-model-fitting (accessed on 21 July 2021). The voltage and current data from the one-minute pulse, at each SOC level from 0.1 to 0.9, were input into MATLAB and fitted with the ‘nlinfit’ function. The results of the fitting can be seen in Table 6, Table 7, Table 8 and Table 9 for LFP, NMC, LMO, and NCA, respectively. The validation experiments would only be conducted under initial SOC levels ranging from 0.3 to 0.8. Thus, only the parameter data from 0.3 to 0.8 SOC, obtained from the HPPC runs and interpolated from the result tables, would be utilized for model validation in this study. The parameters would then be used in the ECMs to predict the voltage in the UDDS and ND cycles at different SOCs, and validation results are shown in the next sub-section.

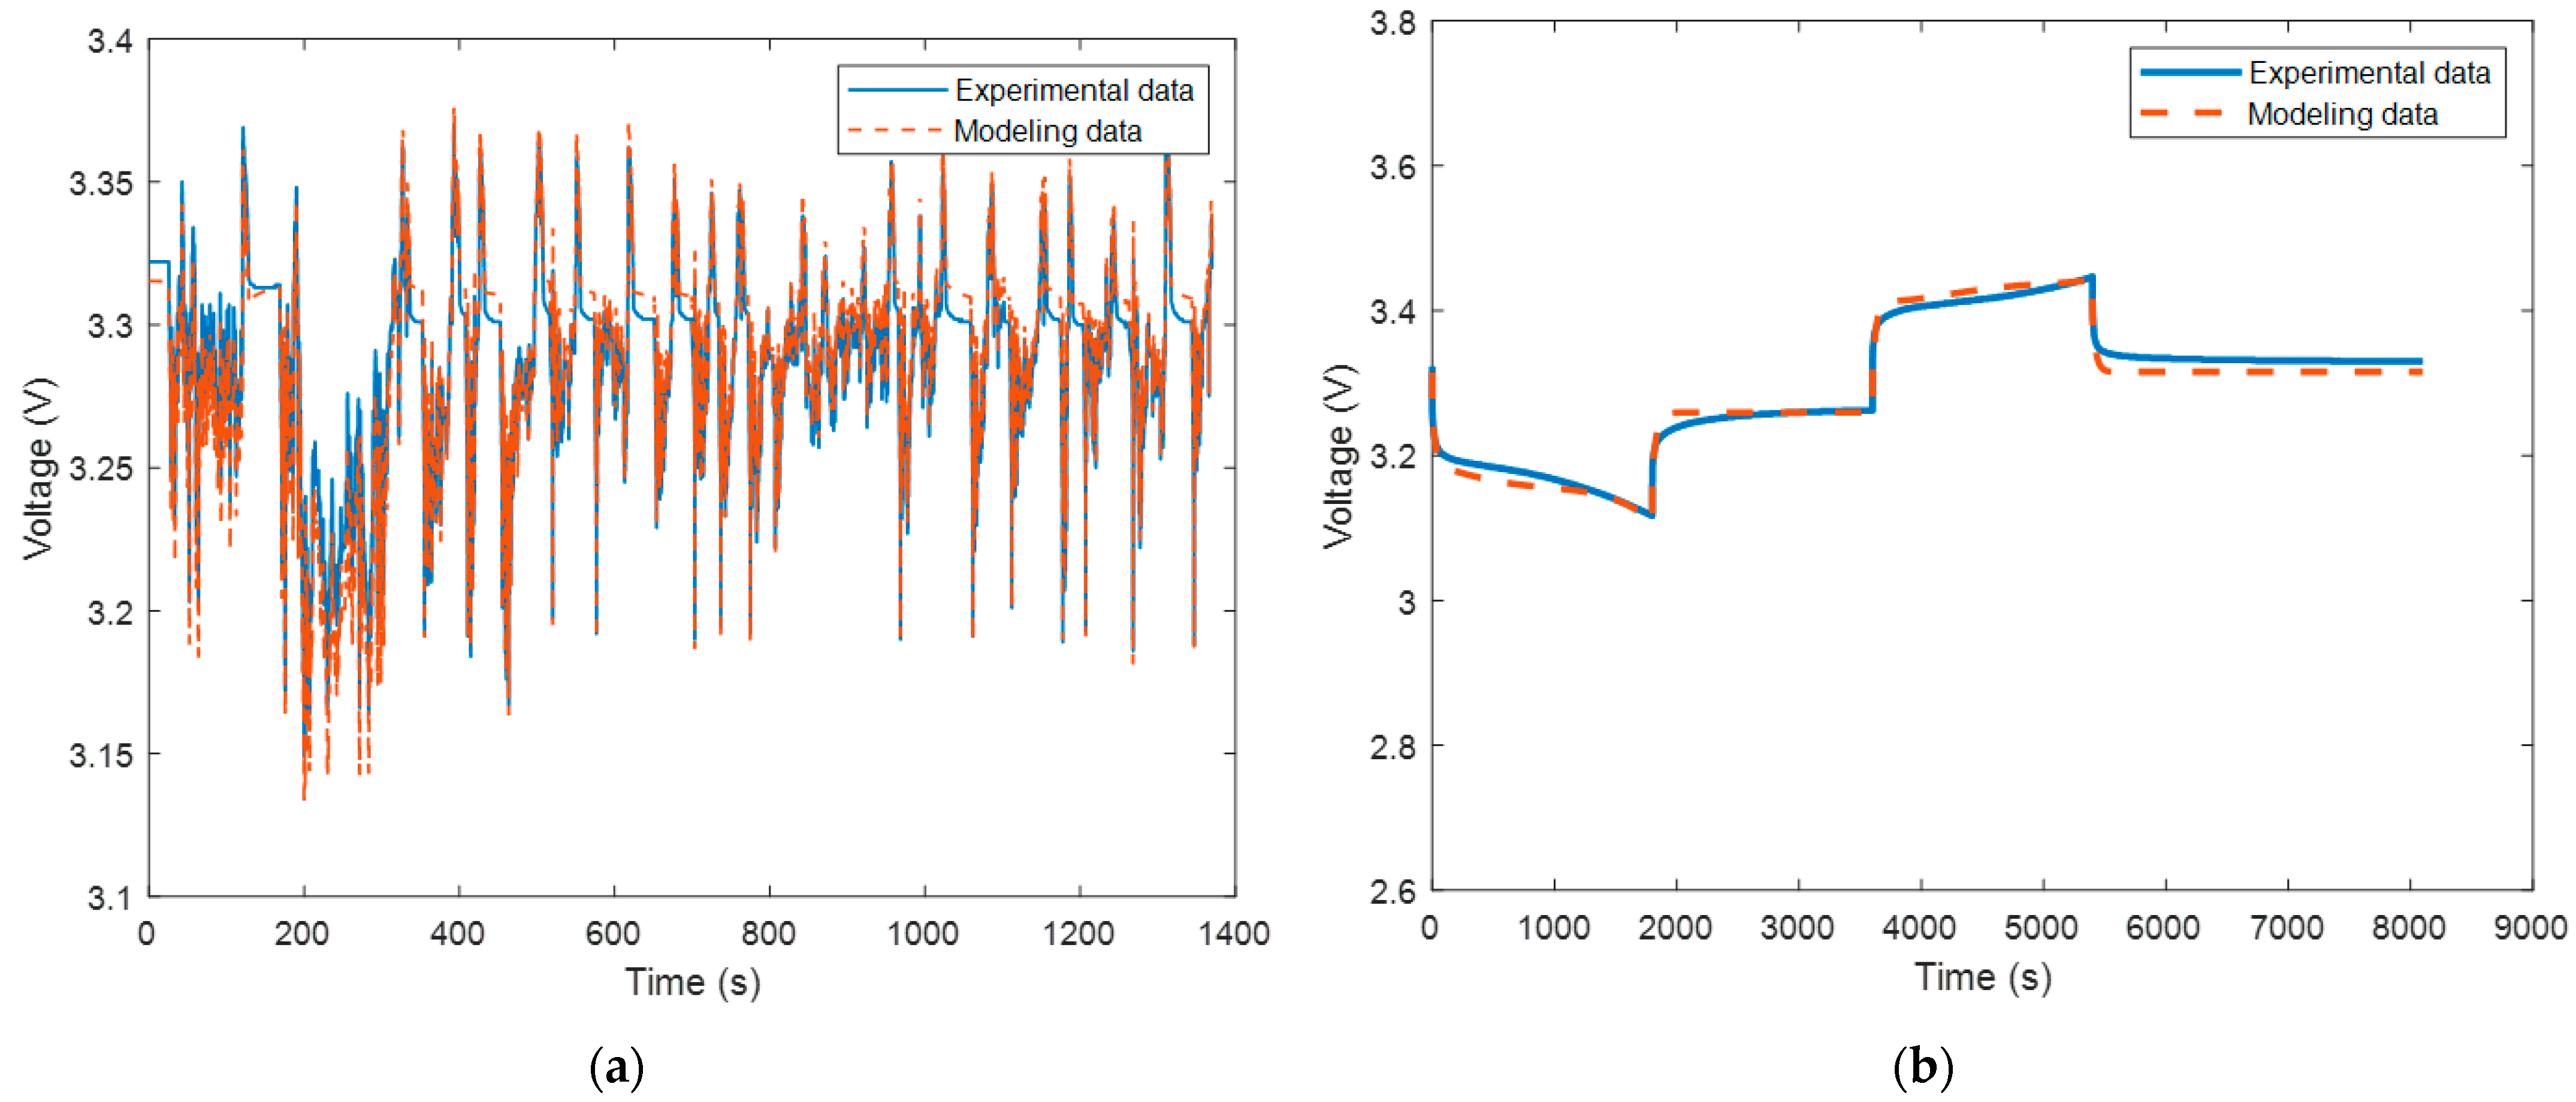
4.2. Model Validation Results

Using the parameters from Table 6, Table 7, Table 8 and Table 9, the battery voltage of each cell can be predicted using the three ECMs, with the measured battery current data being the input of the models. Two types of cycles were used in the validation experiments, a dynamic UDDS and a non-dynamic discharge/rest/charge cycle, representing two different battery application types. In total, there were 132 validation runs, including one for each of the 4 cells, 3 models, and 11 SOC levels. Since there are a large number of runs, only one validation run result is presented as a representative. Figure 7 shows the model validation results for the LFP cell using the first-order ECM at 0.6 SOC. As can be seen, the model, for the most part, agrees well with the experimental data. This observation was also seen with the rest of the validation runs. It can be stated that all three models performed relatively well for predicting the battery voltage, indicated by the low errors between the predicted voltage and the experimentally measured voltage. For each run, the root mean square error (RMSE) of the voltage was calculated as a metric for model performance. The performance of each model in different cell chemistries can be evaluated and compared, and further comparative results and analysis are discussed in the next sub-section.

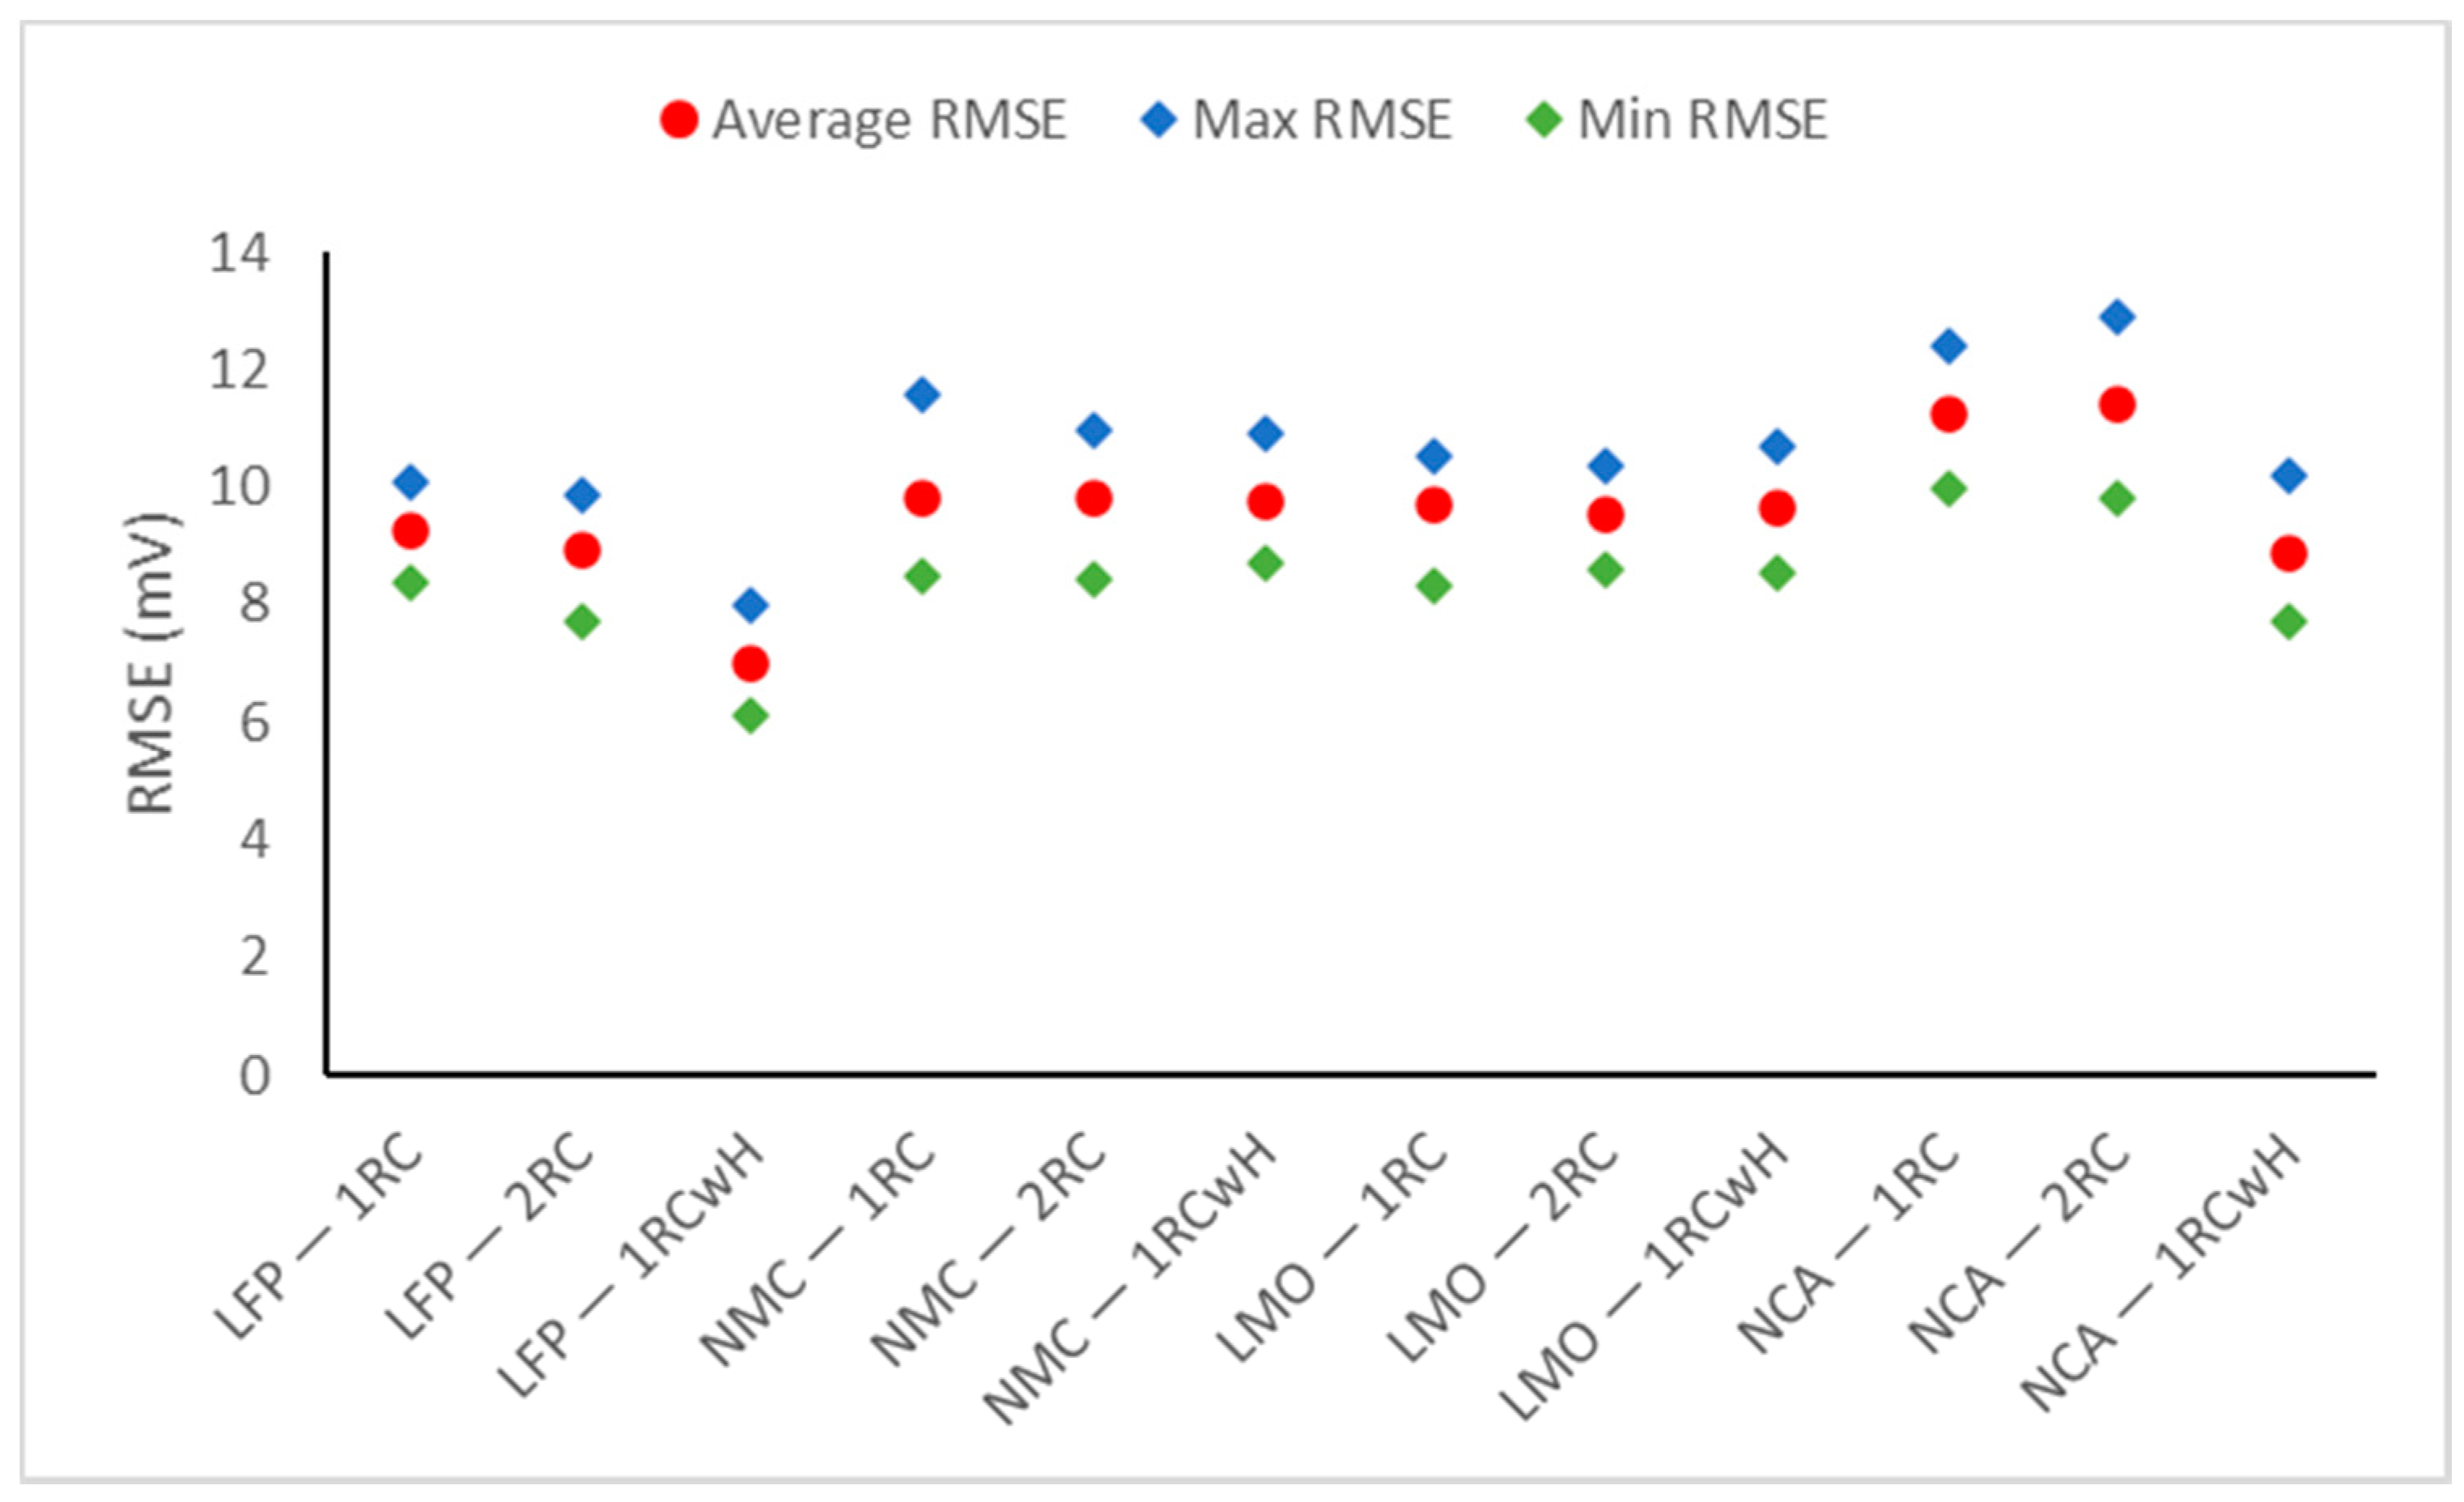
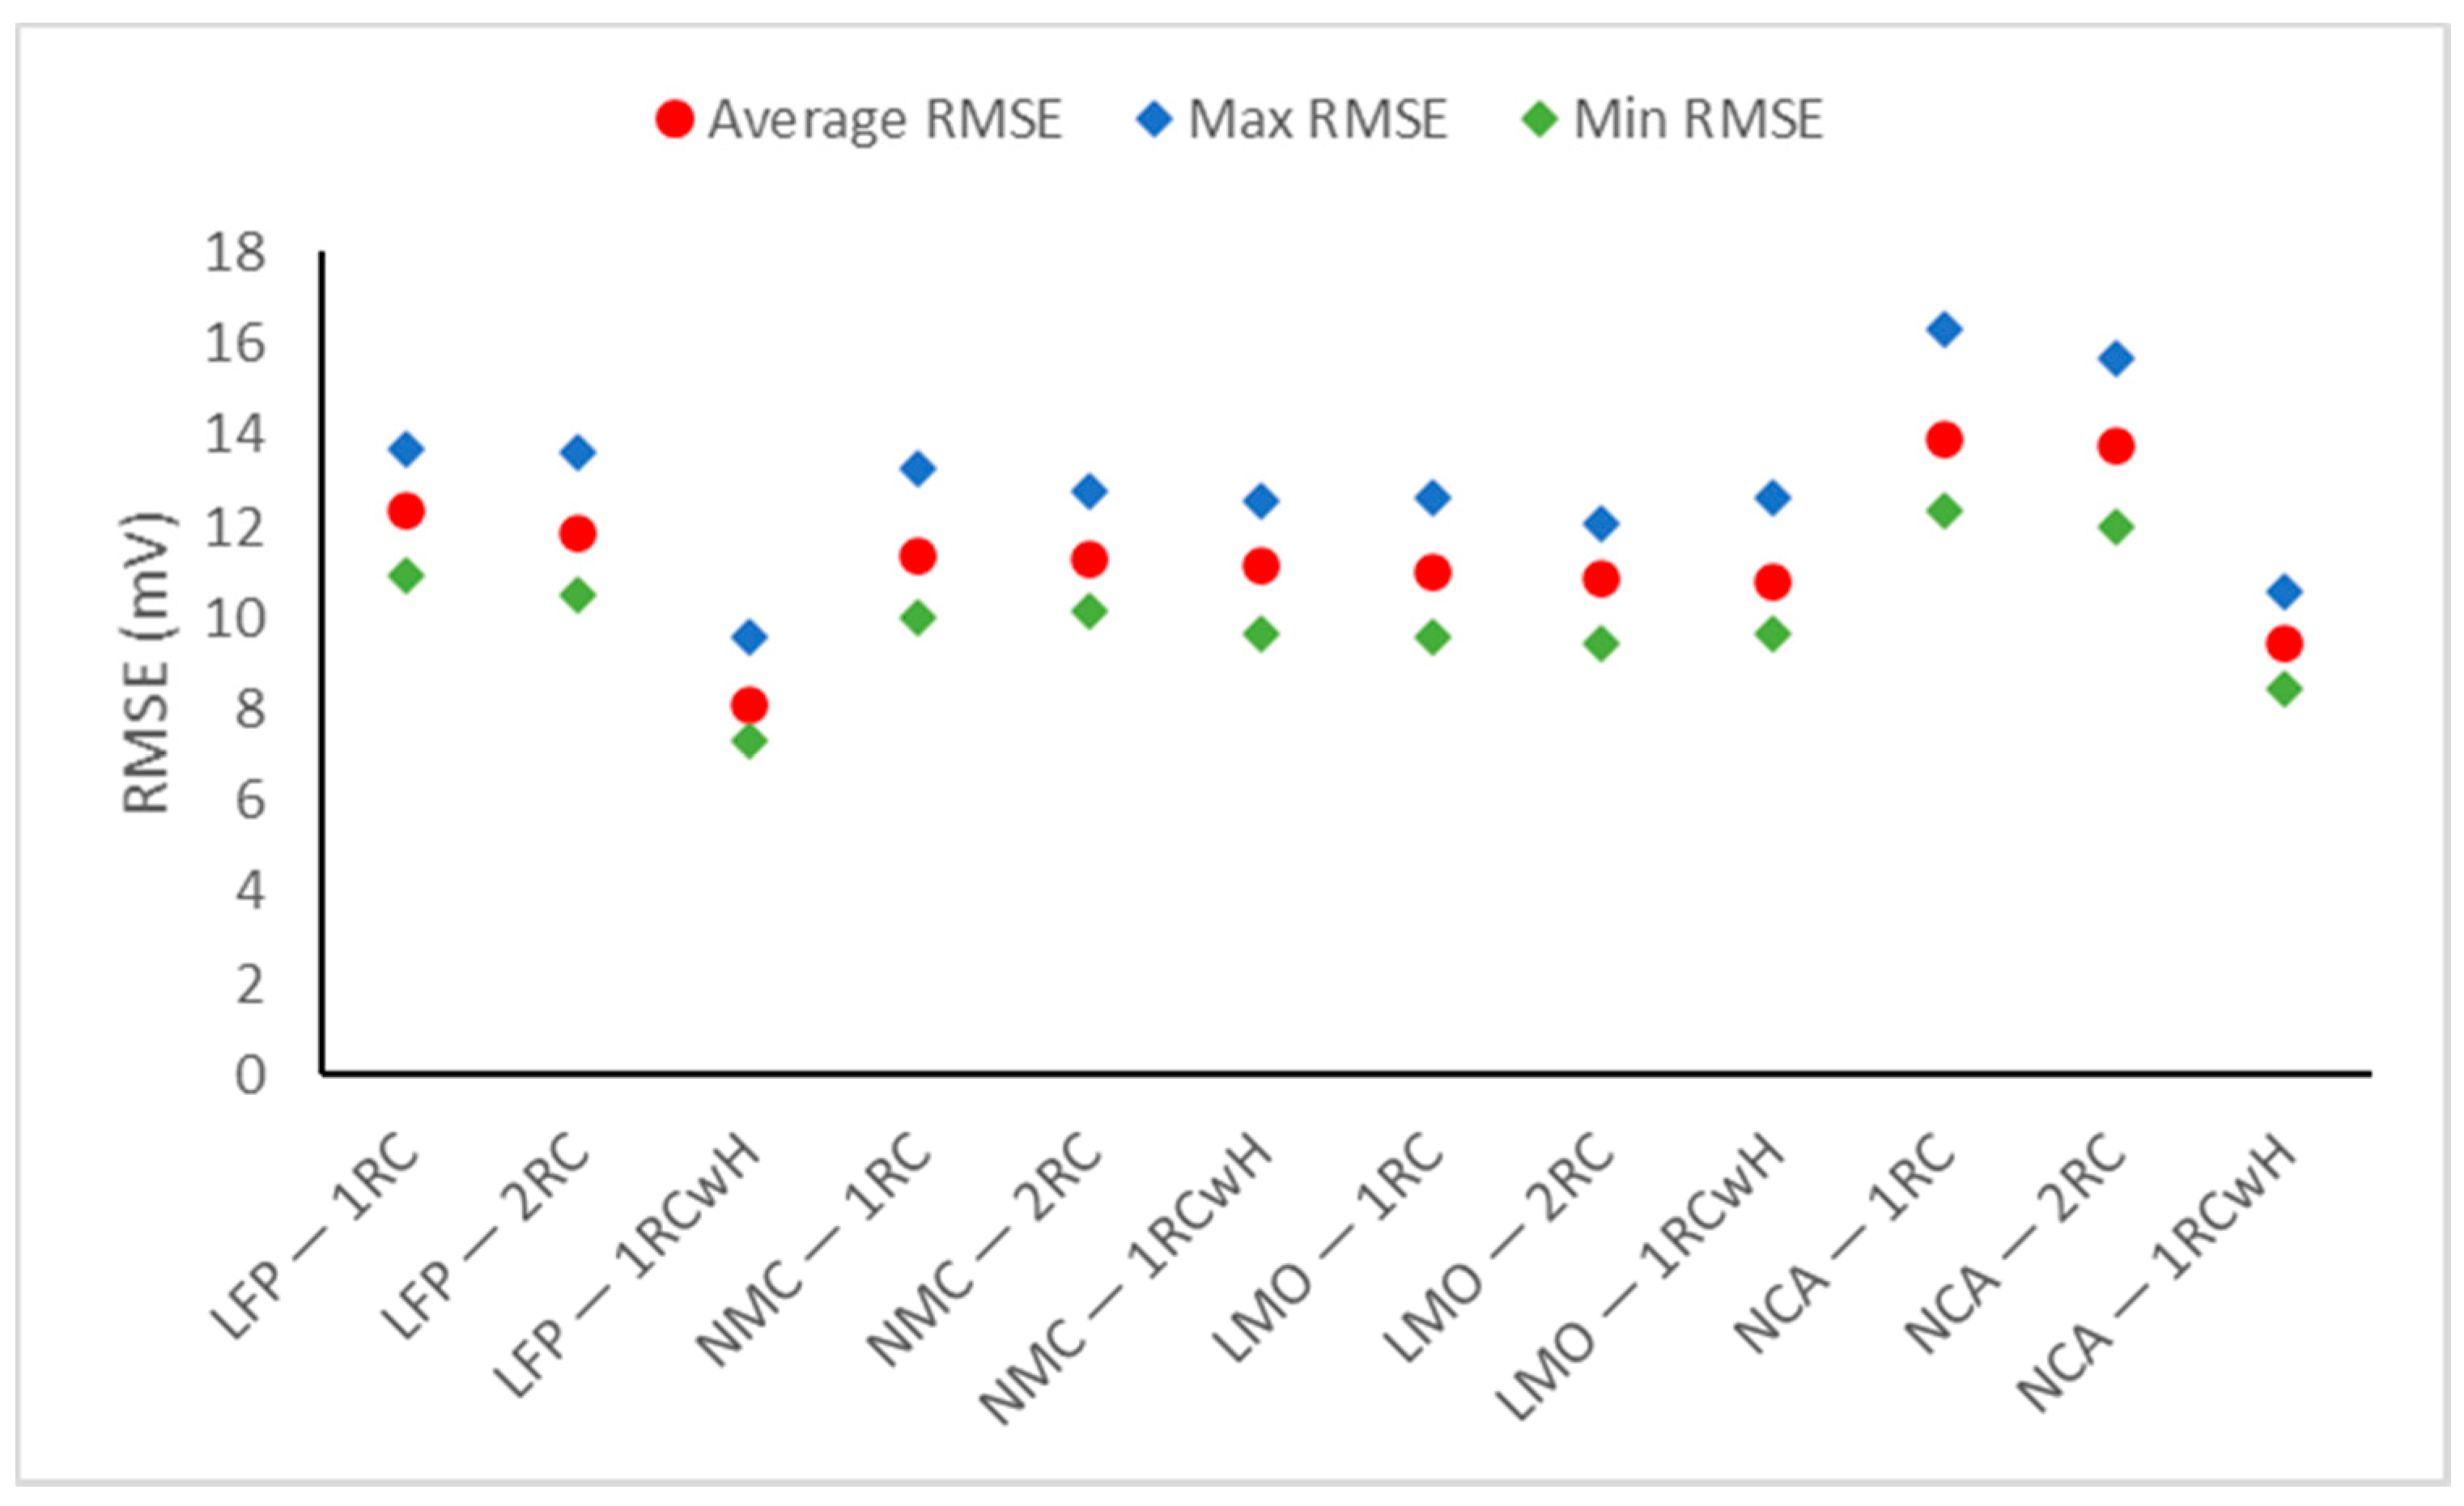
4.3. Comparative Discussion of Models and Battery Chemistries

Figure 8 and Figure 9 show the comparison between the three models for the four chemistries in terms of RMSE. The ’Average RMSE’, ‘Max RMSE’, and ‘Min RMSE’ noted in the figures are the average, maximum, and minimum values of the RMSE for each of the 11 SOC levels that were tested for each model and cell chemistry.
As can be seen from the figures, the trends are relatively similar for the two cycles, UDDS and ND. However, the errors from the UDDS cycles are lower than those from the ND cycles, indicating that the ECM might perform better in more dynamic applications. In terms of cell chemistry, using an ECM without hysteresis, LFP, LMO, and NMC give better model prediction performance than NCA. Using an ECM with hysteresis, LFP gives significantly better results than the rest. Additionally, NCA improves its results from the worst (using an ECM without hysteresis) to the second best (using an ECM with hysteresis). In terms of model accuracy, the 1RCwH model performed the best in LFP and NCA, which was expected from the SOC–OCV curve observations. For LMO and NMC, all three models have very similar performance; therefore, the simplest model should be sufficient in these cells. In general, the 2RC ECM performs better than the 1RC ECM, but not by a significant amount. It should be noted that, in terms of computational complexity, 1RCwH and 2RC have the same number of parameters, therefore, it is assumed that they have a similar complexity, while 1RC is the least complex since it has the fewest number of parameters. Therefore, it can be concluded that the 1RCwH model is most suited for LFP and NCA cells due to the high hysteresis effect in those chemistries, and the 1RC model is most suited for LMO and NMC cells because of its lower complexity and comparable performance overall.

5. Conclusions

This study investigated and compared the performance of three different equivalent circuit models (1RC, 2RC, and 1RC with hysteresis) using four Li-ion battery chemistries (LFP, NMC, LMO, and NCA) under dynamic and non-dynamic current profiles. The batteries underwent characterization experiments to obtain the model parameters to be used in voltage prediction. The three models were then validated experimentally and compared using RMSE to determine the best model for each type of Li-ion battery. The main conclusions from this work are as follows:
  • All three ECMs were able to predict battery voltage with low errors.
  • The hysteresis effect is stronger in LFP and NCA compared to NMC and LMO, based on the SOC–OCV curves of the batteries.
  • The ECMs perform better under dynamic current profiles such as a UDDS cycle compared to non-dynamic profiles such as a constant discharge/rest/charge cycle.
  • The ECMs perform the best for the LFP cell, and the worst for the NCA cell, while for NMC and LMO, the results are similar and in between the other two.
  • Overall, the best model for LFP and NCA is 1RC with hysteresis, as the improvement in accuracy is worth the increase in computational complexity. On the other hand, the best model for NMC and LMO is 1RC, since it has decent accuracy compared to the other models while having the lowest complexity.
These findings above show that different ECMs are suited for different Li-ion battery chemistries, which should be an important factor to be considered in battery and BMS applications. The results from this study contribute towards a better understanding of battery modeling as well as the future developments of more advanced and accurate battery models to be used in real-world applications.

Author Contributions

Conceptualization, M.-K.T. and M.F.; methodology, M.-K.T. and A.D.; software, M.-K.T. and A.M.; validation, M.-K.T., S.P., and M.F.; formal analysis, M.-K.T.; investigation, M.-K.T.; resources, M.F.; data curation, A.D.; writing—original draft preparation, M.-K.T. and A.D.; writing—review and editing, A.M., S.P., and M.F.; visualization, M.-K.T. and A.D.; supervision, S.P. and M.F.; funding acquisition, M.F. All authors have read and agreed to the published version of the manuscript.

Funding

This research received no external funding.

Institutional Review Board Statement

Not applicable.

Informed Consent Statement

Not applicable.

Data Availability Statement

The data presented in this study are available on request from the corresponding author. The data are not publicly available due to confidentiality.

Acknowledgments

This work was supported by the Department of Chemical Engineering at the University of Waterloo, Canada Research Chair Tier I—Zero-Emission Vehicles and Hydrogen Energy Systems Grant number: 950-232215, and The Natural Sciences and Engineering Research Council of Canada (NSERC), Discovery Grants Program, RGPIN-2020-04149.

Conflicts of Interest

The authors declare no conflict of interest.

References

  1. Statistics Canada. Electric Power Generation, Monthly Generation by Type of Electricity. 2021. Available online: https://0-doi-org.brum.beds.ac.uk/10.25318/2510001501-eng (accessed on 23 May 2021).
  2. Tran, M.-K.; Sherman, S.; Samadani, E.; Vrolyk, R.; Wong, D.; Lowery, M.; Fowler, M. Environmental and Economic Benefits of a Battery Electric Vehicle Powertrain with a Zinc–Air Range Extender in the Transition to Electric Vehicles. Vehicles 2020, 2, 21. [Google Scholar] [CrossRef]
  3. Tran, M.-K.; Bhatti, A.; Vrolyk, R.; Wong, D.; Panchal, S.; Fowler, M.; Fraser, R. A Review of Range Extenders in Battery Electric Vehicles: Current Progress and Future Perspectives. World Electr. Veh. J. 2021, 12, 54. [Google Scholar] [CrossRef]
  4. Panchal, S.; Gudlanarva, K.; Tran, M.-K.; Fraser, R.; Fowler, M. High Reynold’s Number Turbulent Model for Micro-Channel Cold Plate Using Reverse Engineering Approach for Water-Cooled Battery in Electric Vehicles. Energies 2020, 13, 1638. [Google Scholar] [CrossRef] [Green Version]
  5. Tran, M.-K.; Akinsanya, M.; Panchal, S.; Fraser, R.; Fowler, M. Design of a Hybrid Electric Vehicle Powertrain for Performance Optimization Considering Various Powertrain Components and Configurations. Vehicles 2021, 3, 2. [Google Scholar] [CrossRef]
  6. Cunanan, C.; Tran, M.-K.; Lee, Y.; Kwok, S.; Leung, V.; Fowler, M. A Review of Heavy-Duty Vehicle Powertrain Technologies: Diesel Engine Vehicles, Battery Electric Vehicles, and Hydrogen Fuel Cell Electric Vehicles. Clean Technol. 2021, 3, 28. [Google Scholar] [CrossRef]
  7. Fotouhi, A.; Auger, D.J.; Propp, K.; Longo, S.; Wild, M. A Review on Electric Vehicle Battery Modelling: From Lithium-Ion toward Lithium–Sulphur. Renew. Sustain. Energy Rev. 2016, 56, 1008–1021. [Google Scholar] [CrossRef] [Green Version]
  8. U.S. Energy Information Administration. Battery Storage in the United States: An Update on Market Trends; U.S. Energy Information Administration: Washington, DC, USA, 2020. [Google Scholar]
  9. Tran, M.-K.; Fowler, M. A Review of Lithium-Ion Battery Fault Diagnostic Algorithms: Current Progress and Future Challenges. Algorithms 2020, 13, 62. [Google Scholar] [CrossRef] [Green Version]
  10. Fleischer, C.; Waag, W.; Heyn, H.-M.; Sauer, D.U. On-Line Adaptive Battery Impedance Parameter and State Estimation Considering Physical Principles in Reduced Order Equivalent Circuit Battery Models: Part 1. Requirements, Critical Review of Methods and Modeling. J. Power Sources 2014, 260, 276–291. [Google Scholar] [CrossRef]
  11. Tran, M.-K.; Fowler, M. Sensor Fault Detection and Isolation for Degrading Lithium-Ion Batteries in Electric Vehicles Using Parameter Estimation with Recursive Least Squares. Batteries 2020, 6, 1. [Google Scholar] [CrossRef] [Green Version]
  12. Mevawalla, A.; Panchal, S.; Tran, M.-K.; Fowler, M.; Fraser, R. Mathematical Heat Transfer Modeling and Experimental Validation of Lithium-Ion Battery Considering: Tab and Surface Temperature, Separator, Electrolyte Resistance, Anode-Cathode Irreversible and Reversible Heat. Batteries 2020, 6, 61. [Google Scholar] [CrossRef]
  13. Yann Liaw, B.; Nagasubramanian, G.; Jungst, R.G.; Doughty, D.H. Modeling of Lithium Ion Cells—A Simple Equivalent-Circuit Model Approach. Solid State Ion. 2004, 175, 835–839. [Google Scholar] [CrossRef]
  14. Fletcher, S.; Black, V.J.; Kirkpatrick, I. A universal equivalent circuit for carbon-based supercapacitors. J. Solid State Electrochem. 2013, 18, 1377–1387. [Google Scholar] [CrossRef] [Green Version]
  15. Mevawalla, A.; Panchal, S.; Tran, M.-K.; Fowler, M.; Fraser, R. One dimensional fast computational partial differential model for heat transfer in lithium-ion batteries. J. Energy Storage 2021, 37, 102471. [Google Scholar] [CrossRef]
  16. He, H.; Xiong, R.; Guo, H.; Li, S. Comparison Study on the Battery Models Used for the Energy Management of Batteries in Electric Vehicles. Energy Convers. Manag. 2012, 64, 113–121. [Google Scholar] [CrossRef]
  17. Hu, X.; Li, S.; Peng, H. A Comparative Study of Equivalent Circuit Models for Li-Ion Batteries. J. Power Sources 2012, 198, 359–367. [Google Scholar] [CrossRef]
  18. Zhang, L.; Peng, H.; Ning, Z.; Mu, Z.; Sun, C. Comparative Research on RC Equivalent Circuit Models for Lithium-Ion Batteries of Electric Vehicles. Appl. Sci. 2017, 7, 1002. [Google Scholar] [CrossRef] [Green Version]
  19. Divya, K.C.; Østergaard, J. Battery Energy Storage Technology for Power Systems—An Overview. Electr. Power Syst. Res. 2009, 79, 511–520. [Google Scholar] [CrossRef]
  20. Satyavani, T.V.S.L.; Srinivas Kumar, A.; Subba Rao, P.S.V. Methods of Synthesis and Performance Improvement of Lithium Iron Phosphate for High Rate Li-Ion Batteries: A Review. Eng. Sci. Technol. Int. J. 2016, 19, 178–188. [Google Scholar] [CrossRef] [Green Version]
  21. Padhi, A.K.; Nanjundaswamy, K.S.; Goodenough, J.B. Phospho-olivines as Positive-Electrode Materials for Rechargeable Lithium Batteries. J. Electrochem. Soc. 1997, 144, 1188. [Google Scholar] [CrossRef]
  22. Forte, F.; Pietrantonio, M.; Pucciarmati, S.; Puzone, M.; Fontana, D. Lithium Iron Phosphate Batteries Recycling: An Assessment of Current Status. Crit. Rev. Environ. Sci. Technol. 2020, 1–28. [Google Scholar] [CrossRef]
  23. Capron, O.; Gopalakrishnan, R.; Jaguemont, J.; Van Den Bossche, P.; Omar, N.; Van Mierlo, J. On the Ageing of High Energy Lithium-Ion Batteries—Comprehensive Electrochemical Diffusivity Studies of Harvested Nickel Manganese Cobalt Electrodes. Materials 2018, 11, 176. [Google Scholar] [CrossRef]
  24. Li, Z.; Chernova, N.A.; Roppolo, M.; Upreti, S.; Petersburg, C.; Alamgir, F.M.; Whittingham, M.S. Comparative Study of the Capacity and Rate Capability of LiNi y Mn y Co1–2y O2 (y = 0.5, 0.45, 0.4, 0.33). J. Electrochem. Soc. 2011, 158, A516. [Google Scholar] [CrossRef]
  25. Yang, H.; Savory, C.N.; Morgan, B.J.; Scanlon, D.O.; Skelton, J.M.; Walsh, A. Chemical Trends in the Lattice Thermal Conductivity of Li(Ni, Mn, Co)O2 (NMC) Battery Cathodes. Chem. Mater. 2020, 32, 7542–7550. [Google Scholar] [CrossRef]
  26. Reddy, M.V.; Mauger, A.; Julien, C.M.; Paolella, A.; Zaghib, K. Brief History of Early Lithium-Battery Development. Materials 2020, 13, 1884. [Google Scholar] [CrossRef] [PubMed] [Green Version]
  27. Li, K.; Zhang, J.; Chen, M.; Yang, Z.; Niu, Q. Advances in Green Energy Systems and Smart Grid; Springer: Singapore, 2018; ISBN 9789811323812. [Google Scholar]
  28. Lee, M.-J.; Lee, S.; Oh, P.; Kim, Y.; Cho, J. High Performance LiMn2O4 Cathode Materials Grown with Epitaxial Layered Nanostructure for Li-Ion Batteries. Nano Lett. 2014, 14, 993–999. [Google Scholar] [CrossRef]
  29. Miao, Y.; Hynan, P.; von Jouanne, A.; Yokochi, A. Current Li-Ion Battery Technologies in Electric Vehicles and Opportunities for Advancements. Energies 2019, 12, 1074. [Google Scholar] [CrossRef] [Green Version]
  30. He, H.; Xiong, R.; Fan, J. Evaluation of Lithium-Ion Battery Equivalent Circuit Models for State of Charge Estimation by an Experimental Approach. Energies 2011, 4, 582–598. [Google Scholar] [CrossRef]
  31. Plett, G.L. Extended Kalman Filtering for Battery Management Systems of LiPB-Based HEV Battery Packs: Part 2. Modeling and Identification. J. Power Sources 2004, 134, 262–276. [Google Scholar] [CrossRef]
  32. Li, D.; Ouyang, J.; Li, H.; Wan, J. State of Charge Estimation for LiMn2O4 Power Battery Based on Strong Tracking Sigma Point Kalman Filter. J. Power Sources 2015, 279, 439–449. [Google Scholar] [CrossRef]
  33. Li, Y.; Wang, C.; Gong, J. A Combination Kalman Filter Approach for State of Charge Estimation of Lithium-Ion Battery Considering Model Uncertainty. Energy 2016, 109, 933–946. [Google Scholar] [CrossRef]
  34. Moskon, J.; Jamnik, J.; Gaberscek, M. In Depth Discussion of Selected Phenomena Associated with Intrinsic Battery Hysteresis: Battery Electrode versus Rubber Balloons. Solid State Ion. 2013, 238, 24–29. [Google Scholar] [CrossRef]
  35. Kalogiannis, T.; Hosen, M.S.; Sokkeh, M.A.; Goutam, S.; Jaguemont, J.; Jin, L.; Qiao, G.; Berecibar, M.; Van Mierlo, J. Comparative Study on Parameter Identification Methods for Dual-Polarization Lithium-Ion Equivalent Circuit Model. Energies 2019, 12, 4031. [Google Scholar] [CrossRef] [Green Version]
  36. Tran, M.-K.; Mevawala, A.; Panchal, S.; Raahemifar, K.; Fowler, M.; Fraser, R. Effect of integrating the hysteresis component to the equivalent circuit model of Lithium-ion battery for dynamic and non-dynamic applications. J. Energy Storage 2020, 32, 101785. [Google Scholar] [CrossRef]
  37. Li, A.; Pelissier, S.; Venet, P.; Gyan, P. Fast Characterization Method for Modeling Battery Relaxation Voltage. Batteries 2016, 2, 7. [Google Scholar] [CrossRef] [Green Version]
  38. Vehicle and Fuel Emissions Testing: Dynamometer Drive Schedules 2020. Available online: https://www.epa.gov/vehicle-and-fuel-emissions-testing/dynamometer-drive-schedules (accessed on 17 February 2021).
Figure 1. Equivalent circuit model diagrams, (a) first-order (1RC), and (b) second-order (2RC).
Batteries 07 00051 g001
Figure 2. Four lithium-ion battery cells with different chemistries tested in the study.
Batteries 07 00051 g002
Figure 3. Experimental setup, including (a) battery tester setup, and (b) schematic of setup.
Batteries 07 00051 g003
Figure 4. HPPC test profile for the NCA cell.
Batteries 07 00051 g004
Figure 5. Validation current profiles for the four batteries, (a) UDDS cycle, and (b) ND cycle.
Batteries 07 00051 g005
Figure 6. SOC–OCV curves for each lithium-ion battery chemistry tested: (a) LFP, (b) NMC, (c) LMO, and (d) NCA.
Batteries 07 00051 g006
Figure 7. Model validation results from the LFP cell using first-order ECM at 0.6 SOC: (a) UDDS cycle, and (b) ND cycle.
Batteries 07 00051 g007
Figure 8. Model validation performance of different equivalent circuit models for various lithium-ion cell chemistries under the UDDS cycles.
Batteries 07 00051 g008
Figure 9. Model validation performance of different equivalent circuit models for various lithium-ion cell chemistries under the ND cycles.
Batteries 07 00051 g009
Table 1. Electrochemical reactions of a lithium iron phosphate (LFP) battery.
ElectrodeElectrochemical Reactions
AnodeLinC6 ⇌ Li0C6 + nLi+ + ne
CathodeLim − nFePO4 + nLi+ + ne ⇌ LimFePO4
OverallLinC6 + Lim − nFePO4 ⇌ Li0C6 + LimFePO4
Table 2. Electrochemical reactions of a lithium nickel manganese cobalt oxide (NMC) battery.
ElectrodeElectrochemical Reactions
AnodeLinC6 ⇌ Li0C6 + nLi+ + ne
CathodeLim − n(NixMnyCoz)O2 + nLi+ + ne ⇌ Lim(NixMnyCoz)O2
OverallLinC6 + Lim − n(NixMnyCoz)O2 ⇌ Li0C6 + Lim(NixMnyCoz)O2
Table 3. Electrochemical reactions of a lithium manganese oxide (LMO) battery.
ElectrodeElectrochemical Reactions
Anode:LinC6 ⇌ nLi+ + ne
Cathode:Lim − nMn2O4 + nLi+ + ne ⇌ LimMn2O4
Overall:LinC6 + Lim − nMn2O4 ⇌ Li0C6 + LimMn2O4
Table 4. Electrochemical reactions of a lithium nickel cobalt aluminum oxide (NCA) battery.
ElectrodeElectrochemical Reactions
AnodeLinC6 ⇌ Li0C6 + nLi+ + ne
CathodeLim − n(NixCoyAlz)O2 + nLi+ + ne ⇌ Lim(NixCoyAlz)O2
OverallLinC6 + Lim − n(NixCoyAlz)O2 ⇌ Li0C6 + Lim(NixCoyAlz)O2
Table 5. Cell specifications for each chemistry.
ChemistryManufacturerCell NameNominal Capacity (mAh)Nominal Voltage (V)Voltage Range (V)
LMOEFESTIMR18650V126003.702.50–4.20
LFPK2 Energy Solutions, Inc.LFP26650P26003.202.00–3.65
NMCSamsung SDIINR18650-20S20003.602.50–4.20
NCAPanasonicNCR18650B32003.602.50–4.20
Table 6. Model parameters obtained from HPPC data fitting in MATLAB for the LFP cell.
SOC1RC2RC1RCwH
R0R1C1R0R1C1R2C2R0R1C1kh
(Ω)(Ω)(F)(Ω)(Ω)(F)(Ω)(F)(Ω)(Ω)(F)/(V)
0.90.02510.0280769.390.02280.02781011.760.0047456.430.02410.0144714.370.06290.0274
0.80.02630.0351747.040.02370.0361967.720.0052420.790.02520.0146700.260.04160.0309
0.70.02710.0287720.090.02420.0284962.900.0055355.450.02590.0148646.300.06730.0319
0.60.02790.0312687.740.02470.0311935.500.0061321.020.02660.0153600.760.05370.0304
0.50.02840.0317649.010.02480.0315887.060.0067271.690.02700.0160558.520.05970.0300
0.40.02960.0367618.500.02530.0373863.250.0078238.120.02810.0166505.920.03530.0349
0.30.03060.0392567.060.02570.0402836.130.0094210.550.02880.0177433.250.02990.0383
0.20.03240.0487520.730.02680.0539834.830.0118202.020.03000.0193353.490.00870.0341
0.10.03440.0750427.090.02870.1047754.390.0164214.490.03100.0234277.310.00030.0338
Table 7. Model parameters obtained from HPPC data fitting in MATLAB for the NMC cell.
1RC2RC1RCwH
SOCR0R1C1R0R1C1R2C2R0R1C1kh
(Ω)(Ω)(F)(Ω)(Ω)(F)(Ω)(F)(Ω)(Ω)(F)/(V)
0.90.06020.01981112.360.05860.02202254.180.0058671.310.05940.0094903.890.00480.0107
0.80.06120.0354921.690.06010.09422310.050.0099758.970.06030.0116754.160.00410.0132
0.70.06100.0436880.620.05980.10171852.540.0094794.670.06010.0119781.740.00410.0127
0.60.06150.0596905.440.06000.11391395.740.0067855.040.06040.0101886.730.00490.0169
0.50.06130.03001249.340.05990.03891902.480.0045884.100.06050.00791058.580.00570.0170
0.40.06300.03121268.090.06190.04602098.650.00491102.260.06230.00811136.450.00480.0157
0.30.06410.03301290.360.06300.05112076.670.00481098.680.06330.00771159.120.00450.0167
0.20.06140.03771287.610.06050.08542237.540.00561224.730.06070.00741216.080.00430.0179
0.10.06290.03921075.170.06190.11502206.020.0078965.100.06210.0094954.070.00390.0170
Table 8. Model parameters obtained from HPPC data fitting in MATLAB for the LMO cell.
1RC2RC1RCwH
SOCR0R1C1R0R1C1R2C2R0R1C1kh
(Ω)(Ω)(F)(Ω)(Ω)(F)(Ω)(F)(Ω)(Ω)(F)/(V)
0.90.04280.03231041.590.04170.10611251.120.0078846.010.04190.0101851.060.00770.0136
0.80.04250.0404888.840.04100.09191384.180.0062776.830.04170.0124816.910.00700.0139
0.70.04280.0515862.270.04170.09121488.500.0079911.130.04200.0123867.860.00980.0138
0.60.04310.0661838.530.04110.08081017.970.0044668.990.04230.0114975.990.01040.0178
0.50.04150.03071318.820.04020.03621744.500.0033981.400.04090.00771301.650.01050.0177
0.40.04170.02871369.560.04050.03321805.970.00311074.470.04110.00761370.470.01080.0164
0.30.04240.03531329.230.04130.04721848.580.00361258.780.04180.00761366.150.00860.0173
0.20.04390.03751212.600.04260.04941690.600.00401036.820.04320.00821195.190.00570.0190
0.10.05530.0574743.890.05100.08841144.140.0136315.480.05100.0136615.530.00390.0218
Table 9. Model parameters obtained from HPPC data fitting in MATLAB for the NCA cell.
1RC2RC1RCwH
SOCR0R1C1R0R1C1R2C2R0R1C1kh
(Ω)(Ω)(F)(Ω)(Ω)(F)(Ω)(F)(Ω)(Ω)(F)/(V)
0.90.10860.0372994.960.10630.0303726.320.0099636.780.10240.0338905.420.00190.0266
0.80.10300.0492928.760.10160.0302734.100.0102594.410.10160.0448845.170.00170.0273
0.70.10330.0534899.130.10200.0315766.530.0105575.440.10200.0486818.200.00160.0272
0.60.10340.0527958.570.10230.0390929.760.0078613.480.10250.0480872.300.00270.0345
0.50.10320.03881233.950.10240.02711131.400.0078789.730.10240.03531122.900.00120.0330
0.40.10480.04031237.150.10400.02751161.670.0077791.770.10400.03671125.800.00110.0306
0.30.10500.04061231.860.10420.02721128.740.0077788.390.10420.03691120.990.00110.0316
0.20.10810.04761166.000.10700.0272982.500.0076746.240.10700.04331061.060.00140.0373
0.10.13440.0619999.380.13250.0498747.540.0096639.610.12410.0588909.440.00160.0389
Publisher’s Note: MDPI stays neutral with regard to jurisdictional claims in published maps and institutional affiliations.

