
Influence of Temperature and Electrolyte Composition on the Performance of Lithium Metal Anodes


Institute of Photovoltaics, Electrical Energy Storage Systems, University of Stuttgart, 70569 Stuttgart, Germany
*
Author to whom correspondence should be addressed.
Batteries 2021, 7(4), 67; https://0-doi-org.brum.beds.ac.uk/10.3390/batteries7040067
Submission received: 30 July 2021
/
Revised: 24 September 2021
/
Accepted: 29 September 2021
/
Published: 14 October 2021
(This article belongs to the Special Issue Battery Systems and Energy Storage beyond 2020)
Abstract
:Lithium metal anodes have again attracted widespread attention due to the continuously growing demand of cells with higher energy density. However, the lithium deposition mechanism and the affecting process of influencing factors, such as temperature, cycling current density, and electrolyte composition are not fully understood and require further investigation. In this article, the behavior of lithium metal anode at different temperatures (25, 40, and 60 C), lithium salts, electrolyte concentrations (1 and 2 M), and the applied cell current (equivalent to 0.5 C, 1 C, and 2 C). is investigated. Two different salts were evaluated: lithium bis(fluorosulfonyl)imide (LiFSI) and lithium bis(trifluoromethanesul-fonyl)imide (LiTFSI). The cells at a medium temperature (40 C) show the highest Coulombic efficiency (CE). However, shorter cycle life is observed compared to the experiments at room temperature (25 C). Regardless of electrolyte type and C-rate, the higher temperature of 60 C provides the worst Coulombic efficiency and cycle life among those at the examined temperatures. A higher C-rate has a positive effect on the stability over the cycle life of the lithium cells. The best performance in terms of long cycle life and relatively good Coulombic efficiency is achieved by fast charging the cell with high concentration LiFSI in 1,2-dimethoxyethane (DME) electrolyte at a temperature of 25 C. The cell has an average Coulombic efficiency of 0.987 over 223 cycles. In addition to galvanostatic experiments, Electrochemical Impedance Spectroscopy (EIS) measurements were performed to study the evolution of the interface under different conditions during cycling.
1. Introduction
1.1. Motivation
Lithium metal has always been one of the most attractive candidates for anode materials in lithium batteries. This is due to its potential to extend the energy density of conventional lithiumion batteries. State-of-the-art Li-ion cells, depending on the cell chemistry, can deliver a specific energy density of 130 Wh·kg to 250 Wh·kg [1]. This is already behind the U.S. Department of Energy’s (DOE) target for advanced batteries for electric vehicles [2]. Lithium has a theoretical specific capacity of 3860 mAh·g and a higher redox potential of V versus standard hydrogen electrodes in comparison to electrodes based on graphite. This means using lithium (Li) instead of conventional intercalating anode materials like graphite (LiC), which has a theoretical specific capacity of 372 mAh·g that can increase the specific energy and volumetric energy density of cells significantly. In one study, researchers reported a 35% increase in specific energy and 50% increase in volumetric energy density when the graphite electrode is replaced with a Li metal electrode [3]. In addition to the aforementioned change in electrode material, they considered a solid electrolyte for the Li-metal cell and a liquid electrolyte for the conventional Li-ion cell in their estimates [3]. However, commercializing Li-metal batteries has been paused due to various challenges in both production and performance of lithium cells [4]. The issues with the production are that the Li surface is highly reactive and sensitive to humidity, oxygen and nitrogen, which are all present in the air atmosphere [5,6]. The challenges of the performance are given by the unstable and different Li growth morphology, low Coulombic efficiency, and considerable volume change during cycling [1]. Lithium metal cannot be utilized with known carbonate electrolytes because its electrochemical potential causes the electrolyte to continuously decompose until a passivating solid electrolyte interface (SEI) is built up [7]. One approach to utilizing the Li-metal is creating a stable and uniform SEI layer on the lithium surface that can withstand significant volumetric changes of Li during cycling. This is of critical concern to ensure safe and efficient lithium metal cells. Local variations in the SEI layer’s composition might cause uneven Li deposition, resulting in changes in Li-ion conductivity across the electrode or SEI rupture, which can facilitate the creation of Li dendrites. Another approach is to use solid membranes, such as solid polymer electrolytes (SPE), which are less reactive to the Li [8] and their soft nature could withstand the extensive volume change of the Li anode [9]. In this study we focus on compatible liquid electrolytes in lithium cells. More experiments investigating the influence of different electrolyte compositions and the cycling conditions on effective SEI layer formation are much needed.
1.2. Relevant Literature
The high reactivity of metallic Li, which causes difficulty during the production process, can also be a source of performance challenges. Potential corrosive reactions at the surface of Li metal often lead to an increase in interfacial resistance, a reduction in Coulombic efficiency (CE) and a poor lifetime. Additionally, the large volume expansion of the electrode during repeated Li deposition/dissolution will seriously deteriorate the interfacial stability and in general increase the gap between theoretical and practical energy density of the Li cells. Continuous interface reactions, together with the surface enlargement due to new depositions, consume the fresh Li more and more during the cycle life of an Li metal anode. This means that an excess of lithium and electrolytes are strongly needed to increase the cycle life and improve the stability of Li metal cells [10]. There are studies implying that 20% is the optimum excess of lithium; a greater excess of lithium will increase the possibility of side reactions and consequently shorten the cycle life of the cells [11]. This required excess of Li and electrolytes is another limitation to increasing practical energy density in Li-metal cells.
The function and properties of Li cells are strongly dependent on the growth morphologies. However, predicting the kinetic structures is difficult as they are influenced by different parameters. There are studies [12,13,14,15] investigating the parameters that have an influence on the shape, morphology and growth of metal particles. Tao Yang et al. [12] proposed three different growth modes: reaction limited, diffusion limited and the so-called reaction–diffusion balance mode. The reaction limited mode is dominated by a slow reaction rate. The reaction in the case of Li cells, which is the focus of this paper, is the nucleation and transformation of an Li ion to deposited Li metal:
The slow reaction rate combined with a sufficient mass transport diffusion in the electrolyte from the cathode to the Li metal anode leads to a rich concentration of reactants (Li ions) around the nucleus which further leads to a classic crystallization process. The diffusion limited mode is dominant if the reaction rate is much faster compared to the mass transport diffusion, which causes a lack of reactants around the nucleus. In both mentioned conditions—reaction limited and diffusion limited—the particles’ growth is slow. However, in the reaction–diffusion balance mode, the morphology is dendritic and the growth speed is fast. In this region, there is a concentration gradient around the nucleus. Yang and his group [12] examined the morphology evolution on silver, gold and copper, coming to the same conclusion that the relation between diffusion and reaction rate is the key factor in predicting the shape of particle growth. With this as the background, the importance of operation temperature and applied current, as the key kinetics definers for the performance of lithium metal anodes, should be emphasized.
There are studies showing that a local temperature rise can have healing effects on Li dendrites at different current densities [13,14]. By increasing the temperature, the diffusion of Li ions in the bulk of the electrolyte will be faster [15]; therefore, based on Tao Yang’s model, in comparison to the cell performed at C, elevated temperature should move the cells either in the direction of reaction limited or to a balanced region. Yehu et al. [13] investigated the temperature influence on the stability and efficiency of the Li metal anode. They found out that in their studied system, temperature rise has a positive influence on the efficiency and life time of the cells. They also studied the impact of different temperatures and electrolyte compositions on the morphology of Li depositions. They found out that bigger Li spheres form at the initial stage of deposition at elevated temperatures, leading to a lower specific area of plated Li and consequently to reducing the probability of dendritic formation [13].
At the same time, there are studies showing that the temperature rise leads to more unstable lithium deposition [16,17,18]. The structural uniformity and mechanical strength of the Solid Electrolyte Interface (SEI) play important roles in defining the type of deposition as they directly influence the dynamic of Li plating and stripping [19]. As the SEI layer consists of reduced and decomposed electrolyte components, different electrolytes induce totally different SEI layers. One influencing component in the electrolyte is the used Li salt. The salt lithium hexafluorophosphate LiPF exhibits poor thermostability [20]; Lithium perchlorate LiClO can strongly oxidize the Li metal [21] and causes low safety. An alternative salt given by lithium bis(fluorosulfonyl)imide (LiFSI) is reported to form a robust SEI protecting layer [22]. In this work, the influence of LiFSI and lithium bis(trifluoromethanesul-fonyl)imide (LiTFSI) and their concentrations in electrolytes on the cycle life of Li metal cells is studied.
1.3. Structure and Technical Contribution
In this article, the influences of temperature, C-rate, type, and concentration of Li salt in the electrolyte on the lithium deposition were studied. A variety of electrolytes including LiFSI in 1,2-dimethoxyethane (DME) with a molar concentration of M, LiFSI in DME with M and lithium LiTFSI in DME, also with a concentration of M, were investigated. In addition to the Coulombic efficiency, EIS measurements were carried out to evaluate the stability and aging behavior. The best performance is achieved by a high concentration of LiFSI-DME electrolyte at 25 C. The remainder of this article is structured as follows. Section 2, presents the materials and methods for evaluating the degradation of the cells. The cell preparation, the measurement procedure and matrix are discussed in detail. The results of the conducted experiments, including the data on the Coulombic efficiency and the Electrochemical Impedance Spectroscopy (EIS) measurements, are shown and discussed in Section 3 and Section 4. Finally, an outlook of the future work and a conclusion are given.
2. Materials and Methods
In this section, the preparation of the cell structure consisting of the electrolyte and the electrodes will be discussed first. Thereafter, the measurement procedure of the cycling tests and the boundary conditions of the conducted experiments will be presented.
2.1. Material and Cell Preparation
Electrolytes preparation: LiTFSI and LiFSI (with a chemical purity of 99%, manufactured by Ionic Liquid Technologies GmbH (Heilbronn, Germany), were purchased and used as received. The electrolyte DME with a chemical purity of 99% manufactured by Thermo Fisher GmbH (Kandel, Germany) was used as the solvent. Three different ether-based electrolytes were prepared as follows: (1) LiTFSI 2M in DME, (2) LiFSI 2M in DME and (3) LiFSI 1M in DME.
Electrode preparation: An oxygen-free copper (Cu) foil from SCHLENK Metal Foils GmbH & Co. KG. (Roth, Germany) with a thickness of µm was purchased and used as received. Current collector (CC) disks with a diameter of mm were punched out of the foil to be used as working electrodes. Lithium metal foil manufactured by Sigma Aldrich (St. Louis, MO, USA) with a thickness of µm was used as the counter electrode. The lithium surface was cleaned of an oxide layer before punching. Disks with a diameter of mm were made. All handling was performed inside an argon-filled glove box from M. Braun Inertgas-Systeme GmbH (Garching, Germany) with an oxygen () and water () concentration ppm. Both counter and working electrodes had an effective surface area of cm.
2.2. Cell Degradation Experiments
Cell degradation experiments were conducted using EL-CELL PAT-Cell cases manufactured by EL-Cell GmbH (Hamburg, Germany). Before cell assembly, Cu current collectors were dried under vacuum for h at C and were transferred into the glove box. Celgard 2500 from Celgard (North Carolina, USA) was used as a separator and was also dried under vacuum for h at C prior to use. Prepared electrolytes were poured on both sides of the separator and the amount was determined depending on the measurement temperature and applied current density. For the measurements performed at C, an electrolyte amount of µL was used for the current densities of mAh · cm and mAh·cm. The amount of electrolyte was increased to µL for the experiments with an applied current density of mAh·cm. Regardless of current density, µL was used for the measurements at C and C.
In order to evaluate the degradation behavior, cycling tests were conducted. A segment of the measurement procedure is visualized in Figure 1 with a C-rate of C. The current is presented in Figure 1a and the corresponding voltage in Figure 1b.
The tests were conducted using a battery cell tester from Basytec GmbH (Asselfingen, Germany) in combination with a Reference 3000 from Gamry Instruments (Warminster, PA, USA) in a climate chamber manufactured by Memmert GmbH (Schwabach, Germany). Prior to cycling, cells were relaxed at the considered measurement temperature for h to achieve a homogeneous electrolyte distribution and a steady state temperature. The Cu/Li cells showed an open circuit potential (OCP) of V which is observable during the relaxation period in the first 4 h of the procedure.
The cells were continuously charged and discharged at the considered C-rate with the maximum voltage limit of V. In this set of experiments, no minimum voltage limit () was defined and instead the specified time period based on the applied current density limited the discharge process. The cells were not relaxed between the charge and discharge cycles. After each 20th full charge/discharge cycle the impedance of the cells was evaluated via EIS measurements. To consider the initial impedance behavior of the cells, an EIS was also conducted after the first deposition period (discharge process) prior to 20 full cycles repetition. The segment including the 20 full cycles and the EIS was repeated up to 20 times depending on the degradation level of the cells.
The cell current and the cell voltage were controlled and captured by the mentioned battery tester. The EIS measurements were conducted using the Reference 3000 from Gamry. The frequency of the EIS was varied between Hz and kHz.
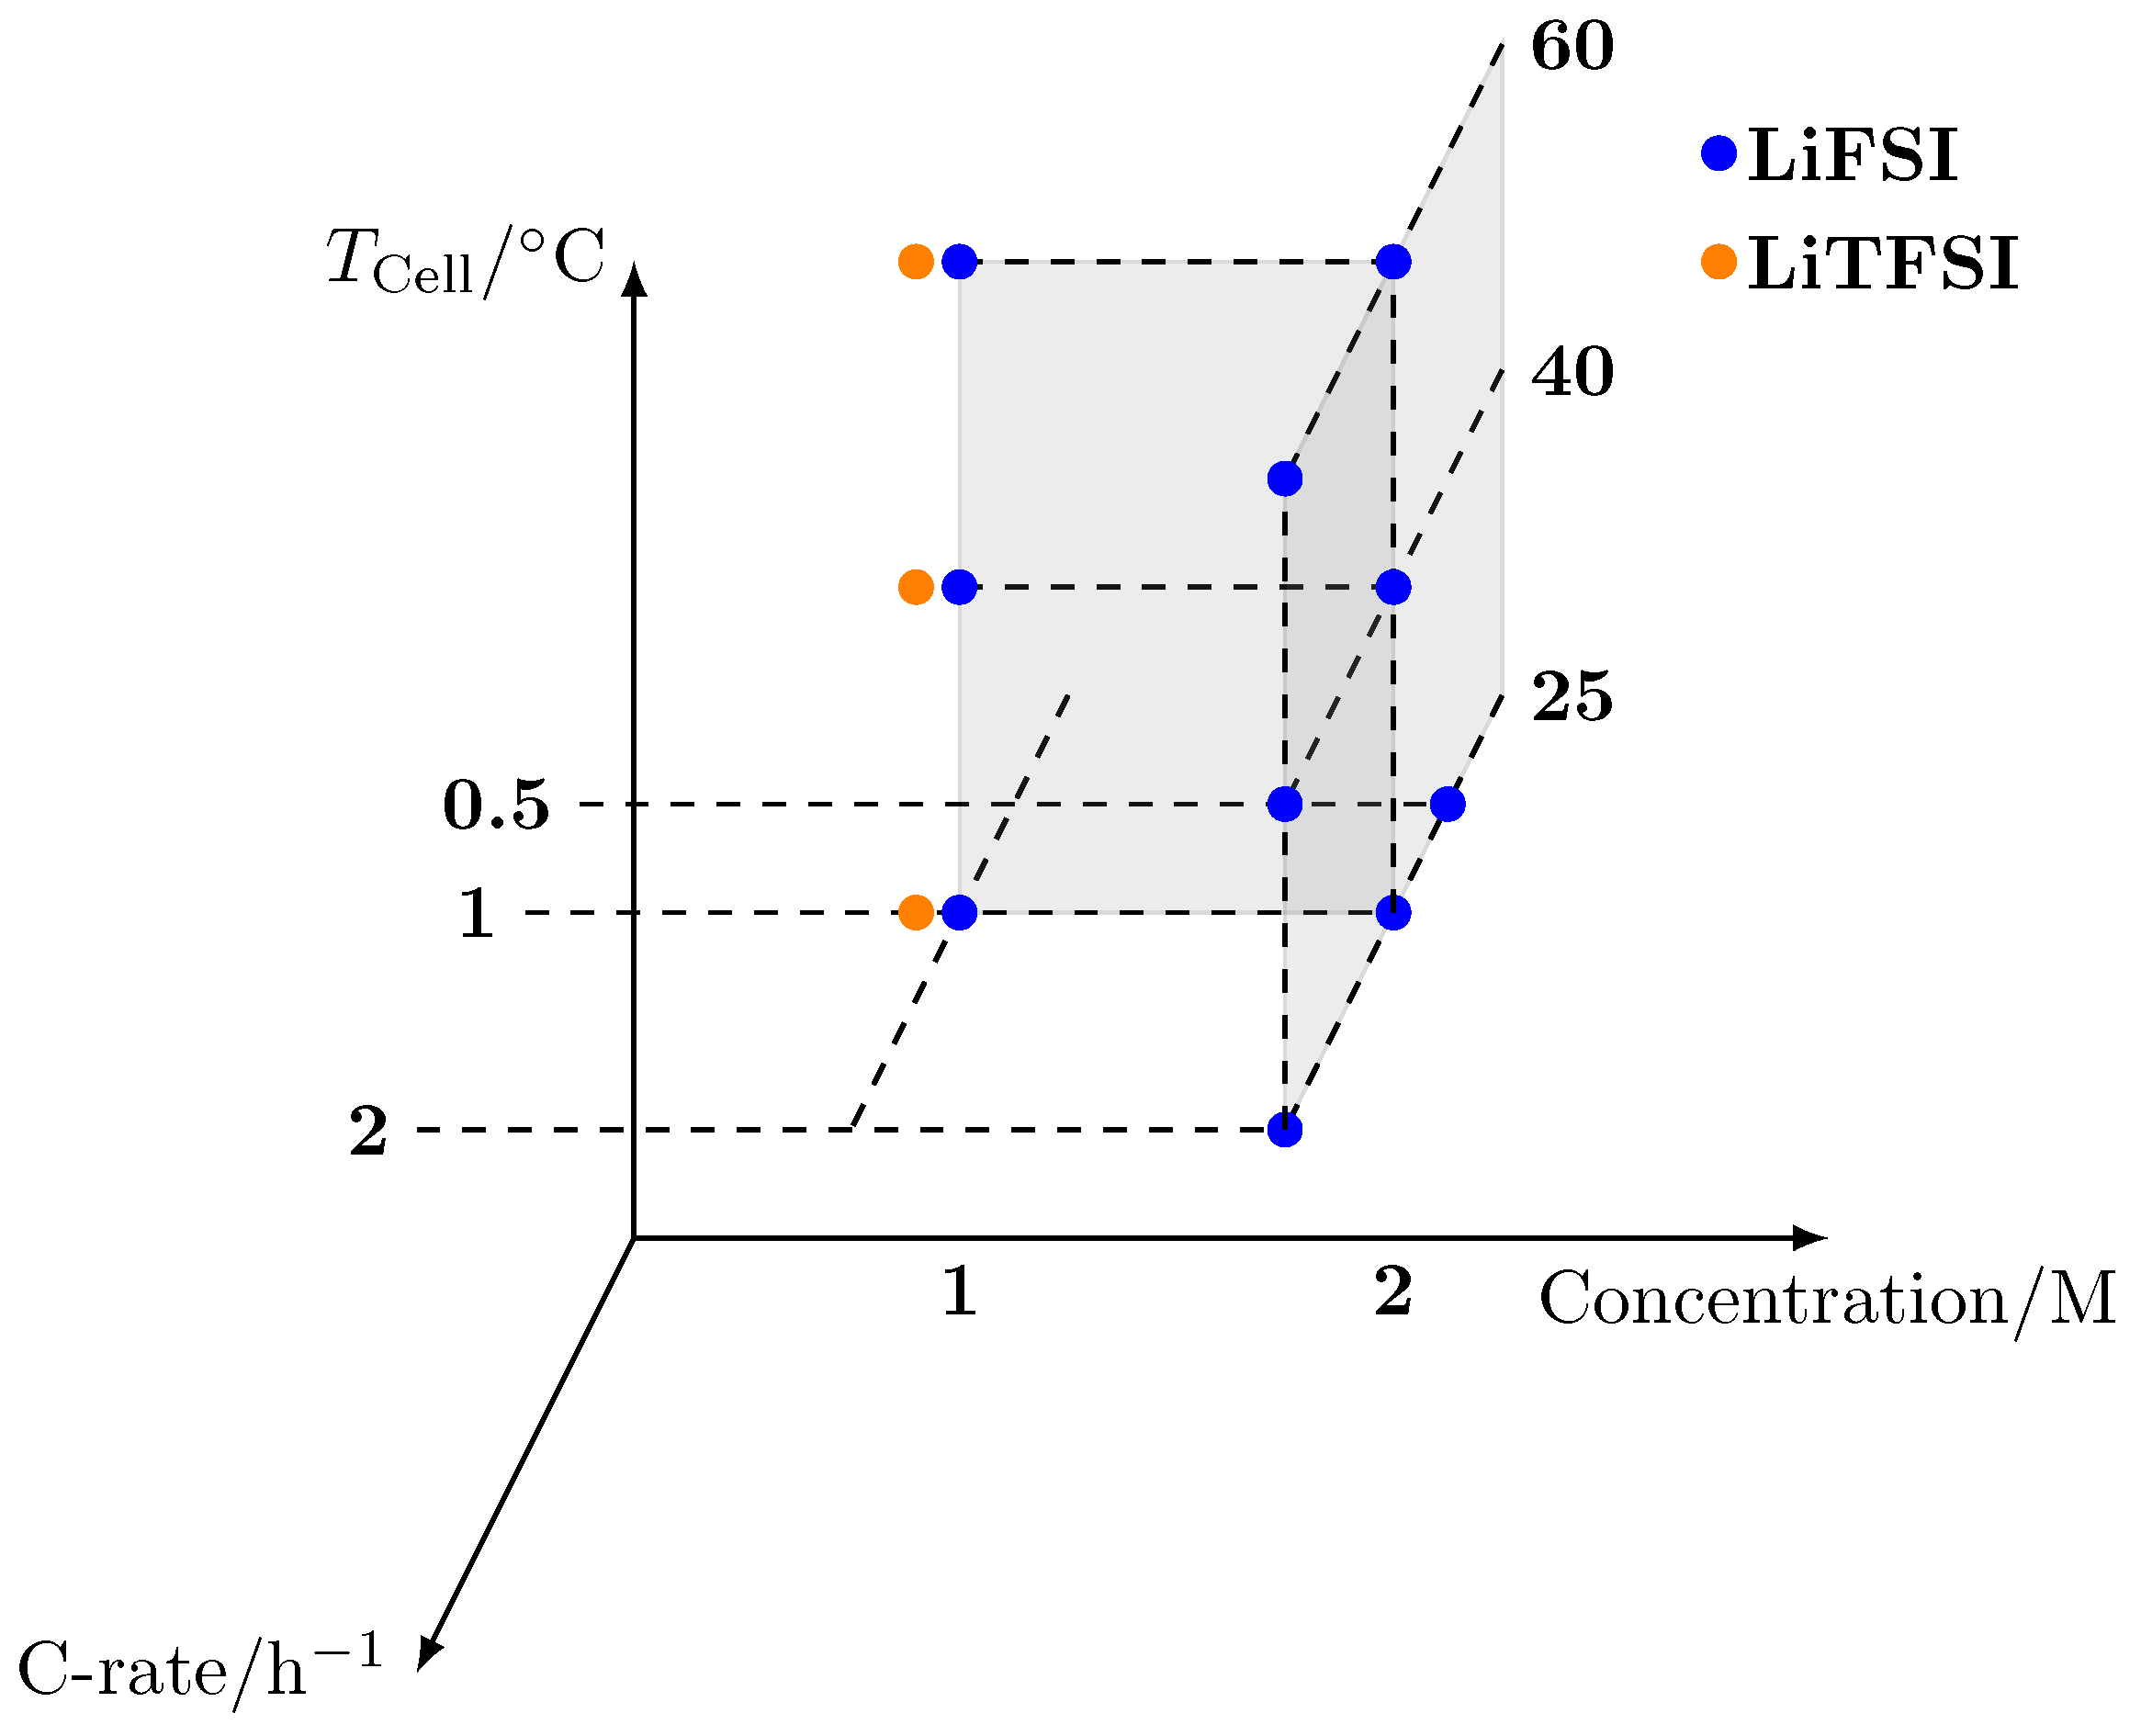
The purpose of this article is to investigate the influence of the C-rate, cell temperature, used salt and salt concentration on the aging behavior of the cells. The set boundary conditions of the conducted experiments are given by the measurement matrix in Figure 2. The different salts used are separated by color; orange measurement points correspond to experiments with LiTFSI and for the measurement points colored blue, LiFSI was used as the salt.
As presented in the measurement matrix, the C-rate was varied with C in order to evaluate the influence of the C-rate. For the current stress of C the cell temperature was varied with C. All mentioned measurements were conducted with LiFSI and a salt concentration of M. To evaluate the impact of the salt and salt concentration experiments at a molar concentration of M and two different salts—LiFSI (blue) and LiTFSI (orange)—were performed. Some measurement points were repeated in order to check the reproducibility and to determine the standard deviation of the experimental data due to the measurement setup, procedure and cell production. The number of measurements for each measurement point is listed in Table 1.
3. Results
In this section, the results of the experimental data will be presented. First, the reproducibility will be analyzed. Thereafter, the influence of the C-rate, temperature and electrolyte composition will be shown.
3.1. Reproducibility of Measurements
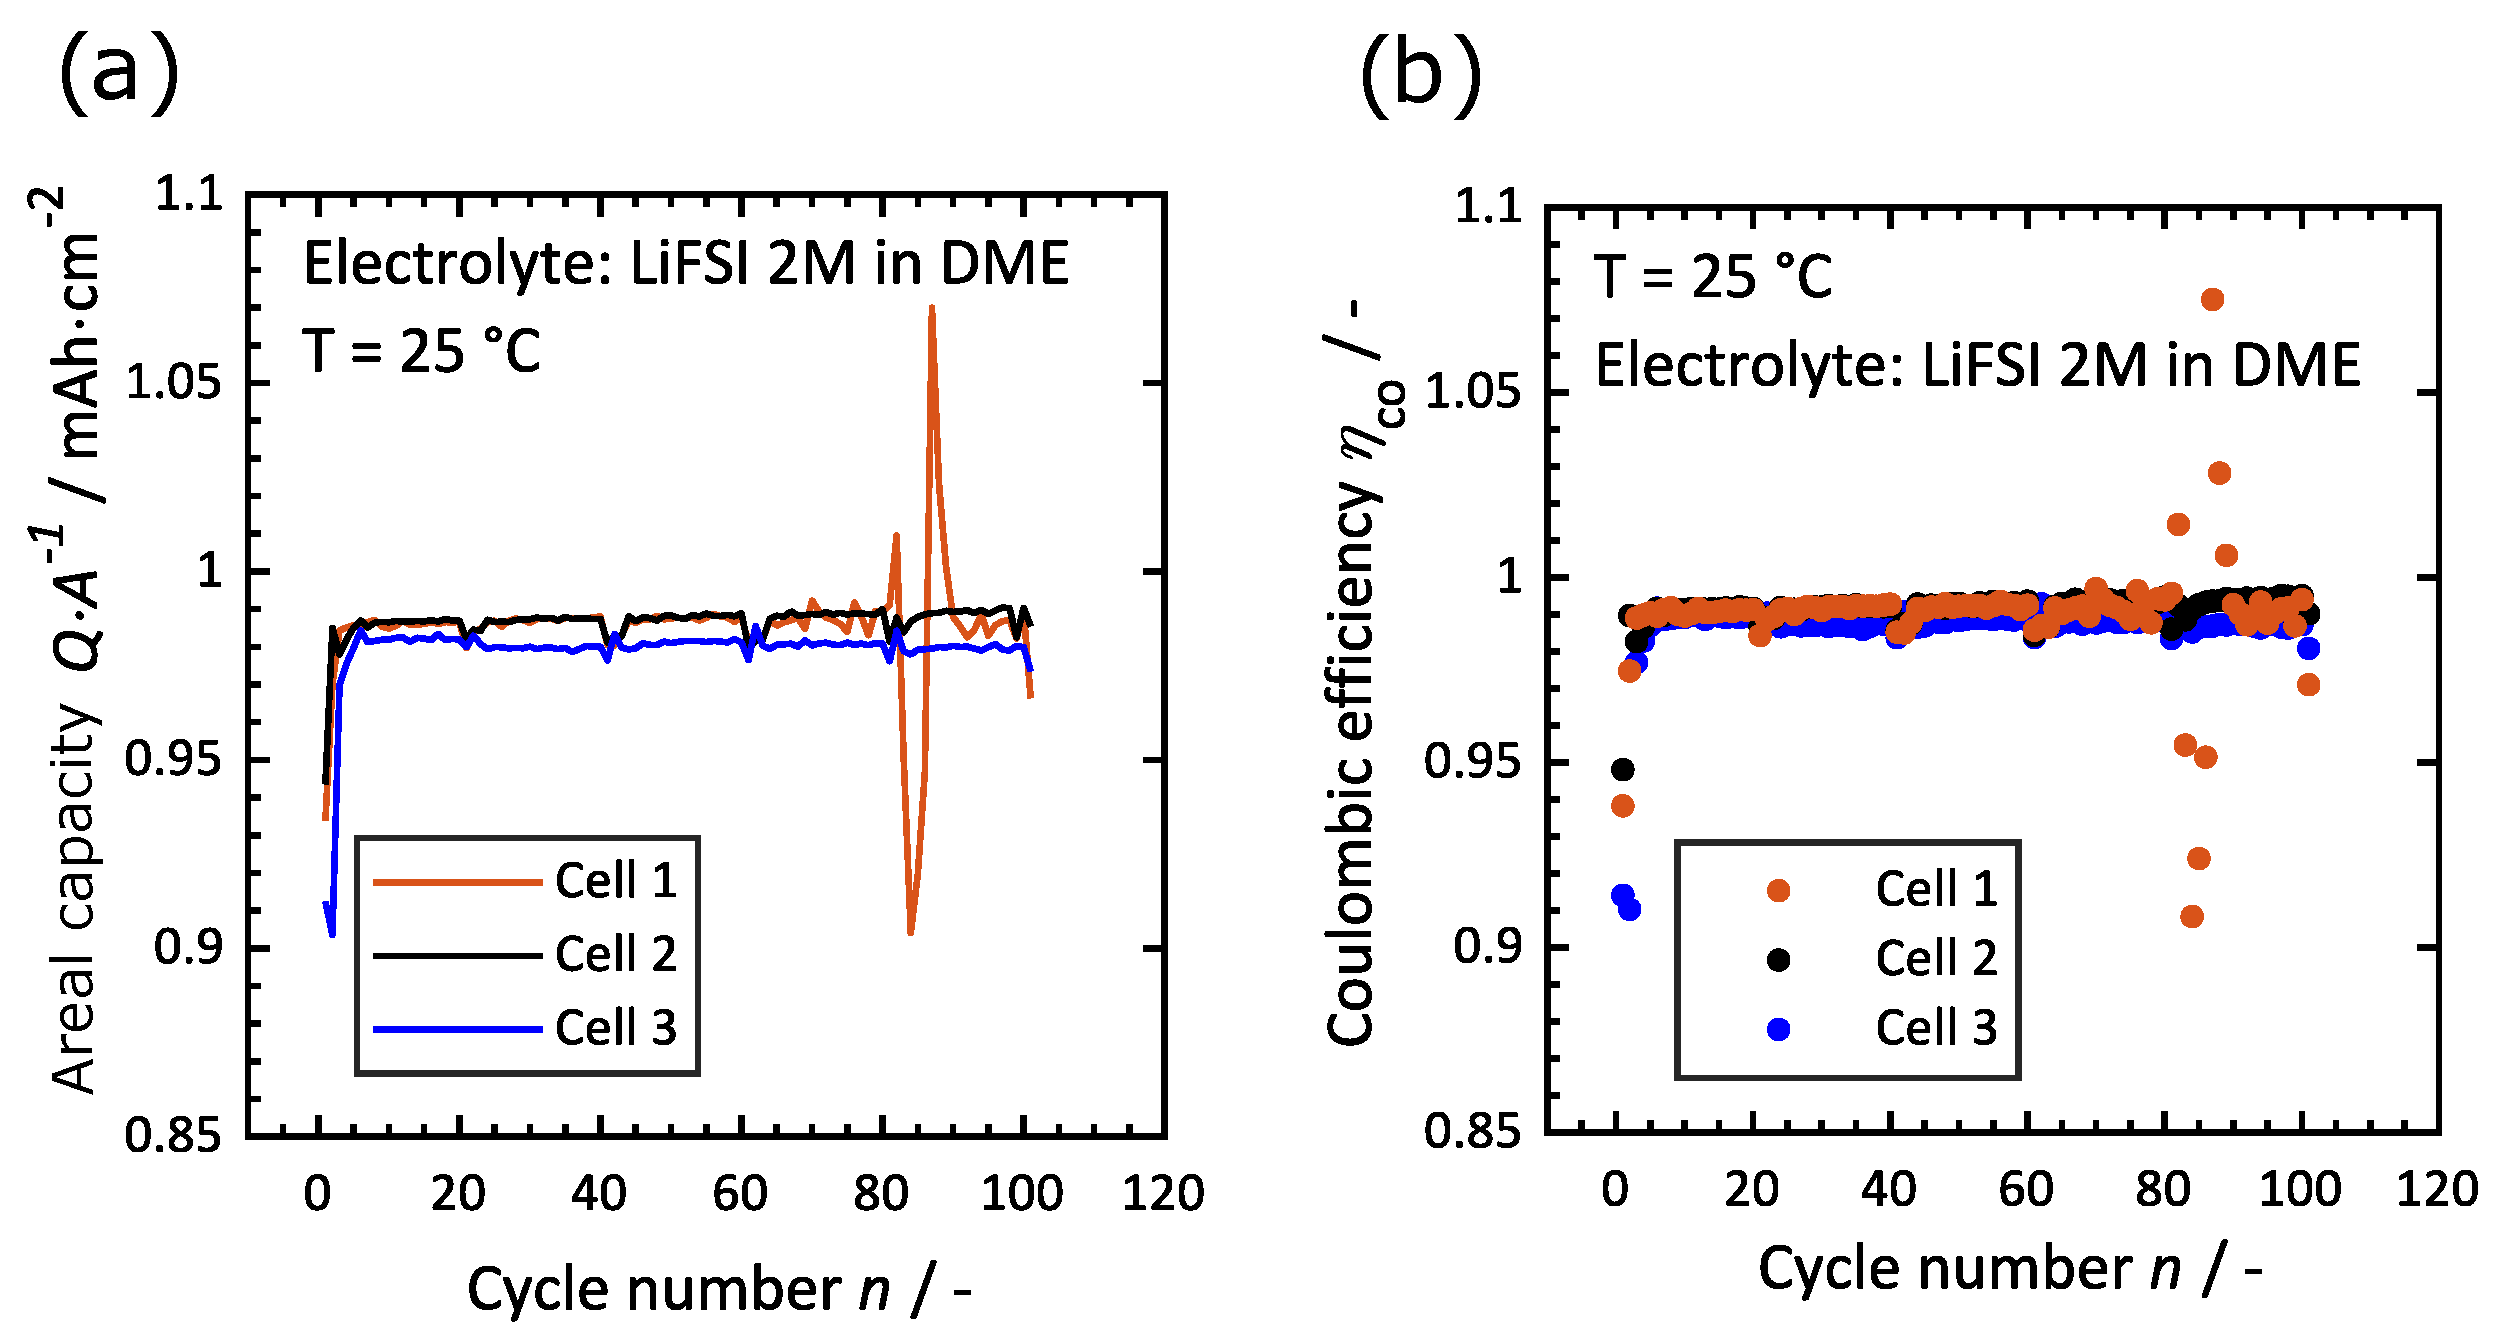
To validate the reproducibility of the galvanostatic cycling measurements on Cu/Li cells for selected points in the measurement matrix, up to three different EL-CELLs with exactly the same cell chemistry were assembled and the cycling results of the conducted measurements were compared (see Table 1). As an example, the cycling results of three cells at one specific measurement point are illustrated in Figure 3, with the areal capacity in Figure 3a and the Coulombic efficiency in Figure 3b. The cells contained LiFSI based electrolyte with a concentration of M in DME and the measurements were performed at a current density of mAh·cm and a temperature of C.
Both the areal capacity (Figure 3a) and the Coulombic efficiency (Figure 3b) of all three cells show a high comparability at the first 100 cycles. This is indicated by the calculated standard deviation of for the Coulombic efficiency and the corresponding value of for the areal capacity. Only cell 1 shows an instability from cycle number 80 onward, which is not the case for cell 2 and cell 3. The ideal discharge capacity that the cells could reach is 1 mAh·cm. The average Coulombic efficiency of indicates the average areal capacity with a value of 0.99 mAh·cm as well. For cell 1 there were four cycles which had a areal capacity and Coulombic efficiency above the theoretical maximum: . It has been reported that micro shorts can happen during the Li deposition period using Li metal electrodes, which could be seen as tiny fluctuations in the voltage behavior of the cell [23]. The micro shorts happen when local dendrites can penetrate through the separator and contact the other electrode. In these cases, the cell locally experiences the occurrence of charge and discharge processes simultaneously. Due to this effect, the cell could show a longer deposition period, as under normal conditions, causing values above the theoretical maximum. In the following, only the Coulombic efficiency is presented and discussed as the areal capacity and the Coulombic efficiency correlate to each other.
3.2. Influence of C-Rate
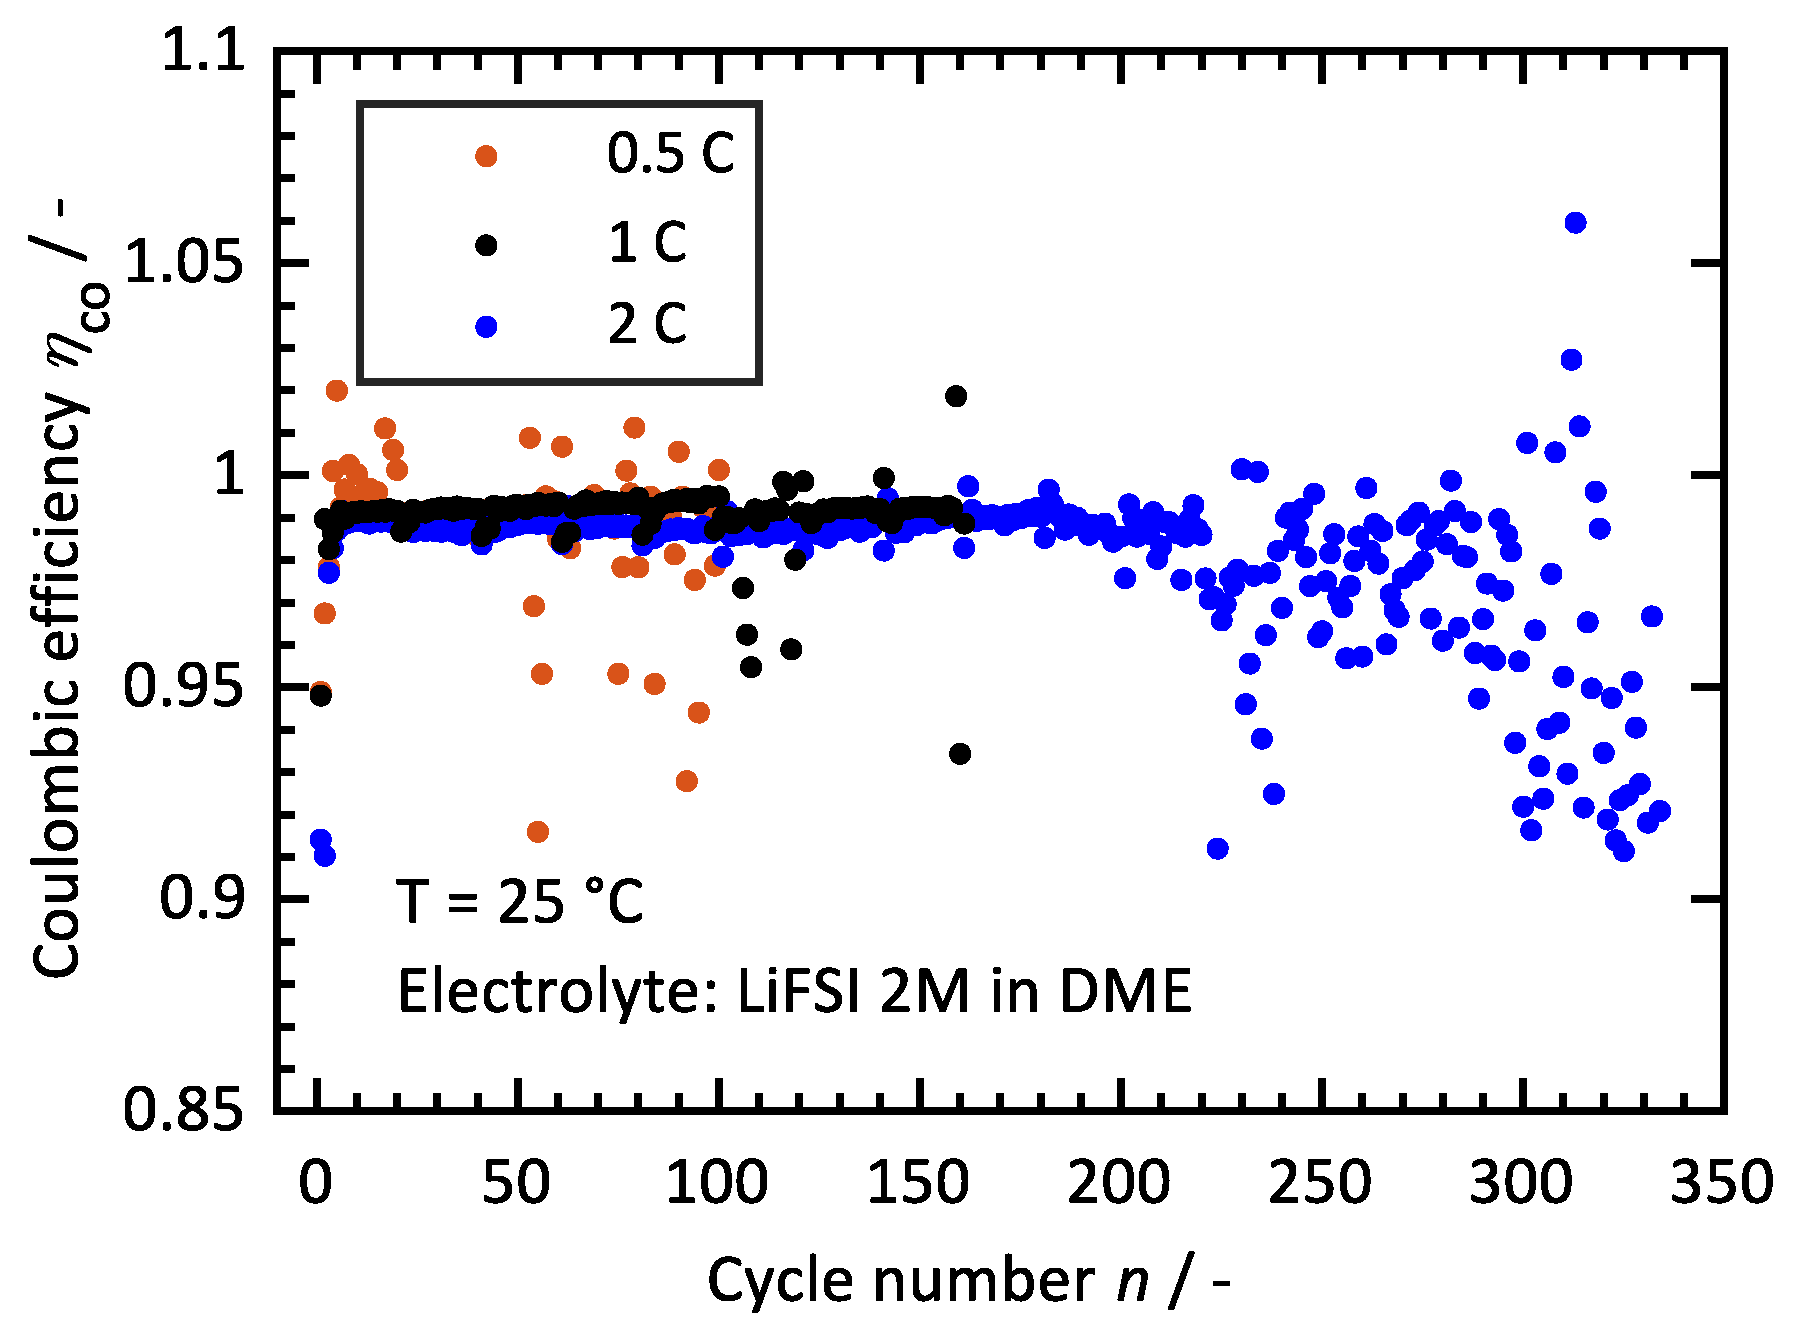
In Figure 4, the influence of the C-rate on the Coulombic efficiency is presented for the measurements using LiFSI with a concentration of M and varying C-rates of C at C.
Interestingly, the cycling results presented in Figure 4 show that increasing the current density of charging and discharging positively influence the cyclability of insitu deposited lithium electrodes. All three cells during the initial cycles have a relatively low Coulombic efficiency which increases gradually with increasing cycle number for all three cells until a Coulombic efficiency of is reached. This could be caused by a rapid SEI formation during the initial cycles. Interface reactions consume electrolytes and a part of the cyclable Li, which negatively influences the Coulombic efficiency during the formation cycles, as can be seen in Figure 4. The cell with the lowest C-rate ( C), which is highlighted with the orange color, illustrates an instability at the early cycles (). Further, a fast drop of the Coulombic efficiency was found and already after 50 cycles the cell reached an efficiency below the set threshold value of . Due to this reason, the cycling of the cell was stopped after 100 cycles. The cell with the medium C-rate ( C) presented in the black color is more stable at the first cycles and the Coulombic efficiency of the cell is very high with for the first 160 cycles. This leads to an increase of the maximum number of cycles by a factor of 3.2 compared to the cell cycled at C. Finally, the cell with the highest C-rate ( C, blue) shows the most stable behavior. This is visible in the Coulombic efficiency, which drops below the set reference value of not until the 220th cycle.
3.3. Influence of Temperature
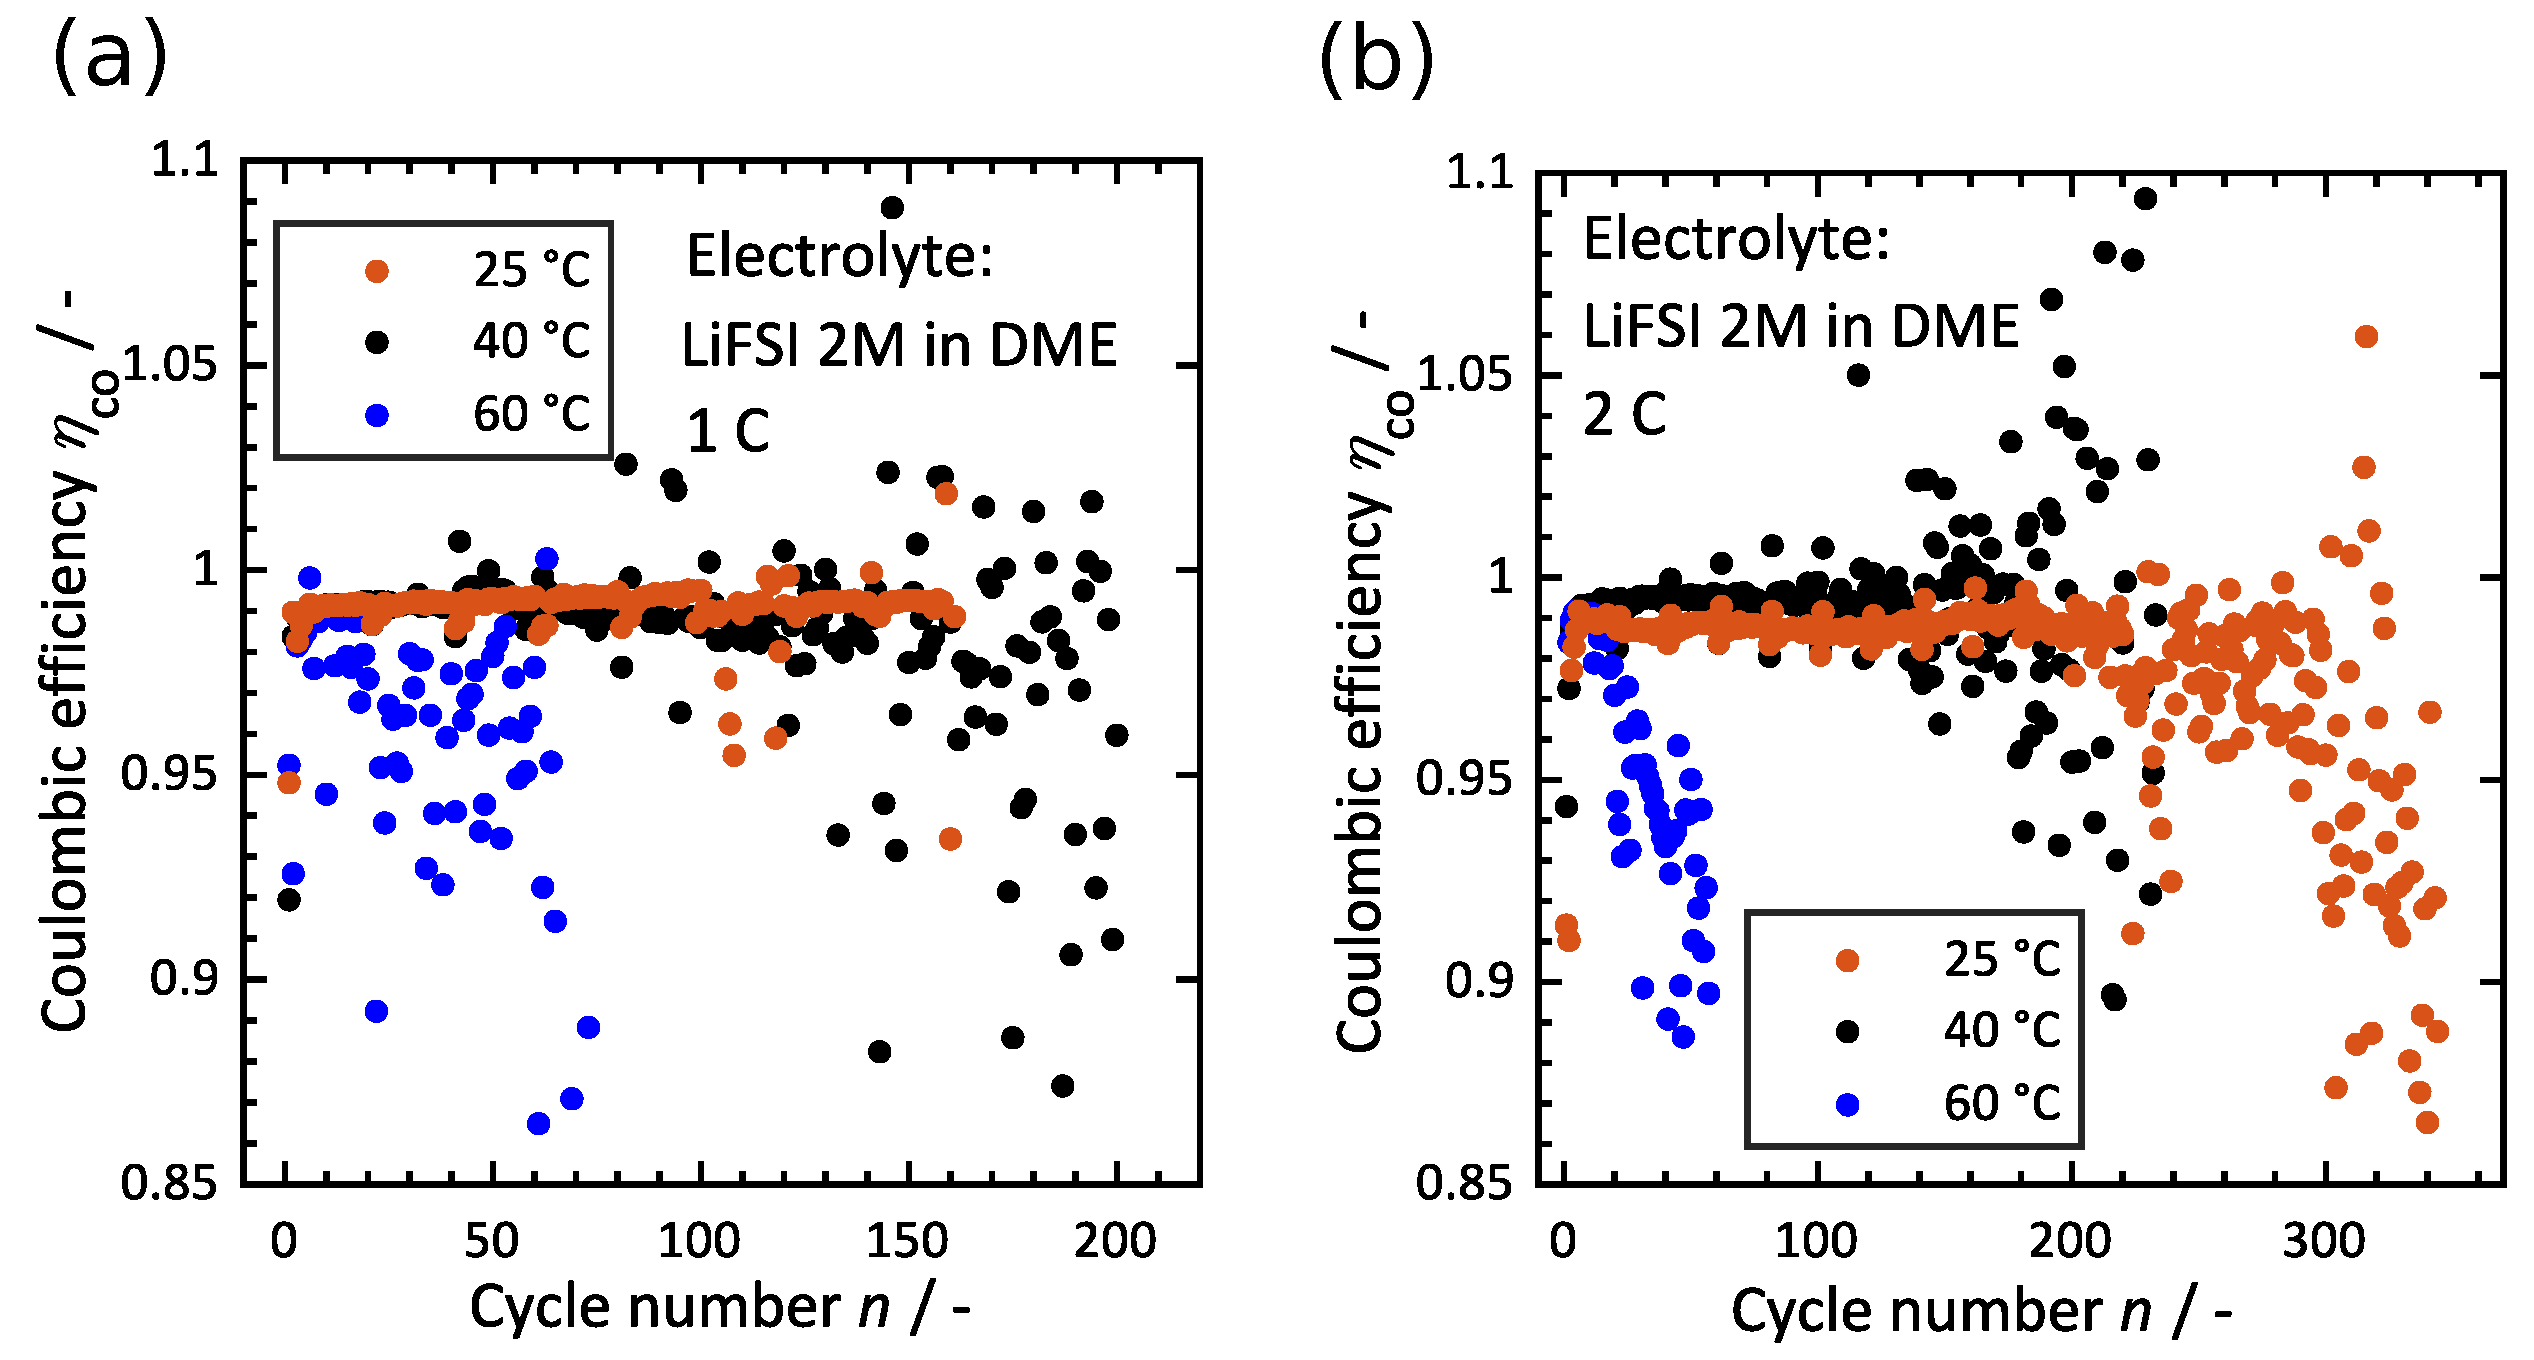
In order to investigate the effect of temperature on the kinetics of Li deposition and consequently the stability and cyclability of insitu deposited lithium electrodes, experiments were performed at three different temperatures with C on the Cu/Li cells using LiFSI with a concentration of M in DME as the electrolyte. The Coulombic efficiency results obtained from cycling tests are shown in Figure 5. Two different C- rates of C were investigated, and the corresponding results are displayed in Figure 5a,b, respectively. The cells cycled at a temperature of C are presented in the orange color, the results at C and C are visualized in black and blue colors, respectively.
In both investigated C-rates, the most stable cycling results were reached at a temperature of C. At this temperature, the cell cycled with C shows 160 smooth cycles with a high average Coulombic efficiency of . After 160 cycles the Coulombic efficiency drops below the threshold value of . The cell cycled at C shows an instability at earlier cycles and reached a Coulombic efficiency of already after 130 cycles. The worst cycling performance was obtained at a temperature of C. The instability starts at the initial cycles and no smoothing behavior, as was found at C, could be achieved during the 70 cycles for which the cell was running. The same trend is observable for the cells running with a C-rate of C. The positive influence of higher C-rates is reflected in an increase of the number of cycles reached for all three cells at the considered temperatures.
3.4. Influence of Salt, Concentration and Temperature
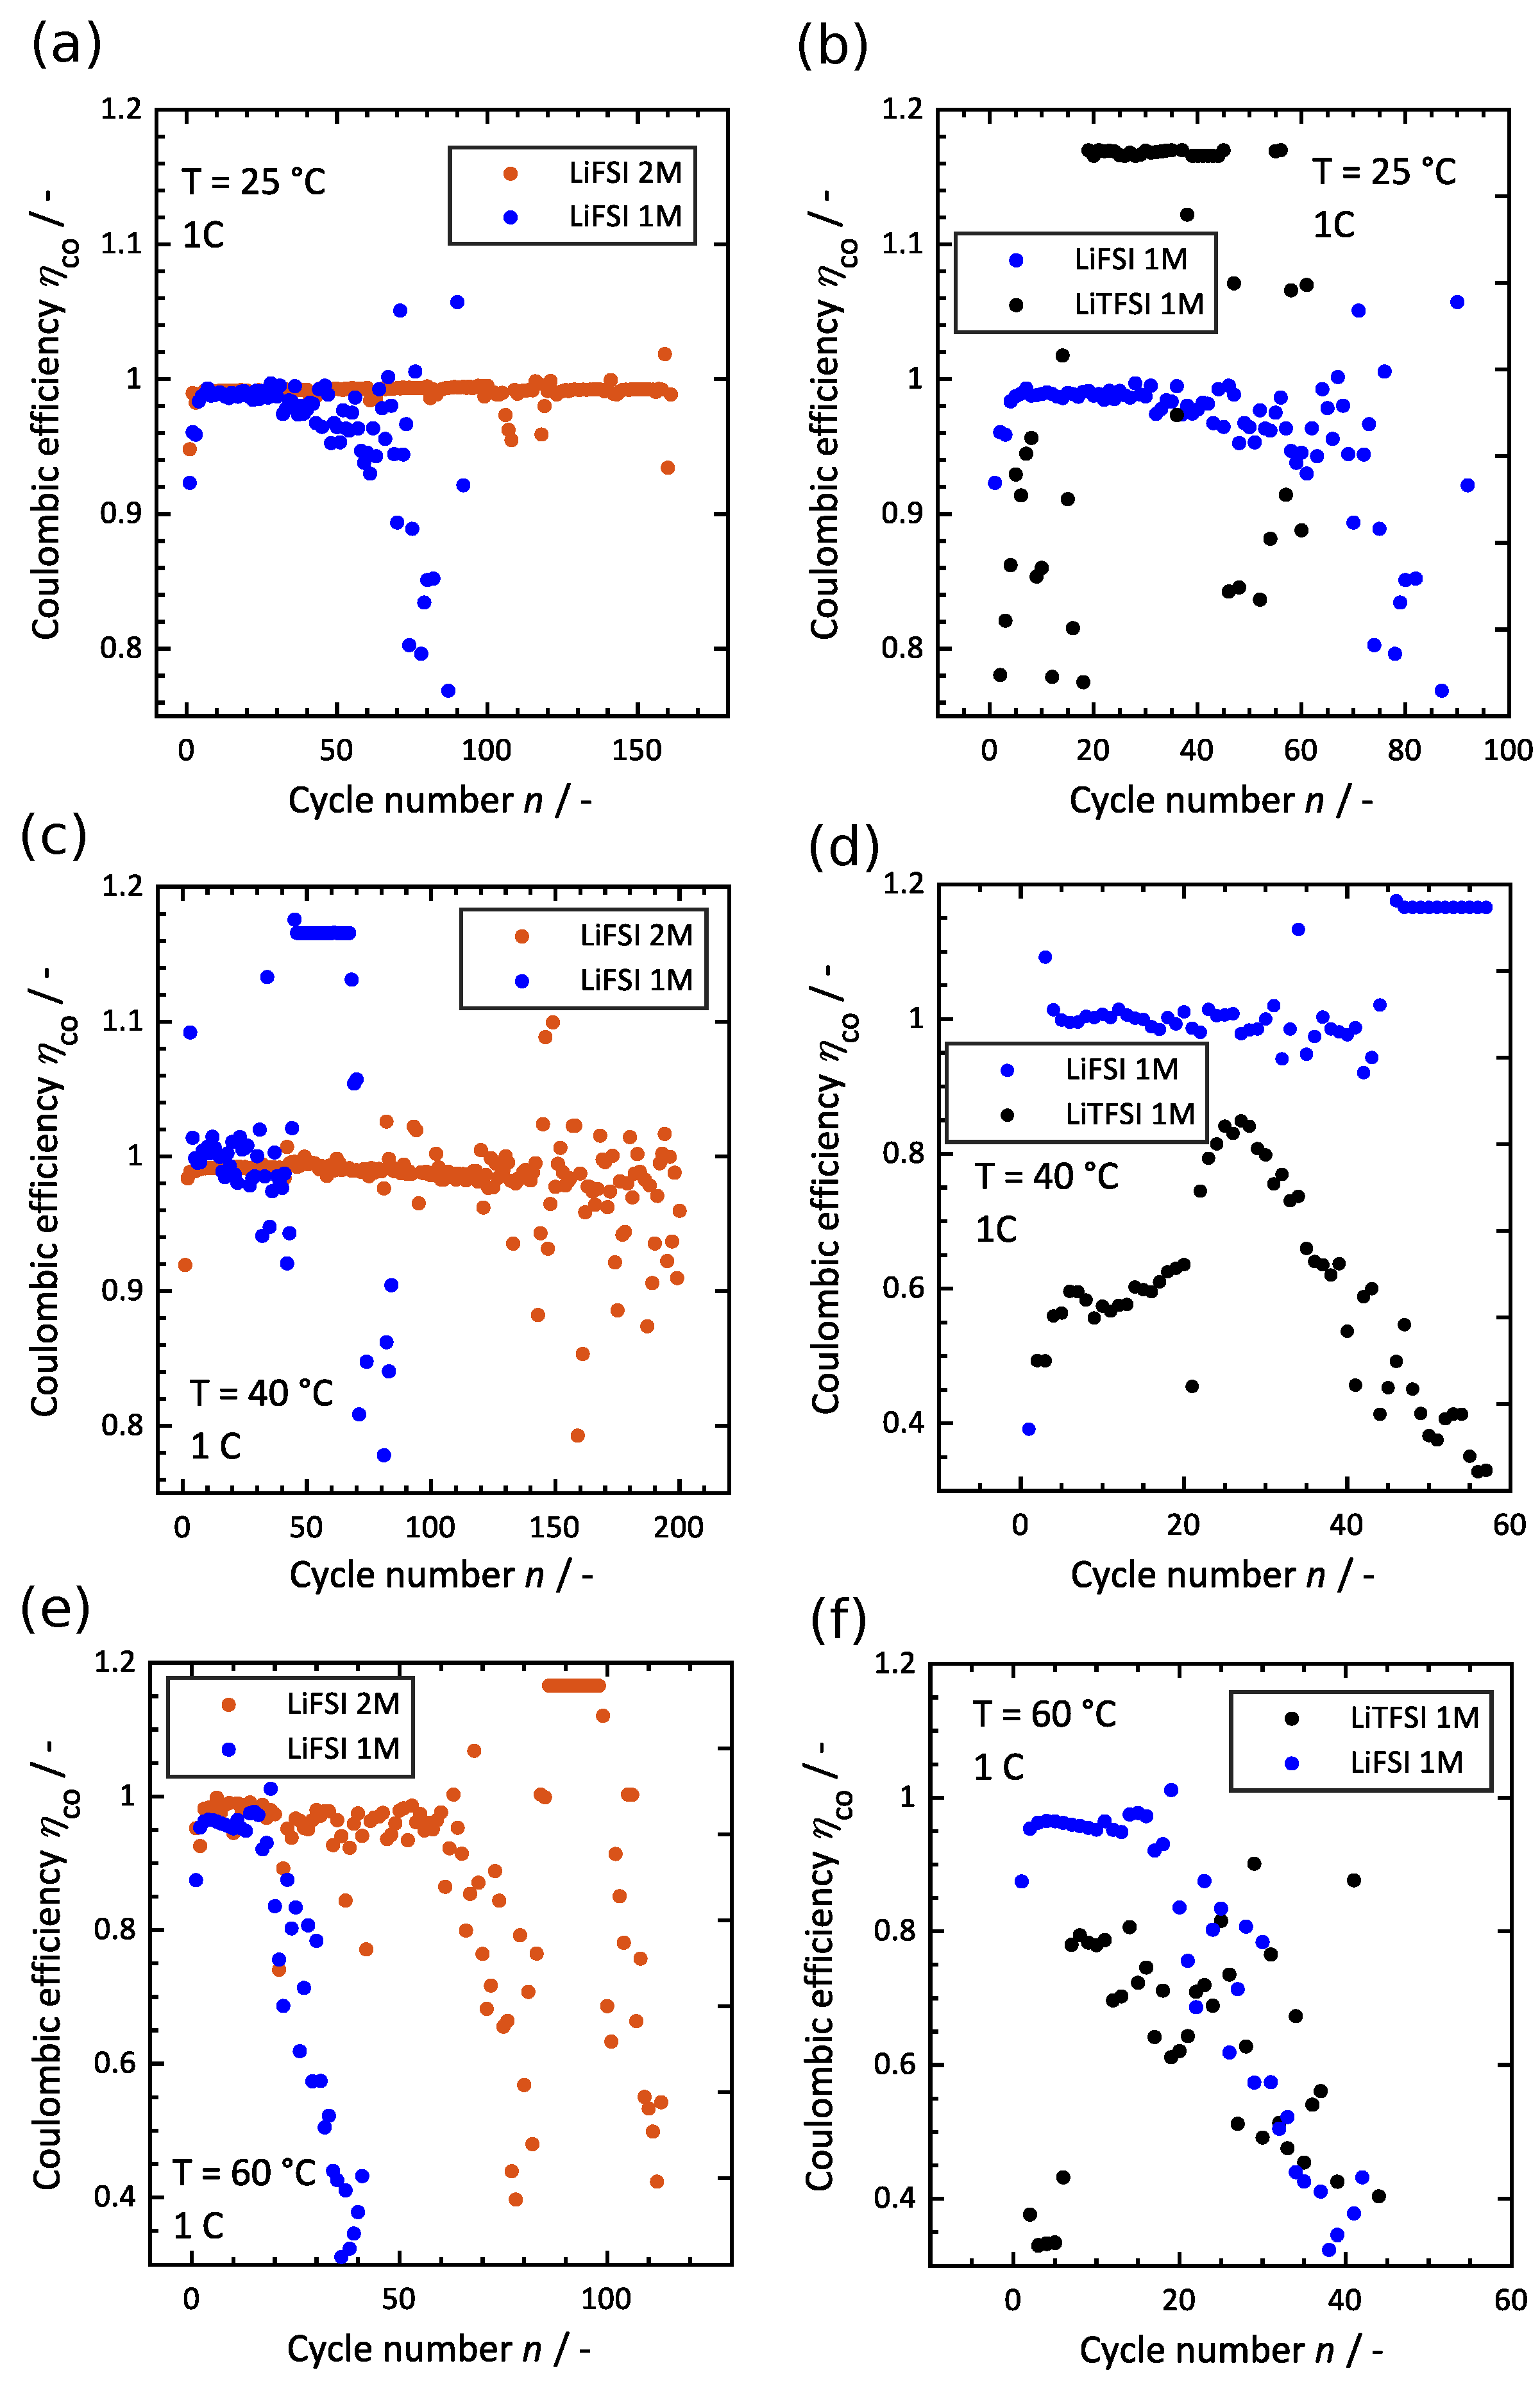
Motivated by the enhanced cycle life at lower temperatures of the cells containing LiFSI with a concentration of M in the DME electrolyte, the influence of the salt concentration and the used salt on the degradation was investigated. Therefore, the concentration was reduced from M to M and the used salt was changed from LiFSI to LiTFSI at a concentration of M. In Figure 6 the impact of the electrolyte composition is visualized. The influence of the concentration is presented in Figure 6a,c,e. The graphs differ for the considered cell temperatures. In Figure 6b,d,f, the effects of the used salt are also given at different temperatures.
Independent of the operating temperature, decreasing the LiFSI concentration from M to M in the electrolyte drastically impaired the cell’s performance. This is clearly evident in the reduced cycle life of the cell with lower concentrations. The limiting value of is reached after 50 cycles for the experiments with M at C. This is three times less than the lifetime of an equivalent cell at a concentration of M. Similar results were found at a cell temperature of C. The maximum number of cycles increased from to as a consequence of the increased concentration. The cells performing at C showed, in general, the worst stability. The cell with 1 M LiFSI reached a cycle number of . The maximum number of cycles was minimally increased to by increasing the concentration to M.
Replacing LiFSI at a concentration of M with LiTFSI at the same concentration affects the cells’ performances drastically. Similar to the effects seen by reducing the salt concentration, the use of LiTFSI negatively influences the cell degradation. At none of the investigated temperatures did the experiments using LiTFSI show stable behavior, not even for a small number of cycles. Independent of the applied temperature, the cells show low and random values for the CE and no trend in the degradation behavior is evident. The cells with LiTFSI also frequently show values above the theoretical maximum value of , which is a sign of the inhomogeneous, poor and weak SEI formation potential of LiTFSI salt [24]. This might be because of the lower LiF content formed during the degradation of LiTFSI, which plays a major role in stabilizing the cell performance, resulting in a longer cycle life [25]. A general trend of CE development observed in Figure 4, Figure 5 and Figure 6 is that the random behavior (noise-like) is a sign of instability. The longer cells run smoothly, the better the cycling performance and lifetime get. A CE value of higher than one could be a sign of micro Li plating, while a CE value of lower than one could be caused by the loss of deposited lithium in the form of SEI or dead lithium. A common behavior in all cells is that the cell cyclability reduces significantly as soon as noises start.
4. Discussion
It has been realized that the type of lithium salt as well as its concentration can strongly influence the performance and cycle life of Li-metal cells. To further investigate this issue, EIS measurements were performed on the cells with different electrolytes of (1) LiFSI 2M in DME, (2) LiFSI 1M in DME, (3) LiTFSI 1M in DME, different measurement temperatures of C and different C-rates of C.
As explained in Figure 1, the first EIS measurement was carried out after the first Li deposition on Cu and then was repeated every 20 cycles until the Coulombic efficiency of the cell reached the value of 0.95. The spectra of cells with different electrolytes after the first Li plating performed at C and an applied current density of mAh·cm (C-rate = 1 C) are presented in Figure 7a. The EIS spectra of cells after the first Li plating performed at different measurement temperatures, having LiFSI 2M in DME electrolyte and a C-rate of C, are presented in Figure 7b. The influence of aging on the EIS spectra of a Cu/Li cell with LiFSI 2M in DME electrolyte, performed at C and a C-rate of C, is visualized in Figure 7c. The spectrum #1 is the first EIS performed after the first Li deposition, #2 is assigned to the second EIS performed after 20 full cycles, #3 is the third EIS after 40 full cycles and so on.
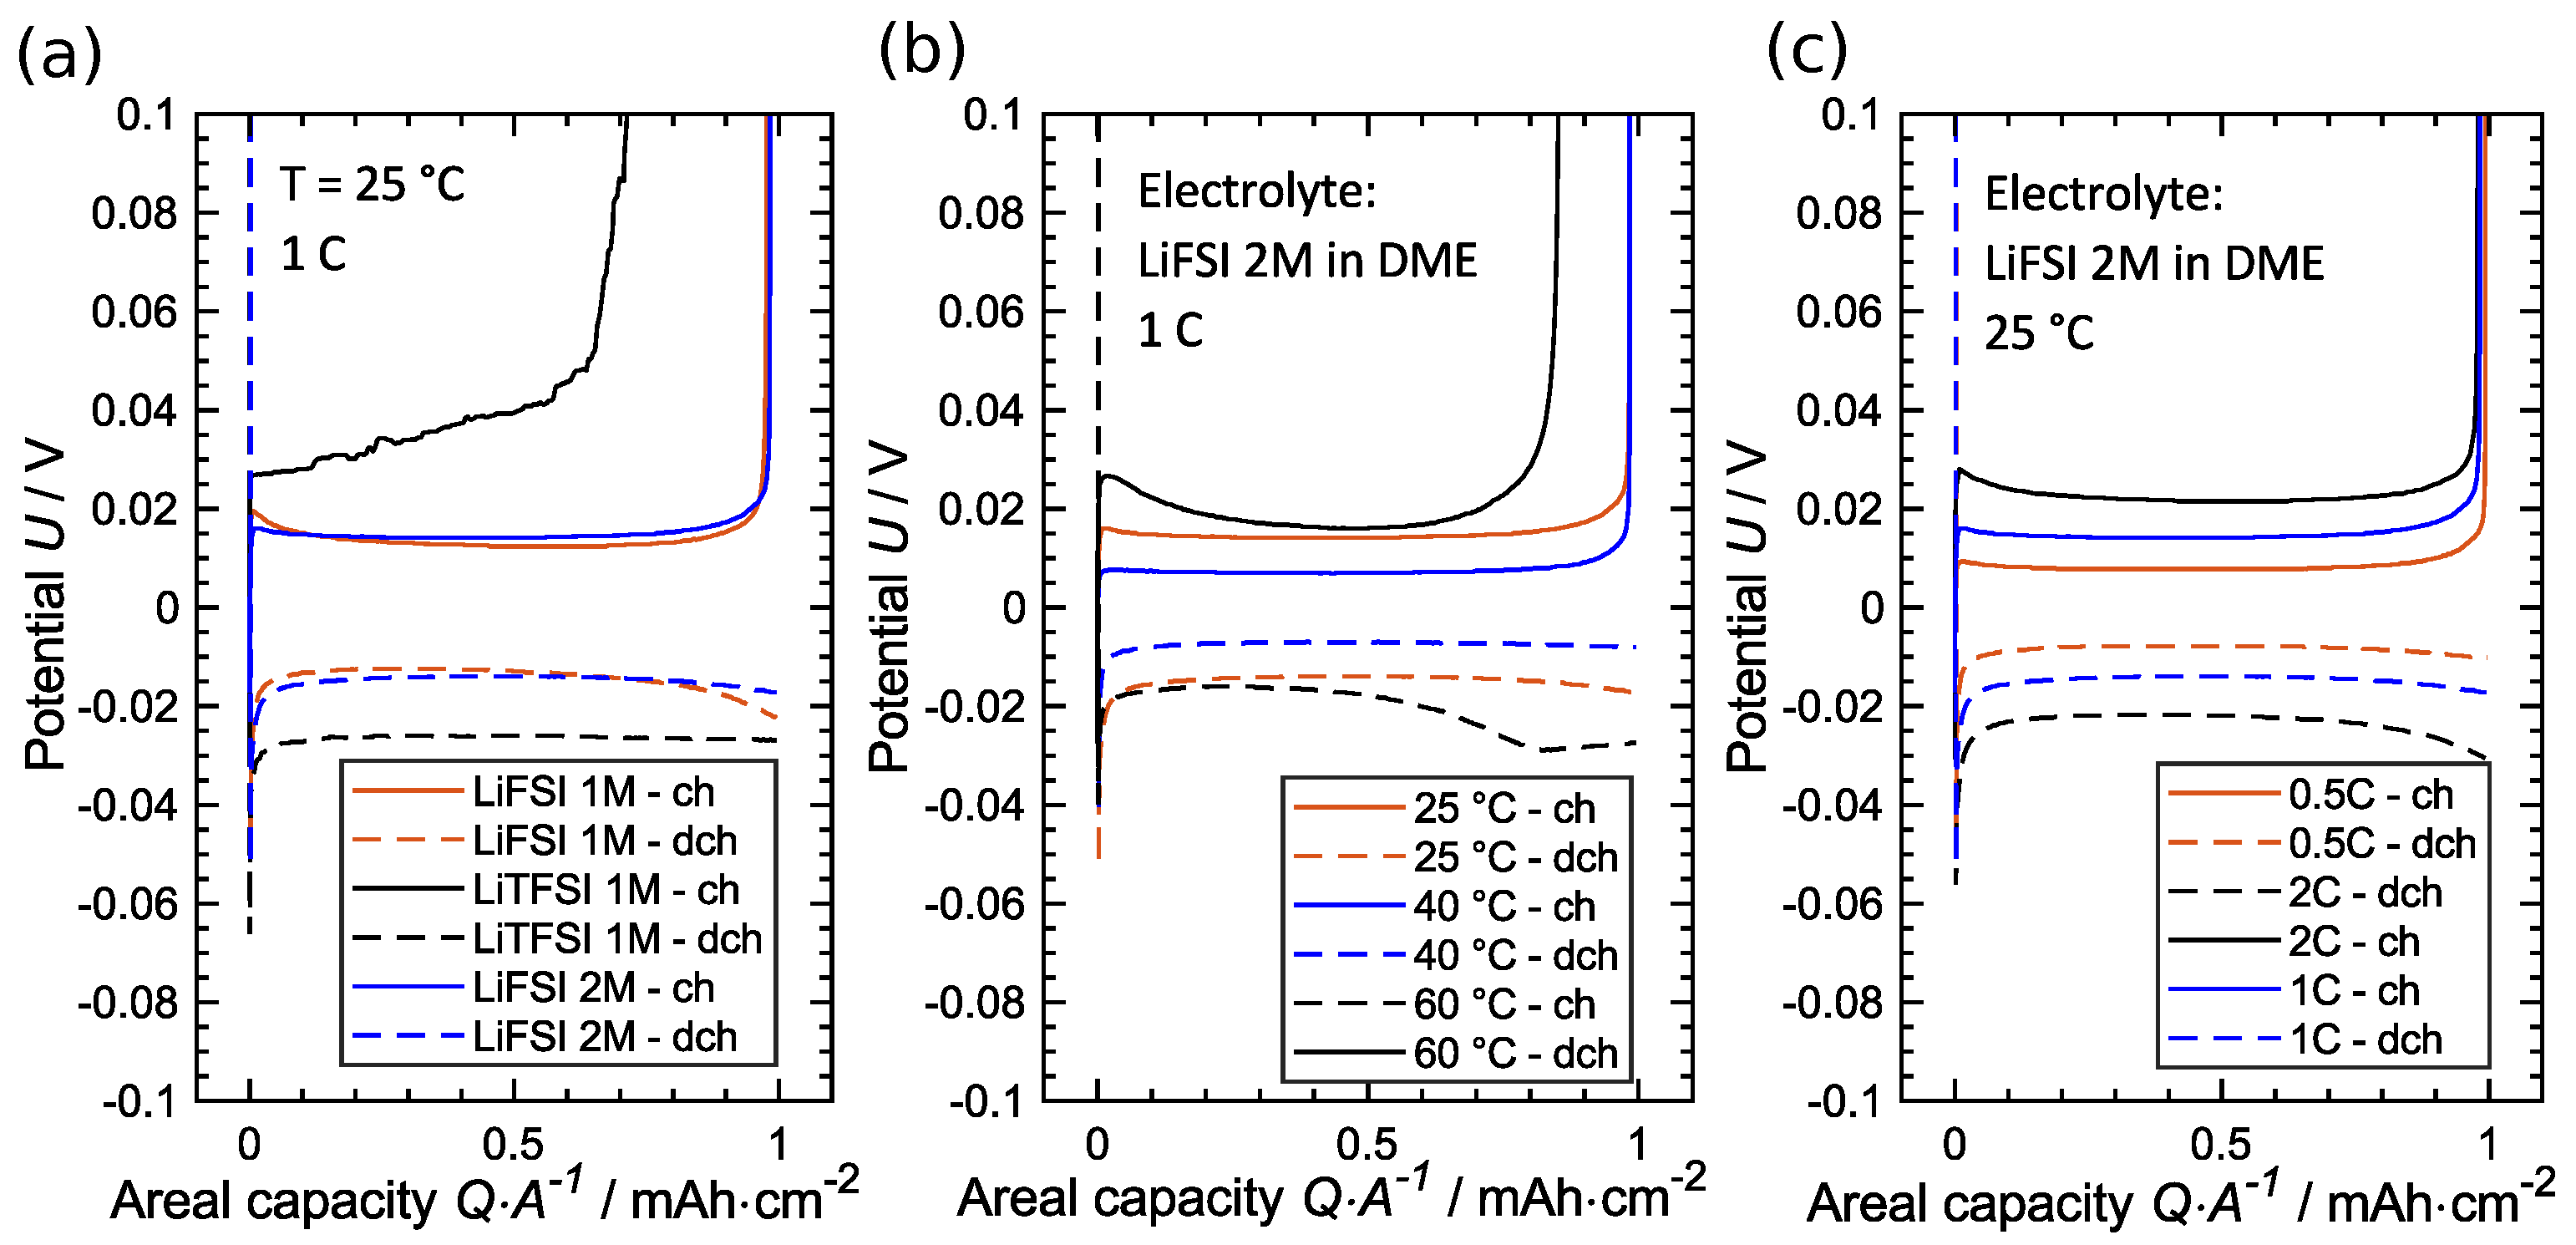
The correlation of EIS measurements with cycling results could be better realized by considering the induced overpotentials of Li deposition nucleation and particle growth during one full cycle. The initial voltage drop at the beginning of plating on Cu is considered to be nucleation overpotential and the steady potential during the rest of deposition period is considered to be growth overpotential [13]. These values are illustrated in Figure 8. The influence of the electrolyte variation is presented in Figure 8a, the influence of temperature variation is visualized in Figure 8b, and at last the impact of the applied current density is displayed in Figure 8c. The cells presented in Figure 8a,b are identical to the cells shown in Figure 7a,b.
All three cells presented in Figure 7a show a comparable ohmic resistance (), which is mainly correlated to electrolyte and contact resistances. This was expected as the cells consist of the same electrodes and the cells are still too fresh to be influenced by different aging rates due to different used electrolytes. The typical semi-circle is easily noticeable in the EIS data of all cells. Additionally, all three cells in Figure 7a show a second semi-circle at lower frequencies, which are partly overlapped with the first ones. The semi-circles at higher frequencies are formed in a similar frequency range for the cells having an LiFSI based electrolyte (see Figure 7a). The frequency values are different for the cells containing the LiTFSI based electrolyte.
These results indicate that the first semi-circle is based on the interface or SEI related impedance. The second semi-circle shows the impedance related to the charge transfer . The consequence of a different impedance behavior of the cells due to the used electrolyte can also be seen in the overpotential of cells during cycling. The voltage behavior of one charge and discharge process (at cycle number #10) is illustrated in Figure 8a; these are the cells identical to those presented in Figure 7a. As expected, the cell with the LiTFSI based electrolyte shows the highest overpotentials ( mV and mV) and irreversible capacity among the rest. The two LiFSI based cells show comparable overpotentials of mV and mV for LiFSI 2M and of mV and mV for LiFSI 1M. The high concentrated LiFSI based cell shows the minimum of irreversible capacity.
By varying the temperature it can be noticed that the cells have the most stable performance at C (see Figure 7b). By increasing the temperature, the frequency which corresponds to a maximum of the semi-circle moves to higher values (from 5 kHz at C to 12.5 kHz at C and to 20 kHz at C). The second semi-circle at elevated temperatures is not distinct anymore and is hardly noticeable at C. This effect can be explained by the fact that with increasing temperature the charge transfer resistance decreases and consequently the correlated semi-circle is more overlapped to the SEI based semi-circle. The ohmic resistances () are comparable in both cells at elevated temperatures and are smaller compared to the resistance of the cell performed at C. The cell cycled at C has the smallest length of the SEI related semi-circle. This is a consequence of the improved kinetic at C in comparison to C. This is in line with the seen voltage profile of the cells presented in Figure 8b. The data at C show the lowest overpotentials of mV and mV. The cell cycled at C also has a low nucleation overpotential of mV; however, in contrast to the rest of the cells is increasing during the plating period and approaches bigger values ( mV). Cycling at a temperature of C has the maximum growth overpotential and the worst cycling stability among all considered temperatures.
Another influencing parameter on the kinetics of Li deposition is the applied current density. We have noticed that cells with a higher C-rate achieve a longer cycle life. This can be seen in Figure 8c, which shows the data extracted from three Li/Cu cells containing LiFSI 2M in DME electrolyte at C with different current densities. As expected, the overpotential increases with increasing current density which causes a higher deviation from equilibrium. However, the better cycling performance of the cells cycled at a higher C-rate could be due to fewer interfacial side reactions as the cycling time is shorter. On the other hand, however, the higher current density could be a trigger to side reactions. More interfacial investigation (EIS and insitu observation) is needed for a better understanding of this process. EIS measurements on the cell with LiFSI 2M in the DME electrolyte performed at C show that, after 20 cycles, the interface resistance significantly decreased. This could be due to the SEI layer not being formed homogeneously and completely after the first deposition. By continuing the cycling, however, the layer becomes denser and more uniform and therefore after 20 cycles the semi-circle is significantly smaller than that after the first deposition. By continuing the cycling, the second semi-circle at low frequencies is still noticeable. This was not the case for the cells cycled at higher temperatures. By cycling the frequency corresponding to the maximum of the first, the semi-circles move towards higher values (similar to the high temperature behavior). The increases by cycling but is still smaller than that of the very first cycle. The ohmic resistance is also slightly increased by cycling. A relatively sharp increase of is noticeable between cycle 100 and cycle 120. It is worth mentioning that, based on cycle performance results, the cell starts to show slight instabilities in the CE trend from the 110th cycle. It can be concluded that both and influence the cycle behavior and the cycle life of the Li-metal cells.
5. Future Work
Another method for investigating lithium deposition during cycling is insitu observation using special cell holders. Insitu observations in the ECC-Opto Stud, manufactured by EL-Cells GmbH (Hamburg, Germany), on battery cells were made in [26,27,28,29,30,31,32,33] using Raman spectroscopy, X-ray diffraction (XRD) and optical analytics. Observations were made using Raman spectroscopy [27,31,32] and XRD [26,28,33] to observe changes in electrodes and SEI during aging. Merryweather et al. [29] used the above-mentioned cell housing for optical interferometric scattering measurements to detect single-particle ion dynamics, and Rittweger et al. [30] observed the reflectivity of cathodes during charge and discharge.
In future work, the above-mentioned cell holder ECC-Opto-Std cell, manufactured by EL-Cell, will be used to conduct insitu measurements. The cell setups, like those described in this article, consisting of Cu/Li, will be used. The experiments will also investigate the influence of C-rate, temperature, used salt and salt concentration on the morphology of lithium deposition. Additionally, in order to better understand the behavior of the lithium at different conditions, a fully developed model will be included.
6. Conclusions
In summary, the electrochemical performance of Cu/Li cells was investigated with the motivation of understanding the kinetics of the deposition mechanism of Li metal electrodes. The influence of temperature C and C-rate C was examined. Additionally, the variety of electrolytes, including LiFSI 2M in DME, LiFSI 1M in DME, and LiTFSI 1M in DME, were utilized to address the impact of type and concentration of Li salt on the electrolyte. Coulombic efficiency and induced depositions overpotential, as well as EIS measurements, were used to evaluate the aging behavior of cells under different conditions. Based on our results, it is confirmed that cycling at a temperature of C has the best kinetics in comparison to the cycling data with C and C, as it shows minimum deposition overpotentials and impedance. However, the best performance regarding the stability and long cycle life is achieved at C. The LiFSI in general showed better cyclability in Cu/Li cells compared to LiTFSI and the best performance could be gained by a high concentration of the LiFSI-DME electrolyte.
Author Contributions
Conceptualization, S.M.B., A.F. and A.R.; methodology, S.M.B.; validation, S.M.B.; investigation, S.M.B.; data curation, S.M.B.; writing—original draft preparation, S.M.B.; writing—review and editing, A.F.; visualization, S.M.B. and A.F.; supervision, K.P.B.; project administration, K.P.B.; funding acquisition, K.P.B. All authors have read and agreed to the published version of the manuscript.
Funding
This research was partly funded by Robert Bosch GmbH.
Institutional Review Board Statement
Not applicable.
Informed Consent Statement
Not applicable.
Data Availability Statement
The data presented in this study are available on request from the corresponding author.
Acknowledgments
The authors thankfully acknowledge Leonie Wolf for helping with the preparation of the cell assemblies. The authors would also like to thank Robert Bosch GmbH for their support during the Bosch Doctoral College.
Conflicts of Interest
The authors declare no conflict of interest.
Abbreviations
The following abbreviations are used in this manuscript:
| A | Effective surface area |
| c | Molar concentration |
| water concentration | |
| oxygen concentration | |
| CC | Current Collector |
| CE | Coulombic efficiency |
| Cu | Copper |
| Diameter of the current collector | |
| Diameter of the Lithium foil | |
| DME | 1,2-dimethoxyethane |
| DOE | US Department of Energy |
| e | electron |
| EIS | Electrochemical Impedance Spectroscopy |
| Maximum frequency of EIS | |
| Minimum frequency of EIS | |
| Hydrogen | |
| Water | |
| Thickness of the Copper foil | |
| Thickness of the Lithium foil | |
| Cell current | |
| j | Current density |
| Li | Lithium |
| Lithium Ion | |
| LiFSI | Lithium bis(fluorosulfonyl)imide |
| LiTFSI | Lithium bis(trifluoromethanesul-fonyl)imide |
| n | Number of cycles |
| Maximum number of cycles | |
| Oxygen | |
| OCP | Open Circuit Potential |
| Charge transfer resistance | |
| Ohmic resistance | |
| SEI | Solid Electrolyte Interface |
| SPE | Solid Polymer Electrolyte |
| t | Time |
| cell temperature | |
| Time of drying | |
| Temperature of drying | |
| Lower voltage limit | |
| Upper voltage limit | |
| Amount of electrolyte | |
| Purity of LiTFSI and LiFSI | |
| XRD | X-ray diffraction |
| Imaginary part of the impedance | |
| Real part of the impedance | |
| Coulombic efficiency | |
| Average Coulombic efficiency | |
| overpotential of Li deposition nucleation | |
| overpotential of particle growth | |
| Potential of Li versus | |
| Standard deviation of the Coulombic efficiency | |
| Standard deviation of the areal capacity |
References
- Ding, Y.; Cano, Z.P.; Yu, A.; Lu, J.; Chen, Z. Automotive Li-ion batteries: Current status and future perspectives. Electrochem. Energy Rev. 2019, 2, 1–28. [Google Scholar] [CrossRef]
- USABC Goals for Advanced Batteries for EVs—CY 2023 Commercialization (USABC, 2017). 2018.
- Albertus, P.; Babinec, S.; Litzelman, S.; Newman, A. Status and challenges in enabling the lithium metal electrode for high-energy and low-cost rechargeable batteries. Nat. Energy 2018, 3, 16–21. [Google Scholar] [CrossRef]
- Brandt, K. Historical development of secondary lithium batteries. Solid State Ionics 1994, 69, 173–183. [Google Scholar] [CrossRef]
- Wang, H.; Zhang, W.D.; Deng, Z.Q.; Chen, M.C. Interaction of nitrogen with lithium in lithium ion batteries. Solid State Ionics 2009, 180, 212–215. [Google Scholar] [CrossRef]
- Furukawa, T.; Hirakawa, Y.; Kondo, H.; Kanemura, T.; Wakai, E. Chemical reaction of lithium with room temperature atmosphere of various humidities. Fusion Eng. Des. 2015, 98, 2138–2141. [Google Scholar] [CrossRef] [Green Version]
- Peled, E. The electrochemical behavior of alkali and alkaline earth metals in nonaqueous battery systems—The solid electrolyte interphase model. J. Electrochem. Soc. 1979, 126, 2047. [Google Scholar] [CrossRef]
- Sergi, F.; Arista, A.; Agnello, G.; Ferraro, M.; Andaloro, L.; Antonucci, V. Characterization and comparison between lithium iron phosphate and lithium-polymers batteries. J. Energy Storage 2016, 8, 235–243. [Google Scholar] [CrossRef]
- Mindemark, J.; Lacey, M.J.; Bowden, T.; Brandell, D. Beyond PEO—Alternative host materials for Li+-conducting solid polymer electrolytes. Prog. Polym. Sci. 2018, 81, 114–143. [Google Scholar] [CrossRef]
- Nagpure, S.C.; Tanim, T.R.; Dufek, E.J.; Viswanathan, V.V.; Crawford, A.J.; Wood, S.M.; Xiao, J.; Dickerson, C.C.; Liaw, B. Impacts of lean electrolyte on cycle life for rechargeable Li metal batteries. J. Power Sources 2018, 407, 53–62. [Google Scholar] [CrossRef]
- Christensen, J.; Albertus, P.; Sanchez-Carrera, R.S.; Lohmann, T.; Kozinsky, B.; Liedtke, R.; Ahmed, J.; Kojic, A. A critical review of Li/air batteries. J. Electrochem. Soc. 2011, 159, R1. [Google Scholar] [CrossRef]
- Yang, T.; Liu, J.; Dai, J.; Han, Y. Shaping particles by chemical diffusion and reaction. CrystEngComm 2017, 19, 72–79. [Google Scholar] [CrossRef]
- Han, Y.; Jie, Y.; Huang, F.; Chen, Y.; Lei, Z.; Zhang, G.; Ren, X.; Qin, L.; Cao, R.; Jiao, S. Enabling stable lithium metal anode through electrochemical kinetics manipulation. Adv. Funct. Mater. 2019, 29, 1904629. [Google Scholar] [CrossRef]
- Li, L.; Basu, S.; Wang, Y.; Chen, Z.; Hundekar, P.; Wang, B.; Shi, J.; Shi, Y.; Narayanan, S.; Koratkar, N. Self-heating–induced healing of lithium dendrites. Science 2018, 359, 1513–1516. [Google Scholar] [CrossRef] [Green Version]
- Aryanfar, A.; Brooks, D.J.; Colussi, A.J.; Merinov, B.V.; Goddard, W.A., III; Hoffmann, M.R. Thermal relaxation of lithium dendrites. Phys. Chem. Chem. Phys. 2015, 17, 8000–8005. [Google Scholar] [CrossRef] [PubMed] [Green Version]
- Zhu, Y.; Xie, J.; Pei, A.; Liu, B.; Wu, Y.; Lin, D.; Li, J.; Wang, H.; Chen, H.; Xu, J.; et al. Fast lithium growth and short circuit induced by localized-temperature hotspots in lithium batteries. Nat. Commun. 2019, 10, 1–7. [Google Scholar] [CrossRef] [Green Version]
- Adair, K.R.; Banis, M.N.; Zhao, Y.; Bond, T.; Li, R.; Sun, X. Temperature-Dependent Chemical and Physical Microstructure of Li Metal Anodes Revealed through Synchrotron-Based Imaging Techniques. Adv. Mater. 2020, 32, 2002550. [Google Scholar] [CrossRef]
- Geng, Z.; Lu, J.; Li, Q.; Qiu, J.; Wang, Y.; Peng, J.; Huang, J.; Li, W.; Yu, X.; Li, H. Lithium metal batteries capable of stable operation at elevated temperature. Energy Storage Mater. 2019, 23, 646–652. [Google Scholar] [CrossRef]
- Cheng, X.B.; Zhang, R.; Zhao, C.Z.; Wei, F.; Zhang, J.G.; Zhang, Q. A review of solid electrolyte interphases on lithium metal anode. Adv. Sci. 2016, 3, 1500213. [Google Scholar] [CrossRef]
- Andersson, A.; Edström, K. Chemical composition and morphology of the elevated temperature SEI on graphite. J. Electrochem. Soc. 2001, 148, A1100. [Google Scholar] [CrossRef]
- Aurbach, D.; Weissman, I.; Zaban, A.; Chusid, O. Correlation between surface chemistry, morphology, cycling efficiency and interfacial properties of Li electrodes in solutions containing different Li salts. Electrochim. Acta 1994, 39, 51–71. [Google Scholar] [CrossRef]
- Kim, H.; Wu, F.; Lee, J.T.; Nitta, N.; Lin, H.T.; Oschatz, M.; Cho, W.I.; Kaskel, S.; Borodin, O.; Yushin, G. In situ formation of protective coatings on sulfur cathodes in lithium batteries with LiFSI-based organic electrolytes. Adv. Energy Mater. 2015, 5, 1401792. [Google Scholar] [CrossRef]
- Dornbusch, D.A.; Hilton, R.; Lohman, S.D.; Suppes, G.J. Experimental validation of the elimination of dendrite short-circuit failure in secondary lithium-metal convection cell batteries. J. Electrochem. Soc. 2014, 162, A262. [Google Scholar] [CrossRef]
- He, Y.; Zhang, Y.; Yu, P.; Ding, F.; Li, X.; Wang, Z.; Lv, Z.; Wang, X.; Liu, Z.; Huang, X. Ion association tailoring SEI composition for Li metal anode protection. J. Energy Chem. 2020, 45, 1–6. [Google Scholar] [CrossRef] [Green Version]
- Jurng, S.; Brown, Z.L.; Kim, J.; Lucht, B.L. Effect of electrolyte on the nanostructure of the solid electrolyte interphase (SEI) and performance of lithium metal anodes. Energy Environ. Sci. 2018, 11, 2600–2608. [Google Scholar] [CrossRef]
- Bärmann, P.; Mohrhardt, M.; Frerichs, J.E.; Helling, M.; Kolesnikov, A.; Klabunde, S.; Nowak, S.; Hansen, M.R.; Winter, M.; Placke, T. Mechanistic Insights into the Pre-Lithiation of Silicon/Graphite Negative Electrodes in “Dry State” and After Electrolyte Addition Using Passivated Lithium Metal Powder. Adv. Energy Mater. 2021, 11, 2100925. [Google Scholar] [CrossRef]
- Blanchard, D.; Slagter, M. In operando Raman and optical study of lithium polysulphides dissolution in Lithium-Sulfur Cells with carrageenan binder. J. Phys. Energy 2021, 3, 044003. [Google Scholar] [CrossRef]
- Chladil, L.; Kunický, D.; Vanýsek, P.; Čech, O. In-Situ X-Ray Study of Carbon Coated LiFePO4 for Li-Ion Battery in Different State of Charge. ECS Trans. 2018, 87, 107–114. [Google Scholar] [CrossRef]
- Merryweather, A.J.; Schnedermann, C.; Jacquet, Q.; Grey, C.P.; Rao, A. Operando optical tracking of single-particle ion dynamics in batteries. Nature 2021, 594, 522–528. [Google Scholar] [CrossRef] [PubMed]
- Rittweger, F.; Modrzynski, C.; Roscher, V.; Danilov, D.L.; Notten, P.H.L.; Riemschneider, K.-R. Investigation of charge carrier dynamics in positive lithium-ion battery electrodes via optical in situ observation. J. Power Sources 2021, 482, 228943. [Google Scholar] [CrossRef]
- Vinayan, B.P.; Diemant, T.; Lin, X.-M.; Cambaz, M.A.; Golla-Schindler, U.; Kaiser, U.; Behm, R.J.; Fichtner, M. Nitrogen Rich Hierarchically Organized Porous Carbon/Sulfur Composite Cathode Electrode for High Performance Li/S Battery: A Mechanistic Investigation by Operando Spectroscopic Studies. Adv. Mater. Interfaces 2016, 3, 1600372. [Google Scholar] [CrossRef] [Green Version]
- Vinayan, B.P.; Euchner, H.; Zhao-Karger, Z.; Cambaz, M.A.; Li, Z.; Diemant, T.; Behm, R.J.; Gross, A.; Fichtner, M. Insights into the electrochemical processes of rechargeable magnesium–sulfur batteries with a new cathode design. Adv. Mater. Chem. A 2019, 7, 25490–25502. [Google Scholar] [CrossRef]
- Zou, J.; Sole, C.; Drewett, N.E.; Velický, M.; Hardwick, L.J. In Situ Study of Li Intercalation into Highly Crystalline Graphitic Flakes of Varying Thicknesses. J. Phys. Chem. Lett. 2016, 7, 4291–4296. [Google Scholar] [CrossRef] [PubMed] [Green Version]
Figure 1.
Segment of the measurement procedure of the conducted cycling tests example at C. The current data are presented in (a) and the corresponding voltage data are visualized in (b). Before the first cycle and after each 20 full charge/discharge cycles, EIS measurements were conducted.
Figure 1.
Segment of the measurement procedure of the conducted cycling tests example at C. The current data are presented in (a) and the corresponding voltage data are visualized in (b). Before the first cycle and after each 20 full charge/discharge cycles, EIS measurements were conducted.

Figure 2.
Matrix of the conducted measurements. For the salt LiFSI the c-rate was varied with C at a salt concentration of M and a cell temperature of C. The temperature was varied with C at the same concentration and C. At a concentration of M measurements at C and C for two salts: LifTSI and LiFSI.

Figure 3.
Galvanostatic cycling performance of three identical cells with Cu/Li structure. Electrolyte used in all cells is LiFSI 2M in DME. (a) areal capacity and (b) Coulombic efficiency over life time is shown for cells running at C with the current density of mA·cm.
Figure 3.
Galvanostatic cycling performance of three identical cells with Cu/Li structure. Electrolyte used in all cells is LiFSI 2M in DME. (a) areal capacity and (b) Coulombic efficiency over life time is shown for cells running at C with the current density of mA·cm.

Figure 4.
Galvanostatic cycling performance of cells with Cu/Li structure using LiFSI 2M in DME as the electrolyte. Cells are run each with an individual C-rate of C and are shown with orange, black and blue colors, respectively. The cell temperature for all three experiments was set to C.
Figure 4.
Galvanostatic cycling performance of cells with Cu/Li structure using LiFSI 2M in DME as the electrolyte. Cells are run each with an individual C-rate of C and are shown with orange, black and blue colors, respectively. The cell temperature for all three experiments was set to C.

Figure 5.
Cycle performance of cells with Cu/Li structure having LiFSI 2M in DME as the electrolyte. (a) Cells are running with the C-rate of C and each at the different temperatures of C shown in orange, black and blue colors, respectively. (b) Cells are running with the C-rate of C and each at the different temperatures of C shown with orange, black and blue colors, respectively.

Figure 6.
Cycle performance of cells with Cu/Li structure. All cells ran with the C-rate of C. (a,c,e) Both cells use LiFSI Li salt in electrolyte with the different concentrations of M represented by orange and blue colors, respectively. (b,d,f) Both cells use a salt concentration of M. Blue points represent the cell using LiFSI salt, and black points show the results of a cell using LiTFSI. (a,b), cell temperature is set to C. (c,d), cell temperature is set to C. (e,f), cell temperature is set to C.

Figure 7.
EIS spectra of Cu/Li cells: (a) Three cells with different electrolytes after the first Li plating. Orange represents LiFSI 2M in DME, black is LiTFSI 1M in DME, and blue shows LiFSI 1M in DME at C and mAh·cm. (b) Three cells at different temperatures C after the first Li plating. Electrolyte: LiFSI 2M in DME with an applied current density of mAh·cm. (c) EIS spectra of a single cell, performed every 20th cycle during the degradation test with LiFSI 2M in DME, C and mAh·cm. EIS # 1 is after first plating, EIS # 2 is after 21 cycles and EIS # 7 is after 121 cycles.

Figure 8.
Potential–Capacity profile at cycle number 10 for Li/Cu cells, (a) with different electrolytes of LiFSI 1M in DME (orange), LiTFSI 1M in DME (black), and LiFSI 2M in DME (blue). Measurements are performed at C and with an applied current density of mAh·cm. (b) performed with different C-rates of C (orange), C (black) and C (blue), with LiFSI 2M in DME as electrolyte at C. (c) performed at different temperature of C (orange), C (black) and C (blue), using LiFSI 2M in DME as electrolyte and a current density of mAh·cm.


Table 1.
Number of measurements for each condition considered.
| LiFSI | LiTFSI | ||||
|---|---|---|---|---|---|
| 2 C | 1 C | 0.5 C | 1 C | ||
| 2 M | 25 C | #1 | #3 | #3 | |
| 40 C | #1 | #2 | |||
| 60 C | #1 | #2 | |||
| 1 M | 25 C | - | #1 | - | #1 |
| 40 C | - | #2 | - | #1 | |
| 60 C | - | #2 | - | #2 | |
Publisher’s Note: MDPI stays neutral with regard to jurisdictional claims in published maps and institutional affiliations. |
© 2021 by the authors. Licensee MDPI, Basel, Switzerland. This article is an open access article distributed under the terms and conditions of the Creative Commons Attribution (CC BY) license (https://creativecommons.org/licenses/by/4.0/).
Share and Cite
MDPI and ACS Style
Boroujeni, S.M.; Fill, A.; Ridder, A.; Birke, K.P. Influence of Temperature and Electrolyte Composition on the Performance of Lithium Metal Anodes. Batteries 2021, 7, 67. https://0-doi-org.brum.beds.ac.uk/10.3390/batteries7040067
AMA Style
Boroujeni SM, Fill A, Ridder A, Birke KP. Influence of Temperature and Electrolyte Composition on the Performance of Lithium Metal Anodes. Batteries. 2021; 7(4):67. https://0-doi-org.brum.beds.ac.uk/10.3390/batteries7040067
Chicago/Turabian StyleBoroujeni, Sanaz Momeni, Alexander Fill, Alexander Ridder, and Kai Peter Birke. 2021. "Influence of Temperature and Electrolyte Composition on the Performance of Lithium Metal Anodes" Batteries 7, no. 4: 67. https://0-doi-org.brum.beds.ac.uk/10.3390/batteries7040067
Note that from the first issue of 2016, this journal uses article numbers instead of page numbers. See further details here.