A Complete VADER-Based Sentiment Analysis of Bitcoin (BTC) Tweets during the Era of COVID-19


Electrical, Computer, and Biomedical Engineering, Ryerson University, Toronto, ON M5B 2K3, Canada
*
Author to whom correspondence should be addressed.
Big Data Cogn. Comput. 2020, 4(4), 33; https://0-doi-org.brum.beds.ac.uk/10.3390/bdcc4040033
Submission received: 2 October 2020
/
Revised: 27 October 2020
/
Accepted: 30 October 2020
/
Published: 9 November 2020
(This article belongs to the Special Issue Knowledge Modelling and Learning through Cognitive Networks)
Abstract
:During the COVID-19 pandemic, many research studies have been conducted to examine the impact of the outbreak on the financial sector, especially on cryptocurrencies. Social media, such as Twitter, plays a significant role as a meaningful indicator in forecasting the Bitcoin (BTC) prices. However, there is a research gap in determining the optimal preprocessing strategy in BTC tweets to develop an accurate machine learning prediction model for bitcoin prices. This paper develops different text preprocessing strategies for correlating the sentiment scores of Twitter text with Bitcoin prices during the COVID-19 pandemic. We explore the effect of different preprocessing functions, features, and time lengths of data on the correlation results. Out of 13 strategies, we discover that splitting sentences, removing Twitter-specific tags, or their combination generally improve the correlation of sentiment scores and volume polarity scores with Bitcoin prices. The prices only correlate well with sentiment scores over shorter timespans. Selecting the optimum preprocessing strategy would prompt machine learning prediction models to achieve better accuracy as compared to the actual prices.
1. Introduction
Recent research studies have emerged that involve the impact of COVID-19 on the financial market, including cryptocurrencies [1,2,3,4,5,6,7,8]. It was illustrated that Bitcoin is not a safe haven [1,2]. A correlation between Bitcoin and the stock market is observed in [3,4]. In [5], authors performed a dynamic correlation analysis that illustrated that Bitcoin could not hedge the US stocks’ extraordinary tail risk. The co-movement between Bitcoin and daily data of COVID-19 world deaths is examined in [6]. The herding behavior in the cryptocurrency market has been explored in [7]. The association between the stock market volatility and policy responses to the COVID-19 outbreak is studied in [8]. Previous work before the pandemic has used various machine learning algorithms to predict the bitcoin price. In [9], Arti Jain et al. attempted to predict the prices of Bitcoin and Litecoin two hours in advance based on the sentiments expressed in current tweets. They investigated if social factors could predict the prices of cryptocurrencies. They used a Multiple Linear Regression (MLR) model to predict a bihourly average price from the number of positive, neutral, and negative tweets accumulated every two hours. Symeonidis et al. compared the significance of different preprocessing techniques for sentiment analysis of tweets [10]. They used four different machine learning algorithms, Linear Regression, Bernoulli Naïve Bayes, Linear Support Vector Machine, and a Convolutional Neural Network to classify tweets as positive, negative, or neutral sentiment. They tested 16 different preprocessing techniques in isolation. They recommended using lemmatization, replacing repeated punctuation, replacing contractions, or removing numbers. They identified the five most impactful techniques for use in a second. Based on their results, they suggested replacing URLs and user mentions, replacing contractions, replacing repeated punctuation, and lemmatization for a neural network classification model. Ibrahim et al. [11] provided a predictive model to the BTC prices using Bayesian autoregression models. In Tan and Kashef [12], a comparative study between various BTC prediction models is performed, showing the Multi-Layer Perceptron (MLP) efficiency in forecasting the Bitcoin price. None of the above research studies have examined the impact of the emotions expressed about bitcoin on social media platforms, such as Twitter, during the COVID-19 outbreak. The preprocessing of tweets is a significant challenge in providing and building an acute prediction model. Feeding text data that do not correlate well with Bitcoin to a prediction model will not allow the right forecasting of Bitcoin’s behavior. The purpose of this paper is to perform a complete Valence Aware Dictionary and sEntiment Reasoner (VADER)-based sentiment analysis of BTC tweets during the era of COVID-19 to identify the role of different preprocessing strategies in predicting Bitcoin prices. The sentiment analysis includes converting tweet text into a sentiment score that is representative of its emotion. Such a task is suited to VADER, a lexicon and rule-based sentiment analysis tool that can deal with the syntax usually adopted on social media. We developed 13 different preprocessing strategies for BTC tweets. To rank the preprocessing strategy’s effectiveness, an overall correlation value, the Average Feature Correlation Magnitude (AFCM), is constructed. For each strategy, the correlation values of all optimum features are averaged by their absolute value. The optimum preprocessing strategies are quantified using VADER scoring systems. The VADER score is used to match the actual BTC price trend. Among all strategies, it was found that splitting sentences, removing Twitter-specific tags, or their combination generally improve the correlation of sentiment scores and volume polarity scores with Bitcoin prices. The rest of this paper is organized as follows: In Section 2, a discussion on sentiment analysis is presented; Section 3 presents related work on tweets sentiments. In Section 4, a Complete Sentiment Analysis using VADER scoring of BTC Tweets during the era of COVID-19 is discussed; Section 5 concludes the paper and provides future research directions.
2. Sentiment Analysis
In this section, some of the well-known sentiment analysis methods are discussed, including VADER [13], Word2vec [14], TFIDF [15], and N-grams [16].
2.1. Valence Aware Dictionary and sEntiment Reasoner (VADER)
VADER is a lexicon- and rule-based sentiment analysis tool that can handle words, abbreviations, slang, emoticons, and emojis commonly found in social media [13]. It is typically much faster than machine learning algorithms, as it requires no training [13,17]. Each body of text produces a vector of sentiment scores with negative, neutral, positive, and compound polarities [13]. The negative, neutral, and positive polarities are normalized to be between 0 and 1. The compound polarity can be thought of as an aggregate measure of all the other sentiments, normalized to be between −1 (negative) and 1 (positive).
2.2. Word to Vector (Word2vec)
In the Word2vec method, embedding words are designed as vectors made of real-valued numbers [14]. These vectors preserve both the syntactic regularity by making similar words have similar vectors and the semantic regularity between word pairs through vector algebra. For example, the word vector for “man” subtracted from the word vector for “king” and added to the word vector for “woman” produces something very similar to the word vector for “queen”. Such vectors provide a way of translating words to numbers for train machine learning algorithms while preserving the relationships between words. Word2vec was initially developed by Tomas Mikolov et al. [14] to produce high-quality word vectors more efficiently than conventional means. A shallow feed-forward neural network trains weights with only input, projection, and output layers as word vectors. Two different network architectures, CBOW and Skip-gram, were used to generate the word vectors. CBOW is optimized to guess a target word from adjacent words in the text, while Skip-gram is optimized to guess adjacent words surrounding a target word.
2.3. Term Frequency-Inverse Document Frequency (TF-IDF)
The TFIDF approach finds keywords for each document in a collection of documents [15,16,18]. It assigns a number to each word in a document based on how frequently it appears in that document and how many documents use it. The “term-frequency” of a word is the number of times that word appears in a document, while the “document frequency” is the number of documents that contain that word [18]. The “inverse document frequency” of a word is the natural logarithm of the total number of documents divided by the word’s “document frequency”. Each word is assigned a TFIDF score by multiplying the word’s “term frequency” by its “inverse document frequency”.
2.4. N-Gram
N-gram is a model describing the identification of all groups of n adjacent words in a body of text [16]. For example, all adjacent triplets’ words in the sentence “Mary had a little lamb” are “Mary had a”, “had a little”, and “a little lamb”. These groupings are known as trigrams. However, groupings can be defined for any integer size. Unigrams, or single word groups, would include “Mary”, “had”, “a”, “little,”, and “lamb”. Bigrams, or pairs of words, would include “Mary had”, “had a”, “a little”, and “little lamb”. Using bigger n-grams in a sentiment dictionary may help improve the accuracy of sentiment analysis when handling negations.
3. Related Work and Background
In [19], a correlation between sentiment analysis using current Bitcoin tweets and future Bitcoin price fluctuations was investigated. Based solely on sentiment changes, the naive prediction model achieves 83% accuracy with very few predictions. Authors in [20] show that Twitter sentiment and message volume could predict the price fluctuations of multiple cryptocurrencies, while Twitter bot accounts could potentially spread cryptocurrency misinformation. A modified VADER algorithm classified the tweet sentiments of nine cryptocurrencies’ as buying, holding, or selling. Their experimental outcome showed that the daily intervals of Twitter sentiments and message volumes are stronger predictors than the buying to selling ratio. T. R. Li et al. [21] have attempted to demonstrate that Twitter’s sentiments help in predicting cryptocurrency price changes. They have trained an Extreme Gradient Boosting Regression tree model (XGBoost) with Twitter sentiments to predict price changes. Six hourly variables for positive, negative, neutral, unweighted, retweet weighted sentiments, and trading volume were produced from the collected datasets. In [22], The VADER sentiment analysis algorithm was used to assign each tweet a compound sentiment score based on how positive, negative, or neutral their words were. The final sentiment score factored in the number of Twitter followers, likes, and retweets associated with each tweet. The current closing price of Bitcoin, final sentiment score, and the moving average of the last 100 data points were used as input variables for the model. C. Kaplan et al. [23] researched if rumors and speculation in social media can influence cryptocurrencies and price changes. Precisely, they gauged the dependence between the unstable cryptocurrency prices on Twitter sentiments. The six cryptocurrencies chosen were Agrello, Bread, Bytecoin, Digibyte, Doge coin, and Icos. Regression analysis was performed to test the dependence of daily cryptocurrency prices on daily Twitter sentiment. Significance F and R2 values were calculated for each cryptocurrency. Bread and Bytecoin showed the lowest R2 scores, while other coins had scores above 0.22. Agrello, Bytecoin, and Icos all had prominent F scores below 0.05. They concluded that some unstable cryptocurrencies might show dependence on Twitter sentiments. Sailunaz and Alhajj [24] created user recommendations for Twitter Users or topics. They showed that analyzing the full text from tweets proved to be better than exploring full text from tweets with only nouns, adjectives, verbs, and adverbs (NAVA). Their work involved providing sentiment scores, a reply network, and a follower network from the tweets to estimate machine learning recommendations. A Naïve Bayes classifier proved to work better than a Support Vector Machine (SVM) or a Random Forest (RF) under k-fold cross-validation [25]. The sentiment scores of the full text were a minimum of 5% better than NAVA text under 3-, 5-, and 10-fold cross-validation. The best score was 66.86%, obtained from the 10-fold cross-validation of a Naïve Bayes classifier on full text. Hanjia Lyu et al. [26] characterized Twitter users who use controversial terms when mentioning COVID-19 on Twitter and trained various machine learning algorithms for classifying users.
4. A Complete Sentiment Analysis of BTC Tweets During the Era of COVID-19
This paper aims to identify modifications on the tweet text during preprocessing so that the resulting sentiment scores best correlated with Bitcoin’s closing prices. We created different ways of preprocessing text for VADER scoring and tested them on truncated and full-length tweets.
4.1. Data Collection
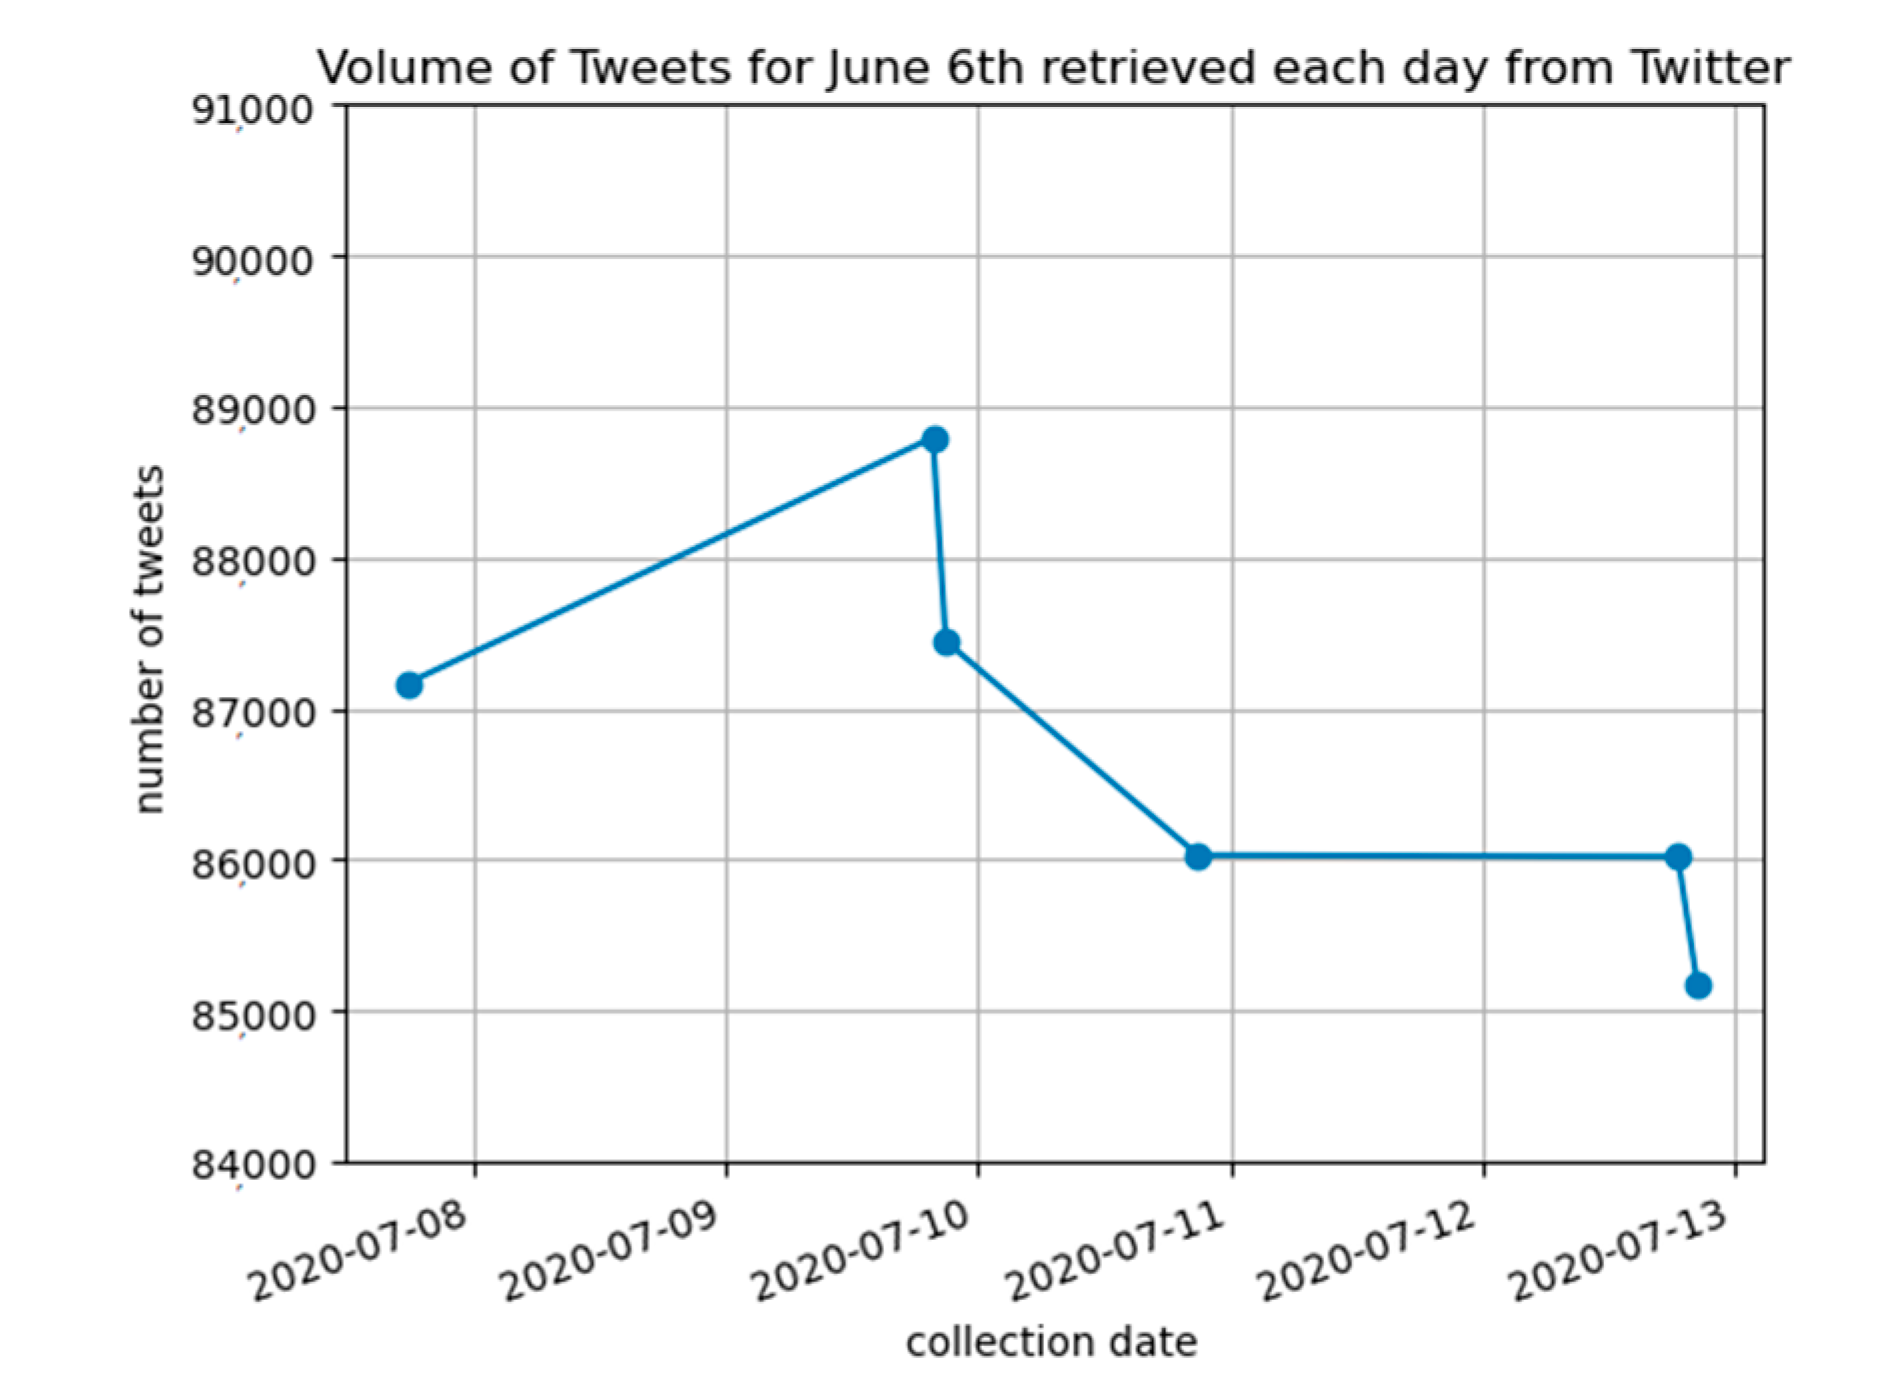
We gathered tweets for sentiment analysis by developing a custom tweet scraper using Twitter API. We chose to collect data for three main reasons manually. All existing online free datasets did not include the COVID-19 pandemic period. All web scrapers were avoided because they might bypass the restrictions of the Twitter API. These restrictions were meant to protect Twitter users. We followed twitters rules [27,28], and we coded our tweet scraper in Python using the Tweepy library to access the Twitter API [29]. In our experiments, the collection method obtained a representative set of BTC tweets during the COVID-19 period. The tweet selection involved filtering tweets by a manually chosen set of keywords. Tweets that contained any keywords related to bitcoin (“bitcoin”, “bitcoins”, “Bitcoin”, “Bitcoins”, “BTC”, “XBT”, and “satoshi”) or any hashtags of Bitcoin’s ticker symbols (“#XBT”, “$XBT”, “#BTC”, and “$BTC”) were collected. Raw tweet text and their timestamps were stored. Timestamps were provided at a temporal resolution to the nearest second. As Twitter truncates tweets over 140 characters, the full-length version of those tweets was also collected [30,31,32]. A total of 4,169,709 tweets were collected from 8:47 AM, 22 May to 11:59 PM, 10 July. The volume of tweets collected for each date was observed to vary based on how old the requested data are, as shown in Figure 1. Bitcoin prices are obtained for free from the CryptoCompare API [32]. They provide open historical data of opening, high, low, and closing prices and volume (OHLCV) information at a temporal resolution of every minute [33]. Minutely, Bitcoin data were obtained over hourly data to provide enough data points to analyze. About 71,472 min of data points was collected from 22 May to 10 July, while collecting hourly prices would have provided nearly 1191 data points. Timestamps of Bitcoin prices and OHLCV data were then stored. The recorded OHLCV data from (Cryptocompare.com) seemed to fluctuate when prices were still recent. Data were provided up to 33 h into the past (based on our tests). A bi-daily collection routine was used to replace any recent prices (near the start of the collection period) that matched timestamps with any older prices from the next collection period.
4.2. Data Preprocessing
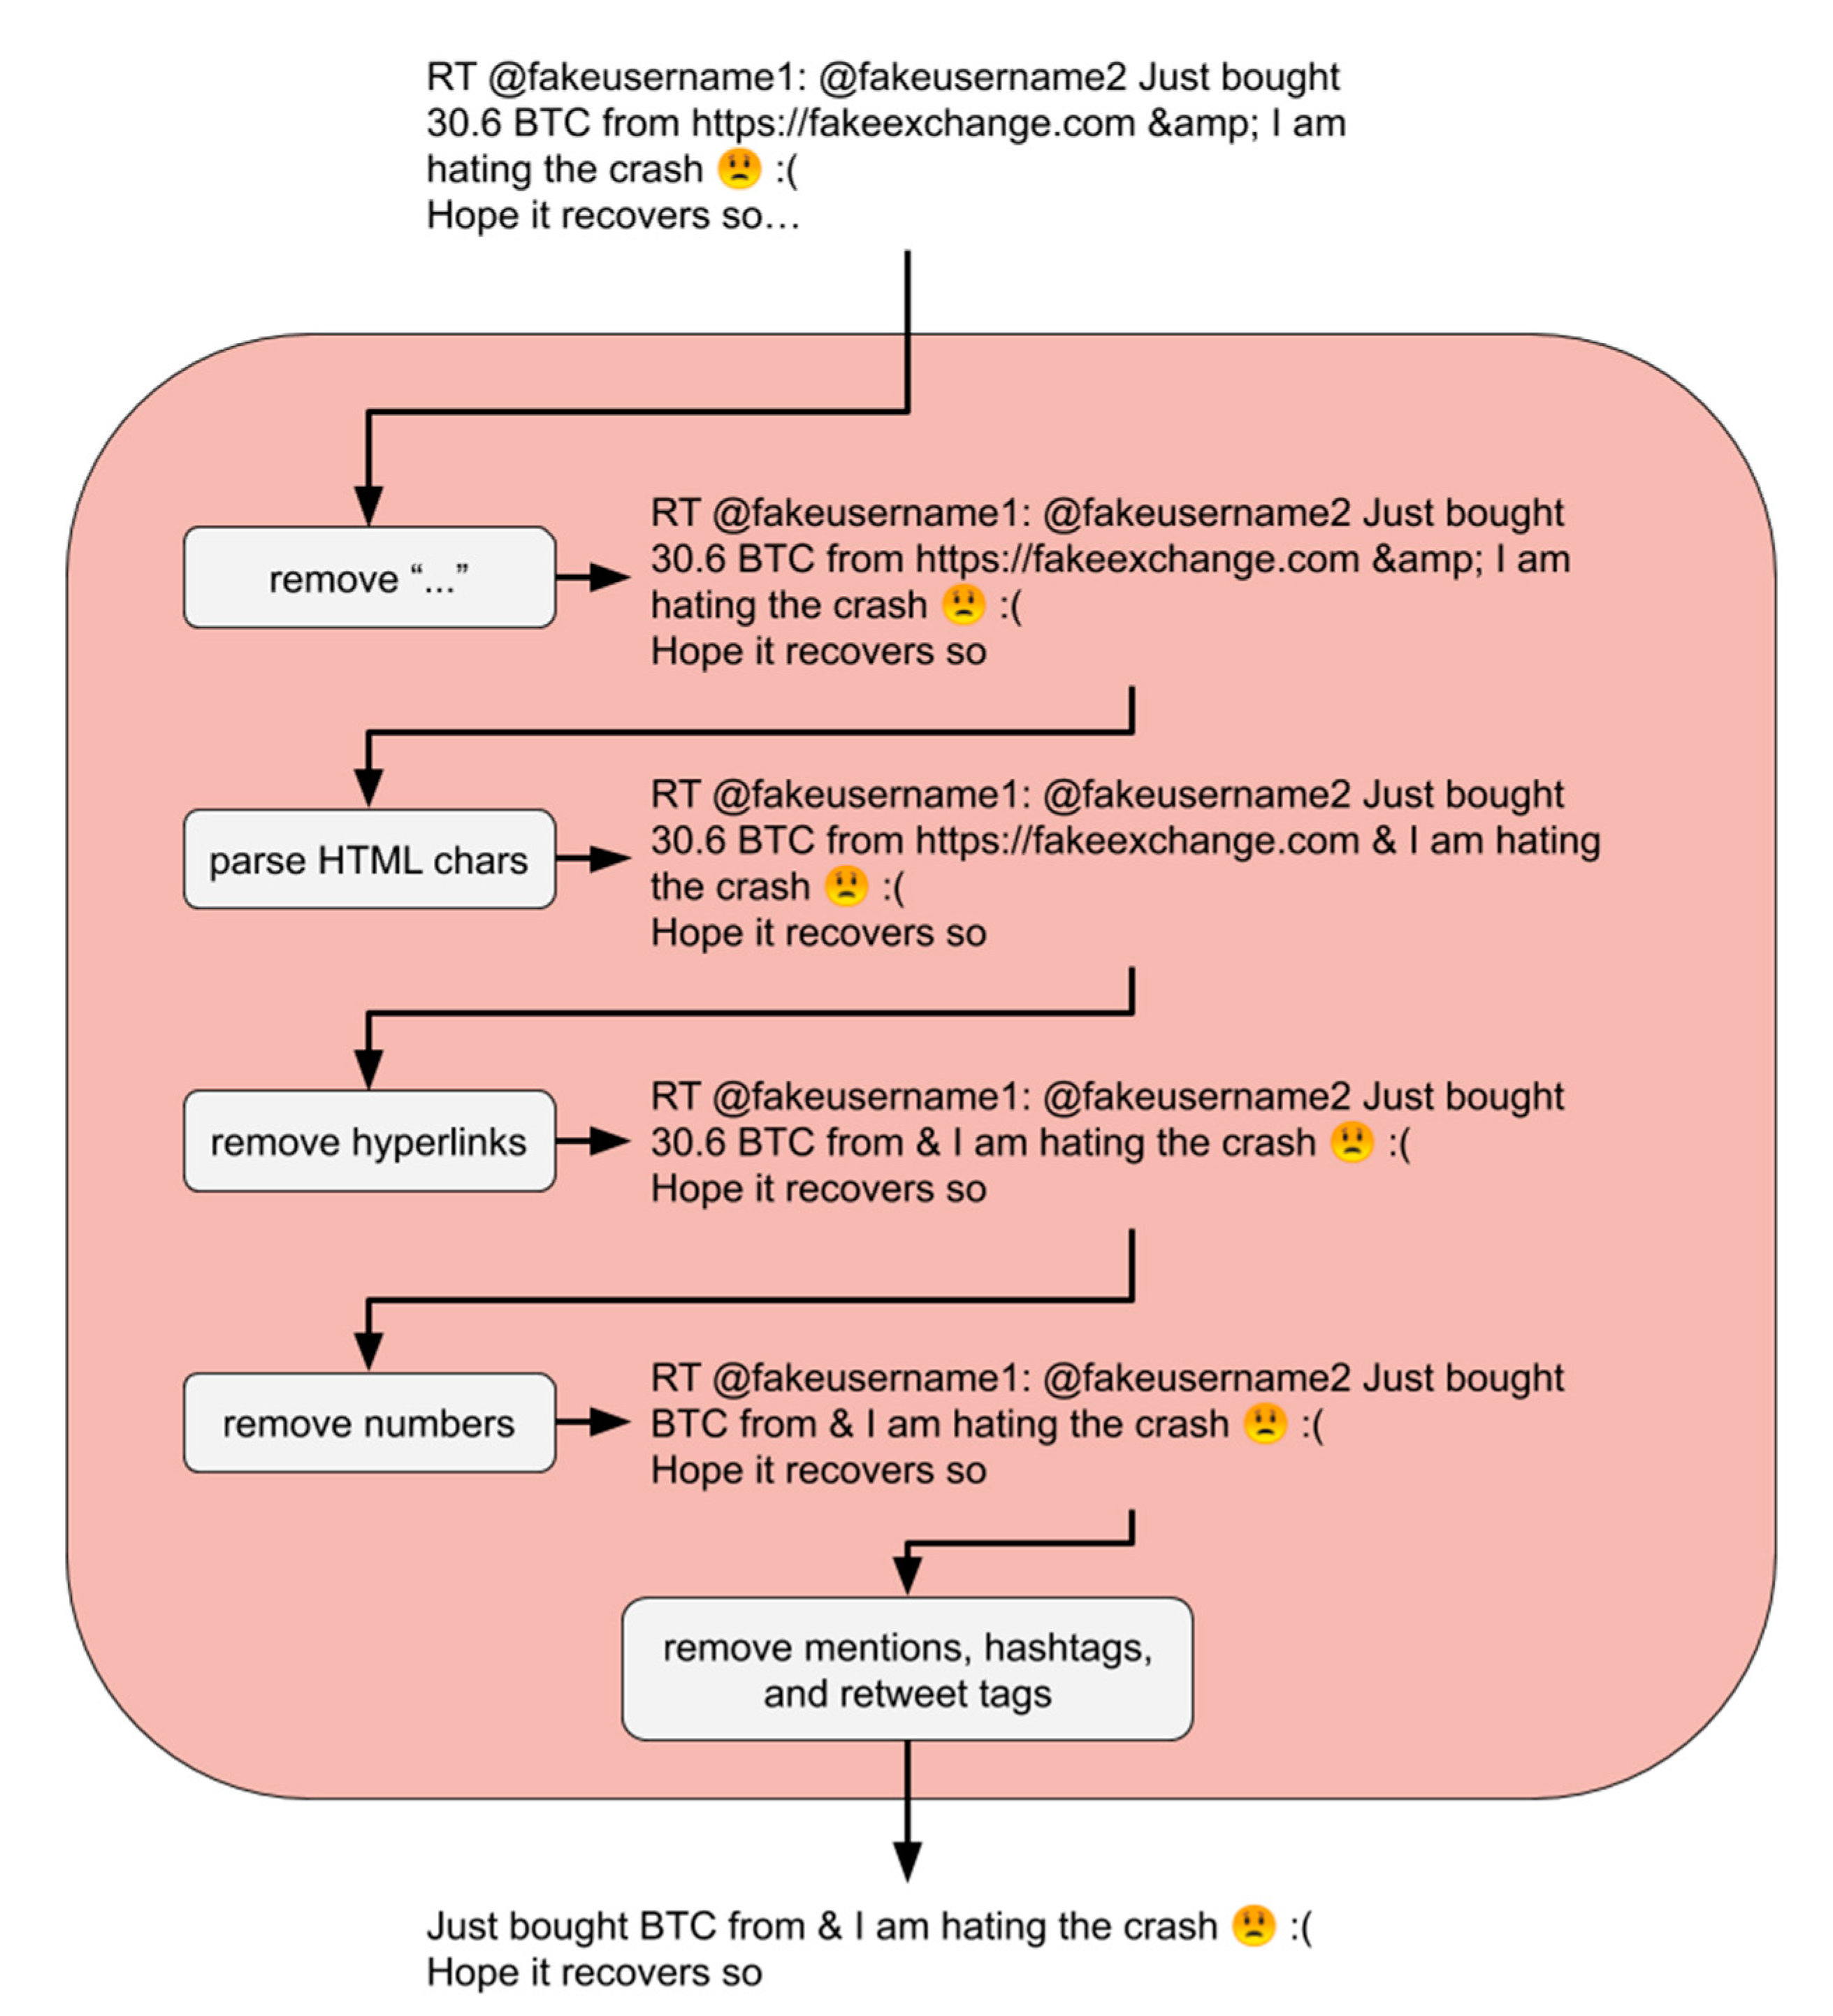
Preprocessing was performed on the text from each tweet converted into an average polarity score and tweet polarity volume per minute. This involves combining three main text cleaning functions labeled “cleaned,” “split,”, and “no sw”. Respectively, they managed the removal of tweet-specific syntax, splitting text into sentences, and removing stopwords. The “cleaned” and “split” functions were tested in different orders, with and without the presence of the “no sw” function at the end. All three preprocessing functions affected the VADER sentiment analysis of text in different ways. Each had the potential to significantly help VADER capture a different aspect of sentiment from the text. The “cleaned” function removed unwanted characters and words used specifically on Twitter’s platform, such as hyperlinks, numbers, and tweet specific syntax, using regular expressions. The removal was applied to preserve emojis and possible emoticon characters for use in the VADER sentiment analyzer. Before removing any alphanumeric chars, the ellipsis mark “…” was removed from the end of tweet text truncated to fit within 140 characters. Additionally, HTML entities such as “&” were converted to UTF-8 equivalent characters, such as “&”. Then hyperlinks starting with the characters “http” or “www.” were removed. Numbers, along with any symbols, punctuation, or units next to them, were removed. Finally, the tweet-specific syntax was removed. This syntax included mentions of usernames of the form “@username,” hashtags of the form “#hashtag” and the start of retweets of the form “RT @username.” Once the cleaning phase was completed as shown in Figure 2, each tweet was represented by words, whitespace, emojis, and other non-alphanumeric characters. Due to the difficulty of creating a regular expression to recognize all emoticons in VADER’s lexicon [34], these characters were left unchanged. Therefore, the “cleaned” text attempted to leave everything that VADER could use in sentiment analysis unchanged.
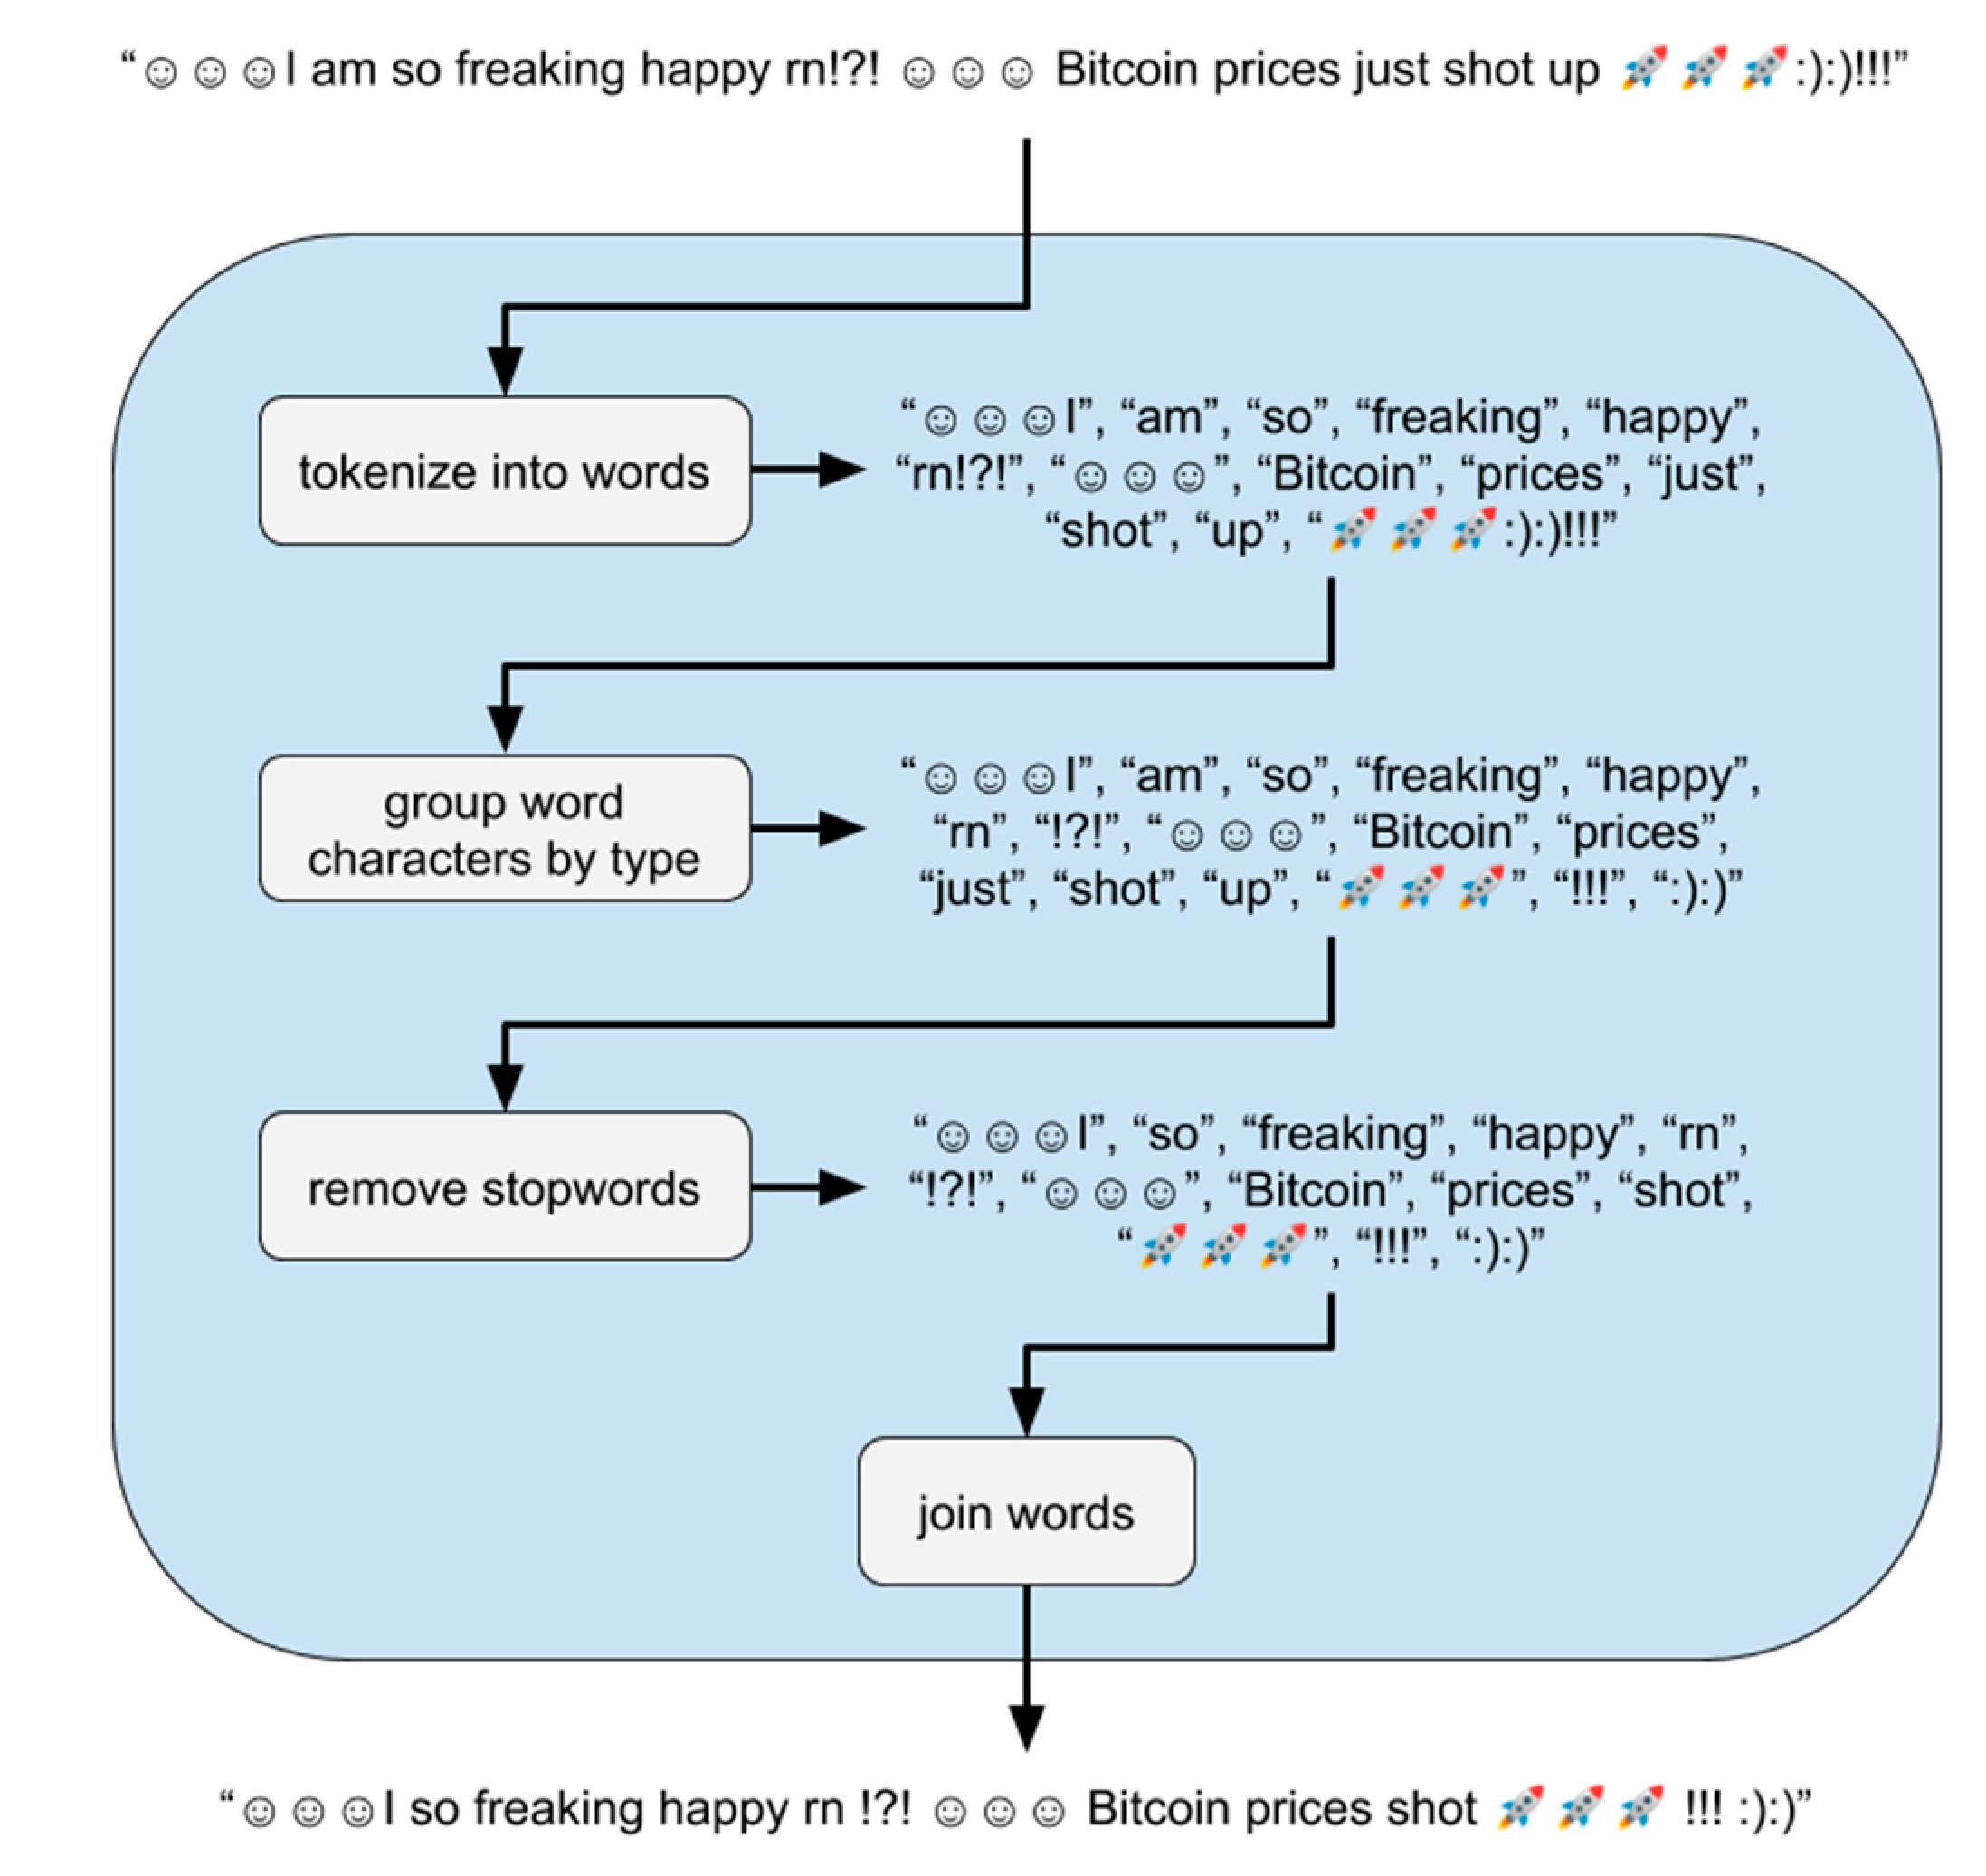
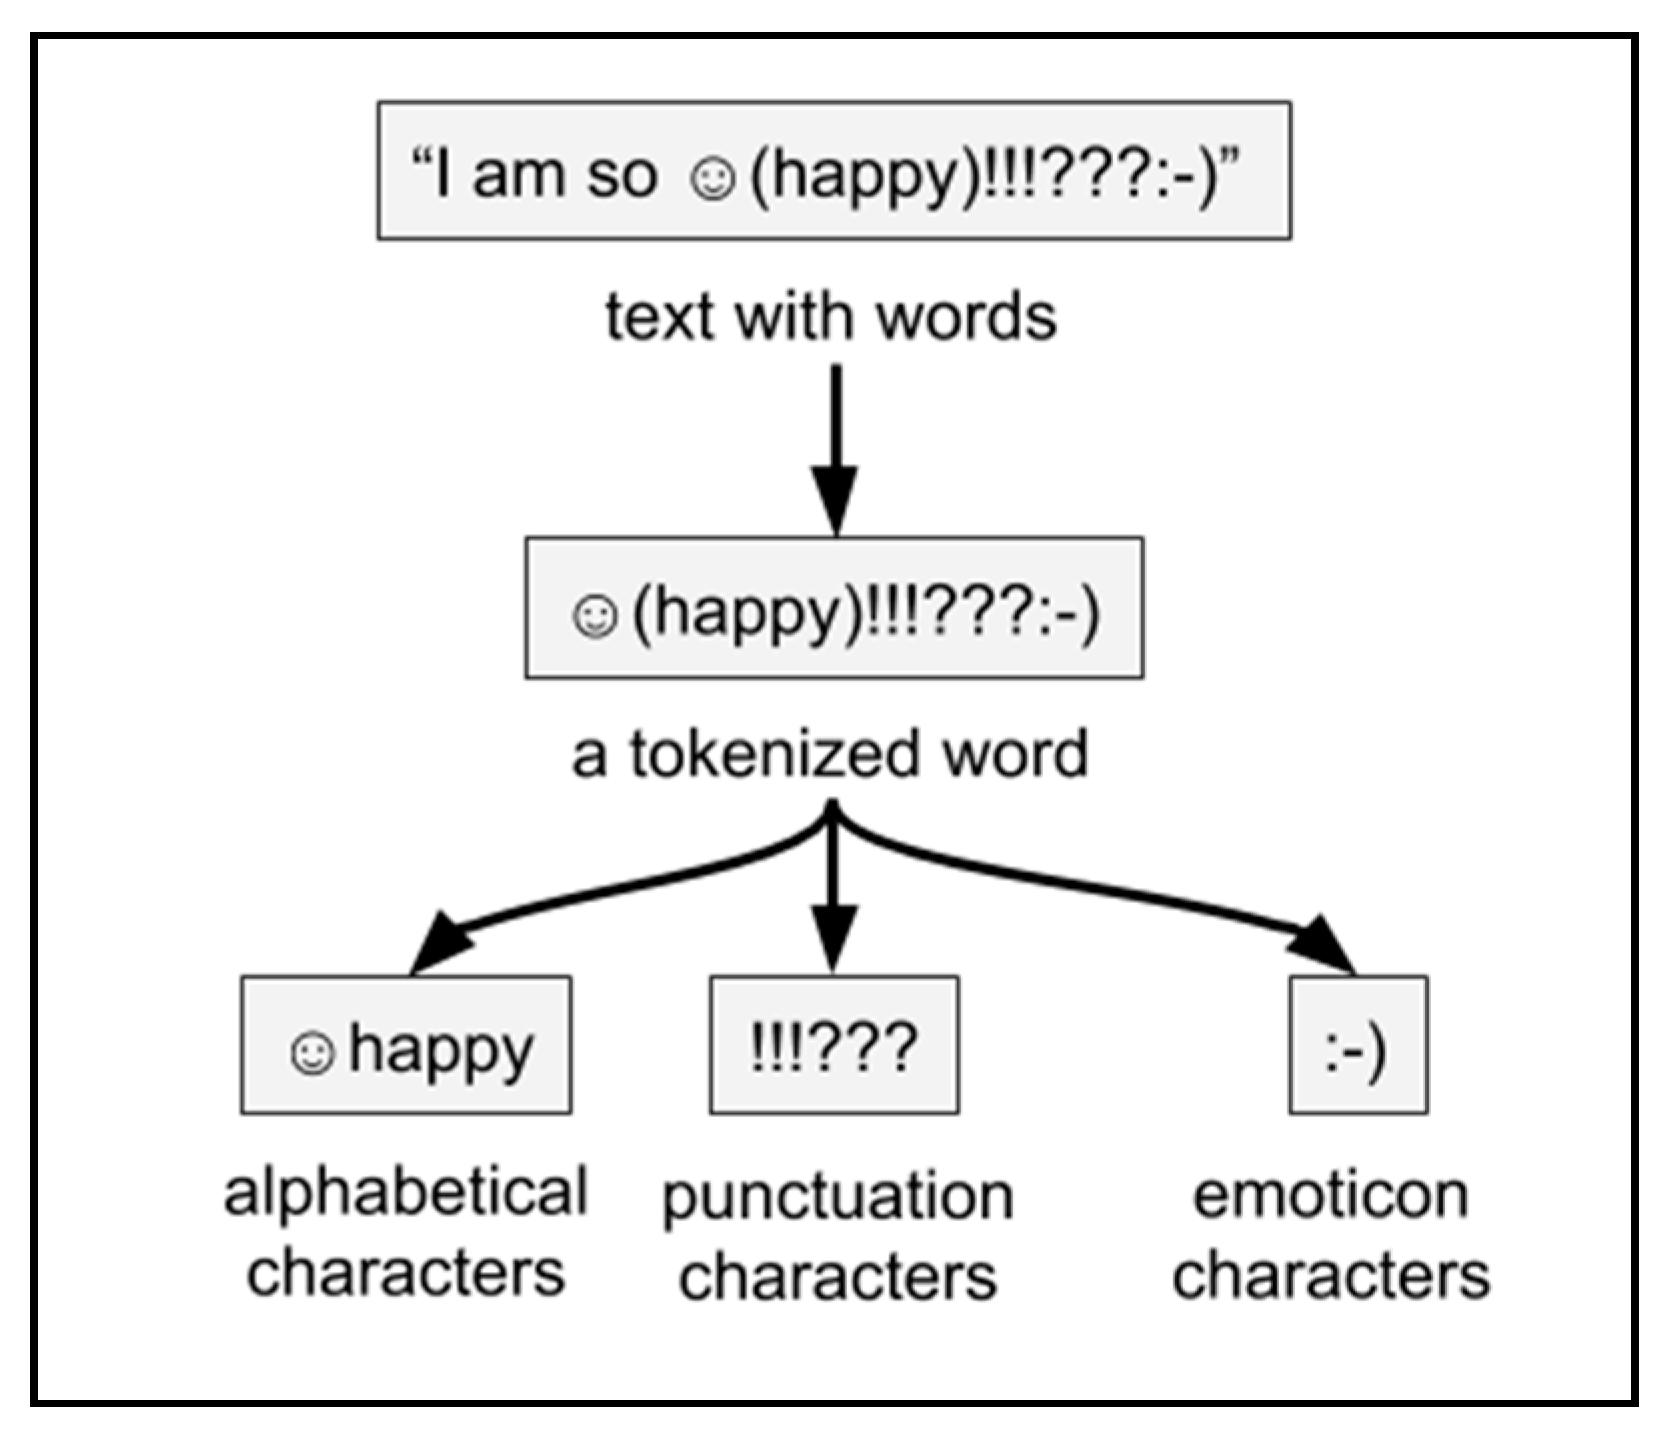
The “no sw” function in Figure 3 tokenizes text into words and removes any stopwords that VADER’s dictionary does not use. Removing stop words from text requires a tokenized text into a list of words. The tokenization of text into words involves separating continuous blocks of alphabetical characters from the rest of the text. Blocks of continuous whitespace mark our word boundaries, split by Python’s split () function [35]. Removing all non-alphabetical characters would solve this; however, this would remove some punctuation, all emojis, and all emoticons that VADER could recognize for sentiment analysis [36]. VADER allows exclamation marks ”!” and question marks ”?”, which affect the sentiment score [36]. Our tokenization algorithm, as shown in Figure 4, groups characters from every tokenized word into “alphabetical”, “punctuation”, or “emoticon” blocks of characters. Ideally, these three blocks of characters would allow VADER to join each of them to preserve most of the text VADER can recognize. To distinguish punctuation from emoticons, any characters in the set $=@&_*#>:`\</{})]|%;~-,([+^” are only part of an emoticon if they occur next to another character in the same set.
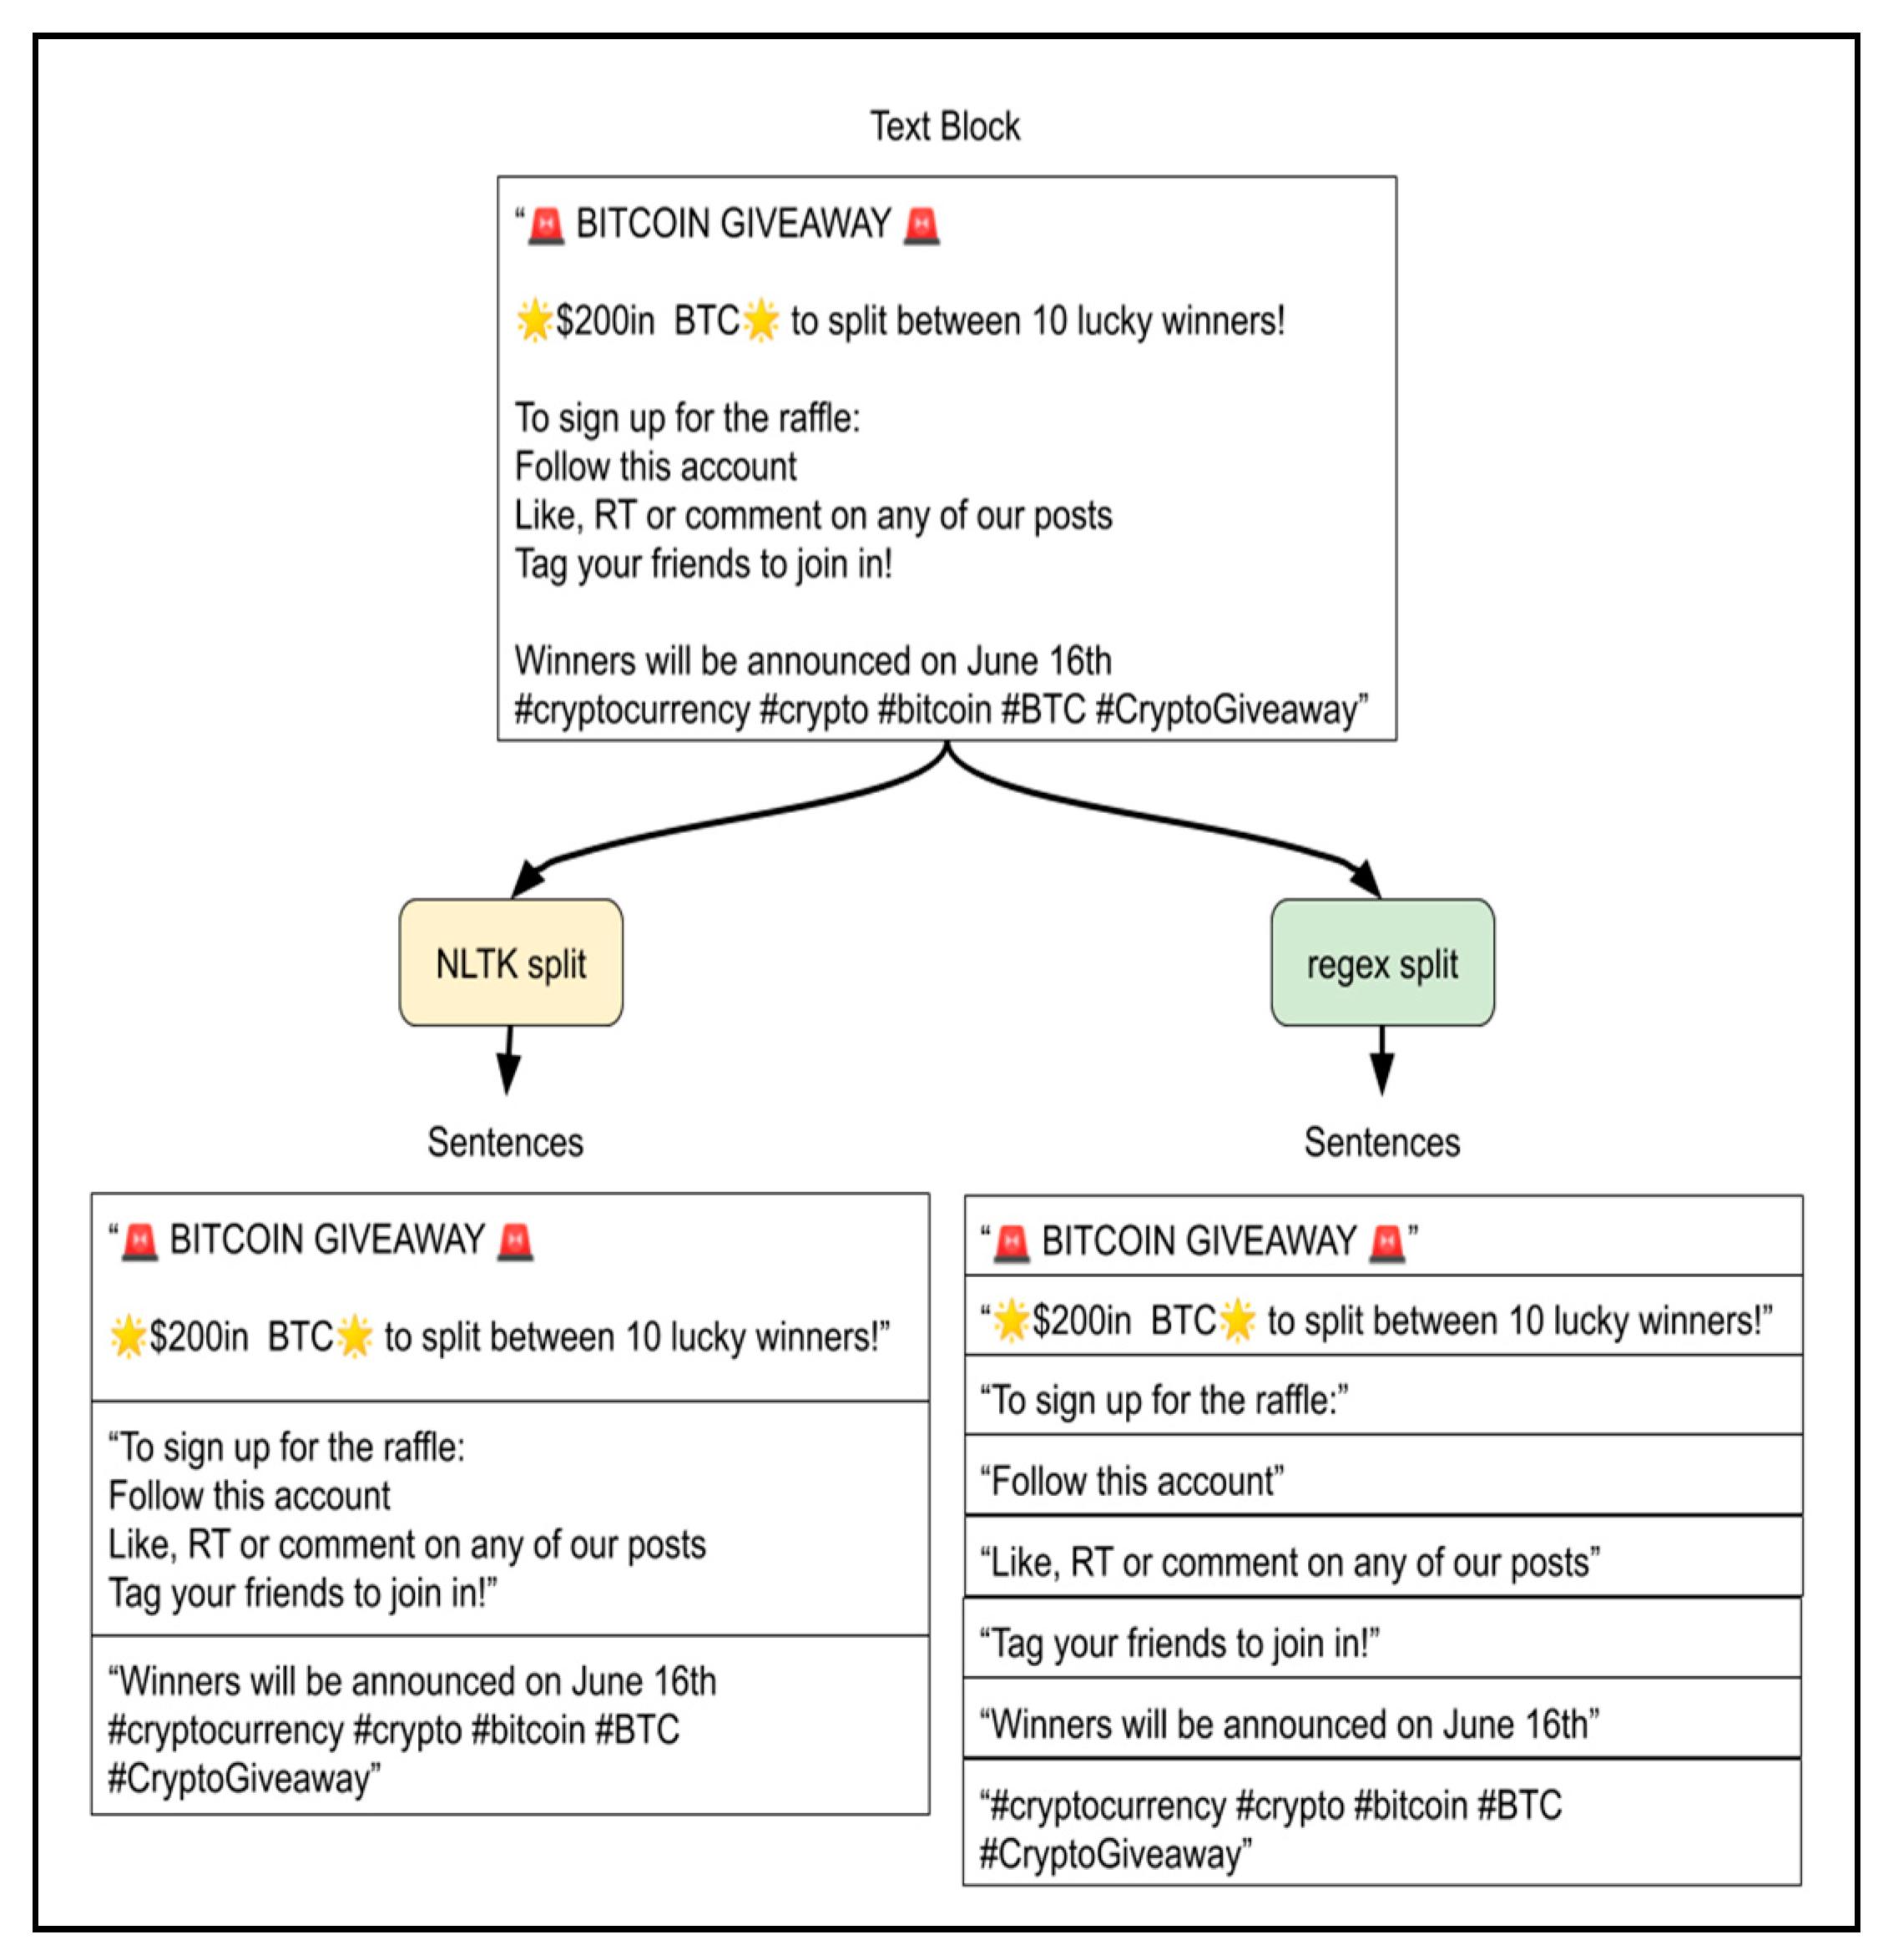
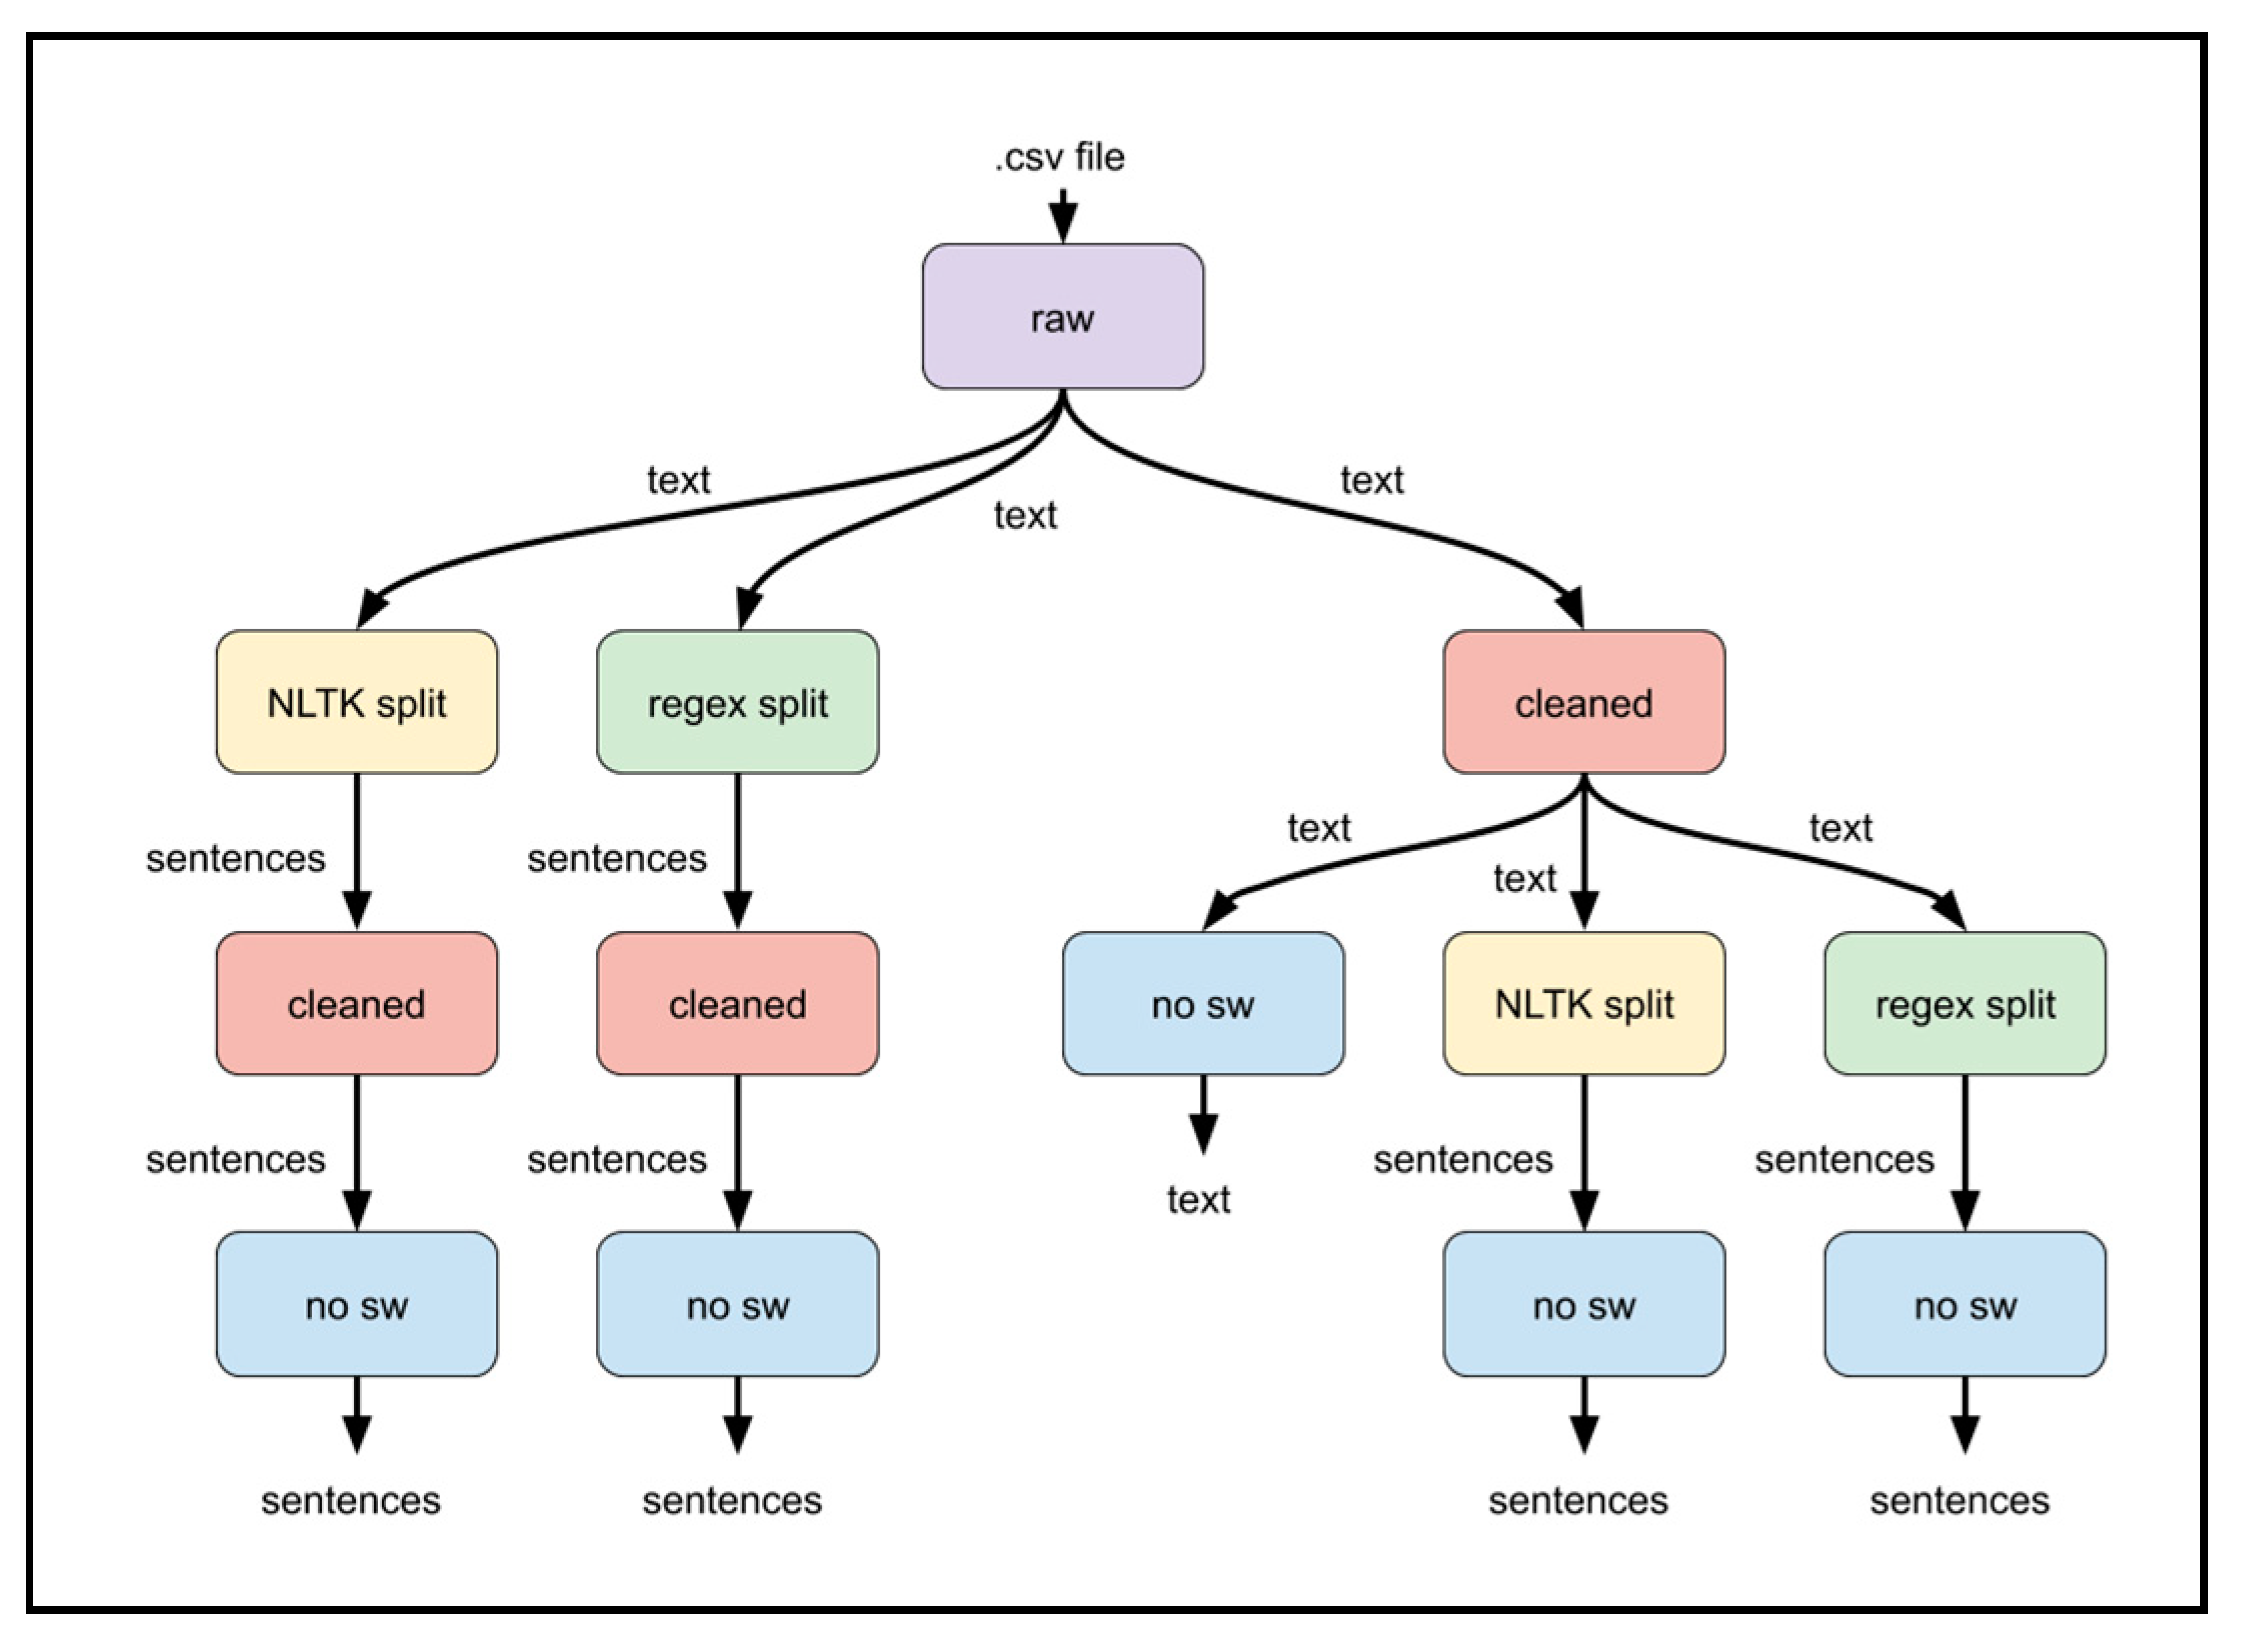
To determine whether certain preprocessing functions contribute to predicting Bitcoin prices, the output of those functions in various combinations was scored by VADER. All text cleaning functions of the preprocessing stage were combined in 5 different pathways. Scores of the text at intermediate steps of each path were recorded to determine if a function offers any improvement to the results. The “cleaned”, “NLTK split”, “regex split”, and “no sw” functions shown in Figure 5 were combined to provide five different pathways. The “no sw” function was treated as the last step in any path, as no other function required word tokenization. Since VADER can be applied to a text of any length, the “cleaned”, “NLTK split”, and “regex split” functions produced a text of varying length. The “cleaned” and “split” functions were interchanged in different pathways. Both “split”, “cleaned”, and a “no sw” functions were applied afterward. The “cleaned” function can have either a “split” function used before the “no sw” stage. Our preprocessing combinations measured the scores of 13 intermediate steps (from 5 different pathways), as shown in Figure 6. The text tweets and the preprocessed dataset are available for access and download in [37].
4.3. VADER Sentiment and BTC Prices
This section uses the Pearson correlation between the VADER scores of each of the 13 intermediate preprocessing steps over time with BTC’s closing prices per minute. As tweets are created much more frequently than once a minute, we aggregated all tweets’ scores into a per-minute feature in two ways. First, we averaged the negative, neutral, positive, and compound scores of all tweets within each minute. This strategy allows us to preserve VADER’s scoring property of the sentiment polarity scores summing to about 1. The second approach involves counting the number (or volume) of tweets that fit an overall sentiment polarity class. Each tweet can be classified as having an overall negative, neutral, or positive sentiment polarity based on its compound sentiment score. We consider any text with a compound VADER sentiment score below −0.05 as having an overall negative polarity, above 0.05, as having an overall positive polarity. Other scores have an overall neutral polarity. This produces 4 VADER sentiment score features and four sentiment volume features [13].
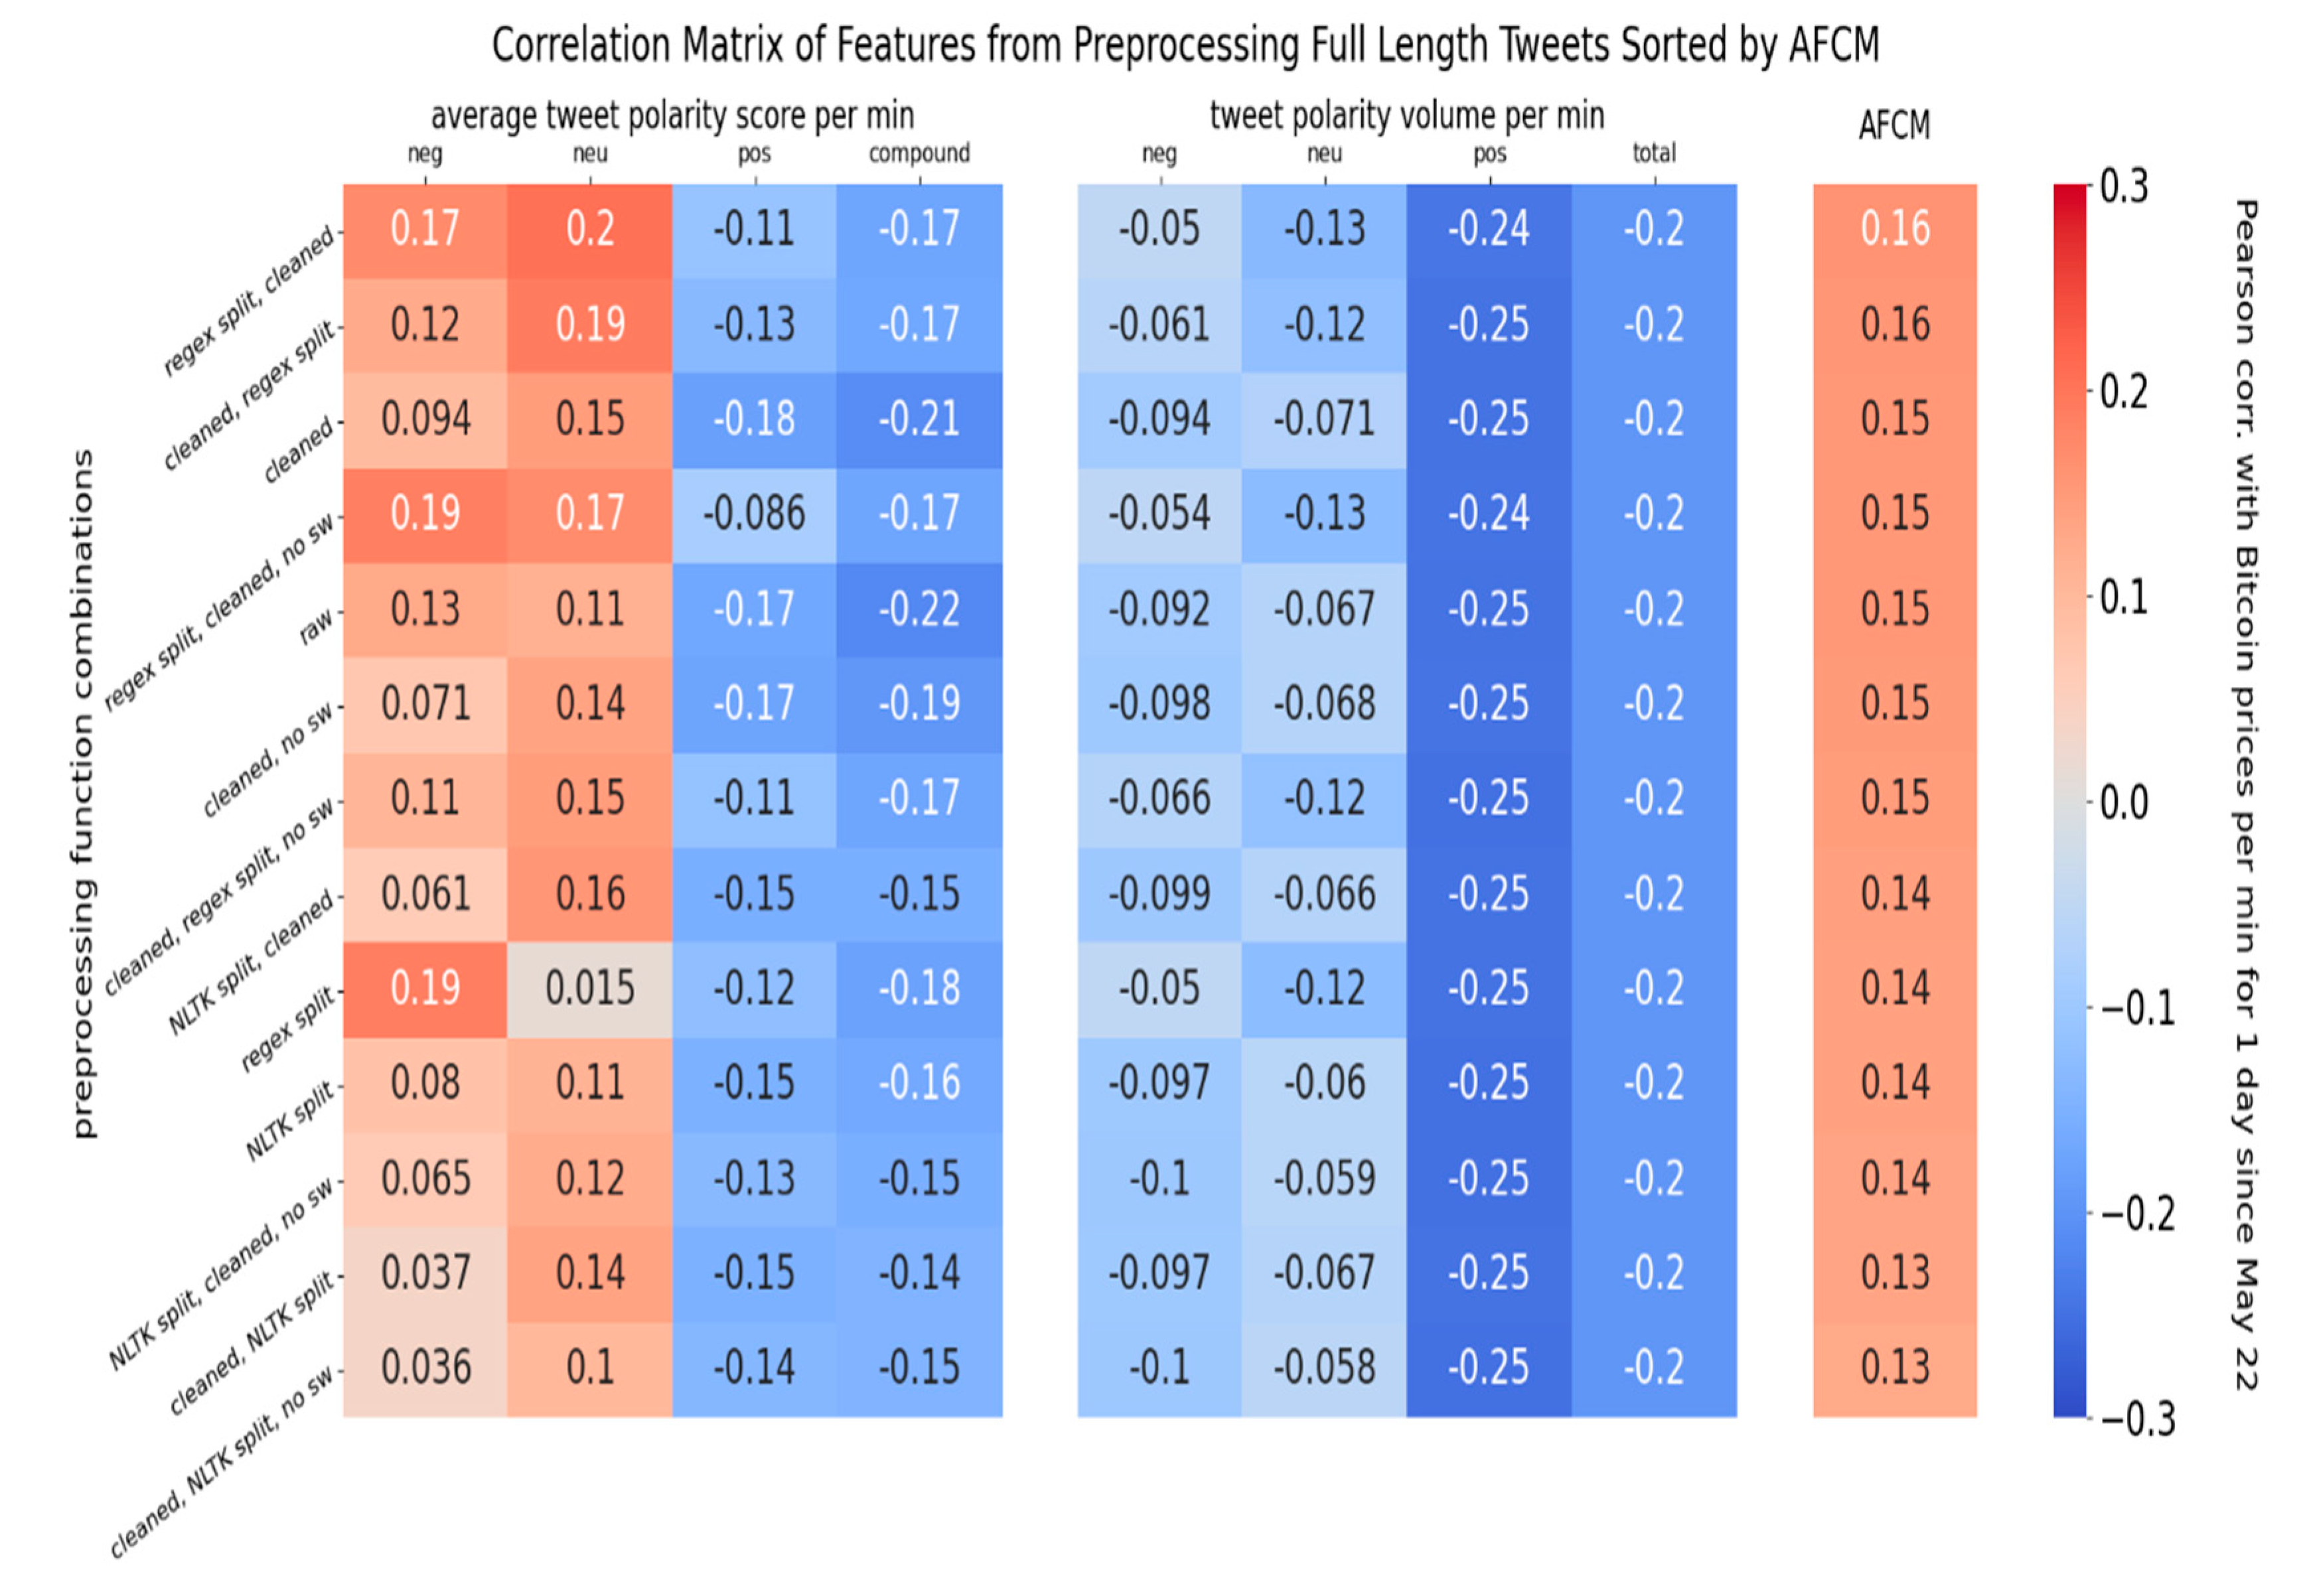
Since there were eight different features obtained for each of the 13 intermediate preprocessing steps over the whole dataset, the Bitcoin prices per minute were correlated against 104 unique time series of numbers. The resulting Pearson correlation score for each time series is displayed in a 13 × 8 heatmap matrix, as shown in Figure 7. This correlation matrix represents the Pearson correlation values of all types of time-series with Bitcoin prices. Each time-series was constructed from the full length of tweet text posted between 22 May, 8:47 AM, and 23 May, 8:47 AM. To rank the effectiveness of different preprocessing strategies, an overall correlation value, the Average Feature Correlation Magnitude (AFCM), was constructed for each matrix row. For each strategy, the correlation values of all eight features are averaged by their absolute value to produce a single value in the rightmost column. While a few patterns can be seen from the matrix, they can change if a shorter time length of data or a different time series start date is used. We improve the correlation matrix by graphing correlation over different dataset lengths in the next section.
4.4. Feature Types and Correlation
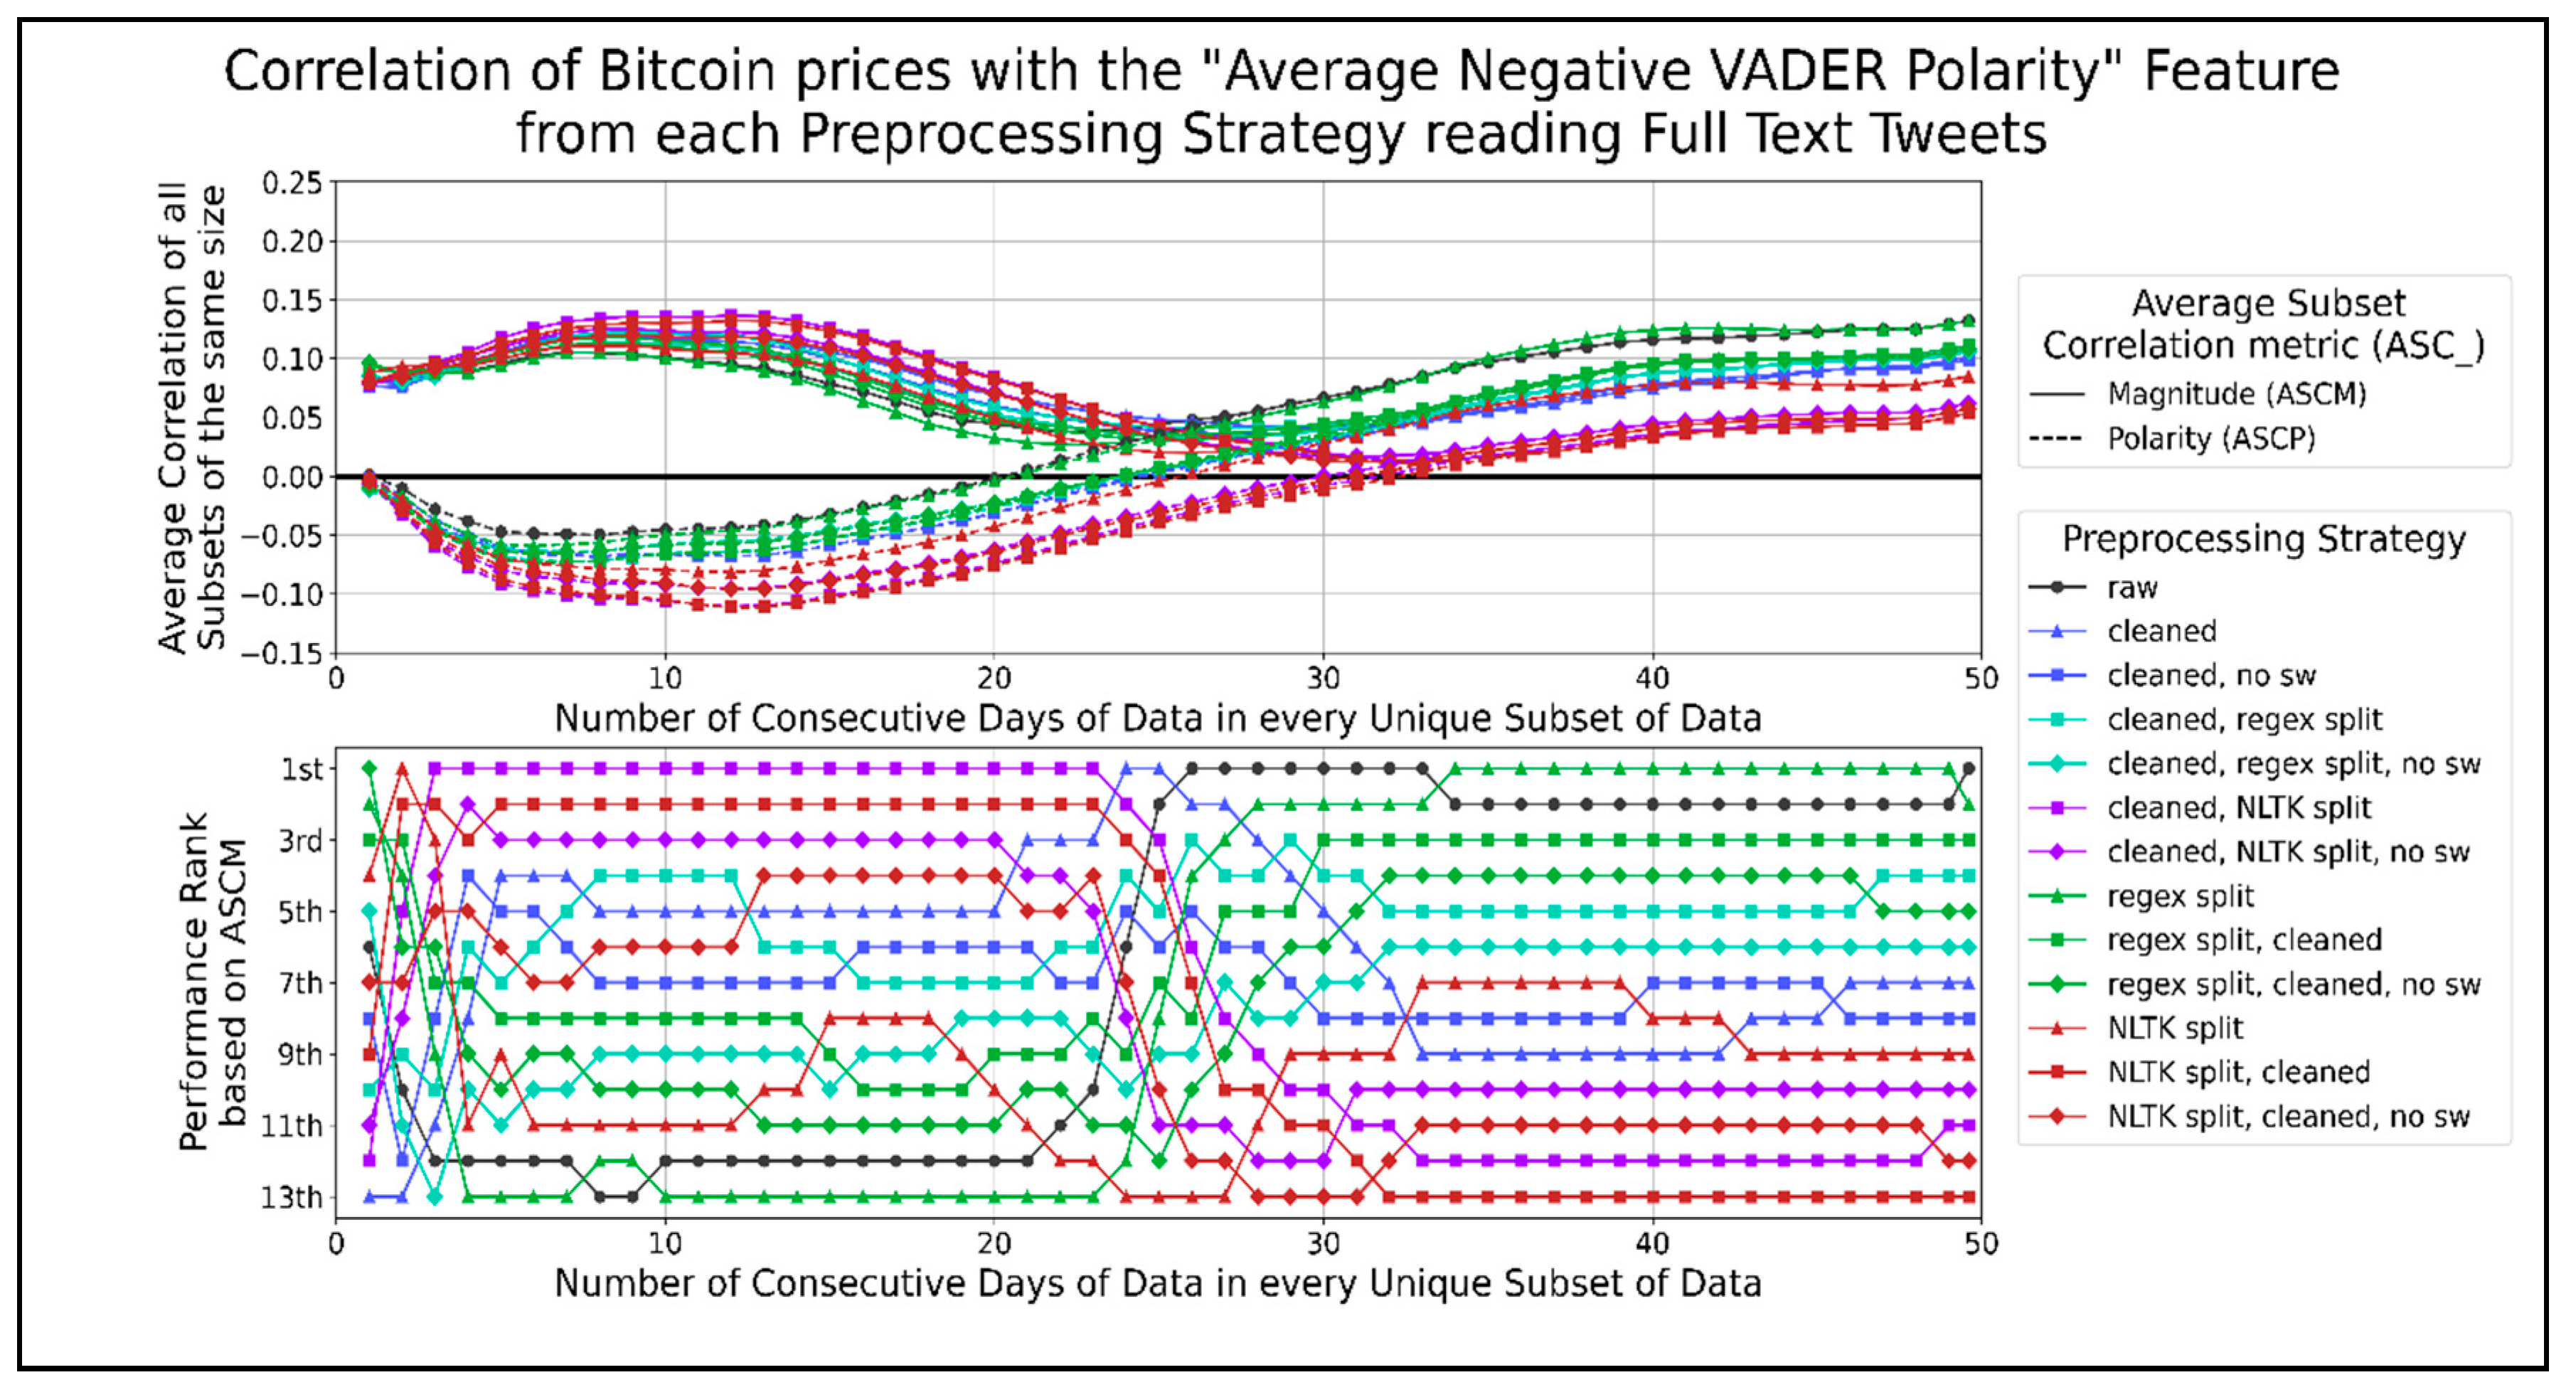
To account for differences in correlation due to the time length of the data used, we used subsets of data. The number of consecutive days of data varied and correlated with the respective Bitcoin prices occurring with the same timestamp. We will refer to this value as the correlation value of the subset. There are multiple unique subsets of data that span the same number of days. For example, a subset of 3 days of data can start on 22 May, 23 May, 24 May… 5 July, 6 July, and 7 July. Therefore, we averaged the correlation values from all unique subsets of data with the same length and differing start dates. The resultant value is independent of its start date (as much as it can be with a finite time length of collected data). Averaging the correlation values of all same-length subsets with different start dates should show us any correlation polarity (positive or negative) that a majority of subsets show. This is known as the Average Subset Correlation Polarity (ASCP, dashed line in figures). The correlation value could be positive, negative, or averaging; thus, we might hide how large the correlation values were and make the ASCP approach zero. To mitigate this effect, we can also average the absolute correlation values of all same-length subsets with different start dates to show the magnitude or strength of the correlation values. This is known as the Average Subset Correlation Magnitude (ASCM, solid line in all figures). The ASCP and ASCM are plotted as line graphs against the length of data in all subsets. The following eight figures show the ASCP and ASCM for common features produced from all 13 preprocessing strategies. A performance ranking scheme graph is included in those figures to rank each strategy from best to worst using the ASCM, for all subset data lengths. The 1st rank corresponds to the best performance and largest ASCM, while the 13th rank corresponds to the worst performance and smallest ASCM. The Pearson correlation average might not be a good representation of correlation magnitude if both positive and negative correlation values are averaged. Therefore, another experimental analysis using the absolute correlation value showing the average correlation magnitude per timespan length was conducted. For a total of 49.6 days of data, we measured all possible subset outcomes, and then we spanned contiguous days of data. Any subsets with the same timespan length and differing start dates had their outcomes averaged. This produced a time-series of correlation values for each of the cells in our correlation matrix.
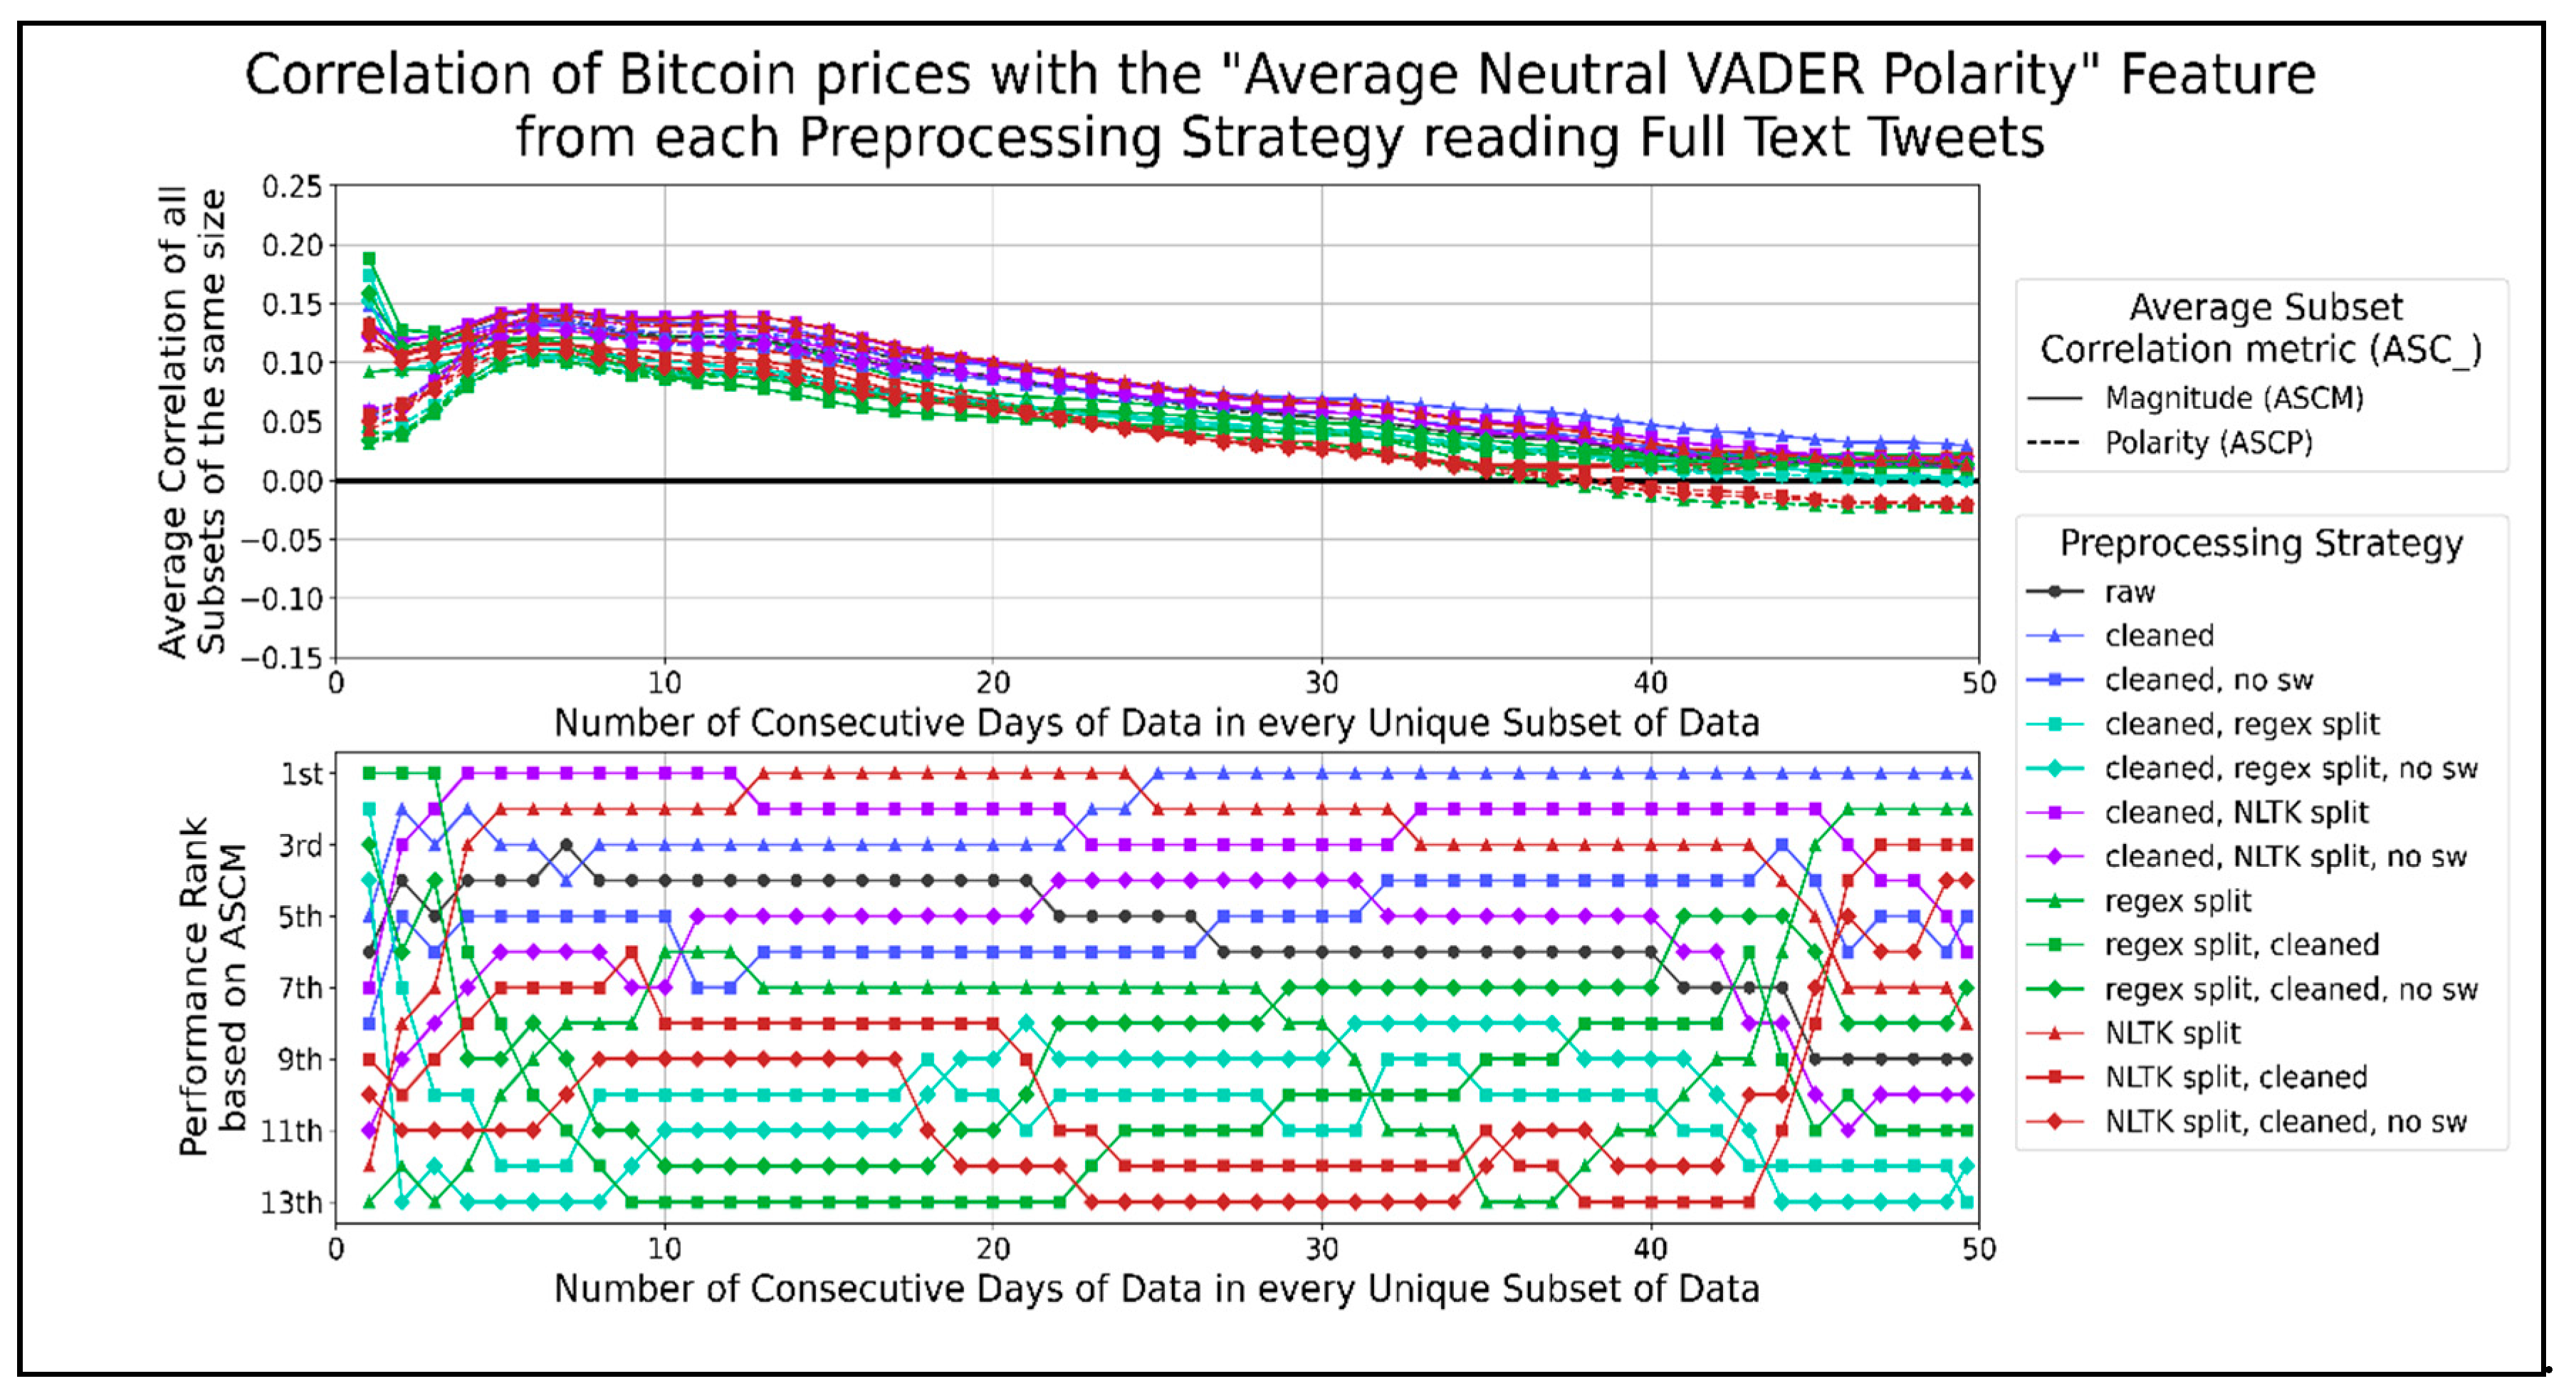
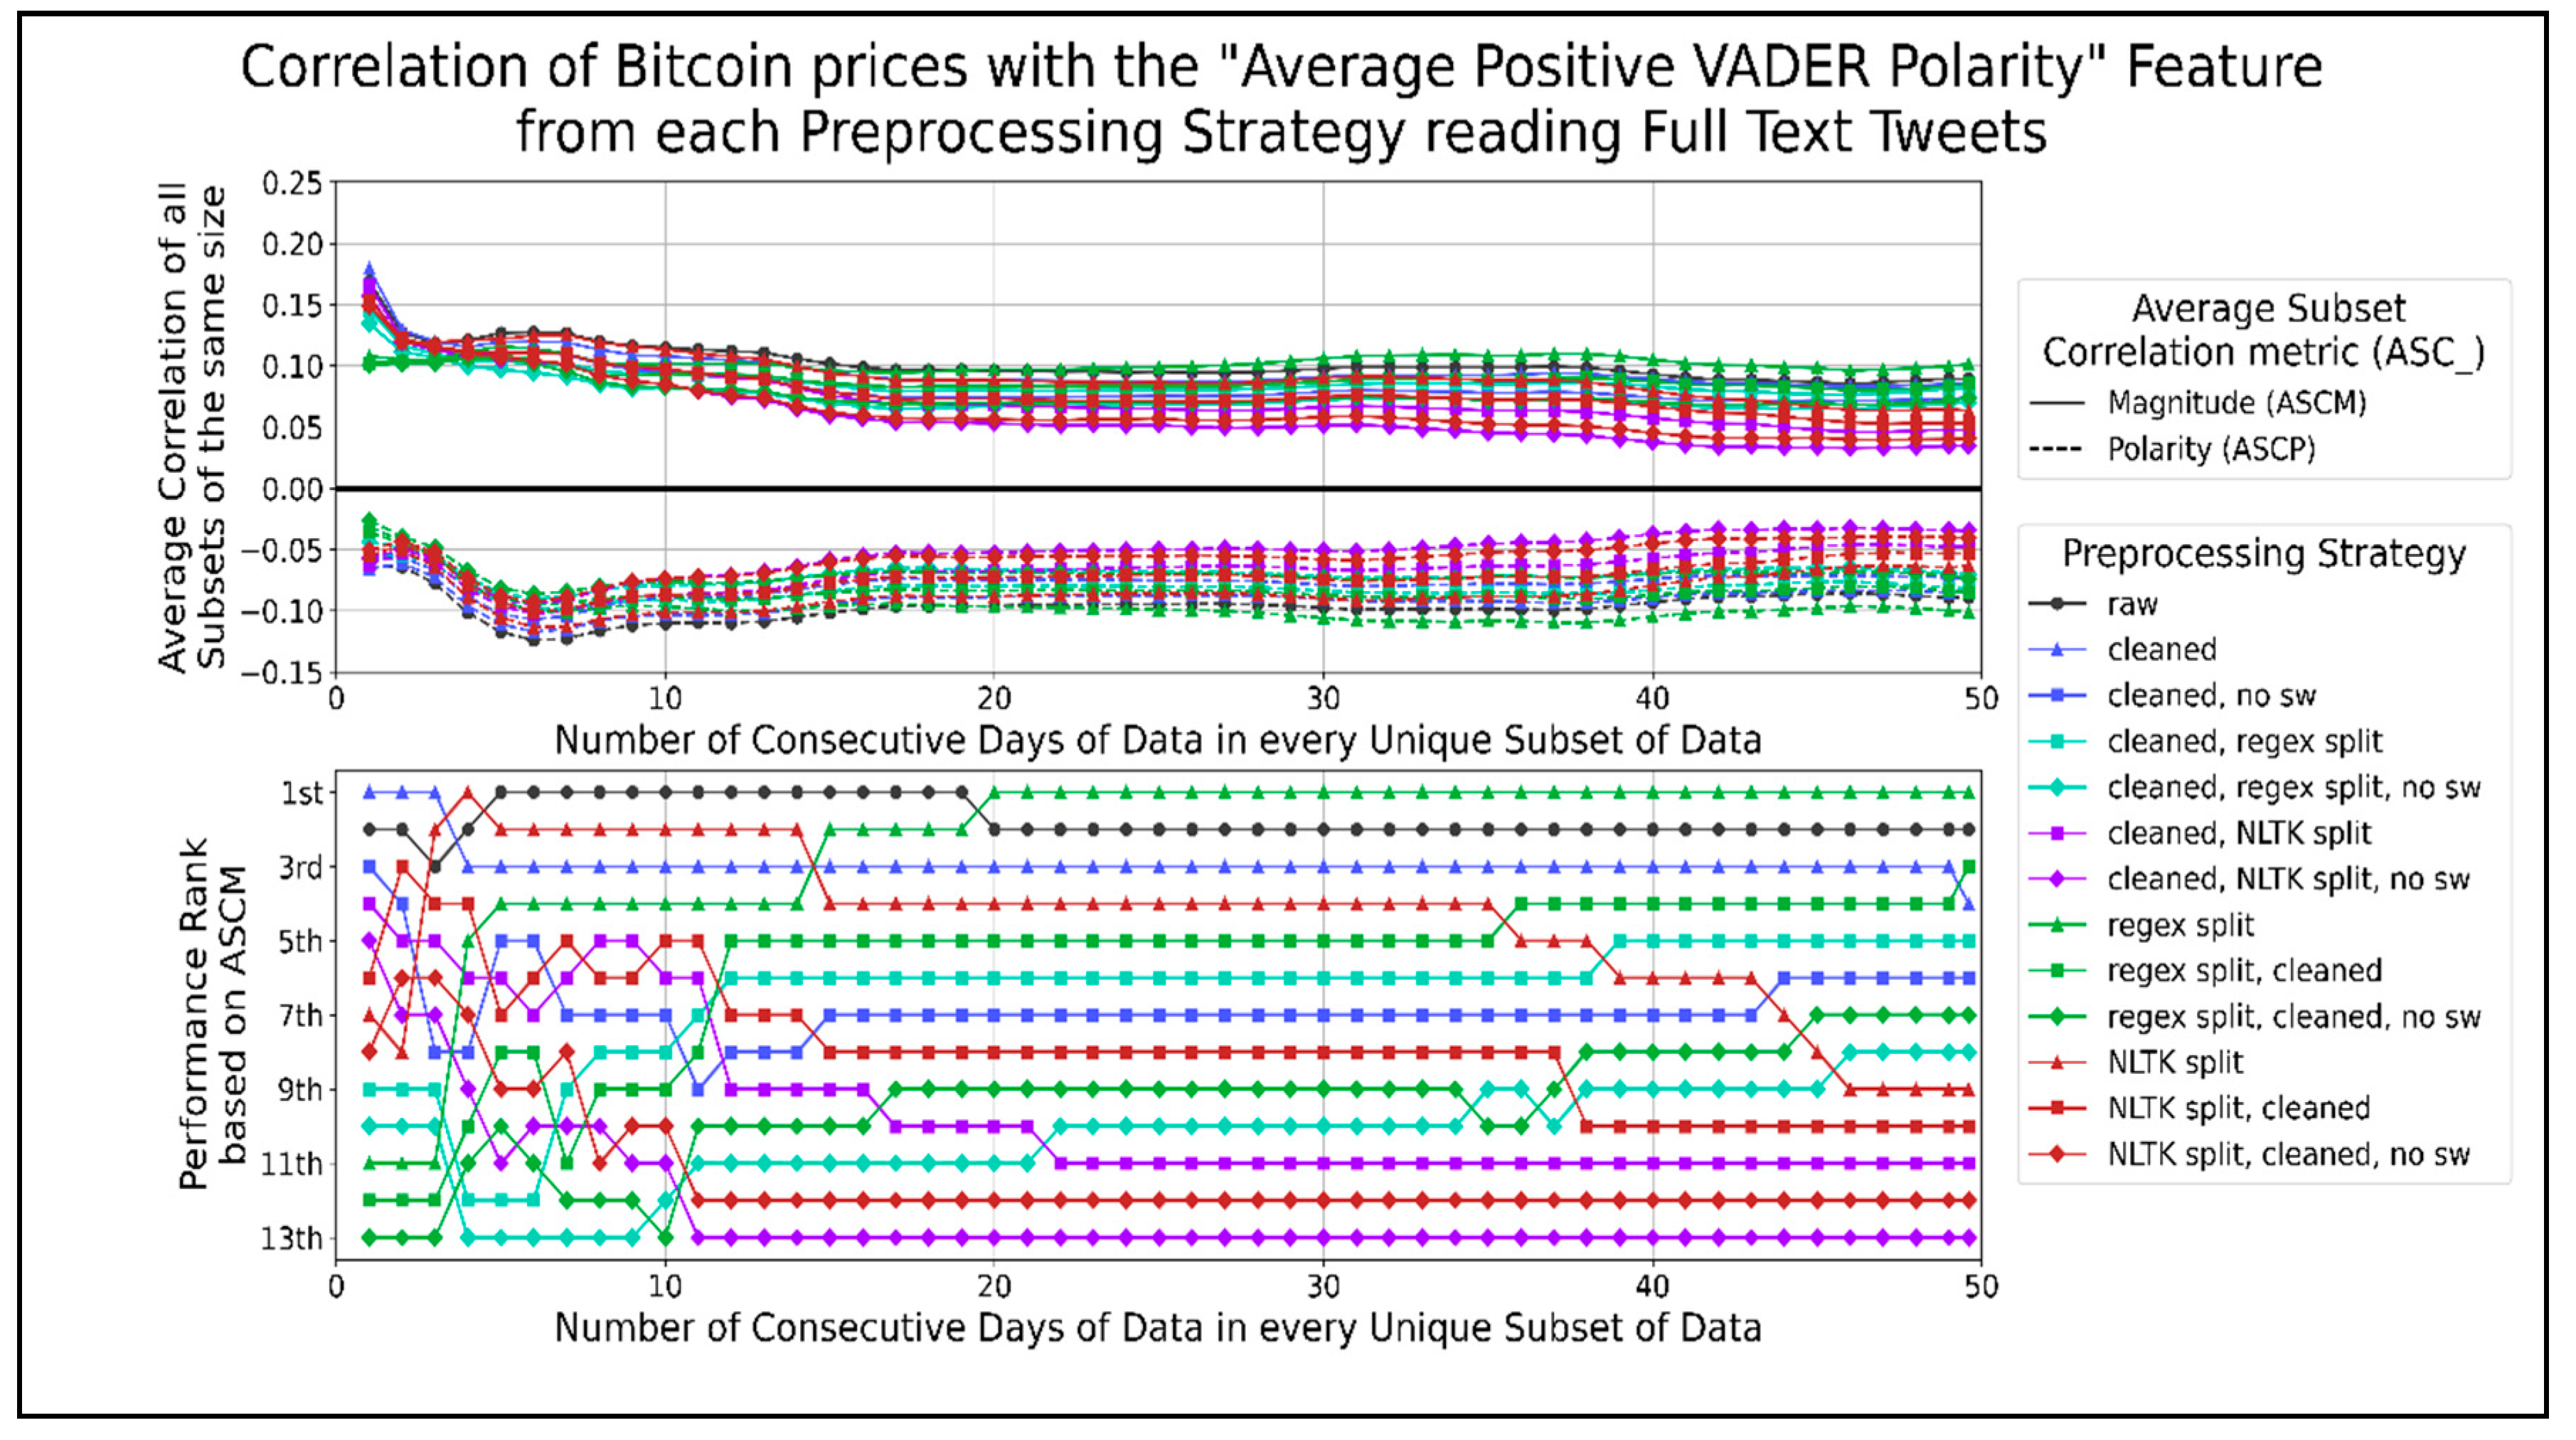
We graphed the correlation time-series for all preprocessing strategies that share the same aggregation score type in the same figure to display this data. Figure 8 shows the trends for the correlation of average negative VADER sentiment with Bitcoin prices for different data timespans. Most preprocessing strategies performed better than raw text when using less than 20 days of data and show a negative ASCP. The top-performing strategies involve cleaning and splitting sentences using the NLTK library in any order before removing their stopwords. A general pattern of combining text cleaning and sentence splitting in any order had a higher correlation than removing stopwords from those combinations. Splitting sentences without being combined with other functions performed worse than the latter two combinations. However, this trend was reversed when using more than 20 days of data, as a positive ASCP developed. Splitting sentences on their own performed better than removing stopwords from any order of cleaned sentence splitting, which served better than any order of cleaned sentence splitting. Few preprocessing strategies performed consistently better than raw text, such as splitting sentences using a regex when using 35 to 45 days of data. Thus, the correlation of average negative VADER sentiments per minute showed opposite trends for datasets of different time lengths. The effectiveness of using any preprocessing strategy over raw text decreased as more days of data were used. Cleaning and splitting text in any order on 20 days of data or less seemed to work best, while splitting raw text into sentences using regexes worked best on more extended datasets. The most significant dip in the ASCP of −0.105 occurred when correlating 8 to 15 days of data. The largest peak in the ASCP of 0.123 occurred when correlating about 40 to 49.6 days of data. Figure 9 shows the correlation of average neutral VADER sentiment with Bitcoin prices over different data timespans. The only preprocessing strategies that consistently performed better than using raw text were cleaning text, splitting text into sentences with the NLTK library, and splitting sentences using NLTK after cleaning text. In general, combining NLTK split sentences with cleaning in any order reduced its ASCM, and removing stopwords from them reduced it further. Similarly, eliminating stopwords from cleaned text reduced its ASCM. The best performing preprocessing strategies for the average VADER neutral score per minute do not involve regex splitting or removing stopwords. The highest peak in both ASCP and ASCM for all strategies occurred when using about 6 to 13 days of data, excluding the rise for one day of data. This range showed a positive correlation of about 0.135. Figure 10 shows the correlation between average positive VADER sentiment with Bitcoin prices. Cleaning text outperformed when using 1 or 2 days of data. Splitting sentences by using a regex performed better when using more than 20 days of data. A general pattern of combining text splitting functions with cleaning reduced their ASCM, and removing stop words reduced them further. This indicates that the best performing preprocessing strategies for the average positive VADER sentiment per minute is raw text, followed by single functions (cleaning or sentence splitting on their own). The largest negative peaks in ASCP, of −0.12 and −0.10, occurred when using about 5 to 8 and 31 to 38 days of data, respectively.
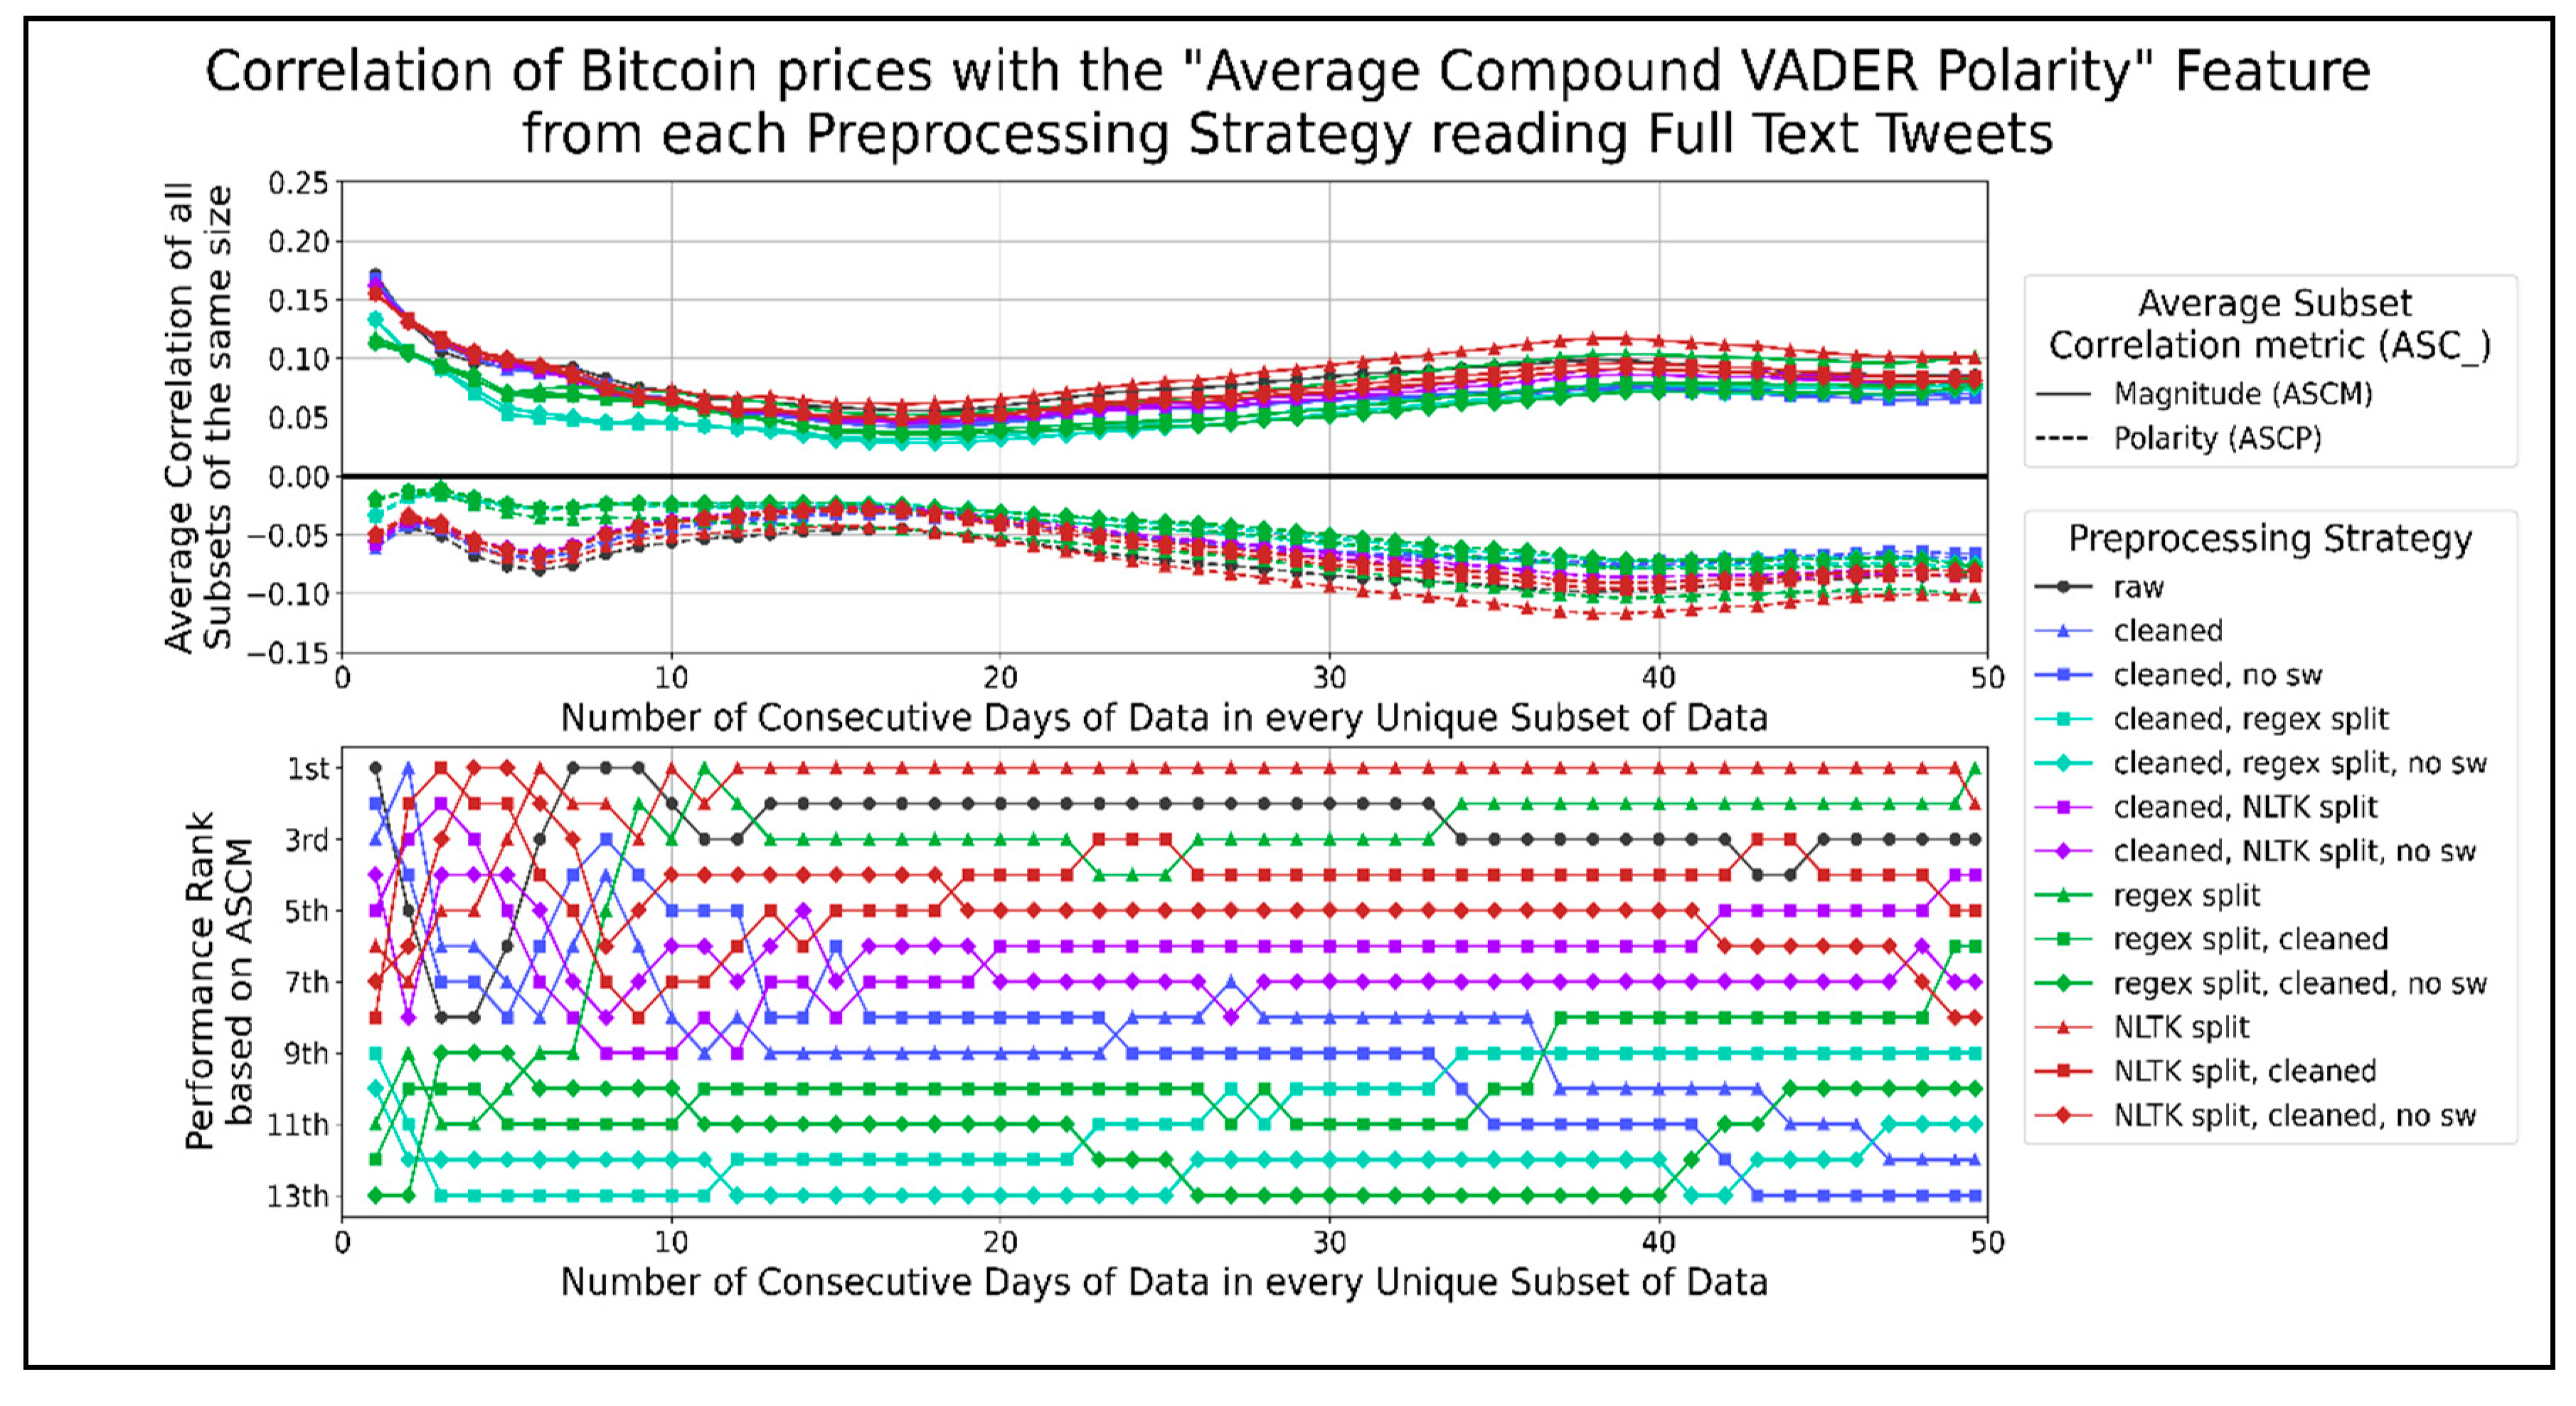
Figure 11 shows correlation graphs of the average compound VADER sentiment at different timespans for the Bitcoin prices. No preprocessing strategies have a consistently higher ASCM than raw text. However, a few preprocessing strategies perform well for a few data subset lengths. Cleaned text, splitting sentences using the NLTK library, and splitting sentences using a regex performed better than using raw text when 1, 19, or more, and 34 or more data days were correlated. In Figure 11, in general, the best preprocessing strategies used the least amount of combined functions. Combinations of functions that split sentences using the NLTK library performed better than those using a regex. Therefore, the preprocessing strategies for the average compound VADER score per minute using raw text for less than 19 days of data and splitting sentences using the NLTK library for greater data lengths performed the best among other strategies. The largest negative peaks in ASCP were −0.06, −0.08, and −0.10 when correlating 1, 5 to 7, and 34 to 44 days of data, respectively.
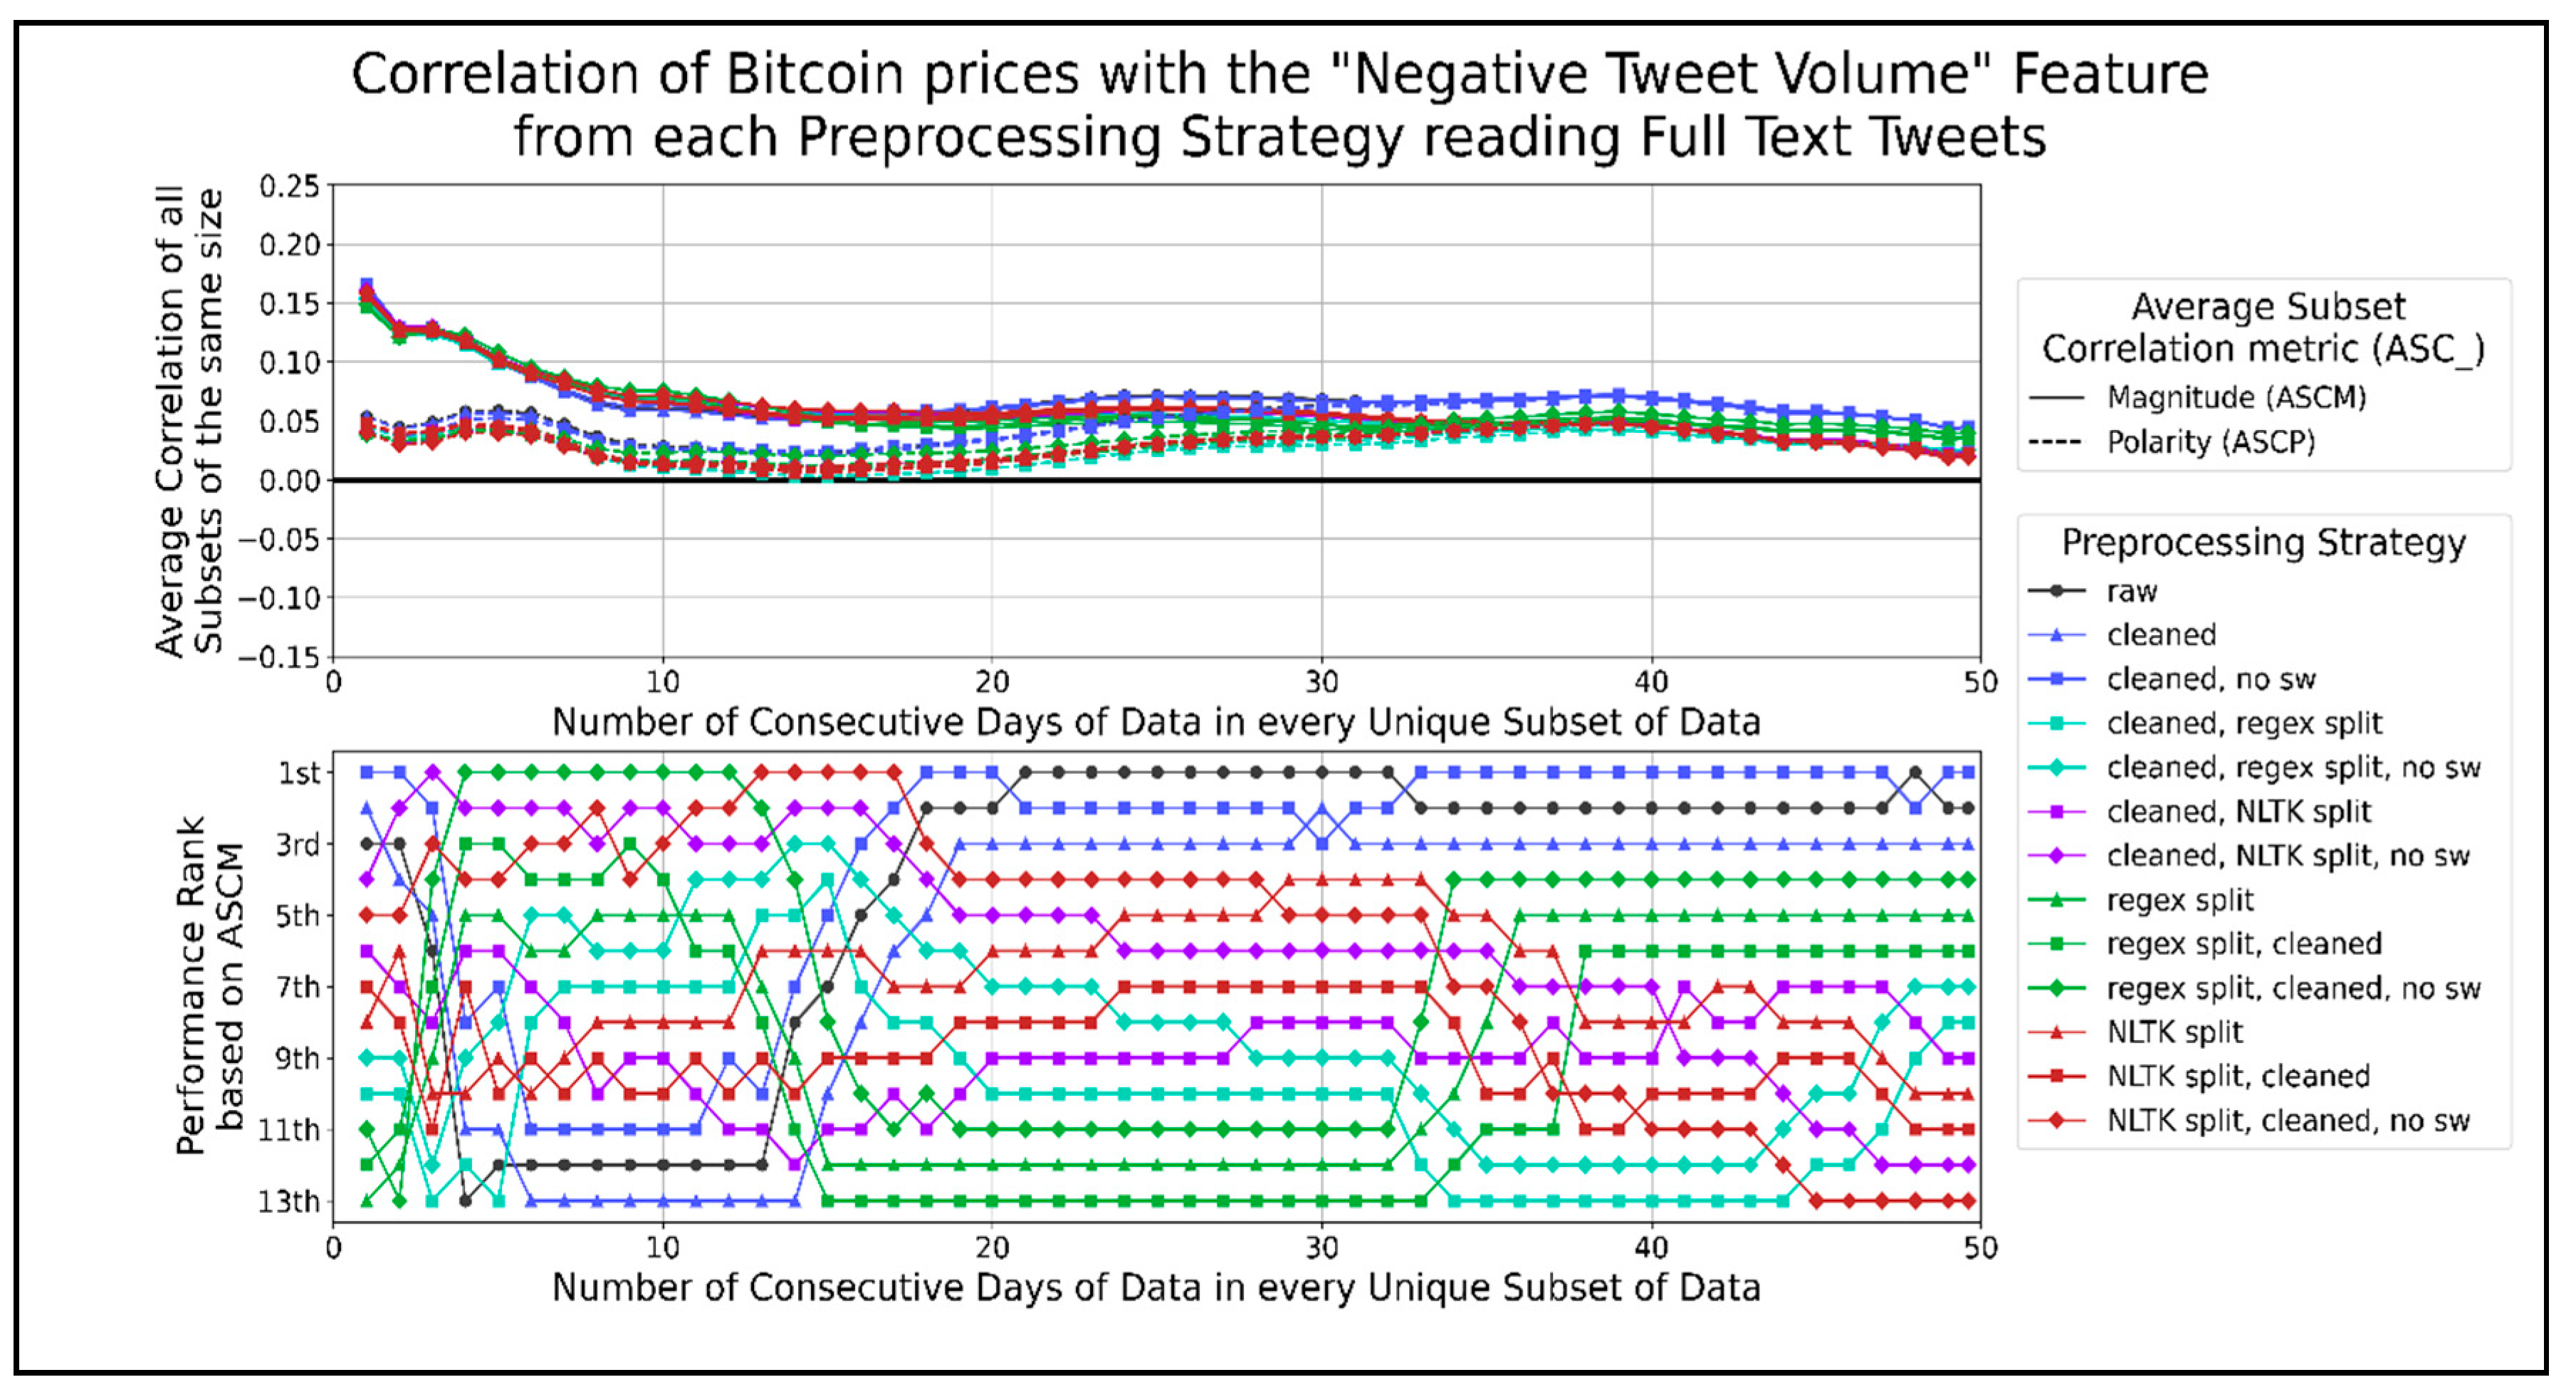
Figure 12 shows the correlation graphs of negative tweets per minute with Bitcoin prices. The cleaned text and cleaned text with stopwords removed closely match the raw text correlation. Cleaned text performed better than raw text when using between 35 days and 47 days of data, coinciding with the largest peak in the ASCP. A general pattern of sentence splitting combined with text cleaning, with stopwords removed, performed better than any sole sentence splitting method, which performed better than any order of combining sentence splitting and cleaned text. There was a large gap in performance between the three top strategies: raw text, cleaned text, cleaned text without stopwords, and the other preprocessing strategies. Therefore, the ASCM of the volume of negative tweets per minute was the highest when using those three strategies. The highest peak in ASCP was 0.07, at 40 days of data. Another peak of about 0.055 occurred when using 4 to 6 days of data.
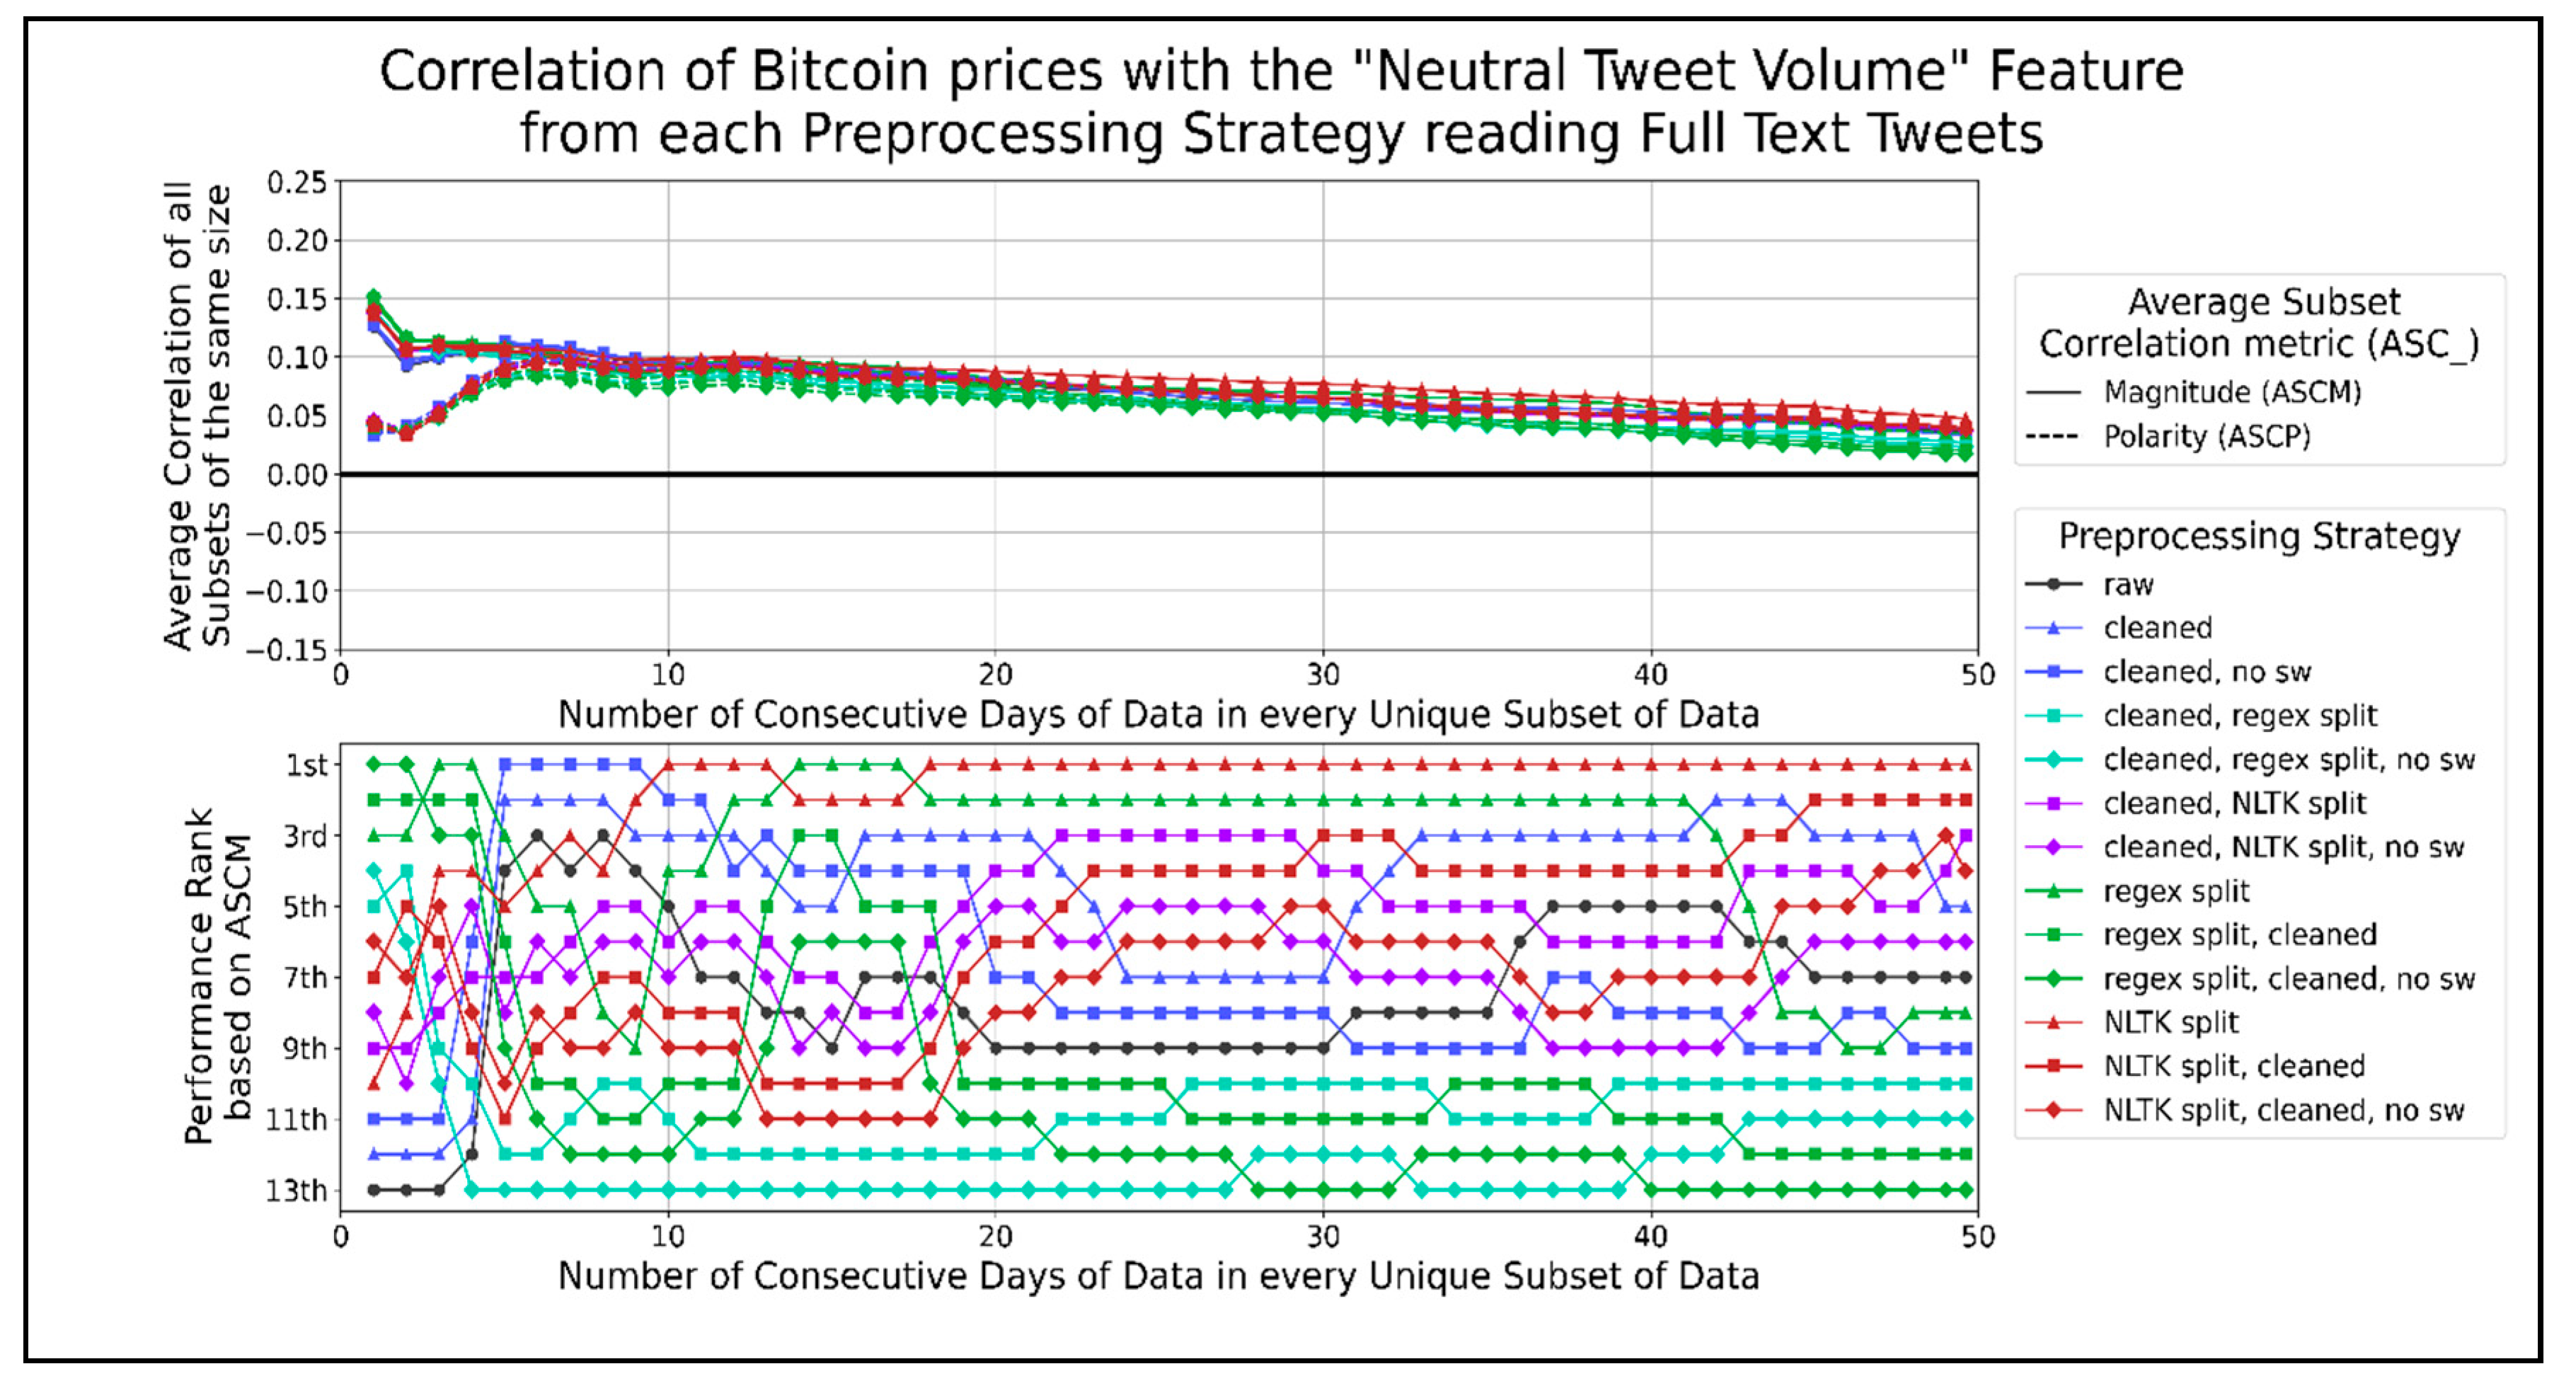
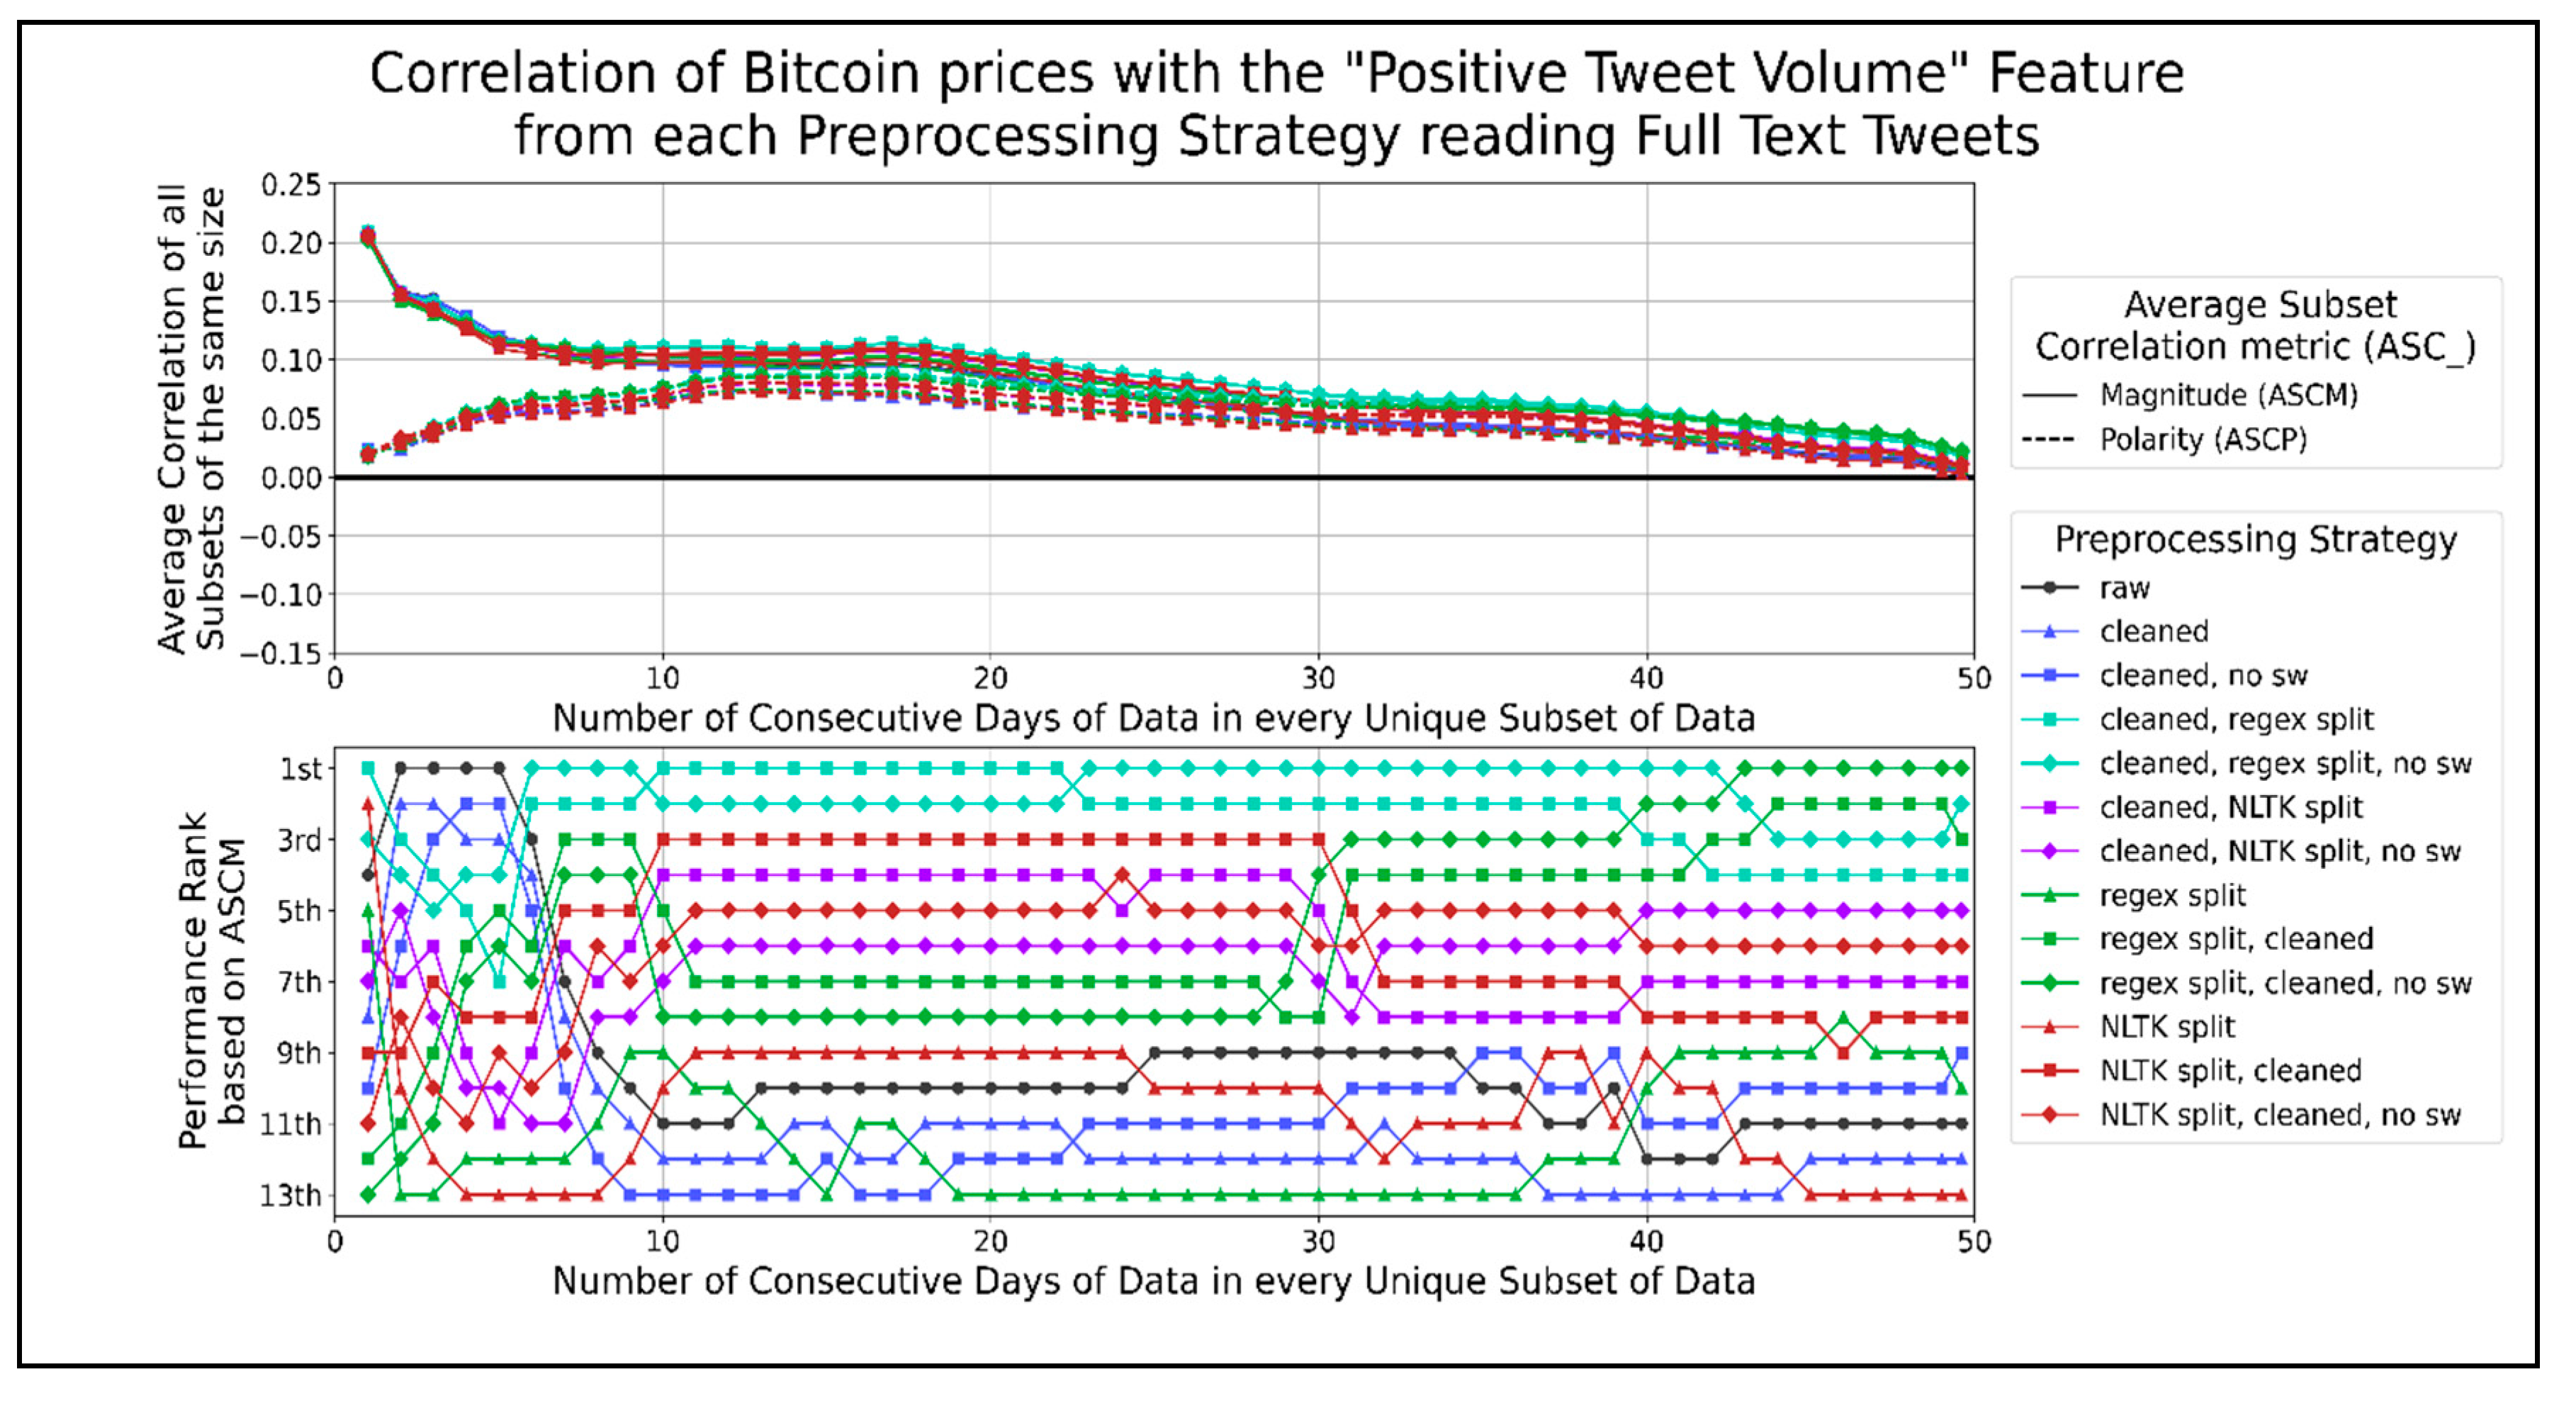
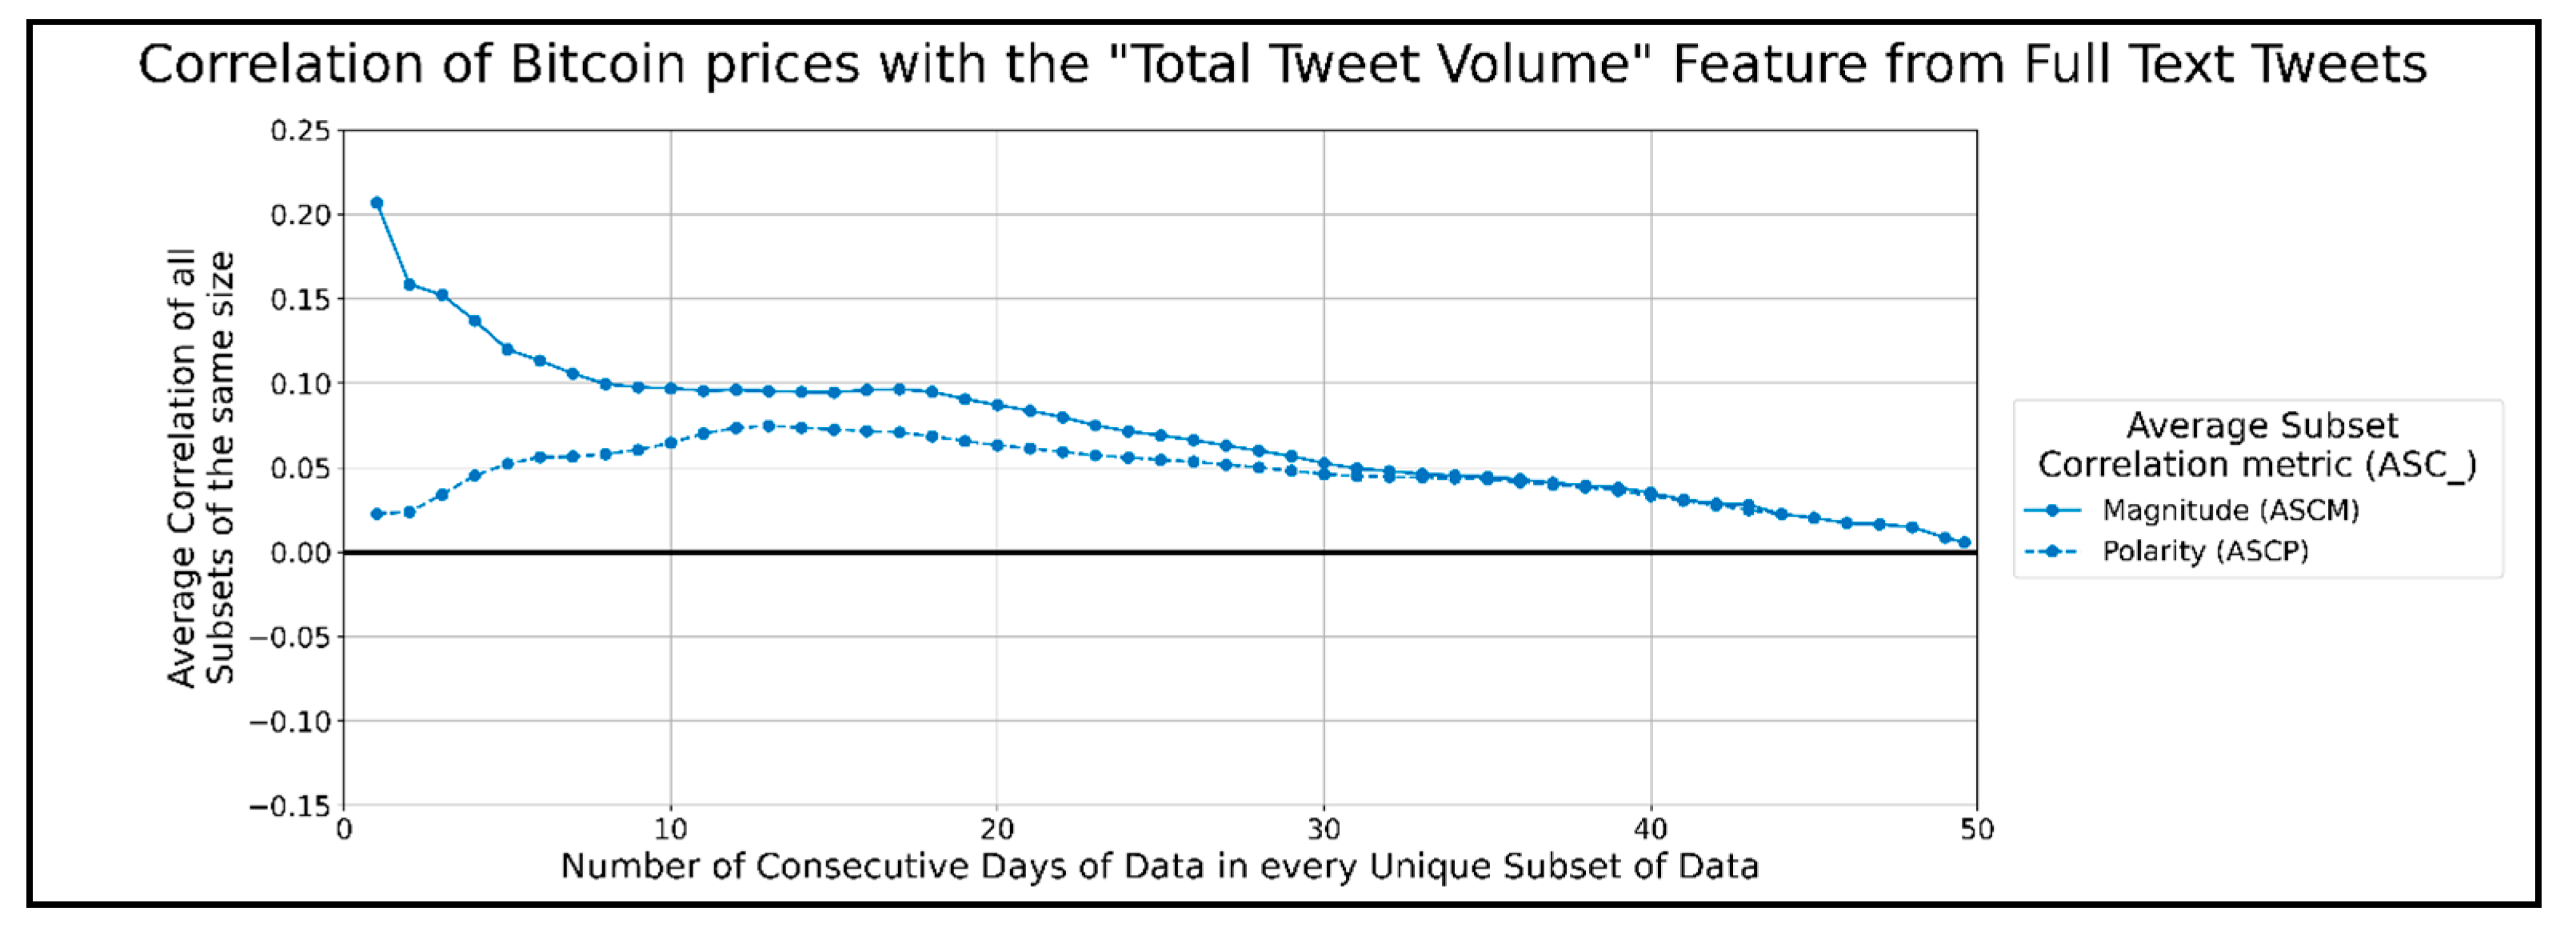
Figure 13 shows the correlation graphs of neutral tweets per minute for Bitcoin prices at different timespans. The top preprocessing strategies are splitting sentences using the NLTK library or a regex. In general, strategies that do not use a regex to split sentences tend to follow raw text correlation closely. Preprocessing strategies that use less combined functions achieve a higher ASCM than otherwise. Therefore, the preprocessing strategy that allows the volume of neutral tweets per minute, which correlates the best with Bitcoin prices, is the NLTK library to split sentences. The highest peak in ASCP was 0.095 when using 6 to 13 days of data. Figure 14 shows the correlation of positive tweets per minute with Bitcoin prices. The preprocessing strategies that consistently performed better than using raw text were the sentence splitting functions combined with one or more functions, such as cleaning text and/or removing stopwords. The top two strategies that performed the best involve cleaning text before using a regex for sentence splitting. In general, preprocessing strategies that involve combining more functions perform better. Therefore, the best preprocessing strategy for correlating Bitcoin prices with the volume of positive tweets per minute involves cleaning text before sentence splitting by a regex function. The highest peak in ASCP was about 0.085 when using 12 to 20 days of data. Figure 15 shows the total correlation per minute of tweets for Bitcoin prices. No preprocessing strategy can affect the total amount of tweets received from Twitter per minute; hence every single preprocessing function would have ASCM and ASCP graphs, as in Figure 15. The highest peak in the ASCP was 0.09 and occurred when correlating 6 to 20 days of data.
It is worth noting that the correlation graphs of the total volume of tweets have a similar trend as the correlation graphs of the neutral and positive volumes of tweets. This may indicate that the correlation of the total volume of tweets shares more in common with the volumes of the neutral and positive tweets than negative tweets when using long-term datasets on a scale of days. The general trend of the above graphs shows the strongest correlation magnitude for shorter datasets of full-text tweet data and Bitcoin prices. When using one day of data for correlation, all ASCMs are significantly higher than when using all other timespans of data (except the average negative VADER scores per minute graphs). This could be a sign of sentiments expressed on Twitter, either responding to or anticipating a Bitcoin price change. However, the ASCPs, when using one day of data, are significantly lower than the respective ASCMs. This might show that any correlation observed with sentiments varies a lot depending on the date. We speculate that the substantial spike in correlation magnitude for a day of data on every graph indicates that correlation may become even stronger when observed on a shorter timescale, such as minutes instead of days. While there is no single preprocessing strategy that performs better than the rest for all feature types, we can see that cleaning text (and/or) splitting sentences is presented in most of the best strategies of each features. Any sentence splitting by itself seemed to work best for average VADER positive/neutral sentiment and neutral tweet volume, while NLTK splitting combined with cleaning worked best for average VADER neutral sentiment. Any sentence splitting also worked best for neutral tweet volume, while cleaning text worked best for negative tweet volume, and regex sentence splitting after cleaning text worked best for positive tweet volume. The feature types with the highest ASCMs around their highest peak were the positive/total tweet volume when a day of data was processed. No clear “best” features could be seen when all lengths of data subsets were considered. The highest ASCMs were all average VADER sentiments when less than 20 days of data were in each subset. ASCPs tended to show a second peak when processing 35 or more days of data to calculate the average VADER negative/positive/compound sentiments and negative tweet volume. These peaks may indicate longer-term data trends that continue outside of our 49.6 days of data, but they are typically low. However, they may be useful in machine learning algorithms that account for the past state, as recurrent neural networks.
5. Discussion
In this paper, we contributed to BTC price forecasting literature by referring to the role of social media, namely Twitter messages, in the forecasting process [38]. It is most important to collect the tweets concerning people’s thoughts, emotions, and opinions about BTC during the period. The resulting sentiment scores from various preprocessing strategies are used to calculate the correlation coefficient with actual Bitcoin prices during the era of COVID−19. Our results indicate that the strongest correlation comes from processing a day’s worth of data, which has an unpredictable correlation polarity. However, some longer-term trends in correlation were observed when using ten days or 35+ data days, which might help machine learning algorithms that use temporal memory, such as recurrent neural networks. The patterns observed in processing full-length tweet text match closely with the patterns in processing truncated tweet text. This indicates that truncated tweet text is a suitable replacement for processing full-length tweet text at a reduced preprocessing cost, which helps process large datasets or real-time prediction systems such as KryptoOracle [22]. Although, in this paper, we used a short-term period for correlating tweets to BTC prices, the experimental period can be used as a sample for a long-term prediction for the entire period. We believe that we can apply the same preprocessing strategies to identify which one represents the BTC trend using the same set of strategies for the whole pandemic period. We expect that if the number of COVID-19 cases rises in specific regions and the tweets change, the proposed preprocessed strategies can work efficiently to provide well-fit representative data as long as we have the actual BTC price to compare with. Additionally, the collection period can be extended if the second wave of COVID-19 happens, such that a new corpus can be selected and matched to the actual BTC during the second wave. Recommendations for the optimum preprocessing strategies will be provided in the same trend provided in the experimental work. Although computing correlations in short time windows provide a well-fit preprocessed model for better BTC forecasting, a significant challenge remains in the unpredictable correlation polarity in longer-term trends. Our preprocessing methods using correlations can successfully be used as a groundwork for knowledge modeling through cognitive networks such as neural networks and deep learning to work directly on the most representative preprocessed Twitter data to the actual BTC price for forecasting. Furthermore, the most-fit preprocessing model can be used to predict the BTC price trends effectively. This paper demonstrated the adoption of natal language processing to assess users and decision-makers in perceiving and monitoring Bitcoin [39].
6. Conclusions and Further Research
In this paper, we identified the optimal preprocessing strategy of Bitcoin tweets introduced in the VADER-based Sentiment Analysis during the era of COVID-19. This paper used the VADER score from text preprocessing strategies to relate to the Bitcoin prices trend in this era. In general, we observe that features from cleaning text of tweet syntax and splitting text into sentences, in combination or separately, somewhat correlate with Bitcoin prices. However, the best preprocessing strategy to use depends on the feature you wish to extract from the text. More complex strategies are not guaranteed to correlate better. It can be concluded that the VADER score from text preprocessing shows a significant short-term correlation with Bitcoin prices. Future research involves investigating how datasets with timespans at each minute, instead of each day, relate to this work. We would also like to investigate if the correlation of our features with Bitcoin prices, from any of our preprocessing strategies, indicates how well a machine learning algorithm performs for predicting the BTC price from those features. Further future directions would involve selecting and correlating the optimal preprocessing strategy after COVID-19, at which we expect that the emotions and opinions on Twitter would change.
Author Contributions
Conceptualization, T.P. and R.K.; methodology, T.P. and R.K.; software, T.P.; validation, R.K.; formal analysis, T.P. and R.K.; investigation, T.P. and R.K.; resources, T.P.; data curation, T.P. and R.K.; writing—original draft preparation, T.P. and R.K.; writing—review and editing, T.P. and R.K.; visualization, T.P.; supervision, R.K.; project administration, R.K.; funding acquisition, R.K. All authors have read and agreed to the published version of the manuscript.
Funding
This research was funded by Ryerson University, Faculty of Engineering Undergraduate Opportunity Fund and The APC was funded by Ryerson Start-up fund.
Conflicts of Interest
The authors declare no conflict of interest.
References
- Conlon, T.; Richard, M. Safe haven or risky hazard? Bitcoin during the COVID-19 bear market. Financ. Res. Lett. 2020, 35, 101607. [Google Scholar] [CrossRef] [PubMed]
- Kristoufek, L. Grandpa, Grandpa, Tell Me the One About Bitcoin Being a Safe Haven: New Evidence from the COVID-19 Pandemic. Front. Phys. 2020, 8. [Google Scholar] [CrossRef]
- Corbet, S.; Charles, L.; Brian, L. The contagion effects of the COVID-19 pandemic: Evidence from gold and cryptocurrencies. Financ. Res. Lett. 2020. [Google Scholar] [CrossRef]
- Lahmiri, S.; Bekiros, S. The impact of COVID-19 pandemic upon stability and sequential irregularity of equity and cryptocurrency markets. Chaos Solitons Fractals 2020, 138, 109936. [Google Scholar] [CrossRef] [PubMed]
- Grobys, K. When Bitcoin has the flu: On Bitcoin’s performance to hedge equity risk in the early wake of the COVID-19 outbreak. Appl. Econ. Lett. 2020, in press. [Google Scholar] [CrossRef]
- Goodell, J.; Goutte, S. Co-movement of COVID-19 and Bitcoin: Evidence from wavelet coherence analysis. Financ. Res. Lett. 2020. [Google Scholar] [CrossRef]
- Yarovaya, L.; Matkovskyy, R.; Jalan, A. The Effects of a Black Swan Event (COVID-19) on Herding Behavior in Cryptocurrency Markets: Evidence from Cryptocurrency USD, EUR, JPY and KRW Markets. SSRN Electron. J. 2020. [Google Scholar] [CrossRef]
- Zaremba, A.; Kizys, R.; Aharon, D.Y.; Demir, E. Infected Markets: Novel Coronavirus, Government Interventions, and Stock Return Volatility around the Globe. Financ. Res. Lett. 2020, 35, 101597. [Google Scholar] [CrossRef]
- Jain, A.; Tripathi, S.; Dwivedi, H.D.; Saxena, P. Forecasting Price of Cryptocurrencies Using Tweets Sentiment Analysis. In Proceedings of the 2018 Eleventh International Conference on Contemporary Computing (IC3) Institute of Electrical and Electronics Engineers (IEEE), Noida, India, 2–4 August 2018; pp. 1–7. [Google Scholar]
- Symeonidis, S.; Effrosynidis, D.; Arampatzis, A. A comparative evaluation of pre-processing techniques and their interactions for twitter sentiment analysis. Expert Syst. Appl. 2018, 110, 298–310. [Google Scholar] [CrossRef]
- Ibrahim, A.; Kashef, R.; Li, M.; Valencia, E.; Huang, E. Bitcoin Network Mechanics: Forecasting the BTC Closing Price Using Vector Auto-Regression Models Based on Endogenous and Exogenous Feature Variables. J. Risk Fin. Manag. 2020, 13, 189. [Google Scholar] [CrossRef]
- Tan, X.; Kashef, R. Predicting the closing price of cryptocurrencies. In Proceedings of the Second International Conference on Data Science, E-Learning and Information Systems-DATA ’19, Association for Computing Machinery (ACM), Dubai, United Arab Emirates, 2–6 December 2019; pp. 1–5. [Google Scholar]
- Hutto, C.J. VADER-Sentiment-Analysis, GitHub. Available online: https://github.com/cjhutto/vaderSentiment (accessed on 24 July 2020).
- Mikolov, T.; Chen, K.; Corrado, G.; Dean, J. Efficient Estimation of Word Representations in Vector Space. arXiv 2013, arXiv:1301.3781 [cs.CL]. [Google Scholar]
- Jones, K.S. A statistical interpretation of term specificity and its application in retrieval. J. Document. 2004, 60, 493–502. [Google Scholar] [CrossRef] [Green Version]
- Tripathy, A.; Agrawal, A.; Rath, S.K. Classification of sentiment reviews using n-gram machine learning approach. Expert Syst. Appl. 2016, 57, 117–126. [Google Scholar] [CrossRef]
- Hutto, C.J.; Gilbert, E. VADER: A Parsimonious Rule-Based Model for Sentiment Analysis of Social Media Text. Available online: https://www.aaai.org/ocs/index.php/ICWSM/ICWSM14/paper/view/8109 (accessed on 24 July 2020).
- Havrlant, L.; Kreinovich, V. A simple probabilistic explanation of term frequency-inverse document frequency (tf-idf) heuristic (and variations motivated by this explanation). Int. J. Gen. Syst. 2017, 46, 27–36. [Google Scholar] [CrossRef] [Green Version]
- Stenqvist, E.; Lönnö, J. Predicting Bitcoin Price Fluctuation with Twitter Sentiment Analysis. Bachelor’ Thesis, School of Computer Science and Communication (CSC), KTH, Stockholm, Sweden, 2017. [Google Scholar]
- Kraaijeveld, O.; De Smedt, J. The predictive power of public Twitter sentiment for forecasting cryptocurrency prices. J. Int. Financial Mark. Inst. Money 2020, 65, 101188. [Google Scholar] [CrossRef]
- Li, T.R.; Chamrajnagar, A.S.; Fong, X.R.; Rizik, N.R.; Fu, F. Sentiment-Based Prediction of Alternative Cryptocurrency Price Fluctuations Using Gradient Boosting Tree Model. Front. Phys. 2019, 7. [Google Scholar] [CrossRef]
- Mohapatra, S.; Ahmed, N.; Alencar, P. KryptoOracle: A Real-Time Cryptocurrency Price Prediction Platform Using Twitter Sentiments. arXiv 2019, arXiv:2003.04967 [cs.CL]. [Google Scholar]
- Kaplan, C.; Aslan, C.; Bulbul, A. Cryptocurrency Word-of-Mouth Analysis via Twitter, ResearchGate. 2018. Available online: https://www.researchgate.net/publication/327988035_Cryptocurrency_Word-of-Mouth_Analysis_viaTwitter (accessed on 20 May 2020).
- Sailunaz, K.; Alhajj, R. Emotion and sentiment analysis from Twitter text. J. Comput. Sci. 2019, 36, 101003. [Google Scholar] [CrossRef] [Green Version]
- Rosen, A. Tweeting Made Easier, Twitter. 7 November 2017. Available online: https://blog.twitter.com/en_us/topics/product/2017/tweetingmadeeasier.html. (accessed on 24 July 2020).
- Lyu, H.; Chen, L.; Wang, Y.; Luo, J. Sense and Sensibility: Characterizing Social Media Users Regarding the Use of Controversial Terms for COVID-19. IEEE Trans. Big Data 2020, 1. [Google Scholar] [CrossRef]
- The Twitter Rules, Twitter. Available online: https://help.twitter.com/en/rules-and-policies/twitter-rules (accessed on 19 May 2020).
- Automation rules, Twitter. Available online: https://help.twitter.com/en/rules-and-policies/twitter-automation (accessed on 19 May 2020).
- Tweepy. 2009. Available online: http://www.tweepy.org/ (accessed on 19 May 2020).
- Counting Characters, Twitter. Available online: https://developer.twitter.com/en/docs/basics/counting-characters (accessed on 24 July 2020).
- Search Tweets-Overview-Search API, Twitter. Available online: https://developer.twitter.com/en/docs/tweets/search/overview/standard (accessed on 24 July 2020).
- Search Tweets-API Reference-Standard search API, Twitter. Available online: https://developer.twitter.com/en/docs/tweets/search/api-reference/get-search-tweets (accessed on 24 July 2020).
- Choose Your Plan, CryptoCompare. Available online: https://min-api.cryptocompare.com/pricing (accessed on 24 July 2020).
- Hutto, C.J. vaderSentiment/vaderSentiment/vader_lexicon.txt, GitHub. 22 May 2020. Available online: https://github.com/cjhutto/vaderSentiment/blob/master/vaderSentiment/vader_lexicon.txt (accessed on 24 July 2020).
- “5. Built-in Types”—Python 2.7.18 Documentation. Available online: https://docs.python.org/2/library/stdtypes.html (accessed on 24 July 2020).
- Hutto, C.J. vaderSentiment/vaderSentiment/vaderSentiment.py, GitHub. 22 May 2020. Available online: https://github.com/cjhutto/vaderSentiment/blob/master/vaderSentiment/vaderSentiment.py (accessed on 24 July 2020).
- Pano, T.; Kashef, R. A Corpus of BTC Tweets in the Era of COVID-19. In Proceedings of the 2020 IEEE International IOT, Electronics and Mechatronics Conference (IEMTRONICS), Institute of Electrical and Electronics Engineers (IEEE), Vancouver, BC, Canada, 9–12 September 2020; pp. 1–4. [Google Scholar]
- Stella, M. Modelling Early Word Acquisition through Multiplex Lexical Networks and Machine Learning. Big Data Cogn. Comput. 2019, 3, 10. [Google Scholar] [CrossRef] [Green Version]
- Li, D.; Summers-Stay, D. Mapping Distributional Semantics to Property Norms with Deep Neural Networks. Big Data Cogn. Comput. 2019, 3, 30. [Google Scholar] [CrossRef] [Green Version]
Figure 1.
The volume of tweets created on 6 June, collected each day from Twitter’s API.

Figure 2.
The preprocessing of the “cleaned” function over sample tweet text.

Figure 3.
The preprocessing of the “no sw” function over sample text.

Figure 4.
Tokenization of a word and character sorting.

Figure 5.
A comparison of sentence splitting by the regular expression and the NLTK sentence tokenizer.
Figure 5.
A comparison of sentence splitting by the regular expression and the NLTK sentence tokenizer.

Figure 6.
Five different preprocessing pathways with 13 collective intermediate steps (boxes).

Figure 7.
Correlation of sentiment timeseries and Bitcoin prices on 22 May.

Figure 8.
The correlation score time-series for the average negative VADER sentiment per minute.

Figure 9.
The correlation score time-series for the average neutral VADER sentiment per minute.

Figure 10.
The correlation score time-series for the average positive VADER sentiment per minute.

Figure 11.
The correlation score time-series for the average compound VADER sentiment per minute.

Figure 12.
The correlation score time-series for the volume of negative tweets per minute.

Figure 13.
The correlation score time-series for the volume of neutral tweets per minute.

Figure 14.
The correlation score time-series for the volume of positive tweets per minute.

Figure 15.
The correlation score time-series for the total amount of tweets posted per minute.

Publisher’s Note: MDPI stays neutral with regard to jurisdictional claims in published maps and institutional affiliations. |
© 2020 by the authors. Licensee MDPI, Basel, Switzerland. This article is an open access article distributed under the terms and conditions of the Creative Commons Attribution (CC BY) license (http://creativecommons.org/licenses/by/4.0/).
Share and Cite
MDPI and ACS Style
Pano, T.; Kashef, R. A Complete VADER-Based Sentiment Analysis of Bitcoin (BTC) Tweets during the Era of COVID-19. Big Data Cogn. Comput. 2020, 4, 33. https://0-doi-org.brum.beds.ac.uk/10.3390/bdcc4040033
AMA Style
Pano T, Kashef R. A Complete VADER-Based Sentiment Analysis of Bitcoin (BTC) Tweets during the Era of COVID-19. Big Data and Cognitive Computing. 2020; 4(4):33. https://0-doi-org.brum.beds.ac.uk/10.3390/bdcc4040033
Chicago/Turabian StylePano, Toni, and Rasha Kashef. 2020. "A Complete VADER-Based Sentiment Analysis of Bitcoin (BTC) Tweets during the Era of COVID-19" Big Data and Cognitive Computing 4, no. 4: 33. https://0-doi-org.brum.beds.ac.uk/10.3390/bdcc4040033