Ticket Sales Prediction and Dynamic Pricing Strategies in Public Transport


DIMES, University of Calabria, 87036 Rende, Italy
*
Author to whom correspondence should be addressed.
Big Data Cogn. Comput. 2020, 4(4), 36; https://0-doi-org.brum.beds.ac.uk/10.3390/bdcc4040036
Submission received: 19 October 2020
/
Revised: 19 November 2020
/
Accepted: 24 November 2020
/
Published: 27 November 2020
(This article belongs to the Special Issue Big Data and Cognitive Computing: Feature Papers 2020)
Abstract
:In recent years, the demand for collective mobility services registered significant growth. In particular, the long-distance coach market underwent an important change in Europe, since FlixBus adopted a dynamic pricing strategy, providing low-cost transport services and an efficient and fast information system. This paper presents a methodology, called DA4PT (Data Analytics for Public Transport), for discovering the factors that influence travelers in booking and purchasing bus tickets. Starting from a set of 3.23 million user-generated event logs of a bus ticketing platform, the methodology shows the correlation rules between booking factors and purchase of tickets. Such rules are then used to train machine learning models for predicting whether a user will buy or not a ticket. The rules are also used to define various dynamic pricing strategies with the purpose of increasing the number of tickets sales on the platform and the related amount of revenues. The methodology reaches an accuracy of 95% in forecasting the purchase of a ticket and a low variance in results. Exploiting a dynamic pricing strategy, DA4PT is able to increase the number of purchased tickets by 6% and the total revenue by 9% by showing the effectiveness of the proposed approach.
1. Introduction
The long-distance bus industry has traditionally been slow to evolve and is quite resistant to change. In Europe, some countries such as the UK, Sweden and Norway liberalized their bus transport market a long time ago, while other countries such as France, Italy and Germany recently opened it [1]. A turning point has occurred in 2015 when FlixBus entered the European market, significantly increasing the supply of interregional buses and practicing aggressive pricing policies, to which many other local operators decided to adapt [2]. FlixBus has immediately provided an advanced online ticket booking platform, which allows booking buses with great flexibility and convenience, and providing personalized offers for users by exploiting the large amount of data stored on its platform [3]. Therefore, thanks to relatively low costs, use of advanced booking platforms and possibility of booking personalized travel itineraries, the bus transportation has been able in recent years to offer an added value to passengers over airlines and trains.
This paper presents a methodology, namely DA4PT (Data Analytics for Public Transport), for discovering the factors that influence users’ behavior in ticket purchasing. In particular, DA4PT allows analyzing large amounts of user-generated event logs from bus ticketing platforms for finding the correlation rules between booking factors and purchase of a ticket. Then, such rules are used: (i) for training machine learning models able to predict whether a user will buy or not a ticket, and (ii) for defining different dynamic pricing strategies with the purpose of increasing ticket sales on the platform and the total revenue.
The proposed methodology was applied to a real case study composed by more than 3 million of event logs of an Italian bus ticketing platform, collected from 1 August 2018 to 20 October 2019. The results obtained show that factors such as number of days passed from booking to departure, occupancy rate and fare of tickets, significantly influence travelers in their purchases. We experimentally evaluated the accuracy of our methodology comparing some of the most relevant machine learning algorithms used in the literature [4]. XGBoost and Random Forest proved to be the best classification models in the demand forecasting domain compared to other algorithms, with an accuracy of 95% and 93%, respectively.
To evaluate the pricing strategies, we defined an algorithm for generating synthetic event logs similar to the real ones, and an algorithm for evaluating the impact of a pricing strategy in terms of number of purchased tickets and total revenue. We compared the different pricing strategies, showing that a dynamic pricing strategy based on occupancy rate and number of days passed from booking to departure are capable of increasing the number of purchased tickets by 6% and the total revenue by 9%.
For the sake of clarity, this paper extends the work presented in [5] including several new original contributions with respect to the previous one. Specifically, the methodology is explained in more detail by analyzing new purchase factors such as the number of attempts made by users before buying a ticket or leaving the platform. A new section on dynamic pricing was added to explain how the synthetic event generator was defined and how the different pricing strategies were evaluated. The experiments section was also extended with new results that show how the number of ticket sales and total revenue increase by using different pricing strategies.
The rest of the paper is organized as follows. Section 2 discusses related work. Section 3 outlines the problem statement and goal of our analysis. Section 4 presents the proposed methodology by describing its steps in detail. Section 5 illustrates the experimental evaluation. Section 6 concludes the paper.
2. Related Work
In this section we discuss previous research work done on two of the main problems addressed in this paper: demand forecasting and dynamic pricing. In particular, we analyzed the most representative research work not only in the public transport field [6] but also in other important fields such as hospitality [7], tourism [8], retail [9], electricity [10], by discussing differences and similarities with the methodology we proposed.
- Demand forecasting. Liu et al. [11] proposed a probabilistic framework for modeling the travel preferences of airline customers and predicting the personalized demand of airline passengers, i.e., the destination and the airline that an individual customer will choose. Experimental results on two real-world datasets demonstrate the effectiveness of our approach on both travel topic discovery and customer travel prediction. Mumbower et al. [12] estimated the fluctuation in flight prices using a database of online prices and seat map displays. The results show how airlines can design optimal promotions by using factors such as booking date and departure time and date (day of the week). In particular, a linear regression method was used to predict the number of bookings for a specific flight. Abdelghany and Guzhva [13] used a time-series modeling approach for airport short-term demand forecasting. The model evaluates how different factors such as seasonality, fuel price, airline strategies, incidents and financial conditions, affect airport activity levels. In [14] Yeboah et al. developed an explanatory model of pre-travel information-seeking behaviors in a British urban environment, using binomial logistic regression. The considered factors include socio-demographics, trip context, frequency of public transport use, used information sources, and smartphone ownership and use. Abdella et al. [15] showed that existing models are generally based on a limited number of factors, such as historical ticket price data, ticket purchase date and departure date, that are not effective enough for ticket/demand prediction.
- Dynamic pricing. Many market leaders, including Groupon [16] and Walmart [17], extensively investigate and utilize dynamic pricing algorithms to obtain and maintain a competitive advantage over time. Kemper and Breuer [18] combined the mathematical principles of dynamic pricing with empirical marketing research methods on a dataset of auctions (from ebay.de), to determine demand functions of football tickets during the 2013-14 Bundesliga season. Through Monte Carlo simulations, the effects of a pricing approach in terms of revenues, number of purchased tickets, and average ticket price were evaluated, discovering that the stadium attendees’ willingness to pay could be significantly higher than the current ticket prices. Sato and Sawaki [19] presented a revenue management model of dynamic pricing for a competitive route. Specifically, the authors suppose that the passengers choose several transport vehicles and that each transport mode offers the multiple alternative schedules. Using a multinomial logit model to describe a customer’s discrete choice, they derive an optimal pricing policy thus as to maximize the expected total revenue for alternative schedules for high-speed rails. Lou et al. [20] proposed a self-learning approach to determine optimal pricing strategies for toll roads. The approach learns recursively motorists’ willingness to pay and then specifies toll rates to maximize the freeway’s throughput. Simulation experiments were performed to demonstrate and validate the proposed approach and to provide insights on when to convert high-occupancy lanes to toll lanes. Rana and Oliveira [21] examined the problem of establishing a pricing policy that maximizes the revenue for selling a given inventory by a fixed deadline. They propose a methodology to optimize revenue in which demand is learned and pricing decisions are updated in real time, showing that the reinforcement learning can be used to model the problem with inter-dependent demands.
Compared to the state of the art, our methodology includes the following novel aspects: (i) it uses process mining algorithms to extract valuable information concerning user behaviors on a bus ticketing platform; (ii) it discovers the main factors that influence user’s buying decisions to predict whether or not a user will buy a ticket; (iii) it proposes two algorithms for evaluating the effects of dynamic pricing strategies; and (iv) the proposed methodology is validated on real data obtained from a bus ticket sales platform.
3. Problem Definitions and Goal
(Input Dataset). Let D be a dataset collecting trip instances of a bus company, where each d is described by the following tuple: , where TI is the identifier of a trip itinerary, is the origin city, is the destination city, is the booking date, is the departure date, F is the fare of a ticket, and NS is the number of bus seats required by a user.
(Event logs). Let EL be a set of event logs generated by users of a bus ticketing platform, where an event is defined by the following tuple: , where C is the cookie of a user, A is the description of a user’s action, t is the timestamp the event happens, TI is the identifier of a trip itinerary, and NS is the number of bus seats required by a user. For instance, a single event may be: (i) find a trip; (ii) calculate fare of a ticket for a given trip; (iii) select a seat on the bus; or (iv) pay the booked trip. Some users finalize their search by purchasing the ticket (purchased) while others abandon the platform without purchasing the ticket (abandoned).
As mentioned before, the main goal of this work is to infer patterns and trends about users behavior on a bus ticketing platform. This is achieved in three steps: (i) discovering the main factors that influence users in ticket purchasing; (ii) training machine learning models able to predict whether a user will purchase a ticket or not; and (iii) testing dynamic pricing strategies to evaluate the number of purchased tickets and the total revenue. Please note that the factors we considered in this paper depend exclusively on the interaction of users with the ticket sales platform, without considering other important factors such as the strategies and prices offered by other competitors (train, airline and other bus companies).
4. Proposed Methodology
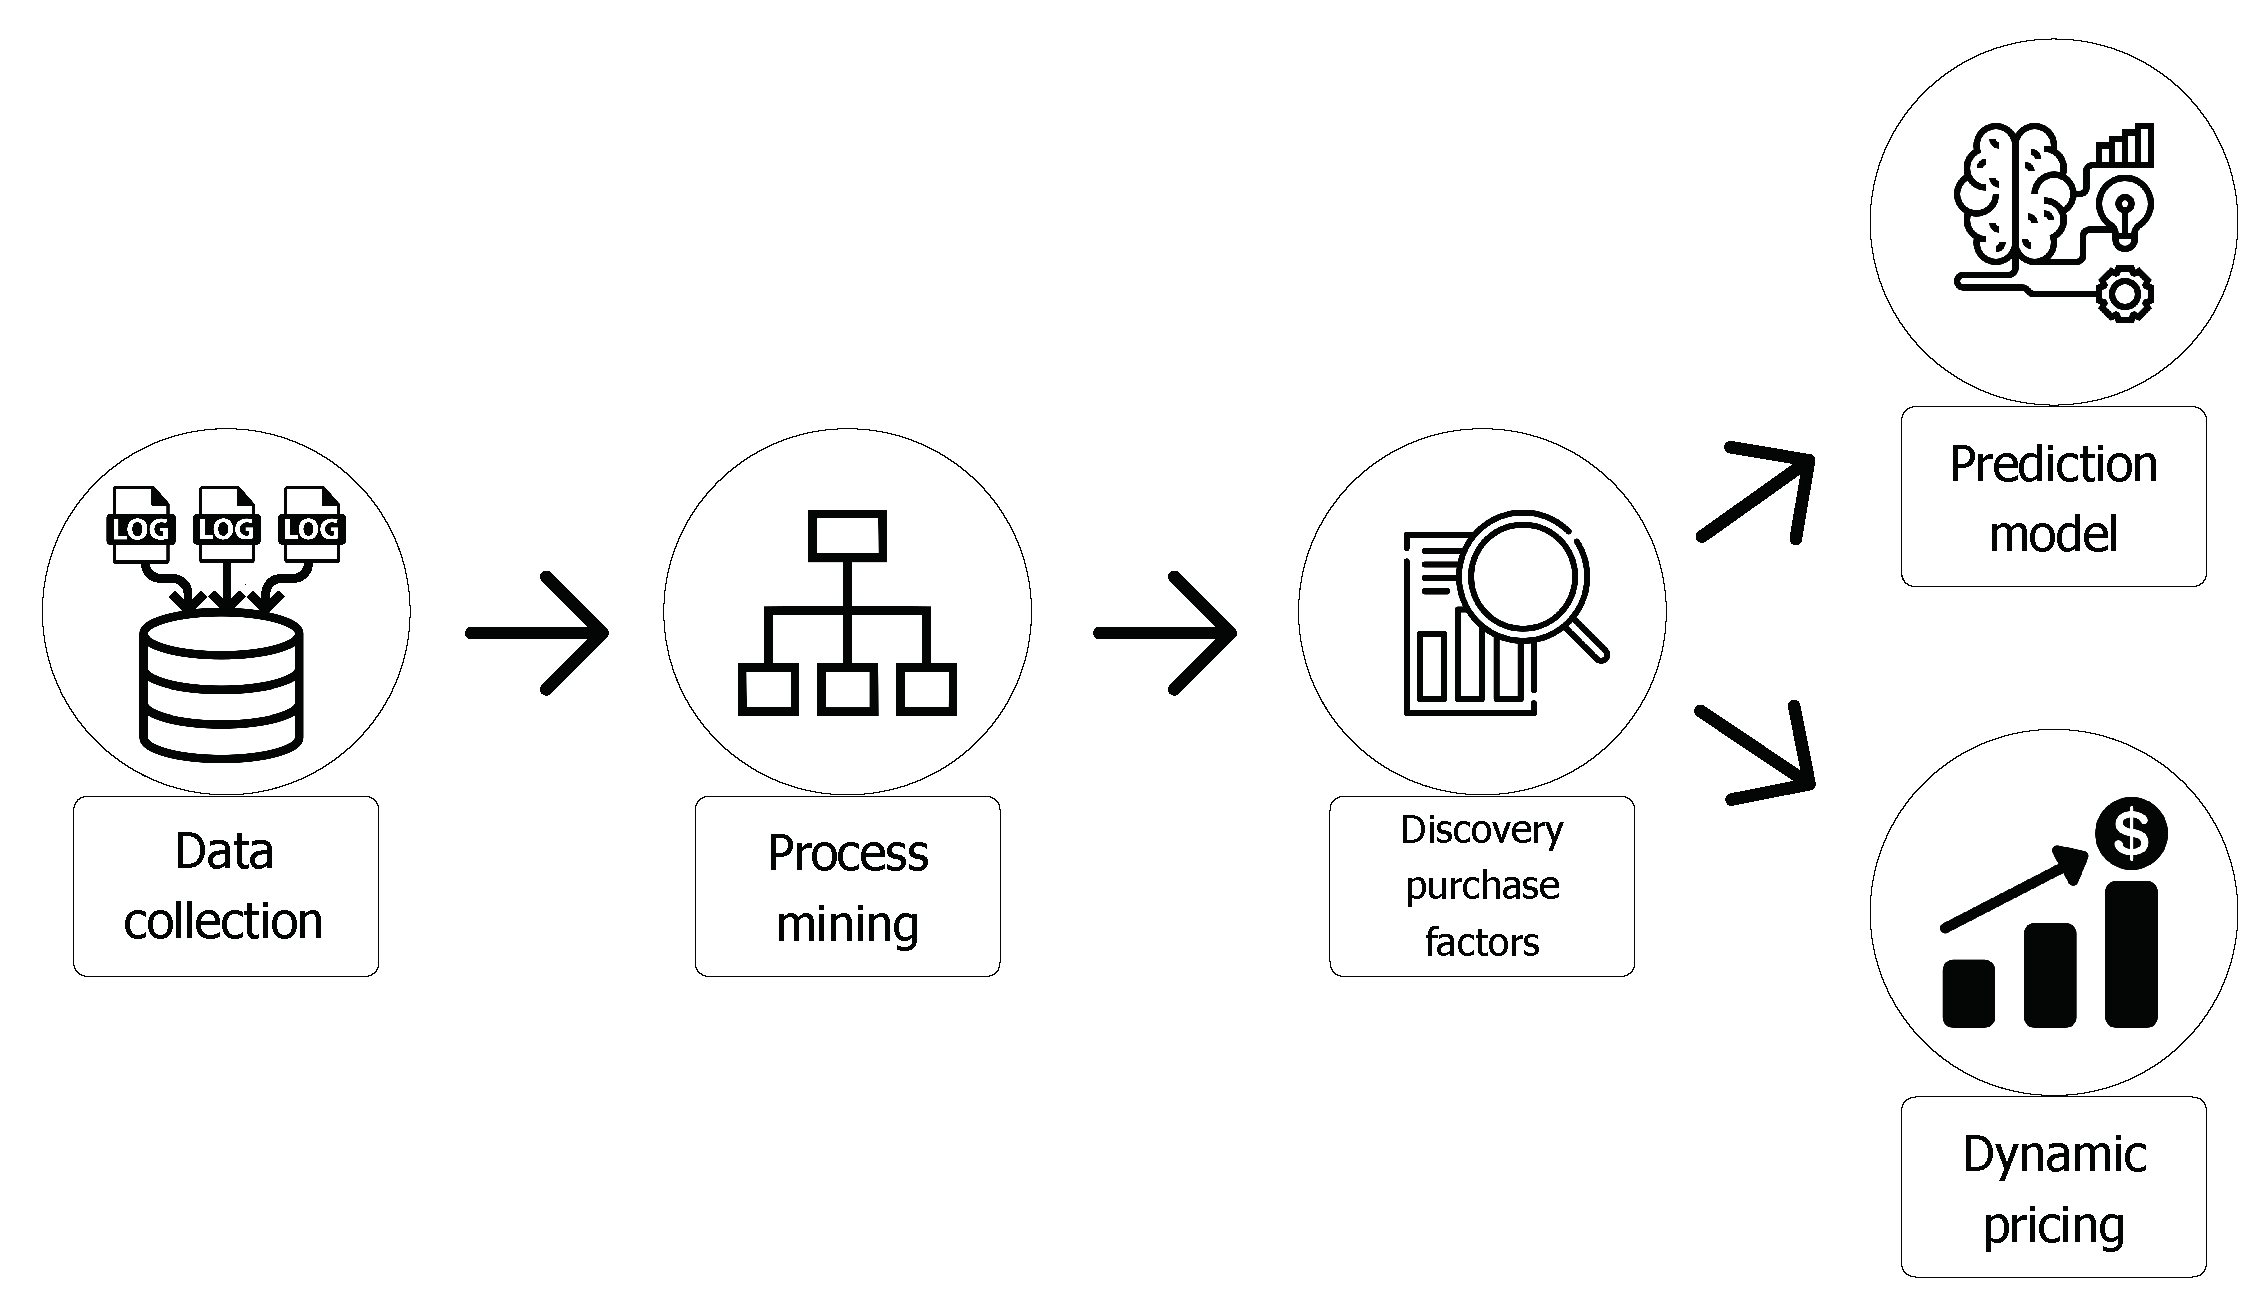
As shown in Figure 1, the proposed methodology consists of five main steps:
- (1)
- Data collection: given a bus ticketing platform, the user-generated event logs are collected.
- (2)
- Process mining: the event logs, after being processed for fixing wrong data and missing values, are analyzed by a process mining algorithm for discovering models and patterns of platform users.
- (3)
- Discovery purchase factors: the event logs are analyzed to discover the main factors that influence a user’s buying decisions. In particular, the goal of this step is to identify the correlation between the information present when booking a ticket and the sale of the ticket.
- (4)
- Prediction model: the main factors that influence a user’s buying decisions are used for training machine learning algorithms for predicting whether or not a user will buy a ticket.
- (5)
- Dynamic pricing: the discovered factors are used for defining dynamic pricing strategies, which have the purpose of increasing the number of purchased tickets and the total revenue of a bus company.
For each step, a formal description and a use case are illustrated in the following sections.
4.1. Steps 1–2: Data Collection and Process Mining
The first two steps aim at extracting relevant information about users behavior, interests and activities by the event logs (EL of a bus ticketing platform). Specifically, during step 1, all the interactions of users with the bus ticketing platform (e.g., whether a user buys or not a ticket, or in which step of the buying decision process a user leaves the platform) are collected. Step 2 leverages a process mining algorithm to learn and support the design of purchasing processes by automatically discovering patterns that explain the events recorded in the input log traces [22].
The set of event logs EL is pre-processed to make it ready for analysis. In particular, we first process events for fixing wrong and missing data. Then, we proceed by selecting only the events that end successfully and unsuccessfully (e.g., the purchase of a ticket and the abandonment of the platform by users, respectively).
The output of step 2 is the dataset , where each is a tuple 〈u, {e, e, ..., e}〉 in which is the event generated by user .
4.2. Step 3: Discovery of Purchase Factors
The goal of step 3 is to identify the key factors that drive a user to purchase a ticket. Firstly, we perform an exploratory analysis to reduce the set of attributes for keeping only those necessary to model travelers’ purchasing behaviors. Then, we apply a correlation analysis for defining conditions that tend to occur simultaneously and/or patterns that recur in certain conditions. In particular, the goal of our analysis is to generate correlation rules such as (if factor occurs, then it is likely that also event occurs). The correlations between an attribute and the class attribute (purchased or abandoned) is evaluated using the Pearson’s correlation coefficient [23]. The values of the Pearson’s correlation can be in the range [−1,1], where the value of 1 represents a strong linear relationship, 0 no linear correlation, while −1 corresponds to a negative linear correlation.
To rule out collinearity issue, we calculate the variance inflation factor (VIF) [24] for each attribute. A VIF value of 1 indicates that there is no correlation between this attribute and any others. VIF values between 1 and 5 suggest that there is a moderate correlation, but it is not severe enough to request corrective measures. VIF values greater than 5 represent critical levels of collinearity which indicate that the correlation coefficients calculated among attributes may be unreliable. From an implementation point of view, the correlation is calculated with an R script, while the collinearity through the statsmodels (https://www.statsmodels.org/) library.
Before performing exploratory factor analysis, we added some attributes in addition to those given in the input dataset: (i) days before departure (DBD), by calculating the difference between booking and departure date; (ii) booking day of the week (BDOW), by extracting the day from a booking date; (iii) occupancy rate for a bus (OCCR), by evaluating the number of required bus seats per passenger; (iv) number of attempts (NA), by evaluating the number of attempts made by a user before buying a ticket or leaving the platform; (v) fare of a ticket (HMLF), by dividing the price of each trip itinerary into three bands (high, medium, and low).
4.3. Step 4: Prediction Model
After defining the purchase factors, we train predictive algorithms to automatically learn whether or not a user will finalize the purchase of a ticket. To perform this task and evaluate the accuracy of the relative predictive models, a 10-fold cross-validation process is exploited. However, it should be noted that the training and test sets that are generated in such a process are unbalanced because the two classes, purchased and abandoned, are not equally represented in the original log. In particular, there is a high percentage of users who visit the bus website without buying any tickets, and a low percentage who instead purchase tickets. To get accurate prediction models and correctly evaluate them, we used balanced training sets and test sets in which half of the log events end with the purchase of a ticket and half with the abandonment of the platform. For this reason, we used the random under-sampling algorithm [25], which balances class distribution through random discarding of major class tuples as described in [26].
Moreover, to make our evaluation more accurate and complete, we evaluated the performance of the proposed approach comparing five classification algorithms (i.e., Naïve Bayes [27], Logistic Regression [28], Decision Tree [29], Random Forest [30], and XGBoost [31]). Specifically, the performance of the algorithms was evaluated through a confusion matrix. Tickets that are correctly predicted as are counted as True Positive (TP), whereas tickets that are predicted as purchased but are actually abandoned are counted as False Positive (FP). Similarly, tickets that are correctly predicted as abandoned are counted as True Negative (TN), whereas tickets that are predicted as but are actually are counted as False Negative (FN). Then, starting from the confusion matrix, we computed four metrics (accuracy, precision, recall and F1-score) which are commonly used in regressive analysis literature to quantify forecast performance.
The machine learning algorithms were implemented in Python using the library sklearn (https://scikit-learn.org/) for producing the confusion matrix and the resulting measures, and its library imblearn to deal with the class-imbalance problem.
4.4. Step 5: Dynamic Pricing
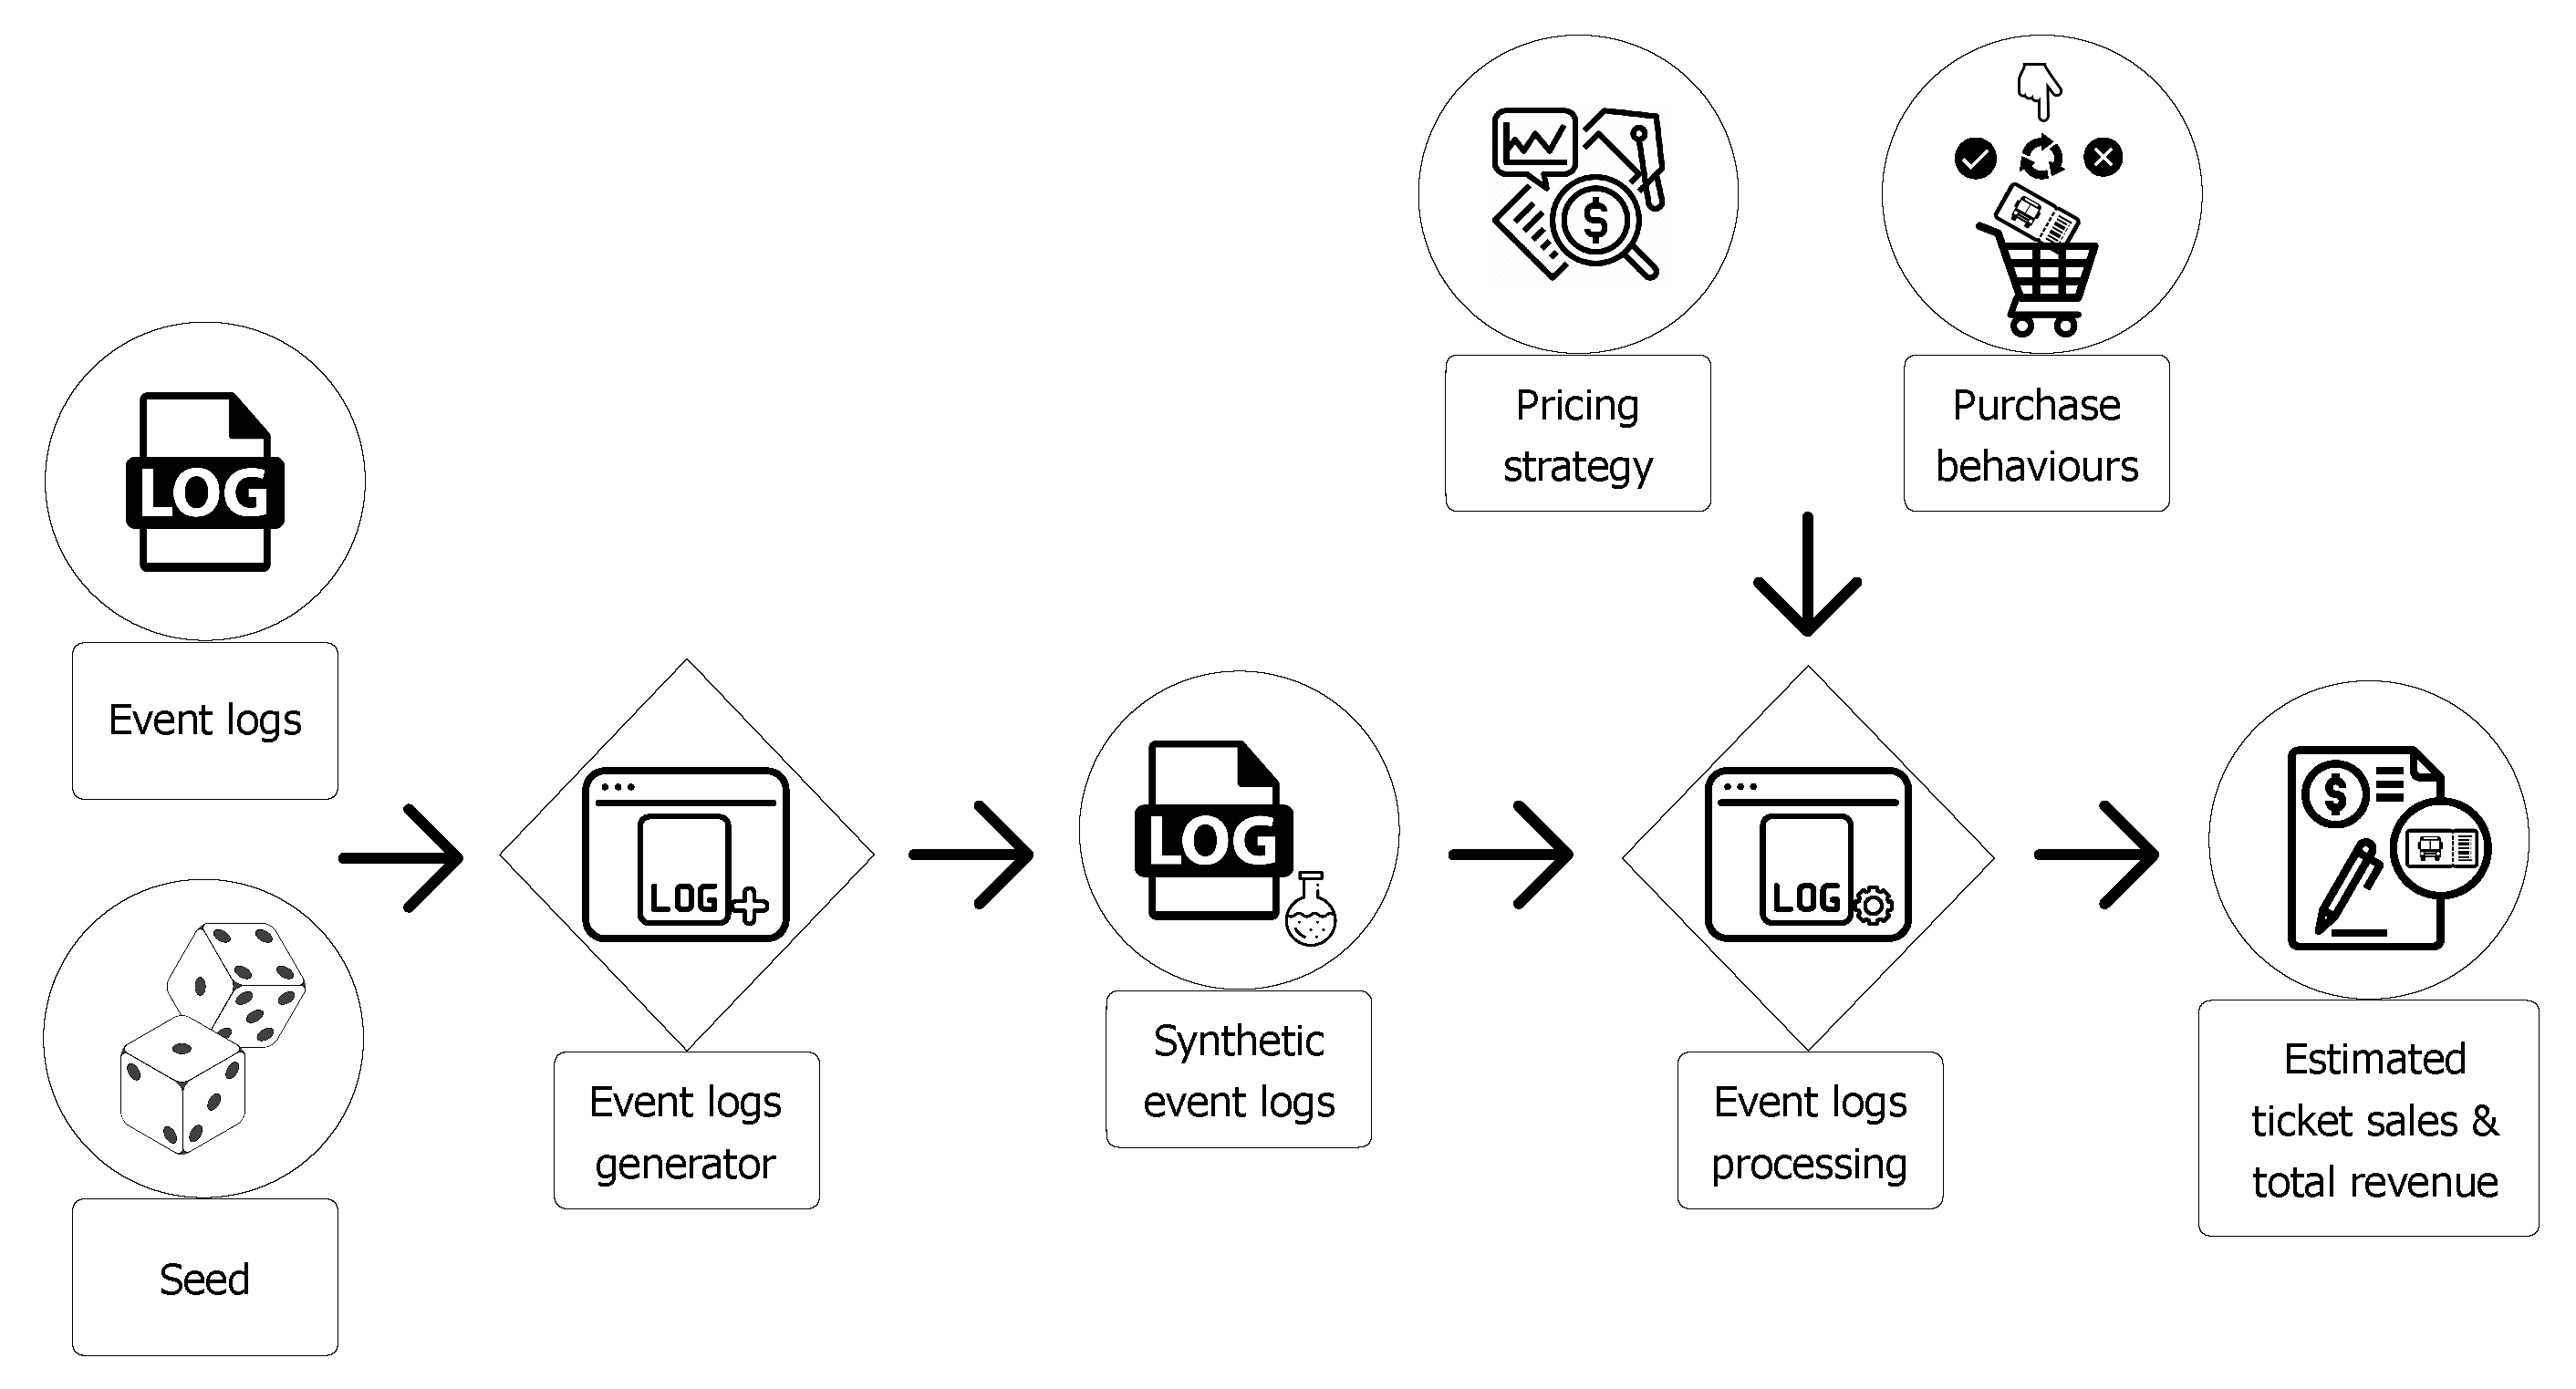
To evaluate the different pricing strategies (standard and dynamic), we defined an algorithm for generating synthetic event logs similar to the real ones, and an algorithm for evaluating the impact of a pricing strategy in terms of number of purchased tickets and total revenue (for more details see Section 5.5). Figure 2 shows the two algorithms, event log generator and event log processing and their inputs and outputs.
The event logs generator algorithm generates synthetic events similar to those registered in original logs file. Specifically, synthetic data is generated by using a multivariate empirical distribution based on input data {{, , ...}, {, , ...}, ...}, where are the observed values for the first attribute, are the observed values for second attribute, and so on. The different synthetic log files that we can produce (one for each seed we use) allow us to perform extensive testing on pricing strategies.
The event logs processing algorithm exploits a pricing strategy and the purchase behaviors of users, to estimate the number of purchased tickets and the total revenue. The pricing strategy sets a price for a ticket based on the user’s choices, for example what type of trip a user chose, how many days before he/she booked the ticket, how much is the percentage of occupancy of the bus, on which day of week he/she booked the ticket.
5. A Case Study
To evaluate the performance and the effectiveness of DA4PT, we carried out several experiments by analyzing the event logs of an Italian bus ticketing platform. The goal of our analysis comprises discovering the main factors that influence users in purchasing bus tickets for: (i) training a machine learning algorithm able to predict whether or not a user will buy a ticket; (ii) testing dynamic pricing strategies to maximize the number of purchased tickets and the total revenue. In the following sub-sections we provide a description of the event logs we analyzed and how the different steps of the methodology were applied to them.
5.1. Data Description
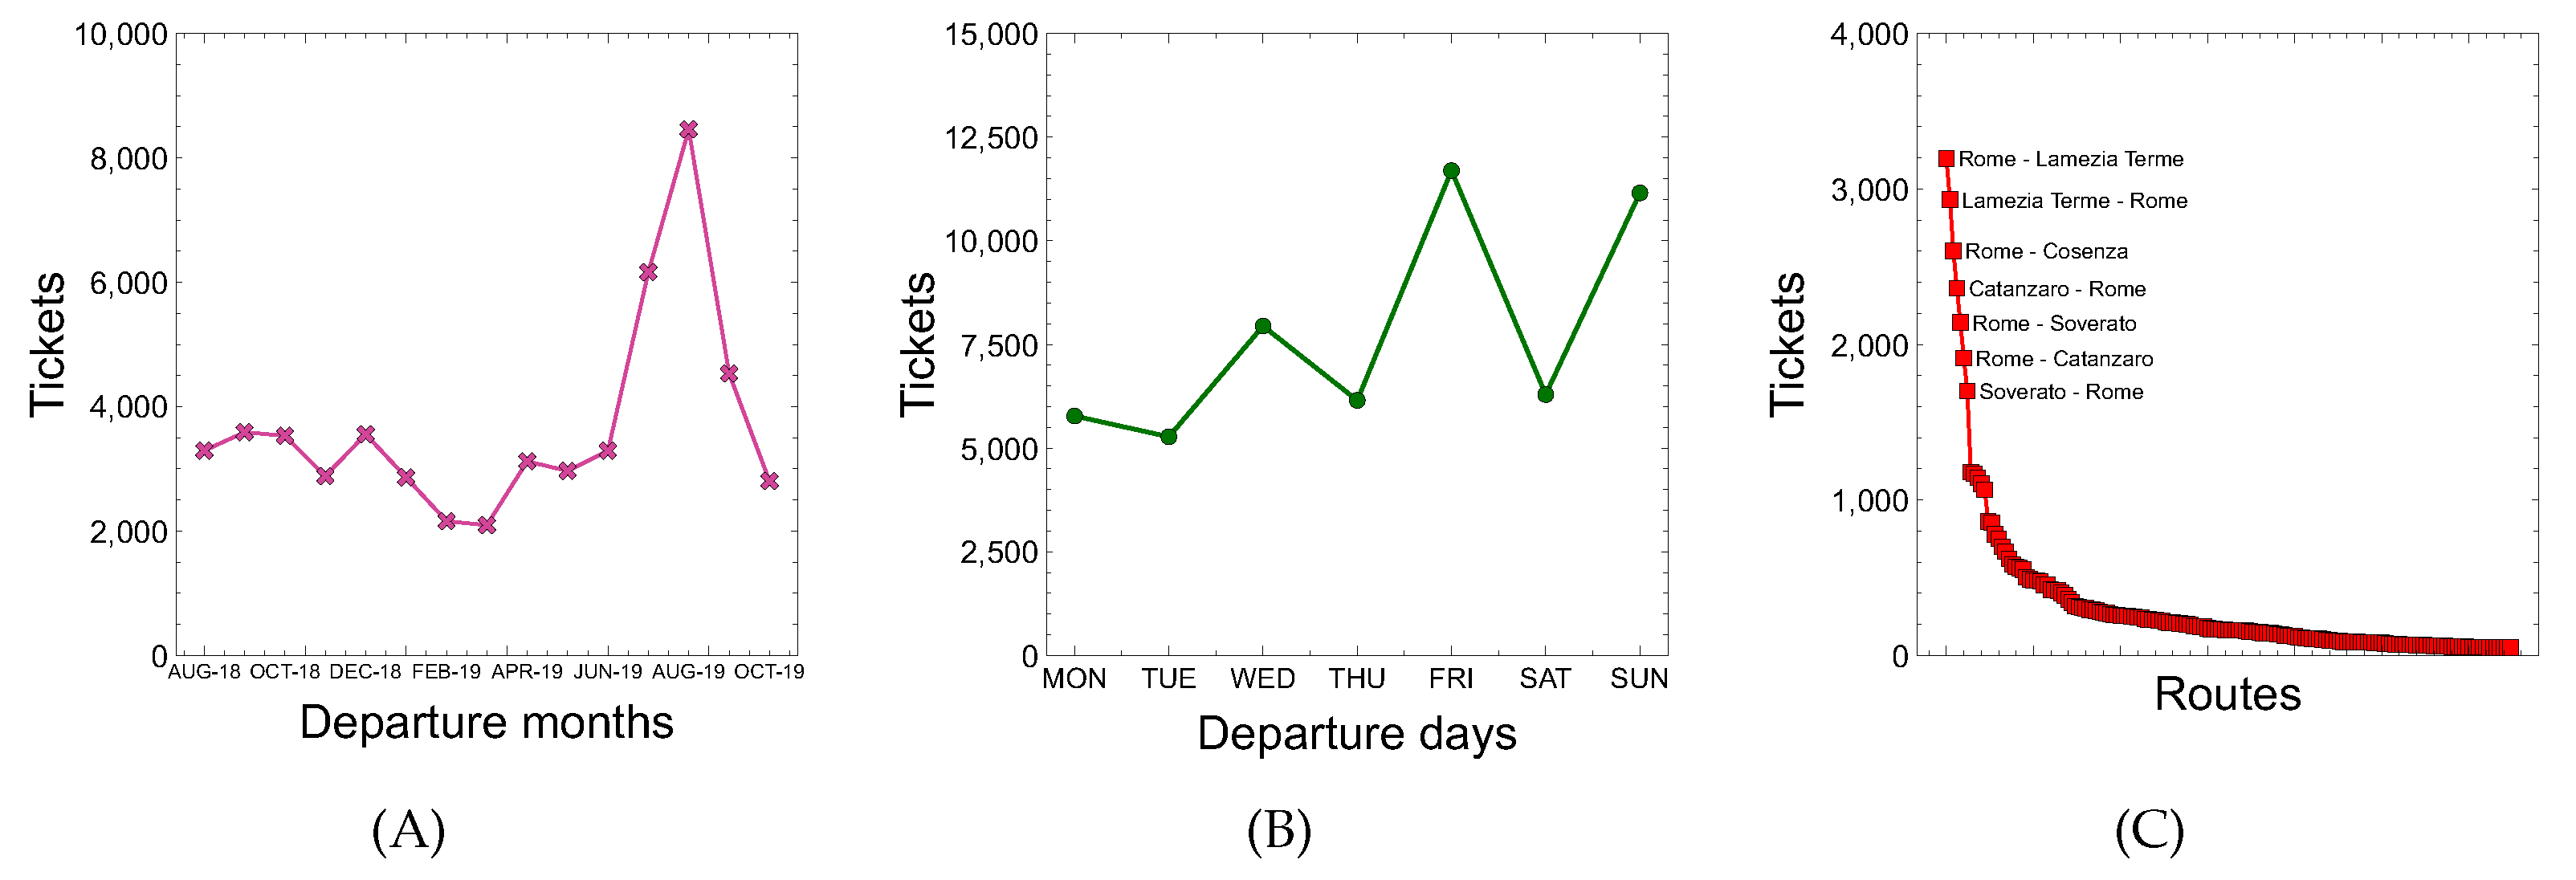
As mentioned, the data used to train the models and perform the experimental evaluation were extracted from a real bus ticketing platform. Specifically, we analyzed more than 3 million of event logs, i.e., a real collection of instances describing the operations made by users to book a ticket on an Italian bus company, collected from 1 August 2018 to 20 October 2019. This log was obtained from a bus ticket sales company that mainly offers trips from Calabrian cities to the most important Italian cities. During the working months, the tickets are mainly purchased by Calabrian citizens to reach the Italian cities, while during holidays by tourists to reach the main attractions present in Calabria.
Figure 3 shows some features of the collected data. In particular, Figure 3A suggests that most people travel in summer (June-September), since the bus company offers most of the trips to/from Calabria, an Italian region with a strong tourist inclination especially in the summer. Figure 3B indicates that the number of trips in the weekend is higher than in working days, whereas Figure 3C shows how some routes are more popular than others. For example, the number of purchased tickets for the route <Rome-Lamezia Terme> is about 3400 because the Calabria region is a tourist destination and many workers/students live outside the region.
5.2. Steps 1–2: Data Collection and Process Mining
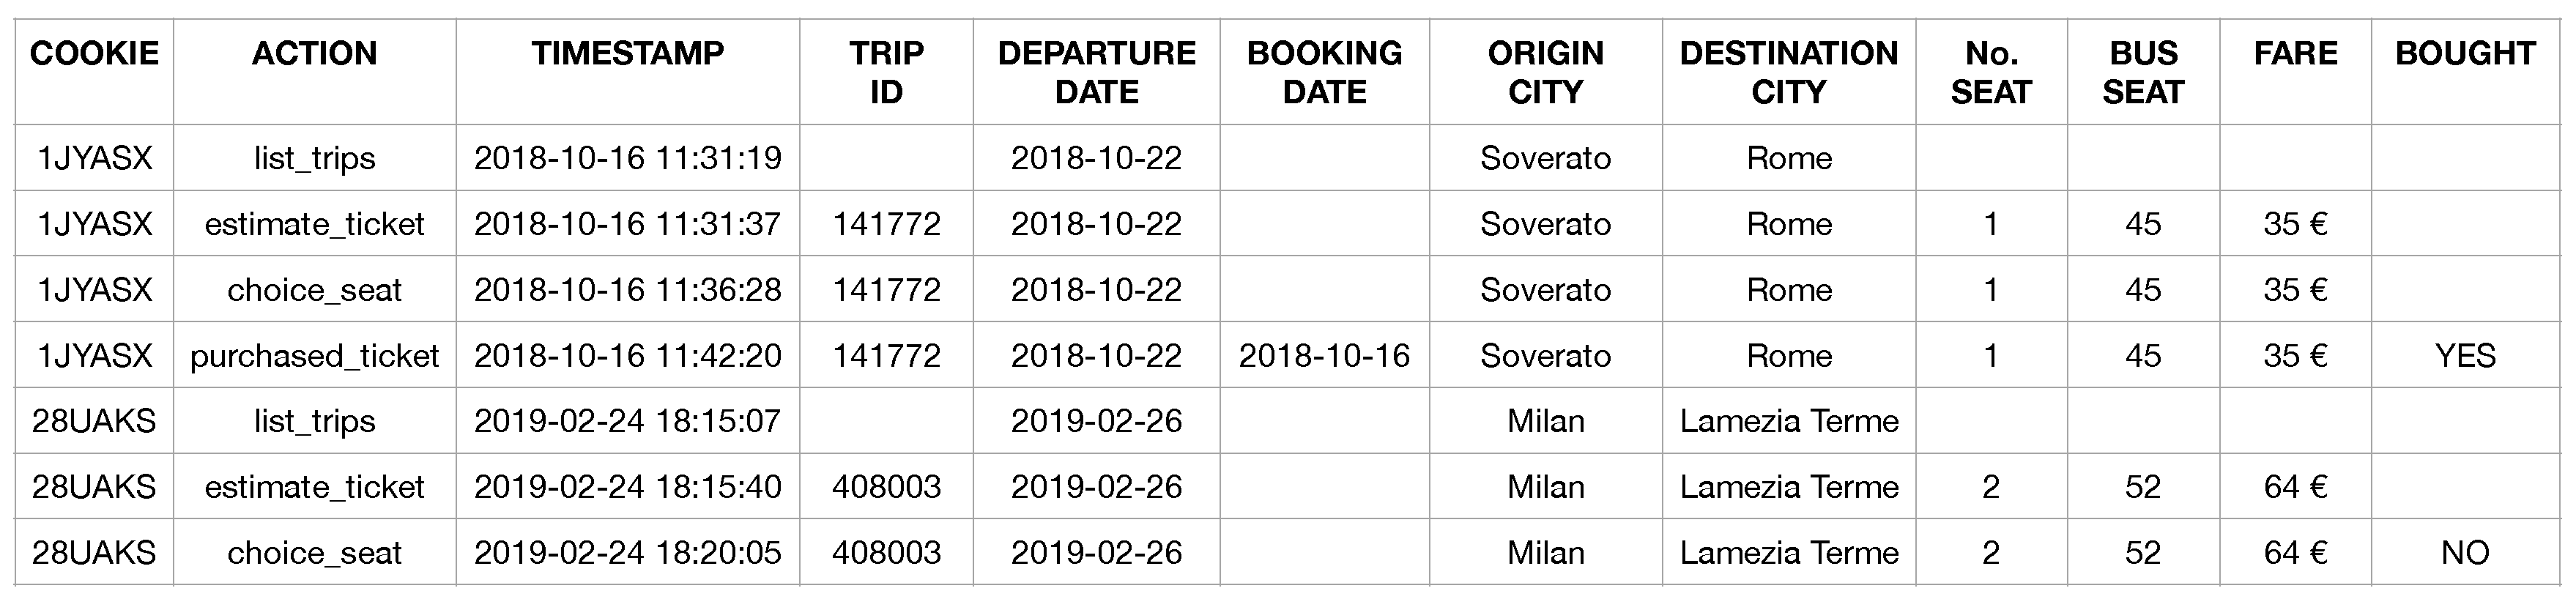
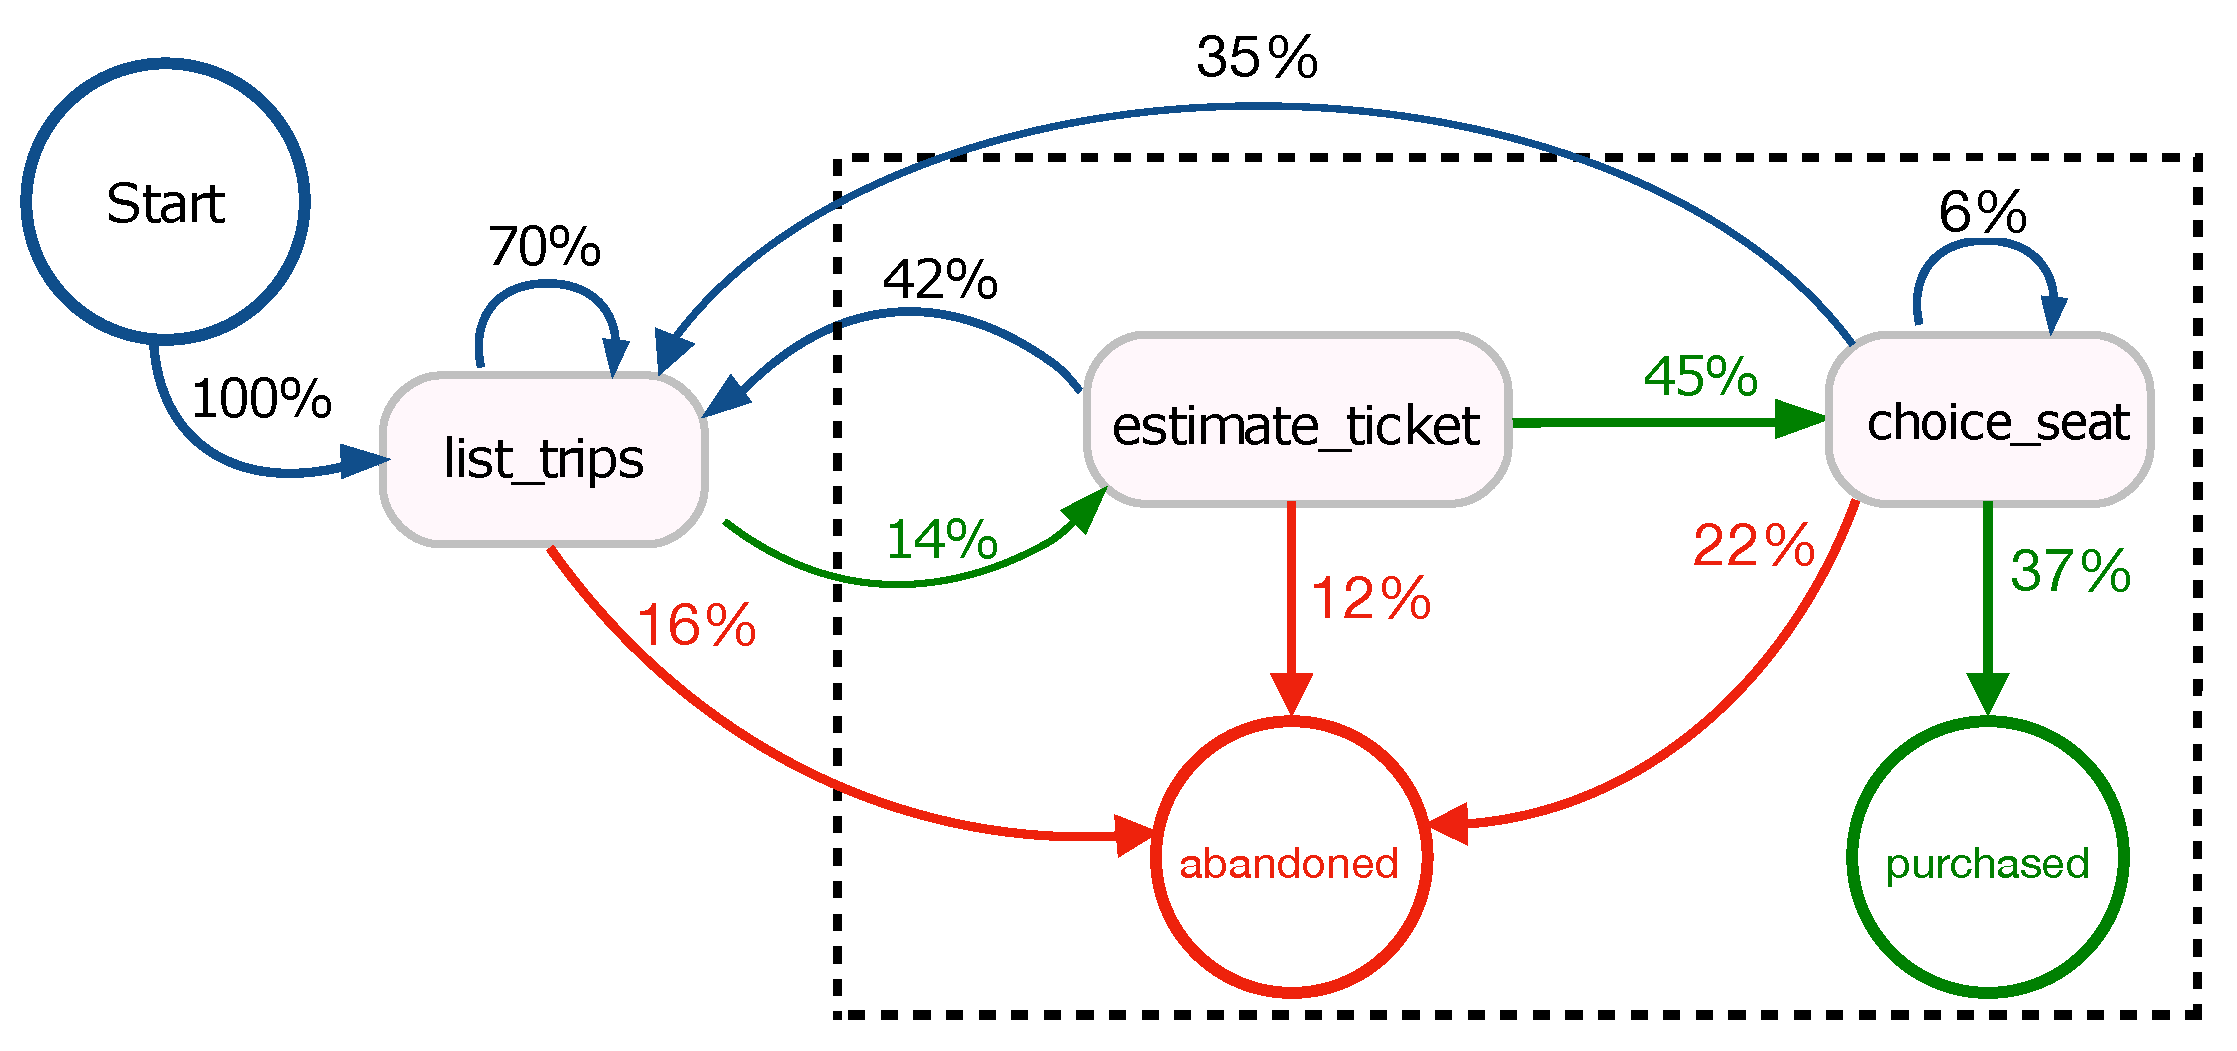
The event logs (EL) is composed by all interactions of the users with the bus ticketing platform. In particular, a user interacts with the platform by generating four types of events, as shown in Figure 4: (i) list_trips, for finding the routes between the origin and destination locations; (ii) estimate_ticket, for determining the itinerary cost on the basis of the route chosen by a user; (iii) choice_seat, for finding available seats on the bus chosen; (iv) purchased_ticket, for confirming the payment of the booked trip.
For example, the user with ID 1JYASX queried the system asking for the list of trips of the route Soverato-Rome (line 1). He/she selected a trip and displayed the cost of the ticket (line 2), chose a seat on the bus (line 3), and then bought the ticket (line 4). The user with ID 28UAKS logged on to the bus ticketing platform to estimate the cost of the route Milan-Lamezia Terme (lines 5-6), but without finalizing the purchase of the ticket (line 7).
After defining the set of event logs (EL), we applied process mining algorithms with the aim of identifying trends and human patterns, and understanding behaviors of users while searching and booking bus trips.
Figure 5 shows the navigation paths corresponding to those produced by users on the bus ticketing platform. Specifically, green paths refer to events that end with the purchase of a ticket (purchased), red paths refer to events that lead a user to leave the platform (abandoned), and blue paths refer to redundant events that generate loops. The percentage present on the edges represents the percentage of users who leave a state to reach another state or a terminal one (abandoned or purchased). For example, among users looking for a trip (list_trips event), 70% change their search query by looking for a new trip, 14% continue browsing estimating the cost of the chosen trip, and 16% leave the platform without buying a ticket.
We cleaned collected data by removing for each user all blue paths. Then, we selected only paths related to purchased and abandoned events by keeping the last event of the booking life cycle per user. To analyze the behavior of a user who searched the possible routes between two localities in a given date (list_trips), we focused on all the events a user generates when chooses one of the routes by viewing the ticket price (estimate_ticket). As shown in the dashed rectangle in Figure 5, we considered only the events estimate_ticket, choice_seat, purchased and abandoned. In this range, only 17% of users purchase a ticket (45% choose a seat, of which only 37% purchase) while 83% abandon the platform without buying. In summary, we focused our analysis on 247,525 final events of which 17% (42,995 events) led to the purchase of one or more tickets (in total 54,284 of purchased tickets) and a total revenue of 2,215,677 €.
5.3. Step 3: Discovery of Purchase Factors
In the following, we present the main results of the correlation analysis. In particular, the result of our analysis is to find the correlation between the five derived attributes - days before departure (DBD), booking day of the week (BDOW), occupancy rate for a bus (OCCR), number of attempts (NA) and fare of a ticket (HMLF) - and the class attribute (purchased or abandoned) as described in Section 4.2. For each derived attribute, we measure the numbers and the percentage of purchased tickets and correlation.
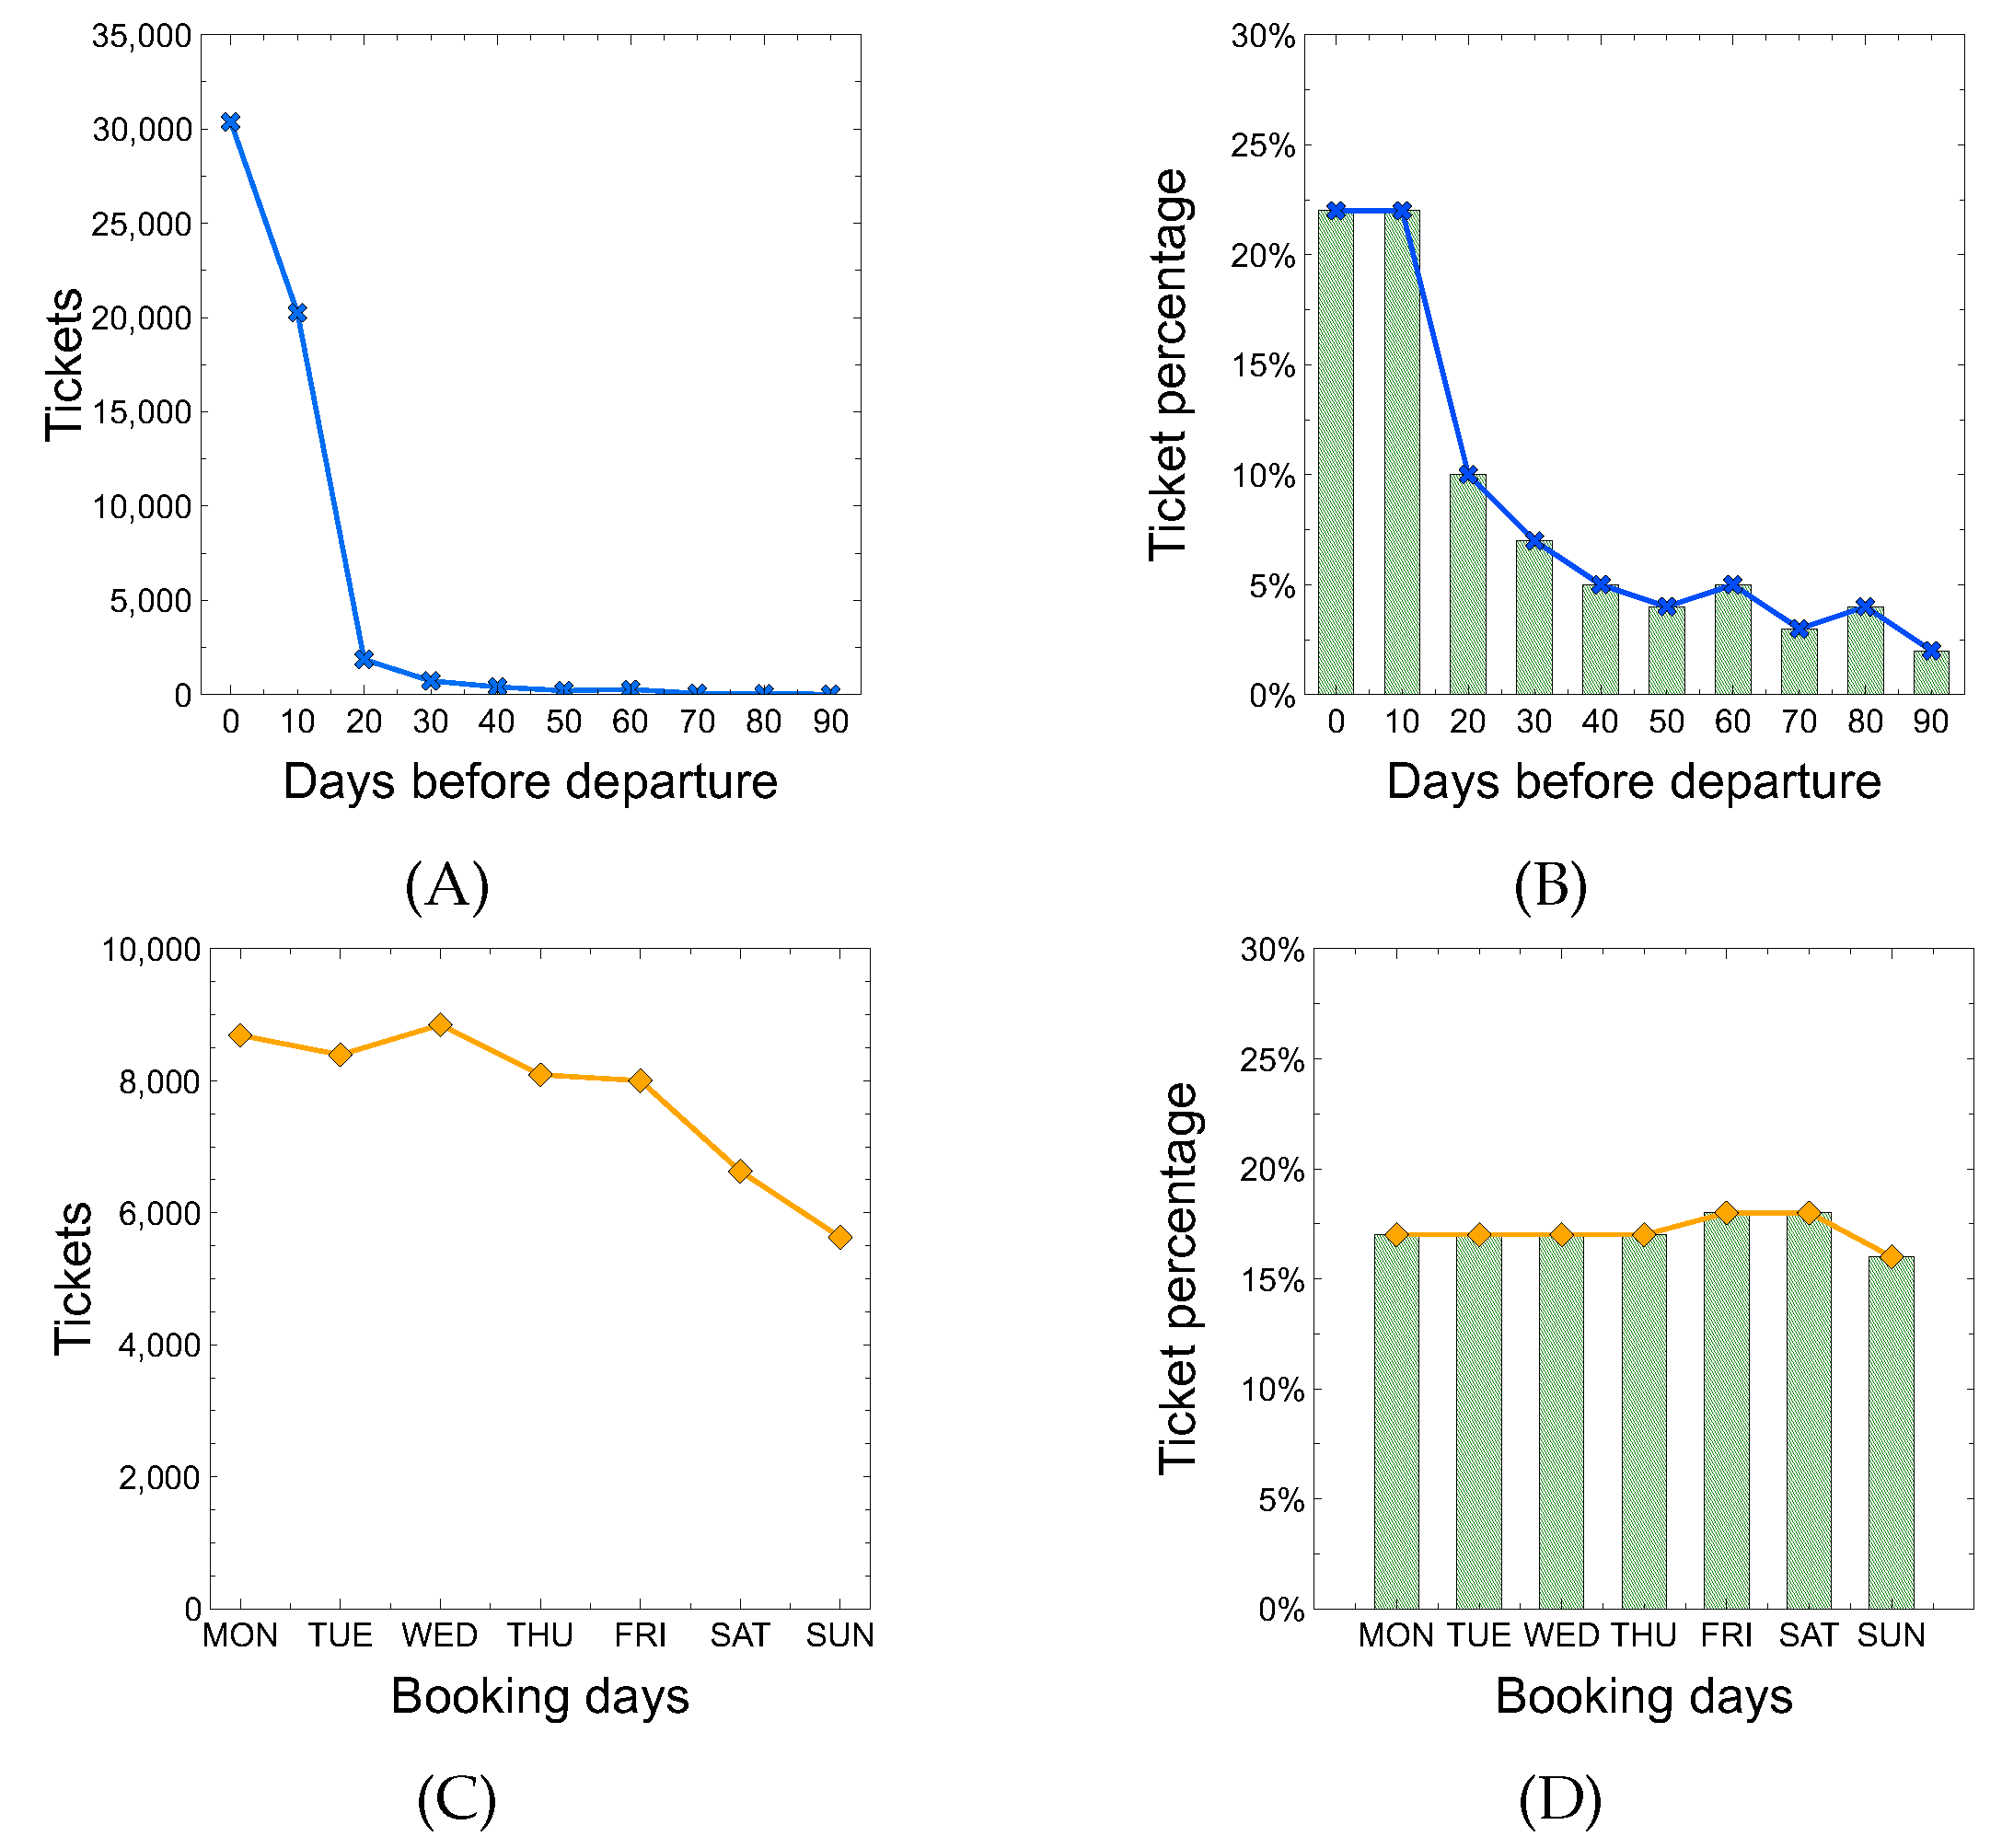
Starting from the DBD attribute, Figure 6A shows the number of purchased tickets versus the number of days before departure. The chart clearly shows that most tickets are sold close to the departure date. For example, about 30 K tickets were purchased on the platform between 0 and 9 days before the trip, 20 K between 10 and 20 days before, and so on. By observing the trend line over histogram in Figure 6B, it can be noted that the percentage of purchasing a ticket is pretty high a few days passed from booking to departure, then there is a decreasing when the date of departure is far away. For example, 22% of users complete the purchase of the ticket between 0 and 19 days before the trip, 10% between 20 and 29 days before, and so on.
Considering the BDOW attribute, Figure 6C shows that most tickets are purchased in the first three days of the week (MON-TUE-WED), while in the other four days the number of purchased tickets drops drastically. Figure 6D shows that the probability of purchasing a ticket is slightly higher on Fridays and Saturdays compared to other days of the week.
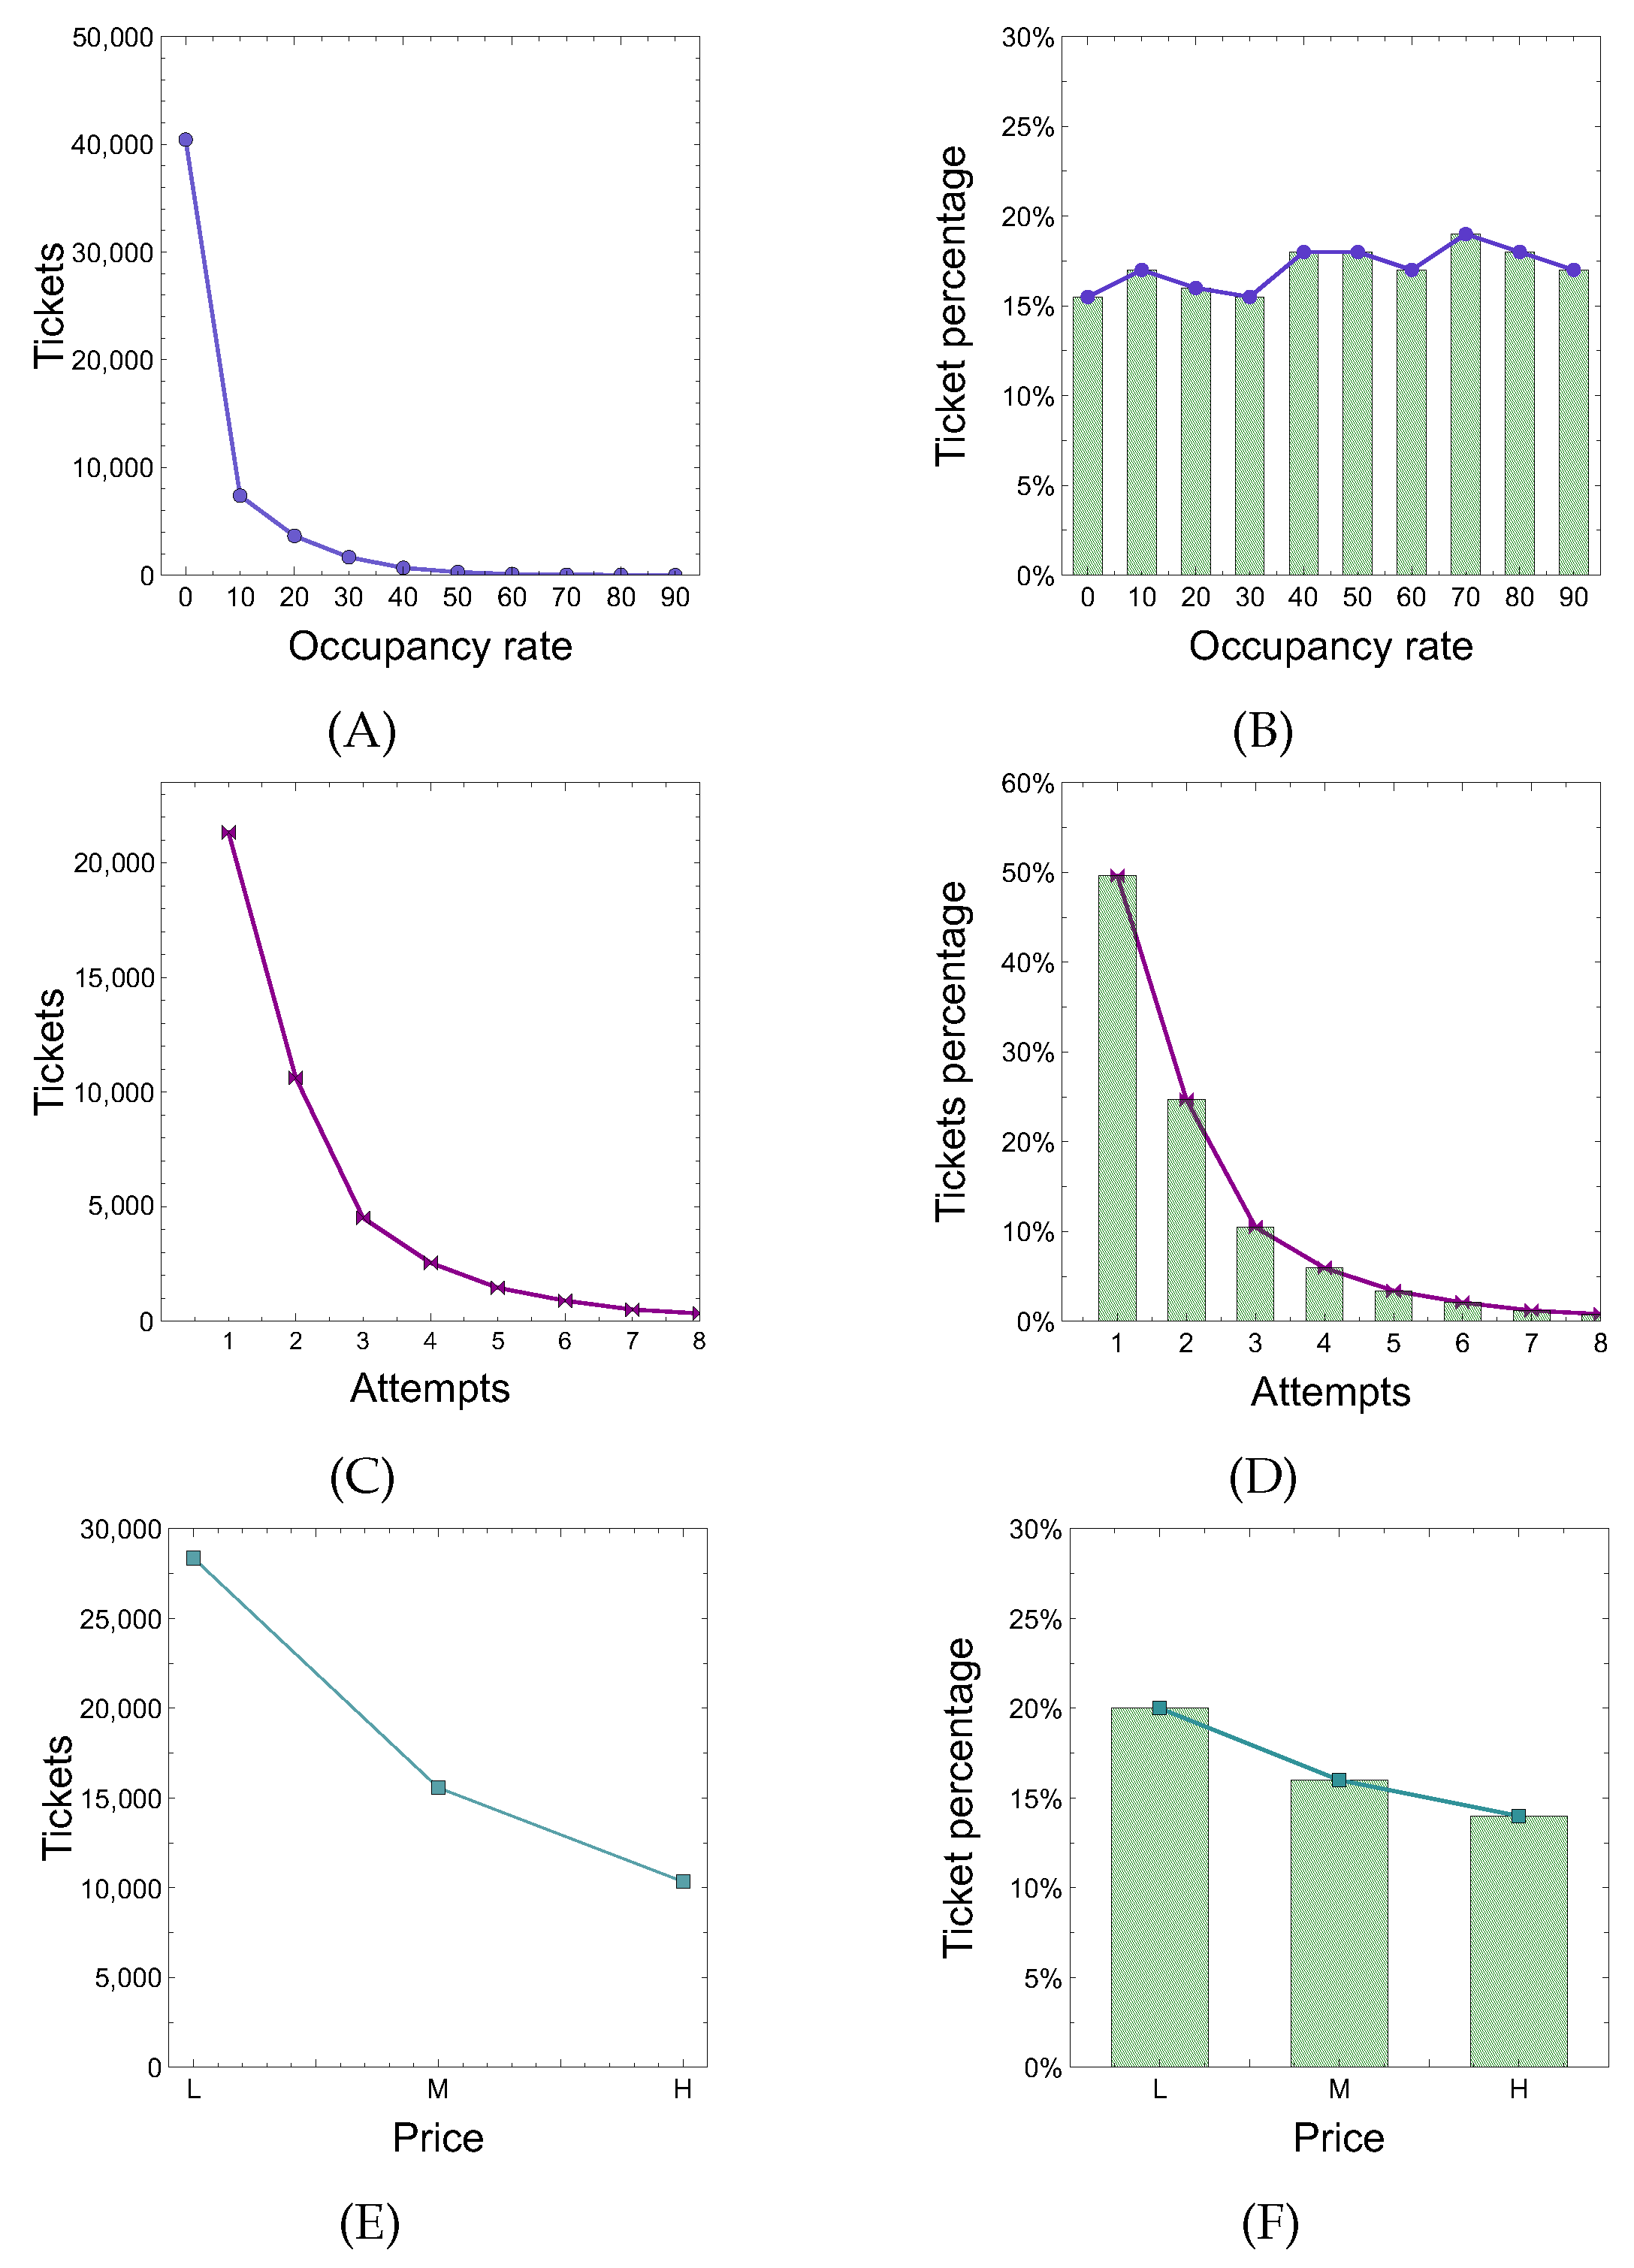
We evaluated how the occupancy rate (OCCR) attribute influences the buying behavior of users. As shown in Figure 7A, users often buy tickets when the percentage of available seats is between 10% and 30%, whereas the trend line shown in Figure 7B, describes that the probability of purchasing a ticket lightly increases when the bus seats are running out. Please note that several buses do not reach the full occupancy because many tickets are not bought on the web platform, and therefore are not recorded in the event logs.
We also evaluated how the number of attempts (NA) attribute influences the buying behavior of users. Given a route and a departure date, in Figure 7 we show user behavior based on the number of attempts made before purchasing a ticket or leaving the platform. In particular, Figure 7C shows that most users purchased a ticket making more than one attempt, whereas Figure 7D shows that the purchase probability decreases with increasing attempts.
Finally, we show the impact that the fare of a ticket (HMLF) attribute had on users’ purchasing choices. In particular, for each trip itinerary we divided the price into high, medium and low, obviously noting that most users buy tickets when the prices are low (Figure 7E). In fact, the probability of buying a ticket in low range (about 20%) is much higher than buying it in medium and high ranges (about 15% and 13% respectively), as shown in Figure 7F.
To define the potential purchase factors, a correlation analysis was executed. The DBD (days before departure) attribute have the highest correlation coefficient (r) with a value of 0.86. The other attributes have the following correlation with the class attribute: r = 0.74 for OCCR (occupancy rate) and BDOW (booking day of the week), r = 0.62 for NA (number of attempts), and r = 0.68 for HMLF (fare of a ticket).
We also evaluated the variance inflation factor (VIF) to identify which attributes could be affected by multicollinearity (attributes with a VIF value greater than a 5). Fortunately, none of our variables were affected by multicollinearity. In fact, we achieved the following VIP values: DBD with a VIF value of 1.68, BDOW with 1.23, OCCR with 1.20, NA with 1.67, and HMLF with 1.18.
5.4. Step 4: Prediction Model
We experimentally evaluated the accuracy of five machine learning algorithms (Naïve Bayes, Logistic Regression, Decision Tree, Random Forest, and XGBoost) to predict whether a user will buy or not a ticket. First of all, being our training data highly unbalanced (247,525 events with 42,995 purchased and 204,530 abandoned), we used a random under-sampling algorithm to balance the class distribution in . After, we performed the comparative analysis, by evaluating the forecasting performance of the five machine learning algorithms. As performance indicators we used accuracy, precision, recall and F1-score. The goal is to maximize accuracy with balanced values of F1-score. Moreover, to measure the quality of a classifier with respect to a given class, for each algorithm we evaluated the purchased recall () and abandoned recall ().
Table 1 summarizes the results obtained by the five machine learning algorithms we used. Specifically, XGBoost and Random Forest proved to be the best classification models with R = 0.95 ( = 0.97 and = 0.90) and R = 0.93 ( = 0.95 and = 0.85), respectively. A high value of accuracy is also obtained by Decision Tree with R = 0.86 ( = 0.87 and = 0.84), showing good robustness and stability. The same value of accuracy is observed for Naïve Bayes and Logistic Regression (R = 0.61), but Naïve Bayes is less accurate on the purchased class than abandoned class ( = 0.40 and = 0.82).
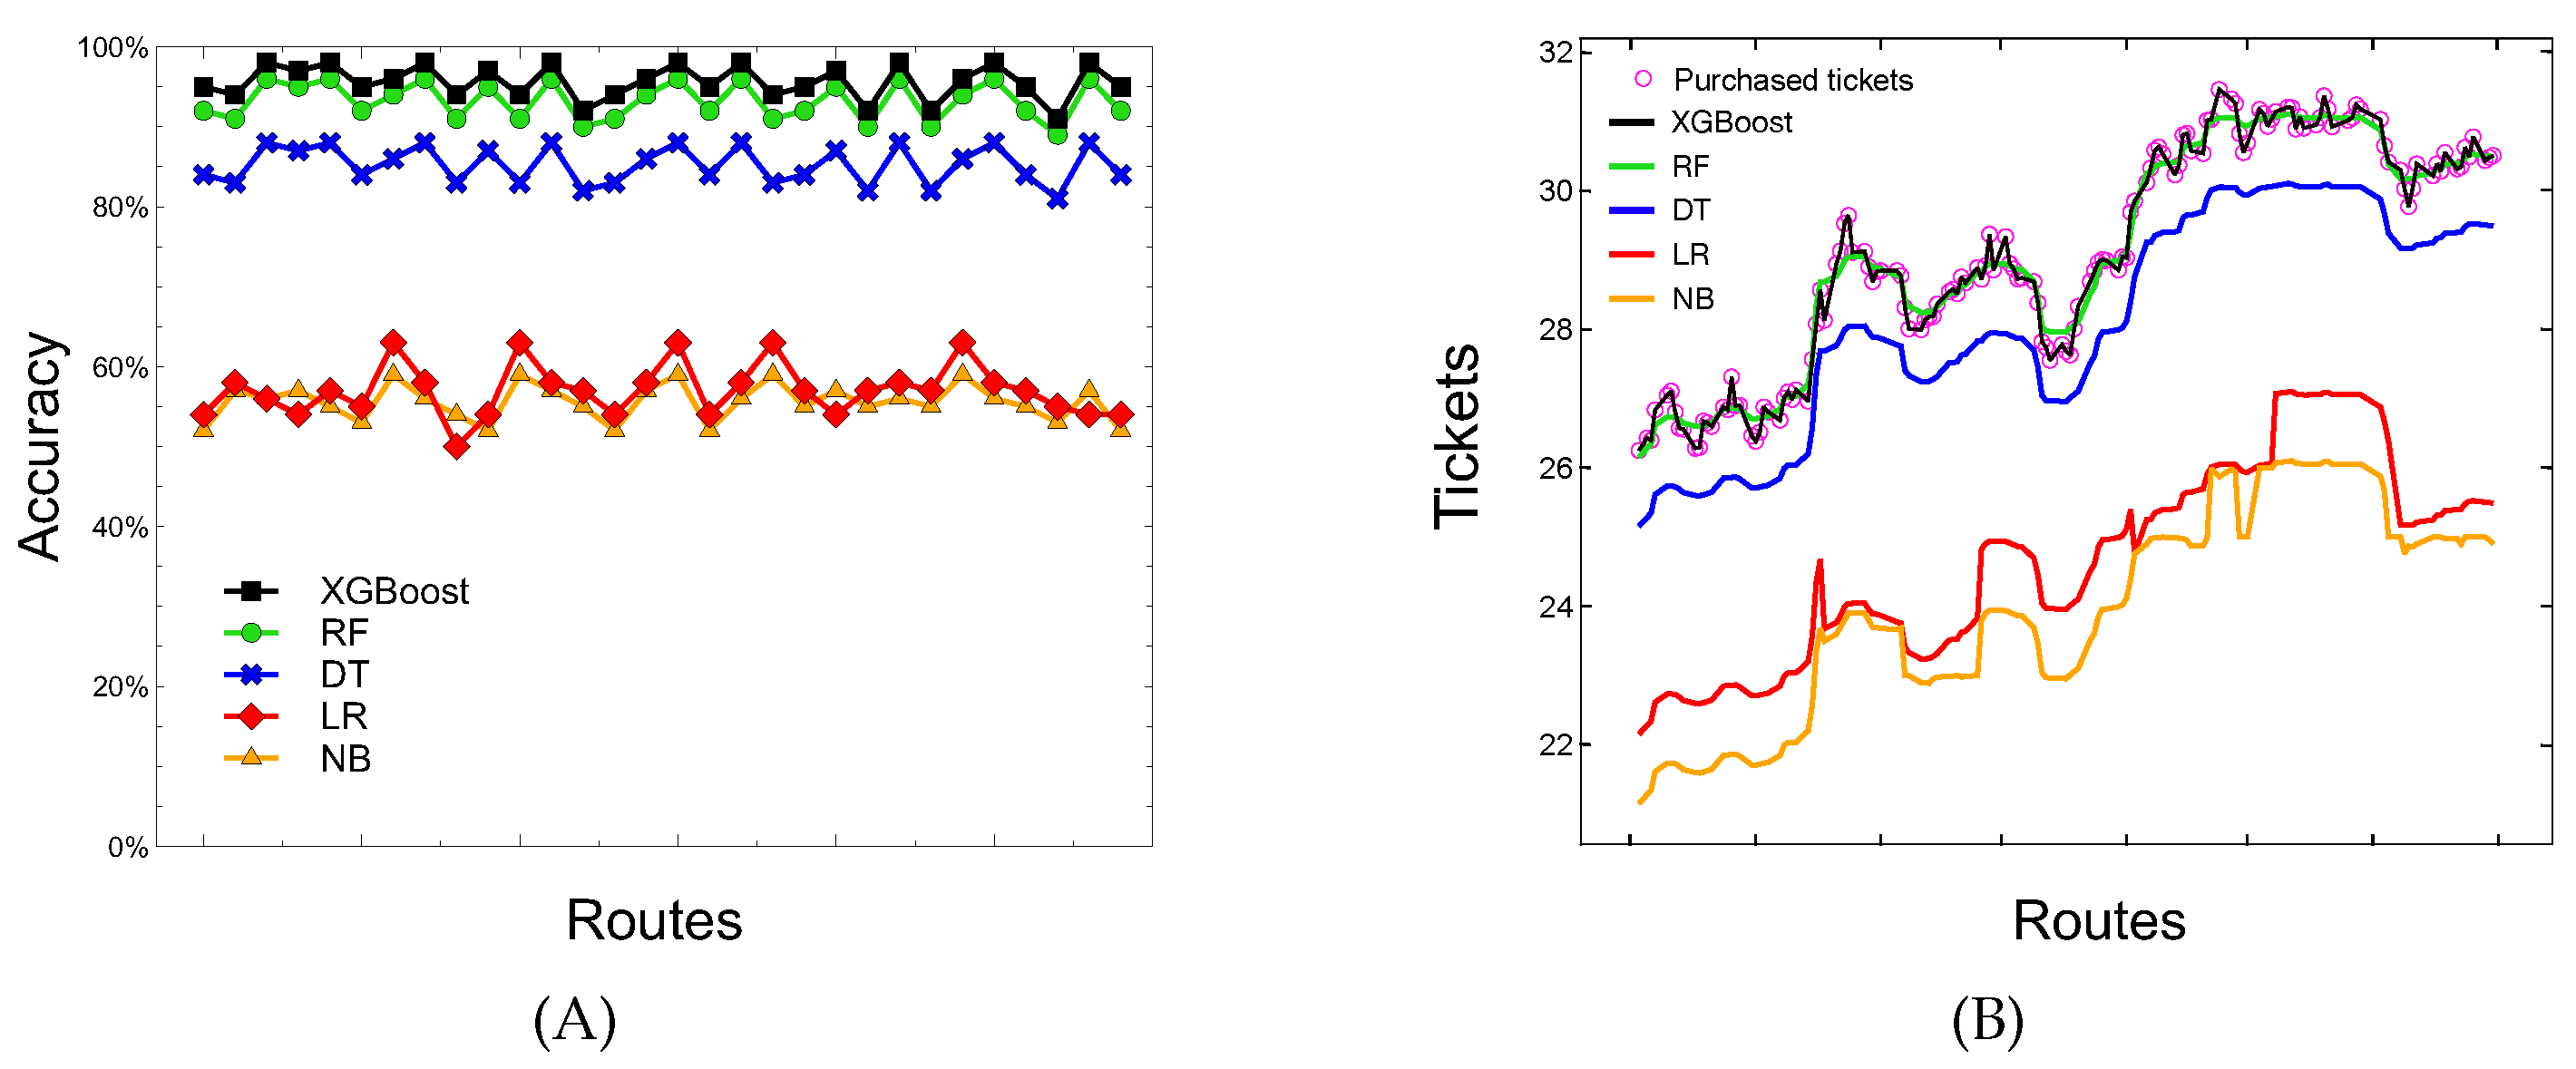
Figure 8 summarizes the results of the comparison, showing the achieved accuracy and the number of predicted tickets for the thirty routes most requested by users. Specifically, Figure 8A shows a time plot of the collected tickets data, in which the accuracy performance of the five machine learning algorithms is plotted versus the number of routes. The trend is quite evident: the accuracy of XGBoost stably ranging from 0.92 to 0.98, followed by Random Forest (0.91–0.96), Decision Tree (0.81–0.88), Logistic Regression (0.50–0.63), and Naïve Bayes (0.52–0.59). Figure 8B shows the number of tickets correctly predicted related to the purchased class. Also in this case, the accuracy of XGBoost and Random Forest is the highest in all routes considered, confirming their very good prediction performance with respect to the other algorithms in the demand forecasting domain.
5.5. Step 5: Dynamic Pricing
For testing different pricing strategies we developed a synthetic event generator capable of generating events similar to those in the original input log. Specifically, synthetic data is generated by using a multivariate empirical distribution based on input data {{, , ...}, {, , ...}, ...}, where are the observed values for the first attribute, are the observed values for second attribute, and so on. The original log file is an ordered list of events, where an represents a user that in a certain day () purchases/don’t purchase a ticket for a given and . The event logs generator algorithm, for each seed, produces a synthetic log of 247,525 events (same cardinality of the initial log). The generator does not establish for each event whether it leads to the purchase of a ticket or not. A second algorithm, event logs processing, will establish whether the ticket will be sold or not according to a price strategy.
We generated ten log event files by using ten different seeds, and so the mean and variance of the number of purchased tickets and total revenue are shown. Moreover, whenever we make a random choice from the data present in our log file, we use a weighted random distribution. This allows defining events with similar characteristics of real data. For example, if there is a route more chosen by users, we should also find this feature in the output data. We compare the results obtained with different pricing strategies against those present in the original data.
5.5.1. Event Logs Generator
Algorithm 1 shows the pseudo-code used to generate a log file. The input of the algorithm is composed of: (i) a list of routes R; (ii) a map which defines for each the dates on which a bus service is available; (iii) two maps, and , which links the number of purchased events to the factors and ; (iv) the number of events n to generate; (v) a seed number s to generate random values. The output is a list of events E.
The algorithm iterates (lines 1–14) for generating n events, by performing the following operations:
- Select a randomly from (line 3) in accordance with a weighted random distribution.
- Select a randomly among all those present in for the chosen (line 5).
- Select the number of randomly among all those present in (line 7).
- Calculate the starting from the and subtracting days (line 9).
- Determine the the user will want to buy randomly among all those present in (line 11). Most users buy only one ticket, in rare cases more than one.
- Define the by grouping all the information we just generated (, , , ) (line 12).
- Add the to E (line 13).
Before being returned, the list of events E is sorted in ascending order by (line 15).
| Algorithm 1: Event logs generator. |
 |
5.5.2. Event Logs Processing
Algorithm 2 shows how a log file is analyzed according to a pricing strategy. The input of the algorithm is composed of: (i) a list of events E generated by Algorithm 1; (ii) a pricing ; (iii) four maps (, , , ) linking the purchase factors - days before departure, booking days, occupancy rate, price - with the percentage of purchased events; (iv) a seed number s. The output is composed by the number of purchased events, the number of purchased tickets and the total revenue.
The algorithm initializes the outputs (line 1) and a map for storing the occupancy of each bus for a given route and day (line 3). The algorithm analyzes each (lines 4–20) by performing the following operations:
- Retrieve the information about , and from the current (lines 5–7). It also retrieves the information from (line 8).
- Set a price for the according to the (line 10).
- Establish the probability of purchase based on the information (, , and of the ticket) and based on users’ behavior as described in Section 5.3 (line 12). Since for each user’s choice (e.g., ) we can determine the probability of purchasing a ticket, we combine these probabilities to define a cumulative probability of the .
- Generate a number between 0 and 1 (line 13).
- If the random number is less than the probability of purchase and if there are free seats on the considered bus, the tickets are considered sold (lines 14–19). Otherwise, we consider that the user has left the platform without buying any tickets. If the user has purchased tickets, the number of purchased events and tickets are increased (lines 15–16) and the total revenue are updated (line 17). Finally, the occupancy of the considered bus is updated based on the number of tickets sold (line 18).
| Algorithm 2: Event logs processing. |
 |
5.5.3. Strategies Evaluation
Seven pricing strategies were tested in order to measure the number of tickets sold and the total revenue. Some of them are standard strategies, others are dynamic strategies based on days before departure () and occupancy rate () factors that showed a strong correlation with the purchase of a ticket. Thus, the following strategies were used:
- Standard: A basic strategy similar to the one used by the bus company. This strategy sets ticket prices according to the rules present in the original data.
- Fix-Low: A strategy that always establishes a low ticket price. We are able to do this because for each route we know the price ranges and we can divide them into three categories (low, medium and high). With this strategy, given a route, we select one of the prices that fall into the low category.
- Fix-Med: A strategy that always establishes a medium ticket price.
- Fix-Hig: A strategy that always establishes a high ticket price.
- Dyn-Day: A dynamic strategy that sets the price based on how many days before departure () the user try to book a ticket. Specifically, the formula used is the following:
- Dyn-Occ: A dynamic strategy that sets the price based on the bus occupancy rate () the user wants to book. Specifically, the formula used is the following:
- Dyn-Mix: A strategy that sets the price based on the days before departure () and on the bus occupancy rate (). Specifically, the formula used is the following:
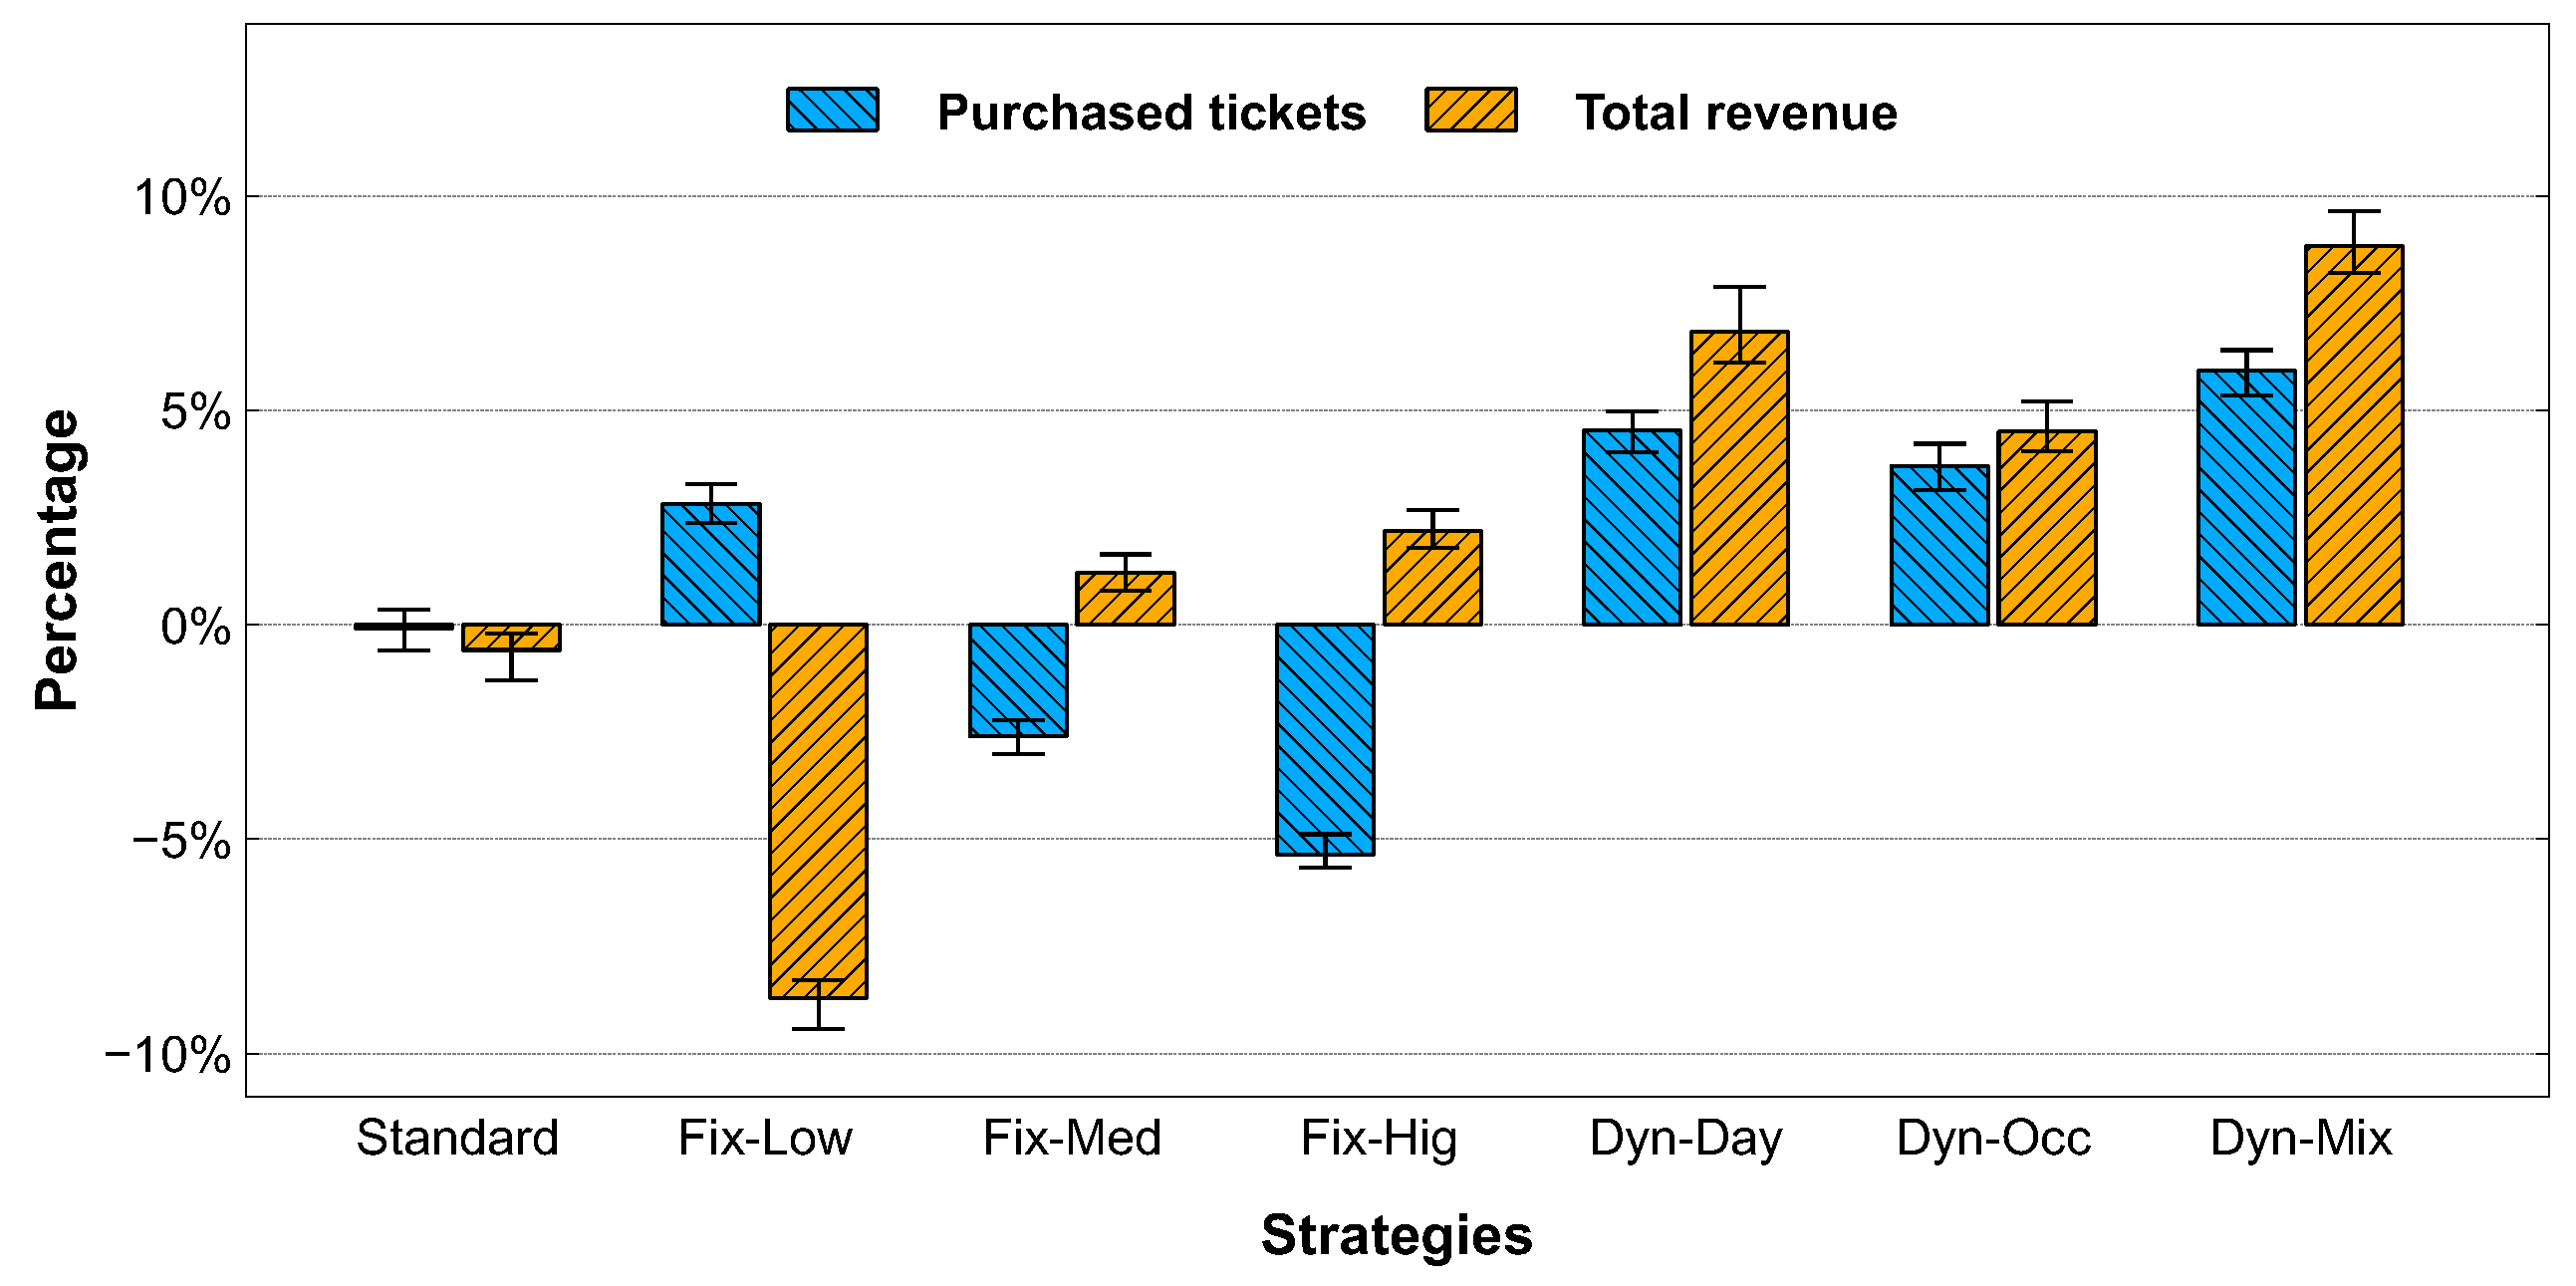
Figure 9 shows the results achieved using the different pricing strategies compared with those of source data, which include 247,525 final events, 42,995 purchased events, 54,284 of purchased tickets and a total revenue of 2,215,677 €. Since the number of purchased tickets depends on the number of purchased events and they are directly proportional, we show in the chart only the value of the purchased tickets.
With the standard strategy, the number of tickets is practically the same as found in the input log file with a slightly changes in the total revenue (on average −2%). Using the fixed strategies, when the ticket price is always low, there is an increase of the number of ticket sales (+5%) but a decrease of the total revenue (−9%). When the price is medium, the average number of purchased tickets goes down (−3%) but the revenue rises slightly (+1%), whereas when the price is always high the number of ticket sales goes down (−5%) but the total revenue increases (+3%).
With dynamic strategies, we are able to increase both the number of purchased tickets and the total revenue. With the strategy that considers only the days before departure (Dyn-Day), we can increase the tickets sold by +4% and the total revenue by +6%. Even considering only the bus occupancy rate (Dyn-Occ), we obtain similar results with 4% increase in the number of tickets and 5% of total revenue. With the mixed strategy (Dyn-Mix), we are able to have the maximum increase in the number of purchased tickets (+6%) and total revenue (+9%). This is due to a good sales strategy that sell the largest number of tickets at variable prices in order to try to maximize revenues. These experimental results show that dynamic pricing strategies allow bus companies to sell a greater number of tickets (thus occupying more seats inside the bus) and also to increase revenues by intercepting user demand.
6. Conclusions
This paper presented a methodology, called DA4PT, aimed at discovering the main factors influencing users in purchasing bus tickets both for training a machine learning model able to predict whether or not a user will buy a ticket, and for testing pricing strategies for maximizing the number of purchased tickets and the total revenue of a bus company.
DA4PT was validated through a real case study based on 3.23 million event logs of an Italian bus ticketing platform, collected from 1 August 2018 to 20 October 2019. The results obtained by this study reveal that factors such as occupancy rate, fare of a ticket, and number of days passed from booking to departure, have significant influence on travelers’ buying decisions.
Experimental evaluation showed that the proposed approach can forecast the number of purchased tickets with high accuracy. In particular, we presented a comparative analysis between algorithms commonly used in classification analysis literature, showing that Random Forest and XGBoost proved to be the best classification algorithm, with an accuracy more than 90% and a low variance. Moreover, we have shown that a dynamic pricing strategy, based on bus occupancy and how many days before booking a ticket, can increase the number of tickets purchased by 6% and the total revenue by 9% compared to a standard pricing policy.
Our methodology can be used for analyzing the buying behavior of large communities of people and providing valuable information and high-quality knowledge that are fundamental for the growth of business and organization systems. Moreover, the use of dynamic pricing strategies allows companies to sell a greater number of goods and things and also increase revenues by intercepting user demand.
In future work, additional research issues will be investigated. For example, our prediction model can be extended considering also external factors that certainly influence users in purchasing tickets, such as the strategies and prices offered by competitors (train, airline and other bus companies). In addition, we can use our methodology in other sales areas by demonstrating how the use of advanced forecasting techniques together with dynamic pricing strategies can increase tickets purchased and company revenues.
Author Contributions
All the authors contributed to the structuring of this paper. F.B. designed the methodology, implemented the model, and performed experimental evaluations. F.M. designed the methodology, developed the dynamic pricing strategies, and performed numerical simulations. D.T. led the research activities and reviewed the content of the paper. All authors have read and agreed to the published version of the manuscript.
Funding
This research received no external funding.
Acknowledgments
This work has been partially supported by the “Moving +: Dati In Movimento” Project, CUP J28C17000300006, funded by Regione Calabria (POR FESR-FSE 2014-2020).
Conflicts of Interest
The authors declare no conflict of interest.
References
- Grimaldi, R.; Augustin, K.; Beria, P. Intercity coach liberalisation. The cases of Germany and Italy. In World Conference on Transport Research-WCTR 2016; Elsevier: Amsterdam, The Netherlands, 2017; pp. 474–490. [Google Scholar]
- Gremm, C. Impacts of the German interurban bus market deregulation on regional railway services. In Proceedings of the International Conference Series on Competition and Ownership in Land Passenger Transport, Stockholm, Sweden, 1 January 2017. [Google Scholar]
- Belcastro, L.; Marozzo, F.; Talia, D. Programming Models and Systems for Big Data Analysis. Int. J. Parallel Emergent Distrib. Syst. 2019, 34, 632–652. [Google Scholar] [CrossRef]
- Talia, D.; Trunfio, P.; Marozzo, F. Data Analysis in the Cloud: Models, Techniques and Applications; Elsevier: Amsterdam, The Netherlands, 2015; pp. 1–138. [Google Scholar] [CrossRef]
- Branda, F.; Marozzo, F.; Talia, D. Discovering Travelers’ Purchasing Behavior from Public Transport Data. In Proceedings of the 6th International Conference on machine Learning, Optimization and Data science-LOD 2020, Siena, Italy, 19–23 July 2020; pp. 702–713. [Google Scholar]
- Saharan, S.; Bawa, S.; Kumar, N. Dynamic pricing techniques for Intelligent Transportation System in smart cities: A systematic review. Comput. Commun. 2020, 150, 603–625. [Google Scholar] [CrossRef]
- Bayoumi, A.E.M.; Saleh, M.; Atiya, A.F.; Aziz, H.A. Dynamic pricing for hotel revenue management using price multipliers. J. Revenue Pricing Manag. 2013, 12, 271–285. [Google Scholar] [CrossRef]
- Abrate, G.; Fraquelli, G.; Viglia, G. Dynamic pricing strategies: Evidence from European hotels. Int. J. Hosp. Manag. 2012, 31, 160–168. [Google Scholar] [CrossRef] [Green Version]
- Hall, J.M.; Kopalle, P.K.; Krishna, A. Retailer dynamic pricing and ordering decisions: Category management versus brand-by-brand approaches. J. Retail. 2010, 86, 172–183. [Google Scholar] [CrossRef]
- Dutta, G.; Mitra, K. A literature review on dynamic pricing of electricity. J. Oper. Res. Soc. 2017, 68, 1131–1145. [Google Scholar] [CrossRef] [Green Version]
- Liu, J.; Liu, B.; Liu, Y.; Chen, H.; Feng, L.; Xiong, H.; Huang, Y. Personalized air travel prediction: A multi-factor perspective. ACM Trans. Intell. Syst. Technol. (TIST) 2017, 9, 1–26. [Google Scholar] [CrossRef]
- Mumbower, S.; Garrow, L.A.; Higgins, M.J. Estimating flight-level price elasticities using online airline data. Transp. Res. Part A Policy Pract. 2014, 66, 196–212. [Google Scholar] [CrossRef]
- Abdelghany, A.; Guzhva, V. A time-series modelling approach for airport short-term demand forecasting. J. Airpt. Manag. 2010, 5, 72–87. [Google Scholar]
- Yeboah, G.; Cottrill, C.D.; Nelson, J.D.; Corsar, D.; Markovic, M.; Edwards, P. Understanding factors influencing public transport passengers’ pre-travel information-seeking behaviour. Public Transp. 2019, 11, 135–158. [Google Scholar] [CrossRef] [Green Version]
- Abdella, J.A.; Zaki, N.; Shuaib, K.; Khan, F. Airline ticket price and demand prediction: A survey. J. King Saud Univ. Comput. Inf. Sci. 2019. [Google Scholar] [CrossRef]
- Cheung, W.C.; Simchi-Levi, D.; Wang, H. Dynamic pricing and demand learning with limited price experimentation. Oper. Res. 2017, 65, 1722–1731. [Google Scholar] [CrossRef]
- Ganti, R.; Sustik, M.; Tran, Q.; Seaman, B. Thompson sampling for dynamic pricing. arXiv 2018, arXiv:1802.03050. [Google Scholar]
- Kemper, C.; Breuer, C. How efficient is dynamic pricing for sport events? Designing a dynamic pricing model for Bayern Munich. Int. J. Sport Financ. 2016, 11, 4–15. [Google Scholar]
- Sato, K.; Sawaki, K. Dynamic pricing of high-speed rail with transport competition. J. Revenue Pricing Manag. 2012, 11, 548–559. [Google Scholar] [CrossRef]
- Lou, Y.; Yin, Y.; Laval, J.A. Optimal dynamic pricing strategies for high-occupancy/toll lanes. Transp. Res. Part C Emerg. Technol. 2011, 19, 64–74. [Google Scholar] [CrossRef]
- Rana, R.; Oliveira, F.S. Real-time dynamic pricing in a non-stationary environment using model-free reinforcement learning. Omega 2014, 47, 116–126. [Google Scholar] [CrossRef]
- Diamantini, C.; Genga, L.; Marozzo, F.; Potena, D.; Trunfio, P. Discovering Mobility Patterns of Instagram Users through Process Mining Techniques. In Proceedings of the IEEE International Conference on Information Reuse and Integration, San Diego, CA, USA, 4–6 August 2017; pp. 485–492. [Google Scholar]
- Pearson, K. Determination of the coefficient of correlation. Science 1909, 30, 23–25. [Google Scholar] [CrossRef]
- O’brien, R.M. A caution regarding rules of thumb for variance inflation factors. Qual. Quant. 2007, 41, 673–690. [Google Scholar] [CrossRef]
- Kotsiantis, S.; Kanellopoulos, D.; Pintelas, P. Handling imbalanced datasets: A review. GESTS Int. Trans. Comput. Sci. Eng. 2006, 30, 25–36. [Google Scholar]
- Belcastro, L.; Marozzo, F.; Talia, D.; Trunfio, P. Using Scalable Data Mining for Predicting Flight Delays. ACM Trans. Intell. Syst. Technol. 2016, 8, 5:1–5:20. [Google Scholar] [CrossRef]
- Maron, M.E. Automatic indexing: An experimental inquiry. J. ACM 1961, 8, 404–417. [Google Scholar] [CrossRef]
- Walker, S.H.; Duncan, D.B. Estimation of the probability of an event as a function of several independent variables. Biometrika 1967, 54, 167–179. [Google Scholar] [CrossRef] [PubMed]
- Safavian, S.R.; Landgrebe, D. A survey of decision tree classifier methodology. IEEE Trans. Syst. Man Cybern. 1991, 21, 660–674. [Google Scholar] [CrossRef] [Green Version]
- Breiman, L. Random forests. Mach. Learn. 2001, 45, 5–32. [Google Scholar] [CrossRef] [Green Version]
- Chen, T.; Guestrin, C. Xgboost: A scalable tree boosting system. In Proceedings of the 22nd Acm Sigkdd International Conference on Knowledge Discovery and Data Mining, San Francisco, CA, USA, 13 August 2016; pp. 785–794. [Google Scholar]
Figure 1.
The steps of the DA4PT methodology.

Figure 2.
Evaluation steps of a dynamic pricing strategy.

Figure 3.
No. of purchased tickets considering (A) departure month, (B) departure day of the week, and (C) route attributes.
Figure 3.
No. of purchased tickets considering (A) departure month, (B) departure day of the week, and (C) route attributes.

Figure 4.
Example of the log events.

Figure 5.
Process mining algorithms applied to user event logs.

Figure 6.
No. and percentage of purchased tickets considering the days before departure (DBD) and the booking day of the week (BDOW).
Figure 6.
No. and percentage of purchased tickets considering the days before departure (DBD) and the booking day of the week (BDOW).

Figure 7.
No. and percentage of purchased tickets considering the occupancy rate for a bus (OCCR), the number of attempts (NA), and the fare of a ticket (HMLF).
Figure 7.
No. and percentage of purchased tickets considering the occupancy rate for a bus (OCCR), the number of attempts (NA), and the fare of a ticket (HMLF).

Figure 8.
Accuracy obtained (A) and number of predicted tickets (B) by Naïve Bayes (NB), Logistic Regression (LR), Decision Tree (DT), Random Forest (RF) and eXtreme Gradient Boosting (XGBoost).
Figure 8.
Accuracy obtained (A) and number of predicted tickets (B) by Naïve Bayes (NB), Logistic Regression (LR), Decision Tree (DT), Random Forest (RF) and eXtreme Gradient Boosting (XGBoost).

Figure 9.
Comparative analysis among pricing strategies, evaluating the number of purchased tickets and the relative revenue.
Figure 9.
Comparative analysis among pricing strategies, evaluating the number of purchased tickets and the relative revenue.


Table 1.
Performance evaluation.
| Algorithms | Accuracy | Precision | Recall | F1-Score |
|---|---|---|---|---|
| Naïve Bayes | 0.61 | 0.64 | 0.61 | 0.59 |
| Logistic Regression | 0.61 | 0.61 | 0.61 | 0.61 |
| Decision Tree | 0.86 | 0.86 | 0.86 | 0.86 |
| Random Forest | 0.93 | 0.93 | 0.93 | 0.93 |
| XGBoost | 0.95 | 0.95 | 0.95 | 0.95 |
Publisher’s Note: MDPI stays neutral with regard to jurisdictional claims in published maps and institutional affiliations. |
© 2020 by the authors. Licensee MDPI, Basel, Switzerland. This article is an open access article distributed under the terms and conditions of the Creative Commons Attribution (CC BY) license (http://creativecommons.org/licenses/by/4.0/).
Share and Cite
MDPI and ACS Style
Branda, F.; Marozzo, F.; Talia, D. Ticket Sales Prediction and Dynamic Pricing Strategies in Public Transport. Big Data Cogn. Comput. 2020, 4, 36. https://0-doi-org.brum.beds.ac.uk/10.3390/bdcc4040036
AMA Style
Branda F, Marozzo F, Talia D. Ticket Sales Prediction and Dynamic Pricing Strategies in Public Transport. Big Data and Cognitive Computing. 2020; 4(4):36. https://0-doi-org.brum.beds.ac.uk/10.3390/bdcc4040036
Chicago/Turabian StyleBranda, Francesco, Fabrizio Marozzo, and Domenico Talia. 2020. "Ticket Sales Prediction and Dynamic Pricing Strategies in Public Transport" Big Data and Cognitive Computing 4, no. 4: 36. https://0-doi-org.brum.beds.ac.uk/10.3390/bdcc4040036