Big Data and Actuarial Science


1
Research Institute of Energy Management and Planning, University of Tehran, Tehran 1417466191, Iran
2
Department of Business & Management, Webster Vienna Private University, 1020 Vienna, Austria
3
Department of Economics and Business, Saint Anselm College, Manchester, NH 03102, USA
4
Department of Tourism, Faculty of Economic Sciences, Ionian University, Kalypso Building, 4 P. Vraila Armeni, 49100 Corfu, Greece
*
Author to whom correspondence should be addressed.
Big Data Cogn. Comput. 2020, 4(4), 40; https://0-doi-org.brum.beds.ac.uk/10.3390/bdcc4040040
Submission received: 14 October 2020
/
Revised: 11 December 2020
/
Accepted: 14 December 2020
/
Published: 19 December 2020
Abstract
:This article investigates the impact of big data on the actuarial sector. The growing fields of applications of data analytics and data mining raise the ability for insurance companies to conduct more accurate policy pricing by incorporating a broader variety of data due to increased data availability. The analyzed areas of this paper span from automobile insurance policy pricing, mortality and healthcare modeling to estimation of harvest-, climate- and cyber risk as well as assessment of catastrophe risk such as storms, hurricanes, tornadoes, geomagnetic events, earthquakes, floods, and fires. We evaluate the current use of big data in these contexts and how the utilization of data analytics and data mining contribute to the prediction capabilities and accuracy of policy premium pricing of insurance companies. We find a high penetration of insurance policy pricing in almost all actuarial fields except in the modeling and pricing of cyber security risk due to lack of data in this area and prevailing data asymmetries, for which we identify the application of artificial intelligence, in particular machine learning techniques, as a possible solution to improve policy pricing accuracy and results.
1. Introduction
Actuarial science is a far-reaching discipline in numerous contexts. In 2018, insurance sectors worldwide amassed a revenue exceeding $5 trillion [1]. A total that exceeds the entire GDP of the world’s third-largest economy, Japan [2].
The insurance sector depends upon risk analysis and functions in a domain of improbability. As humans, we are equipped with intuitive reasoning to recognize risk and comprehend it. Incorporated into the progress of the Western world, the concept of risk motivates all elements of our daily lives, with safeguarding our own lifespan being the backdrop for doing so. This made for uncertainty that entered the minds of the first city-state inhabitants as they shifted their lifestyles to suit crude forms of financial living within highly connected groups. The adjustment from haggling to systems of exchange meant that risk became collectively measurable in respect of a common currency: A commercial innovation that had a knock-on effect on our ability to judge risk on multiple levels.
Certain qualities of insurance were in place before recognized formalities made up the origins of business and trade, historically identifiable by 400 BC. The merchants of Ancient Greece were able to obtain loans for ocean voyages with the stipulation that, if the shipment became lost at sea, no repayments would be sought. Plus, interest was applied to the loan to account for the insurance risk, which meant that the risk pool—an acknowledgement that a cohort and the recipient are involved with shared risk-taking—was present even during these early origins [3]. A premium was reached based on agreeing on the size of the pool and combining it with a risk estimate. A few centuries later, the Roman Empire shows further sophisticated examples, including records of funds maintained to pay for funerals (Johnston, 1932 [4]). In fact, it was not only those people we associate with progress who understood risk by this time, as primitive insurance methods were also practiced by the Celts and Saxons (Loan, 1992 [5]). However, the majority of these endeavors encountered numerous pitfalls due to poor recordkeeping and poor comprehension of what risk meant [6].
Insurance market roots can be located by studying the professions of shipping merchants who supported sea voyages in search of new land. Undertakings that became partly underwritten by the Lloyd’s subscription market, which was established more than three centuries ago and remains the prominent insurance market player across the globe [7]. This was largely made possible by English trade making overseas expansions, which occurred alongside Western Europe becoming industrialized. Following the early activities of Lloyds of London allows for recognizing this increasing market tendency to support the purchase of insurance via underwriters. This breakthrough led to significant trade with both India and Colonial America, which included maritime insurance policies formed to insure against the likelihood of loss at sea. Considering the worth of the cargo and the amount of time it took to travel, maritime insurance proved an essential player in securing the practicality of deeds for which one lone disastrous loss could result in total business failure.
Additionally, coinciding with the first advance of the Industrial Revolution in 1760, the application of insurance was regularly found at the forefront of industrial growth, working to nurture further economic development [8]. Insurance, along with the actuarial profession, had a leading position as it grew within a transforming world. For example, overcrowding in built-up suburban environments resulted in the first fire insurance. What was, in effect, a fire brigade service then developed into property insurance. A number of the initial policies designed for accident insurance also came into place as railroads expanded to account for hurts and tragedies that were occurring while building rail systems. Plus, the railroads were also integral to the first pension plans being developed in the United States, resulting in a private pension fund in 1874. Social insurance was created to strengthen forms of private insurance, unemployment insurance grew rapidly, and 1935 saw the United States introduce Social Security as a consequence of the economic hardships experienced due to the Great Depression.
Although the origins of insurance can be traced back to antiquity, however, actuarial science was certainly founded in the late 1600s, when heightened requirements for long-term insurance packages like life insurance, annuities, and burial, gave birth to this new mathematical discipline. The individual who would go down in history for this breakthrough was Edmond Halley [9], a notable astronomer as well as a mathematician, who in 1693 was the first to valuate life annuities by designing a life table founded on population data. By considering the historical context, Halley’s work remains an important contribution to demographic statistics, data analysis and other areas that involve life table construction [10]. Another important contributor was De Moivre’s mortality law concept (1725) [11], which has been widely applied for calculations of life insurance. Other pioneering mathematicians include the likes of Gauss, Bernoulli and Euler who, alongside the Newtonian revolution, provided the means and directions that allowed actuarial science to progress as a discipline. Indeed, the work of Gauss [12] is notable who, from 1845–1851, concentrated his efforts on enhancing a local fund for Göttingen University’s professor’s widows. As a result, actuarial science has continued to evolve ever since with many more notable breakthroughs.
In today’s context, actuarial science is employed to analyze the key risks faced by both insurance and finance, with the chief packages to focus on being life insurance, healthcare, and pensions. Other sectors also favor such methods, for example, banking, agriculture, transport, consulting and also the space sector. Almost every successful business relies in some way on a team that handles commercial insurance, so professionals that practice actuarial science are vital for safeguarding a wide range of financial risks and payment annuities.
A varied range of academic expertise becomes incorporated into actuarial science methods, meaning that professionals’ abilities are interdisciplinary in nature. Being able to analyze various dangers depends upon the application of mathematics, finance, economics, statistics, probability theory, and computer science. In this manner, actuaries assess risk levels by pool and the premiums required for insurance packages. In the past, this has required the application of models that are deterministic, together with actuarial tables. Recently though, science disciplines have experienced further revolutionary changes, largely because of the rise of computers in the 1980s and the merging of stochastic actuarial approaches with current financial theory (Frees (1990) [13]). The resulting emergence of Big Data Analytics in the 1990s, especially in relation to machine learning (ML) and artificial intelligence (AI), provides a new opportunity to transform actuarial science. Plus, as computational influence continues to expand, via the internet and social media, smartphones, digitalization, and innovative sensor devices, the discipline of actuarial science is facing the greatest potential change since the 1980s.
As this is happening, insurance sectors are transforming too as insurance firms are required to find solutions for a consumer market that is more informed and has more extensive requirements, while also having greater access to the competition than previously. Furthermore, internet capabilities enable price comparison sites and analytical guidance that can quickly make insurance packages uncompetitive. Numerous insurers are attempting to diversify their approach as a result and looking for relevance in different markets around the world. This is all taking place at the same time as a more extensive focus on market regulation. Undoubtedly, to survive in these new-age conditions, insurers have no choice but to embrace the capabilities of big data.
We contribute to the existing literature in various ways. First, we analyze the potential impact of big data on the actuarial industry in a rigorous way by covering all possibly affected areas of insurance companies. Second, we provide a detailed analysis of how these areas are impacted by the rapidly evolving digitalization. Third, we weigh in on a broad range of literature by outlining the benefits and improvements for the actuary sector as well as for their clients by the usage of big data. Fourth, we give an overview and outlook how the application of big data in the actuarial industry is changing the business models and way insurance policies are priced. Fifth, we address the challenges each insurance policy pricing faces and how big data can improve transparency as well as accuracy and auditability of insurance policy pricings.
To the best of our knowledge, this kind of extensive analysis about the impact of big data on the actuarial industry is novel and provides a very good primer on what to expect in the insurance sector from the accelerating digitalization of the industry. Since the world is becoming increasingly digitized, it is important to provide a detailed overview of the different methodologies on insurance policy pricing and how big data impacts it, as it allows to derive future developments in this sector due to increasing data reliability.
This paper is organized as follows. A short introduction to big data in actuarial science is provided in Section 2. Some significant attempts have been made to use various applications to measure the importance of big data, together with related analytics and their connotations for actuarial science and insurance sectors, which are covered in Section 3. Other key areas we explore include healthcare, mortality, and auto insurance. Pioneering technologies are included in this, such as autonomous vehicle technology and telematics. There is also a focus on how mortality predictions will affect the managing of pensions and life insurance. Regarding healthcare, we look closely at some of the major challenges countries have been facing, while as an additional area of focus we also take a look at harvest risk. The rest of this paper is organized as follows: First we explain the general capabilities of big data. Then we present a range of catastrophic disaster risks and outline the relevant actuarial applications of big data for each case. Thereafter, we assess the role of big data in evaluating the cost of climate change as well as combating cyber risk, before we finally conclude.
2. Big Data
Historically, data processing has been central to the task of forming insurance solutions, with dependence upon statistical analysis that is data-led. The collection and processing of data to guide underwriting strategies have been a norm for the insurance sector, as well as its utilization for risk analysis, claim management, fraud, and pricing structures (Shapiro and Jain (2003) [14]).
Although insurers have a significant heritage of establishing and leveraging data-led methods, doing so has usually been domain-specific. There is the potential to be more general, however, as more extensive data sources continue to become available which, in turn, enhances the scope of analytics. Big data breakthroughs, combined with innovations in related sectors, like cybersecurity, blockchain, the Internet of Things (IoT), cloud computing (KPMG (2016) [15]; Corlosquet-Habart and Jansen (2018) [16]; EIOPA (2019) [17]), virtual reality, and quantum computing are all likely to define the direction and success of future economies, against which key developments in actuarial science will be assessed. In such a new outlook, insurance is only one sector looking to make the most of potential, with the activities of numerous additional players also impacting on how the sector will operate. Likely examples will include data providers and aggregators, retailers, automotive companies and telecommunications, with the progress of these industries poised to shape the insurance market that relies upon their custom. (BearingPoint (2020) [18]) Alongside countless opportunities, however, all of these sectors will produce new risk management complications. One example already apparent is the new trend of AI-powered real-time claims processing, which has opened the door to new forms of fraud, leading to the development of new types of safety nets like real-time detection. The more extensive personalization capabilities enabled by these new techniques, including for price and cover, bring forward numerous pricing dilemmas and the question of socio-economic consequences that, if becoming of political concern, might lead to increased regulation regarding how big data and AI algorithms are applied (Deloitte Insights (2019) [19]).
The data that insurance companies utilize at the various levels of the insurance value chain might incorporate both personal and non-personal information. In doing so, the data might be from internal or external sources or be both structured and unstructured [20]. Every insurance firm faces the challenge of assessing the likely contributions of a wide range of factors, including its own data, whether historic, current or potential, and also of external open data sources they may have access to and any purchased data, as well as keeping track of any knock-on effects coming from decisions and upgrades made within current insurance packages (Barthelé (2018) [21]).
Structured data are the most regularly applied for insurance analytics, although they make up only 10–15 percent of currently available data. Largely, it is sourced from the tabular data of spreadsheets or databases dependent upon them [22]. Plus, as the insurance sector has continued to advance over recent years in obtaining and examining extensive structured data connected to various products and customer bases, it has become clear that even greater unstructured data sources are still unexplored [23]. Examples of such unstructured sources include social media content, web feeds, emails, forums, blogs, text documents, and the plethora of streaming data that devices and sensors now capture. Further fresh sources of data made possible by digitization include: the IoT, such as vehicle telematics; wearables data, gathered from physical activities and medical patients especially; online media data, such as from online purchasing, job searches, web searches, and social media; geocoding data, which we are now often dependent upon for travel; genetics data, coming from gene and chromosome analysis; banking habits, in terms of shopping income and wealth, together with a wide range of interrelated data streams and unique data generated within insurance firms themselves (EIOPA, 2019).
The analytical capabilities of big data enabled the insurance market to gain a perspective of the wider marketplace before upgrading their offers by offering a slicker and more in-depth appreciation of risk exposure. When internal and external banks of data are merged with existing expertise, together with real-time monitoring techniques of the most crucial impactful factors, insurers can make a calculation for competitive premium rates and support risk assurance in real-time. The fresh sources of data now made available thanks to digitalization are proving to be a watershed moment for the insurance sector by allowing firms to correspond with clients in a manner that enhances brand loyalty. They can also make crucial business procedures, such as claims processing, run more smoothly and support the development of preventive practices to enhance cost-effectiveness and profit.
Significant trends are becoming clear in terms of how the insurance sector is looking to embrace big data. A 2018 analysis from SNS Telecom & IT (2018) [23] confirms that the utilization of big data continues to accelerate, forecasting a predicted $3.6 billion worth of investments to take place by 2021. Furthermore, the same research also shows figures highlighting how the embracing of big data leads to 30 percent healthier access to insurance packages, 40–70 percent cost savings, and 60 percent improvement on identifying fraud, so it is proving beneficial to companies and to their investors. Furthermore, another study [24] estimated that 74 percent of insurance firms (figures taken from a batch of around 4 percent of worldwide companies) confirmed that the utilization of big data and analytics has resulted in competitive gains for their businesses. While another study [25] found that more than half of respondents reported that finding the right workforce expertise to take advantage of big data is a challenge, and less than ten percent felt that they were currently making the most of the available potential.
Breakthroughs in Big Data Analytics and wearables are resulting in a growing intrigue for the prospects of insurance premiums and products that are ‘personalized’ (Topol (2015) [26]; Swiss Re (2016) [27]; Meyers et al. (2017) [28]). The key players championing big data, who are multinational giants, are making steady progress towards launching their presence into the insurance industry via their extensive capabilities for customer experience [29]. A crucial lead these Big Tech firms have over those operating in the insurance market is the convenient access to a plethora of customer data, especially in relation to personal and behavioral tendencies. Using this store of information, they are constructing ecosystems capable of making services bespoke to each client, as well as launching new value-added features to enhance the customer experience even further. These significant new insurance market players are also leading the way in pioneering many related skills, via the likes of artificial intelligence and machine learning, as well as data analytics. Worldwide, close to one-third of customers are welcoming the opportunity to purchase insurance from Big Tech companies, as shown by the 2018 World Insurance Report [30]. Indeed, the same report also shows that Gen Y and tech-savvy companies are strongly focused on choosing new insurance providers within a short-term period, which will include more utilization of Big Tech players. Plus, over 65 percent of surveyed customers confirmed that overall personalization of the customer experience is now their key focus.
Actuaries have a firm foundation in traditional forms of statistics and their usage in the overall assessment of insurance and related financial concerns (SOA (2019) [31]). Despite this, a substantial increase has been identified in the application of predictive analytics due to their versatility in addressing a wide range of new and varied challenges. [32] Current research expects significant transformations concerning the analytical methods employed by actuaries and related professionals (Sondergeld and Purushotham (2019) [33]; Guo (2003) [34]; Wedel and Kannan (2016) [35]). Actuaries also possess in-depth expertise in relation to how insurance and financial services workplaces function.
To enable a pathway for actuaries to access and flourish in an environment defined by big data, an extensive list of abilities and knowledge need to be incorporated, including data integration and preparation, the constructing of specialized computing environments, data mining and intelligent algorithms (Deloitte Insights (2019) [36]). Even more crucially, data analysis has to be made applicable to the more general aspects of business strategy, so data researchers need to comprehend the challenges to business that need answering and the context in which doing so benefits the company. To achieve this, data scientists require a blend of business, technical and people skills [37].
Due to the relations with computer science, the launch of big data also stretches to electrical engineering and computer science (EECA), as well as the application of platforms [38,39] in respect of data handling techniques. This breakthrough has resulted in significant requirements for higher education institutions to merge EECA with statistics and actuarial science. In such a manner, the business sector can progress alongside engineering innovation as they pursue a vision of applying actuarial science to a new industry landscape. A comparable transformation is underway for financial technology (Fintech), which is also dependent on aspects of actuarial science. Fintech educational programs that cover both the business and engineering sectors are clear examples.
Undoubtedly, requirements exist for providing students with mentors from within the profession they are pursuing. The task for actuaries, therefore, will be to grow these abilities themselves, or become proficient with handling and applying a wide range of new data science tools and in numerous multidisciplinary contexts. The priority is for actuaries to reach an appreciation for the benefits that big data offers via some innovative data handling methods and especially with regards to unstructured data.
Because actuarial science and insurance make up a worldwide industry, which draws in double the intake of the oil industry, the focused utilization of big data is worth analyzing. The expected result of big data breakthroughs and innovative technological advances for insurance companies could be enhancements in productivity methods, together with greater commercial profits. Indeed, a great deal of potential exists for insurers and also for their customers, but there are also ethical issues that big data analytics will inevitably raise, in terms of the transparency of new services, together with the associated accuracy and auditability. Introducing artificial intelligence and machine learning tools will not be achieved without complications (EIOPA, 2019).
Figure 1 exhibits the typical process of a machine learning algorithm. After definition of a problem, a dataset needs to be generated by gathering the relevant data. Once collected, these data serve as a training set subject to a loss function which serves as input for the learning algorithm, which is subject to a pre-set hypothesis. By optimizing the prediction error, the optimal parameters are being saved and fed into the learned model which then performs the prediction analysis.
3. Big Data Application and Insurance
3.1. Automobile Insurance
Actuaries are becoming armed and ready with new tools and techniques, blending with their own working procedures and offering them relevance within a new world led by big data thanks to being able to identify previously unseen patterns unavailable from previously utilized databanks. Kunce and Chatterjee (2017) [40] highlighted how K-Nearest Neighbors, K-Means Clustering, and Kernel Regression can be applied to assess rating aspects of Commercial Auto Liability policies from a decade of archived closed-claims data (2003–2012). Noll et al. (2018) [41] offer guidance based on a comparison of a generalized linear model for claims frequency modeling with boosting machines, regression trees, and neural network approaches to French motor third-party liability insurance data. Similarly, Zappa et al. (2019) [42] examine the effectiveness of text mining in grasping latent information applicable for directing insurance costs and current NLP results, in the content of accident reports filed from 2005–2007 in the United States.
Innovative service and business methods are consistently becoming available thanks to IoT breakthroughs, many of which insurers are immediately drawn to. This IoT expertise allows insurers to attempt more accurate calculations when assessing risk. As detailed by a 2018 European Insurance and Occupational Pensions Authority (EIOPA) survey [43], almost a quarter of respondents to the survey already utilize IoT capabilities, with around one-third predicted to take such a step by 2021. Figures show that the motor insurance industry especially tends to be swifter in taking up new data potential.
In the past, auto insurers have tended to depend upon indirect indicators of driving performance to confirm their premiums, such as age, address, and credit history. Moving forward, however, there will be more of a tendency to make insurance usage-based and featuring real-time pricing, which is largely made possible by auto insurers making the most of telematics capabilities to draw in a mass of data regarding driving performance and behavior (CB Insights (2019) [44]). Regarding telematics, which can be gathered via smartphone apps as well as black boxes fitted in vehicles, predictive analytics enables insurance firms to obtain more precise readings on poor driving examples and law-breaking (Bellina et al. (2018) [45]). Predictive techniques, therefore, may then be applied to risk assessments so that clients can receive tailored benefits that reward quality driving (Huang and Meng (2019) [46]).
Tselentis et al. (2017) [47] offer an analysis of the most common and well received methods concerning usage-based motor insurance (UBI). Baecke and Bocca (2017) [48] examine the efficacy of telematics driving behavior data to enhance insurance risk assessments by applying a distinctive dataset from a European insurance business. Doing so shows that incorporating typical telematics variables greatly enhances the ability to analyze a client’s particular risk. Consequently, insurers will have the capacity to construct bespoke products based on a risk assessment of the client, even using only three months of data to make such a decision.
Paefgen et al. (2013 [49], 2014 [50]) initially looked to test machine learning capabilities in the context of Usage Based Insurance (UBI) pricing. Huang and Meng (2019) [46] went further by examining how applying both typical and new telematics data to assess the risk probability and claim likelihood of vehicles in use. Machine learning methods are strengthened by data-binning procedures, which enhances the precision and interpretability available for establishing vehicle insurance costs. In addition, Husnjak et al. (2015) [51] provide an analysis of the system architecture of current telematics methods found in the market, together with the data structure applied to motor insurance billing procedures. A subsequent real case project launched in Eastern Europe attests to the capabilities of this approach.
Upgrading the autonomous vehicle technology may result in the most transformative time for automobile insurers since it was founded (KPMG, 2015). This shift will certainly transform the way we operate vehicles and travel but there will also be indirect effects on insurance markets, due to fresh perspectives on the risks involved and inevitable pressures to lower premiums as vehicles become safer (Richman (2018) [52]). KPMG’s (2017) [53] research explores the effects autonomous technology is likely to have on vehicle insurance, especially in the context of causing disorder in one of the key roles that actuaries play.
Enhancing the impact of advertising drives and the pursuit and eradication of fraud offer additional examples showcasing some further advantages big data can provide.
Alshamsi (2014) [54] applied random forest algorithms that assist insurers in anticipating client decisions to achieve more enticing insurance packages. Wang (2020) [55] examined the data from over 60,000 auto insurance packages, employing a Light-GBM algorithm to identify the vital features that impact upon decisions to remain with a particular insurer. Doing so allows businesses to produce more robust advertising tactics.
Fraud within the automobile insurance sector makes up a critical portion of the costs faced by property insurers, leading to pricing consequences and socio-economic impacts. Wang and Xu (2018) [56] suggest a deep learning method for identifying fraud within the insurance market via Latent Dirichlet Allocation (LDA)-based text analytics. This approach utilizes LDA to expose aspects of text found within accident accounts and showing up in claims before deep neural networks are then focused on the results, which incorporate the text aspects and typical numeric attributes applicable to recognizing fraud. Subudhi and Panigrahi (2018) [57] examined the identification of fraud within the auto insurance market via a data balancing approach called Adaptive Synthetic Sampling Approach for Imbalanced Learning, then adding the three supervised classifiers of Support Vector Machine (SVM), Decision Tree (DT) and Multi-Layered Perceptron (MLP).
3.2. Mortality Modelling
Current evidence-based underwriting should take on board a significant scale of vital and changeable health and durability factors, including demographic aspects, lifestyle trends, healthcare innovations, and their interconnectivity. Most examples of interventions for public health are done so with a focus on the overall well-being of the populace. Actuarial and medical research, on the other hand, usually pursue different priorities. Although mortality is of primary interest to an actuary, the domain of worsening medical conditions is the focus of medical researchers. Furthermore, clinical experiments handle patients fitting specific criteria, and typically over a short time period. This clarifies that the motivations for current medical research, spanning a wide range of systematic studies, while of interest, are not solely enough for actuarial fields, meaning that the close participation of actuarial experts in health-data modeling is necessary. Insightful actuarial longevity studies need to focus on statistical modeling for population-based individual-level data obtained over an extensive time period (IFoA (2016) [58]).
Mortality modelling can prove integral for actuarial science for being applied to the organizing of risks to longevity via actuarial pricing of securities that are mortality-based, together with any other products linked to lifespan (LLMA (2010) [59]; Silverman and Simpson (2011) [60]).
Typically, approaches that are regression-focused were applied to assess mortality issues, together with extrapolative fittings (Booth and Tickle (2008) [61]). Pioneering methods, including machine learning, predictive analytics, and deep learning techniques, are being consistently embraced throughout actuarial science. Deprez et al. (2017) [62] apply regression trees to demonstrate ways that mortality modelling can be enhanced by incorporating individual features, as well as to calculate conditional likelihoods that can also be linked to mortality. The findings are taken from cases of Swiss mortality, via the Human Mortality Database. Kopinsky (2017) [63] applies tree models to summarize and anticipate maternity recovery and mortality statistics. The data this research draws upon include somewhere between 500,000 and 3,000,000 cases, obtained via a Group Long-Term Disability Database. Hainaut (2018) [64] puts forward the application of a neural network to anticipate and simulate rates of human mortality. This neural analyzer has been converted to fit mortality rates coming from the US, the UK, and France from 1946–2000. The research ascertained that this neural network method offers a significant predictive potential, much greater than the frequently used Lee–Carter model (1992). Additionally, Richman (2018) [52] provides an analysis of deep learning capabilities in respect of actuarial issues in mortality predictions. Shang (2017) [65] anticipates mortality statistics according to types of cancer in a particular populace, incorporating predictive methods that include regression, classification, K-nearest neighbors, random forest, regression tree, and neural network.
3.3. Healthcare
Healthcare sectors are experiencing wide-scale disruption due to the pressures of sustainability, resulting from ageing populations and spiraling costs. As healthcare structures come under more and more pressure, therefore, enhancing the effectiveness of existing practices will become essential if our societies are to manage healthcare needs to meet current expectations. In addressing this significant challenge, big data will play a vital role, being well placed to inform innovative research—which is undoubtedly underused in the current climate—as well as to bring about efficiency improvements and to support the industry in being more cost-effective overall. Mehta et al. (2019) [66] offer a mapping approach that is systematic, allowing for the classification and examination of big data analytics and artificial intelligence innovations that may allow healthcare to advance. Their study includes an analysis of more than 2000 articles obtained from 2013–2019. One means via which Big Data can impact on healthcare advances is through data-driven research that can be applied to enhance personalization techniques, together with their relevance to patient-centered results, and the knock-on benefits for re-admission stats (Chawla and Davis (2013)) [67].
Actuaries operating within healthcare sectors are able to connect with many big data sources that might offer further expertise on risks and potential, previously unobtainable. These new databanks, together with claims and demographic data, incorporate data obtained from social media, from personal devices such as fitness apps, and from medical equipment like diagnostic technologies. Sources for producing such data can include insurance customers, healthcare patients and services, together with various forms of sensor and digitized equipment (Raghupathi and Raghupathi (2014)) [68]. There include examples that were not previously applicable, including the ability to map a patient’s genome.
Above all, personal devices allow for those who maintain them to draw in each user’s activity data, much of which is applicable to health. Such technology means that extensive lifestyle data are now available, with physical activity and heart rates among those factors that can be read. This will undoubtedly result in more effective predictive and diagnostic analytics (OECD (2020) [69]).
The most significant healthcare benefits from the obtainment and application of big data involve the ability to examine the individual attributes of clients alongside the price and effectiveness of their subsequent care needs, which will lead to the best available treatments and their costs. Furthermore, pre-emptive approaches can be combined with predictive methods, backed up by extensive input variables. A further potential that big data offers providers is the sharing of key information across numerous institutions, which will enhance their reaction times and understanding of a particular patient’s needs. Raghupathi and Raghupathi (2014) discuss numerous other advantages of big data in the context of public health, medical breakthroughs, and genomic analytics, the remote monitoring of devices, individual profile analytics, and pre-adjudication fraud assessment. This is furthered by Belle et al. (2015) [69] who examine three key study areas that have already embraced big data. The first of these is image processing, as images have become crucial for informing diagnosis and for agreeing on therapeutic approaches. The second is signal processing, which uses medical signals to assess barriers that are volume- and velocity-based, particularly throughout ongoing, high-resolution acquisition and storage via monitors linked with the patient. The third is genomics, which is benefitting from high-throughput sequencing methods thanks to reducing the costs involved with sequencing the human genome (Lander et al. (2001) [70]; Drmanac et al. (2010) [71]). Bates et al. (2014) [72] put forward six examples of how big data has been utilized for cost reduction. These examples are adverse events, treatment optimization for conditions impacting numerous organs, high-cost patients, triage, readmission, and decompensation, i.e., when a patient experiences a decline.
However, certain cautions are included before treating big data as without issue. Feldman (2012) [73], for example, reports on cases of providers handling big data as if it is perfect and without error, but healthcare is actually the sector that is most likely to find statistics that are inconstant, unstructured, or possibly even just false. There are also numerous service aspects that data do not yet incorporate, such as handwritten prescriptions.
Big data is not the be-all and end-all, therefore, as was shown by the notable Google Flu Trends case (GFT). This was when the search provider attempted to apply search trend activities to estimate influenza outbreaks. This attempt has since been shown to be littered with errors and falsehoods (Kandula and Shaman (2019) [74]).
The utilization of big data still comes with a great deal of complications as mathematical interpretations develop to keep up with what can be learned from databanks. Ascertaining what is likely to occur within biological symptoms is not yet possible with anything close to total accuracy. To address this task, research that is multi-layered in scope is required, whether for medical imaging and sensing technologies, so that professionals can use data for direction regarding anatomical and physiological complications (Horn et al. (2014) [75]; Brandt et al. (2018) [76]; Schileo et al. (2008) [77]) for data processing, so that databases can speedily give up knowledge not otherwise obtainable (Grassi et al. (2011) [78]; Hammer et al. (2009) [79]; Lamata et al. (2013) [80]), biomedical modeling to showcase the accrued knowledge via predictive simulations (Narracott et al. (2005) [81]; Lio et al. (2012) [82]), as well as computational science and engineering for the running of hyper-models (multiple model orchestrations) according to the operational factors demanded by professional application (Evans et al. (2008) [83]; Marco et al. (2013) [84]; Jyung et al. (2011) [85]; Viceconti (2016) [86]).
Typically, health actuaries have applied standard claims data for decisions relating to premiums and related costs. Currently, however, the application of advanced visualization methods is accelerating and also incorporating machine learning approaches so that extensive databanks can be interpreted more effectively (Diana et al. (2019) [87]).
Toyoda and Niki (2015) [88] applied a visualization technique to enable an examination of medical costs that is interactive. Kareem et al. (2017) [89] utilized a blend of cluster analysis methods—both supervised and unsupervised—to identify examples of fraud within health insurance claims, made possible by linking giveaway features present on fraudulent claims applications. Dhieb et al. (2018) [90] offer an extensive list of research focused on analyzing healthcare frauds with predictive methods, together with a comparative assessment. Diana et al. (2019) [87] applied machine learning techniques to model insurance requests, including random forest, regression tree, GLM, and Bayesian analysis. Wang et al. (2018) [91] explored the possibilities of data analytics within the healthcare sector under the context of four key areas: predictive capability, traceability, unstructured data analytical capability and decision support capability. Hartmann et al. (2018) [92] assessed the predictive precision of extreme gradient boosting by comparing it with logistic regression via an assessment of claims that the Health Care Cost Institute found to be associated with particularly high costs. Boodhun and Jayabalan (2018) [93] took machine learning algorithms, including random tree, linear regression, and neural network, for anticipating the risks attached to each potential client. This was conducted with the use of a Prudential Life Insurance databank containing almost 60,000 applications, and with clients characterized by 128 different features.
Establishing bespoke medical packages for a multitude of patients demands extensive data that require standardization, as well as being analyzed for precision and prejudice, safely stored, speedily processed, and made engaging so that professionals can be clear on the advice and direction it offers. Nevertheless, there is significant interest around the world in personalized forms of healthcare. Findings released by the International Actuarial Association (2017) [94] explore the potential of personalized healthcare, a new landscape for genomics and the present obstacles to be overcome, together with the effects these breakthroughs will have on the insurance sector and advice for actuaries. Whereas, Hulsen et al. (2018) [95] examine some of the notable pitfalls in incorporating big data to achieve precision healthcare.
Both big data and AI offer extensive prospects for the prediction of health conditions and, subsequently, will support providers in developing bespoke insurance solutions and to calculate more precise pension obligations. Cirillo and Valencia (2019) [96] claim that pioneering machine learning tools, including deep learning and cognitive computing methods, are the direction that data-driven analysis tools will take in respect of biomedical databanks.
Big Tech firms are researching further innovations to support the diagnosis of health issues at their earliest occurrence. A current study by McKinney et al. (2020) [97] established that the Google Health AI system—the combined efforts of Google’s DeepMind and a number of medical units—is more effective in diagnosing breast cancer than medical professionals. Additionally, research from Perez et al. (2019) [98] has examined the smartphone’s ability to allow for the detection of certain conditions as a result of atrial fibrillation, taken from a databank of 400,000 Apple iPhone users. Nevertheless, key issues remain if the healthcare system is to really make the most of big data, such as the obtainment and standardization of heterogeneous datasets, the identification of applicable clean data, issues relating to whether providers have the consent of users to interpret their data, and the connectivity that exists between healthcare services so that all professionals can benefit from the same level of detail.
Bespoke healthcare and insurance might lead to numerous moral and ethical dilemmas, as well as extensive privacy and security issues. The privacy of consumers needs to be weighed against the positives that obtaining a massive amount of data and the subsequent assessment would provide. This complicated landscape will be further affected by regulation, while technologies might still progress in unexpected ways and lead to additional issues, although actuaries need to assess how to cope with personalized medicine risks in a more general manner that suits their clients.
3.4. Harvest Risk
Harvest risk and its effects on the food chain make it vital to assess for populations around the world. The insurance sector that serves related clients has been robust in looking for a more effective means of understanding the factors that put crops at risk. This is a historic challenge that the first ever human settlements would have been just as concerned with as we are today. While more sophisticated economies led to the partition of labor, the establishment of currencies to enable the exchange of goods allowed for substitutes to be put in place when crops failed. Insurance contracts were one result of this dynamic, allowing farmers to seek compensation for poor seasons.
The most significant challenges insurers have to overcome to protect against harvest failures included weather, insects, and issues related to soil quality, presenting a variety of short- and long-term factors. For a more thorough understanding, the obtainment of data is essential for directing insurers’ positions.
Kamilaris et al. (2018) [99] provide a summary of the big data factors being used to inform agricultural insurers. They note that the rise of smart farming is a significant breakthrough thanks to big data, contributing to the enhancement of production, response to environmental complications, supporting sustainability and overall food supply. Smart farming answers essential human food needs by strengthening the resource base and environmental value (Pretty (2008) [100]).
Agricultural big data has led to a focus on greater infrastructure so that data can be obtained and accessed (Nandyala and Kim (2016) [101]; Hashem et al. (2014) [102]), as applications need to be applicable to real-time activities, whether for assessments of weather conditions, crop analysis, or pest and animal monitoring.
Ground sensors are the most widely agricultural big data source, used in weather stations, biosensors, and chemical detection, among others (Chedad et al. (2001) [103]; Kempenaar et al. (2016) [104]), with remote sensors and geospatial data also being widely applied (Becker-Reshef et al. (2010) [105]; Nativi et al. (2015) [106]; Karmas et al. (2014) [107]). This embracing of innovation has provided vital input for numerous studies that are able to compare traditional techniques with the benefits of machine learning applications (Ma et al. (2018) [108]; Mucherino et al. (2009) [109]) and Cloud platforms (Hashem et al. (2015) [102]).
The rewards of embracing big data are significant as far as agriculture is concerned. Through the use of innovative data gathering techniques, professionals and their governments are able to respond to issues better, adjusting their current operations to suit and keeping in mind predictive analytics that might direct their priorities for the coming seasons.
Shirsath et al. (2019) [110] offer a fresh approach to creating insurance contracts for weather-related issues by merging crop growth modeling and optimization methods with agro-meteorological statistical assessment. Their proposed heuristic model is able to produce enhanced contracts that result in more accurate and regular payouts without the need for subsidies.
Inevitably, some downsides exist concerning big data usage, including sociopolitical factors that lead to certain businesses having unfair advantages, alongside ethical data collection issues, privacy concerns, and the accessibility of key data (Sykuta (2016)) [111]. Overall security and organization are also an issue (Kshetri (2014) [112]), together with the current absence of any regulatory structure in a big data context (Nandyala and Kim (2016)) [102]. All these factors play an important role when it comes to crop prediction, an important step for increasing accuracy in crop insurance policy pricing.
Figure 2 presents the flowchart for assessing the expected crop yield. The chart shows how machine learning models can improve the prediction of a crop, and therefore improve insurance policy pricing by collecting relevant data and test it against a training model which serves as training data in order to predict the amount of crop being harvested given certain input conditions.
3.5. Catastrophe Risk
Big data is assuming ever greater importance in simulating and evaluating catastrophe risk, and multiple ways to harness its power exist, or are under development. Catastrophe risk encompasses several categories of major natural disasters, including storms, hurricanes, tornadoes, fires, geomagnetic events, earthquakes, floods, space events, and droughts. Financial data were used to investigate the modalities of pricing catastrophe risk: a 2008 study of 250 catastrophe bonds issued on the capital markets found that market evaluation of risk worked out 2.69 times greater than the expected long-term loss (Lane and Mahul (2008)) [114]. Big data also has a role in actuarial practice in rating insurance company risk through catastrophe modeling (Li and Powers (2007)) [115]. Bougen’s (2003) [116] investigation into financing mechanisms for catastrophic event-related loss found that, while it is increasingly difficult to find insurance for catastrophic events in today’s so-called ‘risk society’, leveraging the flexibility and adaptability of capitalism may illuminate ways in which our risk society itself may develop in the future.
The actuarial nature of catastrophe risk implies that it is principally relevant to financial matters; hence, as the digitalization of financial markets advances, big data is of growing relevance (Logic and Accord (2013) [117]; Woodie (2016) [118]; Schruek and Shockley (2015) [119]; TIBCO (2015) [120]).
The vast reservoir of information offered by big data is of particular value to insurance firms because it enhances their capacity to carry out more detailed and accurate simulations, thus ensuring better cost estimations of expected damage. Big data-driven risk and vulnerability evaluations also enable insurance companies to more precisely tailor premiums by taking account of any risk management practices undertaken by the insured.
Big data can also be gathered from social media and meteorological sites to predict the needs of the general public or particular groups, as shown by Nguyen et al. (2019) [121]. As digitalization proceeds apace, an increasing number of areas open up to the application of big data: not only insurance policy pricing but also supply chain optimization, and crisis response and prevention. As computational capacity also expands, new possibilities open up for the prediction, prevention, and assessment of catastrophe-related damage and its impact on society. For example, Hangan et al. (2016) [122] underline the importance of big data in simulating multiscale geophysical processes, such as wind phenomena, and generating accurate forecasts which will forewarn of effects on both natural and built environments.
3.5.1. Hurricanes
Cox et al. (2018) [123] used big data to predict hurricane trajectories, and such data are also valuable in showing how damage due to high winds and flooding can be investigated. An examination of post-hurricane taxi and subway system resilience was conducted by Zhu et al. (2016) [124], using big data gathered from taxi firms and turnstile records across New York City after Hurricanes Sandy and Irene. The authors found differing recovery rates, with greater resilience shown after Irene than after Sandy, from which they inferred that road networks are more swiftly recovered than subways.
Other studies in which big data in relation to hurricanes was leveraged for actuarial application include Camara et al.’s (2018) [125] prediction of how such events can affect the stock market and Aldangady et al.’s (2017) [126] investigation of their effect on consumer spending, both of which offer valuable insights for insurance companies.
3.5.2. Tornadoes
Big data yielded by tornadoes has been used in a variety of recent studies. Chen et al. (2019) [127] generated 3D maps of tornado-struck areas by using unmanned aerial vehicle (UAV) images to record damage at roof level and evaluate the structural integrity of affected buildings. The authors found this technology to be an efficient and low-cost means of generating deep learning. Investigating the growth in the power of tornadoes, Elsner et al. (2018) [128] applied a statistical model to big data captured from tornado events occurring in the period 1994–2017 to evaluate the magnitude of increase. Controlling for variables including diurnal cycle, seasonality, climate variability, and the use of a new metric to estimate damage, they found a yearly increase of 5.5% in power. Lian et al. (2017) [129] gathered and analyzed data scattered across multiple sources, using data mining strategies to create comprehensive meteorological datasets from which they were able to map the spatio-temporal patterns of tornados.
3.5.3. Geomagnetic Events
Whereas the effects of some catastrophic events are only felt locally, those of geomagnetic events can be widespread. For example, overvoltage on the power grid can have a supra-regional, even continent-wide, impact. Moreover, if GPS systems go down, industries which are not directly related to the network, such as road- and seaborne freight, can also be heavily impacted, while long-term damage can also be sustained by basic infrastructural elements, such as pipelines being corroded. Hence, big data is invaluable in relation to forecasting and evaluating geomagnetic events, as it can predict long-term infrastructural damage as well as provide real-time information to managers of power plants who must decide whether to close facilities due to the risk of potential damage from overvoltage, frequently under pressure of time.
Big data has been used in a wide range of studies related to geomagnetic events. Srebov et al. (2020) [130] attempted to both explain and predict the dynamics of geomagnetic events through big data related to solar-terrestrial physics, while Pashova et al. (2019) [131] used big datasets gathered across multiple disciplines in an examination of strong geomagnetic storms. Several studies also leveraged big data to investigate how geomagnetic events affect GPS and other applications (see, for example, Blagoveshchensky and Sergeeva (2019) [132]; Astafyeva et al. (2014) [133]; Gvishiani et al. (2016) [134]; Belehaki (2015) [135].
An example of the use of big data in relation to geomagnetic events for financial applications is a recent study by Lemmerer and Unger (2019) [136], in which solar storm data were used to set prices for insurance on potential contingent claims for damage caused by solar eruptions.
Figure 3 shows the structure of two solar flare forecasting models using a convolutional and a traditional Neural Network for learning. Using satellite data from sun observation enables neural networks to evaluate their forecasting performance quicker. Moreover, the collection and utilization of big data enables the various layers to reduce their forecasting error.
3.5.4. Earthquakes
Liu et al.’s (2020) [137] approach to introduce a high-performance blockchain system based on space-structured ledger and corresponding algorithms. This enables blockchain to operate in the Internet of Things (IoT). This blockchain-based communication allows pre-detection mechanisms using IoT and can therefore be installed in order to alarm the population in real time in the event of an emergence of an earthquake.
Clearly, insurance companies are obliged to work within certain mathematical and geophysical parameters (Kagan (2007)) [138]. Brillinger (1993) [139] lists the principal data necessary to calculate financial insurance premiums against earthquake damage, namely the temporal distribution of major earthquakes; ground motion in earthquake-hit locations; the attenuation of energy with distance; descriptions of damages; and real-life practice by country. The distribution of earthquakes (like other catastrophe risks) is long-tailed; hence the value of big data in determining insurance ruin potential across loss distributions. Mouyiannou and Styles (2017) [140] present seismic catastrophe models which are of use for insurers and re-insurers in estimating vulnerability.
Tiampo et al. (2019) [141] used big data to gain a greater understanding of seismic hazards by analyzing ground motion simulations. Their findings enable a better estimation of stability and damage, as well as clarification on construction protocols for earthquake-resistant structures and are thus of value in estimating the potential damage due to catastrophic events, as well as mitigating related risks and losses.
Figure 4 outlines the flow chart for determining the process of predicting human losses due to an earthquake. Big data plays a crucial role in the seismic data collection and the assessment of the importance of the associated features. Machine learning techniques help to learn from collected data which combination of features may lead to a potential earthquake and therefore to take counter measures ahead of time in case of an earthquake, which may lead to reduction of human losses.
3.5.5. Floods
When evaluating the probability of floods, and thus to be able to predict costs, it is important to collect both satellite image data on geo-spatial structures, that is, the earth and the waters on it, and data on urban developments. Public and private insurance both have a significant role to play in flood risk management, as shown by a study using examples from France and the UK (Crichton (2007)) [142]. Big data are also useful in evaluating the cost of damage caused to residential and commercial structures by coastal flooding (e.g., Andre et al. (2013)) [143].
It is also important for insurance companies to estimate and assess damages directly or indirectly caused by flooding to public health, biogeochemical cycling, and wetland ecology. In this regard, Schumann (2014) [144] investigates the use of big data gathered by airborne lidar to create digital elevation models (DEMs). Findings indicate that the more detailed data generated by such models for use in the modeling and forecasting of regional flooding give them an advantage over satellite images, which lack the necessary detail to allow flood simulation.
Moreover, an analysis of historic flood-related insurance claims can be carried out to inform premium pricing levels. One study aiming to identify the drivers of flood-related claims (impact of flood zones, building characteristics, individual vs. collective mitigation, properties subject to repeat damage, etc.) analyzed both claims made between 1978 and 2012 in the US and quantitative relationships among the factors determining payouts.
Big data can also illuminate the extent and characteristics of the demand for flood insurance. Browne et al. (2016) [145], for example, examined whether such demand was related to behavioral bias. Their findings indicated that insurance for high probability/low consequence risks was preferred to that for low probability/high consequence risks, which may explain why demand for flood coverage remains low.
Basis for an insurance company to price a flood insurance policy is to conduct a flood hazard study of the affected region.
Figure 5 outlines how flood hazard studies are being generated. Step 1 already shows the crucial step which affects the quality of the policy pricing accuracy. Since acquiring and evaluating the existing GIS dataset is necessary to get an overview about the imagery, topography, soils, and census data, big data and the methodologies applied in the above-mentioned literature can contribute significantly to the improvement in the amount and quality of collected data.
3.5.6. Fires
The type of fire is generally topographically determined (wildfire, bush fire, crown fire, etc.) and they can be deliberate or accidental. Big data is valuable in predicting and modeling both multiple possible causes (e.g., draughts, electric sparks, etc.) and the financial costs and damage fires cause. Tang (2018) [146] investigated the use of big data in predicting the probability and size of potential fires based on meteorological data, which is of clear use to insurers. Hence, fire prevention measures should be evaluated when calculating policy premiums. According to an exploratory study by Byungkwan (2018) [147] which leveraged prevention-related big data, there is no clear positive relationship between fire safety education and the prevention of fires caused by such education being inadequate.
Gao and Wang (2016) [148] applied machine learning (ML) to ecological and economic data to assess the risk of fire in Yunnan Forest, with the aim of drawing up an integrated risk governance program. The authors’ principal findings were that firstly, forest fire susceptibility can effectively improve the simulated events allocation process; and secondly, the variables of unit area, wildfire susceptibility, and gross value must all be taken into account in assessing the spatial distribution of risk of forest fire; hence, risk response planning must be differentiated along these dimensions. The authors’ findings were utilized in the forest fire insurance program applied to Yunnan Forest.
Gao and Wang (2016) conducted a forest fire risk assessment based on ecological and economic value, which provides a possibility of integrated risk governance and references for forest fire insurance practice. They combined machine learning with event simulation to implement fire risk assessment of the Yunnan forest and found that forest fire susceptibility can be effectively improved through simulated events and differentiated risk response planning.
3.6. Climate Risk
The umbrella category of climate risk is considered to include all the individual catastrophe events considered above, as the climate system itself may be seen as a combination of all such risks. Although climate risk events occur due to a wide range of causes, strong relationships exist between certain types of catastrophe risks; for example, one may be more likely to occur in conjunction with, or be caused by, another: severe air contamination may follow a wildfire, which may itself have been caused by an earthquake. To produce the comprehensive picture of climate risk required through modeling, only the systematic analysis, including cascade and feedback effects, enabled by big data is sufficient.
To carry out systematic, big data-driven assessment of climate risk, researchers must combine analysis of historic data streams with information yielded by real-time monitoring. Instruments which can give researchers a useful generalized overview included the annual Global Climate Risk Index (Eckstein et al. (2020)) [149]. The 2020 edition offers an analysis of the degree to which both countries and regions have been impacted by damage related to meteorological events including storms, floods, and heatwaves.
There has been discussion of how adaptation of insurance instruments can have a role in meeting the challenges of climate change, for example due to the increasing risk of flood (Botzen and van den Bergh (2008)) [150]. Given the pace of climate change, the creation of new financial instruments will also be necessary if the insurance industry is to meet the growth in risks related to environmental damage. Climate risk insurance, like insurance against natural events in general, is being progressively financialized, for example through the issue of catastrophe bonds, which Keucheyan (2018) [151] describes as a neoliberal response to the increasing natural catastrophe-related cost borne by the insurance sector since the 1990s.
Socially responsible insurance underwriting can also make use of big data in assessing climate change risk, in terms of ensuring this type of risk is shared fairly. With this in mind, Zvezdov and Rath (2016) [152] caution that, as part of the evolution of the reinsurance market, regulations must be drawn up to ensure fairness in risk transfer as part of the wider regulatory environment of the financial markets.
Among big data applications which are of increasing relevance to the insurance section are risk assessments of disruption to supply chains, for example the agri-food supply, due to climate change. All stakeholders in agriculture are having to adapt to climate change, including actors in supply chains; therefore, insurance firms must update their forecasts of potential loss. Iuliia and Aleksan (2016) [153] summarize the technologies which can be utilized to apply big data to analyses of agribusiness value chains in developing countries, as well as technologies under development or new to the market; moreover, they present four case studies in which smallholder producers have been successfully targeted by big data applications.
3.7. Cyber Risk
Cyberattack falls within the larger category of terrorist attack, which in the majority of cases is a politically motivated attack on vulnerable elements of national infrastructure, such as transport networks; it can, however, also be a weapon in commercial conflict. When critical elements of the energy infrastructure are damaged, there is a high danger of blackouts. Apart from cyberattack, such damage may also be due to human error, negligence, lack of preparation, training, or motivation, or because the personnel responsible for monitoring systems and sending warnings that overloads and outages are about to occur have fallen ill or are otherwise physically unable to carry out their work.
Power providers and insurance companies are extremely vulnerable to the damage which can follow the outages which follow disruption of the national grid, as demonstrated by a study carried out by Mill and Jones (2016) [154]. The authors gathered data from multiple real-life disruptions to the US national grid to estimate insurance claims, and found that between 3 and 64% of total loss costs across all cases were insured. Big data can also be used to simulate different causes of grid disruption and, hence, enhance the accuracy of premium pricing. A recent study by Biener et al. (2015) [155] extracted data on 994 incidents of cyber loss from an operational risk database, and analyzed their statistical properties to empirically assess the degree to which cyber risk is insurable. Their findings indicate that developing a sustainable cyber insurance market will be hindered by a lack of data, as well as gross information asymmetries, and the fact that losses are, to a significant degree, interrelated.
Eling and Schnell (2016) [156] reached similar conclusions, finding that systematically insuring against cyber risk is problematized by the lack of both data and appropriate modeling methods, as well as the high risk of change and the even higher one of accumulation risks. Despite the conclusions of the cited authors, however, other researchers have found that big data has the potential to generate the necessary data. It has been suggested that data can be classified through the use of combined supervised learning techniques to create security-aware information; hence, any data which could damage either insurance providers or clients remains confidential. Gai et al. (2016) [157] have applied this approach to enhance the cloud-based cyber risk management of financial big data.
4. Summary
Summarizing the findings, we provide an overview of the various machine learning (ML) and deep learning (DL) algorithms and their (potential) field of applications within the insurance sector in Table 1. We assign the corresponding ML and DL algorithms to the following six insurance categories: (1) Automobile, (2) Mortality Modelling, (3) Healthcare, (4) Harvest Risk, (5) Catastrophe Risk (Hurricanes, Tornadoes, Geomagnetic Events, Earthquakes, Floods, Floods) (6) Climate Risk.
We distinguish between three types of machine learning algorithms: (1) Supervised Learning Algorithms which are task-based, (2) Unsupervised Learning Algorithms which are data-driven, (3) Reinforcement learning which reacts to its environment. Among supervised learning algorithms we can further sub-classify into the following categories: Classification, Regression, Ensembling. Among unsupervised learning algorithms we distinguish between: Association, Clustering, Dimensionality Reduction. Table 1 relates the most applied algorithms to the insurance categories we investigate and which technology and framework is used to perform them, such as Internet of Things (IoT), Blockchain, Virtual reality, Quantum computing, Blockchain, Cloud computing, and Cybersecurity. Moreover, we highlight some examples of how they are applied as well as their level of efficiency.
For a detailed description of the functionality of each algorithm, we refer to Shaw (2019) [158].
What we can see from our analysis is that the level of efficiency does not depend on the type of algorithm or technology being used, but rather depends on the nature of the underlying business and the associated complexity of the underlying system, e.g., the complexity of the forecasting of the climate system, or the availability, consistency, and robustness of historical data and patterns such as in automotive or mortality modeling.
We further provide an overview and classification of the various machine learning (ML) and deep learning (DL) techniques in Figure 6.
5. Conclusions
The role of big data in the insurance sector is growing and will continue to grow. The power of insurers to predict the probability of future occurrences, and thus price premiums accurately, is enormously enhanced by analyzing big data related to past contingent claim events. Furthermore, big data-based simulation models enable insurers to predict an ever-larger variety of potential outcomes, which is of significant help for companies operating in the areas of risk management and hedging. The current paper attempts to set out the current uses, advantages, and limitations of big data within the insurance sector, and suggests how, and in which actuarial fields, it may be applied in the future. The fields discussed are automobile insurance, mortality modeling, healthcare, harvest risk, and cyber risk; catastrophe risk such as storms, hurricanes, tornadoes, geomagnetic events, earthquakes, floods, and fires; and climate risk in general. In all these areas, big data can be leveraged to improve the accuracy of predictions and consequently of policy premium pricing. We assess the current applications of big data in each field and highlight the importance of data processing capabilities due to the immense amount and vast speed at which data collection already takes place and is likely to even accelerate.
In the automobile sector, insurance policies use statistical techniques to infer ratings out of accident reports. With the emerging field of IoT, insurance policy pricing will be more accurate due to more data availability of car driver data in motion. For mortality modeling, machine learning techniques such as neural networks enable insurance companies to incorporate individual features to calculate and predict conditional likelihoods that might be linked to mortality. The healthcare insurance sector benefits enormously from Big Data analytics since pre-diagnostics data collection leads to a more accurate prediction possibility about how likely an individual will claim a certain healthcare benefit.
Through the utilization of satellite data and predictive analytics, insurers can better assess the probability of droughts, floods, heat waves, etc. which might lead to a partial or total loss of harvest. Data mining strategies to create comprehensive meteorological datasets allow also more and more accurate predictions about storms such as occurrences of hurricanes, tornadoes, or even geo-magnetic events by processing observed real-time data from the sun. With respect to real-time observation, blockchain-based pre-detection mechanisms using IoT are already capable of alarming the population in real time in the event of an emergence of an earthquake.
One of the most increasing challenges insurers face is the assessment of climate risk. Due to very long durations of periodic changes in climate, it is impossible to rely on historic data to assess the damage done to the economy caused by climate change, since every century, the industrial progress as well as population density has been on a different level and thus caused a different amount of economic damage. Nevertheless, with data analytics and adaptation of insurance instruments, the insurance policy pricing is increasingly capable of taking interdependent and causal effects into account.
In general, a high penetration of insurance policy pricing is found in all the fields listed above, except cyber risk. Modeling cyber risk for insurance purposes, and hence developing a sustainable market in cyber insurance, remains extremely difficult due to a lack of data and gross data asymmetries. The potential to solve these problems lies in the use of big data, alongside ML techniques, including deep or supervised learning.
Author Contributions
Conceptualization, H.H., S.U. and C.B.; investigation, H.H., S.U. and C.B; writing—review and editing, H.H., S.U. and C.B. All authors have read and agreed to the published version of the manuscript.
Funding
This research did not use any kind of funding.
Conflicts of Interest
There are no conflicts of interest for any of the authors.
References
- Global Insurance Premiums Exceed $5 Trillion for the First Time. Available online: https://www.captive.com/news/2019/07/09/global-insurance-premiums-exceed-5-trillion (accessed on 16 December 2020).
- GDP (Current US$). World Development Indicators. World Bank. Available online: https://en.wikipedia.org/wiki/List_of_countries_by_GDP_(nominal) (accessed on 15 October 2019).
- Encyclopedia Britannica, Historical Development of Insurance. Available online: https://www.britannica.com/topic/insurance/Historical-development-of-insurance (accessed on 16 December 2020).
- Johnston, H.W. Burial places and funeral ceremonies. In The Private Life of the Romans; Johnston, M., Ed.; Scott, Foresman and Company: Chicago, IL, USA; Atlanta, GA, USA, 1903; pp. 475–476. Available online: https://en.wikipedia.org/wiki/Actuarial_science#CITEREFJohnston1932 (accessed on 16 December 2020).
- Loan, A. Institutional Bases of the Spontaneous Order: Surety and Assurance. Hum. Stud. Rev. 1991, 7, 92. Available online: https://www.researchgate.net/publication/235899483_Institutional_Bases_of_the_Spontaneous_Order_Surety_and_Assurance (accessed on 17 December 2020).
- Practice areas. In The Official Guide to Becoming an Actuary; Institute and Faculty of Actuaries: London, UK, 2017; Available online: https://silo.tips/download/the-official-guide-to-becoming-an-actuary (accessed on 17 December 2020).
- Deloitte Insights, 2021 Insurance Outlook. Available online: https://www2.deloitte.com/us/en/pages/financial-services/articles/insurance-industry-outlook.html (accessed on 17 December 2020).
- Pearson, R. Insuring the Industrial Revolution: Fire Insurance in Great Britain, 1700–1850; Modern Economic and Social History Series; Ashgate Publishing Company: Burlington, VT, USA, 2004; Volume XI, 434p. [Google Scholar]
- Halley, E. An estimate of the degrees of mortality of mankind, drawn from curious tables of the births and funerals at the city of Breslaw, with an attempt to ascertain the price of annuities upon lives. Philos. Trans. R. Soc. Lond. 1693, 17, 596–610. [Google Scholar] [CrossRef]
- Bellhouse, D.A. A new look at Halley’s life table. J. R. Stat. Soc. A 2011, 174 Pt 3, 823–832. Available online: http://www.medicine.mcgill.ca/epidemiology/hanley/c609/Material/BellhouseHalleyTable2011JRSS.pdf (accessed on 17 December 2020). [CrossRef]
- Grattan-Guinness, I. Landmark Writings in Western Mathematics 1640–1940; Elsevier: Amsterdam, The Netherlands, 2005. [Google Scholar]
- Dunnigton, W.G. Gauss: The Titan of Science; The Mathematical Association of America (Incorporated): Washington, DC, USA, 2004. [Google Scholar]
- Frees, E.W. Stochastic Life Contingencies with Solvency Considerations. Trans. Soc. Actuar. 1990, 42, 91–148. [Google Scholar]
- Shapiro, A.F.; Jain, L.C. (Eds.) Intelligent and Other Computational Techniques in Insurance: Theory and Applications; World Scientific: Singapore, 2003. [Google Scholar]
- KPMG. How Augmented and Virtual Reality Are Changing the Insurance Landscape. Seizing the Opportunity. 2016. Available online: https://members.aixr.org/storage/how-augmented-and-virtual-reality-changing-insurance-landscape%20(1).pdf (accessed on 17 December 2020).
- Corlosquet-Habart, M.; Jansen, J. Big Data for Insurance Companies; ISTE Ltd.: London, UK; John Wiley and Sons, Inc.: New York, NY, USA, 2018; Volume 1. [Google Scholar]
- European Insurance and Occupational Pensions Authority (EIOPA). Big Data Analytics in Motor and Health Insurance; Publications Office of the European Union: Luxembourg, 2019. [Google Scholar]
- BearingPoint Institute. The Smart Insurer: Embedding Big Data in Corporate Strategy. Available online: https://www.bearingpoint.com/en-us/our-success/thought-leadership/the-smart-insurer-embedding-big-data-in-corporate-strategy/ (accessed on 17 December 2020).
- Deloitte Insights. Sector spotlight: Insurance. In Global Risk Management, 11th ed.; 2019; Available online: https://www2.deloitte.com/content/dam/insights/us/articles/4222_Global-risk-management-survey/DI_global-risk-management-survey.pdf (accessed on 17 December 2020).
- Big Data and Insurance: Implications for Innovation, Competition and Privacy. March 2018. Available online: https://www.genevaassociation.org/research-topics/cyber-and-innovation-digitalization/big-data-and-insurance-implications-innovation (accessed on 17 December 2020).
- Berthelé, E. Using Big Data in Insurance. In Big Data for Insurance Companies; John Wiley: New York, NY, USA, 2018; pp. 131–161. [Google Scholar] [CrossRef]
- OECD. The Impact of Big Data and Artificial Intelligence (AI) in the Insurance Sector; OECD: Paris, France, 2020; Available online: http://www.oecd.org/finance/Impact-Big-Data-AI-in-the-Insurance-Sector.htm (accessed on 17 December 2020).
- SNS Telecom & IT. Big Data in the Insurance Industry: 2018–2030—Opportunities, Challenges, Strategies & Forecasts. August 2018. Available online: https://www.snstelecom.com/bigdatainsurance (accessed on 17 December 2020).
- Corbett, P.; Schroeck, M.; Shockley, R. Analytics: The Real-World Use of Big Data in Insurance. Executive Report, IBM Institute for Business Value. 2018. Available online: https://www.ibm.com/downloads/cas/LKMQWLPY (accessed on 17 December 2020).
- PWC’s HR Technology Survey. 2020. Available online: https://www.pwc.com/us/en/library/workforce-of-the-future/hr-tech-survey.html (accessed on 17 December 2020).
- Topol, E.J. The Patient Will See You Now: The Future of Medicine Is in Your Hands; Basic Books: New York, NY, USA, 2015. [Google Scholar]
- Swiss Re. Wearables: New technology—New risks. In Trend Spotlight; Swiss Re.: Zurich, Switzerland, 2016. [Google Scholar]
- Meyers, G.; Van Hoyweghen, I. Enacting Actuarial Fairness in Insurance: From Fair Discrimination to Behaviour-based Fairness. Sci. Cult. 2017, 1–29. [Google Scholar] [CrossRef]
- Available online: https://www.capgemini.com/2018/08/bigtech-firms-take-measured-steps-toward-the-insurance-sector/ (accessed on 23 August 2018).
- World Insurance Report (WIR) 2018: Digital Agility is Key for Insurers as BigTechs Ponder Entering the Market from Capgemini in Collaboration with Efma. Available online: https://www.capgemini.com/news/world-insurance-report-2018-as-more-customers-buy-insurance-from-bigtechs-digital-agility-is-key-for-traditional-insurers/ (accessed on 17 December 2020).
- SOA. 2019. Available online: https://www.soa.org/globalassets/assets/files/resources/research-report/2019/emerging-analytics-techniques-applications.pdf (accessed on 17 December 2020).
- Big Data and the Role of the Actuary. Available online: https://www.actuary.org/sites/default/files/files/publications/BigDataAndTheRoleOfTheActuary.pdf (accessed on 17 December 2020).
- Sondergeld, E.T.; Purushotham, M.C. Top Acturial Technologies of 2019; Society of Actuaries: Itasca, IL, USA, April 2019. Available online: https://www.soa.org/globalassets/assets/files/resources/research-report/2019/actuarial-innovation-technology.pdf (accessed on 17 December 2020).
- Guo, L. Applying Data Mining Techniques in Property/Casualty Insurance. CAS Forum. 2003. Available online: https://www.casact.org/pubs/forum/03wforum/03wf001.pdf (accessed on 17 December 2020).
- Wedel, M.; Kannan, P.K. Marketing Analytics for Data-Rich Environments. J. Mark. 2016, 80. [Google Scholar] [CrossRef]
- Deloitte Insights. 2020 Insurance Outlook. 3 December 2019. Available online: https://www2.deloitte.com/us/en/insights/industry/financial-services/financial-services-industry-outlooks/insurance-industry-outlook.html (accessed on 17 December 2020).
- BearingPoint Institute. The Smart Insurer: More than Just Big Data. Available online: https://www.bearingpoint.com/en/our-success/thought-leadership/the-smart-insurer-embedding-big-data-in-corporate-strategy/ (accessed on 17 December 2020).
- Bakratsas, M.; Basaras, P.; Katsaros, D.; Tassiulas, L. Hadoop MapReduce performance on SSDs for analyzing social networks. Big Data Res. 2017. [Google Scholar] [CrossRef]
- Billot, R.; Bothorel, C.; Lenca, P. Introduction to Big Data and Its Applications in Insurance. In Big Data for Insurance Companies; Wiley: New York, NY, USA, 2018; pp. 1–25. [Google Scholar]
- Kunce, J.; Chatterjee, S. A Machine-Learning Approach to Parameter Estimation, Casualty Actuarial Society Monograph Series 6, CAS. 2017. Available online: https://www.casact.org/pubs/monographs/papers/06-Kunce-Chatterjee.pdf (accessed on 17 December 2020).
- Noll, A.; Salzmann, R.; Wüthrich, M.V. Case Study: French Motor Third-Party Liability Claims. Swiss Association of Actuaries, 2018. Available online: https://ssrn.com/abstract=3164764 (accessed on 17 December 2020).
- Zappa, D.; Clemente, G.P.; Borrelli, M.; Savelli, N. Text Mining in Insurance: From Unstructured Data to Meaning. Variance, 2019. Available online: https://www.variancejournal.org/articlespress/articles/Text_Mining-Zappa-Borrelli-Clemente-Savelli.pdf (accessed on 17 December 2020).
- Report on the Use of Big Data by Financial Institutions. Joint Committee of the ESAs: 15 March 2018. Available online: https://www.esma.europa.eu/sites/default/files/library/jc-2016-86_discussion_paper_big_data.pdf (accessed on 17 December 2020).
- P&C Insurance Trends to Watch in 2019. CB Insights, 4 February 2019. Available online: www.cbinsights.com/research/insurance-trends-2019/ (accessed on 17 December 2020).
- Bellina, R.; Ly, A.; Taillieu, F. A European Insurance lEader Works with Milliman to Process Raw Telematics Data and Detect Driving Behavior. Milliman White Paper. May 2018. Available online: https://www.milliman.com/en/insight/a-european-insurance-leader-works-with-milliman-to-process-raw-telematics-data-and-detect (accessed on 17 December 2020).
- Huang, Y.; Meng, S. Automobile insurance classification ratemaking based on telematics driving data. Decis. Support Syst. 2019, 127, 113156. [Google Scholar] [CrossRef]
- Tselentis, D.I.; Yannis, G.; Vlahogianni, E.I. Innovative motor insurance schemes: A review of current practices and emerging challenges. Accid. Anal. Prev. 2017, 98, 139–148. [Google Scholar] [CrossRef]
- Baecke, P.; Bocca, L. The value of vehicle telematics data in insurance risk selection processes. Decis. Support Syst. 2017, 98, 69–79. [Google Scholar] [CrossRef]
- Paefgen, J.; Staake, T.; Thiesse, F. Evaluation and aggregation of pay-as-you-drive insurance rate factors: A classification analysis approach. Decis. Support Syst. 2013, 56, 192–201. [Google Scholar] [CrossRef]
- Paefgen, J.; Staake, T.; Fleisch, E. Multivariate exposure modeling of accident risk: Insights from Pay-as-you-drive insurance data. Transp. Res. Part A Policy Pract. 2014, 61, 27–40. [Google Scholar] [CrossRef]
- Husnjak, S.; Peraković, D.; Forenbacher, I.; Mumdziev, M. Telematics System in Usage Based Motor Insurance. Procedia Eng. 2015, 100, 816–825. [Google Scholar] [CrossRef] [Green Version]
- Richman, R. AI in Actuarial Science. Presented at the Actuarial Society of South Africa’s 2018 Convention, Cape Town, South Africa, 24–25 October 2018. [Google Scholar]
- KPMG. The Chaotic Middle. The Autonomous Vehicle and Disruption in Automobile Insurance, White Paper. June 2017. Available online: https://assets.kpmg/content/dam/kpmg/us/pdf/2017/06/chaotic-middle-autonomous-vehicle-paper.pdf (accessed on 17 December 2020).
- Alshamsi, A.S. Predicting car insurance policies using random forest. In Proceedings of the 2014 10th International Conference on Innovations in Information Technology (IIT), Abu Dhabi, UAE, 9–11 November 2014. [Google Scholar]
- Wang, H.D. Research on the Features of Car Insurance Data Based on Machine Learning. Procedia Comput. Sci. 2020, 166, 582–587. [Google Scholar] [CrossRef]
- Wang, Y.; Xu, W. Leveraging deep learning with LDA-based text analytics to detect automobile insurance fraud. Decis. Support Syst. 2018, 105, 87–95. [Google Scholar] [CrossRef]
- Subudhi, S.; Panigrahi, S. Effect of Class Imbalanceness in Detecting Automobile Insurance Fraud. In Proceedings of the 2nd International Conference on Data Science and Business Analytics, Changsha, China, 21–23 September 2018; IEEE: New York, NY, USA, 2018. [Google Scholar]
- Institute and Faculty of Actuaries (IFoA). Longevity Bulletin. Big Data Health. 2016. Available online: https://www.actuaries.org.uk/system/files/field/document/Longevity%20Bulletin%20Issue%209.pdf (accessed on 17 December 2020).
- LLMA. Longevity Pricing Framework, A Framework for Pricing Longevity Exposures Developed by the Life & Longevity Markets Association (LLMA). 2010. Available online: www.llma.org (accessed on 17 December 2020).
- Silverman, S.; Simpson, P. Case Study: Modelling Longevity Risk for Solvency II. Milliman Research Report. October 2011. Available online: https://www.milliman.com/-/media/products/reveal/modelling-longevity-risk.ashx (accessed on 17 December 2020).
- Booth, H.; Tickle, L. Mortality modelling and forecasting: A review of methods. Ann. Actuar. Sci. 2008, 3, 3–43. [Google Scholar] [CrossRef]
- Deprez, P.; Shevchenko, P.; Wüthrich, M. Machine learning techniques for mortality modeling. Eur. Actuar. J. 2017, 7, 337–352. [Google Scholar] [CrossRef]
- Kopinsky, M. Predicting Group Long Term Disability Recovery and Mortality Rates Using Tree Models, SOA. 2017. Available online: https://www.soa.org/globalassets/assets/Files/Research/Projects/2017-gltd-recovery-mortality-tree.pdf (accessed on 17 December 2020).
- Hainaut, D. A neural-network analyzer for mortality forecast. Astin Bull. 2018, 48, 481–508. [Google Scholar] [CrossRef] [Green Version]
- Shang, K. Individual Cancer Mortality Prediction; Insurance and Social Protection Area: Madrid, Spain, 2017; Available online: www.fundacionmapfre.org (accessed on 17 December 2020).
- Mehta, N.; Pandit, A.; Shukla, S. Transforming Healthcare with Big Data Analytics and Artificial Intelligence: A Systematic Mapping Study. J. Biomed. Inform. 2019, 100, 103311. [Google Scholar] [CrossRef]
- Chawla, N.V.; Davis, D.A. Bringing Big Data to Personalized Healthcare: A Patient-Centered Framework. J. Gen. Intern. Med. 2013, 28 (Suppl. S3), S660–S665. [Google Scholar] [CrossRef] [Green Version]
- Raghupathi, W.; Raghupathi, V. Big data analytics in healthcare: Promise and potential. Health Inf. Sci. Syst. 2014, 2, 3. [Google Scholar] [CrossRef] [PubMed]
- Belle, A.; Thiagarajan, R.; Soroushmehr, S.M.R.; Navidi, F.; Beard, D.A.; Najarian, K. Big Data Analytics in Healthcare. In BioMed Research International; Hindawi Publishing Corporation: New York, NY, USA, 2015; p. 370194. [Google Scholar] [CrossRef] [Green Version]
- Lander, E.S.; Linton, L.M.; Birren, B.; Nusbaum, C.; Zody, M.C.; Baldwin, J.; Devon, K.; Dewar, K.; Doyle, M.; FitzHugh, W.; et al. Initial sequencing and analysis of the human genome. Nature 2001, 409, 860–921. Available online: http://hdl.handle.net/2027.42/62798 (accessed on 17 December 2020). [PubMed] [Green Version]
- Drmanac, R.; Sparks, A.B.; Callow, M.J.; Halpern, A.L.; Burns, N.L.; Kermani, B.G.; Carnevali, P.; Nazarenko, I.; Nilsen, G.B.; Yeung, G.; et al. Human genome sequencing using unchained base reads on self-assembling DNA nanoarrays. Science 2010, 327, 78–81. [Google Scholar] [CrossRef] [PubMed] [Green Version]
- Bates, D.W.; Saria, S.; Ohno-Machado, L.; Shah, A.; Escobar, G. Big Data in Health Care: Using Analytics to Identify and Manage High-Risk and High-Cost Patients. Health Aff. 2014, 33, 1123–1131. [Google Scholar] [CrossRef] [PubMed] [Green Version]
- Feldman, B.; Martin, E. Big Data in Healthcare Hype and Hope. Comput. Sci. 2012, 360, 122–125. [Google Scholar]
- Kandula, S.; Shaman, J. Reappraising the utility of Google Flu Trends. PLoS Comput. Biol. 2019, 15, e1007258. [Google Scholar] [CrossRef] [Green Version]
- Horn, J.W.; Xi, Z.; Riina, R.; Peirson, J.A.; Yang, Y.; Dorsey, B.L.; Berry, P.E.; Davis, C.C.; Wurdack, K.J. Evolutionary bursts inEuphorbia(Euphorbiaceae) are linked with photosynthetic pathway. Evolution 2014, 68, 3485–3504. [Google Scholar] [CrossRef]
- Brandt, N.; Gunnarsson, T.P.; Bangsbo, J.; Pilegaard, H. Exercise and exercise training-induced increase in autophagy markers in human skeletal muscle. Physiol. Rep. 2018, 6, e13651. [Google Scholar] [CrossRef]
- Schileo, E.; Dall’Ara, E.; Taddei, F.; Malandrino, A.; Schotkamp, T.; Baleani, M.; Viceconti, M. An accurate estimation of bone density improves the accuracy of subject-specific finite element models. J. Biomech. 2008, 41, 2483–2491. [Google Scholar] [CrossRef]
- Irigaray, T.Q.; Pacheco, J.T.B.; Grassi-Oliveira, R.; Fonseca, R.P.; Leite, J.C.D.C.; Kristensen, C.H. Child maltreatment and later cognitive functioning: A systematic review. Psicol. Reflexão Crítica 2013, 26, 376–387. [Google Scholar] [CrossRef] [Green Version]
- Hammer, L.B.; Kossek, E.E.; Bodner, T.; Crain, T. Measurement development and validation of the Family Supportive Supervisor Behavior Short-Form (FSSB-SF). J. Occup. Health Psychol. 2013, 18, 285–296. [Google Scholar] [CrossRef] [PubMed] [Green Version]
- Kerfoot, E.D.; Lamata, P.; Niederer, S.A.; Hose, R.; Spaan, J.A.E.; Smith, N. Share and enjoy: Anatomical models database--generating and sharing cardiovascular model data using web services. Med. Biol. Eng. Comput. 2013, 51, 1181–1190. [Google Scholar] [CrossRef] [PubMed]
- Morris, P.D.; Narracott, A.; von Tengg Kobligk, H.; Soto, D.A.S.; Hsiao, S.; Lungu, A.; Evans, P.; Bressloff, N.W.; Lawford, P.V.; Hose, D.R.; et al. Computational fluid dynamics modelling in cardiovascular medicine. Heart 2016, 102, 18–28. [Google Scholar] [CrossRef] [PubMed] [Green Version]
- Lio, P.; Shavit, Y. CytoHiC: A cytoscape plugin for visual comparison of Hi-C networks. Bioinformatics 2013, 29, 1206–1207. [Google Scholar] [CrossRef] [Green Version]
- Evans, M.A.; Johri, A. Facilitating guided participation through mobile technologies: Designing creative learning environments for self and others. J. Comput. High. Educ. 2008, 20, 92–105. [Google Scholar] [CrossRef]
- Marco, V.; Josef, K.; Clapworthy, G.J.; Saulo, M. Fast realistic modelling of muscle fibres. In Computer Vision, Imaging and Computer Graphics; Csurka, G., Kraus, M., Laramee, R.S., Richard, P., Braz, J., Eds.; Theory and Application; Communications in Computer and Information Science; Springer: Berlin/Heidelberg, Germany, 2013; Volume 359. [Google Scholar] [CrossRef]
- Jyun, J.-G.; Kim, G.; Lee, J.-E.; Kim, Y.; Shim, W.B.; Lee, J.-H.; Shin, H.; Lee, J.D.; Park, B.-G. Single-Crystalline Si STacked ARray (STAR) NAND Flash Memory. IEEE Trans. Electron Devices 2011, 58, 1006–1014. [Google Scholar] [CrossRef]
- Viceconti, M.; Henney, A.; Morley-Fletcher, E. In silico clinical trials: How computer simulation will transform the biomedical industry. Int. J. Clin. Trials 2016, 3, 37. [Google Scholar] [CrossRef] [Green Version]
- Diana, A.; Griffin, J.; Oberoi, J.; Yao, J. Machine-Learning Methods for Insurance Applications-A Survey. Society of Actuaries, 2019. Available online: https://www.soa.org/resources/research-reports/2019/machine-learning-methods/ (accessed on 17 December 2020).
- Toyoda, S.; Niki, N. Information Visualization for Chronic Patient’s Data. In ISIP; Springer: Berlin/Heidelberg, Germany, 2012. [Google Scholar]
- Kareem, S.; Ahmad, R.; Sarlan, A. Framework for the identification of fraudulent health insurance claims using association rule mining. In Proceedings of the 2017 IEEE Conference on Big Data and Analytics (ICBDA), Kuching, Malaysia, 16–17 November 2017; pp. 99–104. [Google Scholar] [CrossRef]
- Dhieb, N.; Ghazzai, H.; Besbes, H.; Massoud, Y. A Secure AI-Driven Architecture for Automated Insurance Systems: Fraud Detection and Risk Measurement. IEEE Access 2020, 8. [Google Scholar] [CrossRef]
- Wang, Y.; Kung, L.; Byrd, T. Big data analytics: Understanding its capabilities and potential benefits for healthcare organizations. Technol. Forecast. Soc. Chang. 2018, 126, 3–13. [Google Scholar] [CrossRef]
- Hartmann, B.; Owen, R.; Gibbs, Z. Predicting High-Cost Health Insurance Members through Boosted Trees and Oversampling: An Application Using the HCCI Database. 2018. Available online: https://hartman.byu.edu/docs/files/HartmanOwenGibbs_HighCostClaims.pdf (accessed on 17 December 2020).
- Boodhun, N.; Jayabalan, M. Risk Prediction in Life Insurance Industry using Supervised Learning Algorithms. Complex Intell. Syst. 2018. [Google Scholar] [CrossRef] [Green Version]
- The International Actuarial Association. Impact of Personalised Medicine and Genomics on the Insurance Industry. April 2017. Available online: http://www.actuaries.org/LIBRARY/Papers/HC_Personalised_Medicine_Paper_Final.pdf (accessed on 17 December 2020).
- Hulsen, T.; Jamuar, S.S.; Moody, A.R.; Karnes, J.H.; Varga, O.; Hedensted, S.; Spreafico, R.; Hafler, D.A.; McKinney, E.F. From Big Data to Precision Medicine. Front. Med. 2019, 6, 34. [Google Scholar] [CrossRef] [PubMed] [Green Version]
- Cirillo, D.; Valencia, A. Big data analytics for personalized medicine. Curr. Opin. Biotechnol. 2019, 58, 161–167. [Google Scholar] [CrossRef] [PubMed]
- McKinney, S.M.; Sieniek, M.; Godbole, V.; Godwin, J.; Antropova, N.; Ashrafian, H.; Back, T.; Chesus, M.; Corrado, G.S.; Darzi, A.; et al. International evaluation of an AI system for breast cancer screening. Nature 2020, 577, 89–94. [Google Scholar] [CrossRef] [PubMed]
- Perez, M.V.; Mahaffey, K.W.; Hedlin, H.; Rumsfeld, J.S.; Garcia, A.; Ferris, T.; Balasubramanian, V.; Russo, A.M.; Rajmane, A.; Cheung, L.; et al. Large-Scale Assessment of a Smartwatch to Identify Atrial Fibrillation. N. Engl. J. Med. 2020, 381, 1909–1917. [Google Scholar] [CrossRef]
- Kamilaris, A.; Antón, A.; Bonmatí, A.; Torrellas, M.; Prenafeta Boldú, F. Estimating the Environmental Impact of Agriculture by Means of Geospatial and Big Data Analysis: The Case of Catalonia; Springer: Cham, Switzerland, 2018. [Google Scholar] [CrossRef]
- Pretty, J. Agricultural sustainability: Concepts, principles and evidence. Philos. Trans. R. Soc. B Biol. Sci. 2007, 363, 447–465. [Google Scholar] [CrossRef] [Green Version]
- Nandyala, C.S.; Kim, H.-K. Big and Meta Data Management for U-Agriculture Mobile Services. Int. J. Softw. Eng. Its Appl. 2016, 10, 257–270. [Google Scholar] [CrossRef] [Green Version]
- Hashem, I.A.T.; Yaqoob, I.; Anuar, N.B.; Mokhtar, S.; Gani, A.; Khan, S.U. The rise of “big data” on cloud computing: Review and open research issues. Inf. Syst. 2015, 47, 98–115. [Google Scholar] [CrossRef]
- Chedad, A.; Moshou, D.; Aerts, J.M.; Van Hirtum, A.; Ramon, H.; Berckmans, D. Recognition system for pig cough based on probabilistic neural networks. J. Agric. Eng. Res. 2001, 79, 449–457. [Google Scholar] [CrossRef]
- Kempenaar, C.; Been, T.; Booij, J.; Van Evert, F.; Michielsen, J.-M.; Kocks, C. Advances in Variable Rate Technology Application in Potato in The Netherlands. Potato Res. 2017, 60, 295–305. [Google Scholar] [CrossRef] [Green Version]
- Becker-Reshef, I.; Justice, C.; Sullivan, M.; Vermote, E.; Tucker, C.J.; Anyamba, A.; Small, J.; Pak, E.; Masuoka, E.; Schmaltz, J.; et al. Monitoring Global Croplands with Coarse Resolution Earth Observations: The Global Agriculture Monitoring (GLAM) Project. Remote. Sens. 2010, 2, 1589–1609. [Google Scholar]
- Giuliani, G.; Nativi, S.; Obregon, A.; Beniston, M.; Lehmann, A. Spatially enabling the Global Framework for Climate Services: Reviewing geospatial solutions to efficiently share and integrate climate data & information. Clim. Serv. 2017, 8, 44–58. [Google Scholar] [CrossRef]
- Karmas, A.; Karantzalos, K.; Athanasiou, S. Online analysis of remote sensing data for agricultural applications. In Proceedings of the OSGeo’s European Conference on Free and Open Source Software for Geospatial, Portland, OR, USA, 8–13 September 2014. [Google Scholar]
- Yu, M.K.; Ma, J.; Fisher, J.; Kreisberg, J.F.; Raphael, B.; Ideker, T. Visible Machine Learning for Biomedicine. Cell 2018, 173, 1562–1565. [Google Scholar] [CrossRef] [PubMed] [Green Version]
- Mucherino, A.; Papajorgji, P.J.; Pardalos, P. Data Mining Agriculture; Springer: New York, NY, USA, 2009. [Google Scholar] [CrossRef]
- Shirsath, P.; Vyas, S.; Aggarwal, P.K.; Rao, K. Designing weather index insurance of crops for the increased satisfaction of farmers, industry and the government. Clim. Risk Manag. 2019, 25, 100189. [Google Scholar] [CrossRef]
- Sykuta, M. Big Data in Agriculture: Property Rights, Privacy and Competition in Ag Data Services. Int. Food Agribus. Manag. Rev. 2016, 19, 1–18. [Google Scholar]
- Kshetri, N. Big data׳s impact on privacy, security and consumer welfare. Telecommun. Policy 2014, 38, 1134–1145. [Google Scholar] [CrossRef] [Green Version]
- Ashok, T.; Suresh, V.P. Prediction of Crops based on Environmental Factors using IoT & Machine Learning Algorithms. Int. J. Innov. Technol. Explor. Eng. 2019, 9, 5395–5401. [Google Scholar]
- Lane, M.; Mahul, O. Catastrophe Risk Pricing—An Empirical Analysis; Policy Research Working Paper; World Bank: Washington, DC, USA, 2008; WPS: 4765. [Google Scholar]
- Li, M.; Powers, I.Y. The role of catastrophe modeling in insurance rating. Risk Manag. 2007, 54, 10. [Google Scholar]
- Bougen, P.D. Catastrophe risk. Econ. Soc. 2003, 32, 253–274. [Google Scholar] [CrossRef]
- Logic Mark and Accord. Making Sense of Big Data in Insurance (White Paper). 2013. Available online: https://cdn1.marklogic.com/wp-content/uploads/2018/01/making-sense-big-data-in-insurance-130913.pdf (accessed on 17 December 2020).
- Big Data Analytics Is Shaking up the Insurance Business? HPC, 2016. Available online: www.datanami.com (accessed on 17 December 2020).
- Schruek, M.; Shockley, R. Analytics: Real World Use of Big Data in Insurance. IBM, 2015. Available online: m.ibm.com (accessed on 17 December 2020).
- TIBCO Blog. 4 Ways Big Data Is Transforming the Insurance Industry. 2015. Available online: https://www.tibco.com/blog/2015/07/20/4-ways-big-data-is-transforming-the-insurance-industry/ (accessed on 17 December 2020).
- Nguyen, L.; Yang, Z.; Li, J.; Pan, Z.; Cao, G.; Jin, F. Forecasting People’s Needs in Hurricane Events from Social Network. IEEE Trans. Big Data 2019. [Google Scholar] [CrossRef] [Green Version]
- Hangan, H.; Refan, M.; Jubayer, C.; Parvu, D.; Kilpatrick, R. Big Data from Big Experiments. The WindEEE Dome. In Whither Turbulence and Big Data in the 21st Century; Springer: Berlin, Germany, 2016; pp. 215–230. [Google Scholar]
- Cox, T.S.; Hoi, C.S.H.; Leung, C.K.; Marofke, C.R. An Accurate Model for Hurricane Trajectory Prediction. In Proceedings of the 2018 IEEE 42nd Annual Computer Software and Applications Conference (COMPSAC), Tokyo, Japan, 23–27 July 2018. [Google Scholar] [CrossRef]
- Zhu, Y.; Ozbay, K.; Xie, K.; Yang, H. Using Big Data to Study Resilience of Taxi and Subway Trips for Hurricanes Sandy and Irene. Transp. Res. Rec. J. Transp. Res. Board 2016, 2599, 70–80. [Google Scholar] [CrossRef]
- Camara, R.C.; Cuzzocrea, A.; Grasso, G.M.; Leung, C.K.; Powell, S.B.; Souza, J.; Tang, B. Fuzzy Logic-Based Data Analytics on Predicting the Effect of Hurricanes on the Stock Market. In Proceedings of the 2018 IEEE International Conference on Fuzzy Systems (FUZZ-IEEE), New Orleans, LA, USA, 23–26 June 2018. [Google Scholar] [CrossRef]
- Aladangady, A.; Aron-Dine, S.; Dunn, W.E.; Feiveson, L.; Lengermann, P.; Sahm, C. The Effect of Hurricane Matthew on Consumer Spending, Feds Notes. 2017. Available online: https://ssrn.com/abstract=3056155 (accessed on 17 December 2020).
- Chen, Z.; Sharma, P.; Sutley, E.J. Deep learning of Tornado Disaster Scenes using Unmanned-Aerial-Vehicle (UAV) Images. In Proceedings of the American Geophysical Union, Fall Meeting 2019, San Francisco, CA, USA, 9–13 December 2019. [Google Scholar]
- Elsner, J.B.; Fricker, T.; Schroder, Z. Increasingly Powerful Tornadoes in the United States. Geophys. Res. Lett. 2018. [Google Scholar] [CrossRef] [Green Version]
- Lian, J.; McGuire, M.P.; Moore, T.W. Funnel Cloud: A cloud-based system for exploring tornado events. Int. J. Digit. Earth 2017, 10, 1030–1054. [Google Scholar] [CrossRef]
- Srebrov, B.; Kounchev, O.; Simeonov, G. Chapter 19—Big Data for the Magnetic Field Variations in Solar-Terrestrial Physics and Their Wavelet Analysis. In Knowledge Discovery in Big Data from Astronomy and Earth Observation, Astrogeoinformatics; Elsevier: Amsterdam, The Netherlands, 2020; pp. 347–370. [Google Scholar]
- Pashova, L.; Srebrov, B.; Kounchev, O. Investigation of Strong Geomagnetic Storms Using Multidisciplinary Big Data Sets; IEEE: New York, NY, USA, 2019. [Google Scholar] [CrossRef]
- Blagoveshchensky, D.; Sergeeva, M. Impact of geomagnetic storm of 7–8 September 2017 on ionosphere and HF propagation: A multi-instrument study. Adv. Space Res. 2019, 63, 239–256. [Google Scholar] [CrossRef]
- Astafyeva, E.; Yasyukevich, Y.; Maksikov, A.; Zhivetiev, I. Geomagnetic storms super-storms and their impacts on GPS-based navigation systems. Space Weather 2014, 12, 508–525. [Google Scholar] [CrossRef]
- Gvishiani, A.; Soloviev, A.; Krasnoperov, R.; Lukianova, R. Automated Hardware and Software System for Monitoring the Earth’s Magnetic Environment. Data Sci. J. 2016, 15, 18. [Google Scholar] [CrossRef]
- Belehaki, A.; Tsagouri, I.; Kutiev, I.; Marinov, P.; Zolesi, B.; Pietrella, M.; Themelis, K.; Elias, P.; Tziotziou, K. The European Ionosonde Service: Nowcasting and forecasting ionospheric conditions over Europe for the ESA Space Situational Awareness services. J. Space Weather Space Clim. 2015, 5, A25. [Google Scholar] [CrossRef]
- Lemmerer, B.; Unger, S. Modeling and pricing of space weather derivatives. Risk Manag. 2019, 21, 265–291. [Google Scholar] [CrossRef]
- Liu, Y.; Wang, K.; Quian, K.; Du, M.; Guo, S. Tornado: Enabling Blockchain in Heterogeneous Internet of Things through a Space-Structured Approach. IEEE Internet Things J. 2020, 7, 1273–1286. [Google Scholar] [CrossRef]
- Kagan, Y.Y. Earthquake size distribution and earthquake insurance. Commun. Stat. Stoch. Models 1997, 13, 775–797. [Google Scholar] [CrossRef]
- Brillinger, D.R. Earthquake risk and insurance. Environmetrics 1993, 4, 1–21. [Google Scholar] [CrossRef]
- Mouyiannou, A.; Styles, K.E. From Structural Performance to Loss Estimation for (Re) Insurance Industry Needs: An Overview of the Vulnerability Estimation Approaches within Earthquake Catastrophe Models. In Proceedings of the COMPDYN 2017 6th ECCOMAS Thematic Conference on Computational Methods in Structural Dynamics and Earthquake Engineering, Rhodes Island, Greece, 15–17 July 2017. [Google Scholar]
- Tiampo, K.F.; Kazemian, J.; Ghofrani, H.; Kropivnitskaya, Y.; Michel, G. Insights into seismic hazard from big data analysis of ground motion simulations. Int. J. Saf. Secur. Eng. 2019, 9, 1–12. [Google Scholar] [CrossRef]
- Crichton, D. Role of Insurance in Reducing Flood Risk. Geneva Pap. Risk Insur. Issues Pract. 2007, 33, 117–132. [Google Scholar] [CrossRef] [Green Version]
- Andre, C.; Monfort, C.; Bouzit, M.; Vinchon, C. Contribution of insurance data to cost assessment of coastal flood damage to residential buildings: Insights gained from Johanna (2008) and Xynthia (2010) storm events. Nat. Hazards Earth Syst. Sci. 2013, 13, 2003–2012. [Google Scholar] [CrossRef] [Green Version]
- Schumann, G.J.-P. Fight floods on a global scale. Nature 2013, 507, 169. [Google Scholar] [CrossRef]
- Browne, J.L.; Kayode, G.A.; Arhinful, D.; Fidder, S.A.J.; E Grobbee, D.; Klipstein-Grobusch, K. Health insurance determines antenatal, delivery and postnatal care utilisation: Evidence from the Ghana Demographic and Health Surveillance data. BMJ Open 2016, 6, e008175. [Google Scholar] [CrossRef] [Green Version]
- Gao, C.; Wang, M. Forest Fire Risk Assessment Based on Ecological and Economic Value—Take Yunnan Province as an Example. In Proceedings of the 7th Annual Meeting of Risk Analysis Council of China Association for Disaster Prevention, Changsha, China, 4–6 November 2016. [Google Scholar] [CrossRef] [Green Version]
- Tang, J. Big Data and Predictive Analytics in Fire Risk using Weather Data; ProQuest Dissertations Publishing; State University of New York at Buffalo: Buffalo, NY, USA, 2018. [Google Scholar]
- Byungkwan, J. Exploratory study on the based on big data for fire prevention of multiple shops. J. Ind. Converg. 2018, 16, 27–32. [Google Scholar]
- Eckstein, D.; Künzel, V.; Schäfer, L.; Winges, M. Global Climate Risk Index, Germanwatch, Briefing Paper. 2020. Available online: https://www.germanwatch.org/sites/germanwatch.org/files/20-2-01e%20Global%20Climate%20Risk%20Index%202020_16.pdf (accessed on 17 December 2020).
- Botzen, W.J.W.; van den Bergh, J.C.J.M. Insurance against Climate Change and Flooding in the Netherlands: Present, Future, and Comparison with Other Countries. Risk Anal. 2008, 28, 413–426. [Google Scholar] [CrossRef]
- Keucheyan, R. Insuring Climate Change: New Risks and the Financialization of Nature. Dev. Chang. 2018, 49, 484–501. [Google Scholar] [CrossRef]
- Zvedzdov, I.; Rath, S. Towards Socially Responsible (Re)Insurance Underwriting Practices: Readily Available ‘Big Data’ Contributions to Optimize Catastrophe Risk Management. 2016. Available online: https://ssrn.com/abstract=2737508 (accessed on 17 December 2020).
- Iuliia, P.; Aleksan, S. Big Data and Smallholder Farmers: Big Data Applications in the Agri-Food Supply Chain in Developing Countries. Int. Food Agribus. Manag. Rev. 2016, 18, 173–190. [Google Scholar]
- Mills, E.; Jones, R.B. An insurance perspective on U.S. electric grid disruption costs. Geneva Pap. Risk Insur. Issues Pract. 2016, 41, 555–586. [Google Scholar] [CrossRef] [Green Version]
- Biener, C.; Eling, M.; Wirfs, J.H. Insurability of Cyber Risk: An Empirical Analysis. Geneva Pap. Risk Insur. Issues Pract. 2015, 40, 131–158. [Google Scholar] [CrossRef] [Green Version]
- Eling, M.; Schnell, W. What do we know about cyber risk and cyber risk insurance? J. Risk Finance 2016, 17, 474–491. [Google Scholar] [CrossRef]
- Gai, K.; Qiu, M.; Elnagdy, S.A. Security-Aware Information Classifications Using Supervised Learning for Cloud-Based Cyber Risk Management in Financial Big Data. In Proceedings of the IEEE 2nd International Conference on Big Data Security on Cloud (BigDataSecurity), IEEE International Conference on High Performance and Smart Computing (HPSC), and IEEE International Conference on Intelligent Data and Security (IDS), New York, NY, USA, 9–10 April 2016. [Google Scholar] [CrossRef]
- Shaw, R. The 10 Best Machine Learning Algorithms for Data Science Beginners. 2019. Available online: https://www.dataquest.io/blog/top-10-machine-learning-algorithms-for-beginners/ (accessed on 25 November 2020).
- Shukla, P.; Iriondo, R.; Chen, S. Machine Learning Algorithms for Beginners with Code Examples in Python, towards AI. 2020. Available online: https://medium.com/towards-artificial-intelligence/machine-learning-algorithms-for-beginners-with-python-code-examples-ml-19c6afd60daa (accessed on 26 November 2020).
Figure 1.
Practical implementation of a machine learning algorithm.

Figure 2.
Flowchart for assessing expected crop yield [113].
Figure 2.
Flowchart for assessing expected crop yield [113].

Figure 3.
Structures of a traditional neural network for solar flare forecasting.

Figure 4.
Flowchart for minimizing human losses with machine learning methods.

Figure 5.
Flowchart of predicting and evaluating flood hazard.

Figure 6.
Overview and classification of various machine learning (ML) and deep learning (DL) techniques. (Shukla, et al. (2020) [159]).
Figure 6.
Overview and classification of various machine learning (ML) and deep learning (DL) techniques. (Shukla, et al. (2020) [159]).


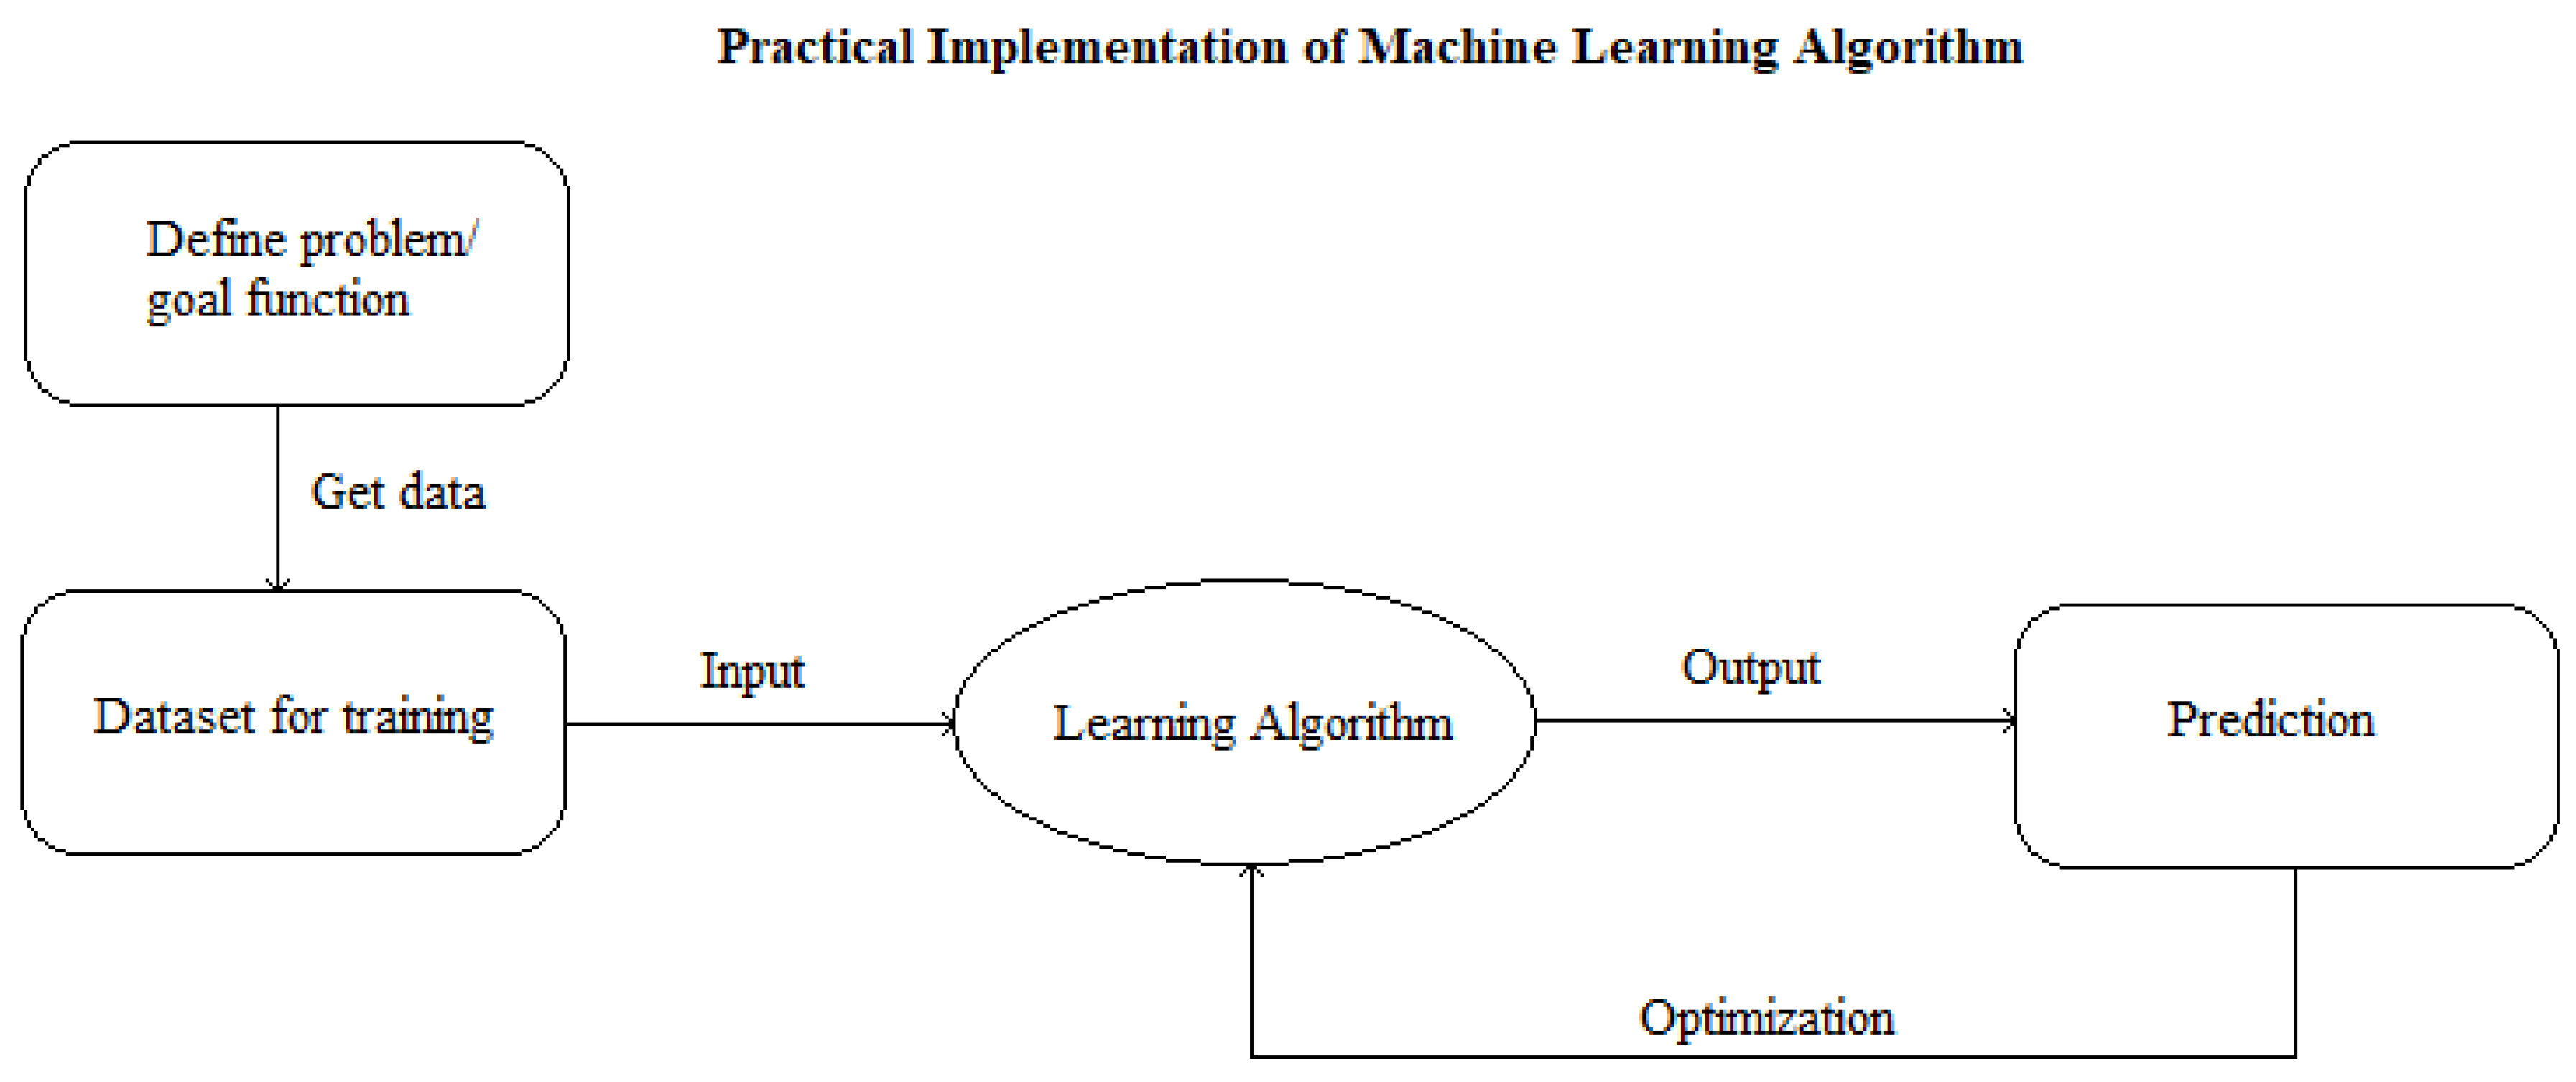
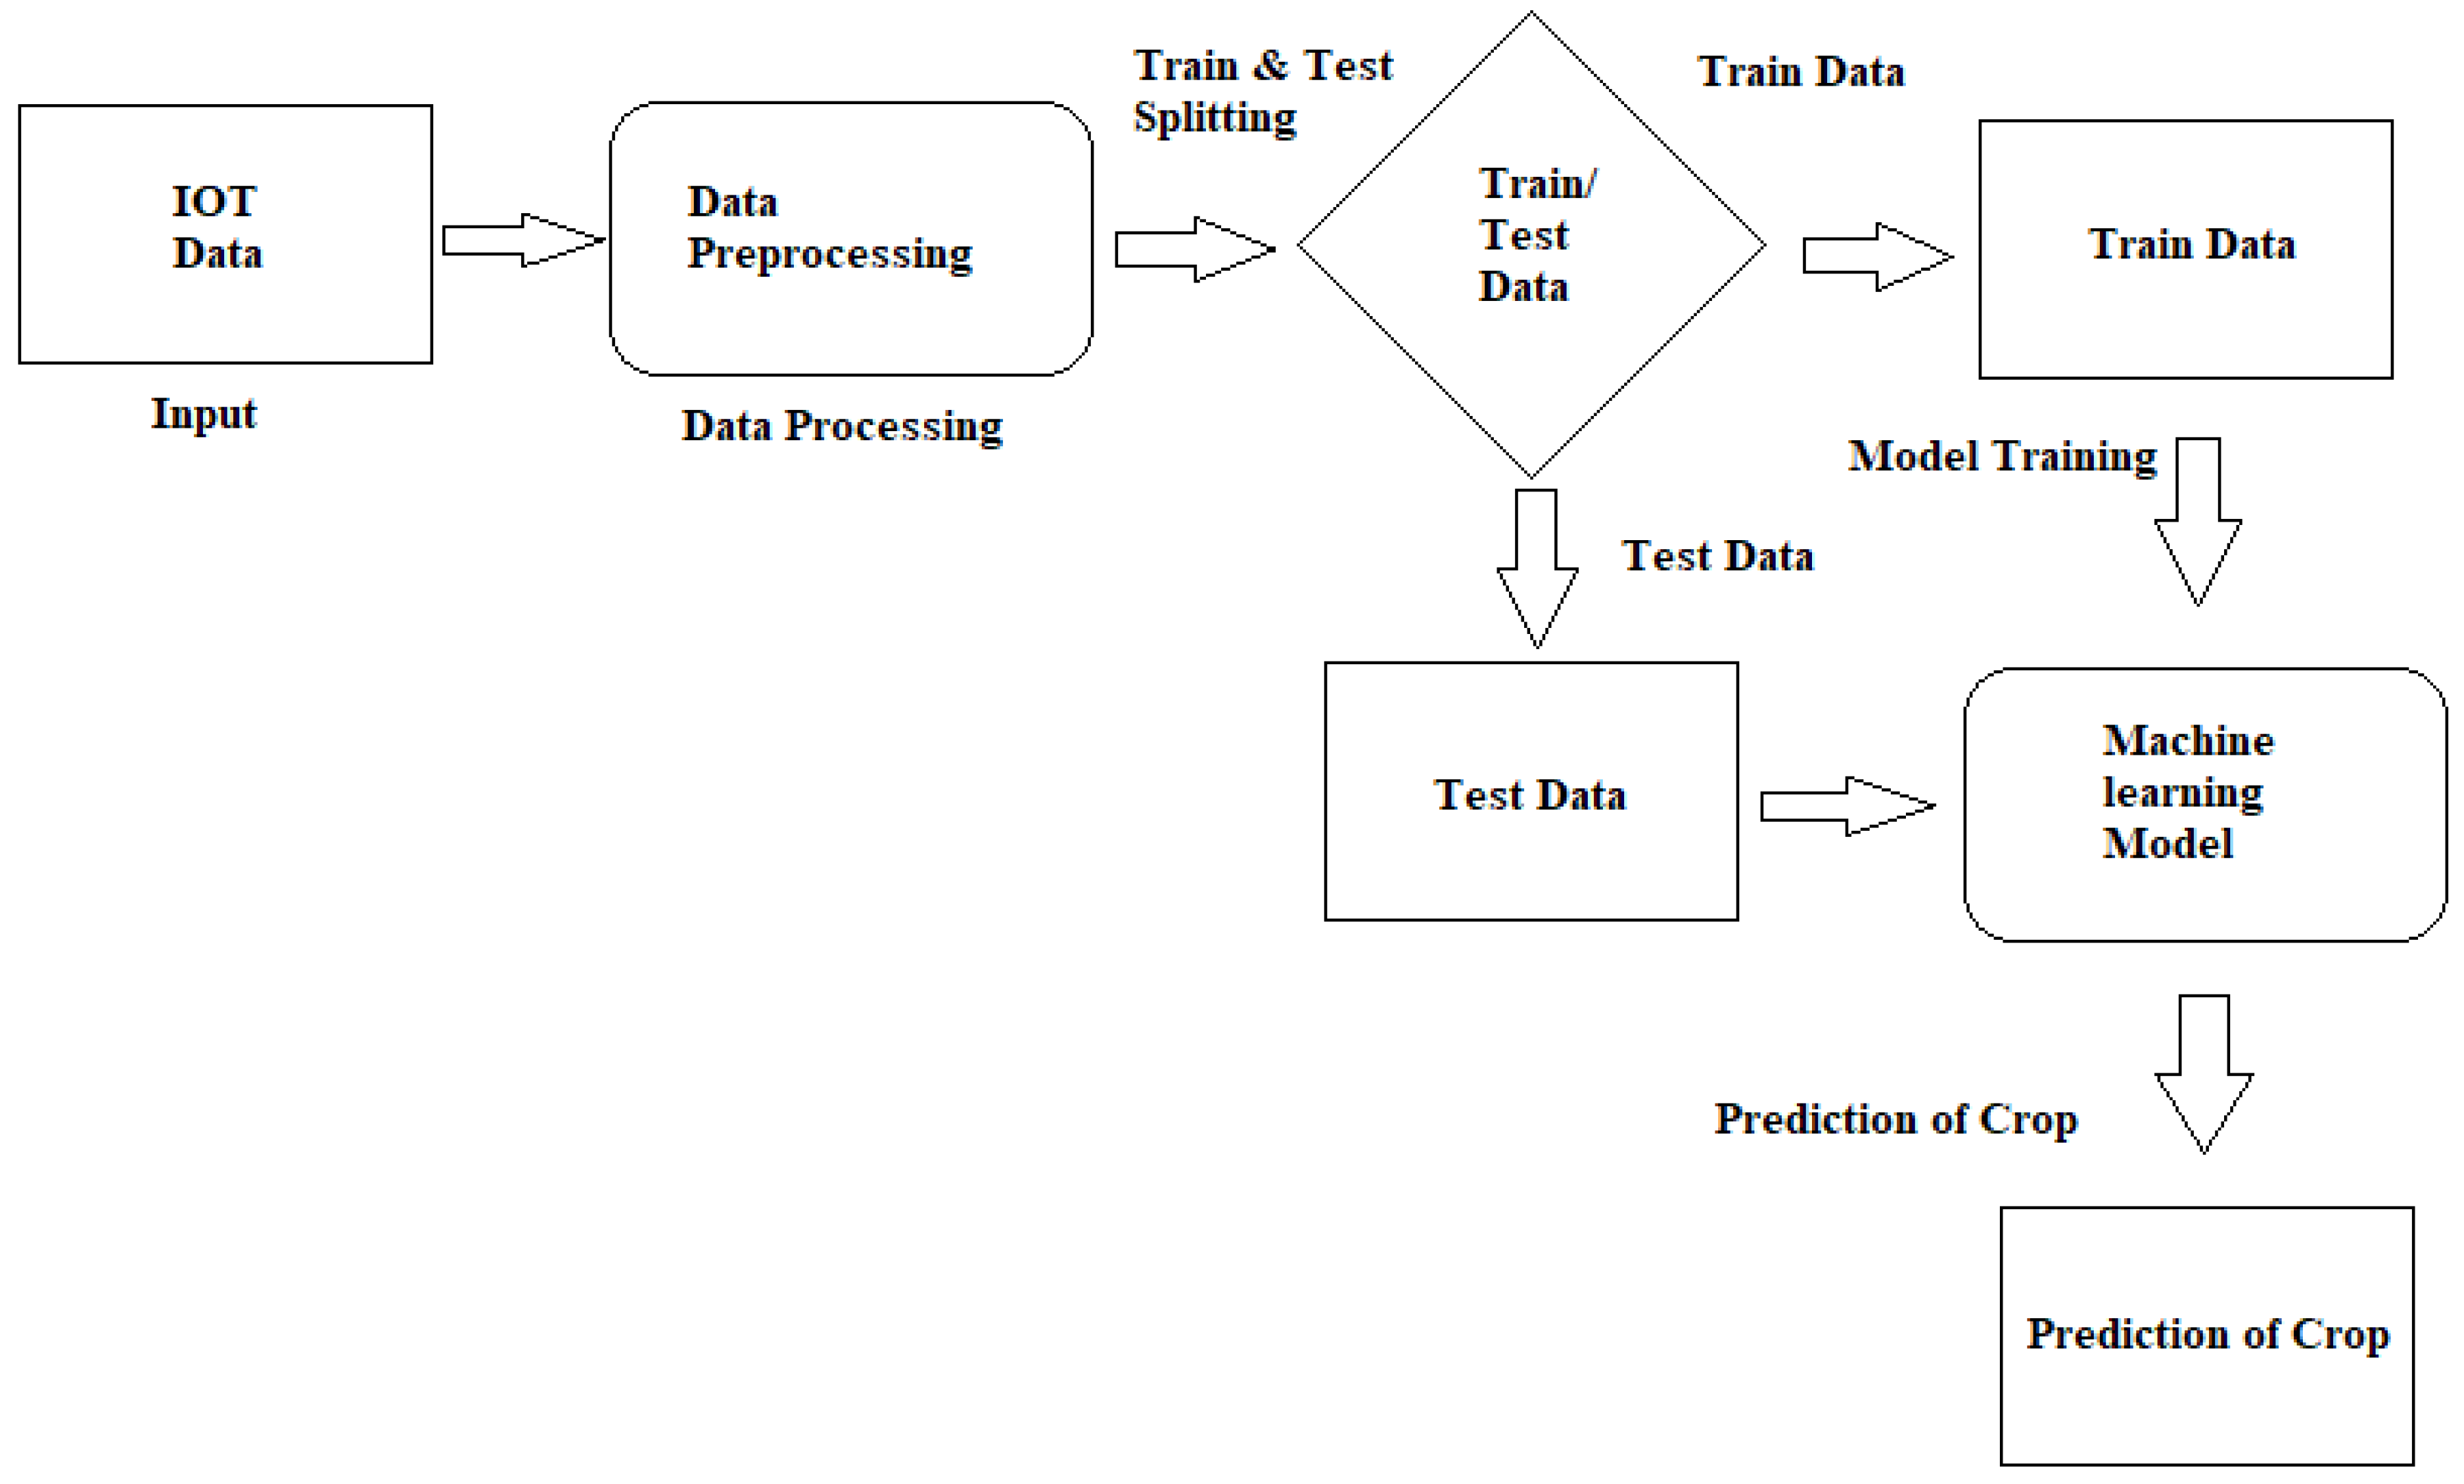
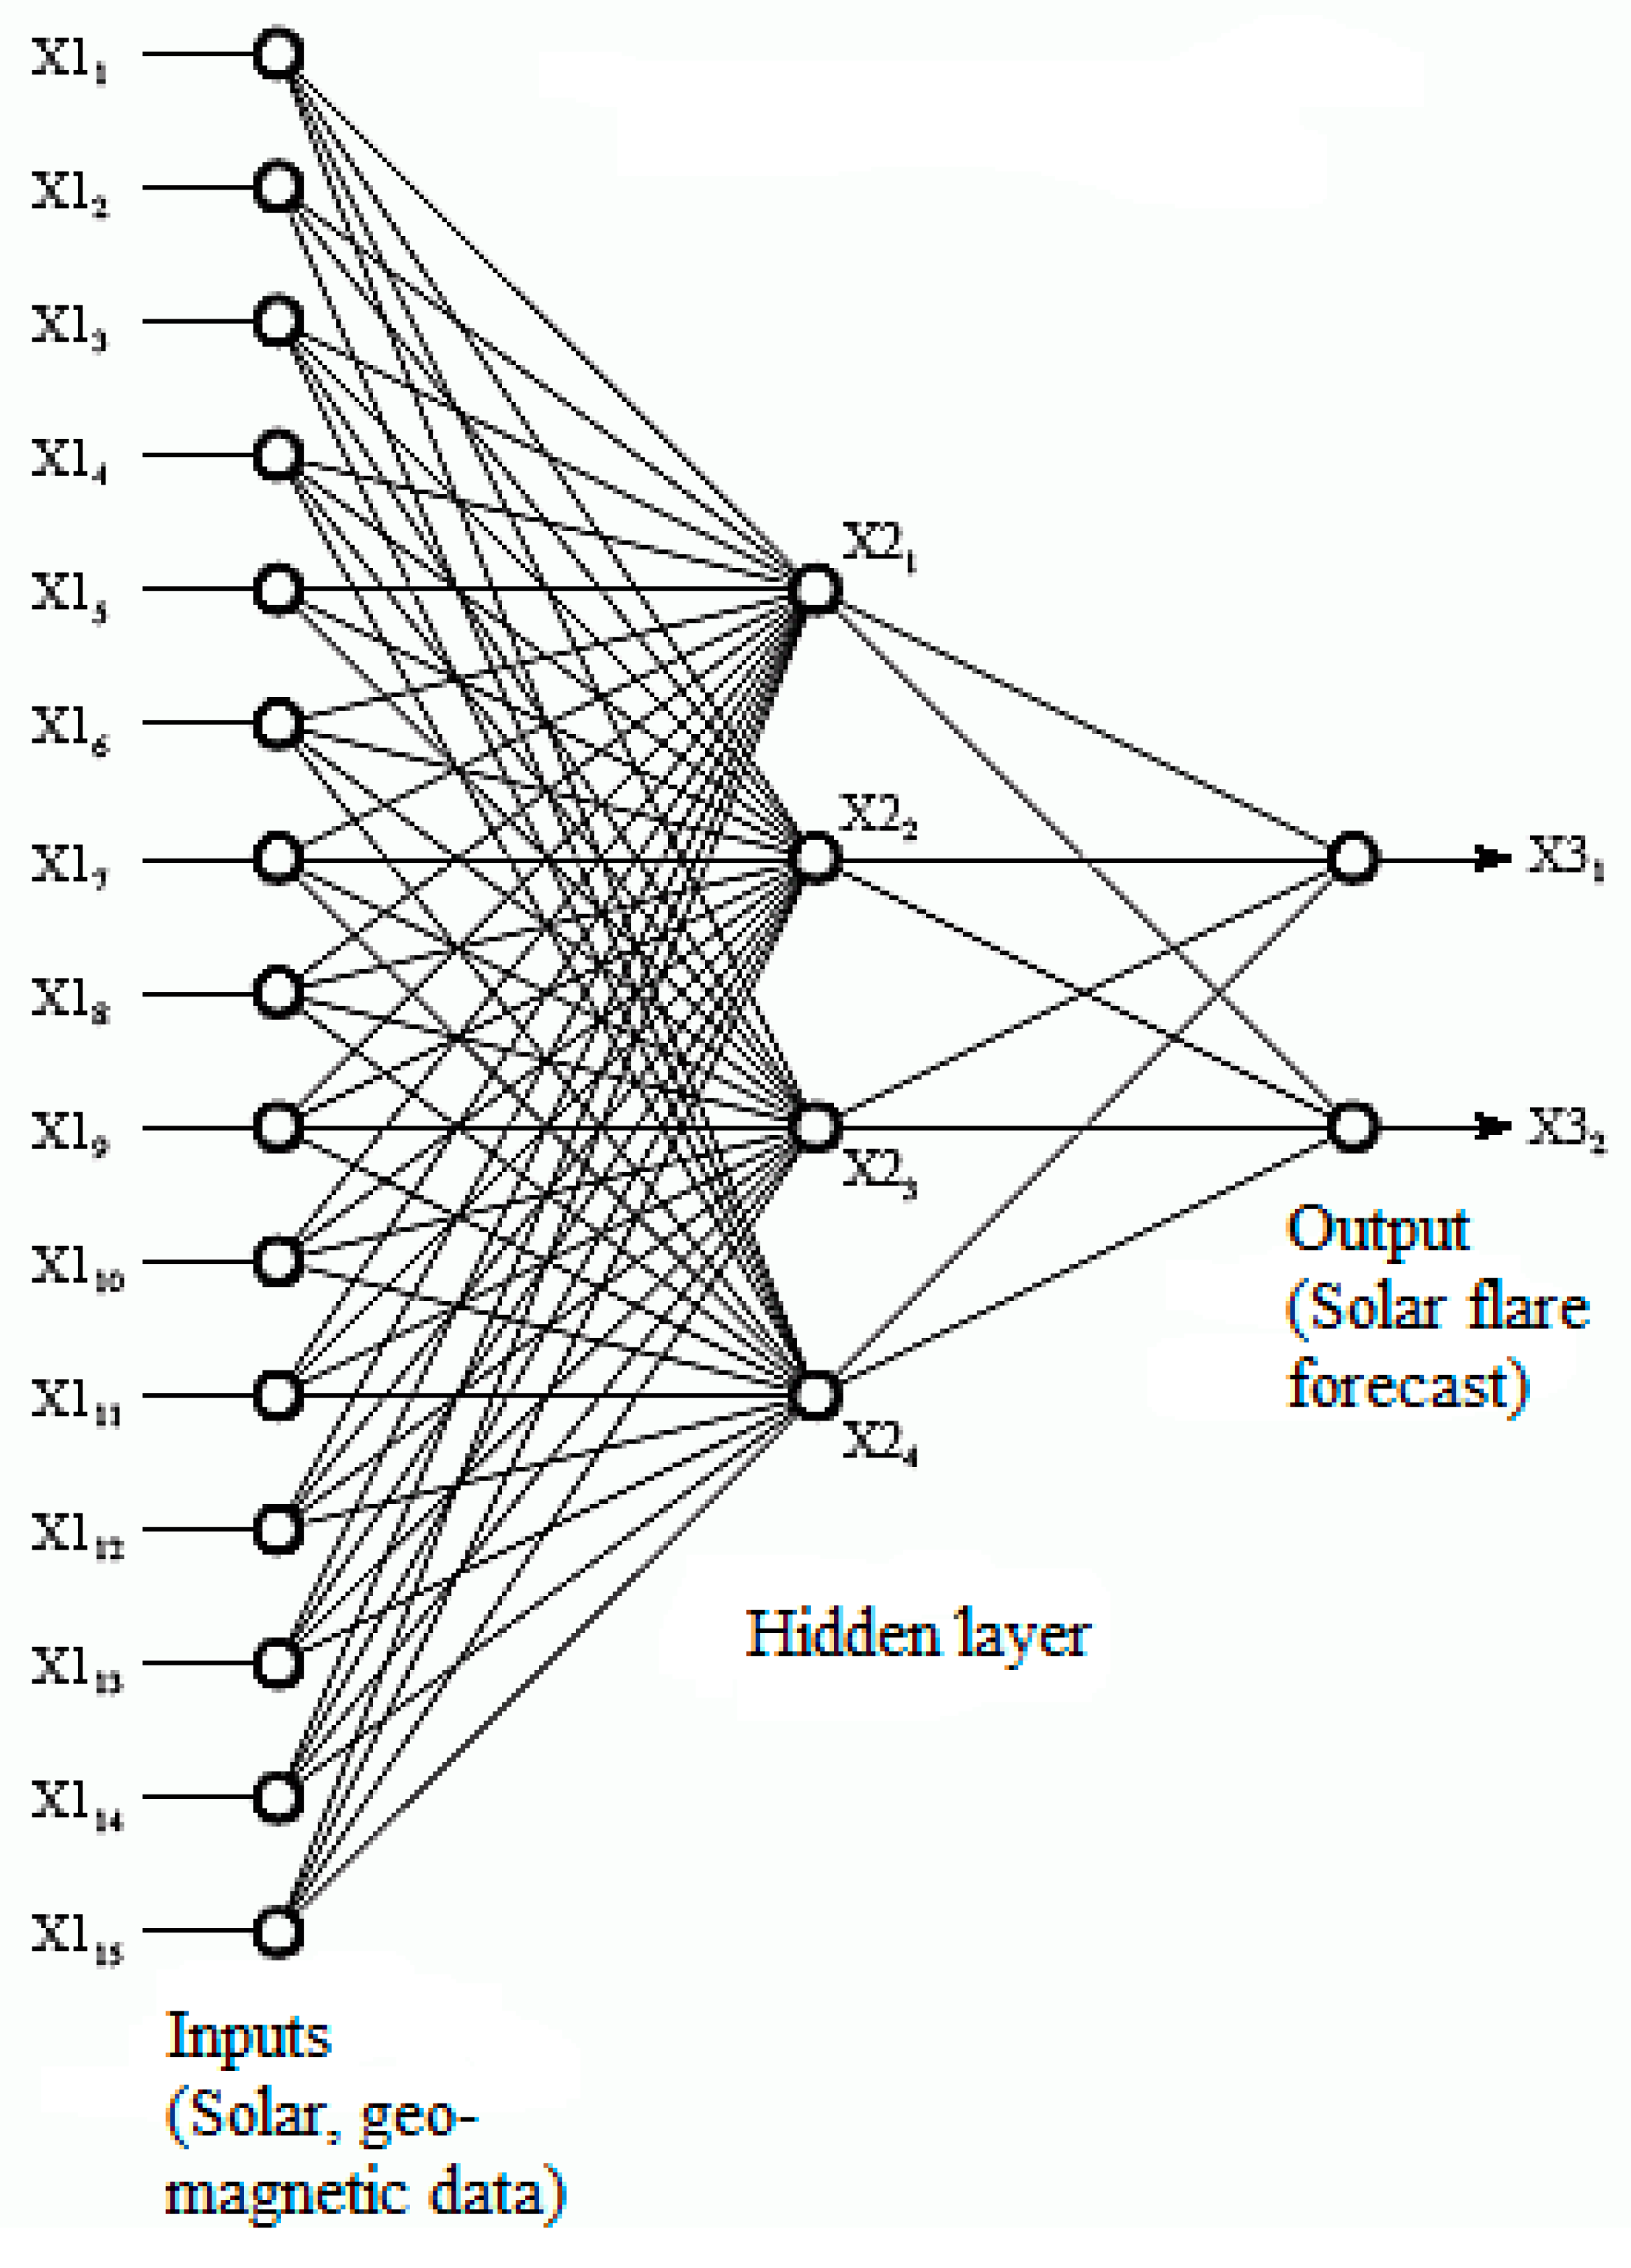
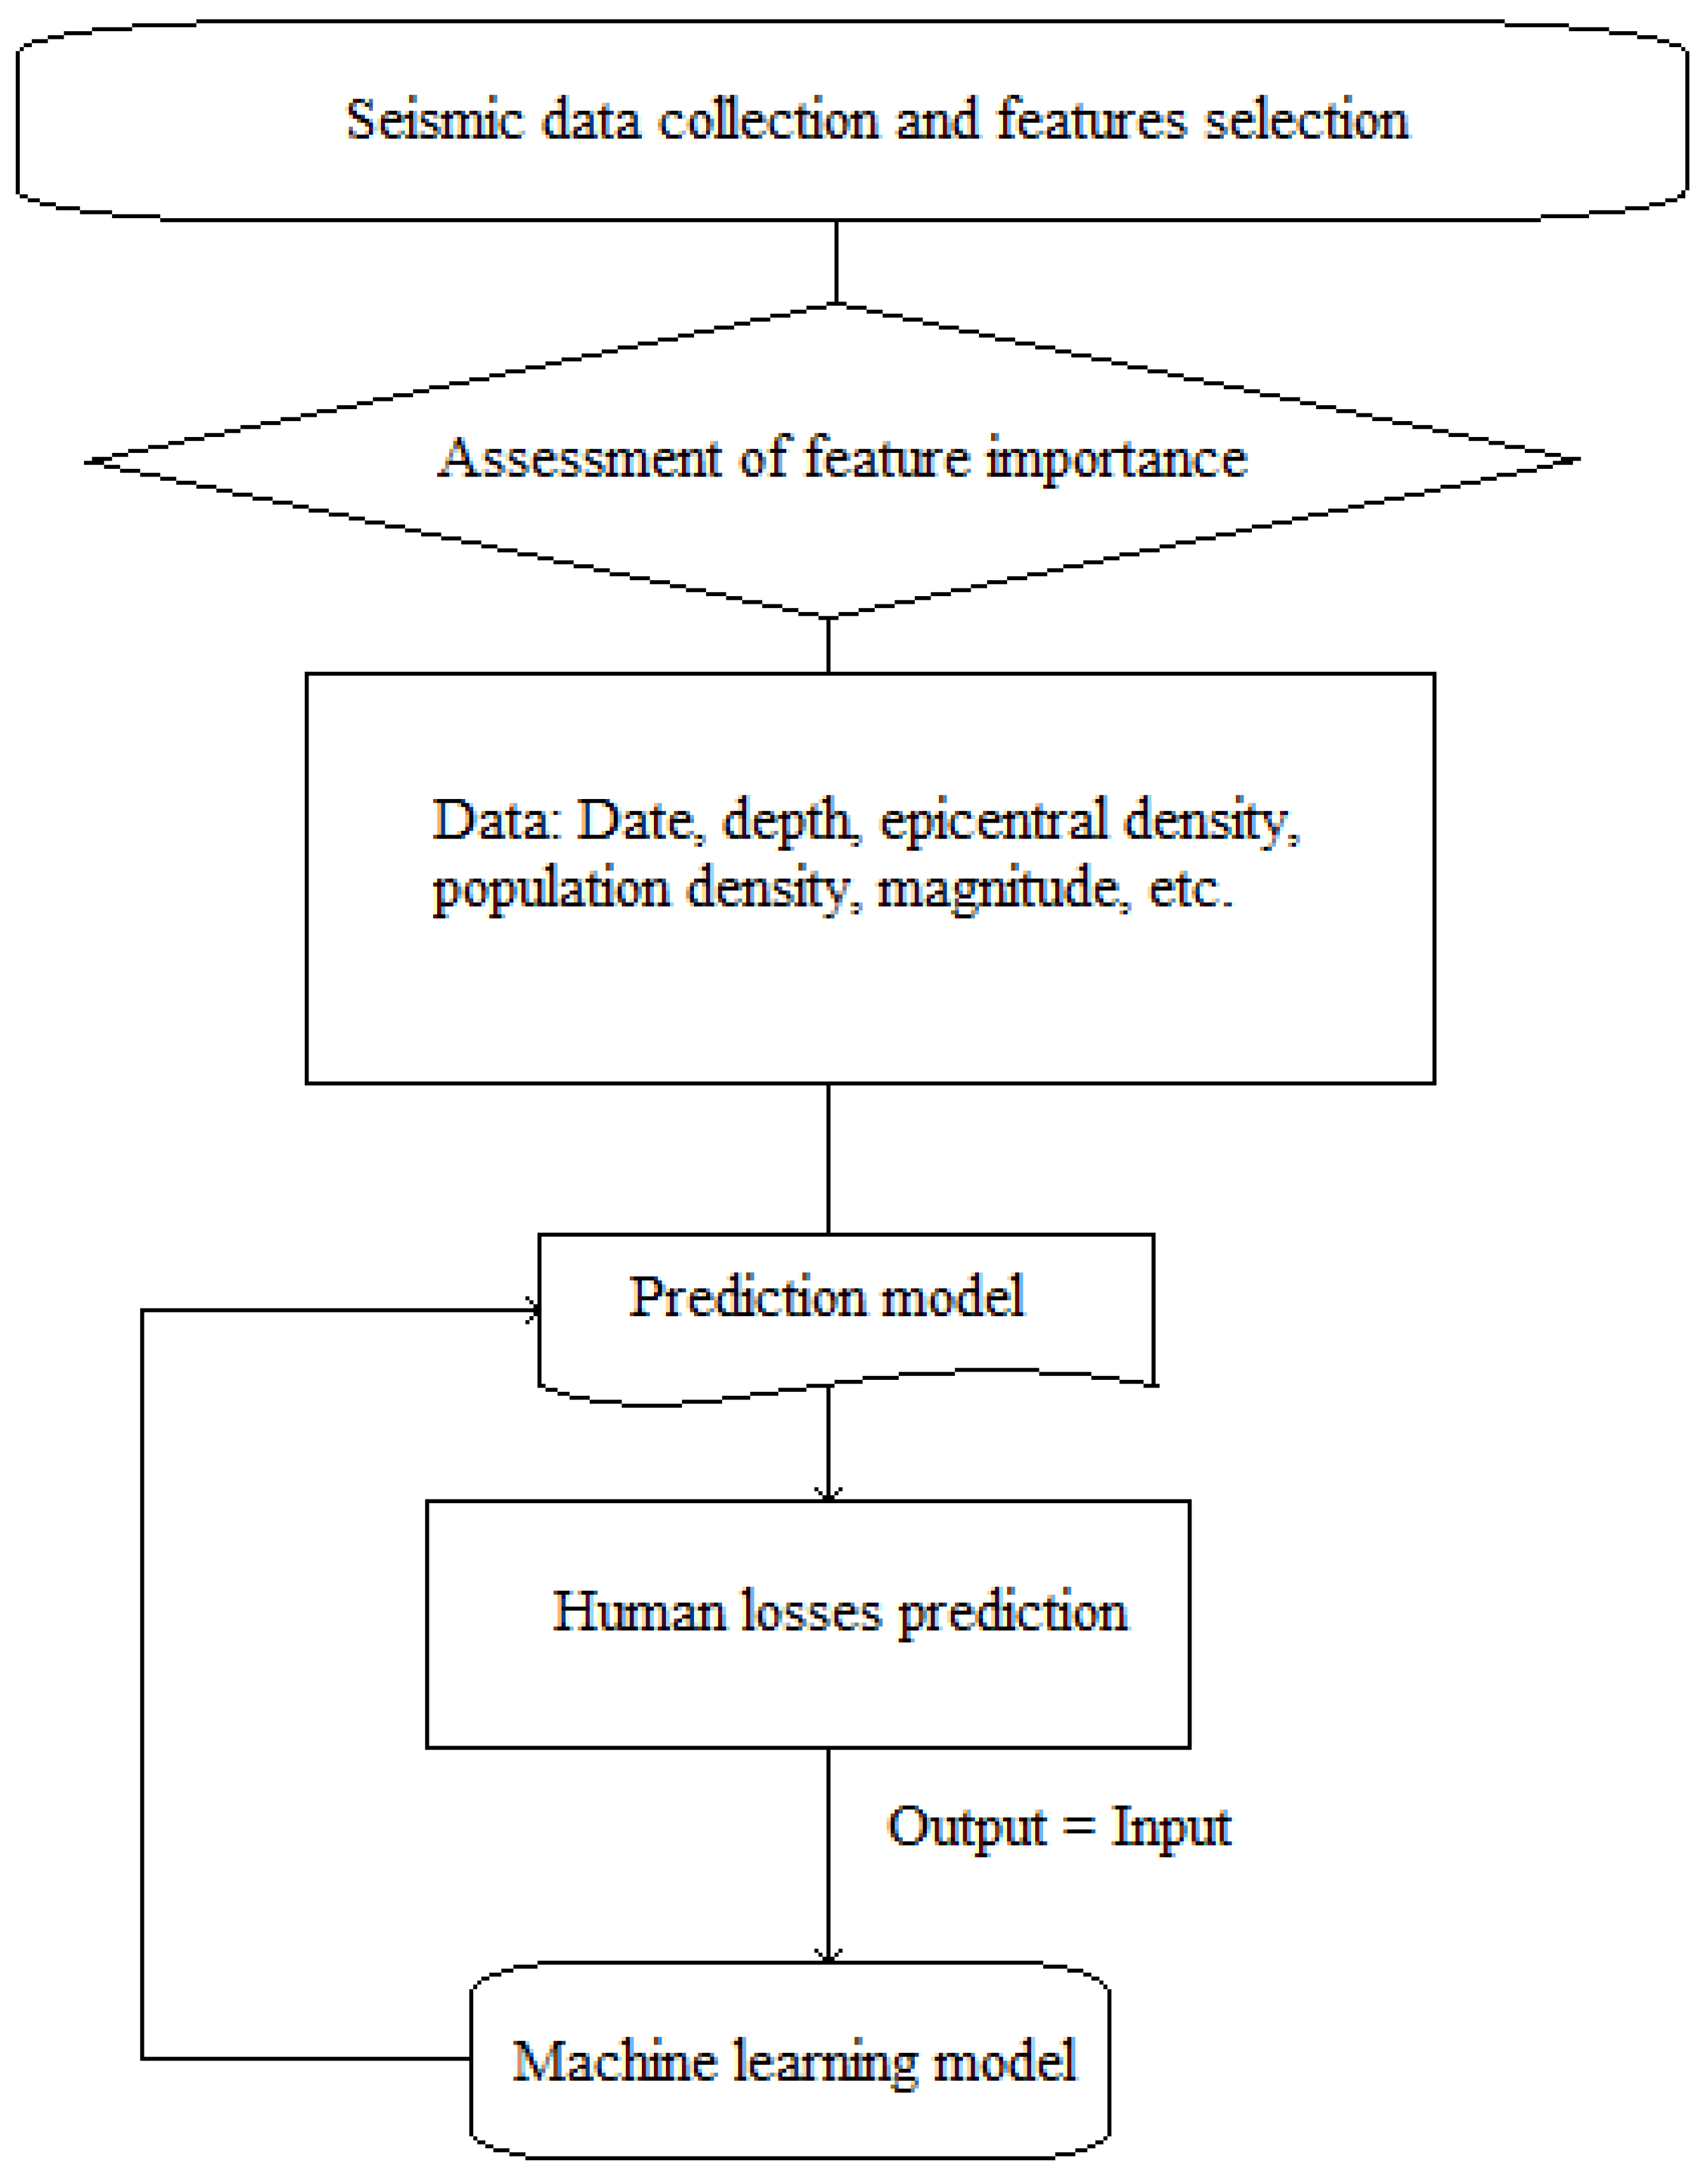
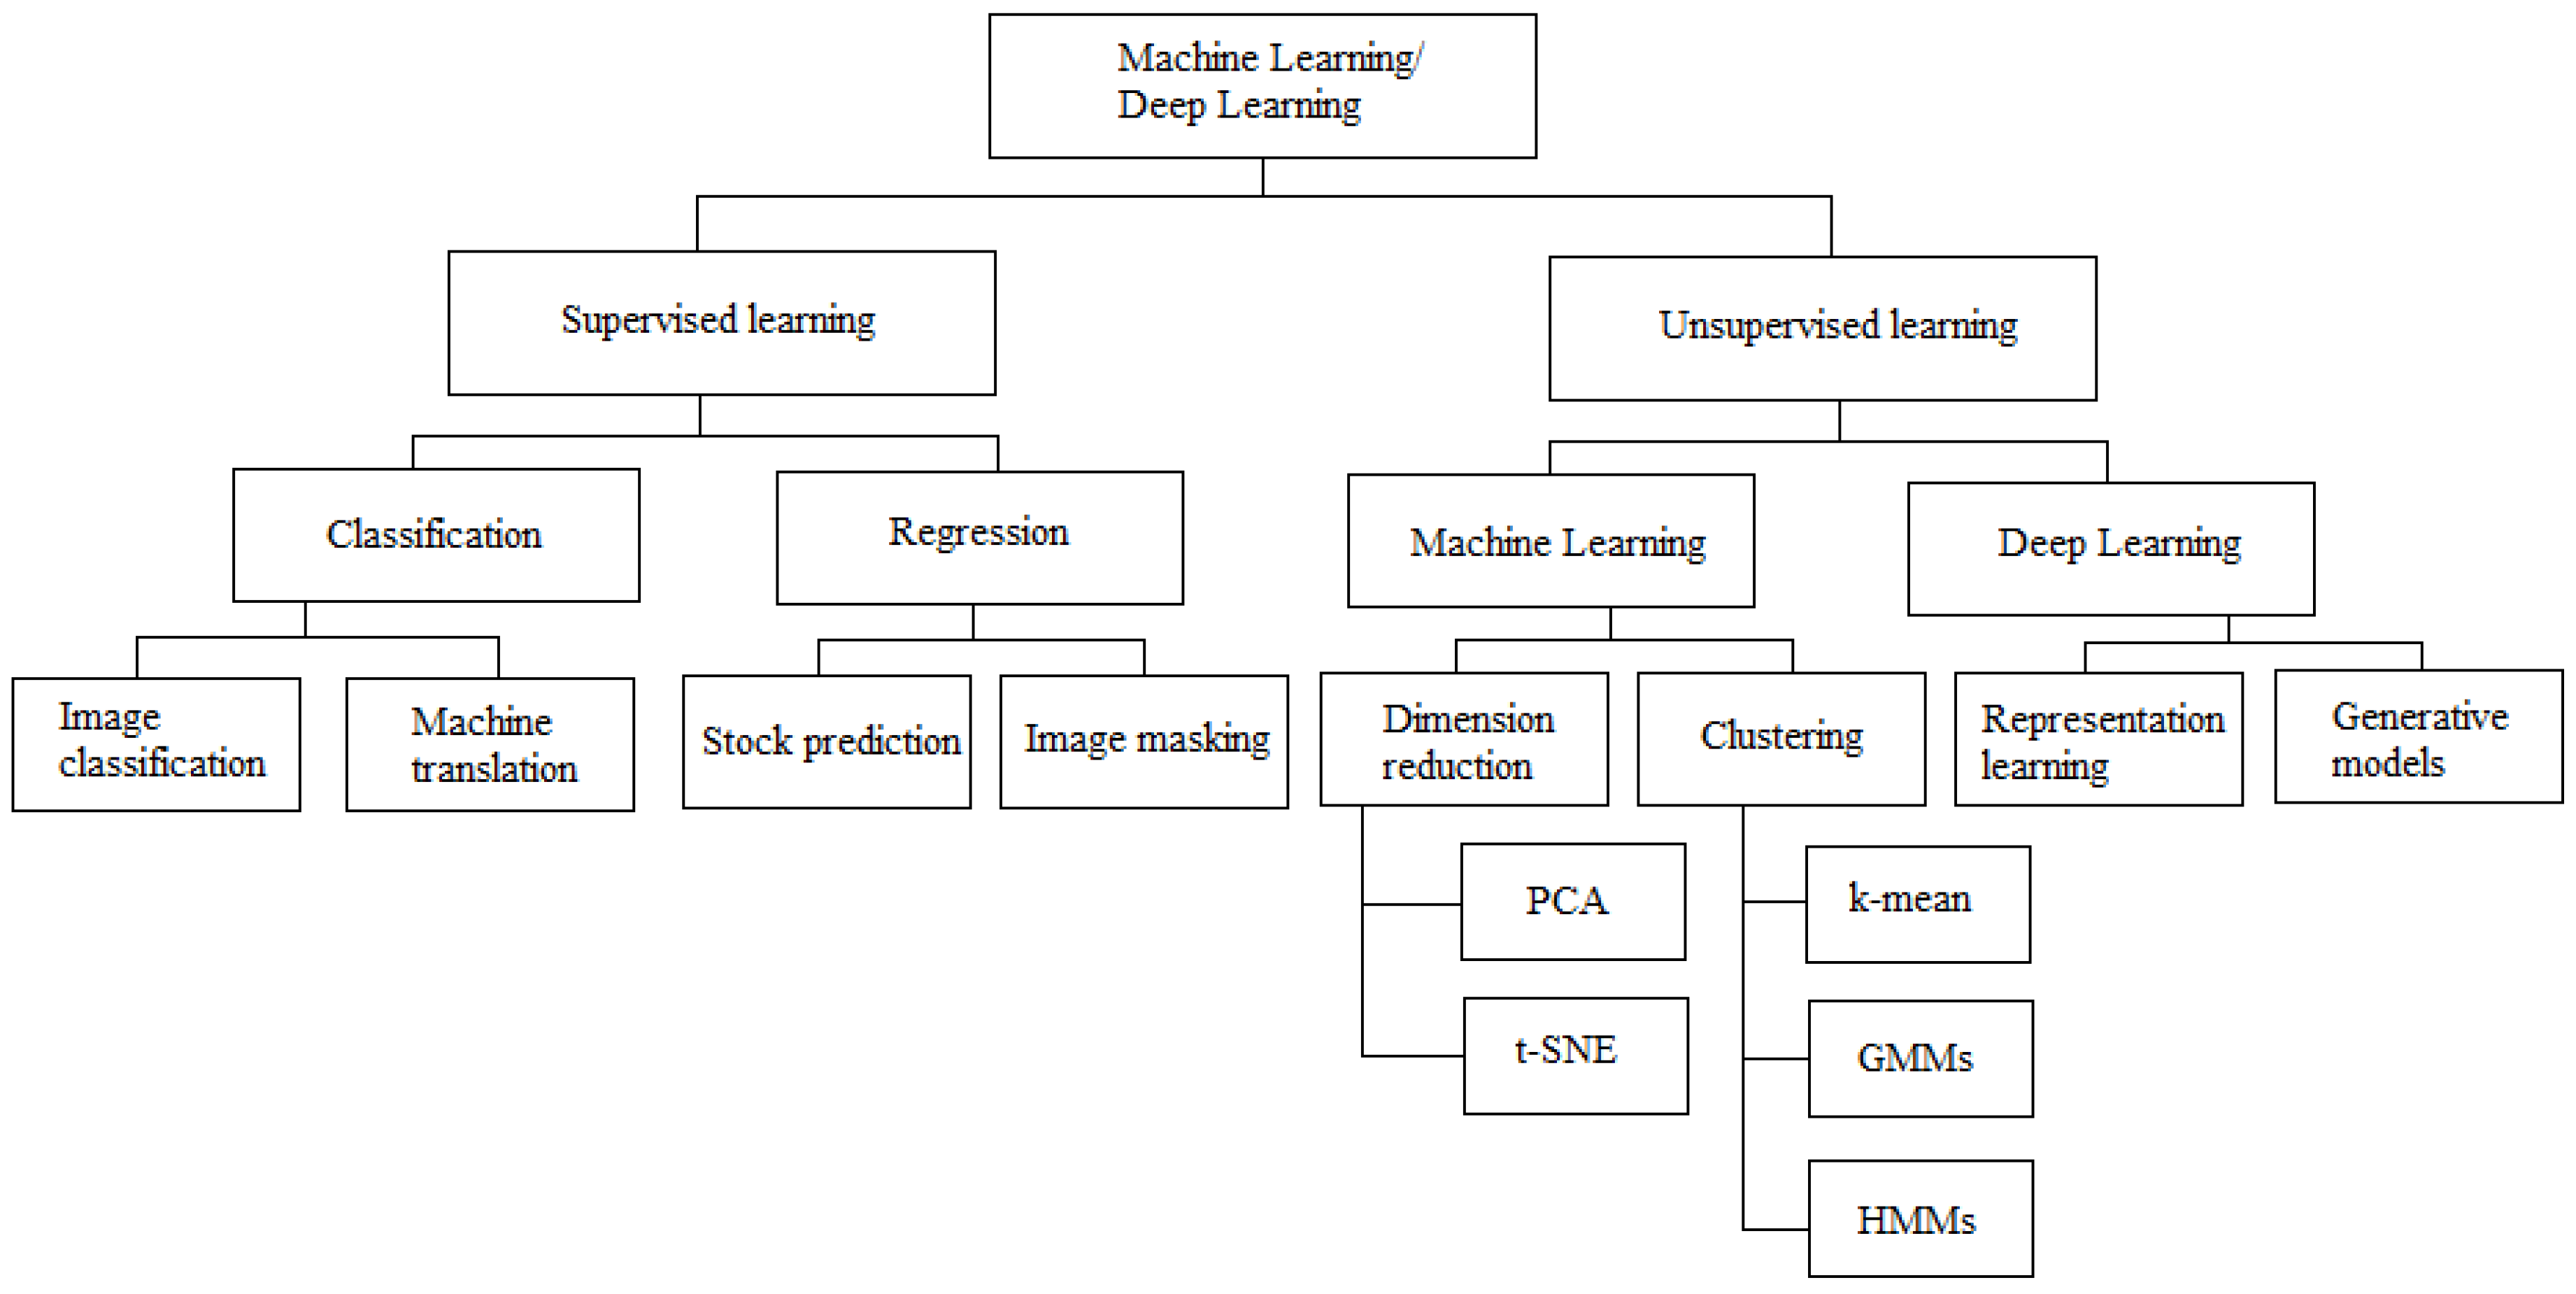
Table 1.
Overview of machine learning algorithms applied in actuarial industry.
| Algorithm | Technology | Category | Application | Efficiency |
|---|---|---|---|---|
| Markov Chain | IoT, Blockchain, Virtual reality, Quantum computing, Data mining | Catastrophe risk, Climate risk | Map the spatio-temporal patterns of tornadoes | Low |
| Monte Carlo | ||||
| Random Forest | ||||
| Clustering | Predict hurricane trajectories, solar flare forecasting, flood simulation | |||
| Support Vector | ||||
| Machines (SVMs) | ||||
| Digital elevation | ||||
| Models | Blockchain | |||
| K-nearest neighbor | Cloud computing, Data mining | Mortality Modelling | Simulate rates of human mortality based upon collected data and co-morbidity factors | High |
| SVM, Multivariate | ||||
| adaptive regression | ||||
| splines, Random | ||||
| Forest, Neural | ||||
| Network | Cybersecurity, Blockchain, Cloud computing, IoT, | |||
| Regression trees | Healthcare | Image processing, diagnosis, biomedical modeling, tumor recognition | High | |
| Lasso, Logistic | ||||
| regression, SVM, | ||||
| Random Forest | ||||
| Artificial and Deep | Blockchain, Cloud computing | Harvest risk | Smart farming, crop growth modeling, agro-meteorological statistical assessment, plant population, soil preparation, pest control | Medium-High |
| Neural Networks | ||||
| Support Vector | ||||
| Machines | ||||
| Quantum computing, Cybersecurity, Cloud computing | Cyber risk | Malware detection, modeling, monitoring, analysis, defense against threats to sensitive data and security systems | ||
| Random Forest | Medium | |||
| Gradient Boosting | ||||
| SVM, Logistic | ||||
| Regression | ||||
| K-Means | ||||
| Neural Networks | IoT, Blockchain, Data mining | Automobile | Achieve more enticing insurance packages, advertising tactics, fraud detection | High |
| Random Forest | ||||
| Light-GBM | ||||
| Latent Dirichlet | ||||
| Allocation-based | ||||
| text analytics | ||||
| Adaptive Synthetic | ||||
| Sampling, SVM | ||||
| Decision Tree, Multi- | ||||
| Layered Perceptron | ||||
Publisher’s Note: MDPI stays neutral with regard to jurisdictional claims in published maps and institutional affiliations. |
© 2020 by the authors. Licensee MDPI, Basel, Switzerland. This article is an open access article distributed under the terms and conditions of the Creative Commons Attribution (CC BY) license (http://creativecommons.org/licenses/by/4.0/).
Share and Cite
MDPI and ACS Style
Hassani, H.; Unger, S.; Beneki, C. Big Data and Actuarial Science. Big Data Cogn. Comput. 2020, 4, 40. https://0-doi-org.brum.beds.ac.uk/10.3390/bdcc4040040
AMA Style
Hassani H, Unger S, Beneki C. Big Data and Actuarial Science. Big Data and Cognitive Computing. 2020; 4(4):40. https://0-doi-org.brum.beds.ac.uk/10.3390/bdcc4040040
Chicago/Turabian StyleHassani, Hossein, Stephan Unger, and Christina Beneki. 2020. "Big Data and Actuarial Science" Big Data and Cognitive Computing 4, no. 4: 40. https://0-doi-org.brum.beds.ac.uk/10.3390/bdcc4040040