
Exploring Retro-Nasal Aroma’s Influence on Mouthfeel Perception of Chardonnay Wines

Abstract
:1. Introduction
1.1. Mouthfeel of White Wine
1.2. Napping®
1.3. Mouthfeel Linked to Winemaking Processes
1.4. Chemicals Involved in Mouthfeel Perception
1.5. Indirect Sensory Attributes, and Interactions
2. Results
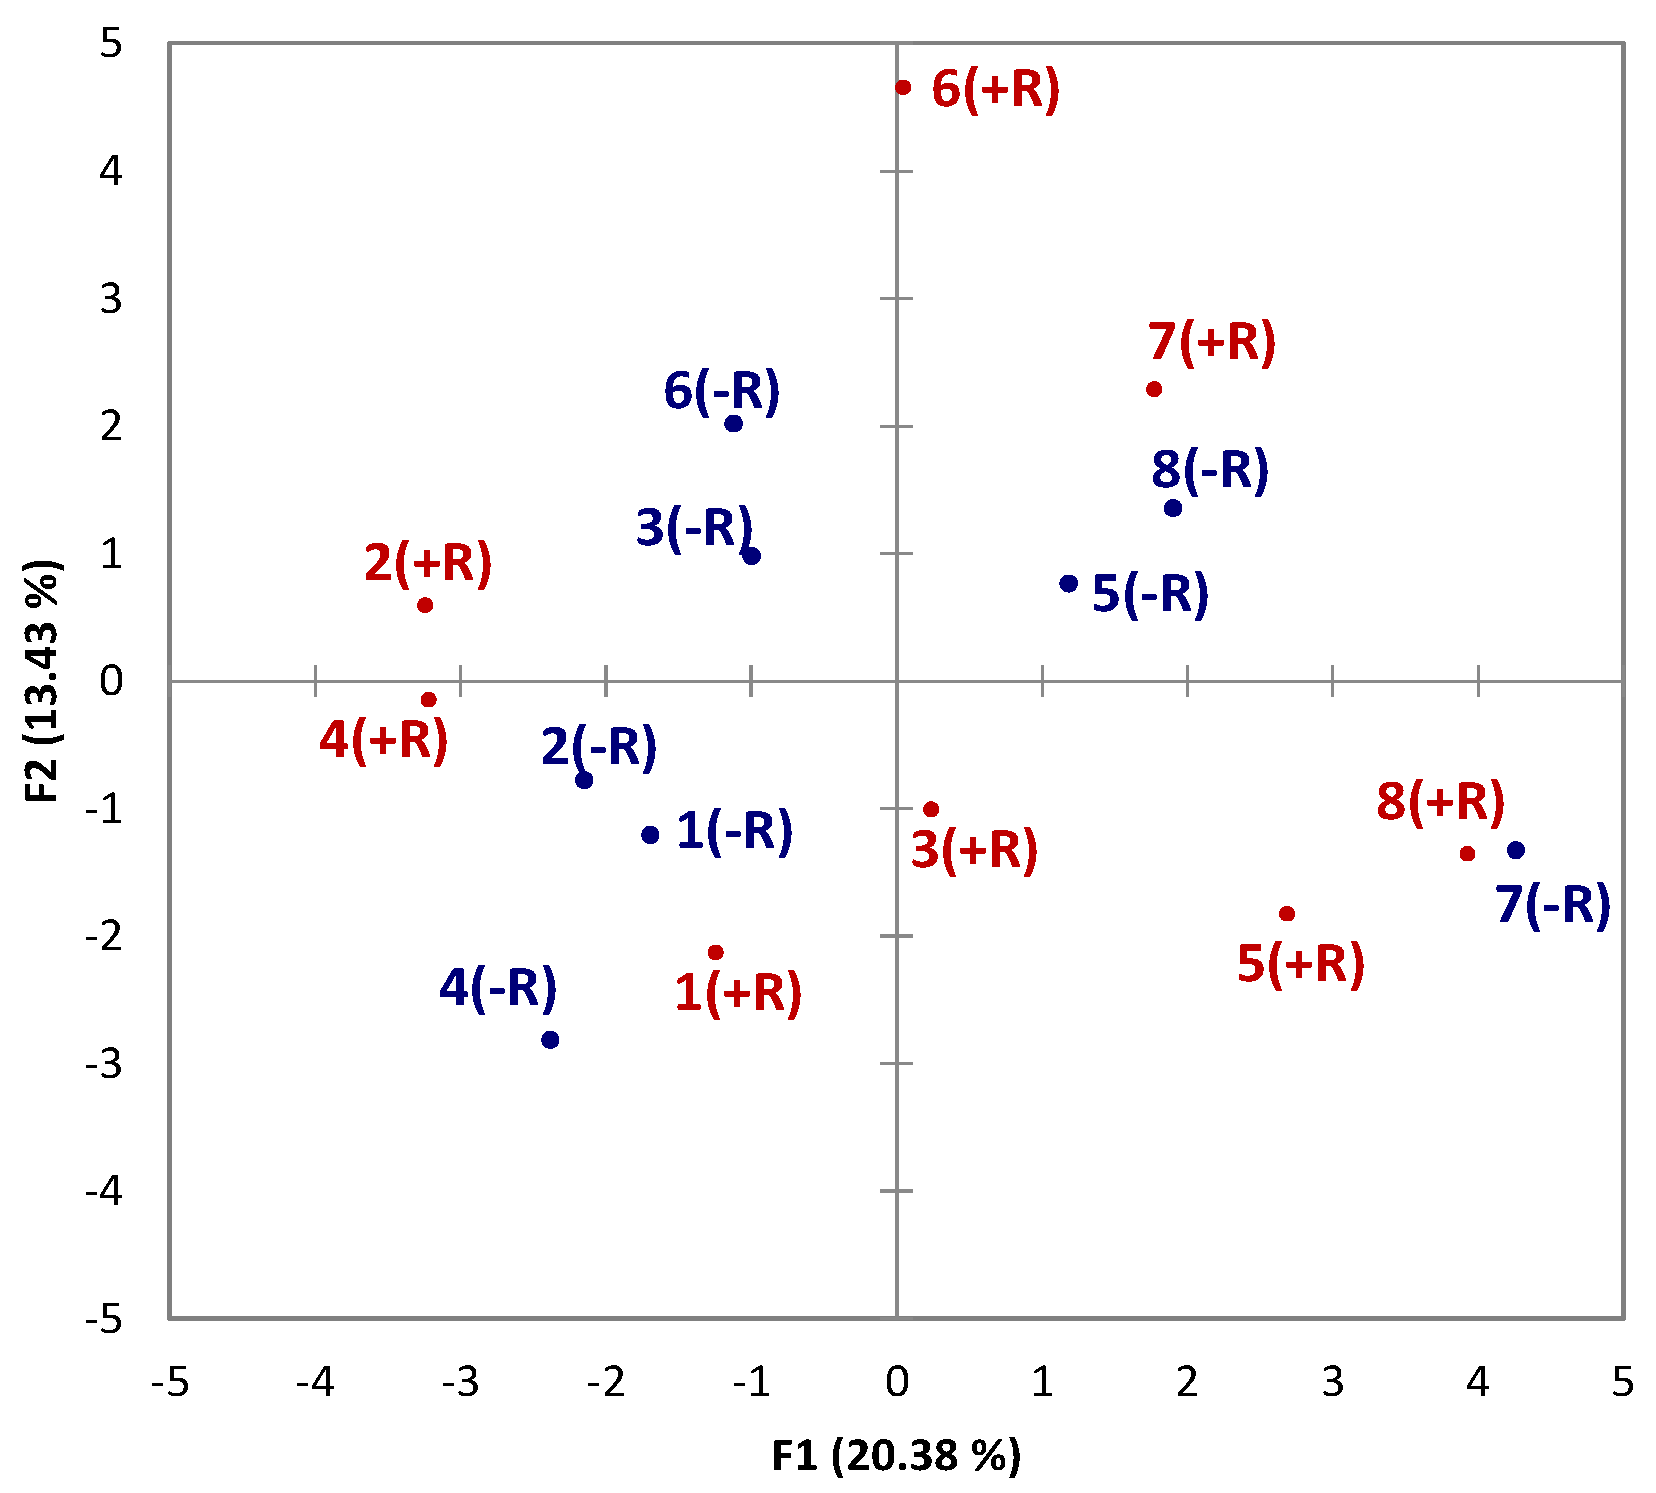
2.1. Napping®
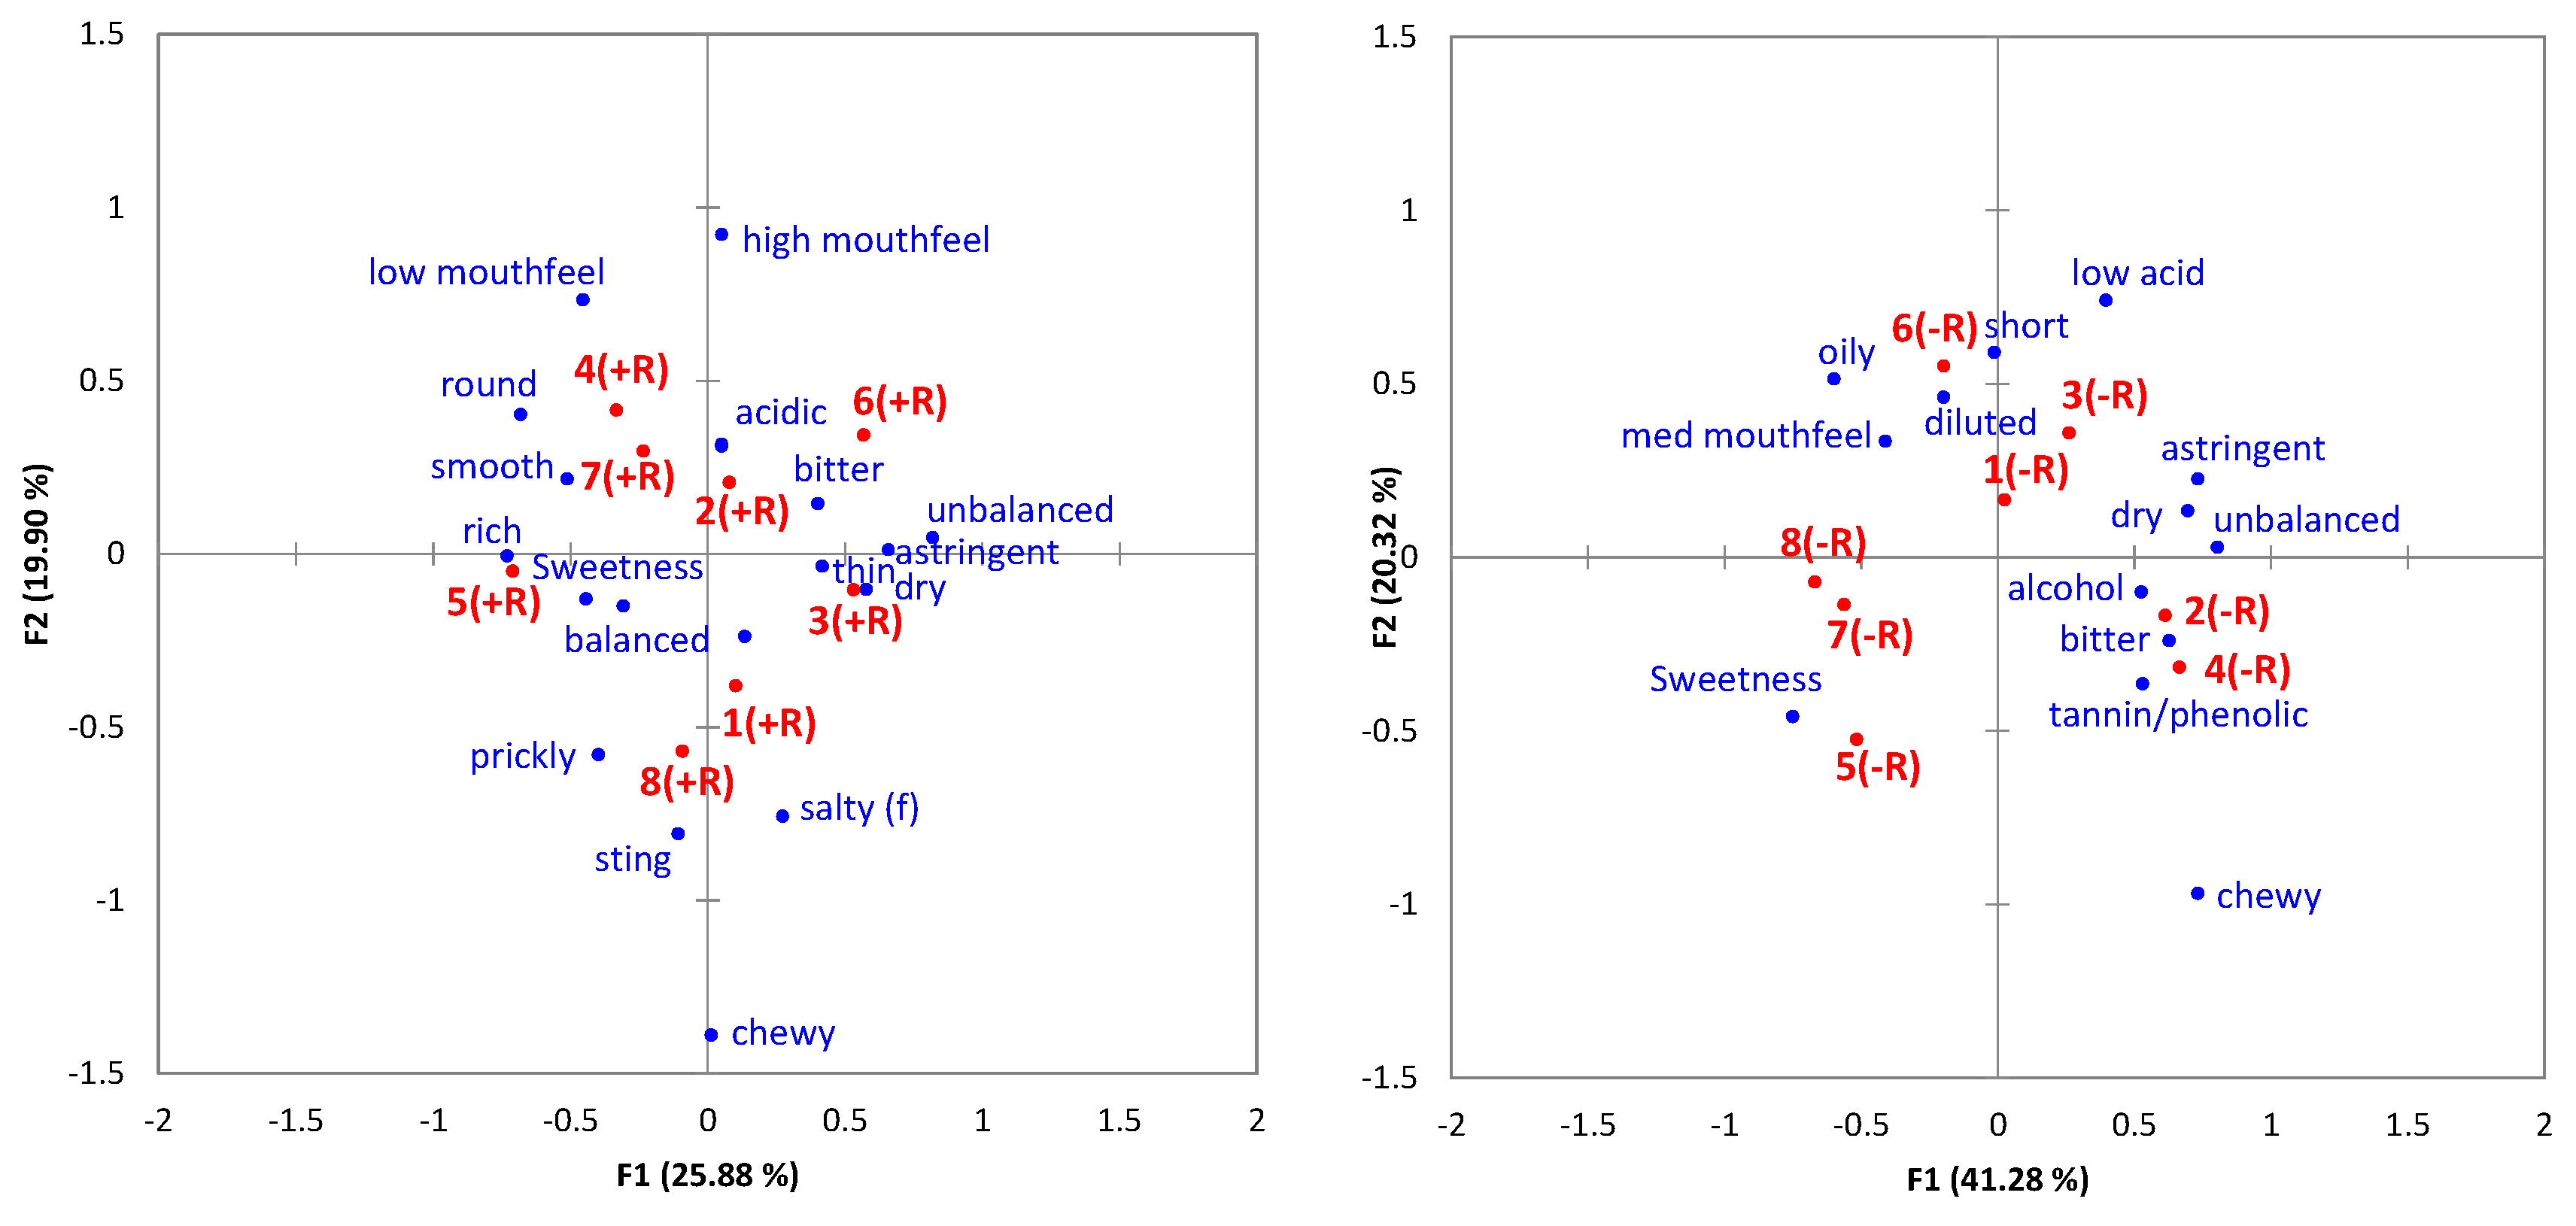
2.2. Ultra-Flash Profiling
2.2.1. With Retronasal Aroma (+R)
2.2.2. Without Retronasal Aroma (−R)
3. Discussion
3.1. Napping®
3.2. Ultra-Flash-Profiling (UFP)
4. Materials and Methods
4.1. Wine Production
4.2. Sensory Analysis Using Napping and Ultra-Flash-Profiling
4.3. Data Analyses
5. Conclusions
Supplementary Materials
Acknowledgments
Author Contributions
Conflicts of Interest
Abbreviations
| TLA | Three letter acronym |
| LD | linear dichroism |
| UFP | ultra-flash-profiling |
| +R | with retronasal aroma |
| −R | without retronasal aroma |
References
- Peynaud, E.; Blouin, J. The Taste of Wine: The Art Science of Wine Appreciation; John Wiley & Sons: Hoboken, NJ, USA, 1996. [Google Scholar]
- Pickering, G.J.; Demiglio, P. The White Wine Mouthfeel Wheel: A Lexicon for Describing the Oral Sensations Elicited by White Wine. J. Wine Res. 2008, 19, 51–67. [Google Scholar] [CrossRef]
- Vidal, S.; Courcoux, P.; Francis, L.; Kwaitkowski, M.; Gawel, R.; Williams, P.; Waters, E.; Cheynier, V. Use of an experimental design approach for evaluation of key wine components on mouth-feel perception. Food Qual. Preference 2004, 15, 209–217. [Google Scholar] [CrossRef]
- Gawel, R.; Oberholster, I.; Leigh Francis, I. A “Mouth-feel Wheel”: Terminology for communicating the mouth-feel characteristics of red wine. Aust. J. Grape Wine Res. 2000, 6, 203–207. [Google Scholar] [CrossRef]
- Jackson, R.S. Wine Science: Principles and Applications; Academic Press: Cambridge, MA, USA, 2008. [Google Scholar]
- Ma, W.; Guo, A.; Zhang, Y.; Wang, H.; Liu, Y.; Li, H. A review on astringency and bitterness perception of tannins in wine. Trends Food Sci. Technol. 2014, 40, 6–19. [Google Scholar] [CrossRef]
- Schöbel, N.; Radtke, D.; Kyereme, J.; Wollmann, N.; Cichy, A.; Obst, K.; Kallweit, K.; Kletke, O.; Minovi, A.; Dazert, S.; et al. Astringency Is a Trigeminal Sensation That Involves the Activation of G Protein–Coupled Signaling by Phenolic Compounds. Chem. Senses 2014, 39, 471–487. [Google Scholar] [CrossRef] [PubMed]
- Pagès, J. Recueil direct de distances sensorielles: Application à l’évaluation de dix vins blancs du Val-de-Loire. Sci. Aliment. 2003, 23, 679–688. [Google Scholar] [CrossRef]
- Pagès, J. Collection and analysis of perceived product inter-distances using multiple factor analysis: Application to the study of 10 white wines from the Loire Valley. Food Qual. Preference 2005, 16, 642–649. [Google Scholar] [CrossRef]
- Risvik, E.; McEwan, J.A.; Colwill, J.S.; Rodgers, R.; Lyon, D.H. Projective mapping: A tool for sensory analysis and consumer research. Food Qual. Preference 1994, 5, 263–269. [Google Scholar] [CrossRef]
- Perrin, L.; Symoneaux, R.; Maître, I.; Asselin, C.; Jourjon, F.; Pagès, J. Comparison of three sensory methods for use with the Napping® procedure: Case of ten wines from Loire valley. Food Qual. Preference 2008, 19, 1–11. [Google Scholar] [CrossRef]
- Perrin, L.; Pages, J. Construction of a product Space from the Ultra-Flash Profiling method: Application to 10 Red Wines from the Loire Valley. J. Sens. Stud. 2009, 24, 372–395. [Google Scholar] [CrossRef]
- Dehlholm, C.; Brockhoff, P.B.; Meinert, L.; Aaslyng, M.D.; Bredie, W.L.P. Rapid descriptive sensory methods—Comparison of Free Multiple Sorting, Partial Napping, Napping, Flash Profiling and conventional profiling. Food Qual. Preference 2012, 26, 267–277. [Google Scholar] [CrossRef]
- Grygorczyk, A.; Lesschaeve, I.; Corredig, M.; Duizer, L. Impact of Structure Modification on Texture of a Soymilk and Cow’s Milk Gel Assessed Using the Napping Procedure. J. Texture Stud. 2013, 44, 238–246. [Google Scholar] [CrossRef]
- Kim, Y.-K.; Jombart, L.; Valentin, D.; Kim, K.-O. A cross-cultural study using Napping®: Do Korean and French consumers perceive various green tea products differently? Food Res. Int. 2013, 53, 534–542. [Google Scholar] [CrossRef]
- Pirie, A.J.G.; Mullins, M.G. Concentration of Phenolics in the Skin of Grape Berries during Fruit Development and Ripening. Am. J. Enol. Vitic. 1980, 31, 34–36. [Google Scholar]
- Gawel, R.; Day, M.; Van Sluyter, S.C.; Holt, H.; Waters, E.J.; Smith, P.A. White Wine Taste and Mouthfeel as Affected by Juice Extraction and Processing. J. Agric. Food Chem. 2014, 62, 10008–10014. [Google Scholar] [CrossRef] [PubMed]
- Domizio, P.; Liu, Y.; Bisson, L.F.; Barile, D. Use of non-Saccharomyces wine yeasts as novel sources of mannoproteins in wine. Food Microbiol. 2014, 43, 5–15. [Google Scholar] [CrossRef] [PubMed]
- Kennedy, J.A. Grape and wine phenolics: Observations and recent findings. Cienc. E Investig. Agrar. 2008, 35, 107–120. [Google Scholar] [CrossRef]
- Runnebaum, R.C.; Boulton, R.B.; Powell, R.L.; Heymann, H. Key Constituents Affecting Wine Body—An Exploratory Study. J. Sens. Stud. 2011, 26, 62–70. [Google Scholar] [CrossRef]
- Walker, S.; Prescott, J. The Influence of Solution Viscosity and Different Viscosifying Agents on Apple Juice Flavor. J. Sens. Stud. 2000, 15, 285–307. [Google Scholar] [CrossRef]
- Vidal, S.; Francis, L.; Williams, P.; Kwiatkowski, M.; Gawel, R.; Cheynier, V.; Waters, E. The mouth-feel properties of polysaccharides and anthocyanins in a wine like medium. Food Chem. 2004, 85, 519–525. [Google Scholar] [CrossRef]
- Oberholster, A.; Francis, I.L.; Iland, P.G.; Waters, E.J. Mouthfeel of white wines made with and without pomace contact and added anthocyanins. Aust. J. Grape Wine Res. 2009, 15, 59–69. [Google Scholar] [CrossRef]
- Breslin, P.A.S.; Gilmore, M.M.; Beauchamp, G.K.; Green, B.G. Psychophysical evidence that oral astringency is a tactile sensation. Chem. Senses 1993, 18, 405–417. [Google Scholar] [CrossRef]
- Pickering, G.J.; Heatherbell, D.A.; Vanhanen, L.P.; Barnes, M.F. The Effect of Ethanol Concentration on the Temporal Perception of Viscosity and Density in White Wine. Am. J. Enol. Vitic. 1998, 49, 306–318. [Google Scholar]
- Nurgel, C.; Pickering, G. Contribution of Glycerol, Ethanol and Sugar to the Perception of Viscosity and Density Elicited by Model White Wines. J. Texture Stud. 2005, 36, 303–323. [Google Scholar] [CrossRef]
- Gawel, R.; Sluyter, S.V.; Waters, E.J. The effects of ethanol and glycerol on the body and other sensory characteristics of Riesling wines. Aust. J. Grape Wine Res. 2007, 13, 38–45. [Google Scholar] [CrossRef]
- Byrnes, N.K.; Nestrud, M.A.; Hayes, J.E. Perceptual Mapping of Chemesthetic Stimuli in Naive Assessors. Chemosens. Percept. 2015, 8, 19–32. [Google Scholar] [CrossRef] [PubMed]
- Demattè, M.L.; Sanabria, D.; Sugarman, R.; Spence, C. Cross-Modal Interactions between Olfaction and Touch. Chem. Senses 2006, 31, 291–300. [Google Scholar] [CrossRef] [PubMed]
- Kora, E.P.; Latrille, E.; Souchon, I.; Martin, N. Texture-Flavor Interactions in Low Fat Stirred Yogurt: How Mechanical Treatment, Thickener Concentration and Aroma Concentration Affect Perceived Texture and Flavor. J. Sens. Stud. 2003, 18, 367–390. [Google Scholar] [CrossRef]
- Rodríguez-Bencomo, J.J.; Muñoz-González, C.; Andújar-Ortiz, I.; Martín-Álvarez, P.J.; Moreno-Arribas, M.V.; Pozo-Bayón, M.Á. Assessment of the effect of the non-volatile wine matrix on the volatility of typical wine aroma compounds by headspace solid phase microextraction/gas chromatography analysis. J. Sci. Food Agric. 2011, 91, 2484–2494. [Google Scholar] [CrossRef] [PubMed] [Green Version]
- Saenz-Navajas, M.-P.; Campo, E.; Fernandez-Zurbano, P.; Valentin, D.; Ferreira, V. An assessment of the effects of wine volatiles on the perception of taste and astringency in wine. Food Chem. 2010, 121, 1139–1149. [Google Scholar] [CrossRef]
- Labbe, D.; Gilbert, F.; Martin, N. Impact of Olfaction on Taste, Trigeminal, and Texture Perceptions. Chemosens. Percept. 2008, 1, 217–226. [Google Scholar] [CrossRef]
- Ferrer-Gallego, R.; Hernández-Hierro, J.M.; Rivas-Gonzalo, J.C.; Escribano-Bailón, M.T. Sensory evaluation of bitterness and astringency sub-qualities of wine phenolic compounds: Synergistic effect and modulation by aromas. Food Res. Int. 2014, 62, 1100–1107. [Google Scholar] [CrossRef]
- Dwyer, E.; Gallagher, E. Functional Ingredients as Fat Replacers in Cakes and Pastries; Teagasc: Dublin, Ireland, 2001. [Google Scholar]
- Busch, J.L.H.C.; Tournier, C.; Knoop, J.E.; Kooyman, G.; Smit, G. Temporal Contrast of Salt Delivery in Mouth Increases Salt Perception. Chem. Senses 2009, 34, 341–348. [Google Scholar] [CrossRef] [PubMed]
- Vignon, X.; Pillet, O.; Kessler, G.; Lhotellier, N.; Le Bras, G. Salinité et Minéralité. Le chaînon manquant. Rev. Oenol. 2012, 143, 49–53. [Google Scholar]
- Ballester, J.; Mihnea, M.; Peyron, D.; Valentin, D. Exploring minerality of Burgundy Chardonnay wines: A sensory approach with wine experts and trained panellists: Exploring minerality in wine. Aust. J. Grape Wine Res. 2013, 19, 140–152. [Google Scholar] [CrossRef]
- Nasri, N.; Septier, C.; Beno, N.; Salles, C.; Thomas-Danguin, T. Enhancing salty taste through odour–taste–taste interactions: Influence of odour intensity and salty tastants’ nature. Food Qual. Preference 2013, 28, 134–140. [Google Scholar] [CrossRef]
- Nasri, N.; Beno, N.; Septier, C.; Salles, C.; Thomas-Danguin, T. Cross-modal interactions between taste and smell: Odour-induced saltiness enhancement depends on salt level. Food Qual. Preference 2011, 22, 678–682. [Google Scholar] [CrossRef]
- Baeyens, F.; Eelen, P.; Van den Bergh, O.; Crombez, G. Flavor-Flavor and Color-Flavor Conditioning in Humans. Learn. Motiv. 1990, 21, 434–455. [Google Scholar] [CrossRef]
- Barkat, S.; Poncelet, J.; Landis, B.N.; Rouby, C.; Bensafi, M. Improved smell pleasantness after odor–taste associative learning in humans. Neurosci. Lett. 2008, 434, 108–112. [Google Scholar] [CrossRef] [PubMed]
- Ross, C.F. Physiology of Sensory Perception. In The Sensory Evaluation of Dairy Products; Springer US: New York, NY, USA, 2009; pp. 17–42. [Google Scholar]
- Stéphane Vidal, L.F. Taste and mouth-feel properties of different types of tannin-like polyphenolic compounds and anthocyanins in wine. Anal Chim Acta. Anal. Chim. Acta 2004, 513, 57–65. [Google Scholar] [CrossRef]
- Jones, P.R.; Gawel, R.; Francis, I.L.; Waters, E.J. The influence of interactions between major white wine components on the aroma, flavour and texture of model white wine. Food Qual. Preference 2008, 19, 596–607. [Google Scholar] [CrossRef]
- R Core Team. R: A Language and Environment for Statistical Computing; R Foundation for Statistical Computing: Vienna, Austria, 2015. [Google Scholar]
- Lê, S.; Josse, J.; Husson, F. About the FactoMineR package. J. Stat. Softw. 2008, 25, 1–18. [Google Scholar]


| Term | +R | −R |
|---|---|---|
| Sweetness | 31 | 31 |
| Acidic | 28 | 33 |
| Alcohol | 16 | 17 |
| Balanced | 15 | 13 |
| Dry | 12 | 6 |
| Bitter | 12 | 13 |
| Length/Persistence | 11 | 6 |
| Round | 11 | 8 |
| Short | 11 | 5 |
| Tannin/phenolic | 10 | 9 |
| Thin | 10 | 13 |
| Astringent | 8 | 8 |
| Flabby | 8 | |
| Medium mouthfeel | 8 | 10 |
| Diluted | 7 | 7 |
| Rich | 7 | 8 |
| Fresh | 6 | |
| Smooth | 5 | |
| Soft | 5 | |
| Bright | 4 | 4 |
| Chewy | 4 | 4 |
| Prickly | 4 | |
| Low mouthfeel | 4 | 11 |
| High mouthfeel | 4 | |
| Unbalanced | 4 | 4 |
| Sting | 4 | |
| Salty | 4 |
© 2016 by the authors; licensee MDPI, Basel, Switzerland. This article is an open access article distributed under the terms and conditions of the Creative Commons by Attribution (CC-BY) license (http://creativecommons.org/licenses/by/4.0/).
Share and Cite
Sereni, A.; Osborne, J.; Tomasino, E. Exploring Retro-Nasal Aroma’s Influence on Mouthfeel Perception of Chardonnay Wines. Beverages 2016, 2, 7. https://0-doi-org.brum.beds.ac.uk/10.3390/beverages2010007
Sereni A, Osborne J, Tomasino E. Exploring Retro-Nasal Aroma’s Influence on Mouthfeel Perception of Chardonnay Wines. Beverages. 2016; 2(1):7. https://0-doi-org.brum.beds.ac.uk/10.3390/beverages2010007
Chicago/Turabian StyleSereni, Anthony, James Osborne, and Elizabeth Tomasino. 2016. "Exploring Retro-Nasal Aroma’s Influence on Mouthfeel Perception of Chardonnay Wines" Beverages 2, no. 1: 7. https://0-doi-org.brum.beds.ac.uk/10.3390/beverages2010007