Storage Stability of Novel Functional Drinks Based on Ricotta Cheese Whey and Fruit Juices


Consiglio per la Ricerca in Agricoltura e l’Analisi dell’Economia Agraria, Centro di Ricerca Ingegneria e Trasformazioni Agroalimentari (CREA-IT), Dipartimento di Milano, via Venezian 26, I-20133 Milano, Italy
*
Author to whom correspondence should be addressed.
Beverages 2018, 4(3), 67; https://0-doi-org.brum.beds.ac.uk/10.3390/beverages4030067
Submission received: 6 July 2018
/
Revised: 8 August 2018
/
Accepted: 14 August 2018
/
Published: 5 September 2018
(This article belongs to the Special Issue Novel Beverages and Novel Technologies for Their Production)
Abstract
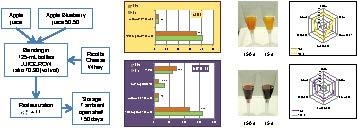
:To study the storage stability of drinks produced by blending ricotta cheese whey (RCW) with fruit juices, apple-RCW and apple and blueberry mix (50:50)-RCW (juice/RCW ratio: 70/30, 14.5% soluble solids content) were prepared. Color, sugar and organic acid profiles, antioxidant composition, and sensory features were analyzed after 15 to 150 days of storage on an open shelf at room temperature. A browning phenomenon occurred in the apple-RCW-based drink, while no significant color changes occurred in the mix-based drink. Significant degradation of polyphenol compounds (TPC) occurred in both drinks, but more markedly in the mix-based one. Storage strongly influenced the stability of the total monomeric anthocyanins (MAP) due to their sensitivity to temperature and light. Antioxidant capacity was preserved in both drinks, suggesting that the antioxidant capacity of Maillard reaction products and/or polymeric anthocyanins formed during storage compensated for the TPC/MAP loss. Sugar and organic acid profiles changed without influencing the sensory characteristics. Except for the sourness intensity in the apple-based drink, which increased significantly, storage did not negatively influence the sensory parameters, so both RCW-based drinks obtained high acceptance scores at the end of the storage period. Despite the bioactive compound losses, both drinks provided interesting nutritional value at the end of the storage period, particularly the mix-based drink. The overall results showed that both products are stable enough to hypothesize their commercialization.
1. Introduction
Ricotta cheese whey (RCW), also called scotta, is a highly pollutant dairy waste [1]. It is the main by-product of ricotta cheese production obtained after the flocculation of whey proteins induced by thermal treatment of cheese whey at 85–90 °C for about 20 min. A considerable amount of RCW is produced in the Mediterranean basin, especially in Italy, which contributes about 1 Mt/year [2], creating a serious environmental problem. The RCW composition is characterized by a high lactose concentration and interesting mineral profile, but the protein concentration is low [3].
In the last few years, novel dairy-based beverages have been developed. They can be categorized into two basic groups: (i) fortified dairy beverages (including probiotics, prebiotics/fibers, polyphenols, peptides, sterol/stanols, minerals, vitamins, and fish oil); and (ii) whey-based beverages, i.e., dairy-type beverages, thirst-quenching beverages, and fruit juice-type beverages [4]. Specifically, in fruit juice-type beverages, the whey composition [5] is enriched by the nutraceutical compounds of the fruit, increasing the functional value of the final product [4,6,7,8].
Cortellino et al. [9] developed a new product replacing whey with ricotta cheese whey (RCW). The authors set up two formulations of RCW-fruit-based functional drinks, selecting the type of juice and the juice/RCW ratio basing on their sensory quality. Firstly, the influence of the type of fruit juice was evaluated by testing fruit-RCW-based drinks (juice/RCW ratio: 80/20, 14% soluble solids content) using pear-RCW and apple-RCW drinks for the ‘yellow’ type and blueberry-RCW and strawberry-RCW drinks for the ‘red’ ones [9]. This study suggested mixing the blueberry juice with apple juice in order to buffer the high sourness of the blueberry-based drink, which on the other hand was preferred for color, as well as to enrich the apple-based drink, which was preferred for taste, with anthocyanin compounds from blueberry. Hence, in a subsequent sensory test aimed at selecting one formulation per drink type, the mixed juice formulations of apple:blueberry (50:50)-RCW and apple:blueberry (75:25)-RCW drinks were compared to the apple-based and blueberry-based ones. Furthermore, based on these results, Cortellino et al. [9] selected the apple-based drink for the ‘yellow’ type and the mixed 50:50-based drink for the ‘red’ type. Chemical analyses [10] confirmed the choice of the apple-RCW drink, which was preferred to the pear-RCW ones because, despite having similar Total Sweetness Index and Sourness Index values, the apple-based drink was richer in total phenolic content and antioxidant capacity. On the other hand, for the ‘red’ type, the apple:blueberry (50:50) blend was chosen, as it was a noteworthy source of phenolic compounds and monomeric anthocyanin pigments in addition to a good compromise for the taste, having an acceptable Sourness Index. Furthermore, Cortellino et al. [9] set up the maximum percentage of RCW to be used in the formulation without impairing the organoleptic quality; even though the increase of RCW percentage from 20% to 40% did not significantly affect the odor and taste pleasantness, the 70 juice:30 RCW formulation had the highest scores for acceptability and proneness to buy.
This study investigated the storage stability at ambient temperature on an open shelf of the most preferred drinks (the apple-based drink for the “yellow” type and the blueberry:apple (50:50) drink for the “red” type), prepared using 30% RCW and 70% juice, considering physicochemical characteristics, color, sugar and organic acid profiles, antioxidant composition, and sensory characteristics.
2. Materials and Methods
2.1. Reagents
The reagents sodium hydroxide 0.1 N in water, potassium chloride, sodium acetate, potassium bisulfate, sodium carbonate, Folin-Ciocalteu reagent, 1,1-diphenyl-2-picrylhydrazyl radical (DPPH), ethyl alcohol, hydrochloric acid, and orthophosphoric acid were purchased from Sigma-Aldrich (Milano, Italy).
Gallic acid, DL-malic acid, lactic acid, citric acid, fumaric acid, lactose, glucose, fructose, sucrose, and sorbitol were obtained from Merck KGaA (Darmstadt, Germany). All reagents were of analytical grade.
2.2. Preparation of RCW-Fruit Juice Drinks
Two formulations were prepared with a juice/RCW ratio of 70/30 and about 14.5% solid soluble content (SSC): apple-RCW and mix-RCW, which contained a blend of apple and blueberry juices (50:50, v/v) [9].
The cow RCW used to prepare the fruit-RCW-based beverages was provided as a frozen product by a dairy industry in the Sardinia region (Italy) producing ricotta cheese using their own cheese whey. Before blending, RCW was thawed at 2 °C for 24 h and filtered in order to remove the majority of fat. The chemical composition, nitrogen distribution, and mineral composition of RCW are reported in Table 1 [3].
Two types of concentrated clear fruit juices were used in the beverages preparation: 65% pectin-free blueberry and 70% apple juices. They were purchased as frozen products without any preservers and colorants addition from a fruit juice producer industry (GMC G. Mariani & C. S.p.A., Cellatica, BS, Italy). The thawed concentrated juices were diluted to 18.5% SSC with tap water for a better simulation of an industrial context. They were then blended with RCW individually for every bottle. Beverages were packed in 125 mL uncolored glass bottles capped with twist-off lids. Forty-eight bottles per juice type were divided into two lots and each lot (24 bottles per juice type/lot) was separately pasteurized in an autoclave (Ghizzoni, Parma, Italy) using saturated steam. Pasteurization temperatures were detected in the autoclave and at the core of the bottle by means of flexible thermocouple probes and monitored with an E-Val 2.10 software system (Ellab A/S, Hillerød, Denmark); the lethal rate value [11] was 11 [10,12].
After pasteurization, 15 bottles per juice type/lot were kept on open shelves at ambient temperature (ca. 20 °C; sampling times: 15 days (3 bottles per juice type/lot); 150 days (12 bottles per juice type/lot)) and nine bottles per juice type/lot were stored at −30 °C. After 15 and 150 days of shelf life at 20 °C, for each drink, three bottles per pasteurization lot were analyzed soon after opening for physicochemical parameters (pH, titratable acidity, soluble solids content, color). Then, 50 mL aliquots from every bottle were frozen at −20 °C until the analysis for soluble sugar and organic acid compositions, phenolics, anthocyanins, polymeric color, and total antioxidant capacity. After 150 days, for each drink, 18 bottles per pasteurization lot (nine kept at 20 °C and nine kept at −30 °C) were used for sensory analysis.
2.3. Physicochemical Analyses
The pH values and titratable acidity were determined using a titroprocessor (model 682, Metrohm AG, Herisau, Switzerland), by titrating 5 g of beverage plus 100 mL of distilled water with 0.1 N NaOH to pH = 8.2. Soluble solids content (SSC) was measured using an automatic refractometer (RFM81, Bellingham-Stanley Ltd, Tunbridge Well, England). Each bottle was analyzed separately (one bottle/three replicates).
Color parameters (one bottle/three replicates) were measured by means of a Spectrophotometer CM-2600 (Minolta, Tokyo, Japan) equipped with a sample holder for 10 mm plastic cells suited for liquid analysis, using the primary illuminant D65 [13] and 2° observer in the L*, a*, b* color space. Specular component included (SCI) mode was selected and a white calibration tile was used as background. From the L*, a*, b* values, the color difference (∆E) was computed according to the following equation:
where subscript 15 refers to beverages after 15 days and subscript 150 to beverages after 150 days of storage.
∆E = ((L15* − L150*)2 + (a15* − a150*)2 + (b15* − b150*)2)−2
2.4. Determination of Total Phenolic Content (TPC)
Total phenolic content (TPC) (one bottle/three replicates) was measured spectrophotometrically by the Folin-Ciocalteau assay [14] and was expressed as gallic acid equivalents (mg GAE/100 mL). Samples, diluted with distilled water, and Folin-Ciocalteu reagent were incubated for 8 min, followed by the addition of 20% sodium carbonate. After 2 h in the dark, the absorbance was measured at 730 nm against a blank with a Jasco 7800 UV/VIS spectrophotometer (Jasco Europe S.r.l., Cremella, LC, Italy).
2.5. Determination of Total Anthocyanin Pigments (MAP) and Color Index (PPC)
Total monomeric anthocyanin pigment (MAP) (one bottle/two replicates) was estimated spectrophotometrically by the pH-differential method [15] using a Jasco 7800 UV/VIS spectrophotometer (Jasco Europe S.r.l., Cremella, LC, Italy). Samples were diluted with distilled water and absorbance was measured at 510 nm and 700 nm in buffers at pH 1.0 and 4.5 using the following equation:
with a molar extinction coefficient of 26,900. Results were expressed as mg of cyanidin 3-glucoside equivalents (mg C3GE/100 mL).
A = (A510 − A700)pH 1.0 − (A510 − A700)pH 4.5
Percent polymeric color (PPC) was measured using the bisulphite bleaching method [15]. Samples and 20% potassium bisulphite were mixed and after 15 min the absorbance was measured at 420 nm, λvis-max, and 700 nm against a blank (sample and distilled water). The diluted drinks were measured at 420 nm, λvis-max, and 700 nm against a blank (water) and were used as control samples. The PPC was computed according to Equation (3):
where CD is the color density, which was computed using the absorbance values of control samples according to Equation (4):
and PC is the polymeric color, which was computed using the absorbance values of bisulphite bleached samples according to Equation (5):
PPC = (PC/CD) × 100
CD = [(A420nm − A700nm) + (Aλvis-max − A700nm)]
PC = [(A420nm − A700nm) + (Aλvis-max − A700nm)]
2.6. Determination of Antioxidant Capacity
The antioxidant capacity (AntOx) (one bottle/three replicates) was measured according to the method described by Lo Scalzo et al. [16] using a Jasco 7800 UV/VIS spectrophotometer (Jasco Europe S.r.l., Cremella, LC, Italy). For the measurement, samples were mixed with 2 mM 2,2-diphenyl-1-picrylhydrazyl radical (DPPH) ethanol solution and ethanol. The absorbance at 517 nm against a blank (ethanol and sample) was recorded at 0 s and 180 s. The percentage of DPPH decrease was computed as:
and results were expressed as mg gallic acid equivalents (mg GAE/100 mL).
DPPH% = ((At0 − At180)/At0) × 100
2.7. Soluble Sugar and Organic Acid Compositions
Soluble sugar and organic acid compositions (six replicates/beverage) were determined using HPLC and each bottle was analyzed separately (one bottle/one replicate). After thawing and filtration, samples were diluted with distilled water. The HPLC system (Jasco Inc., Tokyo, Japan) was equipped with an isocratic pump (PU 880), an automatic sampler (AS-1555) set at 20 µL sample volume, and Borwin® 5.0 software (JMBS developments, Grenoble, France) for collecting peak data.
Soluble sugars were separated on a Rezex™ RPM-monosaccharide Pb+2 (8%) (300 × 7.8 mm, Phenomenex) column kept at 85 °C and connected to a refractive index detector (RI-930) employing water as a mobile phase at a flow rate of 0.6 mL/min.
Organic acids were analyzed on a Hypersil Gold (5 µm, 4.6 × 250 mm, Thermo Scientific) column kept at 30 °C and fitted to a variable wavelength detector (UV-1575) set at 210 nm using 0.02 M orthophosphoric acid as a mobile phase at a flow rate of 0.7 mL/min.
Chromatographic peaks were identified by comparing retention times with those of standards and by spiking samples with pure compounds, while quantification was carried out using specific calibration curves. Data of sugar composition were expressed as g/100 mL of beverage, whereas those of organic acids were expressed as mg/100 mL of beverage.
2.8. Sensory Analysis
In order to study the influence of storage at ambient temperature on sensory quality, drinks were evaluated after 150 days of storage, together in the same session with drinks that had been subjected to 15 days of open storage followed by storage at −30 °C until sensory analyses. Drinks were evaluated both by a panel of 10 judges for qualitative descriptive analysis (QDA) [17] and a panel of 10–13 judges for triangle test [18]. Panelists (35–50 years old, six men and seven women, all belonging to the CREA-IT technical and scientific staff) had extensive experience in QDA and triangle test sensory evaluation for fruit products, and received short-term training for the specific descriptors of this type of beverage.
In the descriptive test, the four drinks (d15 and d150 for apple and d15 and d150 for mix) were evaluated by a panel of 10 judges for the intensities of sourness, sweetness, and saltiness; the pleasantness of color, odor, and aroma; and the overall acceptance using 120 mm lines with low and high anchors near the extremes. Two sessions in subsequent days were carried out, each dedicated to a pasteurization lot.
In the triangle test, one different and two alike samples were presented to the panelist, who had to identify the odd sample [18]. For each type of drink, two sessions, in which d15 and d150 samples were compared, were carried out on subsequent days, each dedicated to a pasteurization lot. After being kept at 12 °C for 24 h, each drink was served in a 100 mL transparent flute glass coded by a random three-digit code. Three and six bottles for the descriptive and triangle test, respectively, per juice type per pasteurization lot per storage time were utilized. The position of the samples within the descriptive test and the triangle test was randomized according to the experimental design performed by means of FIZZ software, v. 2.45 (Biosystèmes, Couternon, France). The sensory tests were carried out in a panel room with separate booths for each judge.
2.9. Statistical Analysis
The Statgraphics v.5.2 (Manugistic Inc., Rockville, MD, USA) software package was used. For each bottle, the average of its repetitions was submitted to multi-factor analysis of variance separately for apple and mix types, considering pasteurization lot, storage time, and their interaction as sources of variation. As no significant effects of pasteurization lot and interaction were observed, to calculate the statistical significance of the difference between means of d15 and d150 samples, compared two by two, the Student’s t-test was used.
Prior to the analysis of variance of QDA sensory data, the rating scores of each attribute were standardized by panelist in order to remove the variability due to panelists using different parts of the scale, as shown in Equation (7):
where is the ith standardized value (standard score) of descriptor x for a certain panelist, S is the general standard deviation of all scores of the descriptor, M is the general mean of all scores of the descriptor, xi is the ith observed value for the panelist, is the descriptor’s mean for the panelist, and sx is the descriptor’s standard deviation for the panelist. In this way, the resulting standardized descriptor for each panelist has a mean equal to M and a standard deviation equal to S [19]. The triangle test results were evaluated by a one-tailed binomial test with p = 1/3 ([18] Table 8).
3. Results and Discussion
In this storage experiment, two sampling times were selected in order to obtain sample characteristics of the commercial distribution chain for this type of product. The 15-day sampling time refers to the minimum time which might elapse between the last step of production and the first hypothetical retail sale time. The 150-day sampling time instead simulates a medium suggested time for consumption compared to the best-by date time used for similar products commercially available.
3.1. Influence of Storage on Physicochemical Analyses
Table 2 shows the results obtained for the physicochemical analyses of drinks. Comparison of soluble solid content (SSC) values in both juices (ca. 14.65% in the apple-RCW drink and ca. 14.46% in the mix-RCW drink) revealed that this parameter hardly underwent any modifications throughout storage. The pH parameter showed slight but significant decreases for both samples, to a lesser degree for the mix-RCW formulation (Δ = −0.07) and a higher degree for the apple-RCW one (Δ = −0.14). On the other hand, the titratable acidity value of the apple-RCW-based drink (Δ = +0.49) was statistically increased by storage; however, this phenomenon was not observed for the mix-RCW drink, whose parameter remained substantially unchanged (Δ = +0.07). All of these parameters could be considered reasonably stable, confirming that the microbial load present both in RCW and juice was successfully inactivated by the thermal treatment of ricotta processing combined with the pasteurization step employed during drink processing. Otherwise, the lactose present would have been consumed, resulting in an excessive decrease in the soluble solid content and pH value as well as a related increase of titratable acidity, with negative consequences on the sensory characteristics. Similar slightly decreasing pH results were noted by Casati et al. [20] for pasteurized blueberry juices stored for six months and by Nani et al. [21] for pasteurized blends of berry and apple juices stored for four months. This trend may be due to chemical changes linked with non-enzymatic browning reactions that happen throughout storage [22,23]. In relation to other dairy products, drinks containing goat whey and strawberry or peach pulp showed much higher pH value (ca. 6.90) due to their formulation and slight but not significant decreases of pH and increases for titratable acidity during 14 days of refrigerated storage [24].
The storage caused a darkening of the apple-RCW drink, reflected by a significant decrease of the lightness (L*) parameter (Δ = −4.07). Moreover, the color shifted from yellow to yellow-orange, due to a slight but significant increase of the green-red parameter (a*) (Δ = +1.83). In contrast, the color change with storage of the mix-RCW drink involved only a very slight, though significant, decrease of lightness (Δ = −0.27).
The total color difference gives an indication whether the difference in color parameters occurred throughout storage was noticeable. On the basis of the ΔE value, color difference can be evaluated as not noticeable (0–0.5), slightly noticeable (0.5–1.5), noticeable (1.5–3.0), well visible (3.0–6.0), and great (6.0–12.0) [25].
The whole dataset highlighted a more stable behavior of the mix-RCW-based drink if compared to the apple-RCW-based one, as also indicated by the respective total color difference between the beginning and the end of storage; this value was very low and not noticeable to the human eye for the mix-RCW sample (ΔE = 0.47 ± 0.09), while it was quite high and consequently well visible for the apple-RCW one (ΔE = 4.54 ± 0.32). The color system of the mix-RCW-based drink of this work was found to be much more stable than that reported in the literature for other apple/berries juice blends. It has been reported that apple/sour cherries (80/20; 15% SSC) and apple/bilberry (83.5/16.5; 13.5% SSC) mix juices after four months of storage showed a consistent decrease of all chromatic parameters (L*, a*, and b*), resulting in a final color difference value of 7.2 for the former and a value of 4.7 for the latter [21,26]. Concerning the apple-RCW-based drink, only lightness data on apple juice concentrate is available in the literature. Our result (ΔL* = −4.1) is in line with the results reported by Burdurlu et al. [27], who found that the L value decreased by 3.2 and 5.7 for apple juice concentrate (65% SSC) after a four-month storage period at 20 °C and 37 °C, respectively.
Toribio et al. [28] and Cao et al. [29] asserted that the Maillard reaction is the most important reason for browning throughout storage in apple concentrate and strawberry juice, respectively, since enzymatic browning is eliminated by heat treatment during processing. The Maillard reaction takes place between α-amino groups and reducing sugars, glucose, and fructose, when the temperature reaches 20–25 °C. In our study reducing sugars are mainly supplied by fruit juices, while amino acids are supplied by both fruit juices and RCW. In the Maillard browning system, the reactivity of aldoses (glucose) is higher than that of ketoses (fructose), and basic amino acids have more reactivity than acidic ones [27]. Maillard reactions can also cause the accumulation of 5-hydroxymethyl-furfural (5-HMF), which is formed by the enolization of reducing sugars reacting with amino acids after Amadori rearrangement [30]. Then these 5-HMF molecules condense with nitrogenous compounds and polymerize to give brown pigments [31]. Burdurlu et al. [27] found that the absorbance at 420 nm (A420) and the lightness values of Golden Delicious apple juice concentrates respectively decreased and increased by increasing storage time and temperature; the former follows a zero-order reaction, but no fitting kinetic model was found for the latter. In a previous study, Toribio et al. [28] revealed that non-enzymatic browning follows a first-order reaction in apple juice concentrates during storage. The 5-HMF level enhanced significantly at the end of the four months of storage at 20 and 37 °C; moreover, the increase of 5-HMF between 5 and 37 °C was approximately 1000 times [27].
A combination of the Maillard reaction and degradation phenomenon of anthocyanins compounds (discussed in the following paragraph) probably contributed to the color change of the mix-RCW drink, even though its results were rather limited. Some steps of Maillard pathways are slowed down by low pH values, since the amino group in the equilibrium is more protonated and, consequently, less reactive with the sugar [32]. This fact may explain the limited browning phenomenon that occurred in the mix-RCW drink, whose initial pH value (pH = 3.32) was lower than that of the apple-RCW drink (pH = 3.70).
3.2. Influence of Storage on Total Anthocyanin Pigments
Storage strongly influenced the stability of total monomeric anthocyanins, resulting in a loss of about 60% of the initial content (Figure 1). This result was higher than the previously reported value for a blend of apple and bilberry juices, with a respective loss of 11% and 24% after one and four months of storage at room temperature on an open shelf, but consistent with the findings reported for blends of apple juice with juices from other berries, such as redcurrant, blackcurrant, blackberry, and raspberry, with similar ranges of loss of 28–50% and 40–59% [21]. Rapid degradation in the initial phase was also observed, with a loss of about 50% just after one month, followed by a lessened decreasing trend with a loss of about 85% after four months for the mixed juice of apple with sour cherries [26].
Storage temperature had a strong influence on the stability of anthocyanins in blueberry juices stored at 4, 25, and 40 °C [33], in raspberry pulp stored at 4, 20, and 37 °C [34], and in black carrot juice concentrates stored at 5, 20, and 30 °C [35]. Other studies have shown the degradation of anthocyanins in blueberry juices during storage in the dark; it has been reported that more than 50% of anthocyanins were lost after six months at 25 °C [36], 74% of malvidin and 21% of peonidin were lost after 60 days at 23 °C, and 100% of anthocyanins were lost after 60 days at 35 °C [37]. The decrease follows a first-order reaction kinetic and the kinetic rate constant k value increases with temperature, indicating a greater degradation at higher storage temperatures [33,34,35]. In addition, light has a significant negative effect on anthocyanin stability, since the degradation rate of açai anthocyanin extract in buffer solution and in an isotonic soft drink-like system was 7.1 and 1.7 times faster, respectively, under light than in the dark [38].
It has been reported that for some types of berry products color deterioration cannot be characterized by changes in total anthocyanin alone, as most of the anthocyanins polymerize instead of being lost during storage. The Giusti and Wrolstad’s [15] method measures the PPC color index, exploiting the ability of bisulphite to form colorless adducts with monomeric anthocyanin compounds; meanwhile, the polymeric pigments are resistant to bisulphite bleaching. Hence, PPC is an index of the degree of anthocyanin polymerization. The PPC value increased from 60% to 73% (Figure 1), indicating that the degree of anthocyanin polymerization, already rather high after processing, increased further throughout storage. These phenomena cannot be attributed to the residual activity of polyphenoloxidase and peroxidase enzymes, which may contribute to anthocyanin degradation, as they were certainly inactivated by the heat treatment of pasteurization. A more plausible mechanism involves condensation reactions of anthocyanins with other phenolic compounds, such as phenolic acid and condensed tannins; the kinetics of PPC formation was found to follow a first-order reaction model during storage [35]. Even though the initial value of PPC was higher than that reported in the literature for similar products [10,36,39], the increase (Δ = +13.2) that occurred throughout storage was in line with the results of Hager et al. [39] on blackberry juices, for which PPC increased from 4.5% to 28% in nonclarified juices and from 10% to 32% in clarified juices, as well as with the results of Brownmiller et al. [36] on blueberry juices, for which PPC increased from 10 to 25% in nonclarified juices and from 8 to 17% in clarified juices over six months of storage.
The drinks studied in this work contain 30% RCW and thus, considering the composition data reported in Table 1 [3], a very small amount of total protein (0.10 g/100 g), of which just a part can be considered as true protein (0.04 g/100 g). RCW also contributed further compounds to the drink, such as α-lactalbumin (5.4 mg/100 g) and β-lactoglobulin (6.3 mg/100 g) as well as casein macropeptide and peptides, which may interact with anthocyanins, increasing their stability as reported in the literature. On the other end, anthocyanins, in the presence of vitamin C, are subjected to chemical degradation leading to color fading and loss of bioactivity. It has been proved that the color stability of purple carrot anthocyanin in model beverage systems, stored at an elevated temperature (40 °C) under light for seven days, was enhanced by adding biopolymers [40]. The heat-denatured whey protein isolate conferred the best stability by means of complexation with anthocyanin, reducing its degradation due to ascorbic acid. Chung et al. [40] showed through a fluorescence quenching study that anthocyanin formed stronger interactions with protein through hydrogen bonding than with ascorbic acid. Moreover, Chung et al. [41] suggested that the addition of three amino acids (L-phenylalanine, L-tyrosine, and L-tryptophan) and a polypeptide (ε-poly-L-lysine) may prolong the color stability of the same beverage, with the most significant improvement being observed for L-tryptophan, which interacted with anthocyanins mainly through hydrogen bonding but also by hydrophobic interaction.
3.3. Influence of Storage on Total Phenolic Content and Antioxidant Capacity
Phenolic concentration (TPC) significantly decreased over five months of storage in both drinks, by 13.4% for apple-RCW and by 27.9% for mix-RCW (Table 3). On the other hand, total antioxidant capacity (AntOx) showed a different trend (Table 3), as values increased slightly by 8.8% for the apple-RCW drink and remained stable for the mix-RCW one.
The loss of phenolic compounds in the mix-RCW sample was in line with the findings reported in the literature [20] for blueberries, elderberry, and blackberry juices stored for six months in the dark at 40 °C, whose phenolic concentration decreased by approximately 40% throughout the first 30 days of storage and remained nearly stable until six months of storage was reached. On the other hand, this result did not agree with those of Nani et al. [21] and Babsky et al. [22]. Nani et al. [21] found a 9% TPC increase in a blend of bilberry and apple juices after four months of storage at ambient temperature on an open shelf, while Babsky et al. [22] reported that polyphenol content increased by 44% in clarified apple juice concentrate stored at 37 °C for 111 days in the dark. The reason for TPC increase may be found in the interference of reductone compounds present in the juices with the Folin Ciocalteau reagent, so that the apparent phenolic content was increased [42]. As reported for the anthocyanin degradation, the stability of the total phenols also depended on the storage temperature. Cao et al. [29] reported that the loss of total phenols in high hydrostatic pressure processed cloudy and clear strawberry juices was almost identical at the same temperature, but at 25 °C it was 1.5–2 fold than that at 4 °C.
Polyphenoloxidase and peroxidase were considered to be the main enzymes responsible for the decay of phenols in berry-derived foods [43], but these two enzymes were totally inactivated by the pasteurization treatment. The oxidation degradation of phenolic compounds and the polymerization of phenolic compounds with protein would be responsible for the decrease of the total phenols [43]. Results indicated that the loss of total phenols was much lower than the loss of anthocyanins; this phenomenon may be due at least in part to some degradation products of anthocyanins with phenolic hydroxyl groups, which could be included in the total phenols if the Folin-Ciocalteau method is used [43]. The antioxidant capacity of polymeric anthocyanins [44,45] and Maillard reaction products [46] formed during storage likely compensated for the loss of the antioxidant capacity as a result of monomeric anthocyanin degradation. Some authors showed in berry juices that changes of antioxidant capacity, determined by the DPPH test, were similar to the changes in total phenols, with losses of 41.3% for strawberry juice [29], as well as 52% for blueberry, 34% for elderberry, and 56% for blackberry juices [20] stored for six months. The different scenario found in this work for the mix-RCW drink could also be due to the presence of equal amounts of blueberry juice and apple juice, which, as compared to the apple-RCW drink, had a slight increase in AntOx with storage; this fact likely partially compensated for the loss of antioxidant capacity due to the concomitant decrease in TPC content.
3.4. Influence of Storage on Sugar and Organic Acid Compositions
The sugars composition (Table 4) was partially affected by storage, since the sucrose concentration decreased significantly in both drinks, with a loss of 30% for the apple-RCW sample and 54% for the mix-RCW sample. Consequently, the concentration of glucose and fructose increased, although this increase was only significant for glucose in the apple-RCW-based drink, probably because of the high standard errors for the samples after storage. This scenario could be due to sucrose acid hydrolysis, as sucrose under an acid condition may tend to hydrolyze to fructose and glucose. Babsky et al. [22] showed a sucrose loss of more than 50% in apple juice concentrate (72% SSC) stored at pH 3.55 and 37 °C for three and a half months. Sucrose was hydrolyzed under these conditions at a rate corresponding to a first-order process. The reducing sugars increased in proportion to the sucrose loss and no consumption attributable to a browning reaction was detected, although the Maillard reaction was evidently taking place as judged by browning and 5-HMF production. Our results were also in line with the results of Nani et al. [21,26] for blends of apple and various types of berry fruit juices, stored for four months with a sucrose loss ranging from 42% for blackcurrant to 100% for sour cherry, blackberry, and raspberry.
Concerning the other sugars, sorbitol was contained in very small quantities with no changes throughout storage. The sorbitol stability was confirmed by Rizzolo et al. [47], who found that it remained stable in clear sour cherry juices till eight months of storage at ambient temperature on an open shelf. As expected, the amounts of lactose did not differ between the two formulations since it was supplied by the RCW. Results showed that storage did not cause lactose loss at all. As this type of drink is very novel; no literature data concerning the behavior of lactose in fruit juices throughout storage are available. It was not possible to quantify galactose from RCW, as it was below the limit of quantification since the proportion of RCW used in both formulations was only 30%.
Except for citric acid in the apple-RCW-based drink, all of the organic acid concentrations were significantly influenced by storage (Table 4). The lactic acid from RCW, similar to lactose, showed no difference between the formulations; on the other hand, the amount of citric acid in the mix-RCW drink was 10-fold that in the apple-RCW drink. With the exception of fumaric acid, the other organic acids losses were overall lower (range 0.4–10.9%) in the apple-RCW sample as compared to the mix-RCW sample (range 7.8–17.7%). In fact, fumaric acid, present just in trace levels, was reduced by 22% in the apple-RCW and 15.5% in the mix-RCW drinks. Citric acid showed different behavior, as it remained substantially stable in the apple-RCW sample and slightly decreased in the mix-RCW one. The decreases of lactic and malic acids, respectively 10.9 and 7.5% in the apple-RCW drink and 17.7 and 15.5% in the mix-RCW drink, were those that most affected the organic acid profile from the quantitative point of view. To our knowledge, very few reports in the literature concerning the behavior of organic acids contained in juices during storage are available. Rizzolo et al. [47] stated that malic acid decreased by 21% in sour cherry juice stored for four months. Gierschner [48] reported progressive malic acid losses up to 20% in apple concentrate during storage. It is probable that this is due to the formation of sugar/acid esters, although dimeric lactide formation is also a possibility. It is not known what effect such complexes have on the perceived acidity of juice in terms of flavor, but they can certainly be a source of error in analytical determinations.
3.5. Influence of Storage on Sensory Analysis
In this work, a sensory analysis was carried out in order to obtain a description of the sensory profile of the two drinks concerning sweetness, sourness, and saltiness, and to verify whether the storage at ambient temperature on open shelves affected the sensory profile (QDA). The triangle test, instead, was performed to see whether the samples subjected to the two storage time periods were distinguishable. Concomitant to the QDA analysis, panelists were also asked to give a pleasantness score for color, odor, and aroma, the sensory characteristics firstly impacting consumers, as well as a score for the overall acceptance of the drink. In this way, a preliminary indication of the hypothetical impact of these drinks on consumers could be obtained.
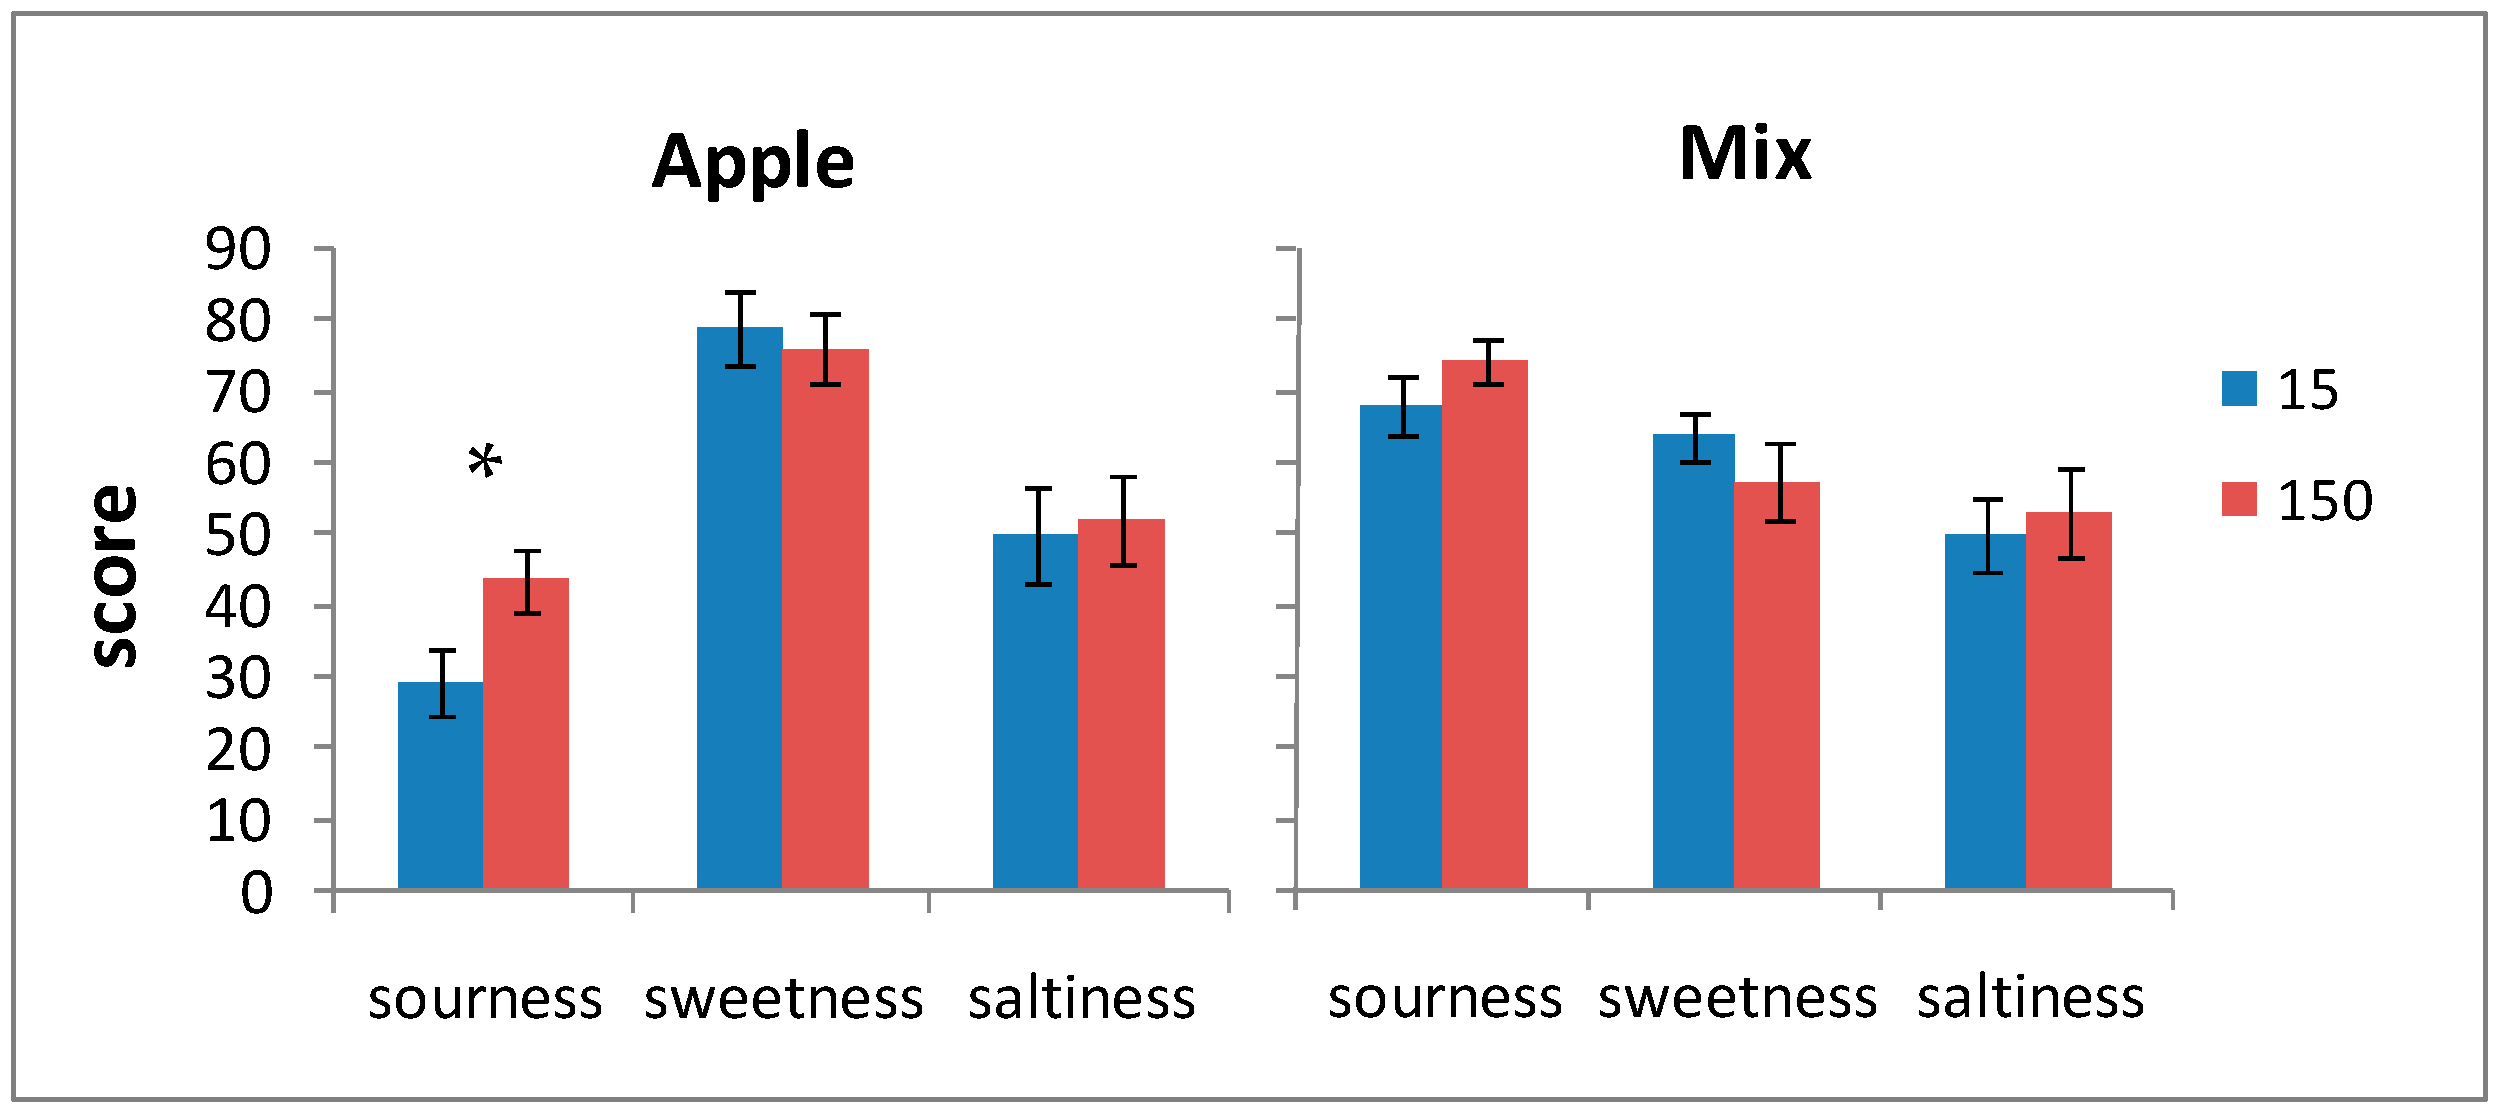
Results indicate that the 150-day storage period on open shelves at ambient temperature did not significantly influence the pleasantness of color, odor, and aroma, the overall acceptability (Table 5), and the sweetness and saltiness intensities of both formulations (Figure 2). The sourness intensity did not change in the mix-RCW drink and increased significantly with storage in the apple-RCW-based drink (Figure 2), in accordance with the instrumental results (pH and titratable acidity). The significant color changes found instrumentally, especially for the apple-RCW-based drink, did not negatively affect the judgment of the drinkers, whose scores for color pleasantness decreased only slightly with storage.
It is worth emphasizing that the pleasantness of color, odor, aroma, and the overall acceptability received good scores—higher than average values—even at the end of the storage periods. The perceptions of sourness and saltiness, even though the former were quite high in the mix-RCW drink, were not so much as to compromise the global acceptability both at the beginning and at the end of the storage period.
However, the overall slight differences in scores between the two storage periods allowed the judges to distinguish both types of drinks by the triangle test (Table 6). In fact, the odd drink was correctly recognized in test 1 for the apple-based drink and in test 2 for the mix drink, in the first case with less significance than in the second. Furthermore, summing up the answers of the two tests for each formulation, the judges were able to distinguish drinks from the two storage times, always with less significance for the apple-based formulation.
Our results were confirmed by literature data, as Spayd et al. [49] reported that the sensory scores of product acceptability of a juice blend of apple and black raspberries (ratio 80:20) were not influenced by six months of storage, even though its total anthocyanin content and polymeric color changed significantly. The sensory color changes of blueberry, elderberry, and blackcurrant juices throughout storage were perceived by consumers [20] when they were evaluated in a triangle test, as the odd drink was correctly recognized when samples with different storage times were compared. The differences were described as having a less red/more brownish color and lower viscosity for blueberry (comparison between 0–15 and 15–45 days of storage), a darker red color and higher viscosity for elderberry (0–15 and 15–45 days), or a slightly less red and brownish color, lower viscosity, and more acidity for blackcurrant (0–30 and 30–75 days).
4. Conclusions
Storage at ambient temperature on an open shelf caused a rather marked darkening phenomenon in the apple-RCW-based drink but no significant color changes in the mix-RCW-based one. TPC and MAP degradation occurred, though to a greater extent in the latter. The loss may have been enhanced by the sample’s sensitiveness to temperature and light. On the other hand, the antioxidant capacity was completely preserved; the reason for this may be found in the Maillard reaction products and/or anthocyanin polymers, which compensated for the loss of antioxidant capacity due to TPC and MAP degradations. The sucrose acid hydrolysis changed the sugars profile, decreasing sucrose and increasing glucose and fructose contents throughout storage. The organic acids also were modified, as most of them decreased to different degrees. A sensory analysis indicated that only the sourness index in the apple-RCW drink changed with storage time, and the score increase agreed with the instrumental results. The good pleasantness scores for color, odor, and aroma, obtained for both drinks using a small panel, should be confirmed using a larger number of panelists. All of the physicochemical modifications observed were not enough to negatively influence the overall judgment of the tasters, who expressed high product acceptance scores, even at the end of the storage periods. Despite the loss of bio-active compounds throughout storage, both final products provided interesting nutritional values, particularly the mix-RCW-based drink as evidenced by its high antioxidant capacity. The overall results showed that both products are stable enough to hypothesize their commercialization, which also would not require a cold chain, even though they were made without any stabilizers. These novel functional drinks, well accepted by potential consumers, may be considered a convenience and health-promoting product, in line with these current lifestyle trends. Further, these alternative products may improve the sustainability of the dairy sector, representing the possibility of reducing industrial costs of the disposal of RCW with minimal additional costs to the dairy plant.
Author Contributions
A.R. and G.C. conceived and designed the experiment; G.C. did all of the experimental work; A.R. and G.C. analyzed the data; G.C. wrote and edited the original draft; A.R. supervised.
Funding
This research was carried out within the “Twinning Italy-Canada activities in Research and Innovation in the Agro-Food Area—CANADAIR” project funded by the Italian Ministry of Agriculture (Ministry Decree 27240/7303/2011).
Acknowledgments
The authors would like to thank Nicola Luccini for her contribution to the preparation and analyses of RCW-juice drinks.
Conflicts of Interest
The authors declare no conflict of interest.
Abbreviations
The following abbreviations are used in this manuscript:
| RCW | Ricotta cheese whey |
| SSC | Soluble solid content |
| TA | Titratable acidity |
| TPC | Total phenolic content |
| MAP | Monomeric anthocyanin pigment |
| AntOx | Antioxidant activity |
| PPC | Percent polymeric color |
References
- Marwaha, S.S.; Kennedy, J.F. Whey-pollution problem and potential utilization. J. Food Sci. Technol. 1988, 23, 323–336. [Google Scholar] [CrossRef]
- Ozmihci, S.; Kargi, F. Ethanol production from cheese whey powder solution in a packed column bioreactor at different hydraulic residence times. Biochem. Eng. J. 2008, 42, 180–185. [Google Scholar] [CrossRef]
- Monti, L.; Povolo, M.; Passolungo, L.; Contarini, G. Chemical characterization of Ricotta-cheese whey (scotta). In Proceedings of the Final Conference of Project CANADAIR, Twinning Italy-Canada Activities in Research and Innovation in the Agro-Food Area, Lodi, Italy, 15 June 2015; CREA: Roma, Italy, 2015; pp. 60–64. [Google Scholar]
- Özer, H.B.; Kirmaci, H.A. Functional milks and dairy beverages. Int. J. Dairy Technol. 2010, 63, 1–15. [Google Scholar] [CrossRef]
- Mollea, C.; Marmo, L.; Bosco, F. Valorisation of cheese whey, a by-product from the dairy industry. Food Ind. 2013, 549–588. [Google Scholar]
- Djurić, M.; Carić, M.; Milanović, S.; Tekić, M.; Panić, M. Development of whey-based beverages. Eur. Food Res. Technol. 2004, 219, 321–328. [Google Scholar] [CrossRef]
- Goudarzi, M.; Madadlou, A.; Mousavi, M.E.; Emam-Djomeh, Z. Formulation of apple juice beverages containing whey protein isolate or whey protein hydrolysate based on sensory and physicochemical analysis. Int. J. Dairy Technol. 2015, 68, 70–78. [Google Scholar] [CrossRef]
- Sakhale, B.K.; Pawar, V.N.; Ranveer, R.C. Studies on the development and storage of whey based RTS beverage from mango cv. Kesar. J. Food Process. Technol. 2012, 3, 148. [Google Scholar]
- Cortellino, G.; Rizzolo, A.; Cattaneo, T.M.P. Ricotta-cheese whey-fruit based functional drinks. In Proceedings of the Final Conference of Project CANADAIR, Twinning Italy-Canada Activities in Research and Innovation in the Agro-Food Area, Lodi, Italy, 15 June 2015; CREA: Roma, Italy, 2015; pp. 65–70. [Google Scholar]
- Rizzolo, A.; Cortellino, G. Beverages based on ricotta cheese whey and fruit juices. Ital. J. Food Sci. 2018, 30, 289–302. [Google Scholar]
- Stoforos, N.G.; Taoukis, P.S. Heat processing: Temperature-time combinations. In Handbook of Food Science, Technology and Engineering; Hui, H.Y., Sherkat, F., Eds.; CRC Press: Boca Raton, FL, USA, 2006; pp. 1–16. [Google Scholar]
- Rizzolo, A.; Cortellino, G. Ricotta cheese whey–fruit-based beverages: Pasteurization effects on antioxidant composition and color. Beverages 2017, 3, 15. [Google Scholar] [CrossRef]
- CIE 2006. Colorimetry—Part 2: CIE Standard Illuminants. [ISO 11664-2:2007]. Available online: https://www.iso.org/obp/ui/#iso:std:iso:11664:-2:ed-1:v1:en (accessed on 15 June 2018).
- Singleton, V.L.; Rossi, J.A. Colorimetry of total phenolics with phosphomolybdic–phosphotungstic acid reagents. Am. J. Enol. Vitic. 1965, 16, 144–158. [Google Scholar]
- Giusti, M.M.; Wrolstad, R.E. Characterization and measurement of anthocyanins by UV−visible spectroscopy. In Current Protocols in Food Analytical Chemistry; Wrolstad, R.E., Acree, T.E., An, H., Decker, E.A., Penner, M.H., Reid, D.S., Schwartz, S.J., Shoemaker, C.F., Sporns, P., Eds.; John Wiley and Sons: New York, NY, USA, 2001; pp. F1.2.1–F1.2.13. [Google Scholar] [CrossRef]
- Lo Scalzo, R.; Iannoccari, T.; Summa, C.; Morelli, R.; Rapisarda, P. Effect of thermal treatments on antioxidant and antiradical activity of blood orange juice. Food Chem. 2004, 85, 41–47. [Google Scholar] [CrossRef]
- Pagliarini, E. Metodi descrittivi. In Valutazione Sensoriale; U. Hoepli: Milano, Italy, 2002; pp. 59–65. [Google Scholar]
- Pompei, C.; Lucisano, M. Introduzione all’Analisi Sensoriale degli Alimenti; Edizioni Tecnos: Milano, Italy, 1991; p. 90. [Google Scholar]
- Bianchi, G.; Eccher Zerbini, P.; Rizzolo, A. Short-term training and assessment for performance of a sensory descriptive panel for the olfactometric analysis of aroma extracts. J. Sens. Stud. 2009, 24, 149–165. [Google Scholar] [CrossRef]
- Casati, C.B.; Sánchez, V.; Baeza, R.; Magnani, N.; Evelson, P.; Zamora, M.C. Relationships between colour parameters, phenolic content and sensory changes of processed blueberry, elderberry and blackcurrant commercial juices. Int. J. Food Sci. Technol. 2012, 47, 1728–1736. [Google Scholar] [CrossRef]
- Nani, R.; Di Cesare, L.F.; Rizzolo, A.; Picariello, M. New drinks based on clear juices—Part 2: Blends of apple juice and berry juices. Fruit Process. 1993, 3, 219–222. [Google Scholar]
- Babsky, N.E.; Toribio, J.L.; Lozano, J.E. Influence of storage on the composition of clarified apple juice concentrate. J. Food Sci. 1986, 51, 564–567. [Google Scholar] [CrossRef]
- Buedo, A.P.; Elustondo, M.P.; Urbicain, M.J. Non-enzymatic browning of peach juice concentrate during storage. Innov. Food Sci. Emerg. Technol. 2001, 1, 255–260. [Google Scholar] [CrossRef]
- Tranjan, B.C.; Cruz, A.G.; Walter, E.H.M.; Faria, J.A.F.; Bolini, H.M.A.; Moura, M.R.L.; Carvalho, L.M.J. Development of goat cheese whey-flavoured beverages. Int. J. Dairy Technol. 2009, 62, 438–443. [Google Scholar] [CrossRef]
- Cserhalmi, Z.; Sass-Kiss, Á.; Tóth-Markus, M.; Lechner, N. Study of pulsed electric field treated citrus juices. Innov. Food Sci. Emerg. Technol. 2006, 7, 49–54. [Google Scholar] [CrossRef]
- Nani, R.; Rizzolo, A.; Di Cesare, L.F.; Picariello, M. Nuove bevande a base di succhi limpidi. Nota 1. Miscele di succhi di mela e di ciliegia acida. Industrie Delle Bevande 1990, XIX, 402–405. [Google Scholar]
- Burdurlo, H.S.; Karadeniz, F. Effect of storage on nonenzymatic browning of apple juice concentrates. Food Chem. 2003, 80, 91–97. [Google Scholar] [CrossRef]
- Toribio, J.L.; Lozano, J.E. Nonenzymatic browning in apple juice concentrate during storage. J. Food Sci. 1984, 49, 889–892. [Google Scholar] [CrossRef]
- Cao, X.; Bi, X.; Huang, W.; Wu, J.; Hu, X.; Liao, X. Changes of quality of high hydrostatic pressure processed cloudy and clear strawberry juices during storage. Innov. Food Sci. Emerg. Technol. 2012, 16, 181–190. [Google Scholar] [CrossRef]
- Yaylayan, V. In search of alternative mechanisms for the Maillard reaction. Trends Food Sci. Technol. 1990, 1, 20–22. [Google Scholar] [CrossRef]
- Resnik, S.; Chirife, J. Effect of moisture content and temperature on some aspects of nonenzymatic browning in dehydrated apple. J. Food Sci. 1979, 44, 601–605. [Google Scholar] [CrossRef]
- Martins, S.I.F.S.; Jongen, M.F.W.; van Boekel, A.J.S.M. A review of Maillard reaction in food and implications to kinetic modeling. Trends Food Sci. Technol. 2001, 11, 364–373. [Google Scholar] [CrossRef]
- Buckow, R.; Kastell, A.; Terefe, N.S.; Versteeg, C. Pressure and temperature effects on degradation kinetics and storage stability of total anthocyanins in blueberry juice. J. Agric. Food Chem. 2010, 58, 10078–10084. [Google Scholar] [CrossRef] [PubMed]
- Ochoa, M.R.; Kesseler, A.G.; Vullioud, M.B.; Lozano, J.E. Physical and chemical characteristics of raspberry pulp: Storage effect on composition and color. Lebensm. Wiss. Technol. 1999, 32, 149–153. [Google Scholar] [CrossRef]
- Türkyilmaz, M.; Özkan, M. Kinetics of anthocyanin degradation and polymeric colour formation in black carrot juice concentrates during storage. Int. J. Food Sci. Technol. 2012, 47, 2273–2281. [Google Scholar] [CrossRef]
- Brownmiller, C.; Howard, L.R.; Prior, R.L. Processing and storage effects on monomeric anthocyanins, percent polymeric color, and antioxidant capacity of processed blueberry products. J. Food Sci. 2008, 73, H72–H79. [Google Scholar] [CrossRef] [PubMed]
- Srivastava, A.; Akoh, C.C.; Yi, W.; Fischer, J.; Krewer, G. Effect of storage conditions on the biological activity of phenolic compounds of blueberry extract packed in glass bottles. J. Agric. Food Chem. 2007, 55, 2705–2713. [Google Scholar] [CrossRef] [PubMed]
- De Rosso, V.V.; Mercadante, A.Z. Evaluation of colour and stability of anthocyanins from tropical fruits in an isotonic soft drink system. Innov. Food Sci. Emerg. Technol. 2007, 8, 347–352. [Google Scholar] [CrossRef]
- Hager, A.; Howard, L.H.; Prior, R.L.; Brownmiller, C. Processing and storage effects on monomeric anthocyanins, percent polymeric color, and antioxidant capacity of processed black raspberries products. J. Food Sci. 2008, 73, 134–140. [Google Scholar] [CrossRef]
- Chung, C.; Rojanasasithara, T.; Mutilangi, W.; McClements, D.J. Enhanced stability of anthocyanin-based color in model beverage systems through whey protein isolate complexation. Food Res. Int. 2015, 76, 761–768. [Google Scholar] [CrossRef] [PubMed]
- Chung, C.; Rojanasasithara, T.; Mutilangi, W.; McClements, D.J. Stability improvement of natural food colors: Impact of amino acid and peptide addition on anthocyanin stability in model beverages. Food Chem. 2017, 218, 277–284. [Google Scholar] [CrossRef] [PubMed]
- Cornwell, C.J.; Wrolstad, R.E. Causes of browning in pear juice concentrate during storage. J. Food Sci. 1981, 46, 515–518. [Google Scholar] [CrossRef]
- Cao, X.M.; Zhang, Y.; Zhang, F.S.; Wang, Y.T.; Yi, J.Y.; Liao, X.J. Effects of high hydrostatic pressure on enzymes, phenolic compounds, anthocyanins, polymeric color and color strawberry pulps. J. Sci. Food Agric. 2011, 91, 877–885. [Google Scholar] [CrossRef] [PubMed]
- Tsai, O.; Huang, H. Effect of polymerization on the antioxidant capacity of anthocyanins in Roselle. Food Res. Int. 2004, 37, 313–318. [Google Scholar] [CrossRef]
- Tsai, P.; Huang, H.; Huang, T. Relationship between anthocyanin patterns and antioxidant capacity in mulberry wine during storage. J. Food Qual. 2004, 27, 497–505. [Google Scholar] [CrossRef]
- Yilmaz, Y.; Toledo, R. Antioxidant activity of water-soluble Maillard reaction products. Food Chem. 2005, 93, 273–278. [Google Scholar] [CrossRef]
- Rizzolo, A.; Nani, R.; Mastellone, F. Studi sulla valorizzazione delle ciliegie acide. Produzione di succhi limpidi stabili. In Atti III Giornate Scientifiche S.O.I; Istituto di Coltivazioni Arboree, Università degli Studi: Palermo, Italy, 1996; pp. 367–368. [Google Scholar]
- Gierschner, K. The importance of the acids and their reaction during production concentration and storage of fruit juices. Flüssiges Obst. 1979, 8, 292–298. [Google Scholar]
- Spayd, S.E.; Nagel, C.W.; Hayrynen, L.D.; Drake, S.R. Color stability of apple and pear juices blended with fruit juices containing anthocyanins. J. Food Sci. 1984, 49, 411–414. [Google Scholar] [CrossRef]
Figure 1.
(a) Monomeric anthocyanin pigments (MAP); and (b) percent polymeric color (PPC) of mix-RCW drink after 15 and 150 days of storage. Data are expressed as the mean ± standard error (n = 6). *** Significance of Student’s t-test: exact p-value: <0.0001.
Figure 1.
(a) Monomeric anthocyanin pigments (MAP); and (b) percent polymeric color (PPC) of mix-RCW drink after 15 and 150 days of storage. Data are expressed as the mean ± standard error (n = 6). *** Significance of Student’s t-test: exact p-value: <0.0001.

Figure 2.
Sourness, sweetness, and saltiness scores for the apple-RCW and mix-RCW drinks after 15 and 150 days of storage. Data are expressed as the mean ± standard error (n = 20). * Significance of Student’s t-test: exact p-value: 0.029.
Figure 2.
Sourness, sweetness, and saltiness scores for the apple-RCW and mix-RCW drinks after 15 and 150 days of storage. Data are expressed as the mean ± standard error (n = 20). * Significance of Student’s t-test: exact p-value: 0.029.


Table 1.
Chemical composition, nitrogen distribution, and mineral composition of ricotta cheese whey (RCW).
Table 1.
Chemical composition, nitrogen distribution, and mineral composition of ricotta cheese whey (RCW).
| Chemical Composition (g/100 g) | Mineral Composition (mg/kg) | ||||||
|---|---|---|---|---|---|---|---|
| pH | 6.26 | Lactose | 3.76 | K | 1518 | P | 277 |
| Total solids | 5.39 | Glucose | - | Ca | 293 | Mg | 219 |
| Ash | 0.74 | Galactose | 0.02 | Fe | 0.49 | Cu | 0.06 |
| Fat | - | Citric acid | 0.15 | Mn | <0.01 | Se | 0.005 |
| Total proteins | 0.34 | Lactic acid | 0.05 | Na | 1260 | Zn | 0.30 |
| Nitrogen distribution | |||||||
| % | g/100 g | g/100 g | % | ||||
| NPN/NT | True protein (NT-NPN) × 6.38 | Denatured protein (NT-NCN) × 6.38 | α-la | β-lg | α-la + β-lg | CMP | Peptides |
| 64.8 | 0.12 | 0.01 | 0.018 | 0.021 | 27.5 | 26.4 | 46.1 |
NT = total nitrogen; NPN = non-protein-nitrogen; NCN = non-casein-nitrogen; α-la = α-lactalbumin; β-lg = β-lactoglobulin; CMP = casein macropeptide. Adapted from Monti et al., 2015, CREA [3] with permission from CREA.
Table 2.
Physicochemical parameters: pH, soluble solids content (SSC, g/100 g), titratable acidity (TA, meq/100 mL), color parameters (L* lightness; a* green-red; b* blue-yellow) of apple- and mix-RCW drinks after 15 and 150 days of storage.
Table 2.
Physicochemical parameters: pH, soluble solids content (SSC, g/100 g), titratable acidity (TA, meq/100 mL), color parameters (L* lightness; a* green-red; b* blue-yellow) of apple- and mix-RCW drinks after 15 and 150 days of storage.
| Sample | Storage | SSC | pH | TA | L* | a* | b* |
|---|---|---|---|---|---|---|---|
| Apple | 15 | 14.65 ± 0.04 | 3.70 ± 0.02 | 6.54 ± 0.08 | 52.58 ± 0.17 | 2.73 ± 0.06 | 27.01 ± 0.15 |
| 150 | 14.65 ± 0.06 | 3.56 ± 0.04 | 7.05 ± 0.07 | 48.51 ± 0.33 | 4.56 ± 0.08 | 26.58 ± 0.25 | |
| p-value | ns | 0.011 | 0.0007 | <0.0001 | <0.0001 | ns | |
| Mix | 15 | 14.46 ± 0.04 | 3.32 ± 0.01 | 11.79 ± 0.01 | 24.97 ± 0.02 | 4.14 ± 0.11 | 0.57 ± 0.03 |
| 150 | 14.45 ± 0.04 | 3.25 ± 0.01 | 11.86 ± 0.05 | 24.70 ± 0.10 | 4.04 ± 0.06 | 0.62 ± 0.02 | |
| p-value | ns | 0.002 | ns | 0.023 | ns | ns |
Data are expressed as the mean ± standard error (n = 6). p-value, significance of Student’s t-test: exact p-value for significant test, ns for not significant test.
Table 3.
Total phenolics content (TPC-mg GAE/100 mL) and antioxidant capacity (AntOx-mg GAE/100 mL) of apple- and mix-RCW drinks after 15 and 150 days of storage.
Table 3.
Total phenolics content (TPC-mg GAE/100 mL) and antioxidant capacity (AntOx-mg GAE/100 mL) of apple- and mix-RCW drinks after 15 and 150 days of storage.
| Sample | Storage | TPC | AntOx |
|---|---|---|---|
| Apple | 15 | 40.91 ± 0.56 | 2.73 ± 0.03 |
| 150 | 35.44 ± 0.67 | 2.97 ± 0.05 | |
| p-value | <0.0001 | 0.0027 | |
| Mix | 15 | 161.93 ± 0.80 | 15.62 ± 0.21 |
| 150 | 116.81 ± 3.00 | 15.69 ± 0.07 | |
| p-value | <0.0001 | ns |
Data are expressed as the mean ± standard error (n = 6). p-value, significance of Student’s t-test: exact p-value for significant test, ns for not significant test.
Table 4.
Amounts of sugars (g/100 mL) and organic acids (mg/100 mL) of apple- and mix-RCW drinks after 15 and 150 days of storage.
Table 4.
Amounts of sugars (g/100 mL) and organic acids (mg/100 mL) of apple- and mix-RCW drinks after 15 and 150 days of storage.
| Apple | p-Value | Mix | p-Value | |||
|---|---|---|---|---|---|---|
| Sugars | 15 | 150 | 15 | 150 | ||
| Sucrose | 1.35 ± 0.03 | 0.94 ± 0.01 | <0.0001 | 0.75 ± 0.05 | 0.34 ± 0.01 | <0.0001 |
| Glucose | 3.44 ± 0.05 | 3.74 ± 0.04 | 0.0011 | 4.63 ± 0.14 | 4.48 ± 0.03 | ns |
| Fructose | 7.39 ± 0.09 | 7.70 ± 0.16 | ns | 7.68 ± 0.19 | 7.39 ± 0.04 | ns |
| Sorbitol | 0.43 ± 0.01 | 0.42 ± 0.02 | ns | 0.25 ± 0.01 | 0.24 ± 0.01 | ns |
| Lactose | 0.86 ± 0.02 | 0.80 ± 0.02 | ns | 0.83 ± 0.01 | 0.85 ± 0.04 | ns |
| Organic acids | ||||||
| Malic acid | 523.45 ± 9.82 | 484.14 ± 1.33 | 0.0027 | 475.02 ± 9.94 | 401.43 ± 3.93 | <0.0001 |
| Lactic acid | 136.98 ± 1.20 | 122.09 ± 0.72 | <0.0001 | 146.24 ± 0.74 | 120.34 ± 1.88 | <0.0001 |
| Citric acid | 46.13 ± 0.27 | 45.96 ± 0.63 | ns | 483.55 ± 8.99 | 445.70 ± 0.95 | 0.0019 |
| Fumaric acid | 0.236 ± 0.005 | 0.184 ± 0.002 | <0.0001 | 0.315 ± 0.003 | 0.266 ± 0.004 | <0.0001 |
Data are expressed as the mean ± standard error (n = 6). p-value, significance of Student’s t-test: exact p-value for significant test, ns for not significant test.
Table 5.
Pleasantness of color, odor, aroma, and overall acceptability for the apple-RCW and mix-RCW drinks after 15 and 150 days of storage.
Table 5.
Pleasantness of color, odor, aroma, and overall acceptability for the apple-RCW and mix-RCW drinks after 15 and 150 days of storage.
| Sample | Storage | Color Pleasantness | Odor Pleasantness | Aroma Pleasantness | Overall Acceptability |
|---|---|---|---|---|---|
| Apple | 15 | 75.8 ± 3.36 | 73.5 ± 5.16 | 63.9 ± 5.51 | 57.9 ± 4.49 |
| 150 | 70.9 ± 3.73 | 72.1 ± 3.18 | 65.5 ±3.88 | 63.2 ± 4.01 | |
| p-Value | ns | ns | ns | ns | |
| Mix | 15 | 82.1 ± 3.20 | 74.6 ± 5.16 | 70.1 ± 5.05 | 69.2 ± 6.0 |
| 150 | 78.0 ± 3.39 | 70.7 ± 2.87 | 80.7 ± 3.75 | 78.3 ± 3.92 | |
| p-value | ns | ns | ns (0.09) | ns |
Data are expressed as the mean ± standard error (n = 20). p-value, significance Student’s t-test: exact p-value for significant test, ns for not significant test.
Table 6.
Sensory evaluation of the apple- and mix-RCW drinks by triangle test after 150 days of storage.
Table 6.
Sensory evaluation of the apple- and mix-RCW drinks by triangle test after 150 days of storage.
| Test | Drink | Correct/Total Responses | p-Value |
|---|---|---|---|
| 1 | Apple | 7/10 | * |
| 1 | Mix | 6/10 | ns |
| 2 | Apple | 6/13 | ns |
| 2 | Mix | 9/13 | ** |
| 1 + 2 | Apple | 13/23 | * |
| 1 + 2 | Mix | 15/23 | ** |
p-value, significance of F ratio: * p < 0.05, ** p < 0.01, ns = not significant.
© 2018 by the authors. Licensee MDPI, Basel, Switzerland. This article is an open access article distributed under the terms and conditions of the Creative Commons Attribution (CC BY) license (http://creativecommons.org/licenses/by/4.0/).
Share and Cite
MDPI and ACS Style
Cortellino, G.; Rizzolo, A. Storage Stability of Novel Functional Drinks Based on Ricotta Cheese Whey and Fruit Juices. Beverages 2018, 4, 67. https://0-doi-org.brum.beds.ac.uk/10.3390/beverages4030067
AMA Style
Cortellino G, Rizzolo A. Storage Stability of Novel Functional Drinks Based on Ricotta Cheese Whey and Fruit Juices. Beverages. 2018; 4(3):67. https://0-doi-org.brum.beds.ac.uk/10.3390/beverages4030067
Chicago/Turabian StyleCortellino, Giovanna, and Anna Rizzolo. 2018. "Storage Stability of Novel Functional Drinks Based on Ricotta Cheese Whey and Fruit Juices" Beverages 4, no. 3: 67. https://0-doi-org.brum.beds.ac.uk/10.3390/beverages4030067
Note that from the first issue of 2016, this journal uses article numbers instead of page numbers. See further details here.