Article

Oxygen Consumption by Red Wines under Different Micro-Oxygenation Strategies and Q. Pyrenaica Chips. Effects on Color and Phenolic Characteristics

Grupo UVaMOX, E.T.S. Ingenierías Agrarias, Universidad de Valladolid, Avda. Madrid 50, 34004 Palencia, Spain
*
Author to whom correspondence should be addressed.
Submission received: 9 August 2018 / Revised: 31 August 2018 / Accepted: 5 September 2018 / Published: 6 September 2018
(This article belongs to the Special Issue Wine Aging Technologies)

Abstract

:
The use of alternative oak products (AOP) for wine aging is a common practice in which micro-oxygenation (MOX) is a key factor to obtain a final wine that is more stable over time and with similar characteristics as barrel-aged wines. Therefore, the oxygen dosage added must be that which the wine is able to consume to develop correctly. Oxygen consumption by red wine determines its properties, so it is essential that micro-oxygenation be managed properly. This paper shows the results from the study of the influence on red wine of two different MOX strategies: floating oxygen dosage (with dissolved oxygen setpoint of 50 µg/L) and fixed oxygen dosage (3 mL/L·month). The results indicated that the wines consumed all the oxygen provided: those from fixed MOX received between 3 and 3.5 times more oxygen than the floating MOX strategy, the oxygen contribution from the air entrapped in the wood being more significant in the latter. Wines aged with wood and MOX showed the same color and phenolic evolution as those aged in barrels, demonstrating the importance of MOX management. Despite the differences in the oxygen consumed, it was not possible to differentiate wines from the different MOX strategies at the end of the aging period in contact with wood.

Graphical Abstract

1. Introduction

Oxygen has a fundamental role in wine technology [1]. It plays an important role in the different processes that take place during wine-making and aging [2,3,4,5,6]. Oak barrel aging is traditionally used in wine-making to produce high quality wines, since the contact between wine and oxygen in the oak barrels influences its composition.
In order to shorten time and reduce costs [7,8,9,10], the use of alternative oak products (AOP) is widespread. Although its combination with the micro-oxygenation (MOX, small oxygen dosage) technique has scarcely been used until now [11,12], it is known that its results essential to reproducing the behavior, and hence the benefits, of the barrel. Since micro-oxygenation is the controlled introduction of oxygen into wine, the dosage and duration of oxygen addition are the critical points in MOX treatment, and positive effects can be obtained when the treatment is applied correctly. This can be acquired by specifying the oxygen management for each kind of wine, alternative oak product (chips, cubes and staves, among others) and also for the botanical origin of each wood [13]. Active micro-oxygenation could be accomplished in two ways: (i) by means of continually adding small fixed dosages of oxygen, known as fixed MOX dosage; and (ii) by means of an adaptive dosage at the level of dissolved oxygen (DO) present in the wine, known as floating MOX dosage. The latter strategy consists of an adaptive oxygen dosage to achieve the desired amount of DO in the wine (setpoint). This content can satisfy the demand throughout the aging process, and must be maintained throughout it to ensure the best integration of wood and wine. Thus, the dosage can be regulated by comparing the reading of each DO measurement with the reference of the DO level.
Recently, it has been demonstrated that, when oak chips were flooded with wine, they would provide 0.135 mg of oxygen per gram of oak chips [14]. In wine aging processes, the oxygen contained in alternative products (oak chips, staves, cubes, etc.), added to wine, has to be estimated correctly. The wine needs to count on the oxygen necessary to evolve appropriately during these processes of aging with wood products, so the dosage of oxygen provided by the wood itself needs to be added to that added by active or passive MOX [15].
Quercus pyrenaica wood’s effectiveness in wine aging has meant that it is considered highly advisable as a source of barrels [16]. However, its forest management does not allow it to be supplied to the barrel manufacture industry, but as a source for obtaining alternative products [11,17,18,19,20,21].
The main goal of this work was to study the influence on red wine of two different strategies of MOX/floating oxygen dosage (with a dissolved oxygen setpoint of 50 µg/L) and fixed oxygen dosage (3 mL/L·month), together with the effect over time of adding chips of Q. pyrenaica oak wood during aging: all at the beginning, or fractionations at two different times during the process.

2. Materials and Methods

2.1. Wood Samples

Oak heartwood in the form of chips (1 cm × 0.5 cm, approximately) from Q. pyrenaica trees, grown in Salamanca (Spain) and provided by CESEFOR (Soria, Spain), were used after natural seasoning in climatic conditions. The wood was then toasted in an industrial-scale convection oven located in the experimental cellar of the University of Valladolid (Palencia, Spain), with supports specially adapted to special oven trays for chips (BINDER APT-COM V 1.0., New York, NY, USA) at 190 °C for 10 min.

2.2. Wine

A young red wine made from a red single-variety grape (cv. Tinta del País) belonging to the Spanish appellation of origin Ribera del Duero, and produced on an industrial scale in 2008, was treated using different MOX aging systems for a period of 4 months. The chemical parameters of the wine before aging were: total acidity 6.1 g/L (expressed as tartaric acid), volatile acidity 0.69 g/L (expressed as acetic acid), sugars 1.33 g/L, degree of alcohol 14.59%, color intensity 21, and total polyphenol 2.2 g/L (expressed as gallic acid). These parameters were evaluated before the wine was transferred into tanks, and also during aging, in accordance with International Organization of Vine and Wine (OIV) methods (OIV, 1990).
The wines were transferred into the tanks and samples were taken from each after 20, 48, 76, 97 and 111 days’ aging. After 111 days, the wines were taken out of the tanks and bottled separately. Samples were taken periodically from each aging system.

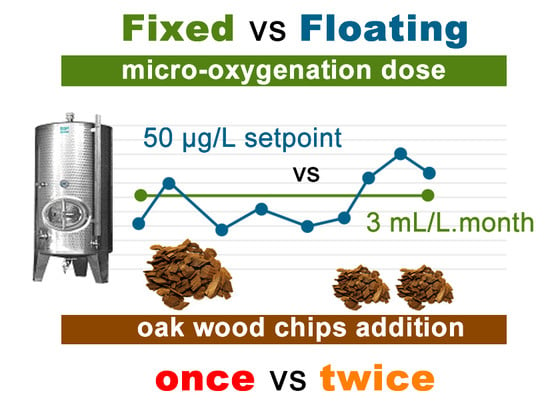
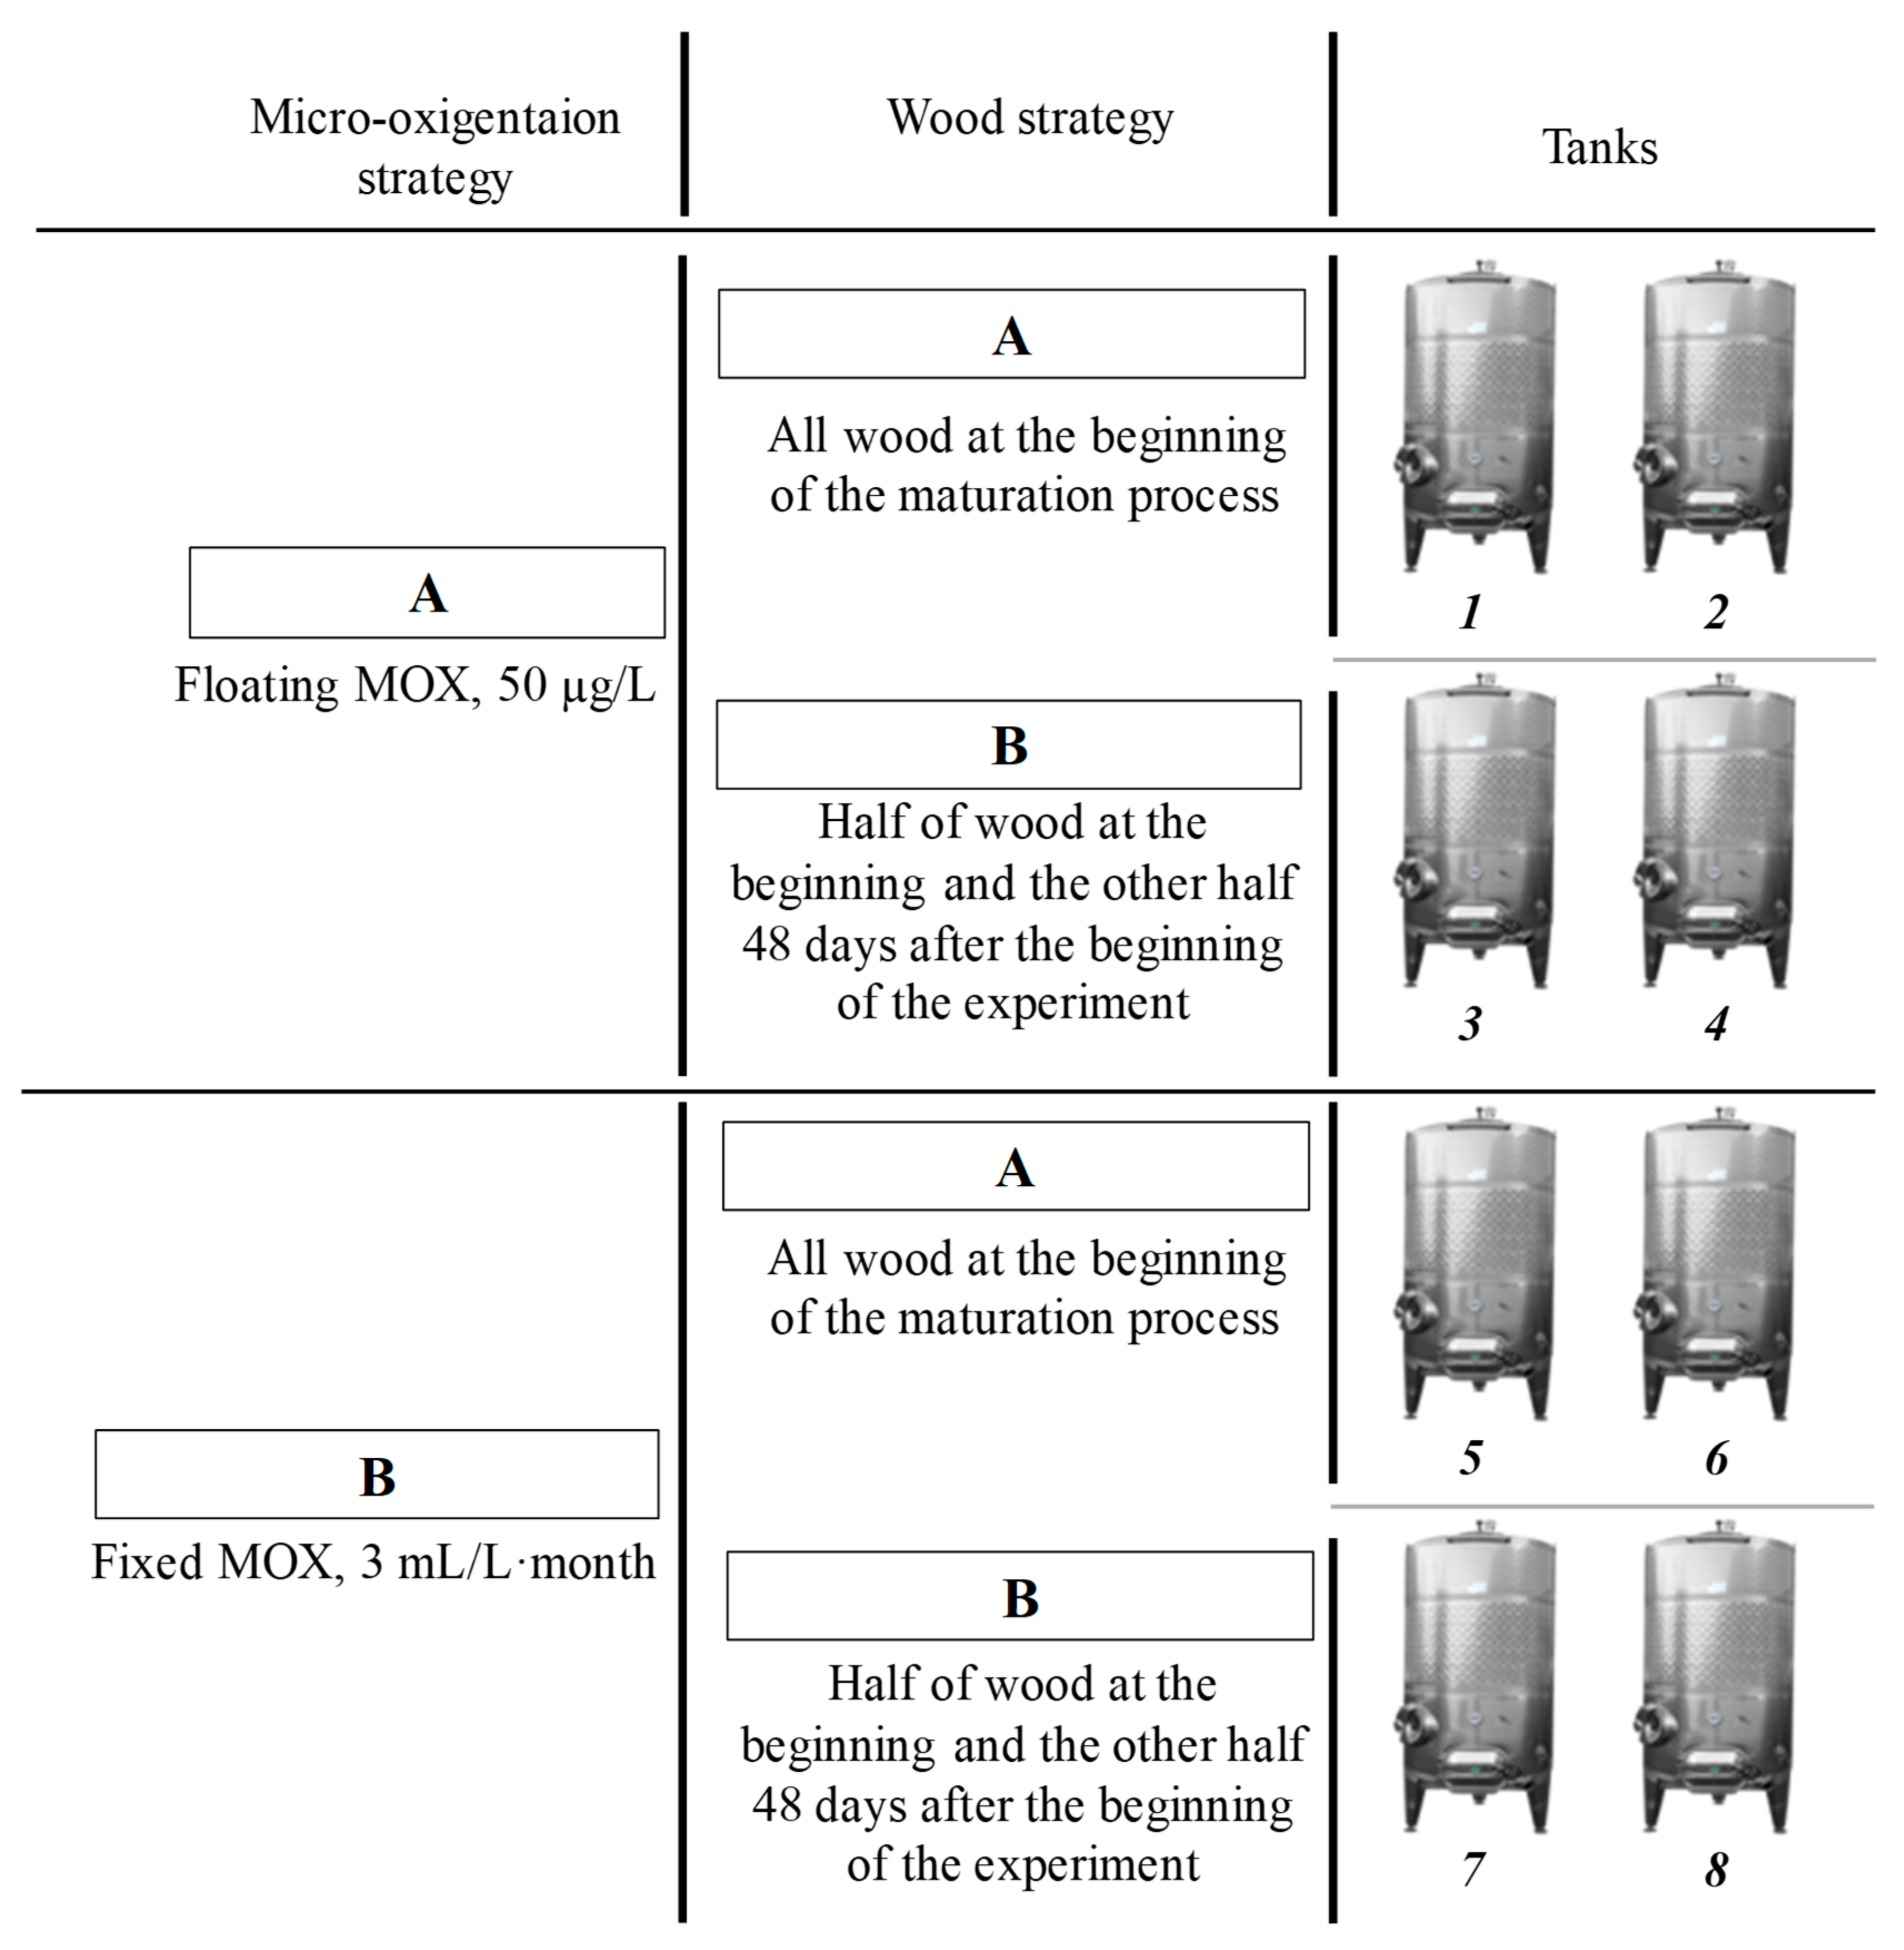
2.3. Wood and Micro-Oxygenation (MOX) Strategies

Oak chips were added to the tanks at two different moments: in half of them, all the wood was added at the beginning of the aging process, whereas in the other half of the tanks, the wood was added twice, half at the beginning and the other half 48 days after the beginning of the experiment, coinciding with a wine sampling.
The quantity of oak chips added was calculated using the surface/volume relation of 225-L barrels in order to determine the quantity of oak chips necessary to reproduce the same relation in 225-L stainless steel tanks [22]. The oak chip dosage was determined by their weight distributed over a known surface: 1250 g of oak chips were used for each tank. Two different strategies were applied: A—all oak chips at the beginning of the experiment; and B—half of the oak chips at the beginning and the other half 48 days later. All the tanks with oak chips were micro-oxygenated using an Eco2 device (Oenodev, Maumusson-Laguian, France) and ceramic diffusers. The MOX dosage was: A—floating MOX strategy (FMOX), in which the setpoint was set at 50 µg/L; B—fixed MOX strategy, with 3 mL/L·month. Additionally, the quantity of air in the oak chips’ interior was taken into account, since that is an additional oxygen contribution, which can be estimated at 0.135 mg oxygen per gram of oak chips [14]. The quantity of oxygen contributed during initial filling of the tanks was added and established as 1 mg/L.
The wine was stored in stainless steel 225 L tanks with oak chips and MOX (Figure 1). Every aging system was replicated, thus requiring eight stainless steel tanks as follows: tanks 1 and 2 with A wood strategy and A MOX dosage [13], tanks 3 and 4 with B wood strategy and A MOX dosage, tanks 5 and 6 with A wood strategy and B MOX dosage, and tanks 7 and 8 with B wood strategy and B MOX dosage. The wines were matured in the same aging room in the experimental cellar of the University of Valladolid (Palencia, Spain), where humidity and temperature conditions were controlled at 65–75% and 15–16 °C, ensuring MOX in the best way over the aging period [3,23].
The dosages were checked daily with each DO measurement and, in the case of the floating MOX strategy, adjusted, increased or decreased according to the DO level of each reading, always searching for the DO setpoint.

2.4. Oxygen Determination

The DO measurement system used was capable of measuring oxygen concentrations at μg/L (ppb) level. An Electrochemical system was selected, model 3650/111 Micrologger O2 (Orbisphere Laboratories, Geneva, Switzerland) and equipped with a sensor measuring from 0.1 μg/L (ppb) to 80 mg/L (ppm) with an accuracy ± 0.001 mg/L, and a detection limit from 0.1 μg/L using the most sensitive membrane. It was fitted in a stainless-steel flow chamber. The conditions of the micro-oxygenated wines were not altered because a non-intrusive pumping system, based on a small peristaltic reversible turn pump equipped with a Tygon® tube, was used. The flow rate was 10 mL/min in order to avoid the influence of any oxygen consumption by the probe or oxygen diffusion when low oxygen concentrations of samples needed to be measured at very low flow rates (≤0.1 mL/min). This enabled the use of a tangential flux, essential for correctly measuring the DO [24]. The whole system was argon-inerted and equipped with quick-connectors that linked all the tanks with non-permeable flexible tubing in order to avoid any interference. Wine samplings were collected at mid-height from each tank. Wine was force-returned to the tanks with argon, in order to guarantee no oxygenation of the system at any time. This procedure was previously tested to verify the absence of oxygen permeability through the walls of the tubing or the fittings [23].
The electrochemical equipment was calibrated in air as a valid option before every reading; in addition, zero calibration was performed in electrochemical systems between every tank reading when the installation was purged with argon to return the wine to the tank. The sensors were chemically reconditioned and the membranes replaced if the zero calibration was above 2 μg/L [25]. A detailed calibration in air-saturated water at a constant temperature, as described in other studies, was carried out monthly [26].

2.5. Consumed Oxygen Determination

The oxygen consumed by the wine aged in stainless steel tanks was calculated every reading day by the difference between the oxygen dosage and the remaining dissolved oxygen at every moment.

2.6. Wine Analysis

2.6.1. Phenolic, Anthocyanin, and Tannin Global Parameters Determination

Phenolic compounds, such as total phenols (PT, as mg/L of gallic acid), were determined by the method of Folin-Ciocalteu [27], and low polymerized phenols (LPP, as mg/L of gallic acid) were determined by Masquelier et al. [28]. High polymerized phenols (HPP, as mg/L of gallic acid) were calculated by the difference between PT and LPP. Total anthocyanins (ACY, as mg/L of malvidin-3-O-glucoside) were analyzed by means of color changes according to the pH of the medium [29], tannins (TAN, as g/L of cyanidin chloride) using the Ribéreau-Gayón and Stonestreet method [30] and, finally, catechins (CAT, as mg/L of D-catechin) were analyzed following the method described by Swain and Hillis [31]. Orthodiphenols (OD, as mg/L of D-catechin) were analyzed by Paronetto [29]. The ionization index (ION-I) was analyzed by Somers and Evans method [32] and gelatin index (GEL-I), ethanol index (EtOH-I) and hydrochloric acid index (HCl-I) by Ribéreau-Gayón [33].

2.6.2. Color Analysis

Color intensity was determined by measuring absorbance at 420, 520, and 620 nm in a 1 mm cell. Other variables calculated were red, yellow, and blue percentages, according to Glories [34].
Spectral readings (transmittance every 10 nm over the visible spectrum, 380–770 nm, and absorbance measurements at 420, 520, and 620 nm) were performed with a PerkinElmer’s LAMBDA 25 UV/vis Spectrophotometer (Waltham, MA, USA), using 1 mm path length cuvette. All the parameters were measured in duplicate in every sample.

2.6.3. Copigmentation Parameter Determination

Copigmentation was determined according to the method proposed by Boulton [35], via the following parameters, where the color was due to (TA) total anthocyanins; (COP) copigmentation; (AL) free anthocyanins; (PP) polymeric pigment; (FC) the estimation of the content of flavanol cofactors; and (TP) the estimation of the content of total phenols (monomers and tannins).

2.6.4. Anthocyanin Individual Determination

Anthocyanins were analyzed by HPLC-DAD according to del Alamo Sanza et al. [8], as mg/L of malvidin-3-O-glucoside: delphinidin-3-O-glucoside (Df-3-Gl), cyanidin-3-O-glucoside (Cy-3-Gl), petunidin-3-O-glucoside (Pt-3-Gl), peonidin-3-O-glucoside (Pn-3-Gl), malvidin-3-O-glucoside (Mv-3-Gl), vitisin A (vitA); acetyl derivates: peonidin-3-O-acetylglucoside (Pn-3-Gl-Ac) and malvidin-3-O-acetylglucoside (Mv-3-Gl-Ac); coumaryl derivates: delphinidin-3-O-p-coumarylglucoside (Df-3-Gl-Cm), cyanidin-3-O-p-coumarylglucoside (Cy-3-Gl-Cm), petunidin-3-O-p-coumarylglucoside (Pt-3-Gl-Cm), malvidin-3-O-p-coumarylglucoside cis-C and trans-T (Mv-3-Gl-Cm); and ethyl-linked malvidin-3-O-glucoside-ethyl-epicatechin (Mv-3-gl-Ethyl).

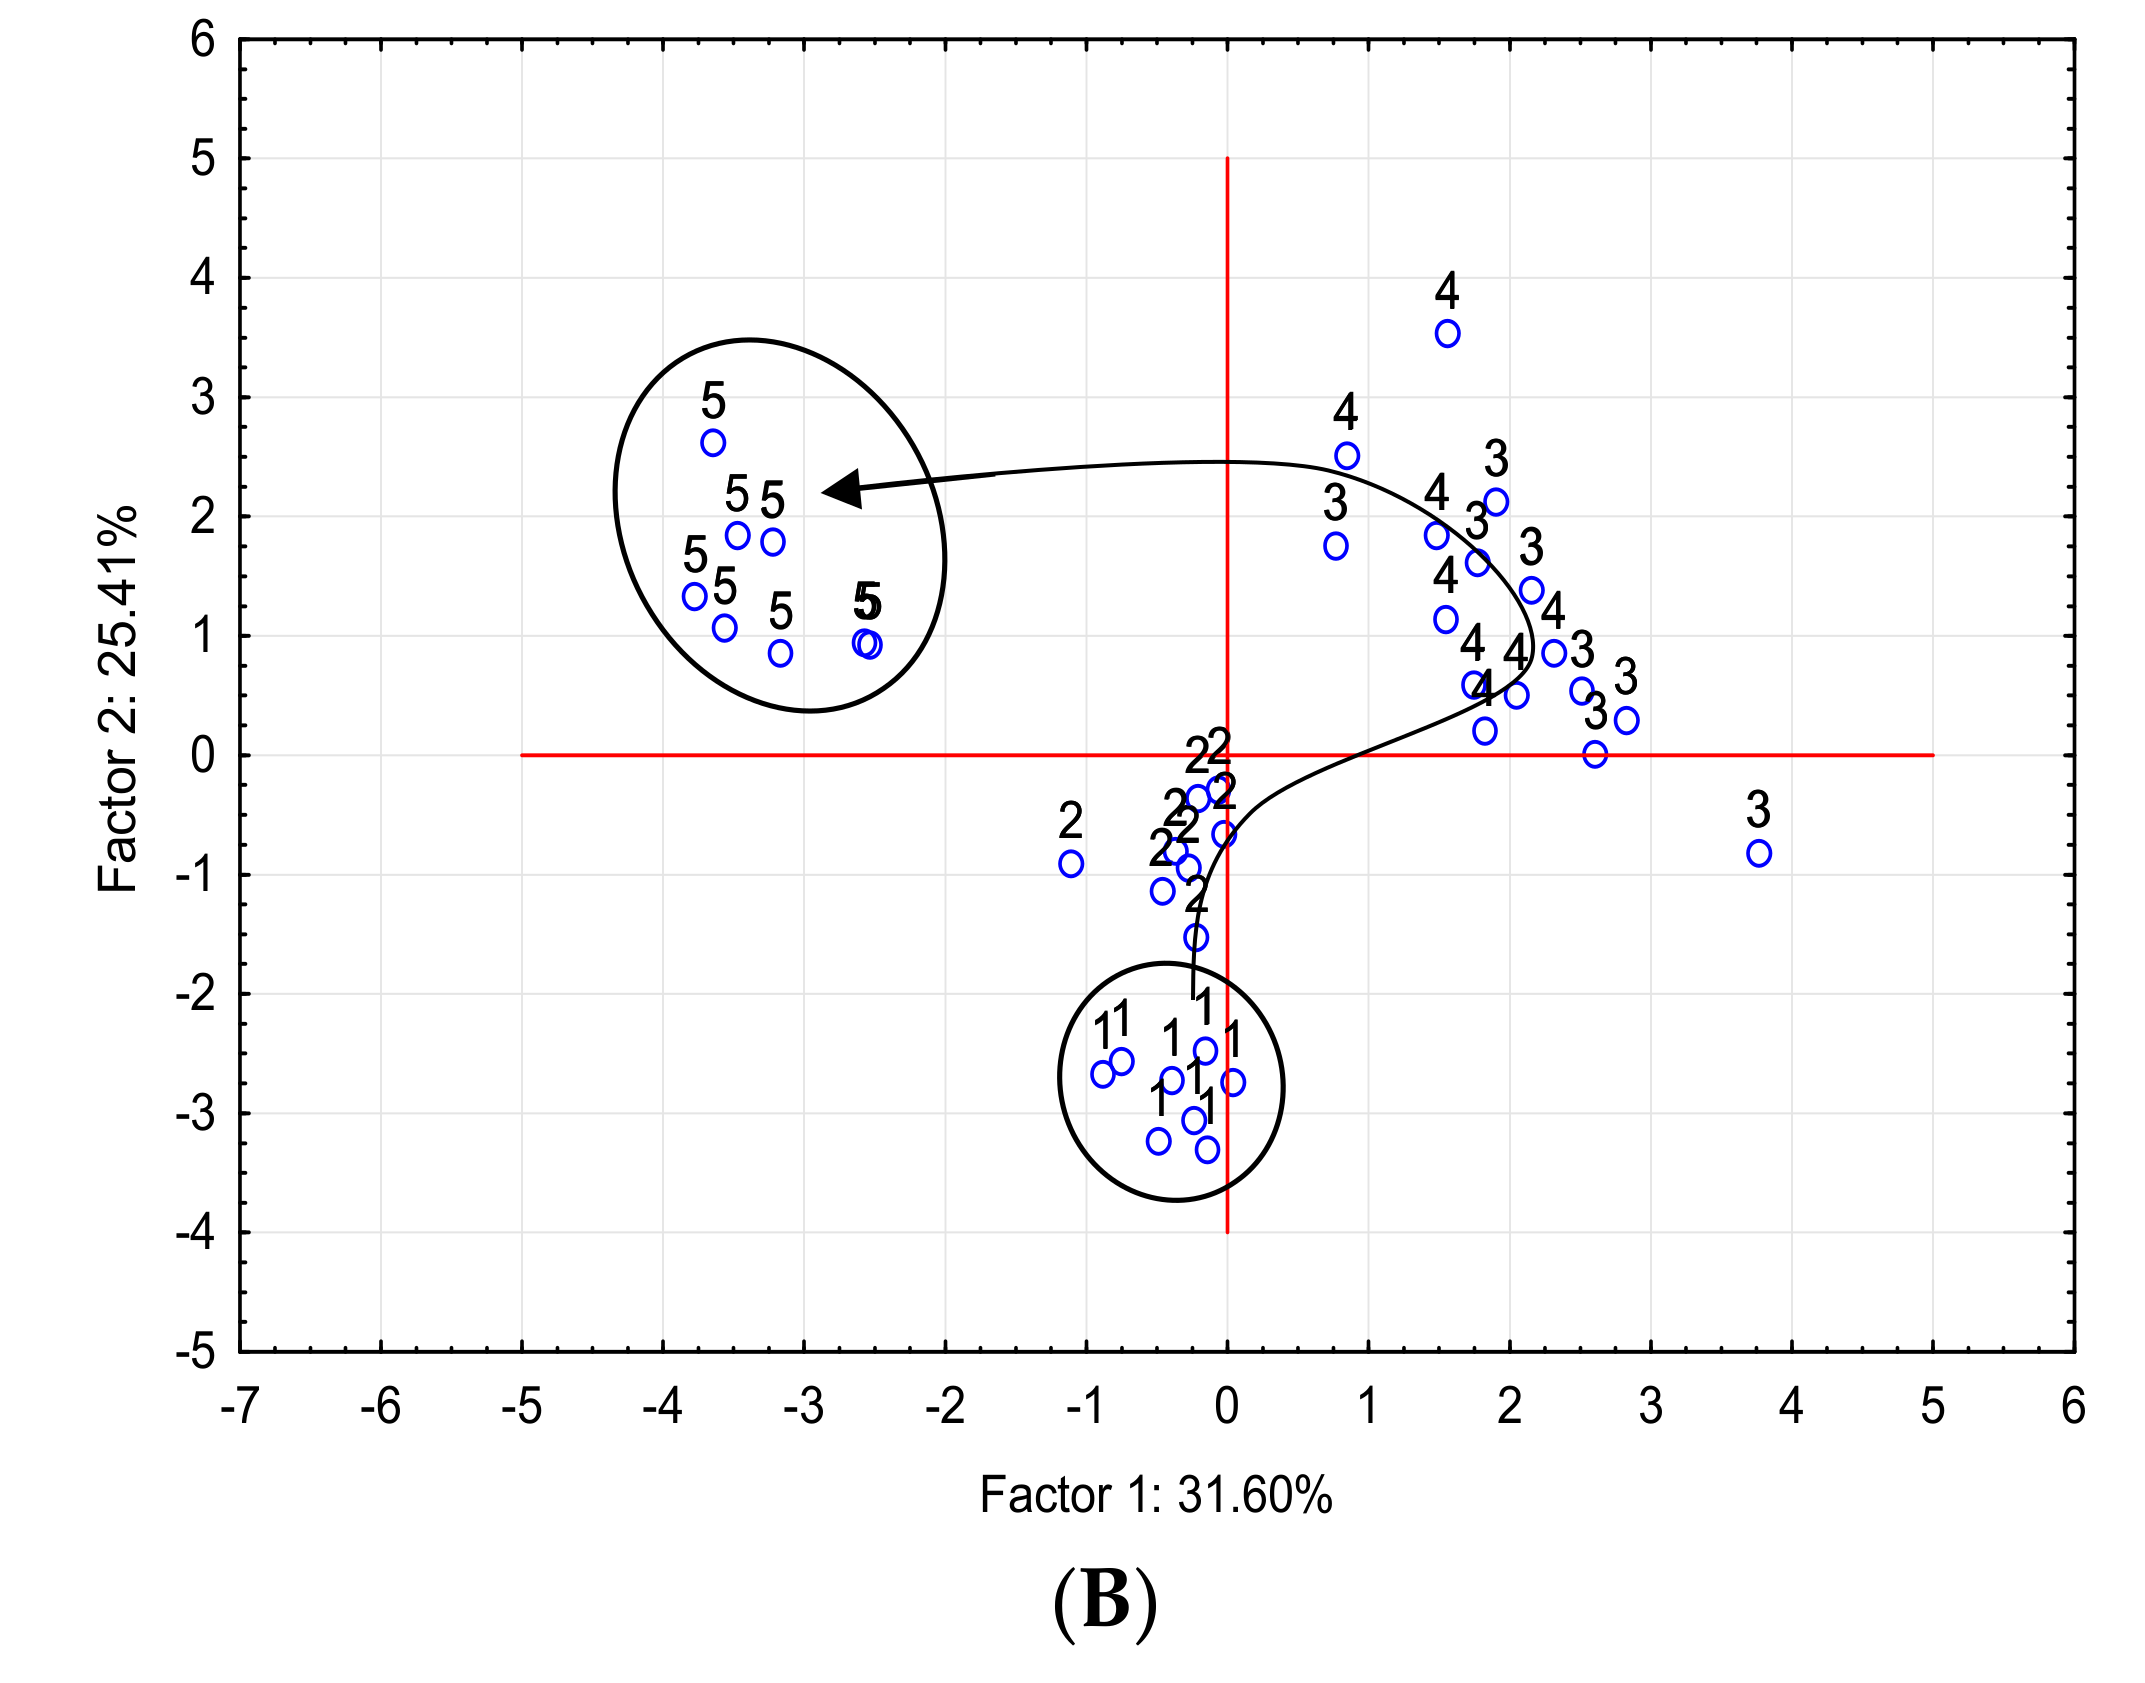
2.7. Statistical Analysis

Correlation coefficients and principal component analysis were performed using the Statgraphics Centurion XVII statistical program (version XVII; StatPoint, Inc., Warrenton, VA, USA).

3. Results and Discussion

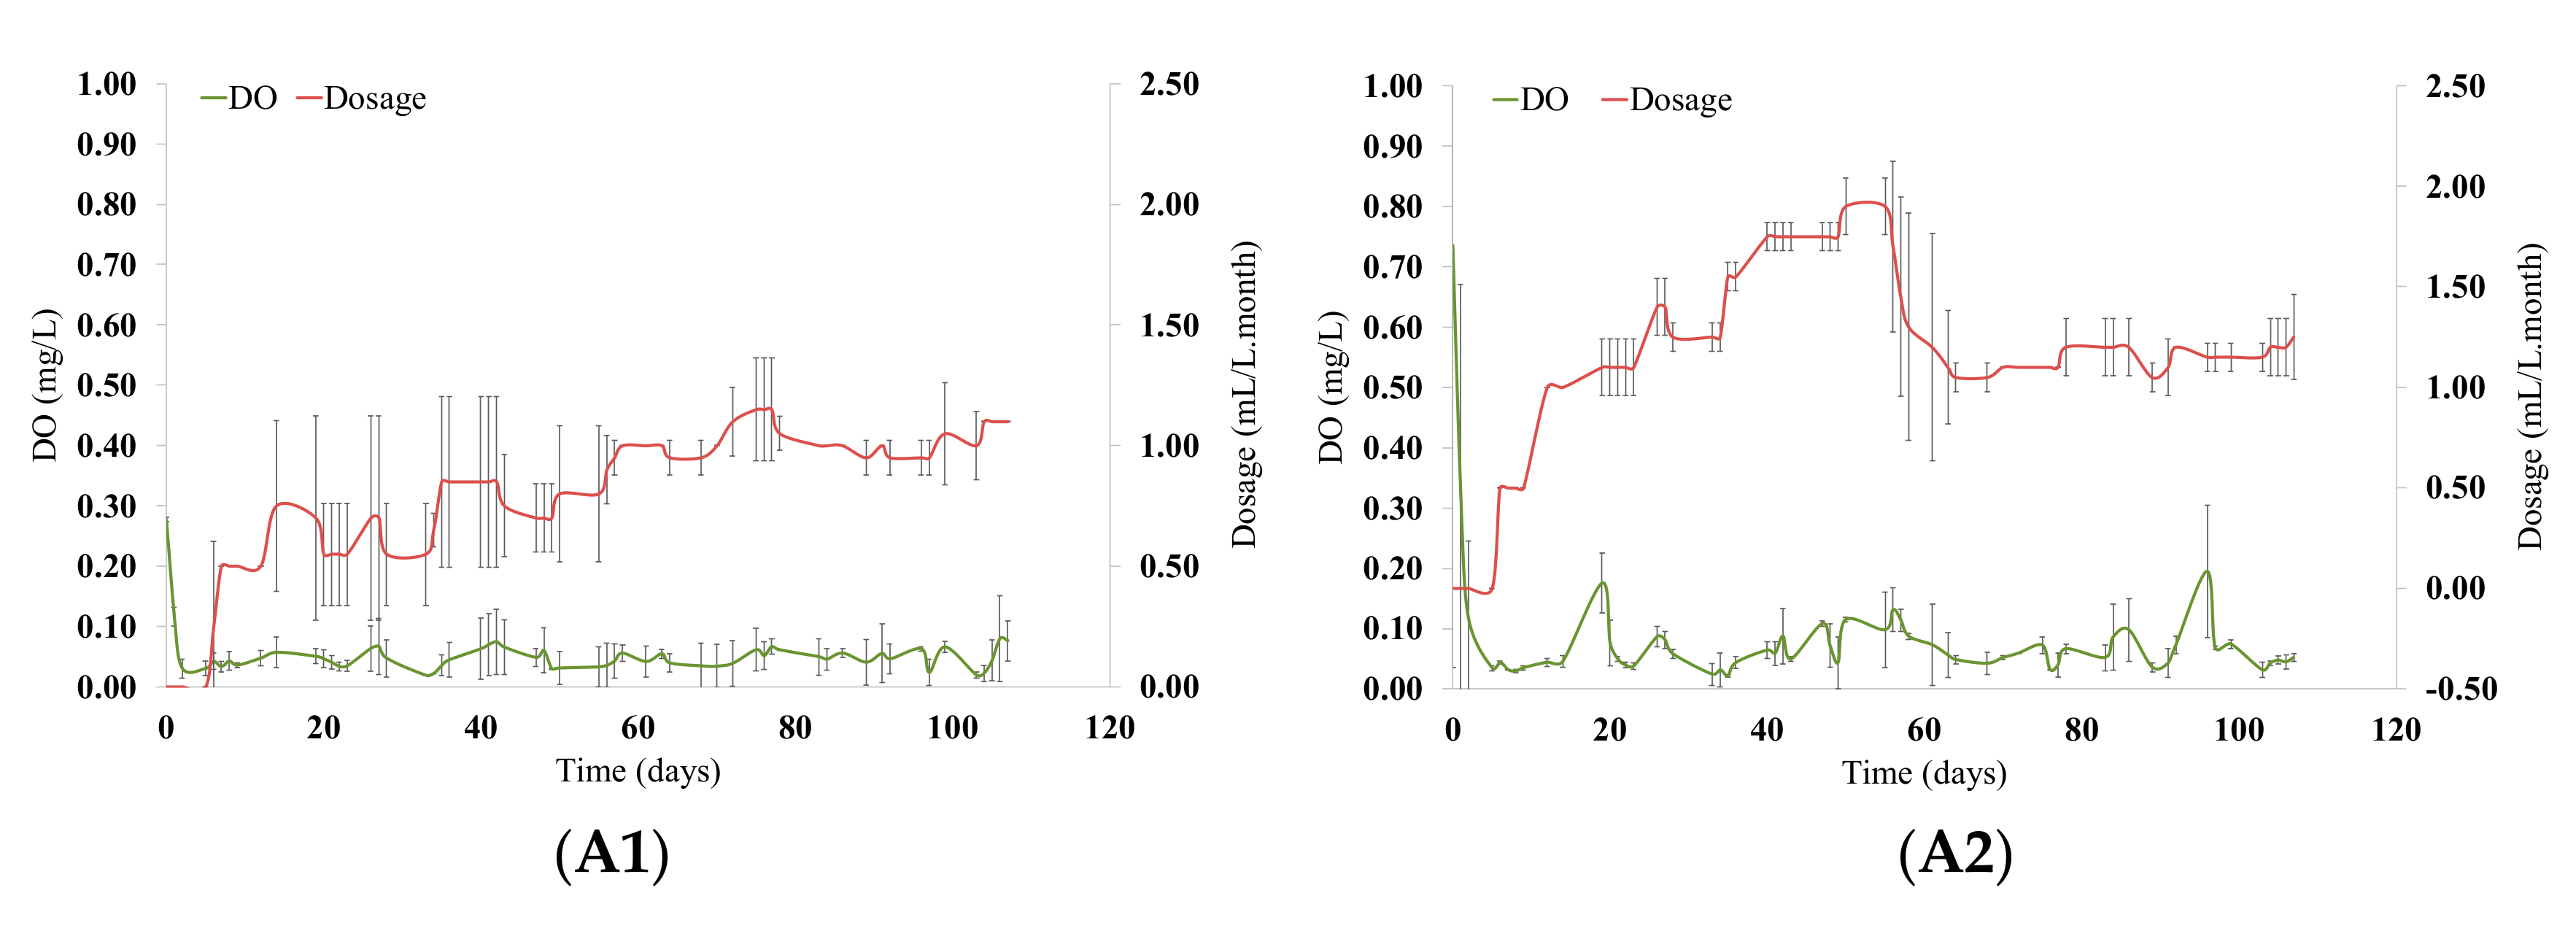
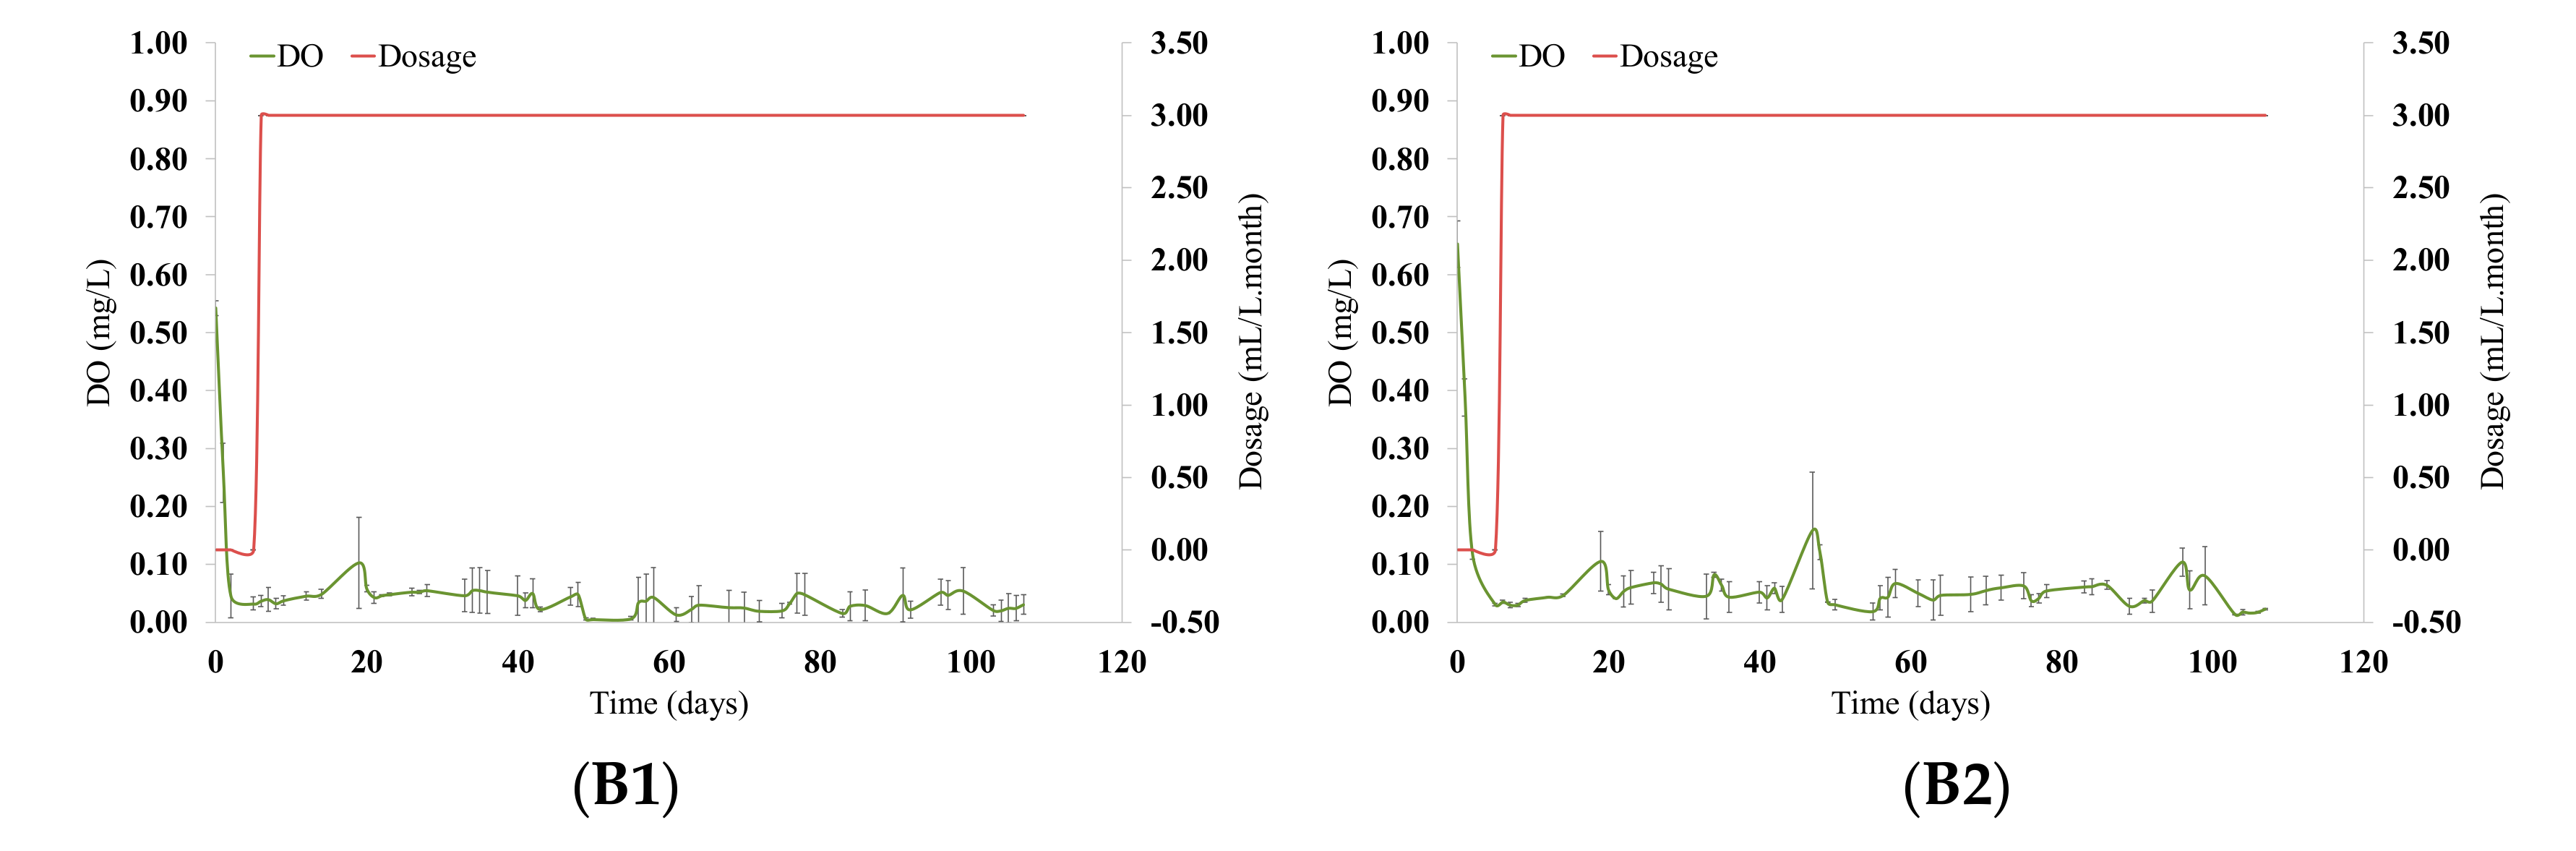
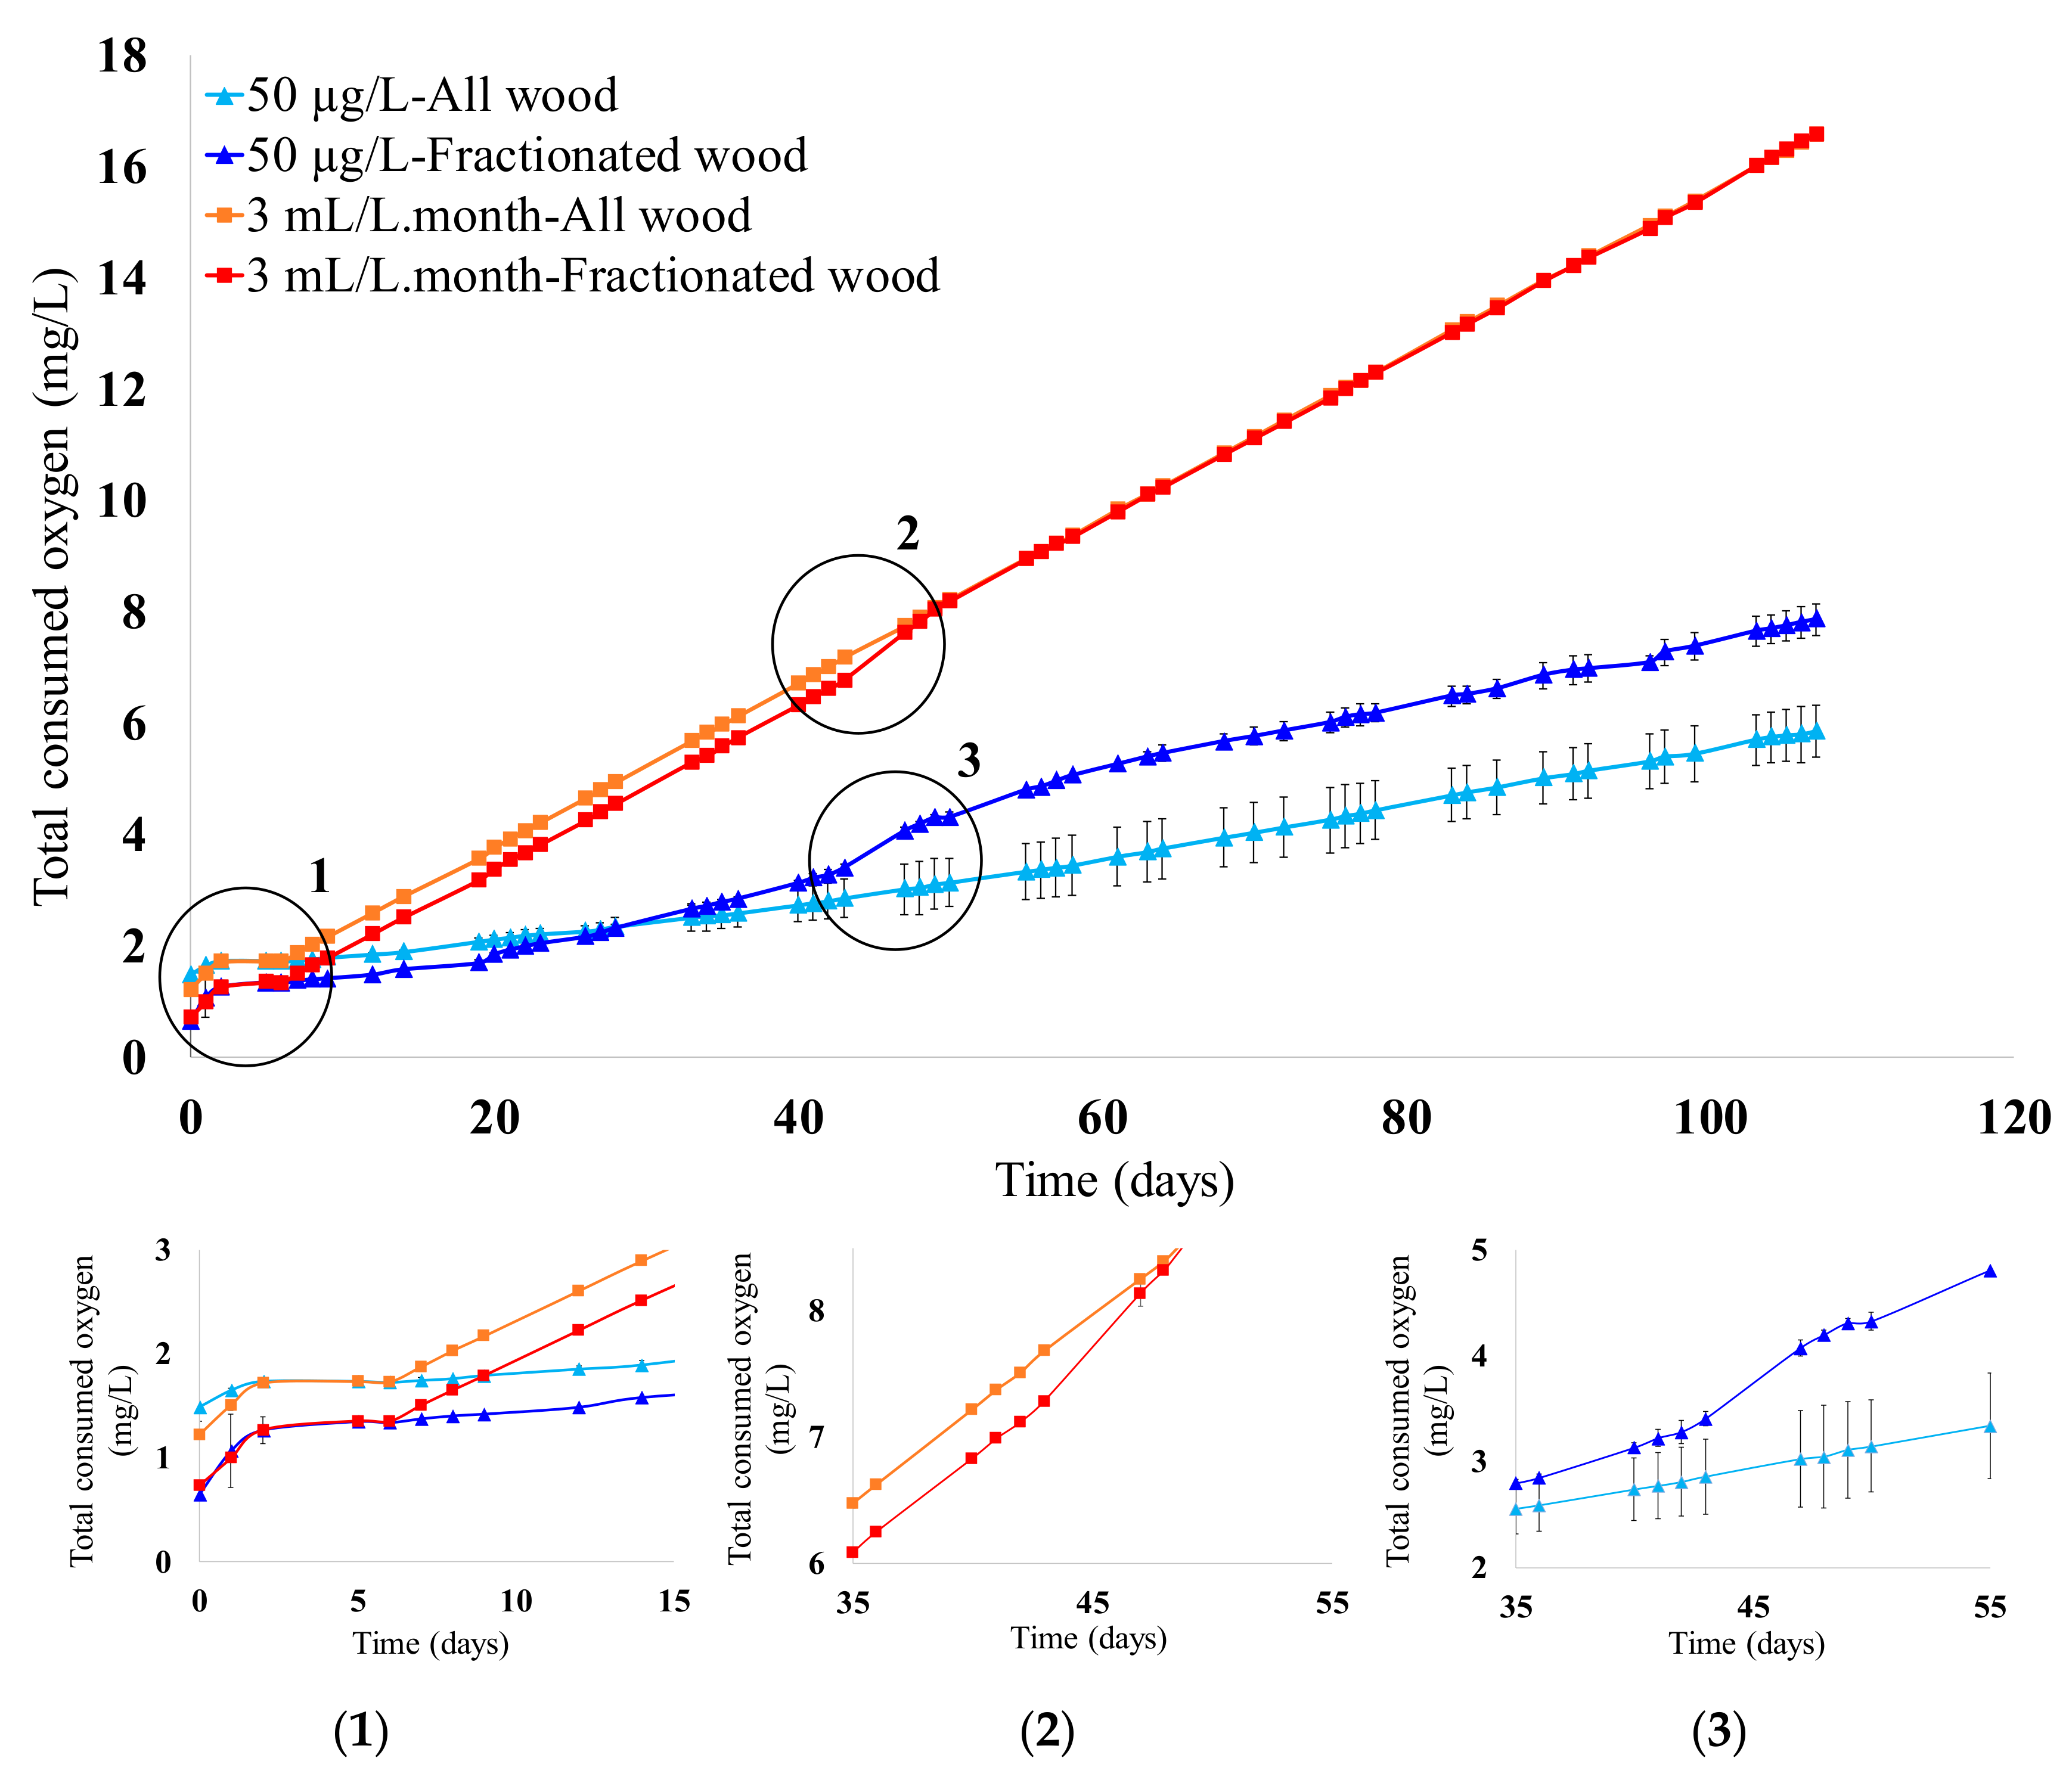
3.1. Micro-Oxygenation Strategy and Evolution of Oxygen Consumption in Wines

The two micro-oxygenation (MOX) strategies selected would be approximated: the normal published oak barrel oxygen ingress rates (50 µg/L) [13,26] and another higher one (3 mL/L·month). Throughout the aging period (111 days), continuous measurements of dissolved oxygen (µg/L) were carried out in each tank. Figure 2 shows the evolution of this dissolved oxygen in wine for each combination of MOX/wood strategy, together with the dosage applied in each one. The difference between a floating and fixed wine MOX can be observed immediately: in the first (Figure 2A1,A2), the dosage varies according to the measure of dissolved oxygen, the wine’s initial level being 0.5 mL/L·month. Each day after exhaustive measuring, as described in the previous section, the level was adjusted to reach the fixed setpoint (50 µg/L). In the second set of cases (Figure 2B1,B2) the measurements were also carried out, but the oxygen dosage was the same throughout the 111 days of the experiment: 3 mL/L·month.
The average trends in the evolution of accumulated oxygen consumption in wines treated with oak chips from Q. Pyrenaica, added at two different times during aging with different MOX strategies, is shown in Figure 3. The data obtained indicate that the wines treated during 111 days with a floating MOX strategy, in which the setpoint was fixed at 50 µg/L, and all the oak chips were added at the beginning (from now on, A wood strategy) consumed an average of 5.86 ± 0.473 mg/L with significant differences from the wines to which the wood was added twice (from now on, B wood strategy), which consumed an average of 7.87 ± 0.287 mg/L. The wines treated with a fixed MOX strategy of 3 mL/L·month and A wood strategy were recorded as consuming an average of 16.58 ± 0.017 mg/L without any significant differences from the wines to which the oak chips were added according to the B wood strategy, and which consumed an average of 16.59 ± 0.001 mg/L.
From the start point (Figure 3, detail number 1), the aging systems were noticeably different in accordance with both the micro-oxygenation and wood dosage strategies. In wines treated with fixed MOX, the most obvious difference appeared from the start point until the moment the second quantity of oak chips was added (Figure 3, detail number 2). No significant differences were observed among them after that time. The average dosage during the whole process was the same for both: 2.04 ± 0.00 mg/L·month (Table 1). With regard to the floating MOX strategy, differences were appreciable between tanks from the start: B wood strategy wines needed a higher oxygen dosage to maintain the setpoint levels than those to which all the wood was added at the beginning of the process (Figure 3, detail number 3). Therefore, the average dosages during the whole process were 0.83 ± 0.24 mg/L·month and 0.62 ± 0.14 mg/L·month (Table 1), respectively. Related to the total oxygen inputs, no significant differences were recorded among the values of wines with a fixed MOX (16.60 ± 0.02 and 16.41 ± 0.25 mL/L, Table 1). However, in the case of those treated with a floating MOX, wines aged with the B wood strategy received over 1.50 mL/L more oxygen than wines treated with the A wood strategy (Table 1).
These results showed that wines consumed all the oxygen available. Also, if a MOX strategy was followed for the wines to retain the amounts of oxygen similar to that in barrel (20 to 50 µg/L) [13,26], between 5 and 8 mg/L of oxygen was required to maintain those levels. However, when they were micro-oxygenated with the fixed dosages common in finished wines, for example 3 mL/L·month, this was between 3 and 3.5 times more than the oxygen they would receive in barrel. When wood was added at the beginning, the micro-oxygenated wines, with a fixed dosage of 3 mL/L·month, consumed 2.8 times more oxygen than those subjected to floating MOX. Similarly, when the wood was added twice, the micro-oxygenated wines with a fixed dosage of 3 mL/L·month consumed 2.10 times more than those subjected to floating MOX.
The contribution of the oxygen from the air entrapped in the oak chips (auto-oxygenation) was evident when both wood and MOX strategies were taken into account. On the one hand, the oxygen contributed by the wood was appreciable: in those tanks where the A wood strategy was tested, it was higher than those where the B wood strategy was used. On the other hand, the oxygen contributed by the oak chips had a greater repercussion when the floating MOX strategy was used (Figure 3, detail number 3): 13.08% and 9.75% of the total oxygen inputs for wood strategies A and B, respectively. In wines treated with fixed MOX (Figure 3, detail number 2) this contribution was 4.62%. Hence, under the conditions tested in this study, the oxygen contribution from the oak chips was higher when a lower MOX was used, in this case, an FMOX. It should be noted that when wine consumes the required quantity of oxygen, auto-oxygenation needs to be taken into account, since it is an important part of the total oxygen consumed, as previously stated. When an FMOX is considered, logically, it has less influence, since it overlaps with the fixed dosage. However, in both cases, the oxygen contained in the wood should be considered as it acts as an oxidizing agent of the compounds released by the wood [14].

3.2. Effect of Micro-Oxygenation in Wines

The measurements carried out throughout the aging process showed that the factors involved (MOX and time of oak chip addition) did not generally affect the chemical wine parameters at the end of aging, with the exception of the degree of alcohol, since wines from floating MOX and A wood strategy had a significantly higher value with respect to the rest of the wines (data not shown). The final chemical parameters of these wines varied in range: total acidity 5.85 to 5.90 g/L; volatile acidity 0.45–0.49 g/L; sugars 1.35–1.39 g/L; degree of alcohol 13.43–14.05%; and the pH of all the wines studied were close to 3.69.
The oxygen consumed by the wine determines its evolution during the period of contact with wood + MOX, thus explaining the final wine differences. Correlations between total consumed oxygen (TCO) by wine and each variable analyzed in the wines were calculated and are shown in Table 2. They were calculated with TCO and the variation of each parameter in each sample, calculated with respect to the value at the initial time (Delta). The parameters studied were (a) parameters of phenols (D-LPP, D-HPP, D-TAN, D-CAT, D-ACY, D-OD); (b) copigmentation indexes (D-COP, D-PP, D-AL, D-FC, D-TP D-HCl-I, D-EtOH-I, D-Ion-I, D-GEL-I); (c) color parameters (D-T, D-%A420, D-%A520, D-%A620); and d) individual anthocyanin compounds (D-Df-3-Gl, D-Cy-3-Gl, D-Pt-3-Gl, D-Pn-3-Gl, D-Mv-3-Gl, D-Vitisin A, D-Pn-3-Gl-Ac, D-Mv-3-Gl-Ac, D-Df-3-Gl-Cm, D-Cy-3-Gl-Cm, D-Pt-3-Gl-Cm, D-Mv-3-Gl-Cm C, D-Mv-3-Gl-Cm T and D-Mv-3-gl-Ethyl). The correlation values significant with total consumed oxygen at p < 0.05 (r > 0.51 or r < −0.51) are in bold (Table 2), where the positive correlation indicates an increase in compound concentration and the negative one a decrease. Significant correlations (p < 0.05) were recorded between TCO and some of the parameters studied in wines treated with both MOX strategies. Table 2 showed the expected increase of D-HPP, which correlated significantly with TCO in wines from both MOX strategies, and had similar values (0.4928 and 0.4708, for 50 µg/L and 3 mL/L·month, respectively). Anthocyanin (D-ACY) evolution correlated negatively to oxygen consumption reflect the anthocyanin decrease. A great number of their reactions during wine aging are known to be determined by DO level [36,37]. This negative correlation was higher in the case of wines with a fixed MOX (−0.6219), which can be explained by higher quantities of anthocyanins lost in wines submitted to this MOX strategy. The anthocyanin decrease is one of the most important processes occurring during wine storage and was previously reported by Del Alamo et al. [13] when a 20 µg/L FMOX was carried out with different alternative oak products. These processes encompass oxidation, condensation and phenolic polymerization with transformation into other compounds which have an evident effect on the modification of wine color. The correlation results shown by the red component (D-%A520) agreed with the above: TCO showed a significant negative correlation with this color component in wines, with a higher value in those from floating MOX. Also, the previous results were in agreement with the free anthocyanins (D-AL) value from copigmentation parameters, since TCO showed a statistically significant (p < 0.05) correlation with its decrease, but only in wines from a floating MOX (−0.6023). In the same way, the D-ION-I was negatively correlated with TCO, especially in the case of wines treated with fixed MOX (−0.7754), which coincided with the higher negative value in the D-ACY parameter for these wines.
The tonality (D-T) increase in wines correlated positively with TCO, especially in the case of those treated with fixed MOX (0.9094). The negative correlations present in color intensity (D-CI) were higher in wines from a fixed MOX strategy (−0.6832) than those from a floating strategy (−0.5616). Del Alamo et al. [13] reported a positive correlation between TCO and D-CI when a 20 µg/L FMOX was studied.
TCO showed significant correlations with some individual anthocyanins. While D-Cy-3-Gl, D-Df-3-Gl-Cm and D-Mv-3-Gl-Cm T content defined wines in the first sampling, their decrease throughout the aging process correlated negatively with TCO, with values similar in wines from each MOX studied (Table 2). In wines from floating MOX, D-Pt-3-Gl-Cm also correlated negatively with TCO. Contrary to the D-Mv-3-Gl-Cm T, the cis isomer correlated positively with TCO (0.5255) in wines from floating MOX. D-vitisin A correlated positively (p < 0.05) with the TCO increase, with values very close for both MOX strategies: 0.6574 and 0.6599 for floating and fixed MOX strategies, respectively. Vitisin A, as a pyranoanthocyanin, is an important compound in the color of red wines, since the cycloaddition process strongly increases product stability. In this way, vitisin A has been reported as being more stable than Mv-3-Gl or ethyl-linked compounds, and more resistant to oxidation [38].
Related to ethyl-linked compounds, D-Mv-3-Gl-Ethyl increased significantly in wines throughout the aging period. This compound, purple in color, is less sensitive to bleaching by SO2 and pH than monomeric anthocyanins, and its formation is favored by oxygen [36], as shown by the positive correlation between this compound and TCO.
Figure 4, Figure 5 and Figure 6 present the results of principal component analysis (PCA) of the variation in variables analyzed in wines (Delta). This analysis was carried out to obtain a reduced number of linear combinations of the variables that explain the greater variability in the data. The projections of the variables analyzed in the principal components (PCs) are the weighted sum of the original variables and are named loads (Table 3). Using the variables of total oxygen consumed, phenolic compounds and color parameters, 3 components with eigenvalues greater than or equal to 1.0 were obtained. They explain 74% of the variability in the original data, where the first main component included 34.6%, the second 27.6%, and the third 11.73% (Table 3 PCA-A). Projection of the variables on the factor-plane (1 × 2) (Figure 4A) and of the wines on the factor-plane, show that wines were located according to their aging time (Figure 4B), and demonstrate the significance of the variables in the samples with aging time. There was a greater distance between the samples of the first and second sampling, which indicates a greater evolution between 20 and 48 days, while there was almost no differentiation between 76 and 97 days of aging. Finally, the separation between the samples after 111 days of aging was remarkable, indicating different characteristics of the wines aged in the different systems according to the variables studied. The first main component PC1 contains, on the one hand, information on oxygen consumption and tonality and, on the other, the red component related to the loss of anthocyanins. The second main component PC2 is primarily defined by the yellow component information, which relates to the formation of polymerized phenolic compounds on the one hand, and the blue color component on the other. According to the distribution of the samples the youngest wines, after one month’s aging, were located in the negative PC1 and logically defined by the free anthocyanins, catechins, and orthodiphenols, showing significant levels of compounds responsible for their red color. As aging progresses, after 3 months’ contact with wood and MOX, the wines had significant levels of compounds responsible for blue tones, which in the following month, changed to brown, showing the importance of the yellow color component. Wines at the end of the period of contact with wood (after 111 days) were located in the positive PC1 and defined by their consumption of oxygen (TCO), which is directly related to the formation of highly polymerized phenolic compounds, and increase in wine tonality and the yellow component (Figure 4B).
As regards the capacity of wine differentiation by accumulated oxygen consumption (TCO), copigmentation, phenolic indexes, and color Delta parameters (Figure 5), the three main components comprised 77.40% of the variance (Table 3 PCA-B), where the first and second main components explained 31.6% and 25.41%, respectively, whereas the third was 20.39%. As before, wines were shown based on their aging time according to the projection of the variables on the factor-plane (1 × 2) (Figure 5A) and the projection of the wines on the factor-plane (Figure 5B). In this case, the wines of the first two samplings were very close, which indicates low evolution of the variables studied between 20 and 48 days. Similar trends were observed in samplings 3 and 4. The first main component, PC1, encompasses positive variables, such as ionization index and the blue color component, whereas the yellow component and gelatin index were negative. Meanwhile, the second main component PC2 was mainly defined by the information on oxygen consumption relating to the loss of anthocyanins and represented by two parameters: the red color component and free anthocyanins from the copigmentation parameters. The distribution of the samples showed that after one month’s aging, wines were located in the negative PC2, and defined by the anthocyanins, both as free ones and as a percentage which contributed to color. They also showed significant levels of compounds responsible for the red color, as previously stated (Figure 4A). As the wine aging progressed, after 3 months’ contact with wood and MOX, wines were found to show significant levels of compounds responsible for blue tones. In the following months, these changed to brown, showing the importance of the yellow color component (after 111 days). At the end of the aging period, wines were located in the positive PC2, and were defined by their consumption of oxygen (TCO), which was directly related to the copigmentation parameter (COP) and the astringent tannin content through the gelatin index (Figure 5B).
Figure 6 summarizes the principal component analysis carried out with individual anthocyanin compounds and color parameters, which revealed that the three main components explained 82.97% of the variance, where the first main component includes 46.13% and the second 25.63% (Table 3 PCA-C). Figure 6A,B include the projection of the variables and the wine samples in the plane of the first two main components respectively, showing that wines were located according to their aging time, as was also found with the previously studied parameters (Figure 4 and Figure 5). On the one hand, information related to the yellow component was included in the first main component PC1 and, on the other hand, the red component related to the loss of individual anthocyanins, where compounds such as malvidin-3-O-glucoside, peonidin-3-O-glucoside, and delphinidin-3-O-glucoside are worth noting, in this order. The second main component, PC2, was mainly defined by vitisin A and malvidin-3-O-glucoside-ethyl-epicatechin, along with information on oxygen consumption and the loss of malvidin-3-O-p-coumarylglucoside trans, and cyanidin-3-O-glucoside. Considering the distribution of wines throughout the aging process, they were located in the negative PC2 from the first month of aging to the third one. They were defined by compounds responsible for the red color and anthocyanin monomers (malvidin-3-O-glucoside, peonidin-3-O-glucoside, and delphinidin-3-O-glucoside) in the younger wines. Sample 2 showed variations in malvidin-3-O-p-coumarylglucoside trans, and cyanidin-3-O-glucoside until the blue color component and anthocyanins, such as cyanidin-3-O-p-coumarylglucoside and malvidin-3-O-p-coumarylglucoside cis, were recorded in wines from the second month. Wines at the end of the period of contact with wood and MOX, which covers the fourth and fifth sampling, were located in the positive PC2 and defined by the consumption of oxygen (TCO) and anthocyanin derivates more stable to oxidation, such as vitisin A and malvidin-3-O-glucoside-ethyl-epicatechin (Figure 6B), showing significant levels of the compounds responsible for yellow tones.

4. Conclusions

The results of oxygen consumption by red wines under different micro-oxygenation (MOX) strategies and Q. pyrenaica chips showed that they consumed all the oxygen available, and that this consumption depended on the MOX strategy selected. Thus, wines from fixed MOX received between 3 and 3.5 times more oxygen than those using the floating MOX strategy. In the latter, the oxygen contribution by the air entrapped in the wood was more significant, since this contribution represented a higher percentage with respect to the total. Therefore, the oxygen contribution from the chips and the moment when this contribution is made should be taken into account, because it affects the MOX strategy selected. In general, although the amount of oxygen that had been applied and the way it was applied is different, it does not appear that these are important differences in the studied time. However, it will be interesting to continue the study of the wines in the bottle in order to evaluate the effect of this great difference in the oxygen consumed by the wines. According to this information we could say that the wines are similar, even though we believe that it is more appropriate to implement floating dosage MOX, that is, to give the wine the oxygen it needs at every moment.
In relation to their effect on color and phenolic characteristics, both MOX strategies studied contributed to the characteristic processes which take place during barrel aging: oxygen consumption was related to copigmentation increment, with the consequent loss of monomeric anthocyanins together with an increase in yellow tones, related to the formation of polymerized phenolic compounds. From the point of view of individual global phenol and copigmentation parameters, 111 days’ aging was the period where a higher evolution was observed, while in case of individual anthocyanin compounds, there was hardly any evolution between the last two sampling points.
Consequently, the use of chips combined with MOX is an adequate technique to carry out the aging process in tanks.

Author Contributions

Conceptualization, I.N. and M.d.A.-S.; Funding acquisition, I.N. and M.d.A.-S.; Methodology, M.d.A.-S.; Supervision, I.N.; Visualization, R.S.-G.; Writing—original draft, R.S.-G. and A.M.M.-G.; Writing—review & editing, R.S.-G., I.N. and M.d.A.-S.

Funding

This research was funded by the Ministry of Economy and Competitiveness-FEDER of the Spanish Government for Project AGL2014-54602-P, Junta de Castilla y León for project VA028U16 and Interreg Spain-Portugal for Iberphenol project.

Acknowledgments

R.S.-G. would like to thank her postdoctoral contract to Interreg Spain-Portugal for Iberphenol project. The authors wish to thank to J. Calles for her support throughout the chemical analysis. Authors thank Ann Holliday for her services in revising the English.

Conflicts of Interest

The authors declare no conflict of interest.

References

  1. Anli, R.E.; C avuldak, Ö.A. A review of microoxygenation application in wine. J. Inst. Brew. 2012, 118, 368–385. [Google Scholar] [CrossRef] [Green Version]
  2. Chiciuc, I.; Farines, V.; Mietton-Peuchot, M.; Devatine, A. Effect of wine properties and operating mode upon mass transfer in micro-oxygenation. Int. J. Food Eng. 2010, 6, 9. [Google Scholar] [CrossRef]
  3. Du Toit, W.J.; Marais, J.; Pretorius, I.S.; du Toit, M. Oxygen in must and wine: A review. S. Afr. J. Enol. Vitic. 2006, 27, 76–94. [Google Scholar] [CrossRef]
  4. Parish, M.; Wollan, D.; Paul, R. Micro-oxygenation—A review. Aust. N.Z. Grapegrow. Winemak. 2000, 438a, 47–50. [Google Scholar]
  5. Parpinello, G.P.; Versari, A. Micro-oxygenation of red wine: Chemistry and sensory aspects. In Wine: Types, Production and Health; Peeters, A.S., Ed.; Nova Science Publishers: New York, NY, USA, 2012; pp. 93–123. ISBN 978-161470635-9. [Google Scholar]
  6. Trivellin, N.; Barbisan, D.; Badocco, D.; Pastore, P.; Meneghesso, G.; Meneghini, M.; Zanoni, E.; Belgioioso, G.; Cenedese, A. Study and development of a fluorescence based sensor system for monitoring oxygen in wine production: The WOW project. Sensors 2018, 18, 1130. [Google Scholar] [CrossRef] [PubMed]
  7. Del Alamo Sanza, M.; Nevares Domínguez, I.; Cárcel Cárcel, L.M.; Navas Gracia, L. Analysis for low molecular weight phenolic compounds in a red wine aged in oak chips. Anal. Chim. Acta 2004, 513, 229–237. [Google Scholar] [CrossRef]
  8. Del Álamo Sanza, M.; Domínguez, I.N.; Merino, S.G. Influence of different aging systems and oak woods on aged wine colour and anthocyanin composition. Eur. Food Res. Technol. 2004, 219, 124–132. [Google Scholar] [CrossRef]
  9. Del Alamo-Sanza, M.; Laurie, V.F.; Nevares, I. Wine evolution and spatial distribution of oxygen during storage in high-density polyethylene tanks. J. Sci. Food Agric. 2014, 95, 1313–1320. [Google Scholar] [CrossRef] [PubMed] [Green Version]
  10. Oberholster, A.; Elmendorf, B.L.; Lerno, L.A.; King, E.S.; Heymann, H.; Brenneman, C.E.; Boulton, R.B. Barrel maturation, oak alternatives and micro-oxygenation: Influence on red wine aging and quality. Food Chem. 2015, 173, 1250–1258. [Google Scholar] [CrossRef] [PubMed]
  11. Gallego, L.; Del Alamo, M.; Nevares, I.; Fernández, J.A.; De Simón, B.F.; Cadahía, E. Phenolic compounds and sensorial characterization of wines aged with alternative to barrel products made of Spanish oak wood (Quercus pyrenaica Willd.). Food Sci. Technol. Int. 2012, 18, 151–165. [Google Scholar] [CrossRef] [PubMed]
  12. Nevares, I.; Del Alamo, M.; Cárcel, L.M.; Crespo, R.; Martin, C.; Gallego, L. Measure the dissolved oxygen consumed by red wines in aging tanks. Food Bioproc. Technol. 2009, 2, 328–336. [Google Scholar] [CrossRef]
  13. Del Álamo, M.; Nevares, I.; Gallego, L.; Fernández de Simón, B.; Cadahía, E. Micro-oxygenation strategy depends on origin and size of oak chips or staves during accelerated red wine aging. Anal. Chim. Acta 2010, 660, 92–101. [Google Scholar] [CrossRef] [PubMed]
  14. García-Estévez, I.; Alcalde-Eon, C.; Martínez-Gil, A.M.; Rivas-Gonzalo, J.C.; Escribano-Bailón, M.T.; Nevares, I.; del Alamo-Sanza, M. An approach to the study of the interactions between ellagitannins and oxygen during oak wood aging. J. Agric. Food Chem. 2017, 65, 6369–6378. [Google Scholar] [CrossRef] [PubMed]
  15. Nevares, I.; del Álamo-Sanza, M. Wine aging technologies. In Recent Advances in Wine Stabilization and Conservation Technologies; Jordão, A.M., Cosme, F., Eds.; Nova Science Publishers: New York, NY, USA, 2016; pp. 209–245, ISBN 978-163484899-2; 978-163484883-1. [Google Scholar]
  16. De Simón, B.F.; Cadahía, E.; Sanz, M.; Poveda, P.; Perez-Magariño, S.; Ortega-Heras, M.; González-Huerta, C. Volatile compounds and sensorial characterization of wines from four Spanish denominations of origin, aged in Spanish Rebollo (Quercus pyrenaica Willd.) oak wood barrels. J. Agric. Food Chem. 2008, 56, 9046–9055. [Google Scholar] [CrossRef] [PubMed]
  17. Castro-Vázquez, L.; Alañón, M.E.; Ricardo-Da-Silva, J.M.; Pérez-Coello, M.S.; Laureano, O. Study of phenolic potential of seasoned and toasted Portuguese wood species (Quercus pyrenaica and Castanea sativa). J. Int. Sci. Vigne Vin 2013, 47, 311–319. [Google Scholar] [CrossRef]
  18. De Coninck, G.; Jordão, A.M.; Ricardo-Da-Silva, J.M.; Laureano, O. Evolution of phenolic composition and sensory properties in red wine aged in contact with Portuguese and French oak wood chips. J. Int. Sci. Vigne Vin 2006, 40, 25–34. [Google Scholar] [CrossRef]
  19. De Simón, B.F.; Sanz, M.; Cadahía, E.; Poveda, P.; Broto, M. Chemical characterization of oak heartwood from Spanish forests of Quercus pyrenaica (Wild.). Ellagitannins, low molecular weight phenolic, and volatile compounds. J. Agric. Food Chem. 2006, 54, 8314–8321. [Google Scholar] [CrossRef] [PubMed]
  20. De Simon, B.F.; Cadahia, E.; Jalocha, J. Volatile compounds in a Spanish red wine aged in barrels made of Spanish, French, and American oak wood. J. Agric. Food Chem. 2003, 51, 7671–7678. [Google Scholar] [CrossRef] [PubMed]
  21. De Simón, B.F.; Muiño, I.; Cadahía, E. Characterization of volatile constituents in commercial oak wood chips. J. Agric. Food Chem. 2010, 58, 9587–9596. [Google Scholar] [CrossRef] [PubMed]
  22. Del Alamo Sanza, M.; Escudero, J.A.F.; De Castro Torío, R. Changes in phenolic compounds and colour parameters of red wine aged with oak chips and in oak barrels. Food Sci. Technol. Int. 2004, 10, 233–241. [Google Scholar] [CrossRef]
  23. Castellari, M.; Simonato, B.; Tornielli, G.B.; Spinelli, P.; Ferrarini, R. Effects of different enological treatments on dissolved oxygen in wines. Ital. J. Food Sci. 2004, 16, 387–396. [Google Scholar]
  24. Moutounet, M.; Mazauric, J.-P. L’oxygène dissous dans les vins. Rev. Fran. D’Oenol. 2001, 186, 12–15. Available online: https://prodinra.inra.fr/record/56312 (accessed on 20 June 2018).
  25. Laurie, V.F.; Law, R.; Joslin, W.S.; Waterhouse, A.L. In situ measurements of dissolved oxygen during low-level oxygenation in red wines. Am. J. Enol. Vitic. 2008, 59, 215–219. [Google Scholar]
  26. Nevares, I.; del Álamo, M. Measurement of dissolved oxygen during red wines tank aging with chips and micro-oxygenation. Anal. Chim. Acta 2008, 621, 68–78. [Google Scholar] [CrossRef] [PubMed]
  27. Folin, O.; Ciocalteu, V. On tyrosine and tryptophane determination in proteins. J. Biol. Chem. 1927, 73, 627–650. [Google Scholar]
  28. Masquelier, J.; Michaud, J.; Triaud, J. Fractionnement des leucoanthocyannes du vin. Bull. Soc. Pharm. Bordx. 1965, 104, 81–85. [Google Scholar]
  29. Paronetto, L. Polifenoli e Tecnica Enológica; Edagricole: Bologna, Italy, 1977; ISBN 88-206-1704-8. [Google Scholar]
  30. Ribereau-Gayon, J.; Stonstreet, E. Determination of anthocyanins in red wine. In Bulletin de la Societe de Pharmacie de Bordeaux; Société de Pharmacie (Bordeaux): Bordeaux, France, 1965; Volume 9, pp. 2649–2652. ISSN 00378968. [Google Scholar]
  31. Swain, T.; Hillis, W.E. The phenolic constituents of Prunus domestica. I.—The quantitative analysis of phenolic constituents. J. Sci. Food Agric. 1959, 10, 63–68. [Google Scholar] [CrossRef]
  32. Somers, T.C.; Evans, M.E. Spectral evaluation of young red wines: Anthocyanin equilibria, total phenolics, free and molecular SO2, “chemical age”. J. Sci. Food Agric. 1977, 28, 279–287. [Google Scholar] [CrossRef]
  33. Ribéreau-Gayón, P.; Glories, Y.; Maujean, A.; Dobourdieu, D. Tratado de Enología 2. Química del vino. Estabilización y Tratamientos; Ediciones Mundi prensa: Madrid, España, 2003; ISBN 978950504571. [Google Scholar]
  34. Glories, Y. La couleur des vins rouges 2. Mesure, origine et interprétation. Connais. Vigne Vin 1984, 18, 253–271. [Google Scholar] [CrossRef]
  35. Boulton, R.B. The copigmentation of anthocyanins and its role in the colour of red wine: A critical review. Am. J. Enol. Vitic. 2001, 52, 67–87. [Google Scholar]
  36. Atanasova, V.; Fulcrand, H.; Cheynier, V.; Moutounet, M. Effect of oxygenation on polyphenol changes occurring in the course of wine-making. Anal. Chim. Acta 2002, 458, 15–27. [Google Scholar] [CrossRef]
  37. Castellari, M.; Matricardi, L.; Arfelli, G.; Galassi, S.; Amati, A. Level of single bioactive phenolics in red wine as a function of the oxygen supplied during storage. Food Chem. 2000, 69, 61–67. [Google Scholar] [CrossRef]
  38. Morata, A.; Gomez-Cordoves, C.; Colomo, B.; Suarez, J.A. Pyruvic acid and acetaldehyde by different strains of Saccharomyces cerevisiae: Relationship with vitisin A and B formation in red wines. J. Agric. Food Chem. 2003, 51, 7402–7409. [Google Scholar] [CrossRef] [PubMed]
Figure 1. Wine micro-oxygenation (MOX) and wood strategies scheme.
Beverages 04 00069 g001
Figure 2. Graphic representation of dissolved oxygen (mg/L) and MOX dosage (mL/L·month) of wines treated with two micro-oxygenation strategies: (A) floating MOX strategy, in which the setpoint was set at 50 µg/L; (B) fixed MOX strategy with 3 mL/L·month. The wood chips were added at two different moments: (1) all the wood at the beginning of the maturation process; (2) half of the wood at the beginning and the other half 48 days after the beginning of the experiment.
Beverages 04 00069 g002aBeverages 04 00069 g002b
Figure 3. Graphic representation of MOX total consumption of oxygen (TCO mean, mg/L) in wines treated with two micro-oxygenation strategies. : floating MOX strategy (50 µg/L) and all chips added at the beginning of the experiment; : floating MOX strategy (50 µg/L) and half of the chips added at the beginning and the other half 48 days later; : fixed MOX strategy (3 mL/L·month) and all chips added at the beginning of the experiment; : fixed MOX strategy (3 mL/L·month) and half of the chips added at the beginning and the other half 48 days later.
Beverages 04 00069 g003
Figure 4. Principal component analysis (PCA) performed with global phenol parameters in wines from different micro-oxygenation and wood strategies. 1, 2, 3, 4, and 5: samplings carried out in each tank after 20, 48, 76, 97, and 111 days’ aging, respectively.
Beverages 04 00069 g004
Figure 5. Principal component analysis (PCA) performed with copigmentation parameters in wines from different micro-oxygenation and wood strategies. 1, 2, 3, 4, and 5: samplings carried out in each tank after 20, 48, 76, 97, and 111 days’ aging, respectively.
Beverages 04 00069 g005aBeverages 04 00069 g005b
Figure 6. Principal component analysis (PCA) performed with individual anthocyanin compounds in wines from different micro-oxygenation and wood strategies. 1, 2, 3, 4, and 5: samplings carried out in each tank after 20, 48, 76, 97, and 111 days’ aging, respectively.
Beverages 04 00069 g006
Table 1. Summary of dosages during MOX in the aging tanks tested.
Micro-Oxygenation50 µg/L3 mL/L·month
Time wood was addedAt the beginningHalf of the wood at the beginning and the other half at 48 daysAt the beginningHalf of the wood at the beginning and the other half at 48 days
MOX dosage (mL/L·month)0.92 ± 0.171.22 ± 0.353.00 ± 0.003.00 ± 0.00
Total O2 inputs (mL/L)6.06 ± 0.277.60 ± 0.3716.60 ± 0.0216.41 ± 0.25
MOX dosage (mg/month)0.62 ± 0.140.83 ± 0.242.04 ± 0.002.04 ± 0.00
Total O2 inputs include MOX + O2 from the air inside the wood chips and the oxygen contributed during initial tank filling.
Table 2. Mean and standard deviation of each delta analyzed parameter, and correlation coefficients between parameters and oxygen consumed by wine in each micro-oxygenation and wood strategies process.
Parameter50 µg/L3 mL/L·month
MeansStd. Dev.TCO (µg/L)MeansStd. Dev.TCO (µg/L)
TCO (µg/L)4731.5532027.8811.00000010834.074902.5371.000000
D-LPP15.86592.8330.14185527.19173.1860.439508
D-HPP575.850182.7280.492817497.68247.2380.470771
D-CAT5.581116.711−0.138876−12.8470.835−0.380093
D-ACY−106.59562.470−0.521031−90.6533.655−0.621881
D-TAN3.0260.2850.1184162.920.1870.078329
D-CI−1.7893.240−0.561610−1.993.315−0.683212
D-T0.1150.0750.7829660.120.0770.909374
D-FC−0.4001.666−0.098521−0.611.681−0.261112
D-TP−11.23114.193−0.453367−10.5512.323−0.321815
D-COP0.0290.0480.0651260.040.0560.097685
D-AL−0.1540.032−0.602250−0.160.065−0.286415
D-PP0.0740.0400.4025560.070.0340.381631
D-EtOH-I6.6132.660−0.4318445.364.294−0.658603
D-HCl-I3.5292.668−0.4642823.503.059−0.488752
D-GEL-I−20.8277.877−0.095990−19.635.599−0.029458
D-ION-I−8.4438.122−0.516031−9.938.022−0.775361
D-OD−182.10060.460−0.738996−162.8053.456−0.756095
D-IPT0.1036.0660.009464−1.373.0200.002513
D-%A4200.9753.4150.3185940.923.5130.379195
D-%A520−7.3475.000−0.588424−7.585.243−0.645097
D-%A6206.3726.9340.2673736.667.2740.281831
D-Df-3-Gl−4.9576.689−0.359792−5.456.259−0.164040
D-Cy-3-Gl−2.0071.846−0.876709−2.001.808−0.829679
D-Pt-3-Gl−2.1963.909−0.162831−2.373.6430.055472
D-Pe-3-Gl−0.8831.095−0.407683−0.921.005−0.226321
D-Mv-3-Gl−10.42111.659−0.436685−10.8510.893−0.264131
D-Vitisin A0.1790.1910.6574460.180.1930.659883
D-Mv-3-Gl-Ethyl0.1080.2050.5403550.090.2130.699438
D-Pe-3-Gl-Ac−0.4850.523−0.350600−0.590.440−0.323565
D-Df-3-Gl-Cm−2.4701.986−0.813771−2.521.918−0.868531
D-Mv-3-Gl-Ac−0.2580.190−0.361746−0.300.203−0.107868
D-Cy-3-Gl-Cm0.9541.8450.1144541.021.9620.130637
D-Mv-3-Gl-Cm C0.3160.3360.5254930.420.5750.383817
D-Pt-3-Gl-Cm−0.1520.214−0.467845−0.140.164−0.390148
D-Mv-3-Gl-Cm T−2.3961.985−0.875855−2.361.944−0.884408
D-Acet4.2706.4190.6776143.635.9360.771172
D-Cum5.3788.3510.6605665.448.0050.810550
D-Total32.18576.2240.51622330.1373.8110.678868
Significant correlation values (r > 0.51 or r < −0.51). Bold type indicates at least p < 0.05.
Table 3. PCA results.
ParameterFactor 1Factor 2
PCA-A
TCO (µg/L)0.66340.1964
D-LPP0.30820.1378
D-HPP0.44020.4895
D-CAT−0.53600.4341
D-ACY−0.76750.3499
D-TAN−0.0502−0.4529
D-T0.85530.4782
D-%A4200.13340.9629
D-%A520−0.85120.4295
D-%A6200.5486−0.7790
D-OD−0.6510−0.5311
PCA-B
TCO (µg/L)−0.15880.7599
D-%A420−0.91540.1802
D-%A520−0.5577−0.7365
D-%A6200.84830.4431
D-COP−0.44930.2756
D-TP0.5143−0.4087
D-FC0.5851−0.2164
D-AL0.0251−0.6377
D-PP0.59210.4860
D-EtOH-I0.1834−0.6141
D-HCl-I0.0113−0.5556
D-GEL-I−0.7125−0.2527
D-ION-I0.7163−0.5213
PCA-C
TCO (µg/L)0.38900.6159
D-%A420−0.39310.5658
D-%A520−0.8618−0.2132
D-%A6200.8129−0.1221
D-Df-3-Gl−0.91920.2025
D-Cy-3-Gl−0.5871−0.7686
D-Pt-3-Gl−0.84540.4356
D-Pe-3-Gl−0.93410.1583
D-Mv-3-Gl−0.94270.1100
D-Vitisin A−0.01750.9354
D- Mv-3-Gl-Ethyl−0.19160.9326
D-Pe-3-Gl-Ac−0.82970.1714
D-Df-3-Gl-Cm−0.7212−0.5033
D-Mv-3-Gl-Ac−0.3799−0.1920
D-Cy-3-Gl-Cm0.6353−0.4160
D-Mv-3-Gl-Cm C0.53470.0076
D-Pt-3-Gl-Cm−0.8031−0.0258
D-Mv-3-Gl-Cm T−0.4527−0.8697

