Consumer’s Attitude Regarding Soluble Coffee Enriched with Antioxidants


1
Departamento Acadêmico de Alimentos, Universidade Tecnológica Federal do Paraná, Avenida Brasil, n. 4232, Medianeira 85884-000, Paraná, Brazil
2
Departamento Acadêmico de Química, Universidade Tecnológica Federal do Paraná, Avenida Brasil, n. 4232, Medianeira 85884-000, Paraná, Brazil
3
Departamento de Ciência e Tecnologia de Alimentos, Centro de Ciências Agrárias, Universidade Estadual de Londrina, Rodovia Celso Garcia Cid, Pr 445 Km380, Campus Universitário, Cx. Postal 6001, Londrina 86051-980, Paraná, Brazil
*
Author to whom correspondence should be addressed.
Beverages 2018, 4(4), 72; https://0-doi-org.brum.beds.ac.uk/10.3390/beverages4040072
Submission received: 20 August 2018
/
Revised: 8 September 2018
/
Accepted: 26 September 2018
/
Published: 1 October 2018
(This article belongs to the Special Issue Coffee and its Consumption: Benefits and Risks)
Abstract
:Brazil is the second largest coffee consumer in the world. The development of new products related to healthy eating is one of the demands to maintain this scenario. This research aimed to investigate the role of socio-demographic, cognitive and behavioral characteristics on the acceptance of functional foods by coffee consumers. A questionnaire developed and applied in Belgium was previously translated and validated for application with Brazilian consumers. The habits of coffee consumption, knowledge and interest were investigated regarding functional soluble coffee enriched with antioxidants. The self-administered study was performed with 270 consumers. Acceptance was measured by two items: “Functional foods are all right for me as long as they taste good” and “Functional foods are all right for me even if they taste worse than their conventional counterpart foods”, obtaining a mean score of 4.03 and 2.79 (scale 1: totally disagree and 5: totally agree), respectively. The acceptance of functional foods increased with age, schooling, income, belief in the health benefits and knowledge about functional foods for both items. There was no significant correlation between price and acceptance. With regards to a functional soluble coffee product, the sensory quality was more determinant for its acceptance than price.
1. Introduction
Coffee consumption in Brazil was about 21.99 million bags of 60 Kg in 2017, with an increase of 3.6% compared to 2016, corresponding to twice the average world growth. With this volume, the country stands as the second largest consumer of coffee in the world [1,2]. Since 2013, the Associação Brasileira da Indústria de Café (ABIC) and the Ministério da Agricultura Pecuária e Abastecimento (MAPA) have conducted surveys on coffee consumption trends. Recent data confirmed that coffee is a consolidated product, maintaining a high and stable presence in 80% of Brazilian households, but it is important to keep a continuous effort to maintain this consumer behavior. According to ABIC, to stimulate the demand, it is necessary to increase investments in marketing, and in the differentiation and innovation of coffee products. This could be done by highlighting the coffee attributes to create a relationship between healthy living, well-being, energy, and pleasure that coffee consumption provides. Nowadays consumers have more information about the types and qualities of coffee and declare that they are looking for practicality, quality and diversity in coffee [2].
In the process of innovation and development of new products, market research is one of the most used tools for decision making due to its ability to express consumer behavior, wants or needs and to make it possible to measure product acceptance [3]. Functional products are one of the priority areas for innovation in the food industry [4,5]. In this context, one of the critical factors of success is the acceptance of this concept by the consumer. Thus, Verbeke [6], based on an extensive literature review, proposed socio-demographic, cognitive and behavioral determinants that could affect the acceptance of functional foods, and designed a multi-item questionnaire to study these parameters. The questionnaire addresses the hypotheses that the acceptance of functional foods can be affected by knowledge, the perception of the role of food for health, belief in the health benefit of functional foods, and price perception, as well as the socio-demographic characteristics of the consumer. We highlight the impact of the mentioned work, which has 317 citations in the ISI database, with 91 citations in the last 5 years (Web of knowledge).
Studies to verify the behavior and attitudes of consumers regarding functional foods have been carried out mainly in European countries [6,7,8,9,10,11,12,13,14,15,16], in North America [7,17,18], and in Asia [15,19]. In South America, some works have been developed in Uruguay [20,21,22,23,24,25]. In Brazil, which ranks fifth in healthy food and beverage sales, and has a 98% growth in the health food market between 2009 and 2014 according to a study by Euromonitor International [26], there is just a few studies with this focus, such as Melo, Teixeira and Zandonadi [27] and Cruz et al. [28].
Corso, Vignoli and Benassi [29] proposed an instant coffee product enriched with chlorogenic acids (from green Coffea canephora beans) for the Brazilian market. Green coffee freeze dried extracts were added to freeze dried extracts of C. arabica and C. canephora with two roast degrees. Overall, the formulations were well accepted, and the enriched formulations based only on C. canephora (green and roasted bean extracts) showed higher antioxidant potential. However, no product of this kind is available in the Brazilian market so far.
The development and trade of functional food products are quite complex, expensive and risky. Therefore, in addition to technological obstacles, the demands and attitudes of consumers towards a given functional food should be studied [4], since its acceptance will depend on the target audience and may be affected by cultural issues [7,15].
Thus, the present study aimed to investigate: (1) The role of socio-demographic, cognitive and behavioral characteristics in the acceptance of functional foods by coffee consumers; (2) The habits of coffee consumption, knowledge, and interest regarding functional soluble coffee enriched with antioxidants. The study was conducted in the State of Paraná/Brazil, a traditional coffee producer state, in which two of seven major soluble coffee industries in the country were located.
2. Materials and Methods
2.1. Participants
A transversal data collection was performed with 303 coffee consumers living in 34 cities in the State of Paraná/Brazil (Supplementary material, Figure S1). All participants were coffee consumers and were responsible for buying food for their homes. From this sample, 33 cases were excluded based on the analysis of inconsistent responses (item 2.2) or on missing observations in one or more of the variables of interest, thus generating a final sample of 270 consumers. Subjects were selected through non-probabilistic sampling, in easily accessible locations (universities and municipal markets), interviewed personally and informed that they would be asked to complete a self-administered questionnaire, providing personal and opinion data. The study was authorized to collect data from consumers by the Research Ethics Committee involving human beings from Universidade Estadual de Londrina (Certificate of Presentation for Ethical Evaluation No 0143.0.268. 000-10).
2.2. Research Instrument-Questionnaire and Scales
The acceptance of functional foods by consumers was evaluated by studying the effect of four factors: Knowledge, perception of the role of food in health, belief in the health benefit of functional foods, and price perception, using a questionnaire prepared by Verbeke [6] and translated and validated by Corso and Benassi [30] (Table 1). The research used a 5-point structured Likert-type scale; it was anchored at the extremes and in the middle by the expressions (1) Totally not agree; (3) Neutral; and (5) Fully agree. The exception was to statement three, referring to the knowledge factor of the instrument, for which the expressions—(1) Low; (2) Medium; and (3) High—were used.
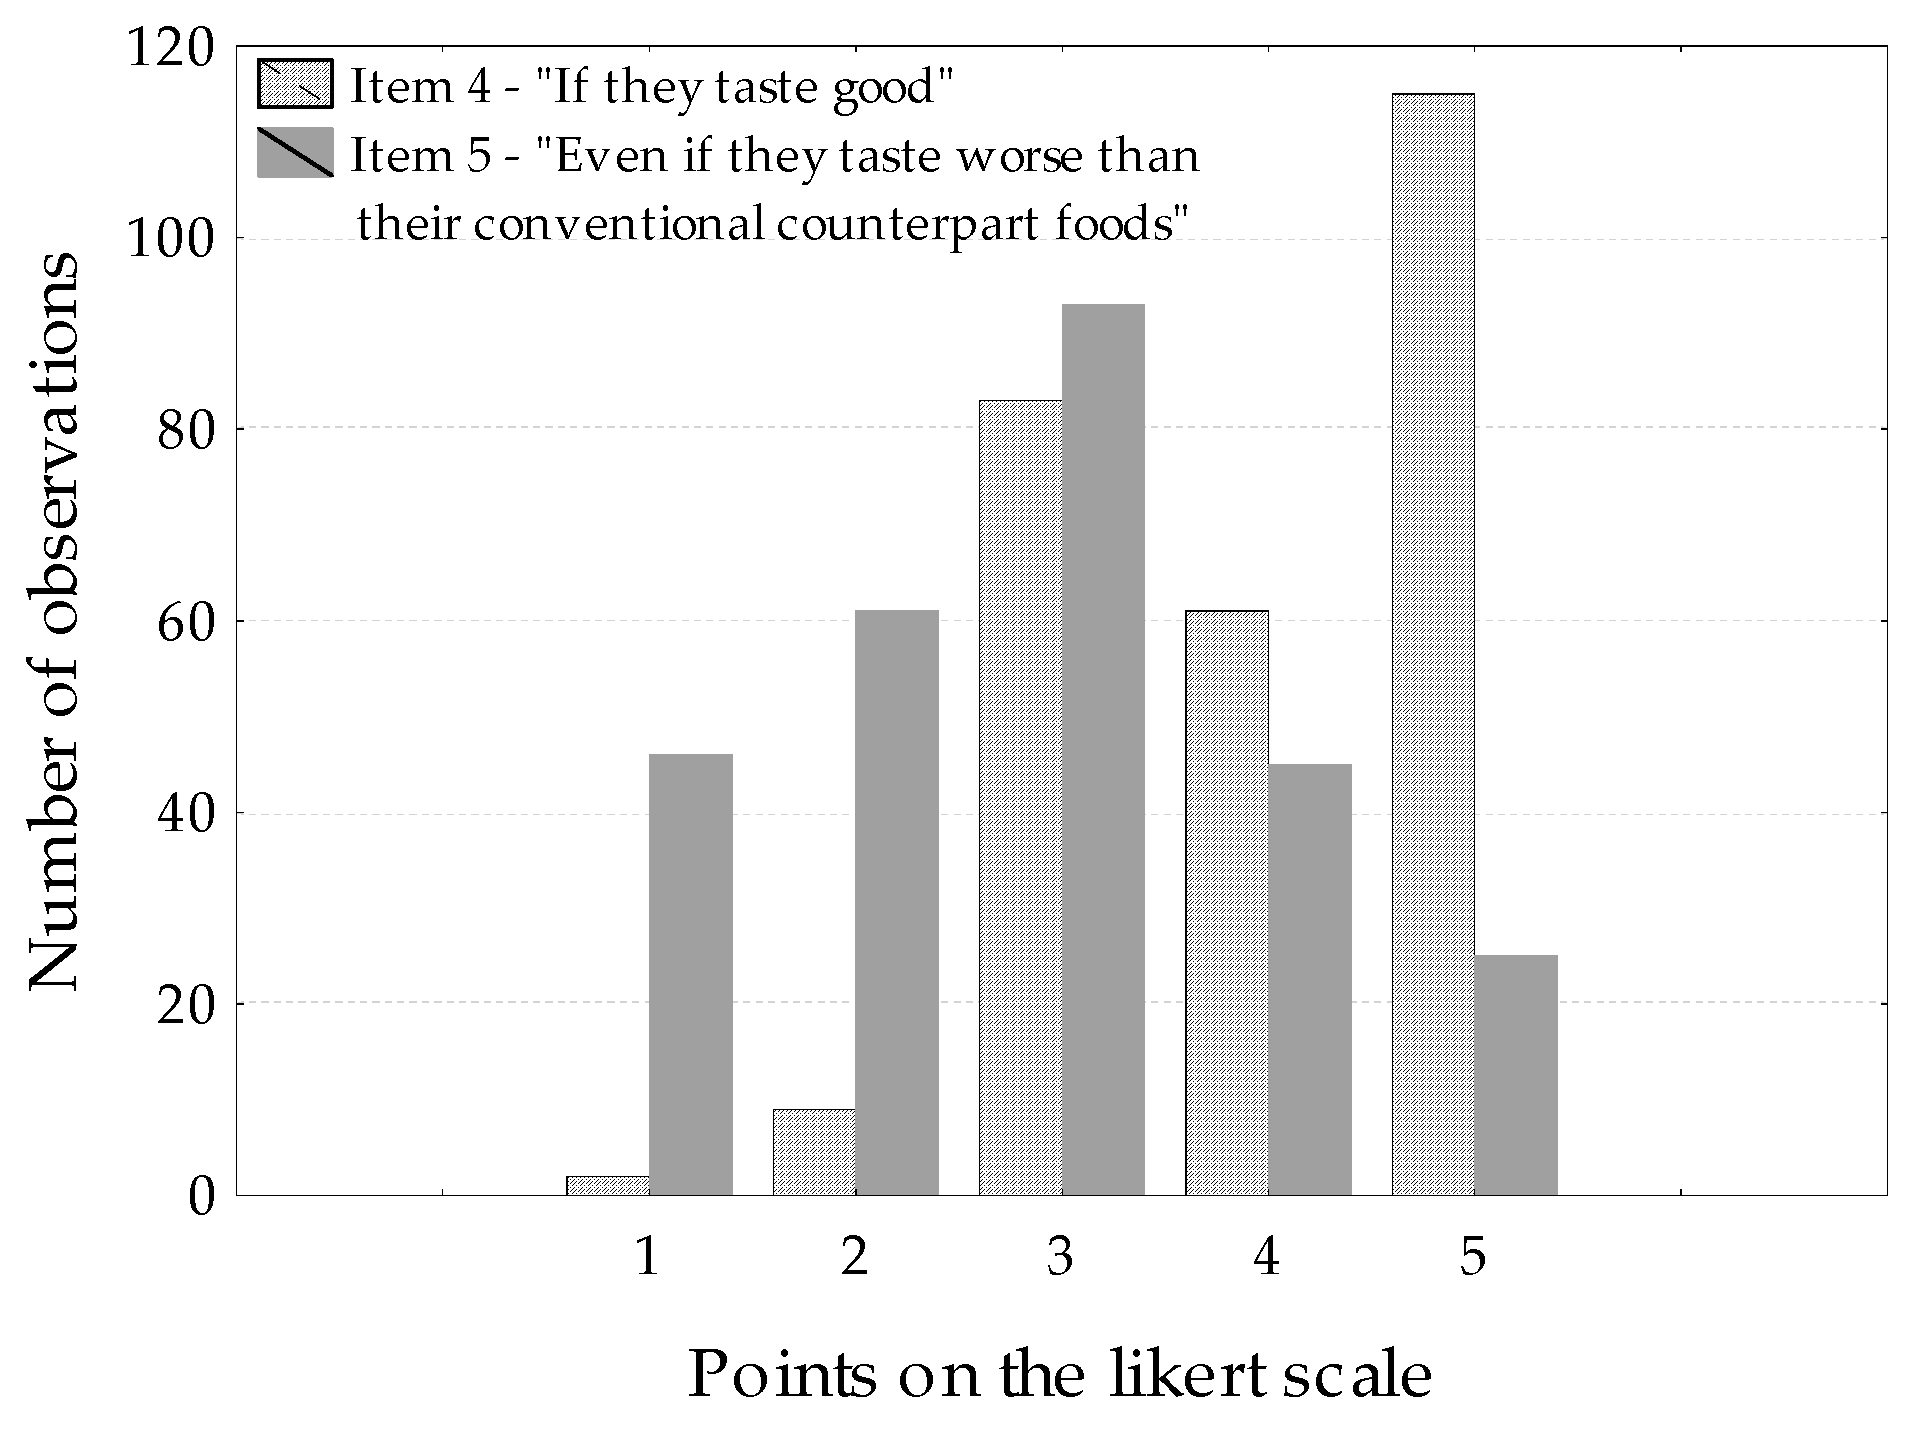
Two items in the questionnaire were the basis for determining acceptance of functional foods: “Functional foods are all right for me as long as they taste good” (item 4) and, “Functional foods are all right for me even if they taste worse than their conventional counterpart foods” (item 5) (Table 1). Both consider flavor as a premise for food acceptance, as several studies report that consumers are not willing to compromise sensory quality, even when it comes to functional foods [4,8,31,32]. In case of a score less than 3 for item 4 but equal to or higher than 3 for item 5, the results were considered inconsistent and were therefore withdrawn from the sample as suggested by Verbeke [6].
The “knowledge” factor was measured by taking into consideration three items (Table 1) showing a Cronbach alpha coefficient of 0.73, calculated according to the literature [33]. The items were added and the sum value used for bivariate data analysis as a continuous variable, with a range from 1 to 15. A similar approach was used for the three items evaluated for the “perception of the role of food for health” factor (Cronbach alpha = 0.64). For the “belief in health benefits” factor, four items were considered (Cronbach alpha = 0.67), with the sum value ranging from 1 to 20. Cronbach alpha coefficients above 0.6 indicated internal consistency in the questionnaire and satisfactory reliability in measurements for exploratory research [34].
The concept of functional foods was defined in the questionnaire, using the statement suggested by Verbeke [6]: “Functional foods are normal foods that claim health protection effects when consumed in normal amounts (portions) by healthy people”. The socio-demographic characteristics and two elements of knowledge (items 1 and 2, Table 1) were evaluated before providing this definition thus without the help of the information. The remaining items (3 to 13, Table 1) were administered after defining the concept of functional foods.
Questions addressing coffee consumption habits, knowledge about the health benefits of coffee and antioxidants, and interest in functional soluble coffee were included in the research (Table 2). For these questions and for questions on socio-demographic data collection, multiple choice (question 1–3, Table 2), open-ended (question 4–6, Table 2) and dichotomous (question 7–10, Table 2) items were used.
2.3. Data Analysis
The normal distribution of the data was verified by the Shapiro-Wilk test. As a non-normal distribution was observed, differences between variables were verified using the non-parametric Mann-Whitney U test at 5% probability level. The degree of association between variables was measured using the Kendall’s tau coefficient (τ) at 5% probability levels. Statistical analyses were performed by Statistica 8.0 (Statsoft Inc., Tulsa, OK, USA).
3. Results and Discussion
3.1. Determinants of Functional Foods Acceptance
The average score for acceptance of functional foods obtained by item 4 (“if they taste good”) was, as expected, higher than that obtained for item 5 (“if they taste worse than their conventional counterpart foods” (4.03 versus 2.79, p < 0.05); similar behavior was observed by Verbeke [6,8]. Verbeke [8] reports that it is a strategically risky option to rely only on consumer willingness to compromise the taste of functional foods for health. Figure 1 shows the frequency distribution on the Likert scale for these two items.
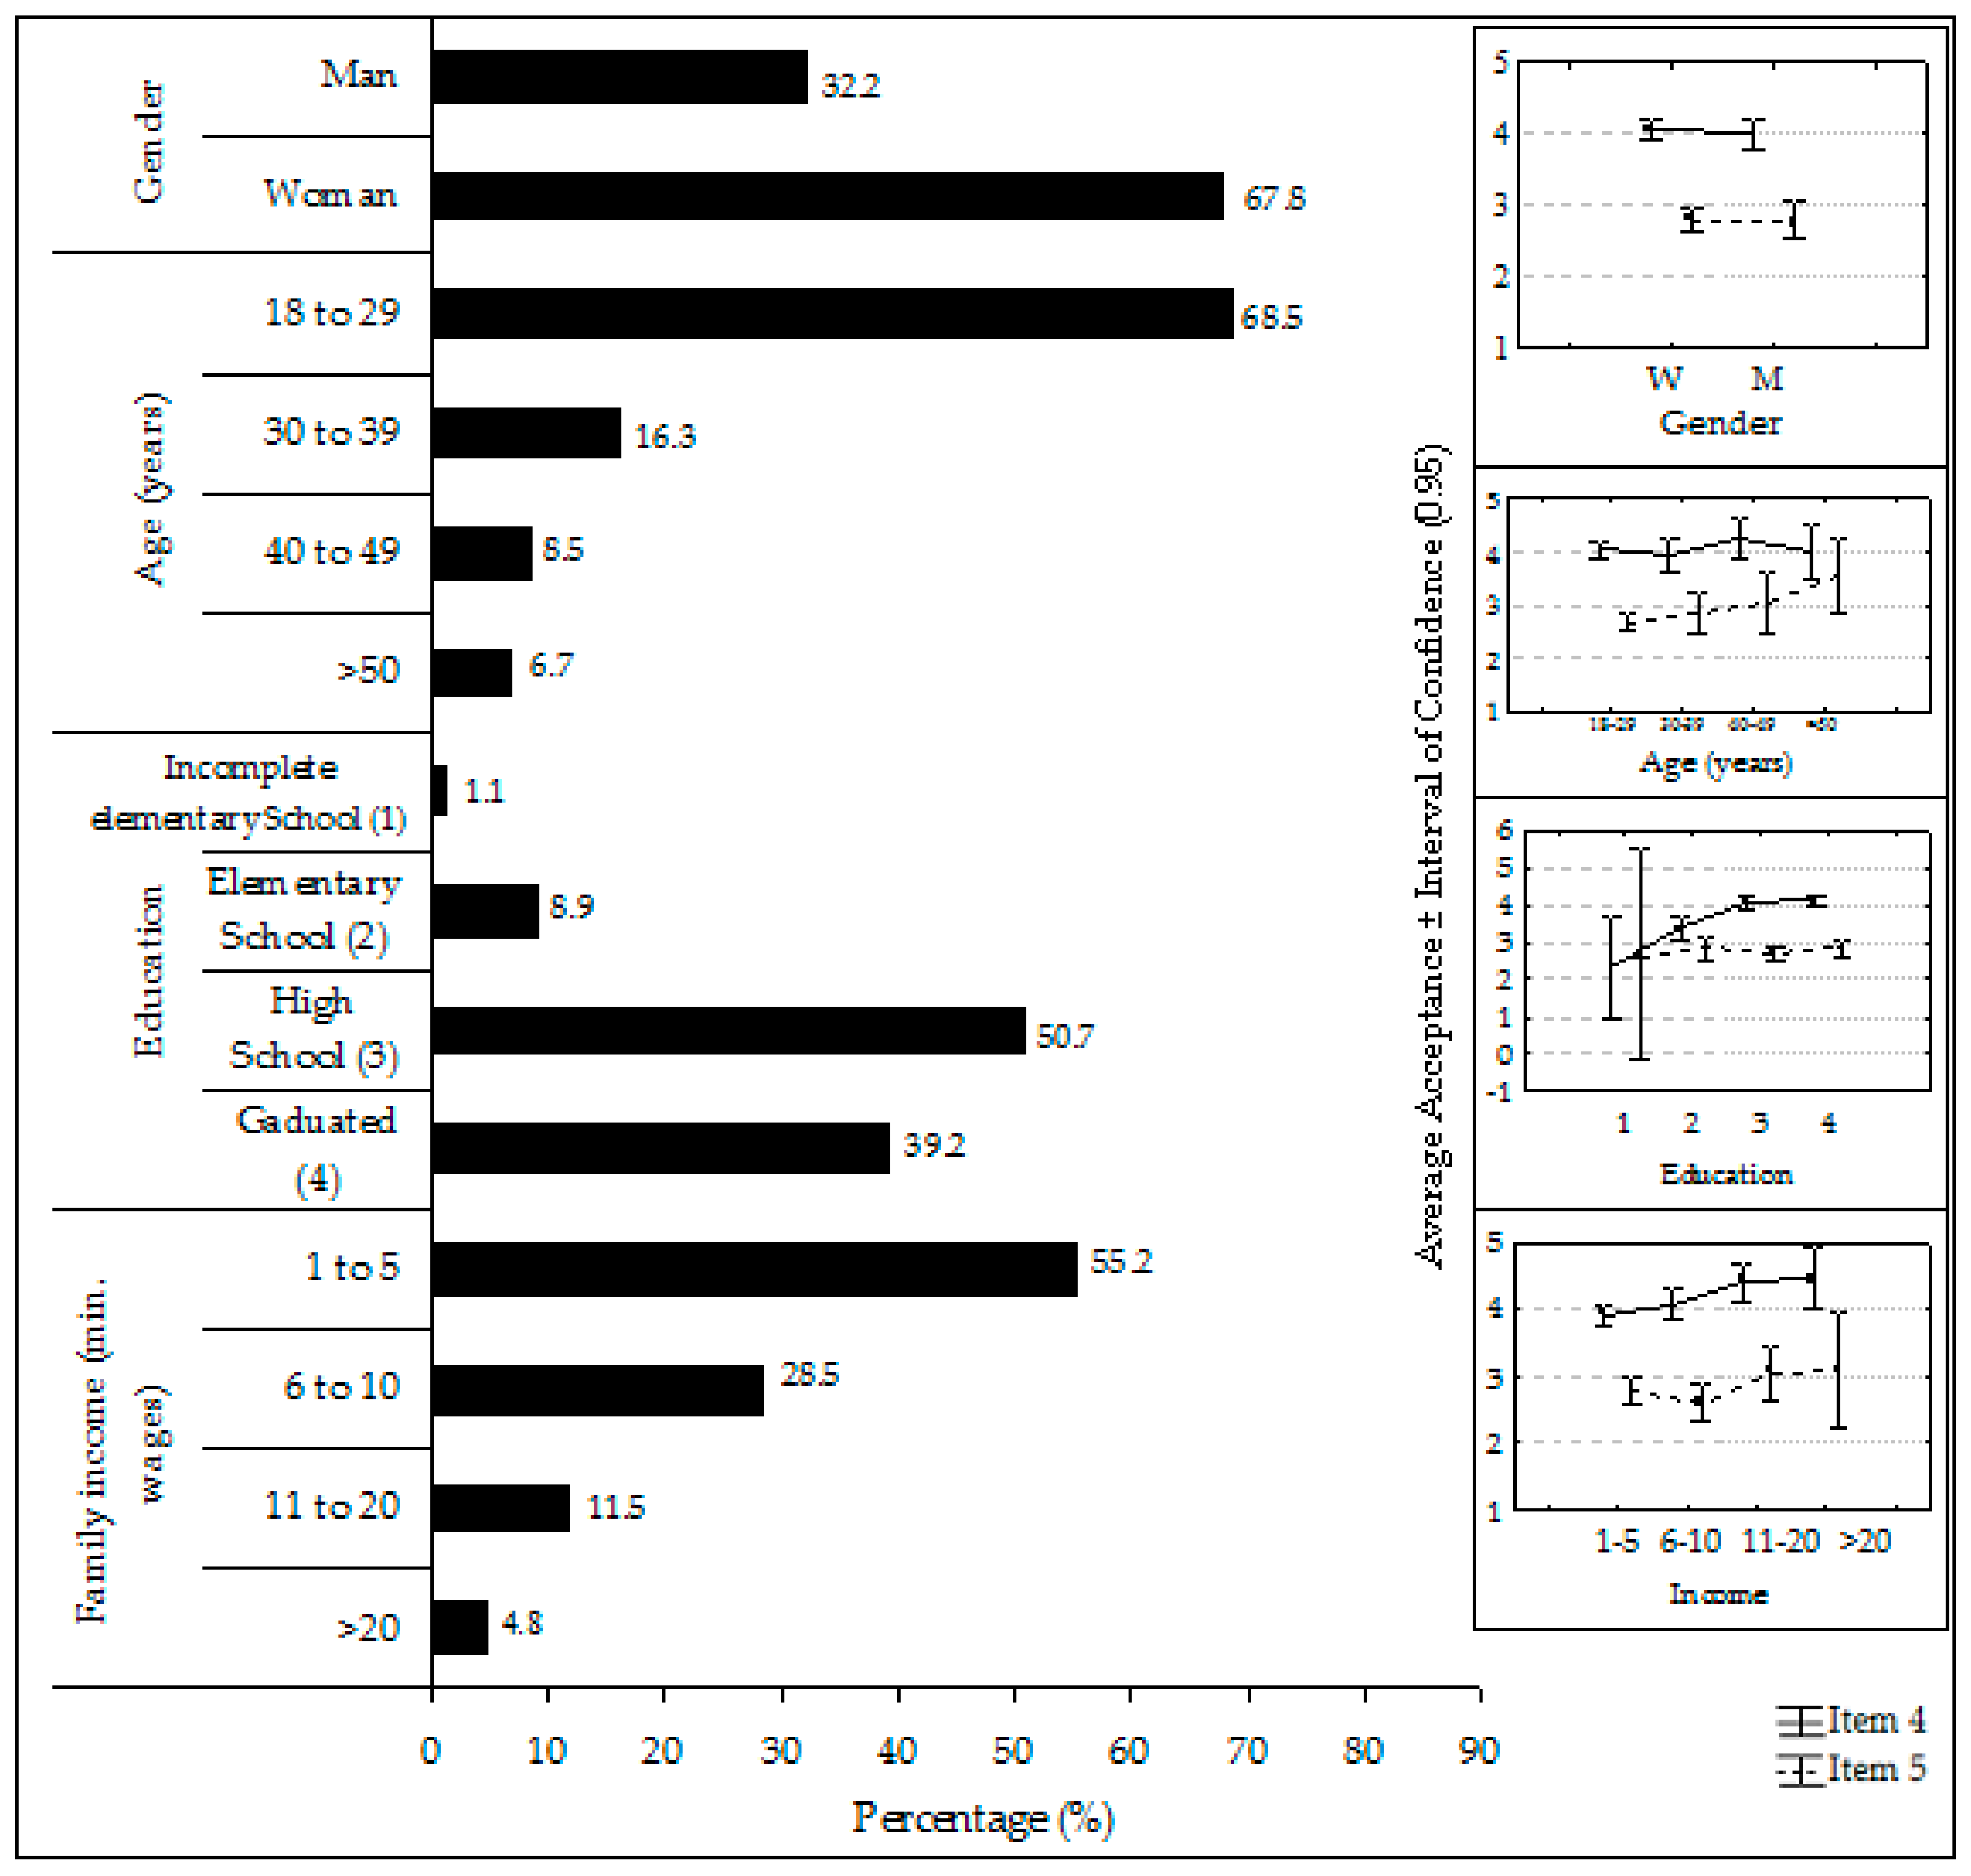
The socio-demographic characteristics of the group and the average acceptance score of functional foods (items 4 and 5) as a function of these characteristics are shown in Figure 2. The fact that the participants were responsible for purchasing food for their homes reflected on the inequality in gender distribution, since in the surveys conducted with coffee consumers, women are still mainly responsible for purchasing coffee for the house (85%) and are the leading consumers of the product (53%) [35].
In the socio-demographic context, the group (Figure 2) shows a similar composition. As for the age and education factors, it includes respondents from a wide age range and all educational levels (Figure 2).
Table 3 shows the correlations between socio-demographic, cognitive and attitudinal determinants and acceptance of functional foods. Age, educational level, and income (number of minimal Brazilian wages) affected the acceptance of functional foods (Figure 2). An increase in the mean acceptance measured by item 4 was observed with the increase in educational level (τ = 0.131, p < 0.05) and income (τ = 0.130, p < 0.05) and by item 5, with the increase in age (τ = 0.144, p < 0.05) (Table 3). It is possible that an increase in the educational level and income contributes to a health concern, and hence a greater acceptance of functional foods especially if they are acceptable in terms of sensorial characteristics. However, the concern would need to be even greater, which may occur with increasing age, so that one accepts the idea of functional even with sensory impairment. The consumers may share some beliefs, however, this will mostly be shaped by the social and cultural influences of their environment.
The gender of the participants was not significantly associated with any of the acceptance statements (p > 0.05) (Table 3). Urala and Lähteenmäki [9] also found no differences in attitudes toward functional foods according to gender, while Verbeke [6] found positive correlations between the acceptance of functional foods and gender (female) and age for Belgian consumers. Considering that the group of males interviewed in our research was made up of participants older (40% over 30 years old) than the female group (28% over 30 years of age), the acceptance of each gender by groups within the same age range was compared for item 5 (p > 0.05). The same behavior was observed for both the female and male gender, respectively (18 to 29 years old: 2.68 vs. 2.63, 30 to 39 years old: 3.00 vs. 2.66 and 40 years or more: 3.14 vs. 3.54). These results confirmed that regardless of their gender, older people with higher incomes and educational levels show a greater willingness to use functional foods, emphasizing once again the importance of studying the target consumer.
Regarding cognitive and attitudinal factors, knowledge had a significant positive correlation with the acceptance measured by both item 4 (τ = 0.168, p < 0.05) and item 5 (τ = 0.137, p < 0.05) (Table 3). As expected, the higher the education level of the participants, the higher the knowledge (τ = 0.328, p < 0.05) was, and the higher the perception of the role of food in health was. A positive correlation was observed between the perception of the role of food in health with its acceptance measured by item 4 (τ = 0.082, p < 0.05) (Table 3). Tudoran, Olsen and Dopico [36] suggested that a health promoting message on a product package is not enough for a health-orientation scheme, and the author highlighted the importance of education level in the consumer health-value orientation.
A positive correlation was also found between the belief in the health benefits of functional foods and the acceptance of these foods either for the statement “if they taste good” (τ = 0.120, p < 0.05), or “if they taste worse than their conventional counterpart foods” (τ = 0.088, p < 0.05). It was observed that gender (higher for females) and increase of the knowledge improve the belief in the health benefits of functional foods (τ = 0.098, and τ = 0.247, respectively, p < 0.05). Verbeke [6] also verified that older participants, females and individuals with more knowledge are greater believers in the health benefits of functional foods (r = 0.123, r = 0.122 and r = 0.348, respectively, p < 0.05). In this way, the fact that Brazilian women are notably the main responsible for purchasing coffee for their homes and are the leading consumers of the product is very positive for the commercialization of a functional coffee product.
Regarding price perception, the claim that “functional foods are very expensive considering their health benefits” got a score of 3.1 ± 1.1 corresponding to the alternative “I do not agree or disagree”. Thus, in general, price did not appear to be a barrier for choosing functional foods, since acceptance did not correlate significantly with the perception of price (p > 0.05). The perception that the price is very high, considering the benefit presented, increased significantly only with the age of the participants (τ = 0.162, p < 0.05) and for men (τ = −0.103, p < 0.05); it should, however, influence the older participants’ opinion less since they already have a better acceptance of the functional foods. This declared behavior was similar to that described by literature [6] for Belgian consumers.
3.2. Demand for Functional Soluble Coffee
Considering that coffee is a widely-consumed beverage (present in more than 80% of households) [2], this work studied the behavior of consumers against a coffee product with an increase in functionality (soluble coffee enriched with antioxidant) and the consumers’ awareness of the alleged functionality of the product. This product type has been commercialized in countries such as France, Spain, Canadian and others, but it is still not marketed in Brazil. Studies about the development of this product has already been made [29]. All participants were consumers of one or more types of coffee brews (Table 4). According to a survey by Euromonitor International [37], the average Brazilian coffee consumption per day is 3.6 cups for women and 3.7 cups for men. In our study, the participants showed a higher consumption of soluble coffee brews compared to the national level (33%) [35], but with a lower frequency (Table 4) than national average (13 days per month) [35].
Milk-soluble coffee is the most usual form of consumption (57%) compared to those who reported consuming pure soluble coffee (50%). The consumption of coffee with milk is second in the ranking of consumption both inside and outside of home, and there may be variations depending on the place and time of consumption [35].
Table 5 shows the participants’ level of knowledge specifically with regards to the benefits of coffee ingestion and antioxidants for health, as well as to their attitude towards the product studied. Data based on the total consumers and highlighting the soluble coffee consumers allow a comparison which takes into consideration the second group’s higher familiarity with soluble coffee.
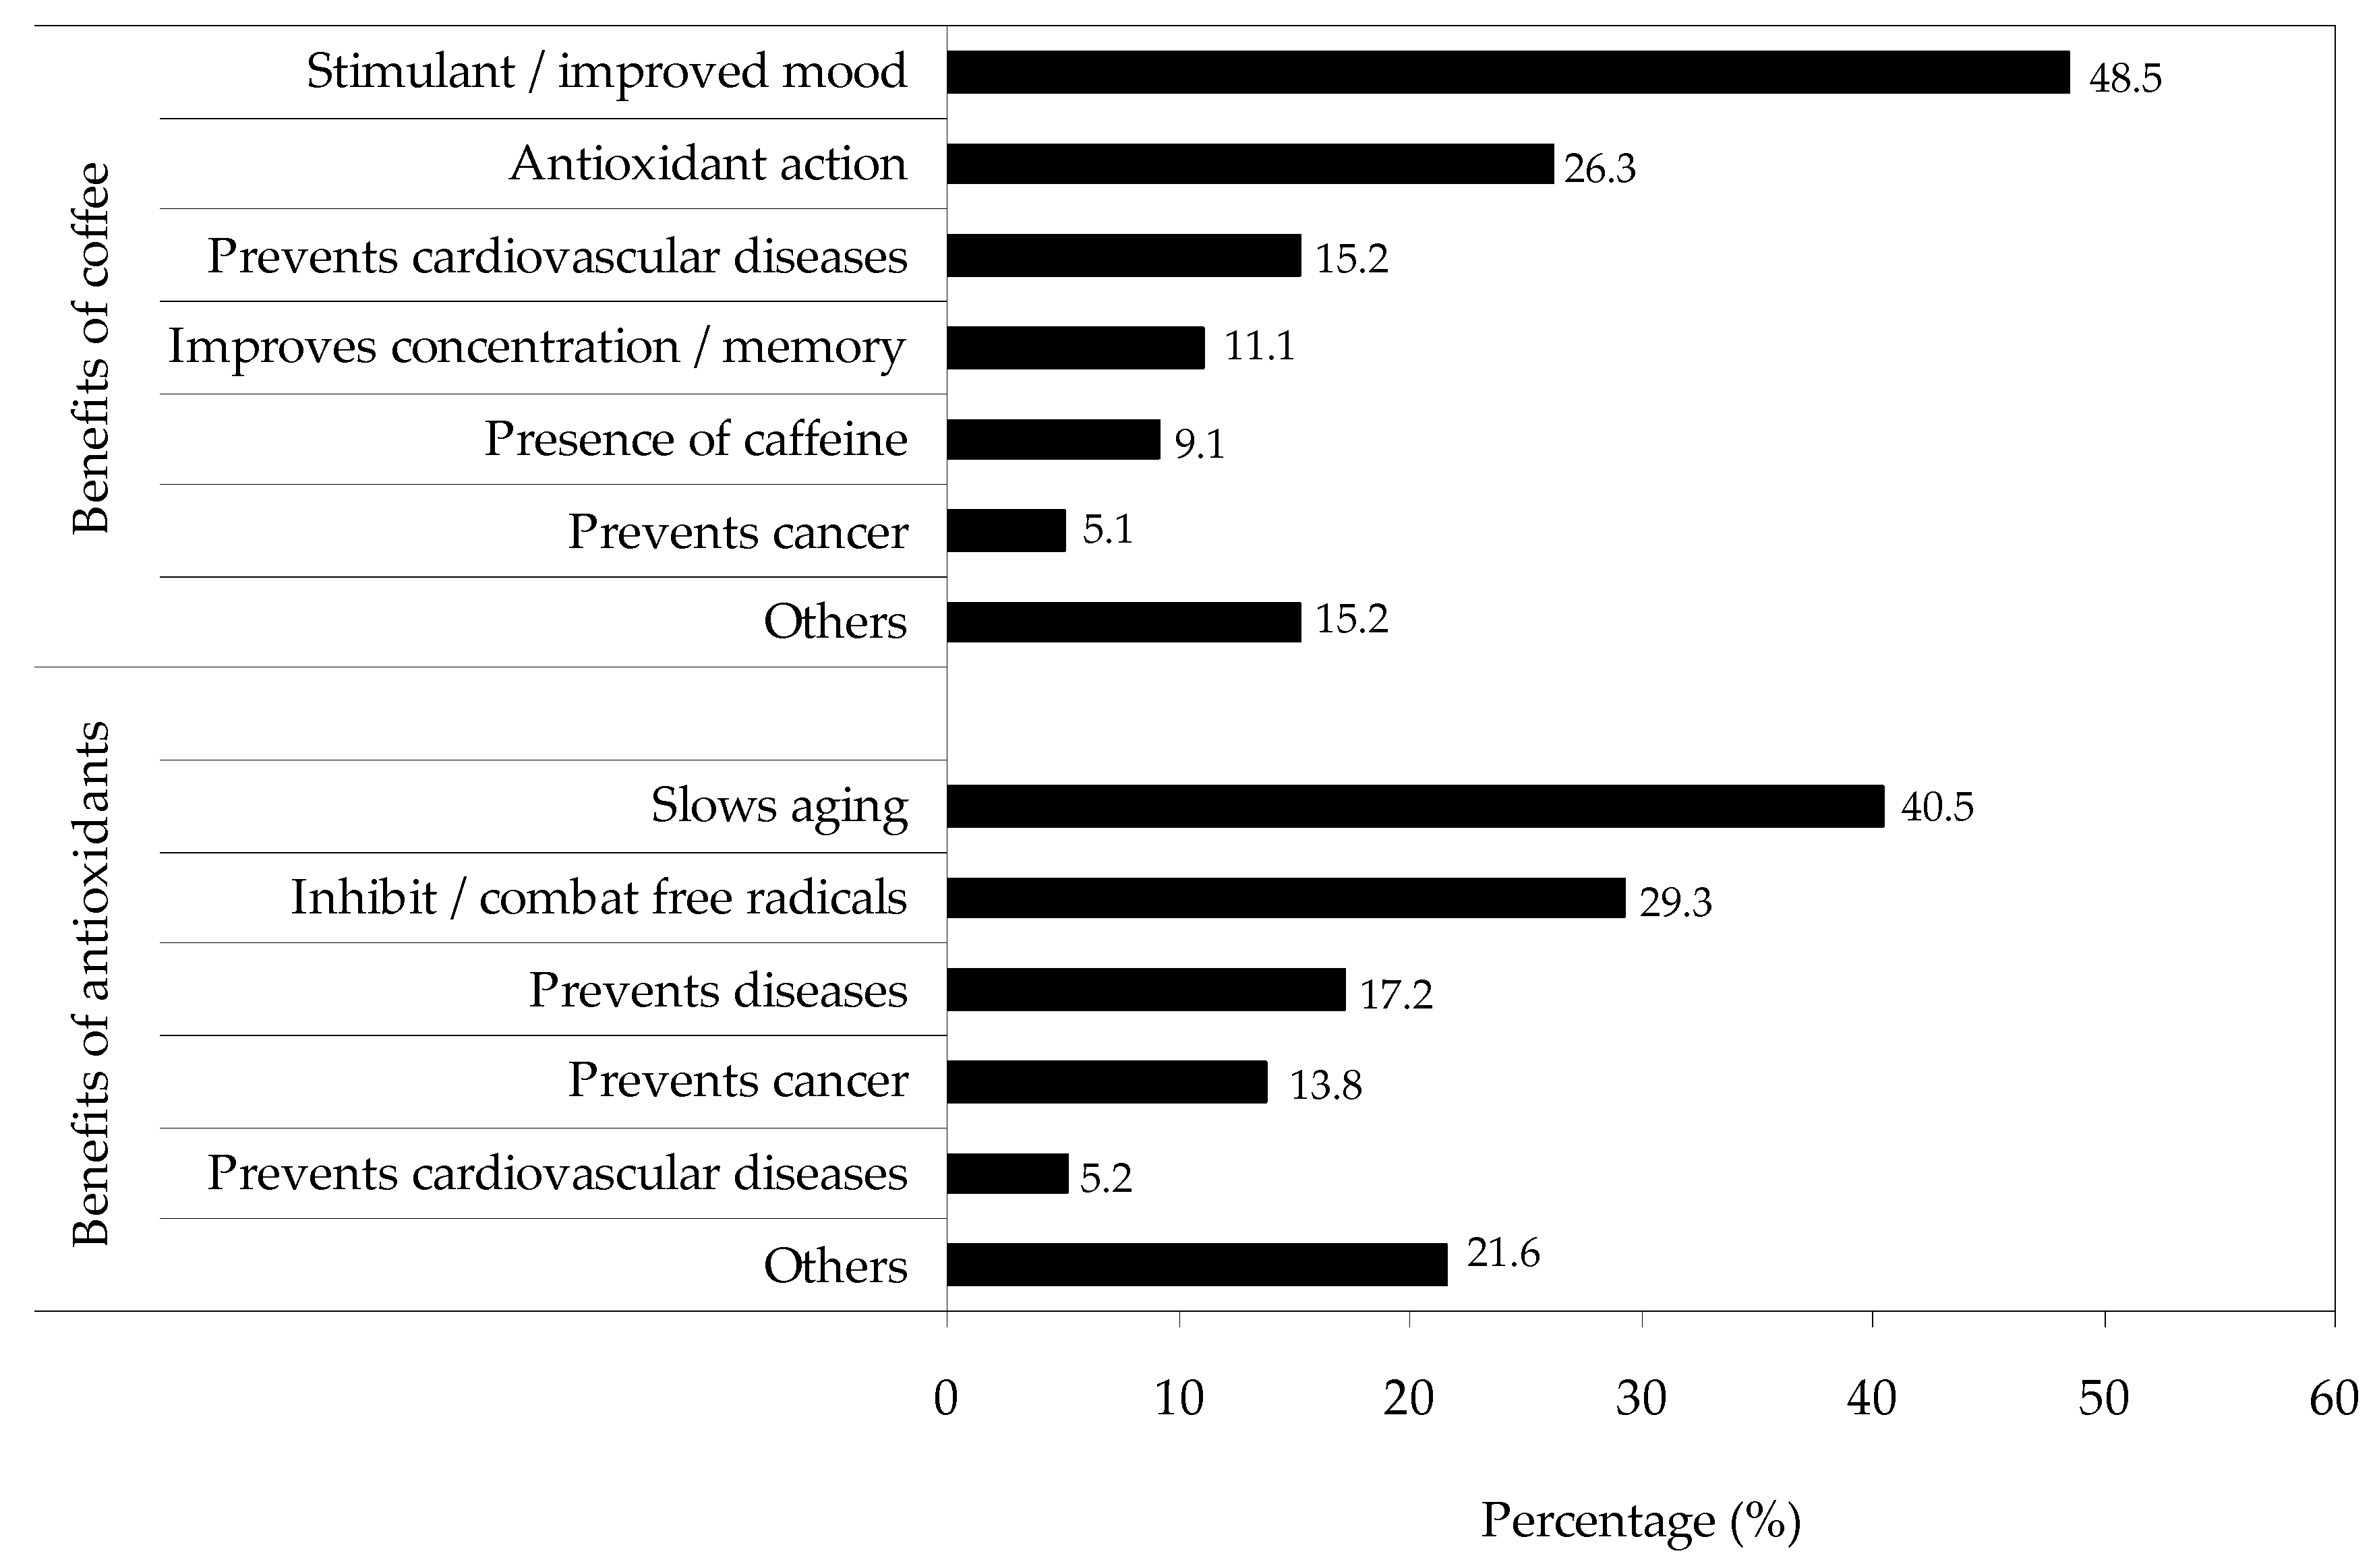
Approximately half of the participants reported having heard of the health benefits of coffee intake (Table 5). It was below the Brazilian average (72%) reported by the ABIC survey [35], in which 36% of the respondents mentioned some benefit. In our research, knowledge was higher among older and more educated participants (τ = 0.109 and τ = 0.328, respectively, p < 0.05) (Table 5). Karina [38] also observed a positive correlation between education level and coffee knowledge (0.4494) in a study with 315 respondents. Among the most cited benefits are stimulant action, similar to that verified by literature [35] (70%), and antioxidant action (Figure 3).
The health benefits of soluble coffee are similar to that of roasted and ground coffee [39,40], however, when the participants were questioned about it, just a few associated the information: 5.6% of the total and 6.9% of soluble consumers (Table 5).
With regards to antioxidants, consumers’ knowledge is more consolidated, with prevention against aging and the inhibition of free radicals as the most frequently cited benefits (Figure 3, Table 5). Older and more educated women showed greater knowledge regarding these benefits (τ = 0.171, τ = 0, 375 and τ = 0.183, respectively, p < 0.05).
In general, the participants’ attitude towards functional soluble coffee (enriched with antioxidants) was quite favorable, considering that most did not know any coffee marketed as a functional product (Table 5). As described for other functional products, the positive attitude towards functional coffee was maintained only when the product kept its sensorial quality. However, a positive attitude towards coffee consumption with worse sensorial characteristics could increase with an increase in knowledge regarding the benefits of coffee ingestion and knowledge about the benefits of antioxidants (τ = 0.101, p < 0.05 and τ = 0,090, p < 0.05). The literature has pointed out that functional products based on a recognized healthy food are more readily accepted by consumers [20,41].
Regarding the willingness to pay more for enriched coffee, higher price did not limit the interest in product consumption, as long as the product had the same flavor (Table 5). However, it depends on the consumer income, since there was a positive correlation between the participants’ higher income and their positive attitude towards a more expensive product (τ = 0.110, p < 0.05). The higher willingness to pay more for the product was also related to an increasing knowledge about the benefits of coffee ingestion (τ = 0.187, p < 0.05) and antioxidants ingestion (τ = 0.143, p < 0.05). According to literature, the consumer is more sensitive to the flavor and aroma of coffee, valuing more its sensorial quality than price [37].
The belief in the health benefits of functional foods also had a positive effect on consumer’s attitude regarding functional soluble coffee enriched with antioxidants. This is related to both the willingness to consume coffee with worse sensorial characteristics (τ = 0.132, p < 0.05) and more expensive coffee (τ = 0.139, p < 0.05).
Consumers who accept functional foods, even when their taste is worse than the conventional alternatives, were also willing to consume soluble coffee enriched with antioxidants (even if they have worse sensorial characteristics) (τ = 0.190, p < 0.05). Thus, coffee with alleged functionality showed the same behavior reported for other functional products. According to the literature, the acceptance and perception of the healthy effect on functional foods depend on the primary product, which serves as the driver for the functional ingredient [7,41].
4. Conclusions
The willingness to consume functional food depends both on socio-demographic characteristics (increasing with the increase in age, income, and educational level), as well as on cognitive and attitudinal determinants (increasing with the increase in the belief in the health benefits/knowledge of functional foods). A reasonable recognition of the benefit of ingesting antioxidants (60% of participants) and coffee (50%) was also verified.
Thus, greater disclosure of the health benefits to consumers can be a useful tool to encourage consumption; however, careful development of products that are cost-effective and with adequate sensory characteristics is also essential.
Consumers that declare a higher willingness to consume functional foods due to their health benefits accept a functional product, even when the price is higher than the conventional product and with worse sensory characteristics. However, in general, a good sensory quality of a functional product, and more specifically of a functional soluble coffee, is more determinant for product acceptance than its price.
Supplementary Materials
The following are available online at https://0-www-mdpi-com.brum.beds.ac.uk/2306-5710/4/4/72/s1, Figure S1: Location of the cities of origin of the study participants.
Author Contributions
Conceptualization, M.T.B.; Data curation, M.P.C. and D.L.K.; Funding acquisition, M.T.B.; Investigation, M.P.C.; Methodology, M.P.C.; Project administration, M.T.B.; Supervision, M.T.B.; Writing—original draft, M.P.C.; Writing—review & editing, M.P.C., D.L.K. and M.T.B.
Funding
CAPES, CNPQ, and Fundo de Apoio ao Ensino, à Pesquisa e à Extensão (FAEP/UEL).
Acknowledgments
The authors thank the Brazilian funding agencies CNPq, CAPES, and Fundo de Apoio ao Ensino, à Pesquisa e à Extensão (FAEP/UEL) for the financial support supplied.
Conflicts of Interest
The authors declare no conflict of interest.
References
- Euromonitor International. Tendências do mercado de cafés em 2017. Available online: http://abic.com.br/estatisticas/pesquisas/pesquisa-tendencias-de-consumo/ (accessed on 20 May 2018).
- Silveira, R.S. Indicadores da Indústria de Café 2017. Available online: http://abic.com.br/estatisticas/indicadores-da-industria/indicadores-da-industria-de-cafe-2017/ (accessed on 25 May 2018).
- Gonçalves, A.C.A.; Ferreira, M.A.M.; Minim, L.A.; Minim, V.P.R. Pesquisa de mercado aplicada à indústria de alimentos. In Análise Sensorial: Estudos com Consumidores, 3th ed.; Minim, V.P.R., Ed.; UFV: Viçosa, Brazil, 2013; pp. 230–274. [Google Scholar]
- Siró, I.; Kápolna, E.; Kápolna, B.; Lugasi, A. Functional food. Product development, marketing and consumer acceptance—A review. Appetite 2008, 51, 456–467. [Google Scholar] [CrossRef]
- Betoret, E.; Betoret, N.; Vidal, D.; Fito, P. Functional foods development: Trends and technologies. Trends Food Sci. Technol. 2011, 22, 498–508. [Google Scholar] [CrossRef] [Green Version]
- Verbeke, W. Consumer acceptance of functional foods: Socio-demographic, cognitive and attitudinal determinants. Food Qual. Prefer. 2005, 16, 45–57. [Google Scholar] [CrossRef]
- Bech-Larsen, T.; Grunert, K.G. The perceived healthiness of functional foods: A conjoint study of Danish, Finnish and American consumers’ perception of functional foods. Appetite 2003, 40, 9–14. [Google Scholar] [CrossRef]
- Verbeke, W. Functional foods. Consumer willingness to compromise on taste for health? Food Qual. Prefer. 2006, 17, 126–131. [Google Scholar] [CrossRef]
- Urala, N.; Lähteenmäki, L. Consumer´s changing attitudes towards functional foods. Food Qual. Prefer. 2007, 18, 1–12. [Google Scholar] [CrossRef]
- Krystallis, A.; Maglaras, G.; Mamalis, S. Motivations and cognitive structures of consumers in their purchasing of functional foods. Food Qual. Prefer. 2008, 19, 525–538. [Google Scholar] [CrossRef]
- Landström, E.; Hursti, U.K.K.; Magnusson, M. “Functional foods compensate for an unhealthy lifestyle”. Some Swedish consumers’ impressions and perceived need of functional foods. Appetite 2009, 53, 34–43. [Google Scholar] [CrossRef]
- Annunziata, A.; Vecchio, R. Consumer perception of functional foods: A conjoint analysis with probiotics. Food Qual. Prefer. 2013, 28, 348–355. [Google Scholar] [CrossRef]
- Goetzke, B.; Nitzko, S.; Spiller, S. Consumption of organic and functional food. A matter of well-being and health? Appetite 2014, 77C, 94–103. [Google Scholar] [CrossRef] [PubMed]
- Bornkessel, S.; Bröring, S.; Omta, S.W.F.(O.); Van Trijp, H. What determines ingredient awareness of consumers? A study on ten functional food ingredients. Food Qual. Prefer. 2014, 32, 330–339. [Google Scholar] [CrossRef]
- Siegrist, M.; Shi, J.; Giusto, A.; Hartmann, C. Worlds apart. Consumer acceptance of functional foods and beverages in Germany and China. Appetite 2015, 92, 87–93. [Google Scholar] [CrossRef] [PubMed]
- Küster-Boludaa, I.; Vidal-Capilla, I. Consumer attitudes in the election of functional foods. Span. J. Mark. ESIC 2017, 21, 65–79. [Google Scholar] [CrossRef]
- Gilbert, L. The functional food trend: What’s next and what Americans think about eggs. J. Am. Coll. Nutr. 2000, 19, 507S–512S. [Google Scholar] [CrossRef] [PubMed]
- Hailu, G.; Boecker, A.; Henson, S.; Cranfield, J. Consumer valuation of functional foods and nutraceuticals in Canada. A conjoint study using probiotics. Appetite 2009, 52, 684–692. [Google Scholar] [CrossRef] [PubMed]
- Chen, M.F. The joint moderating effect of health consciousness and healthy lifestyle on consumers’ willingness to use functional foods in Taiwan. Appetite 2011, 57, 253–262. [Google Scholar] [CrossRef] [PubMed]
- Ares, G.; Gámbaro, A. Influence of gender, age and motives underlying food choice on perceived healthiness and willingness to try functional foods. Appetite 2007, 49, 148–158. [Google Scholar] [CrossRef] [PubMed]
- Ares, G.; Giménez, A.; Gámbaro, A. Influence of nutritional knowledge on perceived healthiness and willingness to try functional foods. Appetite 2008, 51, 663–668. [Google Scholar] [CrossRef] [PubMed]
- Ares, G.; Giménez, A.; Gámbaro, A. Understanding consumers’ perception of conventional and functional yogurts using word association and hard laddering. Food Qual. Prefer. 2008, 19, 636–643. [Google Scholar] [CrossRef]
- Ares, G.; Giménez, A.; Gámbaro, A. Consumer perceived healthiness and willingness to try functional milk desserts. Influence of ingredient, ingredient name and health claim. Food Qual. Prefer. 2009, 20, 50–56. [Google Scholar] [CrossRef]
- Ares, G.; Besio, M.; Giménez, A.; Deliza, R. Relationship between involvement and functional milk desserts intention to purchase. Influence on attitude towards packaging characteristics. Appetite 2010, 55, 298–304. [Google Scholar] [CrossRef] [PubMed]
- Ares, G.; Giménez, A.; Deliza, R. Influence of three non-sensory factors on consumer choice of functional yogurts over regular ones. Food Qual. Prefer. 2010, 21, 361–367. [Google Scholar] [CrossRef]
- Carreiro, J. Pesquisas de mercado apontam maior preocupação com alimentação saudável. Jornal Estadão, 2017. Available online: http://emais.estadao.com.br/blogs/comida-de-verdade/pesquisas-de-mercado-apontam-maior-preocupacao-com-alimentacao-saudavel/ (accessed on 27 May 2018).
- Melo, G.R.C.; Teixeira, A.P.; Zandonadi, R.P. Aceitação e percepção dos estudantes de gastronomia e nutrição em relação aos alimentos funcionais. Alim. Nutr. 2010, 21, 367–372. [Google Scholar]
- Cruz, G.F.R.; Ferreira, M.C.O.; Silva, J.G.; Cucato, J.S.T. O comportamento do consumidor de alimentos funcionais. 2017. Available online: https://singep.org.br/6singep/resultado/611.pdf (accessed on 27 May 2018).
- Corso, M.P.; Vignoli, J.A.; Benassi, M.T. Development of an instant coffee enriched with chlorogenic acids. J. Food Sci. Technol. 2016, 53, 1380–1388. [Google Scholar] [CrossRef] [PubMed] [Green Version]
- Corso, M.P.; Benassi, M.T. Tradução e validação para a língua portuguesa de questionário sobre fatores cognitivos e comportamentais que afetam a aceitação de alimentos funcionais. Alim. Nutr. 2012, 23, 89–94. [Google Scholar]
- Jaeger, S.R.; Axten, L.G.; Wohlers, M.W.; Sun-Waterhouse, D. Polyphenol-rich beverages: Insights from sensory and consumer science. J. Sci. Food Agric. 2009, 89, 2356–2363. [Google Scholar] [CrossRef]
- Vidigal, M.C.T.R.; Minim, V.P.R.; Carvalho, N.B.; Milagres, M.P.; Gonçalves, A.C.A. Effect of a health claim on consumer acceptance of exotic Brazilian fruit juices: Açaí (Euterpe oleracea Mart.), Camu-camu (Myrciaria dubia), Cajá (Spondias lutea L.) and Umbu (Spondias tuberosa Arruda). Food Res. Int. 2011, 44, 1988–1996. [Google Scholar] [CrossRef]
- Hora, H.R.M.; Monteiro, G.T.R.; Arica, J. Confiabilidade em Questionários para Qualidade: Um Estudo com o Coeficiente Alfa de Cronbach. Produto Produção 2010, 11, 85–103. [Google Scholar] [CrossRef]
- Matthiensen, A. Uso do Coeficiente Alfa de Cronbach em Avaliações por Questionários. Documentos. Embrapa. 2011. Available online: http://www.cpafrr.emb rapa.br/embrapa/attachments/871_DOC%2048%202011%20-%20ID%20112.pdf (accessed on 28 June 2013).
- Nielsen. Tendências do consumo de café. Preparado para ABIC. 2014. Available online: http://abic.com.br/src/uploads/2017/10/Tendncias-no-consumo-do-caf-Nielsen-2014.pdf (accessed on 28 May 2018).
- Tudoran, A.; Olsen, S.O.; Dopico, D.C. The effect of health benefit information on consumers health value, attitudes and intentions. Appetite 2009, 52, 568–579. [Google Scholar] [CrossRef] [PubMed]
- Euromonitor International. Tendência do mercado do café. Relatório customizado preparado pelo Euromonitor International para Associação Brasileira da Industria de Café (ABIC). 2015. Available online: http://consorciopesquisacafe.com.br/arquivos/consorcio/consumo/Tendencia_do_Mercado_de_Cafe_-_2015_1.pdf (accessed on 28 May 2018).
- Karina, N. Correlation between Levels of Education and Knowledge of Coffee. Bachelor’s Thesis, Degree in Agricultural Technology, Faculty of Agricultural Technology, Widya Mandala Catholic University Surabaya, Jawa Timur, Indonesia, 2018. [Google Scholar]
- Hatzold, T. Introduction. In Coffee: Emerging Health Effects and Disease Prevention, 1st. ed.; Chu, Y.F., Ed.; Wiley-Blackwell: Oxford, UK, 2012; pp. 1–20. [Google Scholar]
- Marcucci, C.T.; Dias, R.C.E.; Almeida, M.B.; Benassi, M.T. Antioxidant activity of commercial soluble coffees. Beverages 2017, 27, 1–7. [Google Scholar] [CrossRef]
- Van Kleef, E.; Van Trijp, H.C.M.; Luning, P. Functional foods: Health claim-food product compatibility and the impact of health claim framing on consumer evaluation. Appetite 2005, 3, 299–308. [Google Scholar] [CrossRef] [PubMed]
Figure 1.
Frequency distribution on the Likert scale for the functional food acceptance variable (n = 270).
Figure 1.
Frequency distribution on the Likert scale for the functional food acceptance variable (n = 270).

Figure 2.
Socio-demographic characteristics of the participants (n = 270) and their influence on the acceptance of functional foods on a Likert scale. Item 4: “if they taste good”; Item 5: “if they taste worse than their conventional counterpart foods”.
Figure 2.
Socio-demographic characteristics of the participants (n = 270) and their influence on the acceptance of functional foods on a Likert scale. Item 4: “if they taste good”; Item 5: “if they taste worse than their conventional counterpart foods”.

Figure 3.
Consumers’ knowledge of the benefits of coffee intake (n = 99, participants who answered yes with justification) and antioxidants (n = 116).
Figure 3.
Consumers’ knowledge of the benefits of coffee intake (n = 99, participants who answered yes with justification) and antioxidants (n = 116).


Table 1.
Items addressed in the instrument for assessing the impact of cognitive and attitudinal determinants on the acceptance of functional foods.
Table 1.
Items addressed in the instrument for assessing the impact of cognitive and attitudinal determinants on the acceptance of functional foods.
| Knowledge |
|---|
| 1. “I know foods with specific health benefit impacts.” 2. “I know enriched foods.” 3. “How do you judge your knowledge about functional foods?” |
| Acceptance of Functional Foods |
| 4. “Functional foods are all right for me as long as they taste good.” 5. “Functional foods are all right for me even if they taste worse than their conventional counterpart foods” |
| Perception of the role of food in health |
| 6. “Food plays an important role in my health.” 7. “I feel I have control over my health.” 8. “I feel that my food is healthier now than it was five years ago.” |
| Belief in health benefits |
| 9. “Functional foods have a beneficial impact on my health.” 10. “I perceive functional foods as part of a natural way of life.” 11. “Functional foods allow me to take control of my health.” 12. “The consumption of functional foods is a convenient way to get the recommended daily intake of certain components, which I would never get from my conventional diet.” |
| Perception of price |
| 13. “In my opinion, functional foods are very expensive considering their claimed health benefits.” |
Table 2.
Approaches for assessing the demand for soluble coffee enriched with antioxidants.
| Questions |
|---|
| 1. Which type (s) of coffee do you usually consume? 2. How often do you consume soluble coffee (if consumed)? 3. When you consume soluble coffee (if consumed), what is your average consumption (cups)? 4. Have you ever heard of the benefits of coffee ingestion? What are they? 5. Have you ever heard of the benefits of coffee ingestion? What are they? 6. Have you ever heard of the benefits of antioxidants ingestion? What are they? 7. Would you consume functional soluble coffee (enriched with antioxidants)? 8. Would you consume functional soluble coffee if it the sensory aspects (taste, aroma, appearance) were worse than the conventional one? 9. Would you consume a functional soluble coffee if it were more expensive than the conventional? 10. Do you know any type of soluble coffee marketed with a functional claim? |
Table 3.
Matrix of correlation between the socio-demographic, cognitive and behavioral determinants and the acceptance of functional foods (n = 270).
Table 3.
Matrix of correlation between the socio-demographic, cognitive and behavioral determinants and the acceptance of functional foods (n = 270).
| Variables | Gender 1 | Age | LE 2 | Income | K 3 | PRFH 4 | BHB 5 | PP 6 | Item 4 7 | Item 5 8 |
|---|---|---|---|---|---|---|---|---|---|---|
| Gender 1 | 1.000 | −0.092 * | −0.028 | −0.067 | 0.199 * | 0.078 | 0.098 * | −0.103 * | −0.006 | −0.008 |
| Age | −0.092 * | 1.000 | 0.323 * | 0.296 * | 0.109 * | 0.117 * | 0.061 | 0.162 * | 0.024 | 0.144 * |
| LE 2 | −0.028 | 0.323 * | 1.000 | 0.460 * | 0.328 * | 0.137 * | 0.054 | 0.076 | 0.131 * | −0.009 |
| Income | −0.067 | 0.296 * | 0.460 * | 1.000 | 0.220 * | 0.137 * | −0.016 | 0.059 | 0.130 * | 0.018 |
| K 3 | 0.199 * | 0.109 * | 0.328 * | 0.220 * | 1.000 | 0.213 * | 0.247 * | −0.069 | 0.168 * | 0.137 * |
| PRFH 4 | 0.078 | 0.117 * | 0.137 * | 0.137 * | 0.213 * | 1.000 | 0.262 * | 0.056 | 0.082 * | 0.058 |
| BHB 5 | 0.098 * | 0.061 | 0.054 | −0.016 | 0.247 * | 0.262 * | 1.000 | −0.014 | 0.120 * | 0.088 * |
| PP 6 | −0.103 * | 0.162 * | 0.076 | 0.059 | −0.069 | 0.056 | −0.014 | 1.000 | −0.003 | 0.070 |
| Item 4 7 | −0.006 | 0.024 | 0.131 * | 0.130 * | 0.168 * | 0.082 * | 0.120 * | −0.003 | 1.000 | −0.001 |
| Item 5 8 | −0.008 | 0.144 * | −0.009 | 0.018 | 0.137 * | 0.058 | 0.088 * | 0.070 | −0.001 | 1.000 |
1 Gender: Male = 1, Female = 2; 2 LE: Level Education, 3 K: Knowledge, 4 PRFH: Perception of the role of food for health; 5 BHB: Belief in health benefits; 6 PP: Perception of the price; 7 Acceptance: If they taste good; 8 Acceptance: If they taste worse than their conventional counterpart foods; * Significant correlation (p < 0.05).
Table 4.
Participants coffee consumption profile (n = 270).
| Item | Participants (%) |
|---|---|
| Type of consumed coffee | |
| Grounded/Coarse/Filtered | 79 |
| Instant/Soluble | 65 |
| Gourmet | 6.3 |
| Organic | 3.3 |
| Decaffeinated | 1.5 |
| Express | 0.7 |
| Frequency of soluble consumption | |
| Daily | 31 |
| 1 to 3 times/week | 23 |
| Occasionally | 46 |
Table 5.
Participants’ knowledge and attitude regarding the product studied.
| Questioning | Option | Total (%) (n = 270) | Soluble Coffee Consumers (%) (n = 175) |
|---|---|---|---|
| Have you ever heard of the benefits of coffee ingestion? What are they? | Yes | 49.6 | 50.3 |
| Not | 50.4 | 49.7 | |
| YWJ 1 | 36.7 | 39.4 | |
| Have you ever heard of the benefits of consuming soluble coffee? What are they? | Yes | 5.6 | 6.9 |
| Not | 94.4 | 93.1 | |
| YWJ 1 | 4.4 | 5.7 | |
| Have you ever heard of the benefits of antioxidants ingestion? What are they? | Yes | 60.7 | 64.0 |
| Not | 39.3 | 36.0 | |
| YWJ 1 | 42.9 | 44.0 | |
| Would you consume a soluble coffee enriched with antioxidants? | Yes | 96.3 | 96.6 |
| Not | 3.7 | 3.4 | |
| What if it was sensory worse? | Yes | 22.6 | 24.6 |
| Not | 77.4 | 75.4 | |
| What if it was more expensive? | Yes | 61.5 | 65.1 |
| Not | 38.5 | 34.9 | |
| Do you know any kind of functional soluble coffee? | Yes | 3.7 | 2.9 |
| Not | 96.3 | 97.1 |
1 Yes, with justification: Percentage of participants who responded positively and cited the benefit they know.
© 2018 by the authors. Licensee MDPI, Basel, Switzerland. This article is an open access article distributed under the terms and conditions of the Creative Commons Attribution (CC BY) license (http://creativecommons.org/licenses/by/4.0/).
Share and Cite
MDPI and ACS Style
Corso, M.P.; Kalschne, D.L.; Benassi, M.D.T. Consumer’s Attitude Regarding Soluble Coffee Enriched with Antioxidants. Beverages 2018, 4, 72. https://0-doi-org.brum.beds.ac.uk/10.3390/beverages4040072
AMA Style
Corso MP, Kalschne DL, Benassi MDT. Consumer’s Attitude Regarding Soluble Coffee Enriched with Antioxidants. Beverages. 2018; 4(4):72. https://0-doi-org.brum.beds.ac.uk/10.3390/beverages4040072
Chicago/Turabian StyleCorso, Marinês Paula, Daneysa Lahis Kalschne, and Marta De Toledo Benassi. 2018. "Consumer’s Attitude Regarding Soluble Coffee Enriched with Antioxidants" Beverages 4, no. 4: 72. https://0-doi-org.brum.beds.ac.uk/10.3390/beverages4040072
Note that from the first issue of 2016, this journal uses article numbers instead of page numbers. See further details here.