Recent Trends in the Analysis of Chemical Contaminants in Beverages


Department of Analytical Chemistry, Nutrition & Food Sciences, University of Alicante, Campus San Vicente, ES-03690 San Vicente del Raspeig (Alicante), Spain
*
Author to whom correspondence should be addressed.
Beverages 2020, 6(2), 32; https://0-doi-org.brum.beds.ac.uk/10.3390/beverages6020032
Submission received: 24 March 2020
/
Revised: 20 April 2020
/
Accepted: 6 May 2020
/
Published: 17 May 2020
(This article belongs to the Special Issue Chemical Contaminants and Residues in Beverages)
Abstract
:Chemical contaminants should not be present in beverages for human consumption, but could eventually be ingested by consumers as they may appear naturally from the environment or be produced by anthropogenic sources. These contaminants could belong to many different chemical sources, including heavy metals, amines, bisphenols, phthalates, pesticides, perfluorinated compounds, inks, ethyl carbamate, and others. It is well known that these hazardous chemicals in beverages can represent a severe threat by the potential risk of generating diseases to humans if no strict quality control is applied during beverages processing. This review compiles the most updated knowledge of the presence of potential contaminants in various types of beverages (both alcoholic and non-alcoholic), as well as in their containers, to prevent undesired migration. Special attention is given to the extraction and pre-concentration techniques applied to these samples, as well as to the analytical techniques necessary for the determination of chemicals with a potential contaminant effect. Finally, an overview of the current legislation is carried out, as well as future trends of research in this field.
1. Introduction
By definition, beverages are potable liquids for human consumption, which are essential for many physiological functions, such as giving energy and refreshing the body [1]. In general terms, “beverages” include many different products, such as milk, coffee, tea, juices, and alcoholic products, which humans commonly consume in their daily lives [2,3,4,5,6,7]. In agreement with recent literature [8,9,10], the most frequent drinks currently used in the human diet can be classified into two categories: Alcoholic and non-alcoholic beverages. A brief classification of beverages is shown in Figure 1.
The vast majority of beverages, including alcoholic and non-alcoholic drinks, are based on large amounts of water. Nonetheless, water is not classified as a beverage, although in this review, bottled mineral water will be treated as a special kind of beverage, as suggested by some authors [1].
The alcoholic group includes beverages, both distilled and non-distilled, mainly obtained from fruits or grains, with wine and beer having high rates of consumption worldwide, being typical examples of fruit-produced and cereal-produced beverages, respectively [11,12,13].
On the other hand, non-alcoholic beverages are subdivided into carbonated and non-carbonated drinks, including vegetable and fruit juices, prepared or embedded water-based beverages, such as coffee and tea, and dairy products. Carbonated soft drinks are those to which carbon dioxide has been added intentionally to produce a special kind of non-alcoholic liquor, including sodas, cola, lemonade, lemon/lime, tonic, etc.
It is well-known that the beverages market is global, including all categories already mentioned, either alcoholic or non-alcoholic. This industry is in continuous search of innovative and safer products to provide consumers with high-quality products and new tastes that are absolutely free of any potentially hazardous chemicals. In particular, regulatory compliance with the quality of beverages is an important objective to be achieved, not only for companies but also for authorities, policy-makers, and, of course, scientists, as the proposal of new products is linked to scientific advances in food and beverages science and technology. The quality control of beverages is strictly necessary to guarantee their safety and consumers health, as well as to improve their nutritional value [14,15].
The term “contaminants” in beverages includes those compounds that are dangerous to health, whether chemical, physical, or microorganisms. Potential contamination is one of the main issues for consumers when selecting beverages for their use, as it could represent a risk for their health and well-being [16]. Although chemical and biological contaminants are strictly banned in beverages formulation, they can sometimes be unintentionally formed during processing, packaging, and distribution processes. In addition, physical contaminants such as foreign bodies that may be present in beverages must be taken into account (glass, wood, metal fragments, etc.). These may come from raw materials, but also from unintentional contamination from personnel or devices used during the processing and packing of the final product [14].
Particularly, biological contaminants, such as bacteria, fungi, protozoa, and viruses, can enter directly into human cells, triggering severe infectious diseases. Beverages with a strong nutritional characteristic stand out as potential sources for the growth and persistence of this type of contaminant [17]. Therefore, it is essential to avoid their presence in beverages while their early identification is necessary to avoid their spread through the human body after ingestion [10].
Humans may also be exposed to various hazardous chemical pollutants (which are discussed in detail in the following section). The acute toxicity caused by this type of contaminant is forcing food and drinks companies to perform strict quality controls to their products before putting them into the market [14]. However, exposure to low levels of chemical contaminants for prolonged periods is still a clear risk for human health. Many of these substances have carcinogenic, mutagenic, and teratogenic potential [18], and exposure can cause chronic diseases, representing a serious risk to human health [10,19]. A brief classification of contaminants in beverages and their possible sources are shown in Figure 2.
Food packaging facilitates the storage, handling, transport, and distribution of beverages. These concepts are related to inert materials acting as “passive” barriers to separate the packaged product from the environment. Similarly, it must be considered that packaging materials should prevent unintentional migration of harmful chemicals to food and beverages [20]. However, the increasing use of new packaging materials, most of them with specific functionalities, could represent a risk by the potential release of unknown chemicals to food and beverages [21]. These chemical contaminants are directly dependent on the material nature [22] and can be associated with every possible material in beverages packaging [20].
Polymers are mostly used in beverage packaging, with higher rates than other materials, such as glass and tin, mainly due to their low cost and versatility. In general terms, plastic packaging consists of not only individual polymers but also polymeric multilayers where different materials are joined to increase their performance as packaging materials. Polypropylene (PP), high (HDPE)- and low-density polyethylene (LDPE), poly (ethylene terephthalate) (PET), poly (vinyl chloride) (PVC), and polystyrene (PS) are some of the most usual commodities used in beverages packaging [21]. Several contaminants, such as heavy metals, polymer additives, and degradation by-products, can be considered potential contaminants in beverages [23,24,25].
Cans and other similar containers are the main metal-based packaging materials for beverages, particularly aluminum and steel cans. As most aluminum cans are coated with polymer-based coatings in their inner part, direct contact between the beverage and the metal container is quite infrequent. However, it should be highlighted that migration from the coating could take place. Nevertheless, metals-based packaging materials should be studied to guarantee food and beverages safety by avoiding manganese, chromium, tin, zinc, lead, or cadmium migration [26].
This review focuses on discussing the main contaminants potentially present in beverages and their containers, as well as their possible detection techniques, emphasizing discussion of the most recent studies in this area. The effects on human health of these chemicals will also be discussed, including contaminants and their metabolites, which are also an important part of the risk associated with their presence in beverages [27].
2. Chemical Contaminants
The presence of undesired chemicals in beverages and their effect on human health have been largely studied in the last few years. Some of them could be present in the raw materials before processing and end up in the final product. However, the most frequent way for incorporation of chemicals into beverages is through chemical reactions involving some components of the drink itself or through release from packaging materials. Phthalates and heavy metals are described as two of the main contaminants in beverages, as recently reported [18,19]. This section focuses on some of the most important groups of potential chemical contaminants in beverages. They could be organized into two families: (i) Organic compounds (such as phthalates, bisphenol A, and related compounds, primary aromatic amines, perfluorinated compounds, UV ink photoinitiators, ethyl carbamate, and the recently described non-intentionally added substances (NIAS)); and (ii) inorganic compounds (mostly heavy metals). All those chemicals and their main effects are summarized below along with the extraction techniques and analytical methods necessary for their identification and quantification. Their determination requires faster, efficient, reliable, economical, and environmentally friendly analytical methods, which scientists are currently developing to respond to the urgent demand for safe beverages without any trace of contaminants in their composition. The use of innovative instrumentation and protocols is necessary to improve the most relevant analytical figures of merit, such as precision, sensitivity, and specificity, among others [28].
2.1. Inorganic Contaminants
Heavy Metals
Heavy metals are elements naturally found in different environmental matrices in small concentrations (generally lower than 1 mg kg−1), while some of them play important roles for living organisms [29]. However, some heavy metal ions are quite toxic and are considered the foremost inorganic contaminants with high potential to cause negative effects on human health if recommended levels are exceeded. Therefore, they should be monitored frequently in food and beverages to verify their safety for human consumption [16].
Raw materials and added sugars are the most common source of heavy metals in beverages, but their presence as traces in by-products of agrochemical treatments, such as pesticides and fungicides, packaging materials, or as the result of processing technologies should also be considered [21,25].
Arsenic (As), cadmium (Cd), chromium (Cr), lead (Pb), and mercury (Hg) can be considered the most toxic elements potentially present in beverages even at very low concentrations. These elements could induce mutagenicity and carcinogenicity among other negative effects [29]. On the other hand, cobalt (Co), calcium (Ca), copper (Cu), magnesium (Mg), iron (Fe), manganese (Mn), molybdenum (Mo), potassium (K), nickel (Ni), selenium (Se), zinc (Zn), and tin (Sn) are essential elements in many important biological processes within the human body [16]. However, even these elements at high concentrations can cause severe damage to human health [29]. In recent years, the determination of other metals, such as platinum (Pt), rhodium (Rh), and vanadium (V), with potential negative effects on human health, has raised some interest [19]. Pb, Cd, Hg, and Sn have been considered contaminants by the European Commission (EC) regulations [30], while the World Health Organization (WHO) listed, in 2010, Hg, As, Cd, and Pb in its list of the main chemicals with high public health concerns [31]. Their identification and quantification were carried out through different analytical methods. Prior to detection of the analytes, procedures for sample preparation or extraction should be followed to prepare samples for analysis. The main goal of selecting specific analytical methods for heavy metals determination is to obtain the best results fast, with no contamination, and using the minimum amounts of solvents and reagents [16].
Considering that each element has different emission and absorption spectra, atomic spectrometry techniques are the best selection for their identification and quantification. Inductively coupled plasma (ICP) and flame atomic absorption spectrometry (FAAS) are widely used techniques for such purpose. The electrothermal atomic absorption spectrometry (AAS) technique, as well as graphite furnace atomic absorption spectrometry (GFAAS), are currently increasing their importance in these determinations with improved detection and quantification limits with respect to FAAS [29].
A pre-concentration stage prior to the determination by atomic spectroscopic techniques is often necessary in the analysis of beverage samples to increase the analytes concentration while improving the detection limit, precision, and sensitivity by eliminating matrix interferences. Different pre-concentration methods for heavy metals have been reported. Some of them are co-precipitation, cloud point extraction (CPE), ion exchange, liquid–liquid extraction (LLE), solid phase extraction (SPE), dispersive liquid–liquid microextraction (DLLME), or ultrasound-assisted ionic liquid dispersive liquid–liquid microextraction (UA/IL/DLLME), among others [29].
The main reports for the determination of heavy metals in beverages are shown in Table 1, including the combination of extraction and pre-treatment processes with various analytical techniques. The combination of CPE with FAAS was used by Gürkan et al. [32] and Altunay et al. [33] for the determination of Sn and Sb species in canned beverages, either alcoholic or non-alcoholic, and in PET bottles, respectively. These authors reported detection limits of 0.33, 1.68, and 4.28 μg L−1 for Sn (IV), Sb, (III), and Sb (V), respectively. Similarly, CPE has been used for the formation of ion mating complexes and determination of As in water and alcoholic and non-alcoholic beverages, using UV-Vis with 1.14 μg L−1 as the detection limit for As (V) [34]. Matiazzi et al. [35] reported the determination of Sb in juice flavors bottled in PET through AAS, while Uluozlu et al. [36] used co-precipitation as the most adequate pre-treatment for Sn analysis in mineral water and fruit juices (detection limit 0.013 μg L−1). The innovative application of solid surface fluorescence (SSF) to determine Sb and Zn was proposed by Talio et al. [37,38]. Authors reported limits of detection and quantification of 0.36 × 10⁻³ and 1.29 × 10⁻³ μg L−1 in Zn (II) and 0.08 and 0.24 μg L−1 in Sb (III), respectively.
Inductively coupled plasma combined with either mass spectrometry (ICP/MS) or optical emission spectrometry (ICP/OES) has increased their use in the determination of metals due to their many advantages, particularly possibilities to determine many elements in a single run and their excellent detection limits [16]. However, the use of ICP-based techniques shows certain drawbacks, such as their high operating and maintenance costs, as well as high consumption of argon [39].
Different sample treatments for the determination of metals, such as Mn, Fe, Cu, Pb, Zn, Cd, As, Sn, Al, and Hg, in beverages by using ICP/MS and ICP/OES have been proposed. Acid digestion is the most used preparation strategy for beverages either directly or assisted by microwaves (MW), as reported by Görür et al. [40] and Fathabad et al. [41]. Dry ashes (DA) formation was proposed by Abdhel-Rahman et al. [25] to quantify Fe, Mn, Cd, Pb, Ni, Cr, and Cu by ICP/OES in milk derivatives, carbonated drinks, and juices, either bottled in plastic or in cans. Finally, Biata et al. [42] developed a simple and fast UA/IL/DLLME method for the pre-concentration of Sn and Sb traces in beverages with further quantification by ICP/OES.
On the other hand, Whitt et al. [43,44] evaluated different packaging materials based on recycled PET (rPET) with ICP/OES to determine their content in Cd, Cr, Ni, Sb, and Pb. Similarly, Dutra et al. [45] used ICP/MS to quantify the heavy metals content in rPET, recycled HDPE (rHDPE), and rHDPE-multi-layer systems, obtaining values below the legislation limits for the first two materials, while in the rHDPE multi-layer, a higher concentration was observed, which was attributed to the manufacturing process. Similarly, Mertoglu-Elmas et al. [46] determined Pb, Cd, Zn, Ni, and Cu in various materials used in the production of corrugated cardboard by ICP/MS.
On the other hand, a DLLME method for the extraction and pre-concentration of Cd and Pb from soft drinks with further quantification by GFAAS was developed by Mandlate et al. [47]. Limits of detection (LOD) were 0.006 and 0.072 ng L−1 for Cd and Pb, respectively. Finally, a method based on high-resolution continuum source flame atomic absorption spectrometry (HR/CS/FAAS) was developed by Fernández-López et al. [48] to analyze Zn and Cu in a large variety of beverages with excellent results. LODs were 0.040 and 0.016 mg L−1 for Zn and Cu, respectively.
2.2. Organic Contaminants in Beverages
2.2.1. Amines
Biogenic amines (BAs) are basic compounds that are synthesized through some metabolic routes. They are minor constituents of non-fermented raw materials for beverages at low concentrations. Nevertheless, large quantities of these amines have been occasionally detected in specific cases in both beverages and fermented food as a consequence of the presence of contaminating microflora. Therefore, BAs have been traditionally employed as indicators of the sanitary quality of beverages by their microbiota alteration. The chemical structure of the main BAs can be aliphatic, aromatic, or heterocyclic [49] (Figure 3).
Low quantities of BAs are crucial for many human vital processes. However, their ingestion at high concentrations can cause major illnesses through triggering alterations in some important physiological functions, such as cell development, brain activity, corporal temperature, and digestive pH regulation and the immunological response to bacteria and viruses [50]. By consequence, the presence of high concentrations of BAs could lead to headaches, lung distresses, heart palpitation, vomiting, blood pressure disturbances, anaphylaxis, and, lastly, death [51]. Amines with vasoactive activity, such as β-phenylalanine (Phe), tryptamine (Try), and tyramine (Tyr), alter the cardiovascular system, whereas amines with psychoactive function, such as histamine (His), cadaverine (Cad), and putrescine (Put), have their influence on the nervous system. Tyr and His, the most toxic BAs, can be found in beverages, so companies and consumers should pay special attention to them [51]. The effects of BAs on humans are not only dependent on their intrinsic properties, type, and amount, but also on the age, genus, and previous diseases of each individual.
BAs are usually found in beverages, and ripeness or fermentation can contribute to some increase in their concentration. This is particularly critical in wines and fruit nectars, where Cad, spermidine (Spr), spermine (Spm), and Put have been found [52]. No restrictions have been imposed for BAs in beverages, although some European countries have set up recommendations for His in wine not exceeding 2–10 mg L−1 [49].
Primary aromatic amines (PAAs), such as aniline, 2,6-diaminotoluene, 4,4′-methylenedianiline, 2,4-diaminotoluene, or 1,5-diaminonaphthalene, can be found in beverages. These molecules can migrate from packaging materials and are considered toxic compounds and suspected human carcinogens [53]. These compounds can be found in water and food simulants, as well as in beverages that have been in contact with kitchen utensils or plastic laminates/flexible multilayer food packaging materials [54,55].
The choice of analytical techniques for determination of BAs in beverages should take into account the presence of structurally similar compounds that could interfere even at low concentrations. For this reason, SPE and LLE have been considered adequate pre-treatment systems prior to BAs analysis. More recently, micro and miniaturized extraction methods have been reported as useful and eco-friendly analytical tools for BAs extraction. Enzyme-linked immunosorbent (ELISA) methods constitute a rapid and easier alternative for such purpose [56,57].
Due to the fact that amines are not chromophores and their volatility is quite low, a derivatization step is needed [40,41,42]. It has been reported that these previous steps in the analytical procedure improve resolution in liquid chromatography methods [58,59,60,61].
Several methods have been reported for amines detection in beverages (Table 2). In most of them, high-performance liquid chromatography (HPLC), gas chromatography (GC), and capillary electrophoresis (CE) are used [62]. CE methods are rapid and efficient with low reagents consumption. For example, the capillary electrophoresis mass spectrometry method (CE/MS/MS) was applied for the simultaneous assessment of BAs in beer and wine [62]. Emerging electrochemical techniques with different surface/modified electrodes are taking their place as alternatives for amines analysis by their easy procedures and short times required for analysis. A potentiometric sensor with molecularly printed nanoparticles formed through solid-phase printing has also been proposed [63], while electrochemical biosensors are being used for BAs determinations, many of them based on amperometric detection [64].
2.2.2. Bisphenols
Bisphenols consist of two linked hydroxyphenyl groups with hydroxyl functionalities. Bisphenol A (BPA) is the most important compound under this category by many advantageous properties, particularly the antioxidant characteristic (Figure 4). BPA could act as a catalyzer of polymerization reactions, particularly polycarbonates and epoxy resins. In addition, it is extensively employed in the production of phenol resins, polyacrylates, and polyesters. BPA and bisphenol F (BPF) are not only used as precursors of epoxy resins, but also as PVC additives in organosol resins, as they are used to get rid of the spare hydrochloric acid produced in reactions involving PVC [69].
BPA could be found in beverages, making necessary its determination, as the Food and Agricultural Organization (FAO) and the WHO reported negative effects of BPA on animals in concentrations lower than 5 mg kg−1 [70]. The restriction of migration of BPA in food was fixed at 0.6 μg g−1 by the EC [71], and, furthermore, the 2011/8/EU Directive banned the use of BPA in polycarbonate-based children beverage containers [72]. The EC also banned the use of bisphenol F diglycidyl ether (BFDGE) in 2005 [73], while no tolerable limits were set for bisphenol B (BPB). In 2015, the European Food Safety Authority (EFSA) issued a new evaluation of BPA exposure to humans, reducing the tolerable daily intake (TDI) of BPA from 50 to 4 μg kg−1 body mass/day.
Some restrictions in the use of BPA in packaging materials forced companies to replace it by safer chemicals in their formulations and products. For instance, products labeled as “BPA-free” are becoming frequent in canned beverages by containing alternative chemicals, with properties like those of BPA but reduced toxicity and lower estrogenic activity. Among them, BPF, bisphenol S (BPS), and BPB are those with a higher presence as BPA substitutes. These compounds can be found in both soft and canned drinks. However, their use should also be controlled as they show endocrine functions and toxicological profiles similar to BPA, showing some carcinogenic effects.
BPA has been found in infant food, soft drinks [74], and energy drinks [69,75], and it is particularly present in resins employed as inner coatings in metal cans to avoid corrosion. This extensive use could result in beverage contamination due to the presence of metals or bacteria. BPA, which penetrates food and beverages from these epoxy resins, has also been found in recycled paper, probably due to the use of printing dyes.
Electrochemical methods have been reported as those most sensitive and reliable for the BPA detection, as they are fast, repeatable, reproducible, cheap, and do not need pre-treatment steps prior to analysis [1]. For example, BPA was detected in modified polyglycerol esters (PGE) from teethers and feeding bottles for babies [76]. Surface analysis was carried out by scanning electron microscopy (SEM) and analysis was performed by electrochemical methods. These methods showed a low LOD of 134 pg L−1. In addition, a carbon electrode with nanoparticles obtained by reduction from cuprous oxide-wrapped graphene oxide (Cu2O-rGO) was designed as an electrochemical BPA sensor with a very low LOD, 5.3 × 10⁻⁸ M [77].
Another electrochemical sensor for detecting BPA in water with differential pulse voltammetry (DPV) has been recently developed [78]. This sensor was fabricated with multi-walled carbon nanotubes (MWCNT) and gold nanoparticles (AuNP) forming a coating for a glass-carbon electrode. Good recoveries were obtained with this sensor. A NiO/CNT nanocomposite/ionic liquid carbon paste electrode (NiO/CNT/IL/CPE) was also developed for BPA quantification [78]. Authors compared the unmodified and modified electrodes and reported that the LOD obtained was 0.04 μM. Table 3 summarizes examples of electrochemical sensors for BPA found in the literature.
A new specific, reliable, and highly sensitive method for determination of several bisphenols in canned energy drinks was described by Gallo et al. [69]. Authors used ultra-performance liquid chromatography (UPLC) with fluorescence detection (FLD), after pre-treatment by using molecularly imprinted polymers (MIPs), allowing the simultaneous determination of BPA, BPF, BFDGE, BPB, and bisphenol A diglycidyl ether (BADGE) down to 0.50 ng mL−1. This method was applied to the determination of these contaminants in forty energy drinks. MIP are specific chromatographic solid stationary phases with active sites, creating a 3D system with high specificity and even selectivity for the molecule to be trapped. This method also allowed purification of the obtained product, making this method more effective than SPE procedures [69]. Other authors reported the existence of matrix effects in the determination of bisphenols due to the co-elution of other species, which can interfere. These authors proposed several strategies to solve these problems, either improving the sample-treatment procedures or increasing the resolution of the chromatographic separation by changing the gradient program [79].
BPA and perfluorinated compounds were extracted from children beverages and were enriched using solid phase microextraction (SPME). The SPME device was covered by a very thin film of polyaniline and nanocomposites based on multi-walled carbon nanotubes (PANI/MWCNTs) by means of electrochemical deposition. Analytes were desorbed and ionized inside a glass capillary by electrospray ionization (ESI) and ions were, furthermore, analyzed by tandem mass spectrometry [80].
A SPE method combining cationic exchange and reversed-phase mechanisms was enhanced to offer a selective extraction and purification of BPA and analogs. Pyridine-3-sulfonyl chloride can be used as the most adequate derivatizating agent for bisphenols, in particular by their ionization efficiency in ESI [81].
2.2.3. Phthalates
Phthalates are diesters of 1,2-benzene dicarboxylic acid (or ortho-phthalic acid) and they are organic lipophilic compounds with the structure shown in Figure 5. Phthalates are mainly used as plasticizers in the formulation of polyethylene, PVC, and other rigid polymeric materials to increase their flexibility by their molecular interaction with polymeric chains [103], also increasing their durability [104]. As phthalates are not linked with polymeric chains, they are easily released from the matrix and, consequently, the possibilities of contamination to beverages should be studied [105].
A common characteristic of phthalates is that they can be quickly hydrolyzed to monoesters, which can also be transformed into their metabolites. It has been reported that phthalates analysis in urine can be used as a biomarker to assess human exposure to these compounds [70]. It should also be considered that the amount of phthalates in spirits and wine is limited according to the EU Regulation No 10/2011 of 14 January 2011 on plastic materials [106] with strict specific migration limits of 0.3, 1.5, and 30 mg L−1 for di(butyl phthalate) (DBP), di(ethyl hexyl phthalate) (DEHP), and butyl benzyl phthalate (BBP), respectively.
Therefore, innovative analytical techniques and methods have been recently reported for the detection of phthalates in beverages, as shown in Table 4. Most reports for monitoring phthalates focus on simple samples, e.g., phthalates migration into water from plastic bottles. Nevertheless, the migration of phthalates from polymers-based packages to complex beverages matrices, such as juice, carbonated beverages, milk, etc., is difficult to evaluate, as their release during the usual times of processing and use in beverages is small enough to remain at values below the LOD of the selected techniques [103]. The most common analytical methods used for phthalates determination involve GC coupled to mass spectrometry detection (GC/MS), which permit the quantification of phthalates in beverages at concentrations as low as μg kg−1. This is the reason why these methodologies usually include a pre-concentration step, for example, LLE or SPE, as well as micro-extraction methods, such as SPME, liquid-phase microextraction (LPME), or DLLME [103,107].
A previous set of pre-treatment operations including cutting into small pieces is necessary for the determination of phthalates released from packaging materials. A further extraction step with n-hexane/acetone (1:1; v:v) with centrifugation and further recovery of analytes from the supernatant has also been reported prior to injection into GC/MS [105].
2.2.4. Pesticides
Chemical pesticides are increasingly employed in agricultural practices. However, their use can lead to environmental problems and the appearance of unexpected contaminants in the final products. In general terms, these pesticide residues include insecticides, herbicides, and fungicides based on organophosphorus, organochlorine, pyrethrin, pyrethroids, carbendazim, carbamates, carbofurans, and acetamiprid. There is great concern about their extensive use and the possibilities to be present in beverages, as some of their raw materials are vegetal products. For instance, wine producers use a large amount of pesticides in vineyards to increase production, with the risk of allowing some residues to reach the final product if they are not well removed during processing. Fruit juice and beer producers have similar problems with pesticides. Organizations such as FAO and WHO established a joint Commission to coordinate food standards, including beverages, and they established some universal maximum levels for pesticides expressed in mg kg−1. [112].
Identification and quantification of pesticide residues in beverage matrices can be accomplished by applying different pre-treatment and pre-concentration methods to permit a clear reduction in the complexity of sample treatments while increasing the accuracy of the analysis.
The proposal of new sustainable extraction techniques where the use of solvents is greatly reduced has resulted in a wide range of novel and alternative procedures based on LPME, using hollow fiber membranes (HF/LPME), SPE and its miniaturization through SPME, dispersive solid-phase extraction (DSPE), DLLME, matrix solid-phase dispersion (MSPD), and single-drop microextraction (SDME). Chromatographic techniques are the most usual selection for separation of individual compounds from a complex matrix, such as those from beverages, as they provide excellent results in terms of separation, resolution, and selectivity [112]. GC/MS, tandem GC/MS/MS, HPLC/MS, and tandem HPLC/MS/MS are the most common techniques for such determinations, as shown in Table 5. Cladière et al. [113] selected a total of 32 compounds, including pesticides, and used LLE with HPLC with time-of-flight MS (HPLC/MS/ToF) for their determination, obtaining LODs between 0.1 and 6.9 ng mL−1, at the best and worst case scenarios, respectively. Bolaños et al. [114] also used HF/LPME hyphenated with HPLC/MS/MS for the determination of 51 pesticides from alcohol beverages obtaining low values of LOD in the interval between 0.01 and 5.61 μg L−1. Dias et al. [115] evaluated the pesticides content in red wine, obtaining low limits of quantification (LOQ) (1–50 μg kg−1) by using HPLC/MS/MS without any pre-treatment. Pérez-Ortega et al. [116] included a preliminary pre-concentration stage by SPE before determining 60 pesticides in wine with HPLC/MS/ToF. They obtained excellent results with low LOD values (0.04–3.80 μg L−1). Ferrer et al. [117] reported the determination of 53 pesticides in fruit juices by direct injection to HPLC/MS/MS with LOQs obtained of the order of μg L−1. Durak et al. [118] evaluated the presence of five pesticides in tea samples by switchable solvent liquid phase microextraction followed by gas chromatography with mass spectrometry detection (SS/LPME/GC/MS), obtaining LOD values between 0.44 and 1.5 ng mL−1. Anjos et al. [119] developed an efficient procedure for the analysis of pesticides in samples of coconut juice, using SDME in combination with GC/MS. This procedure obtained good LODs (0.1 and 0.88 μg L−1) and LOQs (1.21 and 6.69 μg L−1). Mohebbi et al. [120] introduced the combination of DSPE and DLLME for the analysis of pesticides in juices at trace levels (ng mL−1) before its quantification by GC/FID. They obtained good results with low LODs (0.32–0.76 ng mL−1) and LOQs between 1.1 and 2.6 ng mL−1. A rapid and sensitive method was developed by Zhu et al. [99] to determine 131 pesticides in tea samples using GC/MS/MS preceded by DSPE with LOD values in the 0.5–5 μg kg−1 range. Huang et al. [121] also used a novel modified DSPE protocol with HPLC/MS/MS detection for the determination of 102 pesticides in green tea with LOD and LOQ values between 0.03 and 15 μg kg−1 and 0.1 and 50 μg kg−1, respectively. Similarly, DSPE was used by Lozano et al. for the analysis of 86 pesticides in tea by HPLC/MS/MS and GC/MS/MS [122]. Authors highlighted the necessity to develop selective extraction methods to ensure good recoveries and help to decrease matrix effects. Omote et al. [123] selected a total of 277 pesticides to be determined in beer at the 0.001–0.02 mg kg−1 level. They used LLE and subsequent solid–liquid extraction (SLE), prior to quantification by HPLC/MS/MS. Dušek et al. [124] carried out the evaluation of the persistence of 58 pesticides in beer, which were extracted using the Quick, Easy, Cheap, Effective, Rugged, and Safe method called QuEChERS for subsequent identification and quantification by HPLC/MS/MS. They determined that thermostable pesticides were the most potential risk category due to their persistence in the final product and consequent human exposure. Hengel et al. [125] evaluated the presence of 72 pesticides in various beer samples, known to be previously used in the commercial production of hops. They obtained good results with low LODs (0.024–0.322 ng mL−1) and a LOQ of 0.5 ng mL−1. The method used was LLE followed by detection using HPLC/ESI/MS/MS. Nagatomi et al. [126] developed an SPE-based method, followed by HPLC/MS/MS, to simultaneously analyze five pesticides on 15 different canned beer samples, obtaining high sensitivity with a LOQ of 10 mg kg−1. Inoue et al. [127] also evaluated the persistence of more than 300 pesticides throughout the beer production process and their persistence in the final product. The method consisted of an extraction using QuEChERS with subsequent identification and quantification by HPLC/MS/MS. On the other hand, the combination of SPE with HPLC/MS/ToF was used by Gilbert-López et al. [128,129] for the determination of a large group of representative pesticides in fruit-based soft drinks. The obtained LOQs varied in the μg L−1 concentration level.
2.2.5. Non-Intentionally Added Substances (NIAS)
NIAS are substances that appear in food and beverages packaging materials, but they have not been purposely added during processing. NIAS can be formed in specific processing and use conditions, and they can be released from the material’s surface in contact with food and beverages (Figure 6). They could arise as a consequence of reactions between different components in packaging materials and their own degradation, fundamentally due to impurities present in the precursor materials [130]. Many NIAS are detected by using high-sensitivity analytical techniques, but the elucidation of their chemical structure is often a challenge. It is expected that a greater number of these chemicals will be detected in the coming years, while the development of new analytical methods continues to respond to these unknown compounds [131].
The EU Regulation 10/2011 on materials in contact with food [106] establishes how NIAS can be formed. This was the first time that NIAS was defined and subject to a risk assessment study and legislation. However, no levels of migration or exposure to NIAS are established in these regulations. Threshold limits have been set up to some undesired substances in contact with beverages that should not migrate in levels above 10 µg kg−1 of food [133]. Standard protocols for NIAS identification have not been proposed, and just some methods to carry out direct analysis on food-preserving material or food/beverages simulants have been reported. Depending on the target analyte, gas or liquid chromatography can be employed, generally coupled to MS to allow the accurate assignment of NIAS chemical structures. Nevertheless, a large number of these compounds have not been identified yet and much work is still necessary in this area. However, despite these drawbacks, identification of NIAS is a trending topic in materials research, as well as a complete risk assessment of these compounds. In general terms, the focus is currently on NIAS with a molecular weight lower than 1000 Da as it is considered that compounds with a higher molecular weight have not the necessary characteristics to effectively reach food and beverages by migration [131].
Several analytical approaches have been recently proposed for the determination of NIAS in plastics in contact with beverages (Table 6). Methods based on chromatographic techniques, such as HPLC/MS, GC/MS, or GC/MS with headspace solid phase microextraction (HSSPME), have been proposed [26]. However, other methods related to direct analysis, such as an atmospheric solid analysis probe, direct analysis in real time, or desorption ionization, are currently under development [131]. Spectroscopy techniques, like Raman, have been proposed for the identification of NIAS, as no sample pre-treatment is required [134].
Ramos et al. [130] evaluated the potential of HPLC with a quadrupole time-of-flight-triple quadrupole mass spectrometer detector (HPLC/Q/TOF/MS/MS) for the identification of 26 potential migrants in different packaging materials, such as LDPE with nylon composites and other PE-based materials. Many compounds identified by them were previously named as NIAS, although just one of them, i.e., caprolactam, appeared in the EU-Regulation No 10/2011 [106]. They also stated that PE-based materials released NIAS at concentrations higher than those detailed in the legislation. Athenstädt et al. [135] identified the migration of NIAS from polyurethane (PU) by using GC/MS, as well as HPLC/MS with ESI. Thirteen different chemicals were detected as NIAS, of which 11 were identified as cyclic esters. Felix et al. [136] used headspace/SPME and GC/MS to identify potential NIAS migrating from PU adhesives joined to PET, polyamide, PP, PE, and PE/vinyl ethyl alcohol films. In this case, two food simulants were used and more than 63 potential NIAS were detected. Caprolactam was also identified in the same way by Ramos et al. [130]. The use of UHPLC/MS/TOF was reported by Canellas et al. [137] to study migrating compounds from sealants in food cans whose concentration was above the legislative values.
Bauer et al. identified 42 migrants, including 39 NIAS, by HPLC/Q/TOF/MS [138]. Martínez-Bueno et al. [139] proposed a multi-analytical approach to evaluate previously undetected NIAS that could release from a monolayer film with polylactic acid (PLA), polylimonene (PL), and zinc oxide nanoparticles (ZnO NPs) by ICP/MS to identify the possible transfer of zinc oxide nanoparticles from the polymeric matrix as an antimicrobial agent. They reported the detection of seven NIAS, three by GC/MS and four by HPLC/MS. In another study conducted by Osorio et al. [140], 21 NIAS, including three oligomers, were identified as potential migrants by GC/MS. Garcia-Ibarra et al. [141] analyzed 12 plastic materials in contact with beverages to evaluate their possible migration to simulants by using GC/MS. Around a hundred different organic compounds were detected, including NIAS, most of them not included in the current legislation. Migration of various compounds from almost 30 PP films used in beverages packaging was analyzed by UPLC/MS/QTOF by Vera et al. [142]. In addition, 76 compounds were identified and 75% of them were considered NIAS produced as a result of the degradation of the raw materials used in the polymer formulations. In addition, Portesi et al. [134] used rapid and non-destructive confocal Raman spectroscopy for semi-quantitative analysis of NIAS in LDPE. Four major NIAS were identified, and these results were confirmed by ICP/MS analysis. Finally, Cincotta et al. [143] developed a method based on HS/SPME/GC/MS to determine the release of NIAS based on the time of storage in PET bottles. They obtained good results in terms of linearity, precision, and detection with low LOD (0.05–0.17 μg L−1).
2.2.6. Other Contaminants in Beverages
Perfluorinated compounds (PFCs) are another type of chemical contaminant in beverages. These compounds in general, particularly the two main compounds under this class, i.e., perfluorooctanoic acid (PFOA) and perfluorooctane sulfonate (PFOS), are used in multiple applications, but they show the serious shortcoming of being persistent in the environment [144]. Direct exposure of beverages to PFOS and PFOA could occur due to processing and use [79], although with their precursors, such as fluorotelomeric alcohols (FTOH), perfluorooctane sulfonamides (FOSA), and perfluorooctane sulfonamidoethanols (FOSE). It should be noted that polyfluoroalkyl phosphate (PAP) esters are FTOH precursors and could thus lead to PFOA. These compounds have been the object of some attention by their extensive use in containers made of cardboard and paper, such as milk and fruit juice commercial multilayers [54]. These compounds have a carbon–fluoride bond, which is chemically stable and gives them a high possibility of persistence in the environment, which could result in bioaccumulation in biological tissues. It has also been described that PFOS and PFOA can negatively influence the endocrine system, as well as acting as potential tumor promoters [145]. Therefore, EFSA has established a TDI value of 150 and 1500 ng kg−1 body weight/day for PFOS and PFOA, respectively [146].
Guerranti et al. [144] reported the accurate determination of PFOS and PFOA in milk by using HPLC/ESI/MS with concentrations in real samples lower than LOD. Haug et al. [147] also determined PFCs in 21 food and beverages samples from Norway. About 20 PFCs were detected, including PFOA and PFOS. Previous extraction was performed by alkaline digestion and liquid extraction, followed by SPE and further detection by HPLC/ESI/MS. Zabaleta et al. [145] proposed the use of high-performance liquid chromatography with a triple quadrupole mass spectrometer (HPLC/QqQ/MS/MS) to determine multiple PFCs and potential precursors in packaging materials for milk and coffee. Similarly, the concentrations of various PFCs in almost 400 food samples (including beverages) were determined with HPLC/MS/MS and different pre-treatment methods by Heo et al. [61]. The concentration was variable up to maximum values of 48.3 ng g−1, corresponding to PFOA in beverages.
Inks are traditionally applied to food packaging materials including those used in beverages. They usually comprise polymeric resins, pigments, dyes, and other compounds. The main goal of printing inks is to provide technical data about the packaged food in the label or the external part of the package. The use of these compounds is regulated by the European Printing Ink Association, where hundreds of compounds are recommended for their use in this application [148]. It is known that the migration of these components from the container to beverages can occur during processing or storage [54]. It should also be noted that the use of UV-cured printing inks has increased compared to solvent-based inks, which have traditionally been considered dangerous for the environment and for humans [149].
Aznar et al. reported the presence of 17 migrants from inks normally used in beverages packaging by using UPLC/Q/TOF/MS [148]. Blanco-Zubiaguirre et al. [150] evaluated the migration of 97 chemicals, including photoinitiators, from paper and cardboard materials in food simulants by HPLC/QqQ and high-performance liquid chromatography Orbitrap (HPLC/qOrbitrap), obtaining significant concentrations of benzophenone and 4-phenylbenzophenone in values close to limits set by the EU legislation. Chang et al. developed a HPLC/MS/MS procedure to identify 30 different photoinitiators in ten types of packaging materials for fruit juice [151]. The sample was treated with QuEChERS and some compounds were quantified at concentrations between 2.2 and 152.9 ng g−1. A QuEChERS/LC/MS/MS method was also used by Gallart-Ayala et al. for the determination of 11 inks in packaged foods (including fruit juices, water, and wine) at ng kg−1 levels [152]. In addition, 13 compounds were identified after migration in PE-based materials in different food simulants by Zhang et al. [153] who used SFC/PDA/MS/MS. They obtained low LOD values, between 0.02 and 2.16 μg L−1. Finally, Vavrous et al. [154] studied the detection of around 70 potential contaminants (including photoinitiators) in materials in contact with food and beverages, using ultrasonic extraction by QuEChERS and HPLC/MS/MS with low LOQ (between 0.0013 and 0.22 mg kg−1).
Urethane or ethyl carbamate (EC) is the ethyl ester of carbamic acid and it is sometimes present as a by-product in beverages processing in which processes like fermentation, distillation, and long-term storage are included. EC can be introduced into the human body through fermented beverages, including spirits, for instance, beers, wines, and brandy, where it is considered a potential carcinogenic agent. However, EC is present not only in alcoholic beverages, but also in non-alcoholics, like fruit juice or milk [155,156]. EC is soluble in water, ethanol, and many other organic solvents, making it usual in medical practices, particularly as an antineoplastic agent [156]. EC can be present in distilled alcoholic beverages at concentration levels between 0.01 and 12 mg L−1 depending on their source [157]. The main EC precursors are basically urea and other similar compounds, such as citrulline, cyanogen, carbamyl phosphate, and diethyl pyrocarbonate. Urea thermal degradation results in cyanic acid, which further reacts with ethanol to form EC. It is also known that large amounts of nitrogen fertilizers in crops contribute to increase the amount of EC precursors.
LLE, SPE, SPME, and HSSPME are powerful extraction tools that allow pre-concentration of EC from beverages. Dichloromethane was the most widely used extraction solvent in LLE. Recently, advanced ultrasound-assisted emulsification microextraction (USAEME) has been applied for EC extraction and pre-concentration. Effective microextraction by packed sorbent (MEPS) has been applied for the determination of EC in fortified wines [158]. GC coupled with several detection options, e.g., flame ionization detection (FID), alkali flame ionization detection (AFID), hall electrolytic conductivity detection (HECD), and MS, has been reported as the most used analytical technique for EC determination. Fourier-transform infrared (FTIR) spectroscopy is another technique developed to determine EC in combination with partial least-squares (PLS) chemometric methods. This strategy provides additional information on the amount of hydrocyanic acid, providing an estimation of the total quantities of EC formed when stored. Nevertheless, as a result of its lack of accuracy, FTIR is just suggested for semi-quantitative rather than quantitative determination of EC. UHPLC/MS/MS methods have also been proposed by their very simple sample preparation and the use of non-organic solvents [156]. HPLC/FLD with a previous derivatization step was applied to the EC detection in several alcoholic beverages, such as beer, wine, sake, soju, whisky, or brandy [85]. Finally, a robust method for rapid extraction and accurate quantification of EC in wine and brandy based on the incorporation of MIP and surface-enhanced Raman spectroscopy (MIPs/SERS) was reported [159].
3. Conclusions and Future Trends
Recent developments on analysis approaches for the major groups of chemical contaminants in beverages and their packaging materials have been reviewed. This type of chemical hazard belongs to many groups (organic and inorganic), including heavy metals, amines, bisphenols, phthalates, pesticides, perfluorinated compounds, inks, ethyl carbamate, and non-intentionally added substances. Regardless of the pre-treatment operations, GC/MS is mostly employed for the analysis of phthalates, BPA, and NIAS in beverages and packaging materials, while HPLC/MS/MS is being used as the most adequate technique for more polar molecules (e.g., PFCs, PAAS, and photoinitiators).
Nevertheless, analytical challenges should still be faced by researchers in this field, such as the development of more robust and suitable techniques to offer results with higher analytical quality by increasing accuracy, sensitivity, specificity, and analysis time. Microextraction methods are considered promising in sample preparation, as they help to improve the analytical figures of merit for the determination of contaminants in beverages, most of them highly volatile chemicals, while decreasing LODs and LOQs.
Successful implementation of these methods could provide multiple advantages associated with miniaturization and green analytical chemistry. Simplification of procedures, as well as reduction of analysis times and wastes generated in the laboratory, are still challenging issues in these determinations. The proposal of analytical methodologies that are environmentally friendly is pursued in these developments to finally propose methodologies in the control of contaminants in beverages by simple, sensitive, portable, robust, and reliable instrumental techniques.
Matrix effects in the study of contaminants in beverages are another key issue, and it is necessary to focus on this research to solve this problem due to the complex nature and composition of many beverages. Consequently, researchers must take into account the suitability of analytical methods to each matrix and try to continue improving both sample pre-treatments and extraction procedures in order to pre-concentrate analytes and limit interferences caused by other matrix compounds.
However, continuous research on packaged beverages is essential to ensure that no traces of contaminants could be present in their formulations. These studies could be a challenge for researchers due to the presence of NIAS, as the importance of these pollutants has increased the awareness in the scientific community, making necessary the proposal of new and robust methods to detect this new group of contaminants in beverages.
Needless to say, scientists should review the current legislation, comparing with analytical innovations regarding contaminants in beverages and packaging materials. Therefore, introduction of proactive measures that assess the reliable and fast determination of these pollutants is a must in the current state of research in this area. However, this work will not take effect if there is no support from society, private, and political institutions, for the detection and characterization of these kind of compounds, while establishing action agreements to establish the necessary measures to control beverages contaminants coming from packaging materials.
Author Contributions
Conceptualization, C.J.P., Y.F., A.J. and M.C.G.; methodology, C.J.P., Y.F., A.J. and M.C.G.; formal analysis, discussion and supervision, A.J. and M.C.G. All authors have read and agreed to the published version of the manuscript.
Funding
This research received no external funding.
Acknowledgments
Authors would like to thank Spanish Ministry of Science, Innovation and Universities (MAT2017-84909-C2-1-R) and Generalitat Valenciana (IDIFEDER/2018/007) by their support in this work.
Conflicts of Interest
The authors declare no conflict of interest.
References
- Bakirhan, N.K.; Ozkan, S.A. The recent electrochemical studies on Bisphenol A detection in beverages. In Safety Issues in Beverage Production, 1st ed.; Grumezescu, A.M., Holban, A.M., Eds.; Academic Press: Duxford, UK, 2020; Volume 18, pp. 309–333. [Google Scholar]
- Chandrasekara, A.; Shahidi, F. Herbal beverages: Bioactive compounds and their role in disease risk reduction—A review. J. Tradit. Complement. Med. 2018, 8, 451–458. [Google Scholar] [CrossRef] [PubMed]
- Kandylis, P.; Pissaridi, K.; Bekatorou, A.; Kanellaki, M.; Koutinas, A.A. Dairy and non-dairy probiotic beverages. Curr. Opin. Food Sci. 2016, 7, 58–63. [Google Scholar] [CrossRef]
- Sethi, S.; Tyagi, S.K.; Anurag, R.K. Plant-based milk alternatives an emerging segment of functional beverages: A review. J. Food Sci. Technol. 2016, 53, 3408–3423. [Google Scholar] [CrossRef] [PubMed]
- Mejía-Carmona, K.; Jordan-Sinisterra, M.; Lanças, F. Current trends in fully automated on-line analytical techniques for beverage analysis. Beverages 2019, 5, 13. [Google Scholar] [CrossRef] [Green Version]
- Kandylis, P.; Kokkinomagoulos, E. Food applications and potential health benefits of pomegranate and its derivatives. Foods 2020, 9, 122. [Google Scholar] [CrossRef] [Green Version]
- Coskun, F. A traditional turkish fermented non-alcoholic beverage, “Shalgam”. Beverages 2017, 3, 49. [Google Scholar] [CrossRef] [Green Version]
- Borah, H.; Dutta, U. Trends in beverage packaging. In Trends in Beverage Packaging, 1st ed.; Grumezescu, A.M., Holban, A.M., Eds.; Academic Press: Duxford, UK, 2019; Volume 16, pp. 1–14. [Google Scholar]
- Silva, M.M.N.; Pereira, K.S.; Coelho, M.A.Z. Food additives used in non-alcoholic water-based beverages—A review. J. Nutr. Health Food Eng. 2019, 9, 212540717. [Google Scholar]
- Patra, S.; Choudhary, R.; Madhuri, R.; Sharma, P.K. Quality Control of Beverages for Health Safety: Starting from Laboratory to the Point-of-Care Detection Techniques. In Quality Control in the Beverage Industry, 1st ed.; Grumezescu, A.M., Holban, A.M., Eds.; Academic Press: Duxford, UK, 2019; Volume 17, pp. 39–83. [Google Scholar]
- Gamero, A.; Ren, X.; Lamboni, Y.; de Jong, C.; Smid, E.J.; Linnemann, A.R. Development of a low-alcoholic fermented beverage employing cashew apple juice and non-conventional yeasts. Fermentation 2019, 5, 71. [Google Scholar] [CrossRef] [Green Version]
- Rochte, J.; Berglund, K. Preliminary studies on the use of reactive distillation in the production of beverage spirits. Beverages 2019, 5, 29. [Google Scholar] [CrossRef] [Green Version]
- Chinnamma, M.; Bhasker, S.; Binitha Hari, M.; Sreekumar, D.; Madhav, H. Coconut Neera—A vital health beverage from coconut palms: Harvesting, processing and quality analysis. Beverages 2019, 5, 22. [Google Scholar] [CrossRef] [Green Version]
- Błaszczyk, I. The Management of Food Safety in Beverage Industry. In Safety Issues in Beverage Production, 1st ed.; Grumezescu, A.M., Holban, A.M., Eds.; Academic Press: Duxford, UK, 2020; Volume 18, pp. 1–38. [Google Scholar]
- Aadil, R.M.; Madni, G.M.; Roobab, U.; ur Rahman, U.; Zeng, X.-A. Quality Control in Beverage Production: An Overview. In Quality Control in the Beverage Industry, 1st ed.; Grumezescu, A.M., Holban, A.M., Eds.; Academic Press: Duxford, UK, 2019; Volume 17, pp. 1–38. [Google Scholar]
- Chen, C.-Y.; Aggarwal, S.K.; Chung, C.-H.; You, C.-F. Advanced Mass Spectrometry for Beverage Safety and Forensic. In Safety Issues in Beverage Production, 1st ed.; Grumezescu, A.M., Holban, A.M., Eds.; Academic Press: Duxford, UK, 2020; Volume 18, pp. 223–269. [Google Scholar]
- Ranadheera, C.S.; Prasanna, P.H.P.; Pimentel, T.C.; Azeredo, D.R.P.; Rocha, R.S.; Cruz, A.G.; Vidanarachchi, J.K.; Naumovski, N.; McConchie, R.; Ajlouni, S. Microbial Safety of Nonalcoholic Beverages. In Safety Issues in Beverage Production, 1st ed.; Grumezescu, A.M., Holban, A.M., Eds.; Academic Press: Duxford, UK, 2020; Volume 18, pp. 187–221. [Google Scholar]
- Thompson, L.A.; Darwish, W.S. Environmental chemical contaminants in food: Review of a global problem. J. Toxicol. 2019, 244, 433–439. [Google Scholar] [CrossRef] [PubMed] [Green Version]
- Orecchio, S.; Amorello, D.; Barreca, S. Analysis of Contaminants in Beverages. In Quality Control in the Beverage Industry, 1st ed.; Grumezescu, A.M., Holban, A.M., Eds.; Academic Press: Duxford, UK, 2019; Volume 17, pp. 225–258. [Google Scholar]
- Ramos, M.; Valdés, A.; Mellinas, A.; Garrigós, M. New Trends in Beverage Packaging Systems: A Review. Beverages 2015, 1, 248–272. [Google Scholar] [CrossRef]
- Geueke, B.; Groh, K.; Muncke, J. Food packaging in the circular economy: Overview of chemical safety aspects for commonly used materials. J. Clean. Prod. 2018, 193, 491–505. [Google Scholar] [CrossRef]
- De Fátima Poças, M.; Hogg, T. Exposure assessment of chemicals from packaging materials in foods: A review. Trends Food Sci. Technol. 2007, 18, 219–230. [Google Scholar] [CrossRef]
- Lau, O.-W.; Wong, S.-K. Contamination in food from packaging material. J. Chromatogr. A 2000, 882, 255–270. [Google Scholar] [CrossRef]
- Hahladakis, J.N.; Velis, C.A.; Weber, R.; Iacovidou, E.; Purnell, P. An overview of chemical additives present in plastics: Migration, release, fate and environmental impact during their use, disposal and recycling. J. Hazard. Mater. 2018, 344, 179–199. [Google Scholar] [CrossRef]
- Abdel-Rahman, G.N.; Ahmed, M.B.M.; Sabry, B.A.; Ali, S.S.M. Heavy metals content in some non-alcoholic beverages (carbonated drinks, flavored yogurt drinks, and juice drinks) of the Egyptian markets. Toxicol. Rep. 2019, 6, 210–214. [Google Scholar] [CrossRef]
- Geueke, B. FPF Dossier: Non-Intentionally Added Substances (NIAS), 2nd ed.; CERN: Meyrin, Switzerland, 2018; Available online: https://www.foodpackagingforum.org/food-packaging-health/non-intentionally-added-substances-nias (accessed on 15 April 2020).
- Berman, T.; Goldsmith, R.; Göen, T.; Spungen, J.; Novack, L.; Levine, H.; Amitai, Y.; Shohat, T.; Grotto, I. Urinary concentrations of environmental contaminants and phytoestrogens in adults in Israel. Environ. Int. 2013, 59, 478–484. [Google Scholar] [CrossRef]
- García-Cañas, V.; Simó, C.; Herrero, M.; Ibáñez, E.; Cifuentes, A. Present and future challenges in food analysis: Foodomics. Anal. Chem. 2012, 84, 10150–10159. [Google Scholar] [CrossRef] [Green Version]
- Sharma, N.; Tiwari, S.; Saxena, R. Determination of metal contaminants in beverages using solid phase extraction-based preconcentration and subsequent determination using spectro-analytical techniques. In Quality Control in the Beverage Industry, 1st ed.; Grumezescu, A.M., Holban, A.M., Eds.; Academic Press: Duxford, UK, 2019; Volume 17, pp. 123–159. [Google Scholar]
- Commission Regulation (EC). No 1881/2006 of 19 December 2006 Setting Maximum Levels for Certain Contaminants in Foodstuffs; Official Journal of the European Union: Luxembourg, 2006. [Google Scholar]
- Preventing Disease through Healthy Environments. Available online: https://apps.who.int/iris/bitstream/handle/10665/329482/WHO-CED-PHE-EPE-19.4.1-eng.pdf (accessed on 28 February 2020).
- Gürkan, R.; Altunay, N. Determination of total Sn in some canned beverages by FAAS after separation and preconcentration. Food Chem. 2015, 177, 102–110. [Google Scholar] [CrossRef]
- Altunay, N.; Gürkan, R. A simple, inexpensive and convenient procedure for determination of inorganic Sb species in milk and beverage samples in PET containers by flame atomic absorption spectrometry. Anal. Methods 2015, 7, 9850–9860. [Google Scholar] [CrossRef]
- Gürkan, R.; Kır, U.; Altunay, N. Development of a simple, sensitive and inexpensive ion-pairing cloud point extraction approach for the determination of trace inorganic arsenic species in spring water, beverage and rice samples by UV–Vis spectrophotometry. Food Chem. 2015, 180, 32–41. [Google Scholar] [CrossRef] [PubMed]
- Mattiazzi, P.; Bohrer, D.; Viana, C.; Do Nascimento, P.C.; Veiga, M.; De Carvalho, L.M. Determination of antimony in pharmaceutical formulations and beverages using high-resolution continuum-source graphite furnace atomic absorption spectrometry. J. AOAC Int. 2017, 100, 737–743. [Google Scholar] [CrossRef] [PubMed]
- Uluozlu, O.D.; Tuzen, M. Carrier element-free coprecipitation and speciation of inorganic tin in beverage samples and total tin in food samples using N-Benzoyl-N,N-diisobutylthiourea and its determination by graphite furnace atomic absorption spectrometry. LWT Food Sci. Technol. 2015, 63, 1091–1096. [Google Scholar] [CrossRef]
- Talio, M.C.; Acosta, M.G.; Acosta, M.; Olsina, R.; Fernández, L.P. Novel method for determination of zinc traces in beverages and water samples by solid surface fluorescence using a conventional quartz cuvette. Food Chem. 2015, 175, 151–156. [Google Scholar] [CrossRef]
- Talio, M.C.; Feresin, V.; Muñoz, V.; Acosta, M.; FernÁndez, L.P. New analytical methodology for Sb(III) traces quantification as emergent contaminant in drinks packaged PET samples by solid surface fluorescence. Am. J. Anal. Chem. 2019, 10, 377–393. [Google Scholar] [CrossRef] [Green Version]
- Wilschefski, S.C.; Baxter, M.R. Inductively coupled plasma mass Spectrometry: Introduction to analytical aspects. Clin. Biochem. Rev. 2019, 40, 115–133. [Google Scholar]
- Korkmaz Görür, F.; Keser, R.; Akçay, N.; Dizman, S.; Okumuşoğlu, N.T. Radionuclides and heavy metals concentrations in Turkish market tea. Food Control 2011, 22, 2065–2070. [Google Scholar] [CrossRef]
- Fathabad, A.E.; Shariatifar, N.; Moazzen, M.; Nazmara, S.; Fakhri, Y.; Alimohammadi, M.; Azari, A.; Mousavi Khaneghah, A. Determination of heavy metal content of processed fruit products from Tehran’s market using ICP-OES: A risk assessment study. Food Chem. Toxicol. 2018, 115, 436–446. [Google Scholar] [CrossRef]
- Biata, N.R.; Nyaba, L.; Ramontja, J.; Mketo, N.; Nomngongo, P.N. Determination of antimony and tin in beverages using inductively coupled plasma-optical emission spectrometry after ultrasound-assisted ionic liquid dispersive liquid-liquid phase microextraction. Food Chem. 2017, 237, 904–911. [Google Scholar] [CrossRef]
- Whitt, M.; Vorst, K.; Brown, W.; Baker, S.; Gorman, L. Survey of heavy metal contamination in recycled polyethylene terephthalate used for food packaging. J. Plast. Film Sheeting 2013, 29, 163–173. [Google Scholar] [CrossRef]
- Whitt, M.; Brown, W.; Danes, J.E.; Vorst, K.L. Migration of heavy metals from recycled polyethylene terephthalate during storage and microwave heating. J. Plast. Film Sheeting 2016, 32, 189–207. [Google Scholar] [CrossRef]
- Dutra, C.; Freire, M.T.D.A.; Nerín, C.; Bentayeb, K.; Rodriguez-Lafuente, A.; Aznar, M.; Reyes, F.G.R. Migration of residual nonvolatile and inorganic compounds from recycled post-consumer PET and HDPE. J. Braz. Chem. Soc. 2014, 25, 686–696. [Google Scholar] [CrossRef]
- Mertoglu-Elmas, G. The effect of colorants on the content of heavy metals in recycled corrugated board papers. BioResources 2017, 12, 2690–2698. [Google Scholar] [CrossRef] [Green Version]
- Mandlate, J.S.; Soares, B.M.; Seeger, T.S.; Vecchia, P.D.; Mello, P.A.; Flores, E.M.M.; Duarte, F.A. Determination of cadmium and lead at sub-ppt level in soft drinks: An efficient combination between dispersive liquid-liquid microextraction and graphite furnace atomic absorption spectrometry. Food Chem. 2017, 221, 907–912. [Google Scholar] [CrossRef]
- Fernández-López, L.; Gómez-Nieto, B.; Gismera, M.J.; Sevilla, M.T.; Procopio, J.R. Direct determination of copper and zinc in alcoholic and non-alcoholic drinks using high-resolution continuum source flame atomic absorption spectrometry and internal standardization. Spectrochim. Acta Part B At. Spectrosc. 2018, 147, 21–27. [Google Scholar] [CrossRef]
- Stojanovic, Z.; Kos, J. Detection of metabolites of microbial origin in beverages with harmful effect on human health—Biogenic amines and mycotoxins. In Safety Issues in Beverage Production, 1st ed.; Grumezescu, A.M., Holban, A.M., Eds.; Gerhard Wolff, Andre: Duxford, UK, 2020; Volume 18, pp. 39–51. [Google Scholar]
- Ladero, V.; Calles-Enriquez, M.; Fernandez, M.; Alvarez, M.A. Toxicological effects of dietary biogenic amines. Curr. Nutr. Food Sci. 2010, 6, 145–156. [Google Scholar] [CrossRef]
- Preti, R.; Antonelli, M.L.; Bernacchia, R.; Vinci, G. Fast determination of biogenic amines in beverages by a core-shell particle column. Food Chem. 2015, 187, 555–562. [Google Scholar] [CrossRef]
- Martuscelli, M.; Arfelli, G.; Manetta, A.C.; Suzzi, G. Biogenic amines content as a measure of the quality of wines of Abruzzo (Italy). Food Chem. 2013, 140, 590–597. [Google Scholar] [CrossRef]
- Mattarozzi, M.; Lambertini, F.; Suman, M.; Careri, M. Liquid chromatography-full scan-high resolution mass spectrometry-based method towards the comprehensive analysis of migration of primary aromatic amines from food packaging. J. Chromatogr. A 2013, 1320, 96–102. [Google Scholar] [CrossRef]
- Sanchis, Y.; Yusà, V.; Coscollà, C. Analytical strategies for organic food packaging contaminants. J. Chromatogr. A 2017, 1490, 22–46. [Google Scholar] [CrossRef] [PubMed]
- Brede, C.; Skjevrak, I.; Herikstad, H. Determination of primary aromatic amines in water food simulant using solid-phase analytical derivatization followed by gas chromatography coupled with mass spectrometry. J. Chromatogr. A 2003, 983, 35–42. [Google Scholar] [CrossRef]
- Donthuan, J.; Yunchalard, S.; Srijaranai, S. Vortex-assisted surfactant-enhanced-emulsification liquid liquid microextraction of biogenic amines in fermented foods before their simultaneous analysis by high-performance liquid chromatography. J. Sep. Sci. 2014, 37, 3164–3173. [Google Scholar] [CrossRef] [PubMed]
- Chen, C.; Fan, W.; Jia, X.; Li, J.; Bi, Y.; Liu, W. Development of a recombinant N-Gp5c fusion protein-based ELISA for detection of antibodies to porcine reproductive and respiratory syndrome virus. J. Virol. Methods 2013, 189, 213–220. [Google Scholar] [CrossRef]
- García-Villar, N.; Hernández-Cassou, S.; Saurina, J. Determination of biogenic amines in wines by pre-column derivatization and high-performance liquid chromatography coupled to mass spectrometry. J. Chromatogr. A 2009, 1216, 6387–6393. [Google Scholar] [CrossRef]
- Peña-Gallego, A.; Hernández-Orte, P.; Cacho, J.; Ferreira, V. Biogenic amine determination in wines using solid-phase extraction: A comparative study. J. Chromatogr. A 2009, 1216, 3398–3401. [Google Scholar] [CrossRef]
- Jastrzebska, A.; Piasta, A.; Kowalska, S.; Krzemiński, M.; Szłyk, E. A new derivatization reagent for determination of biogenic amines in wines. J. Food Compos. Anal. 2016, 48, 111–119. [Google Scholar] [CrossRef]
- Heo, J.-J.; Lee, J.-W.; Kim, S.-K.; Oh, J.-E. Foodstuff analyses show that seafood and water are major perfluoroalkyl acids (PFAAs) sources to humans in Korea. J. Hazard. Mater. 2014, 279, 402–409. [Google Scholar] [CrossRef]
- Ordóñez, J.L.; Troncoso, A.M.; García-Parrilla, M.D.C.; Callejón, R.M. Recent trends in the determination of biogenic amines in fermented beverages—A review. Anal. Chim. Acta 2016, 939, 10–25. [Google Scholar] [CrossRef]
- Basozabal, I.; Guerreiro, A.; Gomez-Caballero, A.; Aranzazu Goicolea, M.; Barrio, R.J. Direct potentiometric quantification of histamine using solid-phase imprinted nanoparticles as recognition elements. Biosens. Bioelectron. 2014, 58, 138–144. [Google Scholar] [CrossRef]
- Henao-Escobar, W.; Del Torno-De Román, L.; Domínguez-Renedo, O.; Alonso-Lomillo, M.A.; Arcos-Martínez, M.J. Dual enzymatic biosensor for simultaneous amperometric determination of histamine and putrescine. Food Chem. 2016, 190, 818–823. [Google Scholar] [CrossRef] [PubMed]
- Nalazek-Rudnicka, K.; Wasik, A. Development and validation of an LC-MS/MS method for the determination of biogenic amines in wines and beers. Mon. Chem. Chem. Mon. 2017, 148, 1685–1696. [Google Scholar] [CrossRef] [PubMed] [Green Version]
- Jain, A.; Gupta, M.; Verma, K.K. Salting-out assisted liquid-liquid extraction for the determination of biogenic amines in fruit juices and alcoholic beverages after derivatization with 1-naphthylisothiocyanate and high performance liquid chromatography. J. Chromatogr. A 2015, 1422, 60–72. [Google Scholar] [CrossRef]
- Restuccia, D.; Spizzirri, U.G.; Parisi, O.I.; Cirillo, G.; Picci, N. Brewing effect on levels of biogenic amines in different coffee samples as determined by LC-UV. Food Chem. 2015, 175, 143–150. [Google Scholar] [CrossRef]
- Lee, S.J.; Kim, S.H.; Lim, N.; Ahn, M.Y.; Chae, H. Study on the difference of BIS/BAS scale between Sasang types. Evid.-Based Complement. Altern. Med. 2015, 2015, 805819. [Google Scholar] [CrossRef] [Green Version]
- Gallo, P.; Di Marco Pisciottano, I.; Esposito, F.; Fasano, E.; Scognamiglio, G.; Mita, G.D.; Cirillo, T. Determination of BPA, BPB, BPF, BADGE and BFDGE in canned energy drinks by molecularly imprinted polymer cleaning up and UPLC with fluorescence detection. Food Chem. 2017, 220, 406–412. [Google Scholar] [CrossRef]
- Moreira Fernandez, M.A.; Coelho André, L.; de Lourdes Cardeal, Z. Hollow fiber liquid-phase microextraction-gas chromatography-mass spectrometry method to analyze bisphenol A and other plasticizer metabolites. J. Chromatogr. A 2017, 1481, 31–36. [Google Scholar] [CrossRef] [PubMed]
- Commission Directive 2004/19/EC of 1 March 2004 Amending Directive 2002/72/EC Relating to Plastic Materials and Articles Intended to Come into Contact with Foodstuffs; Official Journal of the European Union: Luxembourg, 2004.
- Commission Directive 2011/8/EU of 28 January 2011 Amending Directive 2002/72/EC as Regards the Restriction of Use of Bisphenol A in Plastic Infant Feeding Bottles; Official Journal of the European Union: Luxembourg, 2011.
- Commission Regulation (EC) No 1895/2005 of 18 November 2005 on the Restriction of use of Certain Epoxy Derivatives in Materials and Articles Intended to Come into Contact with Food; Official Journal of the European Union: Luxembourg, 2005.
- Fasano, E.; Esposito, F.; Scognamiglio, G.; Di Francesco, F.; Montuori, P.; Amodio Cocchieri, R.; Cirillo, T. Bisphenol A contamination in soft drinks as a risk for children’s health in Italy. Food Addit. Contam. Part A Chem. Anal. Control Expo. Risk Assess. 2015, 32, 1207–1214. [Google Scholar] [CrossRef] [Green Version]
- Russo, G.; Barbato, F.; Grumetto, L. Development and validation of a LC-FD Method for the simultaneous determination of eight bisphenols in soft drinks. Food Anal. Methods 2016, 9, 2732–2740. [Google Scholar] [CrossRef]
- Bolat, G.; Yaman, Y.T.; Abaci, S. Highly sensitive electrochemical assay for bisphenol A detection based on poly (CTAB)/MWCNTs modified pencil graphite electrodes. Sens. Actuators B Chem. 2018, 255, 140–148. [Google Scholar] [CrossRef]
- Shi, R.; Liang, J.; Zhao, Z.; Liu, A.; Tian, Y. An electrochemical bisphenol A sensor based on one step electrochemical reduction of cuprous oxide wrapped graphene oxide nanoparticles modified electrode. Talanta 2017, 169, 37–43. [Google Scholar] [CrossRef]
- Masikini, M.; Ghica, M.E.; Baker, P.G.L.; Iwuoha, E.I.; Brett, C.M.A. Electrochemical sensor based on multi-walled carbon nanotube/gold nanoparticle modified glassy carbon electrode for detection of estradiol in environmental samples. Electroanalysis 2019, 31, 1925–1933. [Google Scholar] [CrossRef]
- Gallart-Ayala, H.; Núñez, O.; Lucci, P. Recent advances in LC-MS analysis of food-packaging contaminants. TrAC Trends Anal. Chem. 2013, 42, 99–124. [Google Scholar] [CrossRef] [Green Version]
- Guo, X.; Bai, H.; Ma, X.; Li, J.; Ren, Y.; Ouyang, Z.; Ma, Q. Online coupling of an electrochemically fabricated solid-phase microextraction probe and a miniature mass spectrometer for enrichment and analysis of chemical contaminants in infant drinks. Anal. Chim. Acta 2020, 1098, 66–74. [Google Scholar] [CrossRef] [PubMed]
- Regueiro, J.; Wenzl, T. Determination of bisphenols in beverages by mixed-mode solid-phase extraction and liquid chromatography coupled to tandem mass spectrometry. J. Chromatogr. A 2015, 1422, 230–238. [Google Scholar] [CrossRef] [PubMed]
- Lu, H.; Xu, S. Visualizing BPA by molecularly imprinted ratiometric fluorescence sensor based on dual emission nanoparticles. Biosens. Bioelectron. 2017, 92, 147–153. [Google Scholar] [CrossRef]
- Zhou, Y.; Yang, L.; Li, S.; Dang, Y. A novel electrochemical sensor for highly sensitive detection of bisphenol A based on the hydrothermal synthesized Na-doped WO3 nanorods. Sens. Actuators B Chem. 2017, 245, 238–246. [Google Scholar] [CrossRef]
- Cosio, M.S.; Pellicanò, A.; Brunetti, B.; Fuenmayor, C.A. A simple hydroxylated multi-walled carbon nanotubes modified glassy carbon electrode for rapid amperometric detection of bisphenol A. Sens. Actuators B Chem. 2017, 246, 673–679. [Google Scholar] [CrossRef]
- Li, G.; Zhong, Q.; Wang, D.; Zhang, X.; Gao, H.; Shen, S. Determination and formation of Ethyl Carbamate in Chinese spirits. Food Control 2015, 56, 169–176. [Google Scholar] [CrossRef]
- Ma, Y.; Liu, J.; Li, H. Diamond-based electrochemical aptasensor realizing a femtomolar detection limit of bisphenol A. Biosens. Bioelectron. 2017, 92, 21–25. [Google Scholar] [CrossRef]
- Wang, J.Y.; Su, Y.L.; Wu, B.H.; Cheng, S.H. Reusable electrochemical sensor for bisphenol A based on ionic liquid functionalized conducting polymer platform. Talanta 2016, 147, 103–110. [Google Scholar] [CrossRef] [PubMed]
- Li, Y.; Zhai, X.; Liu, X.; Wang, L.; Liu, H.; Wang, H. Electrochemical determination of bisphenol A at ordered mesoporous carbon modified nano-carbon ionic liquid paste electrode. Talanta 2016, 148, 362–369. [Google Scholar] [CrossRef] [PubMed]
- Nikahd, B.; Khalilzadeh, M.A. Liquid phase determination of bisphenol A in food samples using novel nanostructure ionic liquid modified sensor. J. Mol. Liq. 2016, 215, 253–257. [Google Scholar] [CrossRef]
- Zhan, T.; Song, Y.; Li, X.; Hou, W. Electrochemical sensor for bisphenol A based on ionic liquid functionalized Zn-Al layered double hydroxide modified electrode. Mater. Sci. Eng. C 2016, 64, 354–361. [Google Scholar] [CrossRef]
- Yang, Y.; Zhang, H.; Huang, C.; Jia, N. MWCNTs-PEI composites-based electrochemical sensor for sensitive detection of bisphenol A. Sens. Actuators B Chem. 2016, 235, 408–413. [Google Scholar] [CrossRef]
- Huang, H.; Li, Y.; Liu, J.; Tong, J.; Su, X. Detection of bisphenol A in food packaging based on fluorescent conjugated polymer PPESO3 and enzyme system. Food Chem. 2015, 185, 233–238. [Google Scholar] [CrossRef]
- Pan, D.; Gu, Y.; Lan, H.; Sun, Y.; Gao, H. Functional graphene-gold nano-composite fabricated electrochemical biosensor for direct and rapid detection of bisphenol A. Anal. Chim. Acta 2015, 853, 297–302. [Google Scholar] [CrossRef]
- Jing, P.; Zhang, X.; Wu, Z.; Bao, L.; Xu, Y.; Liang, C.; Cao, W. Electrochemical sensing of bisphenol A by graphene-1-butyl-3-methylimidazolium hexafluorophosphate modified electrode. Talanta 2015, 141, 41–46. [Google Scholar] [CrossRef]
- Kochana, J.; Wapiennik, K.; Kozak, J.; Knihnicki, P.; Pollap, A.; Woźniakiewicz, M.; Nowak, J.; Kościelniak, P. Tyrosinase-based biosensor for determination of bisphenol A in a flow-batch system. Talanta 2015, 144, 163–170. [Google Scholar] [CrossRef]
- Huang, K.J.; Liu, Y.J.; Liu, Y.M.; Wang, L.L. Molybdenum disulfide nanoflower-chitosan-au nanoparticles composites based electrochemical sensing platform for bisphenol a determination. J. Hazard. Mater. 2014, 276, 207–215. [Google Scholar] [CrossRef]
- Deng, P.; Xu, Z.; Kuang, Y. Electrochemical determination of bisphenol A in plastic bottled drinking water and canned beverages using a molecularly imprinted chitosan-graphene composite film modified electrode. Food Chem. 2014, 157, 490–497. [Google Scholar] [CrossRef] [PubMed]
- Najafi, M.; Khalilzadeh, M.A.; Karimi-Maleh, H. A new strategy for determination of bisphenol A in the presence of Sudan i using a ZnO/CNTs/ionic liquid paste electrode in food samples. Food Chem. 2014, 158, 125–131. [Google Scholar] [CrossRef] [PubMed]
- Zhu, B.; Xu, X.; Luo, J.; Jin, S.; Chen, W.; Liu, Z.; Tian, C. Simultaneous determination of 131 pesticides in tea by on-line GPC-GC–MS/MS using graphitized multi-walled carbon nanotubes as dispersive solid phase extraction sorbent. Food Chem. 2019, 276, 202–208. [Google Scholar] [CrossRef] [PubMed]
- Zhang, X.; Wu, L.; Zhou, J.; Zhang, X.; Chen, J. A new ratiometric electrochemical sensor for sensitive detection of bisphenol A based on poly-β-cyclodextrin/electroreduced graphene modified glassy carbon electrode. J. Electroanal. Chem. 2015, 742, 97–103. [Google Scholar] [CrossRef]
- Schymanski, D.; Goldbeck, C.; Humpf, H.U.; Fürst, P. Analysis of microplastics in water by micro-Raman spectroscopy: Release of plastic particles from different packaging into mineral water. Water Res. 2018, 129, 154–162. [Google Scholar] [CrossRef]
- Sakhi, A.K.; Lillegaard, I.T.L.; Voorspoels, S.; Carlsen, M.H.; Løken, E.B.; Brantsæter, A.L.; Haugen, M.; Meltzer, H.M.; Thomsen, C. Concentrations of phthalates and bisphenol A in Norwegian foods and beverages and estimated dietary exposure in adults. Environ. Int. 2014, 73, 259–269. [Google Scholar] [CrossRef]
- Yan, H.; Cheng, X.; Liu, B. Simultaneous determination of six phthalate esters in bottled milks using ultrasound-assisted dispersive liquid-liquid microextraction coupled with gas chromatography. J. Chromatogr. B Anal. Technol. Biomed. Life Sci. 2011, 879, 2507–2512. [Google Scholar] [CrossRef]
- Hayasaka, Y. Analysis of phthalates in wine using liquid chromatography tandem mass spectrometry combined with a hold-back column: Chromatographic strategy to avoid the influence of pre-existing phthalate contamination in a liquid chromatography system. J. Chromatogr. A 2014, 1372, 120–127. [Google Scholar] [CrossRef]
- Fierens, T.; Servaes, K.; Van Holderbeke, M.; Geerts, L.; De Henauw, S.; Sioen, I.; Vanermen, G. Analysis of phthalates in food products and packaging materials sold on the Belgian market. Food Chem. Toxicol. 2012, 50, 2575–2583. [Google Scholar] [CrossRef]
- Commission Regulation (EU) No 10/2011 of 14 January 2011 on Plastic Materials and Articles Intended to Come into Contact with Food; Official Journal of the European Union: Luxembourg, 2011.
- Pellegrino Vidal, R.B.; Ibañez, G.A.; Escandar, G.M. A green method for the quantification of plastics-derived endocrine disruptors in beverages by chemometrics-assisted liquid chromatography with simultaneous diode array and fluorescent detection. Talanta 2016, 159, 336–343. [Google Scholar] [CrossRef]
- Cinelli, G.; Avino, P.; Notardonato, I.; Centola, A.; Russo, M.V. Study of XAD-2 adsorbent for the enrichment of trace levels of phthalate esters in hydroalcoholic food beverages and analysis by gas chromatography coupled with flame ionization and ion-trap mass spectrometry detectors. Food Chem. 2014, 146, 181–187. [Google Scholar] [CrossRef] [PubMed]
- Da Silva Oliveira, W.; de Souza, T.C.L.; Padula, M.; Godoy, H.T. Development of an extraction method using mixture design for the evaluation of migration of non-target compounds and dibutyl phthalate from baby bottles. Food Anal. Methods 2017, 10, 2619–2628. [Google Scholar] [CrossRef]
- He, J.; Lv, R.; Zhu, J.; Lu, K. Selective solid-phase extraction of dibutyl phthalate from soybean milk using molecular imprinted polymers. Anal. Chim. Acta 2010, 661, 215–221. [Google Scholar] [CrossRef]
- Lou, C.; Guo, D.; Zhang, K.; Wu, C.; Zhang, P.; Zhu, Y. Simultaneous determination of 11 phthalate esters in bottled beverages by graphene oxide coated hollow fiber membrane extraction coupled with supercritical fluid chromatography. Anal. Chim. Acta 2018, 1007, 71–79. [Google Scholar] [CrossRef] [PubMed]
- Urkude, R.; Dhurvey, V.; Kochhar, S. Pesticide residues in beverages. In Quality Control in the Beverage Industry, 1st ed.; Grumezescu, A.M., Holban, A.M., Eds.; Academic Press: Duxford, UK, 2019; Volume 17, pp. 529–560. [Google Scholar]
- Cladière, M.; Delaporte, G.; Le Roux, E.; Camel, V. Multi-class analysis for simultaneous determination of pesticides, mycotoxins, process-induced toxicants and packaging contaminants in tea. Food Chem. 2018, 242, 113–121. [Google Scholar] [CrossRef] [PubMed]
- Bolaños, P.P.; Romero-González, R.; Frenich, A.G.; Vidal, J.L.M. Application of hollow fibre liquid phase microextraction for the multiresidue determination of pesticides in alcoholic beverages by ultra-high pressure liquid chromatography coupled to tandem mass spectrometry. J. Chromatogr. A 2008, 1208, 16–24. [Google Scholar] [CrossRef]
- Dias, J.V.; da Graça P. Nunes, M.; Pizzutti, I.R.; Reichert, B.; Jung, A.A.; Cardoso, C.D. Simultaneous determination of pesticides and mycotoxins in wine by direct injection and liquid chromatography-tandem mass spectrometry analysis. Food Chem. 2019, 293, 83–91. [Google Scholar] [CrossRef]
- Pérez-Ortega, P.; Gilbert-López, B.; García-Reyes, J.F.; Ramos-Martos, N.; Molina-Díaz, A. Generic sample treatment method for simultaneous determination of multiclass pesticides and mycotoxins in wines by liquid chromatography–mass spectrometry. J. Chromatogr. A 2012, 1249, 32–40. [Google Scholar] [CrossRef]
- Ferrer, C.; Martínez-Bueno, M.J.; Lozano, A.; Fernández-Alba, A.R. Pesticide residue analysis of fruit juices by LC–MS/MS direct injection. One year pilot survey. Talanta 2011, 83, 1552–1561. [Google Scholar] [CrossRef]
- Durak, B.Y.; Chormey, D.S.; Firat, M.; Bakirdere, S. Validation of ultrasonic-assisted switchable solvent liquid phase microextraction for trace determination of hormones and organochlorine pesticides by GC–MS and combination with QuEChERS. Food Chem. 2020, 305, 125487. [Google Scholar] [CrossRef] [PubMed]
- Dos Anjos, J.P.; de Andrade, J.B. Determination of nineteen pesticides residues (organophosphates, organochlorine, pyrethroids, carbamate, thiocarbamate and strobilurin) in coconut water by SDME/GC–MS. Microchem. J. 2014, 112, 119–126. [Google Scholar] [CrossRef]
- Mohebbi, A.; Farajzadeh, M.A.; Mahmoudzadeh, A.; Etemady, A. Combination of poly (ε–caprolactone) grafted graphene quantum dots—Based dispersive solid phase extraction followed by dispersive liquid–liquid microextraction for extraction of some pesticides from fruit juices prior to their quantification by gas chroma. Microchem. J. 2020, 153, 104328. [Google Scholar] [CrossRef]
- Huang, Y.; Shi, T.; Luo, X.; Xiong, H.; Min, F.; Chen, Y.; Nie, S.; Xie, M. Determination of multi-pesticide residues in green tea with a modified QuEChERS protocol coupled to HPLC-MS/MS. Food Chem. 2019, 275, 255–264. [Google Scholar] [CrossRef]
- Lozano, A.; Rajski, Ł.; Belmonte-Valles, N.; Uclés, A.; Uclés, S.; Mezcua, M.; Fernández-Alba, A.R. Pesticide analysis in teas and chamomile by liquid chromatography and gas chromatography tandem mass spectrometry using a modified QuEChERS method: Validation and pilot survey in real samples. J. Chromatogr. A 2012, 1268, 109–122. [Google Scholar] [CrossRef] [PubMed]
- Omote, M.; Harayama, K.; Sasaki, T.; Mochizuki, N.; Yamashita, H. Analysis of simultaneous screening for 277 pesticides in malt and beer by liquid chromatography with tandem mass spectrometry. J. Am. Soc. Brew. Chem. 2006, 64, 139–150. [Google Scholar] [CrossRef]
- Dušek, M.; Jandovská, V.; Olšovská, J. Tracking, behavior and fate of 58 pesticides originated from hops during beer brewing. J. Agric. Food Chem. 2018, 66, 10113–10121. [Google Scholar] [CrossRef] [PubMed]
- Hengel, M.J.; Miller, D.; Jordan, R. Development and validation of a method for the determination of pesticide residues in beer by liquid chromatography-mass spectrometry. J. Am. Soc. Brew. Chem. 2016, 74, 49–52. [Google Scholar] [CrossRef]
- Nagatomi, Y.; Yoshioka, T.; Yanagisawa, M.; Uyama, A.; Mochizuki, N. Simultaneous LC-MS/MS analysis of glyphosate, glufosinate, and their metabolic products in beer, barley tea, and their ingredients. Biosci. Biotechnol. Biochem. 2013, 77, 2218–2221. [Google Scholar] [CrossRef] [Green Version]
- Inoue, T.; Nagatomi, Y.; Suga, K.; Uyama, A.; Mochizuki, N. Fate of pesticides during beer brewing. J. Agric. Food Chem. 2011, 59, 3857–3868. [Google Scholar] [CrossRef]
- Gilbert-López, B.; Jaén-Martos, L.; García-Reyes, J.F.; Villar-Pulido, M.; Polgar, L.; Ramos-Martos, N.; Molina-Díaz, A. Study on the occurrence of pesticide residues in fruit-based soft drinks from the EU market and morocco using liquid chromatography–mass spectrometry. Food Control 2012, 26, 341–346. [Google Scholar] [CrossRef]
- Gilbert-López, B.; García-Reyes, J.F.; Mezcua, M.; Ramos-Martos, N.; Fernández-Alba, A.R.; Molina-Díaz, A. Multi-residue determination of pesticides in fruit-based soft drinks by fast liquid chromatography time-of-flight mass spectrometry. Talanta 2010, 81, 1310–1321. [Google Scholar] [CrossRef] [PubMed]
- Gómez Ramos, M.J.; Lozano, A.; Fernández-Alba, A.R. High-resolution mass spectrometry with data independent acquisition for the comprehensive non-targeted analysis of migrating chemicals coming from multilayer plastic packaging materials used for fruit purée and juice. Talanta 2019, 191, 180–192. [Google Scholar] [CrossRef]
- Nerin, C.; Alfaro, P.; Aznar, M.; Domeño, C. The challenge of identifying non-intentionally added substances from food packaging materials: A review. Anal. Chim. Acta 2013, 775, 14–24. [Google Scholar] [CrossRef] [PubMed]
- Koster, S.; Bani-Estivals, M.H.; Bonuomo, M.; Bradley, E.; Chagnon, M.C. Guidance on Best Practices on the Risk Assessment of Non Intentionally Added Substances (NIAS) in Food Contact Materials and Articles. Available online: http://0-www-annualreviews-org.brum.beds.ac.uk/doi/10.1146/annurev.phyto.40.120301.093728 (accessed on 15 April 2020).
- Poças, F. Migration From Packaging and Food Contact Materials Into Foods. Ref. Modul. Food Sci. 2018. [Google Scholar] [CrossRef]
- Portesi, C.; Visentin, D.; Durbiano, F.; Abete, M.C.; Rizzi, M.; Maurino, V.; Rossi, A.M. Development of a rapid micro-Raman spectroscopy approach for detection of NIAS in LDPE pellets and extruded films for food packaging applications. Polym. Test. 2019, 80, 106098. [Google Scholar] [CrossRef]
- Athenstädt, B.; Fünfrocken, M.; Schmidt, T.C. Migrating components in a polyurethane laminating adhesive identified using gas chromatography/mass spectrometry. Rapid Commun. Mass Spectrom. 2012, 26, 1810–1816. [Google Scholar] [CrossRef]
- Félix, J.S.; Isella, F.; Bosetti, O.; Nerín, C. Analytical tools for identification of non-intentionally added substances (NIAS) coming from polyurethane adhesives in multilayer packaging materials and their migration into food simulants. Anal. Bioanal. Chem. 2012, 403, 2869–2882. [Google Scholar] [CrossRef]
- Canellas, E.; Vera, P.; Nerín, C.; Dreolin, N.; Goshawk, J. Ion mobility quadrupole time-of-flight high resolution mass spectrometry coupled to ultra-high pressure liquid chromatography for identification of non-intentionally added substances migrating from food cans. J. Chromatogr. A 2019, 1616, 460778. [Google Scholar] [CrossRef] [PubMed]
- Bauer, A.; Jesús, F.; Gómez Ramos, M.J.; Lozano, A.; Fernández-Alba, A.R. Identification of unexpected chemical contaminants in baby food coming from plastic packaging migration by high resolution accurate mass spectrometry. Food Chem. 2019, 295, 274–288. [Google Scholar] [CrossRef]
- Martínez-Bueno, M.J.; Hernando, M.D.; Uclés, S.; Rajski, L.; Cimmino, S.; Fernández-Alba, A.R. Identification of non-intentionally added substances in food packaging nano films by gas and liquid chromatography coupled to orbitrap mass spectrometry. Talanta 2017, 172, 68–77. [Google Scholar] [CrossRef]
- Osorio, J.; Dreolin, N.; Aznar, M.; Nerín, C.; Hancock, P. Determination of volatile non intentionally added substances coming from a starch-based biopolymer intended for food contact by different gas chromatography-mass spectrometry approaches. J. Chromatogr. A 2019, 1599, 215–222. [Google Scholar] [CrossRef] [PubMed] [Green Version]
- García Ibarra, V.; Rodríguez Bernaldo de Quirós, A.; Paseiro Losada, P.; Sendón, R. Non-target analysis of intentionally and non intentionally added substances from plastic packaging materials and their migration into food simulants. Food Packag. Shelf Life 2019, 21, 100325. [Google Scholar] [CrossRef]
- Vera, P.; Canellas, E.; Nerín, C. Identification of non volatile migrant compounds and NIAS in polypropylene films used as food packaging characterized by UPLC-MS/QTOF. Talanta 2018, 188, 750–762. [Google Scholar] [CrossRef] [PubMed]
- Cincotta, F.; Verzera, A.; Tripodi, G.; Condurso, C. Non-intentionally added substances in PET bottled mineral water during the shelf-life. Eur. Food Res. Technol. 2018, 244, 433–439. [Google Scholar] [CrossRef]
- Guerranti, C.; Perra, G.; Corsolini, S.; Focardi, S.E. Pilot study on levels of perfluorooctane sulfonic acid (PFOS) and perfluorooctanoic acid (PFOA) in selected foodstuffs and human milk from Italy. Food Chem. 2013, 140, 197–203. [Google Scholar] [CrossRef] [PubMed]
- Zabaleta, I.; Bizkarguenaga, E.; Bilbao, D.; Etxebarria, N.; Prieto, A.; Zuloaga, O. Fast and simple determination of perfluorinated compounds and their potential precursors in different packaging materials. Talanta 2016, 152, 353–363. [Google Scholar] [CrossRef]
- Healy, A.; Hardy, A.; Kleiner, J.; Robinson, T.; Verhagen, H. Editorial: Review of authorship principles. EFSA J. 2016, 14, e14091. [Google Scholar] [CrossRef] [Green Version]
- Haug, L.S.; Salihovic, S.; Jogsten, I.E.; Thomsen, C.; van Bavel, B.; Lindström, G.; Becher, G. Levels in food and beverages and daily intake of perfluorinated compounds in Norway. Chemosphere 2010, 80, 1137–1143. [Google Scholar] [CrossRef]
- Aznar, M.; Domeño, C.; Nerín, C.; Bosetti, O. Set-off of non volatile compounds from printing inks in food packaging materials and the role of lacquers to avoid migration. Dye. Pigment. 2015, 114, 85–92. [Google Scholar] [CrossRef]
- Silva, A.S.; García, R.S. Photoinitiators in printed food packaging: Migration and food safety concerns. Ref. Modul. Food Sci. 2017. [Google Scholar] [CrossRef]
- Blanco-Zubiaguirre, L.; Zabaleta, I.; Usobiaga, A.; Prieto, A.; Olivares, M.; Zuloaga, O.; Elizalde, M.P. Target and suspect screening of substances liable to migrate from food contact paper and cardboard materials using liquid chromatography-high resolution tandem mass spectrometry. Talanta 2020, 208, 120394. [Google Scholar] [CrossRef]
- Chang, H.-C.; Chen, Y.-J.; Chang, M.-H.; Liao, C.-D.; Kao, Y.-M.; Wang, D.-Y.; Cheng, H.-F. Novel multi-analyte method for detection of thirty photoinitiators in breakfast cereal and packaged juice. J. Chromatogr. B 2019, 1130–1131, 121788. [Google Scholar] [CrossRef] [PubMed]
- Gallart-Ayala, H.; Núñez, O.; Moyano, E.; Galceran, M.T. Analysis of UV ink photoinitiators in packaged food by fast liquid chromatography at sub-ambient temperature coupled to tandem mass spectrometry. J. Chromatogr. A 2011, 1218, 459–466. [Google Scholar] [CrossRef] [PubMed] [Green Version]
- Zhang, Y.; Du, Z.; Xia, X.; Guo, Q.; Wu, H.; Yu, W. Evaluation of the migration of UV-ink photoinitiators from polyethylene food packaging by supercritical fluid chromatography combined with photodiode array detector and tandem mass spectrometry. Polym. Test. 2016, 53, 276–282. [Google Scholar] [CrossRef]
- Vavrouš, A.; Vápenka, L.; Sosnovcová, J.; Kejlová, K.; Vrbík, K.; Jírová, D. Method for analysis of 68 organic contaminants in food contact paper using gas and liquid chromatography coupled with tandem mass spectrometry. Food Control 2016, 60, 221–229. [Google Scholar] [CrossRef]
- Ryu, D.; Choi, B.; Kim, E.; Park, S.; Paeng, H.; Kim, C.I.; Lee, J.Y.; Yoon, H.J.; Koh, E. Determination of ethyl carbamate in alcoholic beverages and fermented foods sold in Korea. Toxicol. Res. 2015, 31, 289–297. [Google Scholar] [CrossRef]
- Zhao, X.; Du, G.; Zou, H.; Fu, J.; Zhou, J.; Chen, J. Progress in preventing the accumulation of ethyl carbamate in alcoholic beverages. Trends Food Sci. Technol. 2013, 32, 97–107. [Google Scholar] [CrossRef]
- Weber, J.V.; Sharypov, V.I. Ethyl carbamate in foods and beverages: A review. Environ. Chem. Lett. 2009, 7, 233–247. [Google Scholar] [CrossRef]
- Gowd, V.; Su, H.; Karlovsky, P.; Chen, W. Ethyl carbamate: An emerging food and environmental toxicant. Food Chem. 2018, 248, 312–321. [Google Scholar] [CrossRef]
- Wu, Z.; Xu, E.; Li, J.; Long, J.; Jiao, A.; Jin, Z. Highly sensitive determination of ethyl carbamate in alcoholic beverages by surface-enhanced Raman spectroscopy combined with a molecular imprinting polymer. RSC Adv. 2016, 6, 109442–109452. [Google Scholar] [CrossRef]
Figure 1.
Classification of beverages taking into account some features such as source, alcohol, or CO2 content. Adapted from [8].
Figure 1.
Classification of beverages taking into account some features such as source, alcohol, or CO2 content. Adapted from [8].

Figure 2.
Brief classification of contaminants in beverages and their possible sources.

Figure 3.
Chemical structure of some biogenic amines (Bas).

Figure 4.
Chemical structure of bisphenol A (BPA).

Figure 5.
Chemical structure of phthalates.

Figure 6.
General classification of non-intentionally added substances (NIAS) that can be found in beverages; adapted from [132].
Figure 6.
General classification of non-intentionally added substances (NIAS) that can be found in beverages; adapted from [132].


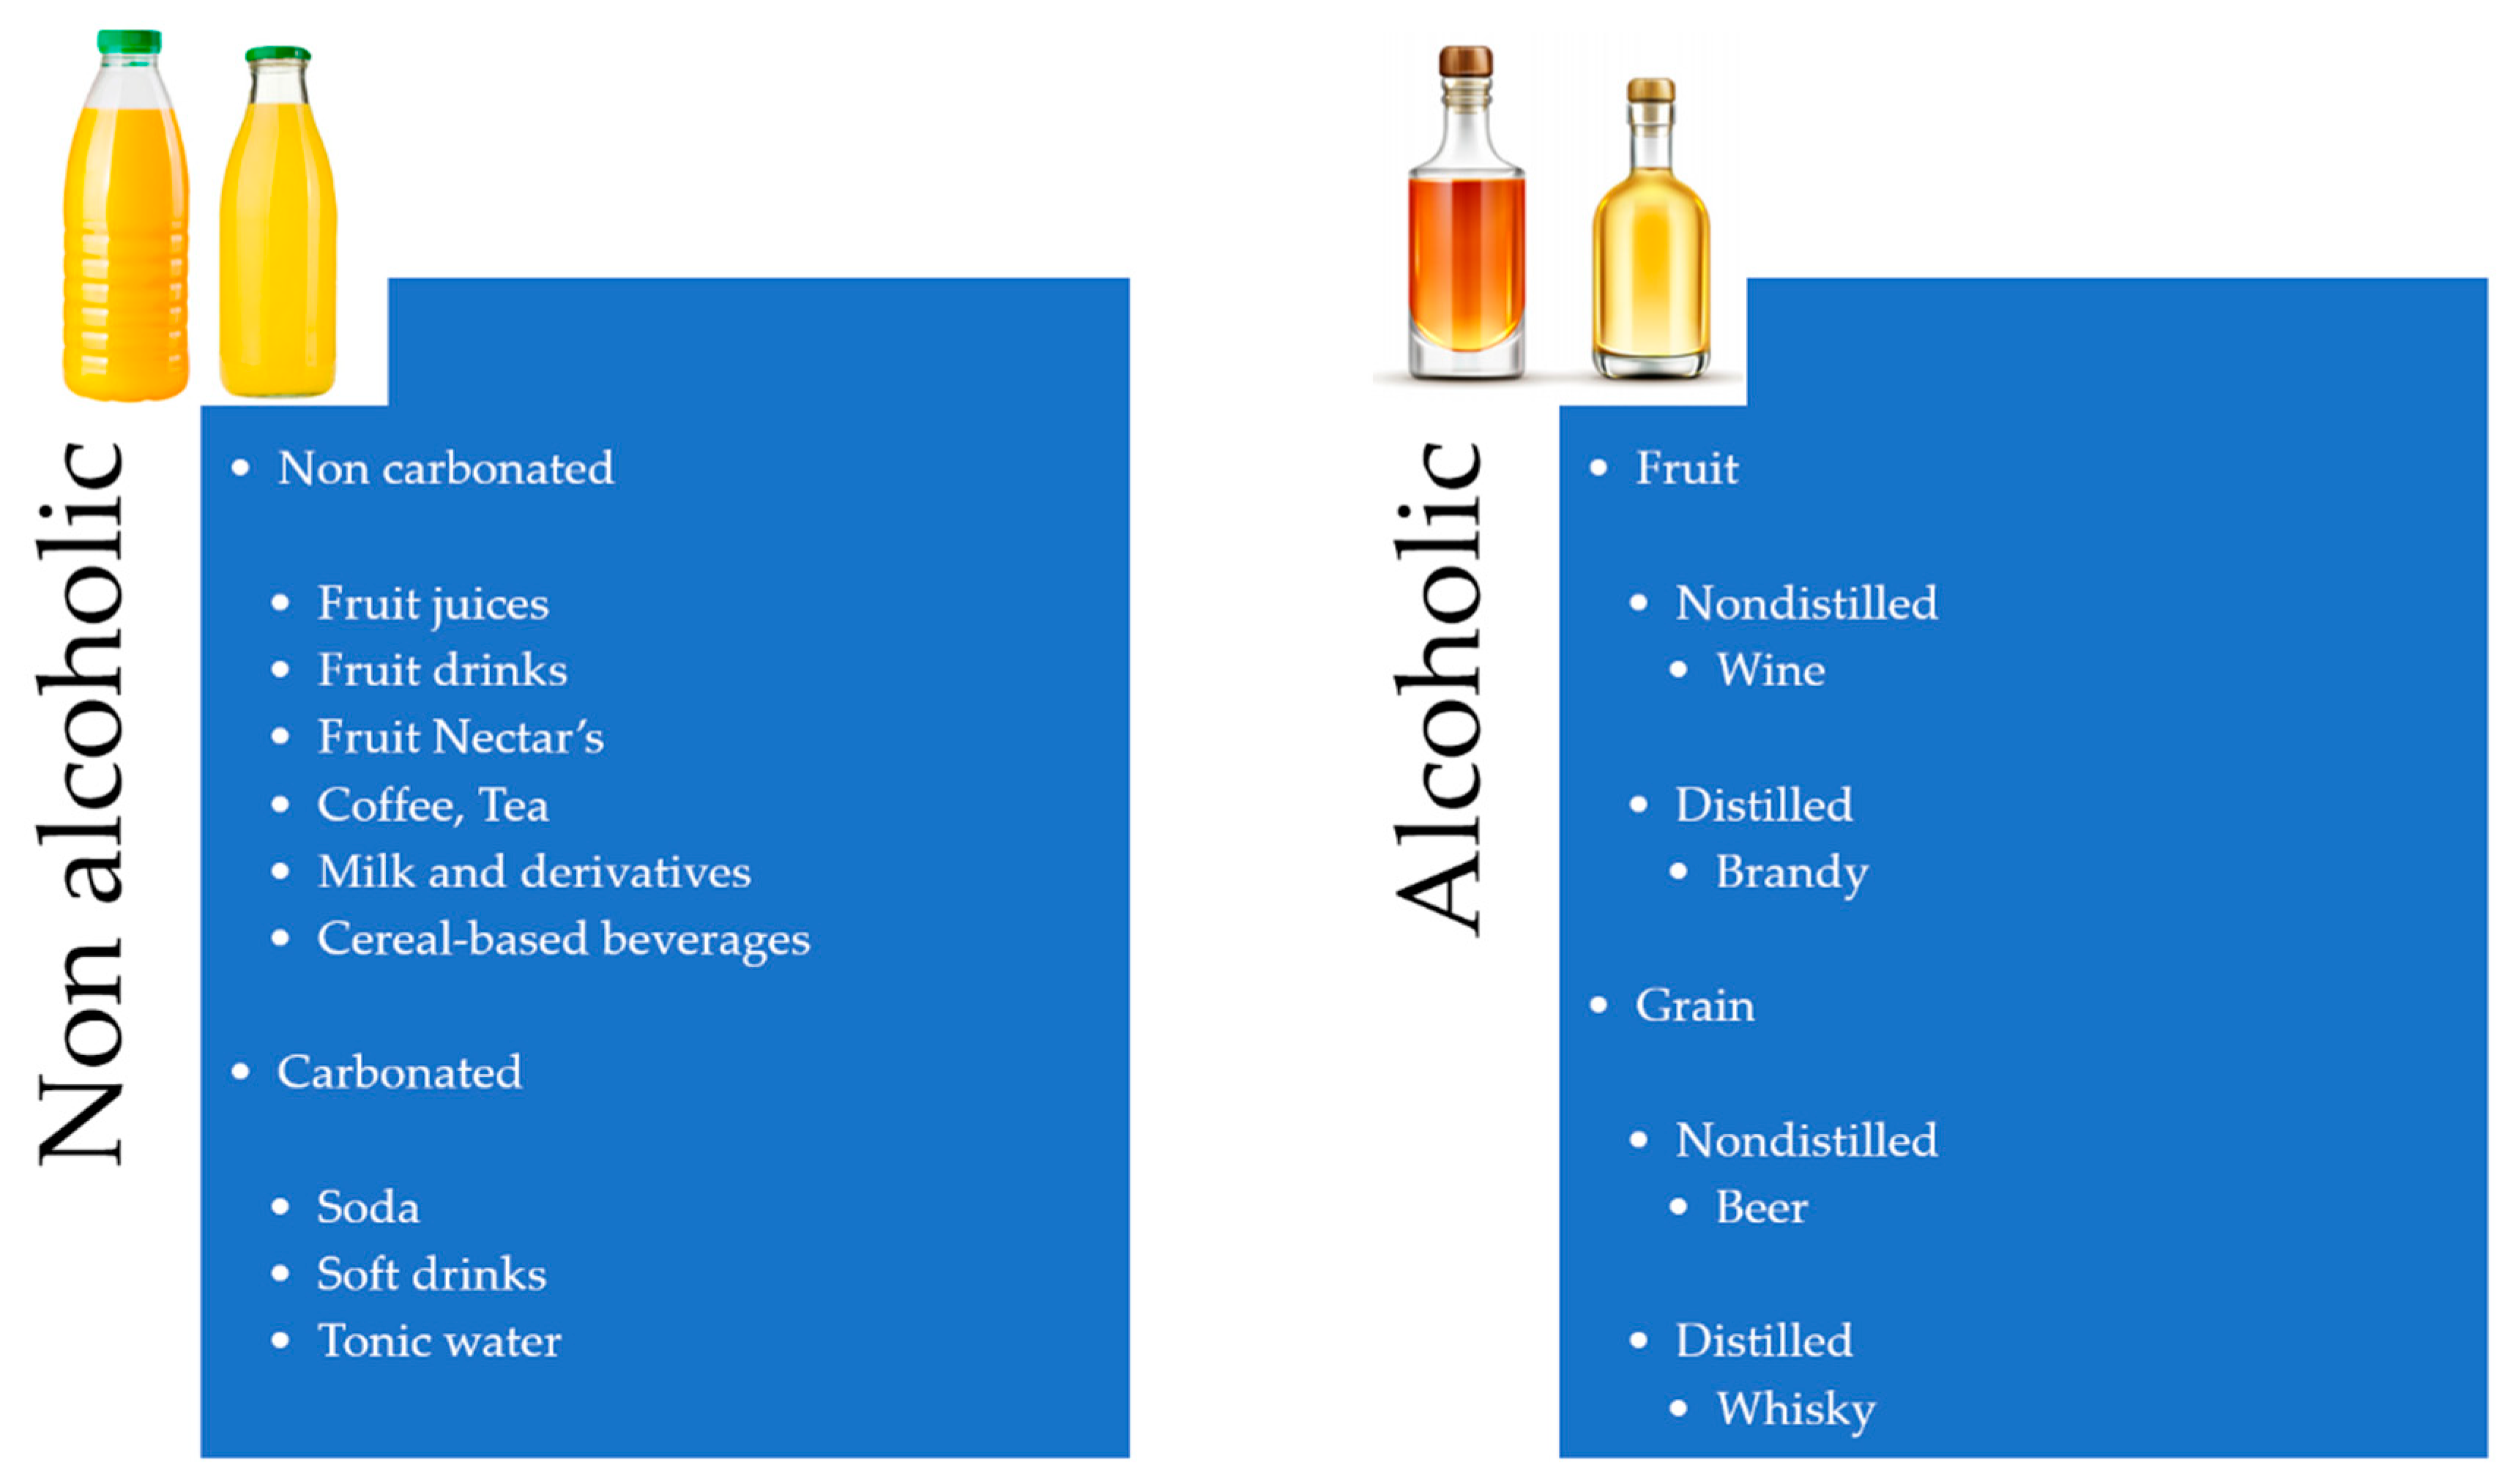
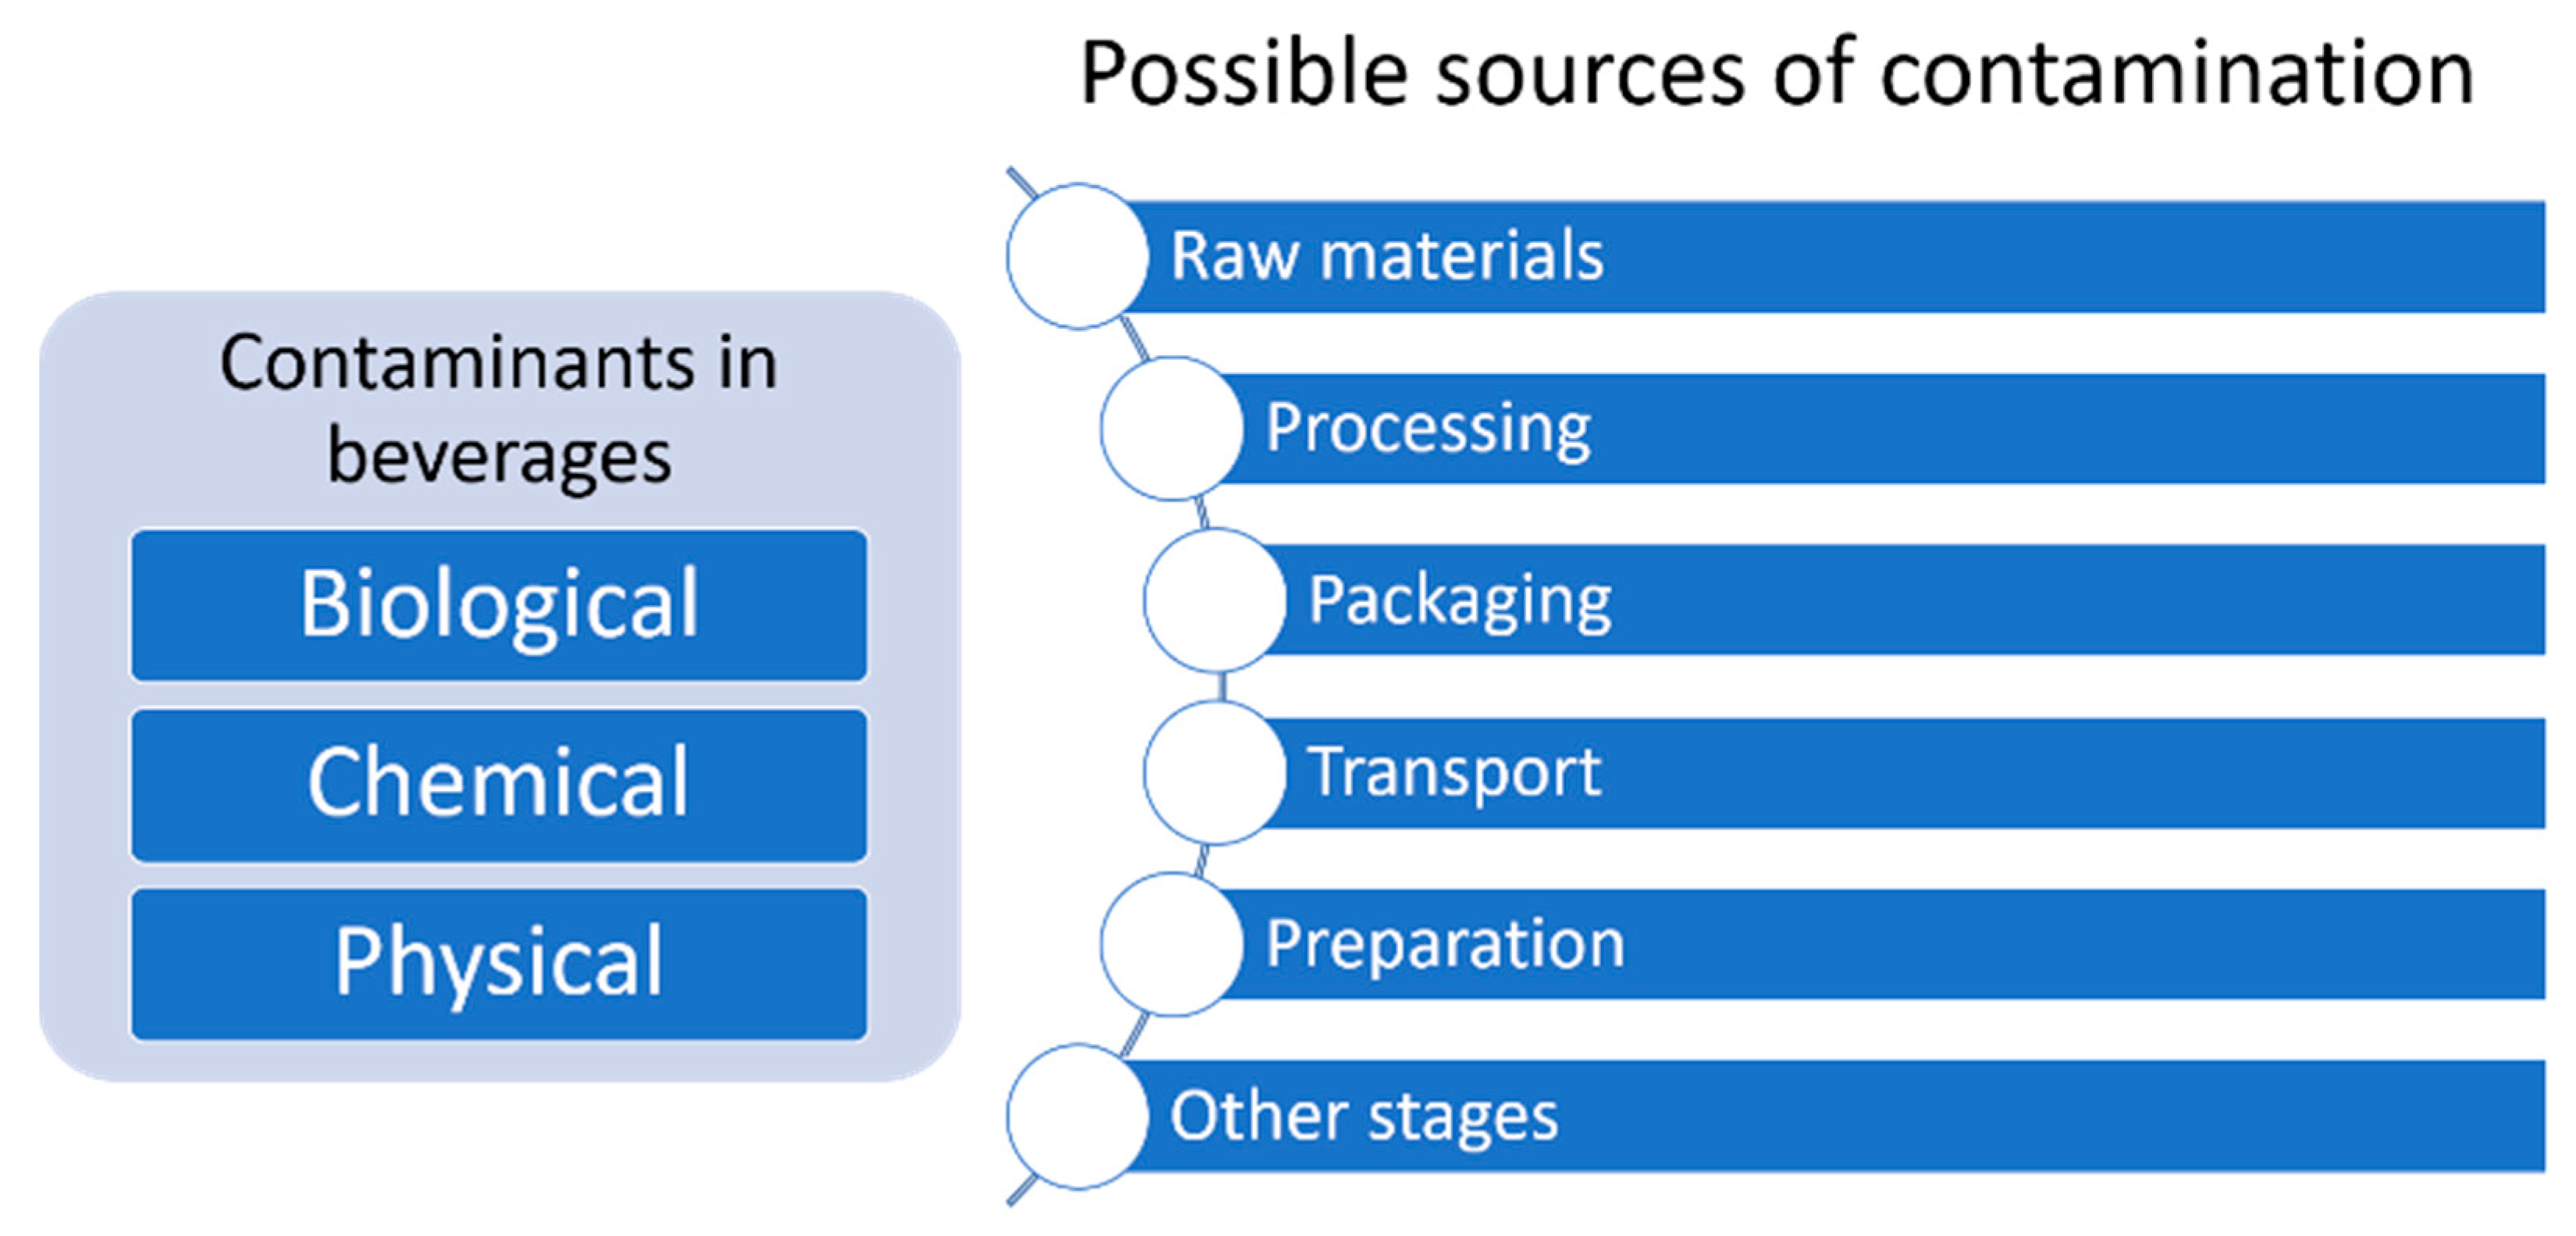
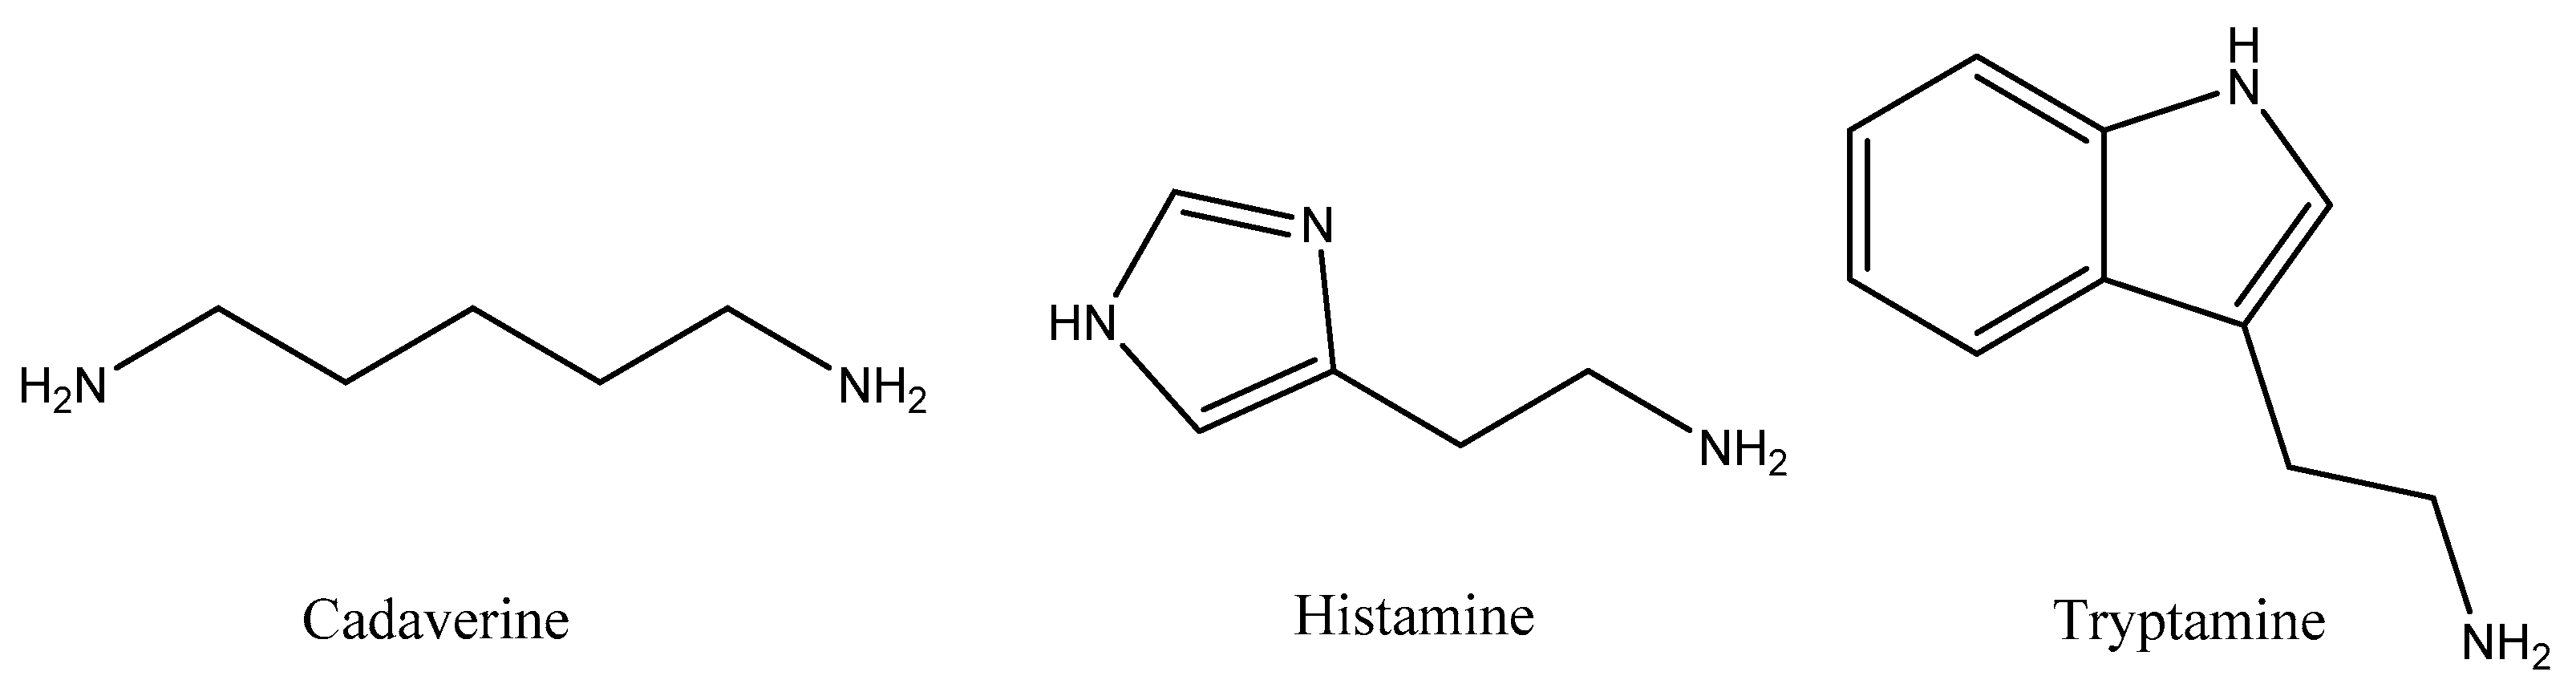
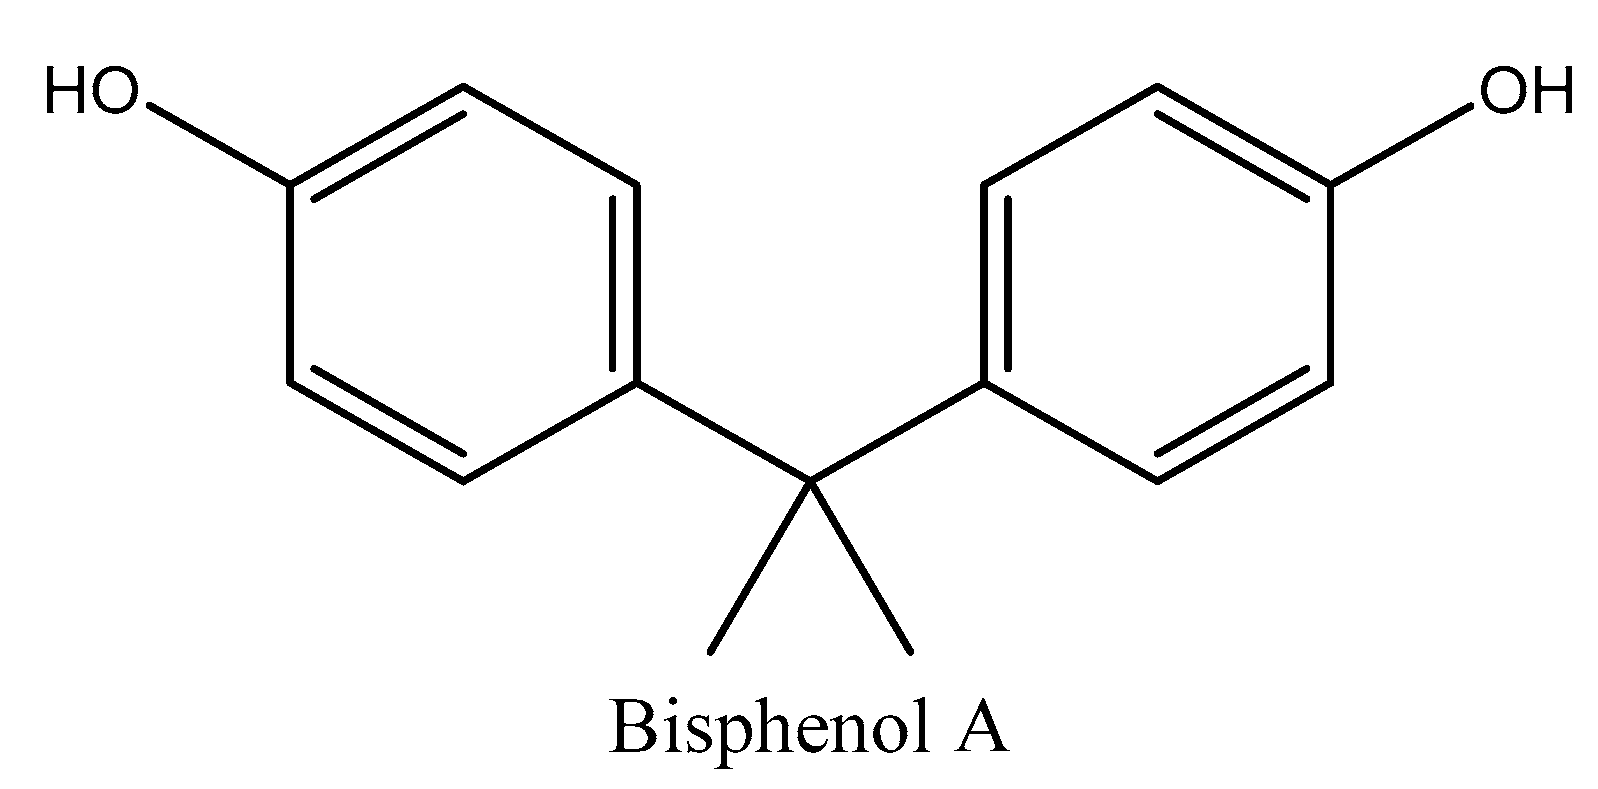
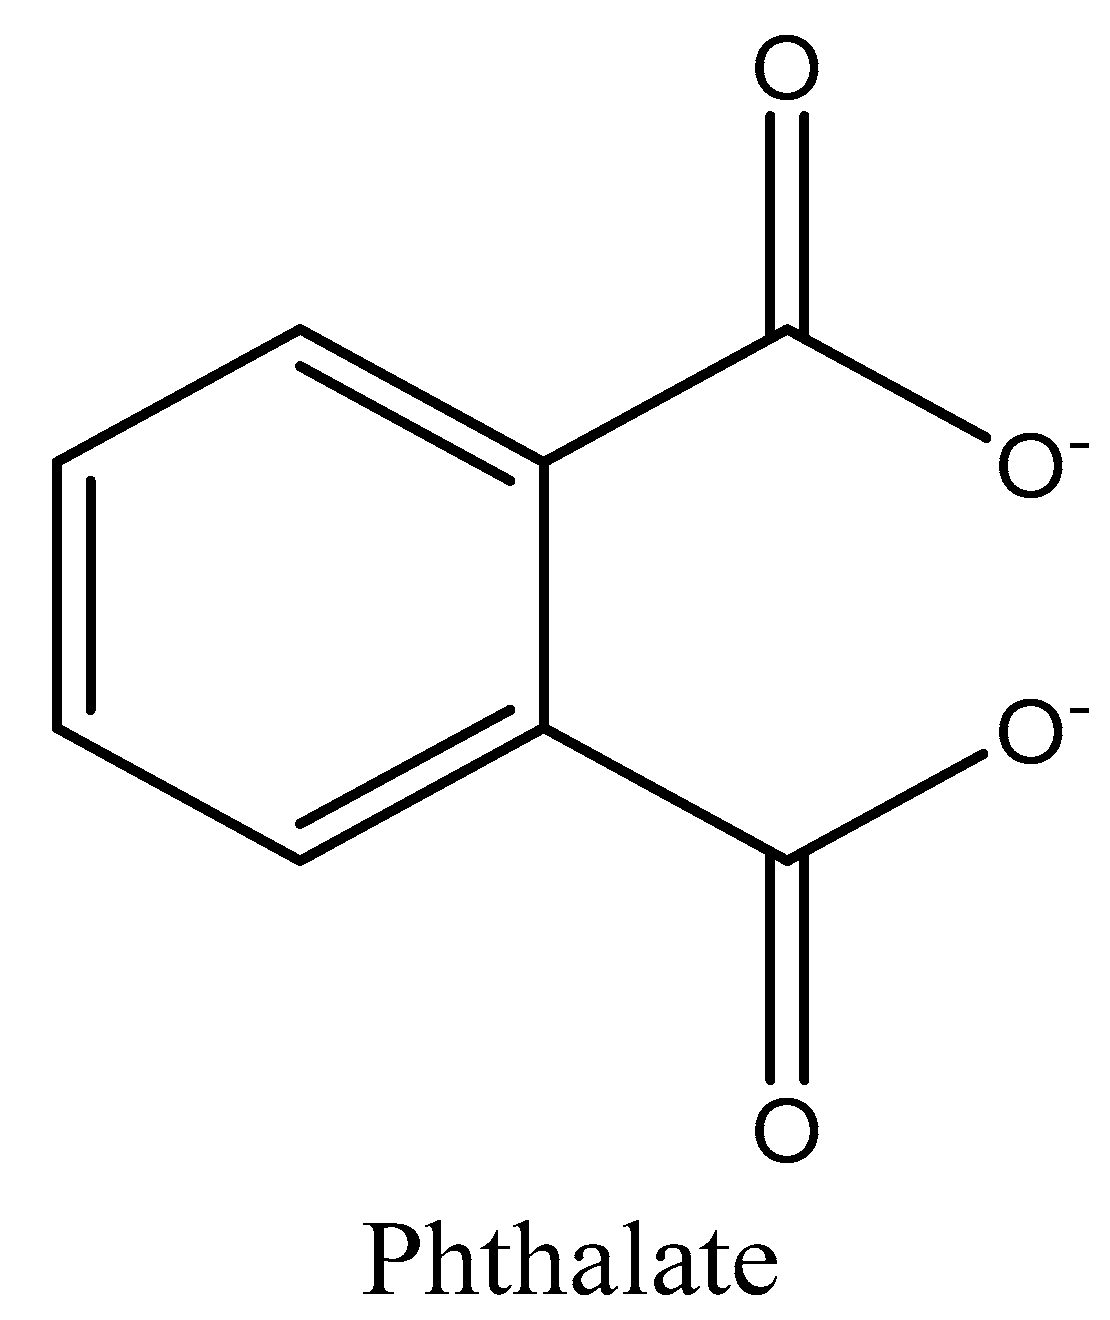
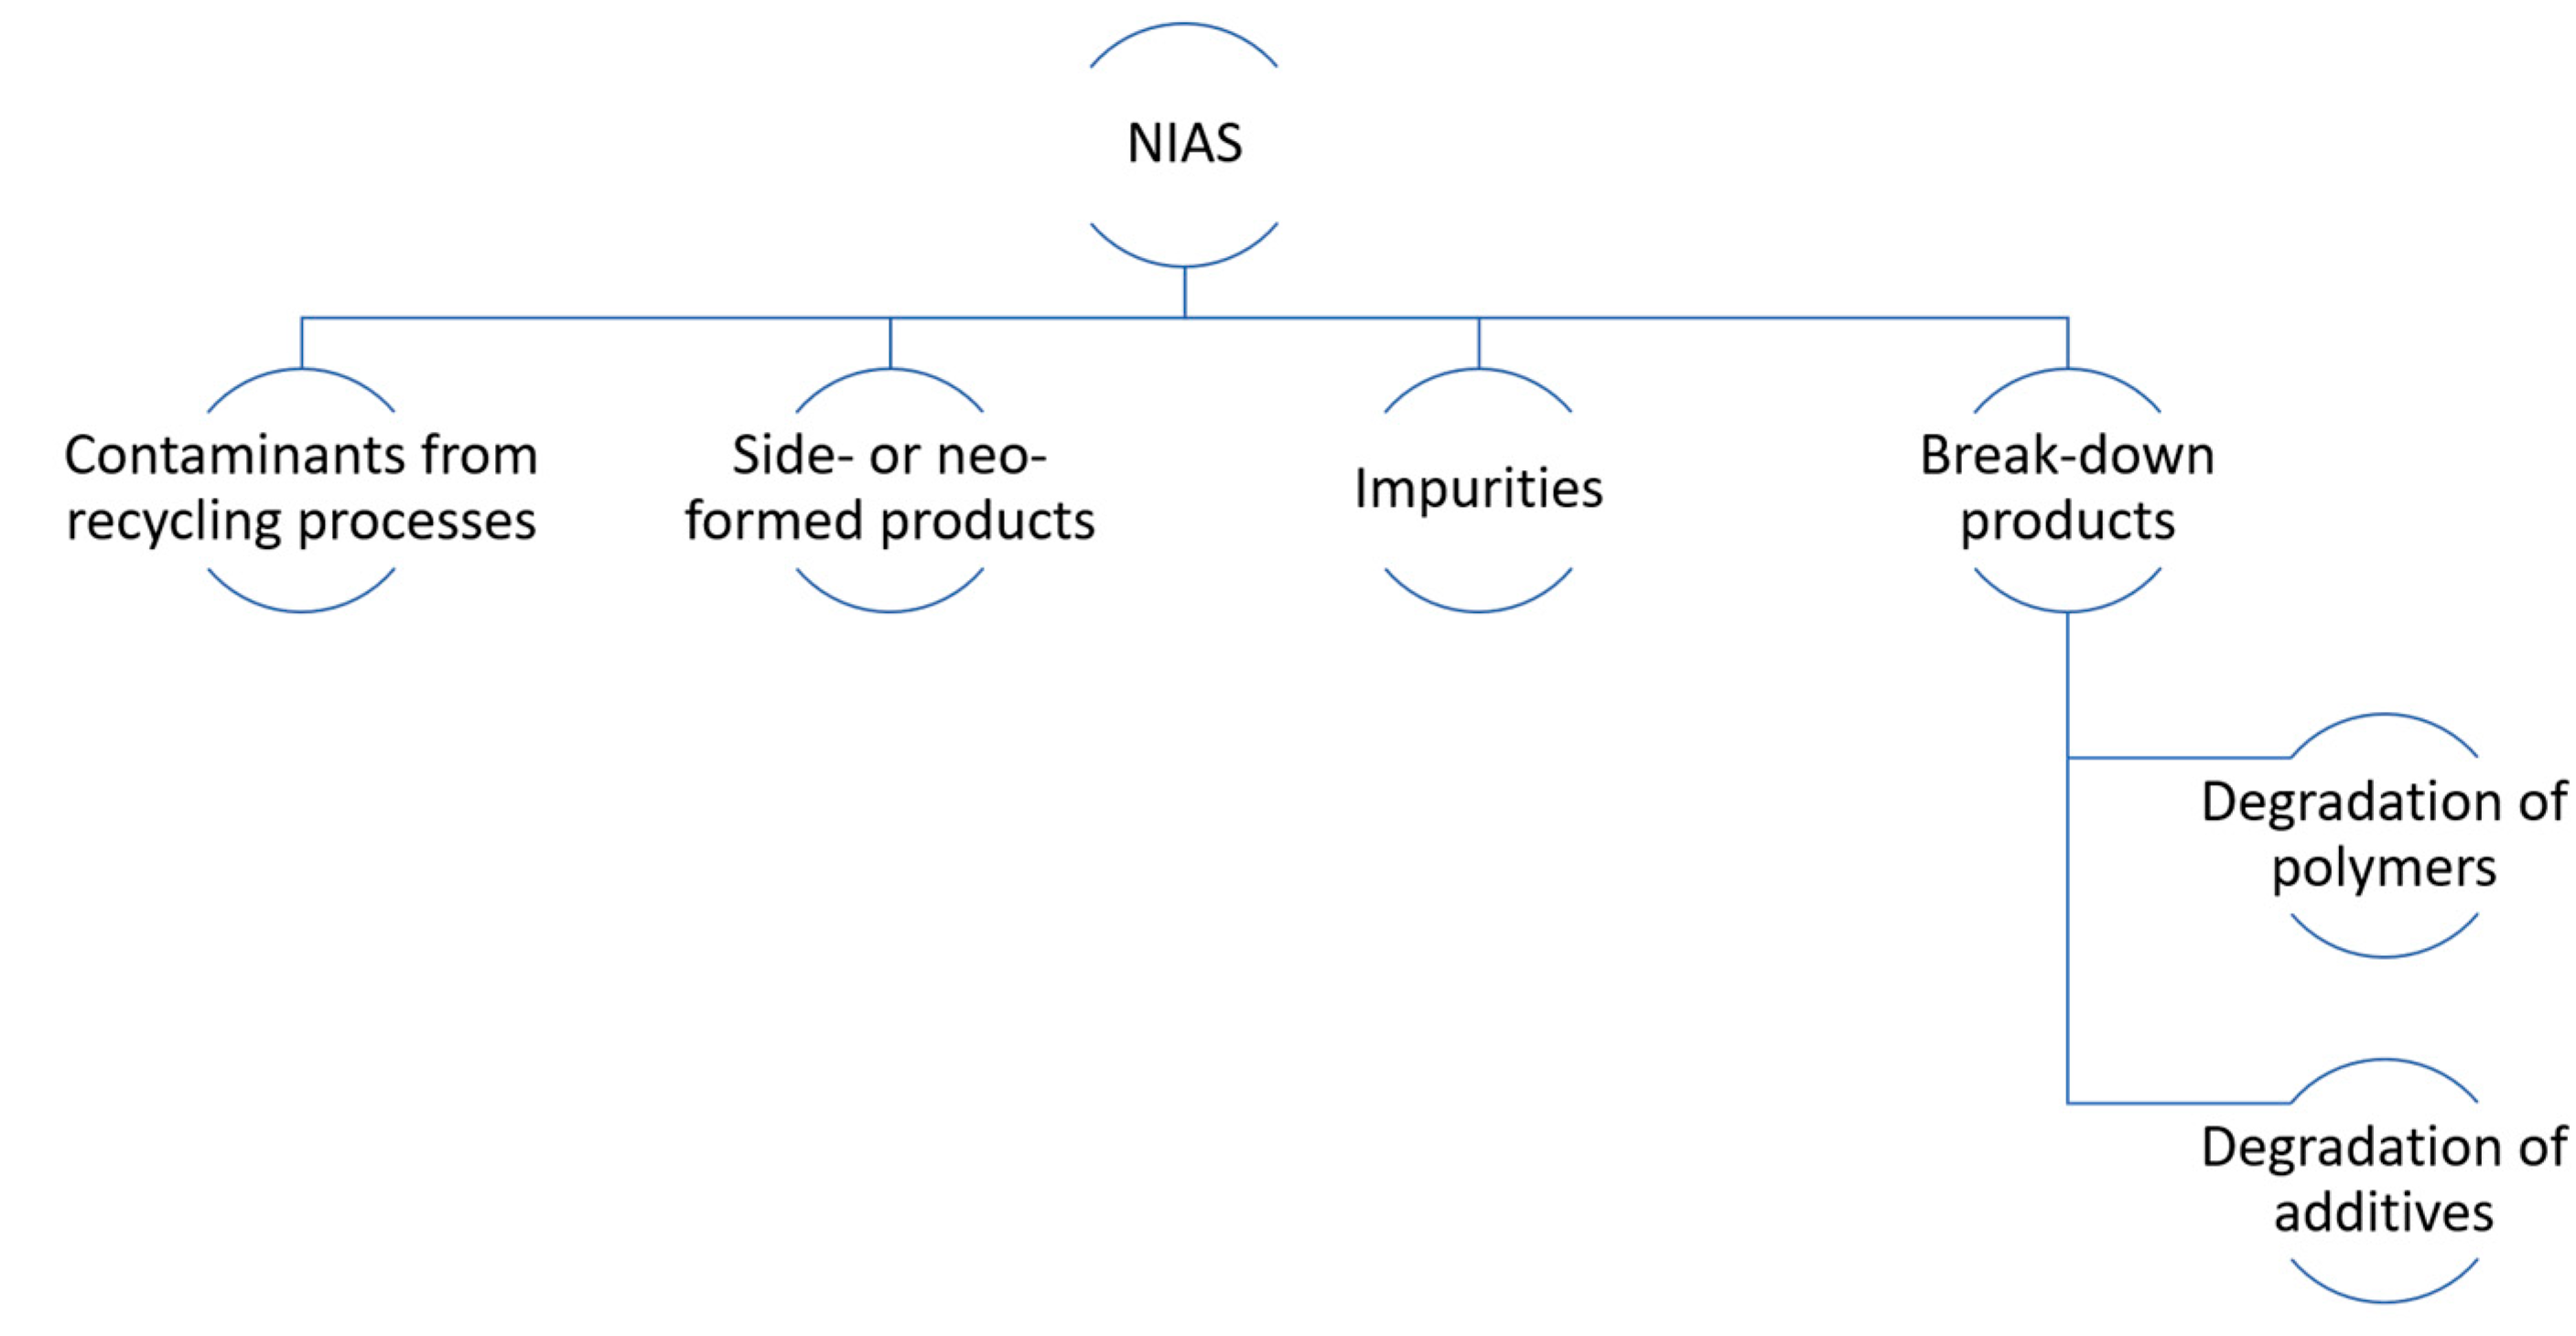
Table 1.
Inorganic contaminants in beverages and analytical techniques used for their determination.
Table 1.
Inorganic contaminants in beverages and analytical techniques used for their determination.
| Chemical Contaminant | Packaging Material | Beverage | Sample Treatment/ | Analytical Method | Ref. |
|---|---|---|---|---|---|
| Fe, Mn, Cd, Pb, Ni, Cr, Cu | Plastics, cans | Carbonated drinks, flavored yogurt, juice | DA | ICP/OES | [25] |
| Sn | Cans | Non-alcoholic, alcoholic beverages | CPE | FAAS | [32] |
| As | - | Drinking water, soft drinks, alcoholic beverages | CPE | UV–Vis | [34] |
| Fe, Mn, Zn, Cu, Pb | - | Black and green tea | Acid digestion | ICP/OES | [40] |
| Sb | PET | Mineral water and juice flavors | - | HR/CS/AAS | [35] |
| Sb, Zn | PET | Mineral water, flavored water and beverages | SPE | SSF | [23,24] |
| Sb, Sn | PET, cans | Beverages | UA/IL/DLLME | ICP/OES | [42] |
| Cd, Hg, Sn, Al, Pb, As | Glass | Fruit juices | MW/acid digestion | ICP/OES | [41] |
| Sn | - | Mineral water and fruit juices | Co-precipitation | GFAAS | [36] |
| Sb | PET | Non-alcoholic, alcoholic beverages | CPE | FAAS | [33] |
| Cd, Cr, Ni, Sb, Pb | rPET | - | MW-acid digestion | ICP/OES | [28,29] |
| As, Al, Ba, Cr, Fe, Mn, Mo, Ni, Pb, Se | rPET, rHDPE, rHDPE multi-layer | - | - | ICP/MS | [45] |
| Pb, Cd, Zn, Ni, Cu | rBoard | - | Acid digestion | ICP/OES | [46] |
| Cd, Pb | - | Soft drinks | DLLME | GFAAS | [47] |
| Zn, Cu | - | Alcoholic and non-alcoholic beverages | - | HR/CS/FAAS | [48] |
Table 2.
Amines in beverages and analytical procedures used for their determination.
| Chemical Contaminant | Beverage | Pre-Treatment/Derivatization | Analytical Method | Ref. |
|---|---|---|---|---|
| Put, Cad, Try, Phe, Spr, Spm, His, Tyr and 1,3-diaminopropane | Grape wine. Rice wine Beer | LLE | HPLC/DAD | [57] |
| His, Tyr, Try, Phe | White and red wines | Precolumn. 1-fluoro-2-nitro-4-(trifluoromethyl) benzene | HPLC/DAD | [60] |
| Put, His, Try, Cad, Agm, Spr, Spm, Phe | Wine. Beer | Precolumn Tosyl chloride | HPLC/MS/MS | [65] |
| Cad, Try, Tyr, His, Spm | Wine. Beer | Precolumn Fluorenylmethyl | HPLC/DAD | [56] |
| Tyr, Put, Try, Phe, Spm, Cysteamine, Metylamine | Fruit juices Beer | Precolumn 1-naphthylisothiocianate | HPLC/DAD | [66] |
| Put, Cad, Spm, Tyr, Phe, His | Wines | - | HPLC/FLD | [66] |
| Put, Spm, His, Tyr, Cad, Spm, Phe, Serotonin | Coffee | Precolumn. Dansyl chloride | HPLC/DAD | [67] |
| Tyr, Phe, Put, Cad, His, Tyr, Spr, Spm | - | - | UHPLC/MS/MS | [68] |
| 22 PAAs | Food simulant | Trifluoroacetic anhydride | HPLC/MS/MS | [54] |
| 8 PAAs | - | Trifluoroacetic anhydride derivatization | GC/MS | [54] |
Table 3.
Bisphenols in beverages and analytical procedures for their determination.
| Chemical Contaminant | Packaging Material | Beverage | Sample Treatment/Extraction Process | Analytical Method | Ref. |
|---|---|---|---|---|---|
| BPA | Nursing bottle | - | - | Amperometry Electrode: Tyr/Au@PDA-RGO-Chit/GCE LOD = 0.10 nM | [82] |
| BPA | - | Milk | - | DPV Electrode: Na-doped WO3/CPE LOD = 0.028 μM | [83] |
| BPA | Baby bottles Drinking bottles | - | - | FIA Electrode: MWCNTs-OH/GCE LOD = 0.18 μM | [84] |
| BPA | Milk bag Plastic juice box | - | - | DPV Electrode: ILs@HPS-Ni/CdFe2O4/GCE LOD: 4.55 nM | [85] |
| BPA | - | Milk | - | EIS Electrode: MCH/Aptamers/Au-NPs/BDD LOD = 1 fM | [86] |
| BPA | Plastic bottles | Water samples | - | FIA Electrode: SPCE/PEDOT/BMIMBr LOD: 0.02 μM | [87] |
| BPA | PC drinking bottle | - | - | LSV Electrode: CMK-3/nano-CILPE LOD: 0.05 μM | [88] |
| BPA | Water bottle | - | - | SWV Electrode: NiO/CNT/IL/CPE LOD: 0.04 μM | [89] |
| BPA | - | Water | - | DPV Electrode: ILs-LDH/GCE LOD: 4.6 nM | [90] |
| BPA | PC drinking bottles | - | LSV Electrode: MWNTs/Au/paper electrode LOD: 0.13 μM | [88] | |
| BPA | - | Milk | - | DPV Electrode: MWCNTs-PEI/GCE LOD: 3.3 nM | [91] |
| BPA | - | Milk | - | DPV Electrode: rGO-Fc-NH2/AuNPs/GCE LOD: 2 nM | [92] |
| BPA | - | Milk carton samples | - | DPV Electrode: GR/Au-Tyr-CS/GCE LOD: 1 nM | [93] |
| BPA | - | Soda Milk | - | LSV Electrode: Gr-IL/GCE LOD: 8.0 nM | [94] |
| BPA | Plastic feeding bottles | - | - | CV Transducer: TYR/TiO2/MWCNTs/PDDA LOD: 1 μM | [95] |
| BPA | Mineral water bottle | - | - | DPV Transducer: β-CD/ILCPE LOD: 4.16 nM | [95] |
| BPA | Polycarbonate drinking bottle | - | - | CV Transducer: AuNPs/MoS2/GCE LOD: 0.005 μM | [96] |
| BPA | Plastic bottled drinking water | Canned beverages | - | Derivative voltammetry Transducer: MIP-GR/ABPE LOD: 6.0 nM | [97] |
| BPA | Water bottle | - | SVW Transducer: ZnO/CNTs/IL/CPE LOD: 9.0 nM | [98] | |
| BPA | - | Milk Mineralized water samples | - | DPV Transducer: ERGO-MN202/CS/GCE LOD: 1.02 nM | [83] |
| BPA | - | Milk | - | CV Transducer: GNPs/GR/GCE LOD: 5 nM | [83] |
| BPA | Drink bottle | - | - | CV Transducer: CTAB/CPE LOD: 0.1 μM | [99] |
| BPA | - | Mineral water | - | CV Transducer: f-SWCNT/PC4/GCE LOD: 0.032 μM | [100] |
| BPA | - | Milk | - | DPV Transducer: Bi2WO6-CPE LOD: 20 nM | [101] |
| 5 bisphenols | - | 40 canned energy drinks | MIPs | UPLC/FLD LOQ: Down to 0.50 ng mL−1 | [69] |
| 8 bisphenols | - | Soft drinks | - | HPLC/FLD LOD: 5.52–21.37 ng mL−1 | [75] |
| BPA | - | Infant drinks | SPME | Ion/MS/MS | [80] |
| 12 bisphenols | - | Alcoholic and non-alcoholic beverages | Mixed-mode solid-phase extraction and stable-isotope dilution | HPLC/MS/MS LOD: 1.6–27.9 ng L−1 | [81] |
| BPA | Cardboard box Plastic canned Plastic Cardboard box with plastic cap and metal | Milk Soft drinks Bottle water Juice | LLE with acetonitrile, n-hexane, isopropanol, acetone:heptane mixtures | UPLC/MS/MS | [102] |
Table 4.
Phthalates in beverages and analytical methods for their determination.
| Chemical Contaminant | Packaging Material | Beverage | Analytical Method | Ref. |
|---|---|---|---|---|
| Dimethyl phthalate Diethyl phthalate | Plastics, paperboard | Hydroalcoholic beverages | GC/FID GC/MS | [105] |
| Diisopropyl phthalate | Plastics, paperboard | Soybean milk Wine | SPE/MIP US/LLME/GC | [103,104] |
| Dibutyl phthalate | Paper | Bottled milk | GC/MS | [103,108] |
| Diisobutyl phthalate | Paper, plastics, paperboard | Soybean milk Hydroalcoholic beverages | SPE/MIP GC/FID GC/MS | [108] |
| Benzylbutyl phthalate | Plastic | Bottled milk Wine | US/LLME/GC | [103,105,108] |
| Dipentyl phthalate | Plastics, cardboard | Hydroalcoholic beverages | GC | [108] |
| Dicyclohexyl phthalate | Plastics, cardboard | Wine | GC | [108] |
| Dihexyl phthalate | paper | Wine | GC | [108] |
| Dioctyl phthalate, bis(2-ethylhexyl) phthalate | Paper, plastics, cardboard | Bottled milk | GC | [108] |
| PHAs | Wine coffee | GC/MS | [19] | |
| 6 phthalates | Bottled milk | GC/FID LOD: 0.64–0.79 ng g−1 | [102] | |
| 8 phthalates | Wines | HPLC/MS/MS LOQ: 1.6–9.8 μg L−1 | [104] | |
| 3 phthalates | Polypropylene Baby Bottles | Milk simulants | FTIR GC/MS | [109] |
| 5 phthalates | - | Soybean milk | GC/MS | [110] |
| 8 phthalates | Tetra brick® | Beer, soft drinks, juices, soup, milk | GC/EI/MS GC/MS | [105] |
| 11 phthalates | - | Bottled beverages | SFC/UV LOD = 1.5–3.0 ng mL−1 | [111] |
Table 5.
Pesticides in beverages and analytical techniques for their determination.
| Chemical Contaminant | Beverage | Sample Treatment/Extraction Process | Analytical Method | Ref. |
|---|---|---|---|---|
| 21 pesticides | Tea | LLE | UHPLC/MS/ToF | [113] |
| 21 pesticides | Tea | HF/LPME | UHPLC/MS/MS | [114] |
| 185 pesticides | Red wine | - | UHPLC/MS/MS | [115] |
| 60 pesticides | Wine | SPE | HPLC/MS/ToF | [116] |
| 53 pesticides | Fruit juices | - | HPLC/MS/MS | [117] |
| 5 pesticides | Tea | SS/LPME | GC/MS | [118] |
| 19 pesticides | Coconut water | SDME | GC/MS | [119] |
| 9 pesticides | Fruit juices | DSPE DLLME | GC/FID | [120] |
| 131 pesticides | Tea | DSPE | GC/MS/MS | [99] |
| 102 pesticides | Tea | DSPE | HPLC/MS/MS | [121] |
| 86 pesticides | Tea | DSPE | HPLC/MS/MS GC/MS/MS | [122] |
| 277 pesticides | Beer | LLE, SLE | HPLC/MS/MS | [123] |
| 58 pesticides | Beer | QuEChERS | HPLC/MS/MS | [124] |
| 72 pesticides | Beer | LLE | HPLC/MS/MS | [125] |
| 5 pesticides | Beer, Barley Tea | SPE | HPLC/MS/MS | [126] |
| 300 pesticides | Beer | QuEChERS | HPLC/MS/MS | [127] |
| 30 pesticides | Fruit-based soft drinks | SPE | HPLC/MS/ToF | [128] |
| 33 pesticides | Fruit-based soft drinks | SPE | HPLC/MS/ToF | [129] |
Table 6.
NIAS in beverages and the analytical method used for their determination.
| Chemical Contaminant | Packaging Material | Beverage | Sample Treatment/Extraction Process | Analytical Method | Ref. |
|---|---|---|---|---|---|
| 26 potential migrants | LDPE+ nylon, PE based material | - | Migration test | HPLC/Q/TOF/MS/MS | [130] |
| 13 potential migrants | PU | - | Migration test | GC/MS HPLC/MS | [135] |
| 63 potential migrants | PU and films of different plastics | - | Migration test | HSSPME/GC/MS | [136] |
| 7 potential migrants | Soda can sealers | - | Migration test | UHPLC/IMS/QTOF/MS | [137] |
| 42 potential migrants | Multilayer packaging PET/Al/PE | - | Migration test | HPLC/Q/TOF/MS | [138] |
| 7 potential migrants | Monolayer film PLA/PL/ZnO NPs | - | Migration test | GC/MS HPLC/MS | [139] |
| 7 potential migrants | Biopolymers based on starch and PLA | - | Migration test | GC/MS | [140] |
| 100 potential migrants | Different plastic films | - | Migration test | GC/MS | [141] |
| 76 potential migrants | PP films | - | Migration test | UHPLC/Q/TOF/MS | [142] |
| 17 potential migrants | LDPE | - | - | Raman spectroscopy | [134] |
| 26 potential migrants | PET bottles | - | - | HSSPME/GC/MS | [143] |
© 2020 by the authors. Licensee MDPI, Basel, Switzerland. This article is an open access article distributed under the terms and conditions of the Creative Commons Attribution (CC BY) license (http://creativecommons.org/licenses/by/4.0/).
Share and Cite
MDPI and ACS Style
Pelegrín, C.J.; Flores, Y.; Jiménez, A.; Garrigós, M.C. Recent Trends in the Analysis of Chemical Contaminants in Beverages. Beverages 2020, 6, 32. https://0-doi-org.brum.beds.ac.uk/10.3390/beverages6020032
AMA Style
Pelegrín CJ, Flores Y, Jiménez A, Garrigós MC. Recent Trends in the Analysis of Chemical Contaminants in Beverages. Beverages. 2020; 6(2):32. https://0-doi-org.brum.beds.ac.uk/10.3390/beverages6020032
Chicago/Turabian StylePelegrín, Carlos Javier, Yaiza Flores, Alfonso Jiménez, and María Carmen Garrigós. 2020. "Recent Trends in the Analysis of Chemical Contaminants in Beverages" Beverages 6, no. 2: 32. https://0-doi-org.brum.beds.ac.uk/10.3390/beverages6020032
Note that from the first issue of 2016, this journal uses article numbers instead of page numbers. See further details here.