Article

The Effect of Pasteurization and Shelf Life on the Physicochemical, Microbiological, Antioxidant, and Sensory Properties of Rose Apple Cider during Cold Storage

by
Chukwan Techakanon
1,* and
Chirat Sirimuangmoon
2
1
Faculty of Science and Industrial Technology, Prince of Songkla University Surat Thani Campus, Surat Thani 84000, Thailand
2
School of Agro-Industry, Mae Fah Luang University, Chiang Rai 57100, Thailand
*
Author to whom correspondence should be addressed.
Submission received: 17 April 2020 / Revised: 12 June 2020 / Accepted: 27 June 2020 / Published: 3 July 2020
(This article belongs to the Special Issue Stability and Shelf Life of Beverages)

Abstract

:
Rose apple fruits (Syzygium agueum Alston cv. Taaptimjan) were used to produce cider to overcome their limitation of short shelf life. Following fermentation, alternative pasteurization conditions at 63 °C for 15 s and at 71 °C for 6 s were compared. The effects of pasteurization conditions on physicochemical properties, microbial safety, antioxidant capacity, and sensory properties of the cider were investigated during storage for 6 months at refrigerated temperature. The unpasteurized cider had 5.9% ethanol content with TSS of 4.1 °Brix. Alcohol content of this treatment group increased while TSS decreased during storage, as effects of continuing fermentation. Pasteurization at 63 or 71 °C effectively prolonged cider shelf life to 3 and 6 months, respectively. Nonetheless, the processing significantly decreased contents of ascorbic acid and antioxidants and affected sensory profile of the cider. Principal component analysis (PCA) indicated storage time as the dominant factor determining cider quality. Trained panelists in the sensory study perceived more intense sweetness, less sourness, and less flavor in the pasteurized samples compared to the control group. The pasteurization conditions 71 °C for 6 s achieved microbiological safety and resulted in desirable sensory quality for up to 6 months of shelf life.

1. Introduction

Rose apple or wax apple (Syzygium aquem Alston) is an important tropical fruit in Southeast Asia, particularly in Thailand, Taiwan, Malaysia, and Indonesia [1]. Rose apple fruit has a pear shape with very thin greenish to deep-reddish skin depending upon cultivar. Fruit mass can vary from 28 g to more than 200 g per fruit. This has become a popular exotic fruit in Western countries due to its unique characters including apple-like crispness, watery sweetness, slightly acidic taste, and aroma of roses [2]. The production of this fruit in Thailand, Taiwan, and Indonesia has continuously increased [1]. A high yield of 50,661 tons was reported for rose apple in Thailand in 2018, creating more than 2000 million baht, which equates to approximately 67 million USD [3]. Among the various cultivars, Taaptimjan is the most popular in Thailand because of its ruby-red skin color, sweet taste, and seedlessness with pleasant flavor. Moreover, this cultivar provides a good source of bioactive compounds, especially phenolic compounds [2]. A major limitation of rose apples is their short shelf life because of their characteristic thin and dehydrated skin that makes them highly perishable. Furthermore, the fruits are sensitive to low temperature storage (0–10 °C) that triggers chilling injuries [4,5]. In order to overcome these limitations and expand rose apple market to a more extensive level, food technology and preservation techniques are required. Several studies have focused on improving the storage life of fresh rose apple fruit, while the processing of this fruit to new products, especially to a beverage, is still limited. In recent years, consumer interest in health has increased, especially as concerns nutrition and diet [6,7]. Rose apple fermentation to produce cider could be an alternative approach creating economic value to these fruits and a match with consumer needs.
Cider is a healthy fermented beverage with low alcohol content in the range 3.0–8.5% with a weakly acidic and slightly sour taste. This is a native drink and has long been popular in western countries. In traditional farmhouse cider making, fermentation is performed by indigenous yeast, while in a commercial approach, unfiltered fruit juice (must) is inoculated with yeast, particularly of species Saccharomyces, Kloeckera, Candida, or Pichia. These microorganisms induce anaerobic fermentation using the sugar from fruit juice to produce ethanol [8,9]. Phytochemical and antioxidant profiles of cider are elevated compared to the juice [10], thus cider has been considered a healthy drink. The rich phenolic content in cider provides several health benefits. Moreover, polyphenols are involved in the color and overall mouthfeel of ciders, especially the bitter taste and astringency [11]. In general, cider is mostly made from apples, although there are other fruits used for cider production, for example pear, cherries, and pome orange [8]. Our previous study introduced cider making from rose apple cv. Taaptimjan and determined its chemical profile compared to rose apple juice [10]. The results from this study indicated that the cider made from rose apple had ethanol content of 6.17%, TSS 3.2 °Brix, and pH of 4.63.
Multiple outbreaks of Escherichia coli and Salmonella sp. contamination in fresh fruit, juices, and other fruit products have raised concerns about the safety of such products [12]. In the case of unpasteurized cider, the several pathogenic bacteria involved include Escherichia coli O157:H7, Salmonella spp., Listeria monocytogenes, and Cryptosporidium parvum. Contamination by E. coli O157:H7 has been the major cause of foodborne illness from apple cider [13,14]. The infection by this pathogen can lead to diarrhea, bloody diarrhea, and haemolytic-uraemic syndrome (HUS) [15]. According to the U.S. Food and Drug Administration regulations, apple cider is required to be treated to achieve a 5-log reduction of the target pathogen [16]. Food processing, both thermal and non-thermal, has been developed to ensure safety of cider for consumption. The candidate non-thermal processes include high-pressure [17,18], UV-irradiation [18,19,20], ultrasound [21,22,23], and pulsed electric field [24,25]. These have been tested for potential use in reducing numbers of pathogens in cider and juice. Although some methods have been approved by the Food and Drug Administration, most still have limitations in commercial applications and effectiveness, depending also on the type of equipment used. Thermal processing thus has been considered the most applicable method for pathogen reduction in cider, and E. coli O157:H7 has been considered the target for pasteurization. The process is also considered the most cost-effective method to guarantee microbial safety [26]. Caminiti et al. [27] suggested that mild temperature short time (MTST), a heat treatment using temperature ≤80 °C, and holding time ≤30 s, resulted in minimal effects on sensory quality of juice. The pasteurization equivalent was established using a D-value of 23 min at 52 °C and a z-value of 4.8 °C to achieve a 5-log reduction of E. coli O157:H7 [28,29]. As stated by AFDO [30], the recommendation for flash pasteurization of apple cider is to heat the juice to 71 °C for 6 s, or to use an equivalent time/temperature combination. Pasteurization is recommended to ensure safety of the cider product. Despite that, the processing technique may result in physicochemical changes that could result not only in sensory modifications but also reduce the content or bioavailability of valuable antioxidants in the product. The goal of reducing the risk from microorganism contamination is crucial, however, it needs to be in balance with retention of the quality attributes. Hence, optimization of the processing conditions is a key to balancing these aspects. The objective of this study was to produce an off-dry and still cider from rose apple and investigate the effects of pasteurization at alternative conditions (63 °C for 15 s and 71 °C for 6 s) compared to control (unpasteurized) on physicochemical properties, microbial safety, antioxidant activity, and sensory profile of the rose apple cider during refrigerated storage for up to 6 months.

2. Materials and Methods

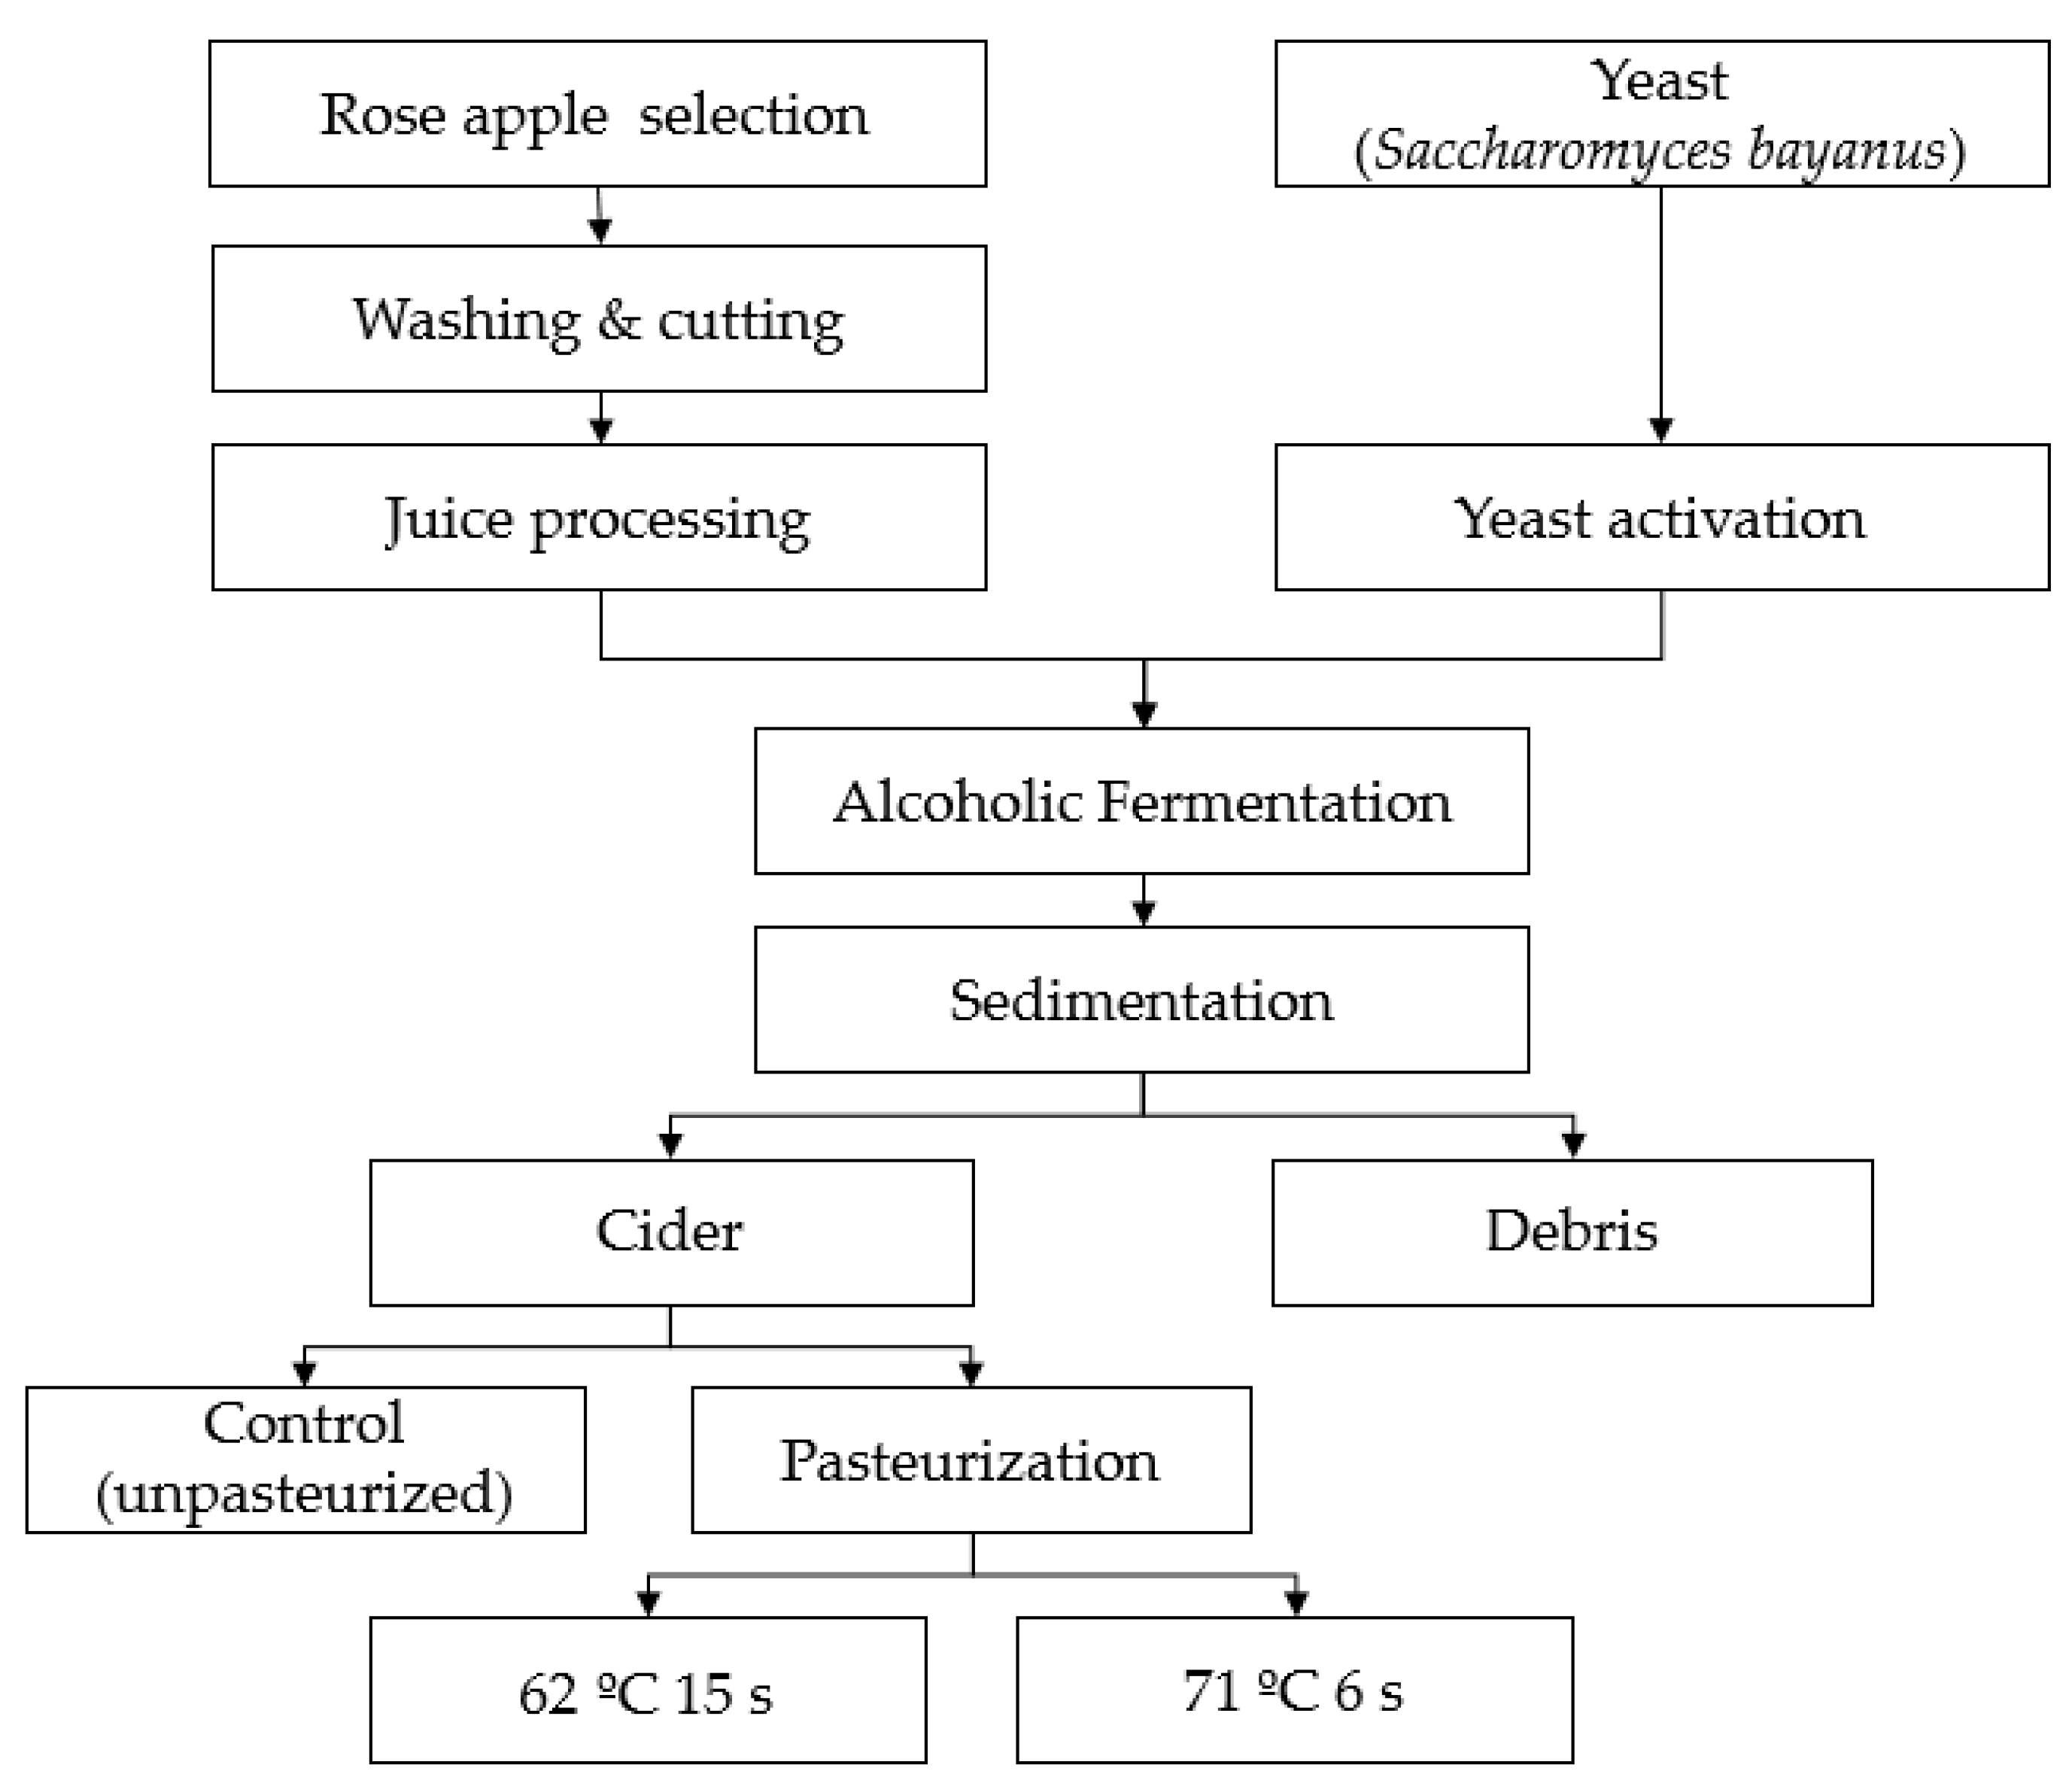
2.1. Cider Preparation and Pasteurization Process

The rose apples (Syzygium aquem Alston cv. Taaptimjan) were harvested by hand from a local commercial orchard in Suratthani province, Thailand. The fruit were transported to the laboratory within 3 h. The raw material selection was based on uniform size (7–9 cm height and 6–8 cm width), dark reddish color, total soluble solids of 10–14 °Brix, and free from damage or disease. The selected fruits (50 kg) were cleaned with distilled water and cut in half before processed to juice using a food processor (Philips centrifugal juicer) on the same day. Approximately 25 L of rose apple juice was obtained and roughly strained using a stainless-steel strainer. Cider fermentation was performed based on the method described by Alberti et al. [31] with some modifications. The process diagram is demonstrated in Figure 1. In each replicate, the rose apple juice (4 L) was used. The yeast strain Saccharomyces bayanus (Fermentis, Lesaffre, Marcq-en-Baroeul, France) was activated in 100 mL rose apple juice and inoculated at 106 cells/mL. Then it was allowed to ferment in a fermenter (Bioflow 3000, New Brunswick Scientific, Edison, NJ, USA). Alcoholic fermentation occurred in the anaerobic environment for 10 days at 25 °C. Sedimentation process, carried out after fermentation by the force of gravity, yielded a cider with some residual yeast and debris. An off-dry and still cider was obtained after sedimentation. Each replication yielded approximately 3 L of cider and was randomly divided to three aliquots of 1 L for control (no heat treatment), pasteurized (63 °C for 15 s), and pasteurized (71 °C for 6 s). The cider was subjected to thermal processing in a custom-made tubular pasteurization unit (ESSOM, Bangkok, Thailand). All three treatment groups were bottled and stored at refrigerated temperature (4 ± 1 °C). Cider fermentation and pasteurization were performed in triplicate.

2.2. Physicochemical Analysis

The cider samples were monitored for total soluble solids using a digital handheld refractometer (Atago, Tokyo, Japan), and the values are reported in °Brix. Ethanol content of cider during storage was determined with an alcoholmeter (Dujardin-Salleron, Noizay, France). The pH was monitored using a digital pH meter (SI Analytics, Mainz, Germany). Total acidity was measured by volumetric neutralization with 0.1 N sodium hydroxide using phenolphthalein as the indicator and is reported in equivalents tartaric acid (g/L). The electrical conductivity is reported in µs/cm and the values were obtained using a conductivity meter (YSI Incorporated, Yellow Springs, OH, USA). The clear part of cider samples was analyzed for total nitrogen (TN) by the Kjeldahl method (AOAC, 2000). The density of samples was measured using a hydrometer with results expressed in g/cm3.

2.3. Microbiological Analysis

Cider samples were evaluated for aerobic microorganisms, yeast and mold, and E. coli once every month. Plate count agar (PCA) (Himedia, Mumbai, India) was used to enumerate the counts for total aerobic microbes. For yeast and mold counts, acidified Potato Dextrose Agar (PDA) at pH 3.5 (Himedia, India) was used. Colonies were counted and are reported as log10 CFU/mL. To enumerate the E. coli in the rose apple cider, 3 M Petrifilm E. coli/Coliform Count Plates (3 M, Saint Paul, MN, USA) were applied.

2.4. Vitamin C Content

The content of vitamin C was measured by means of titration with iodine solution, using the method suggested by Babashahi-Kouhanestani et al. [32]. The cider sample (5 mL) was diluted with 20 mL distilled water, then 0.5 mL of starch paste was added to the solution. The mixture was titrated with 0.01 N iodine solution until blue color was obtained. The content of vitamin C in samples is expressed in mg/100 mL.

2.5. Total Phenols

Total phenols were determined by Folin–Ciocalteu method as described by Waterhouse [33] with some modifications. The cider sample was centrifuged and the supernatant (1 mL) was mixed with 0.36 mL 2 N Folin–Ciocalteu reagent. The mixture was vortexed and allowed to stand for 5 min, after which sodium carbonate (6 mL) was added. The solution was homogenized before adding 2.64 mL of deionized water and incubating at 50 °C for 5 min. When the reaction is completed, the color of solution changes from yellow to blue. Afterwards, the sample was cooled to room temperature, then the absorbance was read at 760 nm using spectrophotometer (UV−1280, Shimadzu, Kyoto, Japan). The results are expressed in mg of gallic acid equivalents (GAE)/L.

2.6. Antioxidant Capacity

2.6.1. DPPH Radical Scavenging Activity

DPPH radical scavenging activity was assayed according to the procedure described by Delgado et al. [34]. The sample (0.1 mL) was mixed with 2.9 mL of DPPH ethanolic solution prepared by dissolving 0.0024 g of DPPH in 100 mL of ethanol. After incubating in dark for 1 h at room temperature, the absorbance was determined at 517 nm. The results are expressed in percentage of scavenging activity calculated by the following equation:
%DPPH radical scavenging activity = [(ADPPH − ASAMPLE)/ACONTROL] × 100

2.6.2. ABTS•+ Radical Scavenging Activity

The ABTS•+ radical cation scavenging activity was analyzed by the method described by Re et al. [35]. To prepare the ABTS•+ 3.5 mM ABTS was reacted with 1.25 mM potassium persulfate. The mixture was incubated in the dark at room temperature for 12–16 h before use. The prepared solution was diluted with ethanol to 0.035 mM with an absorbance of 0.7 at 734 nm. The cider sample was mixed with the prepared ABTS•+ solution (1:3). After reaction at room temperature for 6 min, the absorbance was measured at 734 nm. The ability to reduce the ABTS•+ was calculated using the following equation:
%scavenging activity = [(ACONTROL − ASAMPLE)/ACONTROL] × 100

2.6.3. Hydroxyl Radical Scavenging Ability

The hydroxyl radical scavenging ability using deoxyribose method was applied in this study [36]. The cider sample (100 µL) was added to 690 µL of 0.2 M phosphate buffer (pH 7.4) containing 2.5 mM 2-deoxyribose. Then, a mixture of 1.04 mM EDTA 100 µL and 1.0 mM iron ammonium sulphate was added and homogenized. The mixture was transferred to a 37 °C water bath before adding 100 µL of 1.0 mM L-ascorbic acid and 10 µL of 0.1 M hydrogen peroxide. The homogenized sample was incubated at 37 °C for 10 min, then 1.0 mL of cold 2.8% trichloroacetic acid was added and followed by 0.5 mL of 1% thiobarbituric acid. After this, the sample was boiled for 8 min and the absorbance was measured at 532 nm after the sample was cooled to room temperature. The hydroxyl radicals scavenging activity of cider sample is expressed as percentage calculated by the following equation:
%scavenging activity = [1 − (ACONTROL/ASAMPLE)] × 100

2.6.4. Ferric Reducing Antioxidant Power (FRAP)

FRAP assay was performed according to the method described by Benzie and Strain [37] with some modifications. The sample (40 µL) was mixed with 360 µL of fresh FRAP reagent, which was prepared daily using 10 mM TPTZ (2,4,6-tripyridyl-S-triazine) mixed with 20 mM FeCl3 and 0.3 M acetate buffer at pH 3.6 in the ratio 1:1:10 (v/v). The mixture was evaluated 6 min after mixing against a blank (FRAP reagent and distilled water). A colored ferrous-tripyridyltriazine complex formed by reduction of ferric (Fe3+) to ferrous ion (Fe2+) at low pH was monitored at 593 nm (UV-1280, Shimadzu, Kyoto, Japan). The results are expressed in mmol Fe2+ per 100 mL.

2.7. Modified Spectrum Descriptive Analysis (SDA)

The sensory analysis of cider samples from different treatment groups (control, pasteurization at 63 °C, and pasteurization at 71 °C) during storage life was performed by 15 trained panelists (ages 21–40 years) recruited on the PSU, Suratthani campus. Panel training was organized in 5 2-h training sessions on the general characteristics of rose apple cider. In the first training session, the panelists were given cider samples to taste and asked to develop terms for rose apple cider attributes in aroma (flavor) and taste. During the two following sessions, reference standards at each intensity (from 1 to 5) for the sensory attributes were constructed. In the subsequent sessions, the panelists practiced defining and rating the attributes using a 5-point scale, with 1 for “minimum intensity” and 5 for “maximum intensity”. During the last training session, the panelists practiced evaluating each rose apple cider attribute. The first set of sensory analysis was scheduled on the following day after obtaining microbial results, and subsequent analyses were carried out every 4 weeks over the 6 months of study. A randomized block design was applied for cider sample serving order to each panelist. The samples from different treatments were presented in plastic cups labeled with randomly generated three-digit numbers. Cider samples were served with a cup of water as palate cleanser between samples. To prevent the lasting effect of some strong tastes and aftertastes, the panelists were asked to rinse their mouth until the lasting taste or aftertaste was completely gone, or they could take a break until their palate had recovered to the normal state of perception. The reference standards for tastes (sweetness, bitterness, sourness, and aftertaste) and aromas (fruity smell and sour smell) and a summary of definitions and reference standards for all attributes were also provided in the tasting room to remind their memory and intensity of each point of attribute before the training sessions and the actual test. The panelists were instructed to evaluate the rose apple cider attributes compared to the score given to the reference standards using a 5-point scale.

2.8. Statistical Analysis

This experiment was carried out in three replicate processing runs. The data from physicochemical analysis, vitamin C content, total phenols and antioxidants were analyzed using analysis of variance (ANOVA) and Duncan’s multiple range test to compare the means at p < 0.05. The results are presented as means with standard deviations. SPSS v22 for Windows (IBM, Armonk, NY, USA) was used for all analysis of variance. Principal component analysis (PCA) (XLSTAT version 2012, Addinsoft, Paris, France) was used to evaluate ratings from panels and the data from physicochemical and antioxidant analyses. PCA was conducted from attributes by using the correlation matrix extraction method with no rotation.

3. Results and Discussion

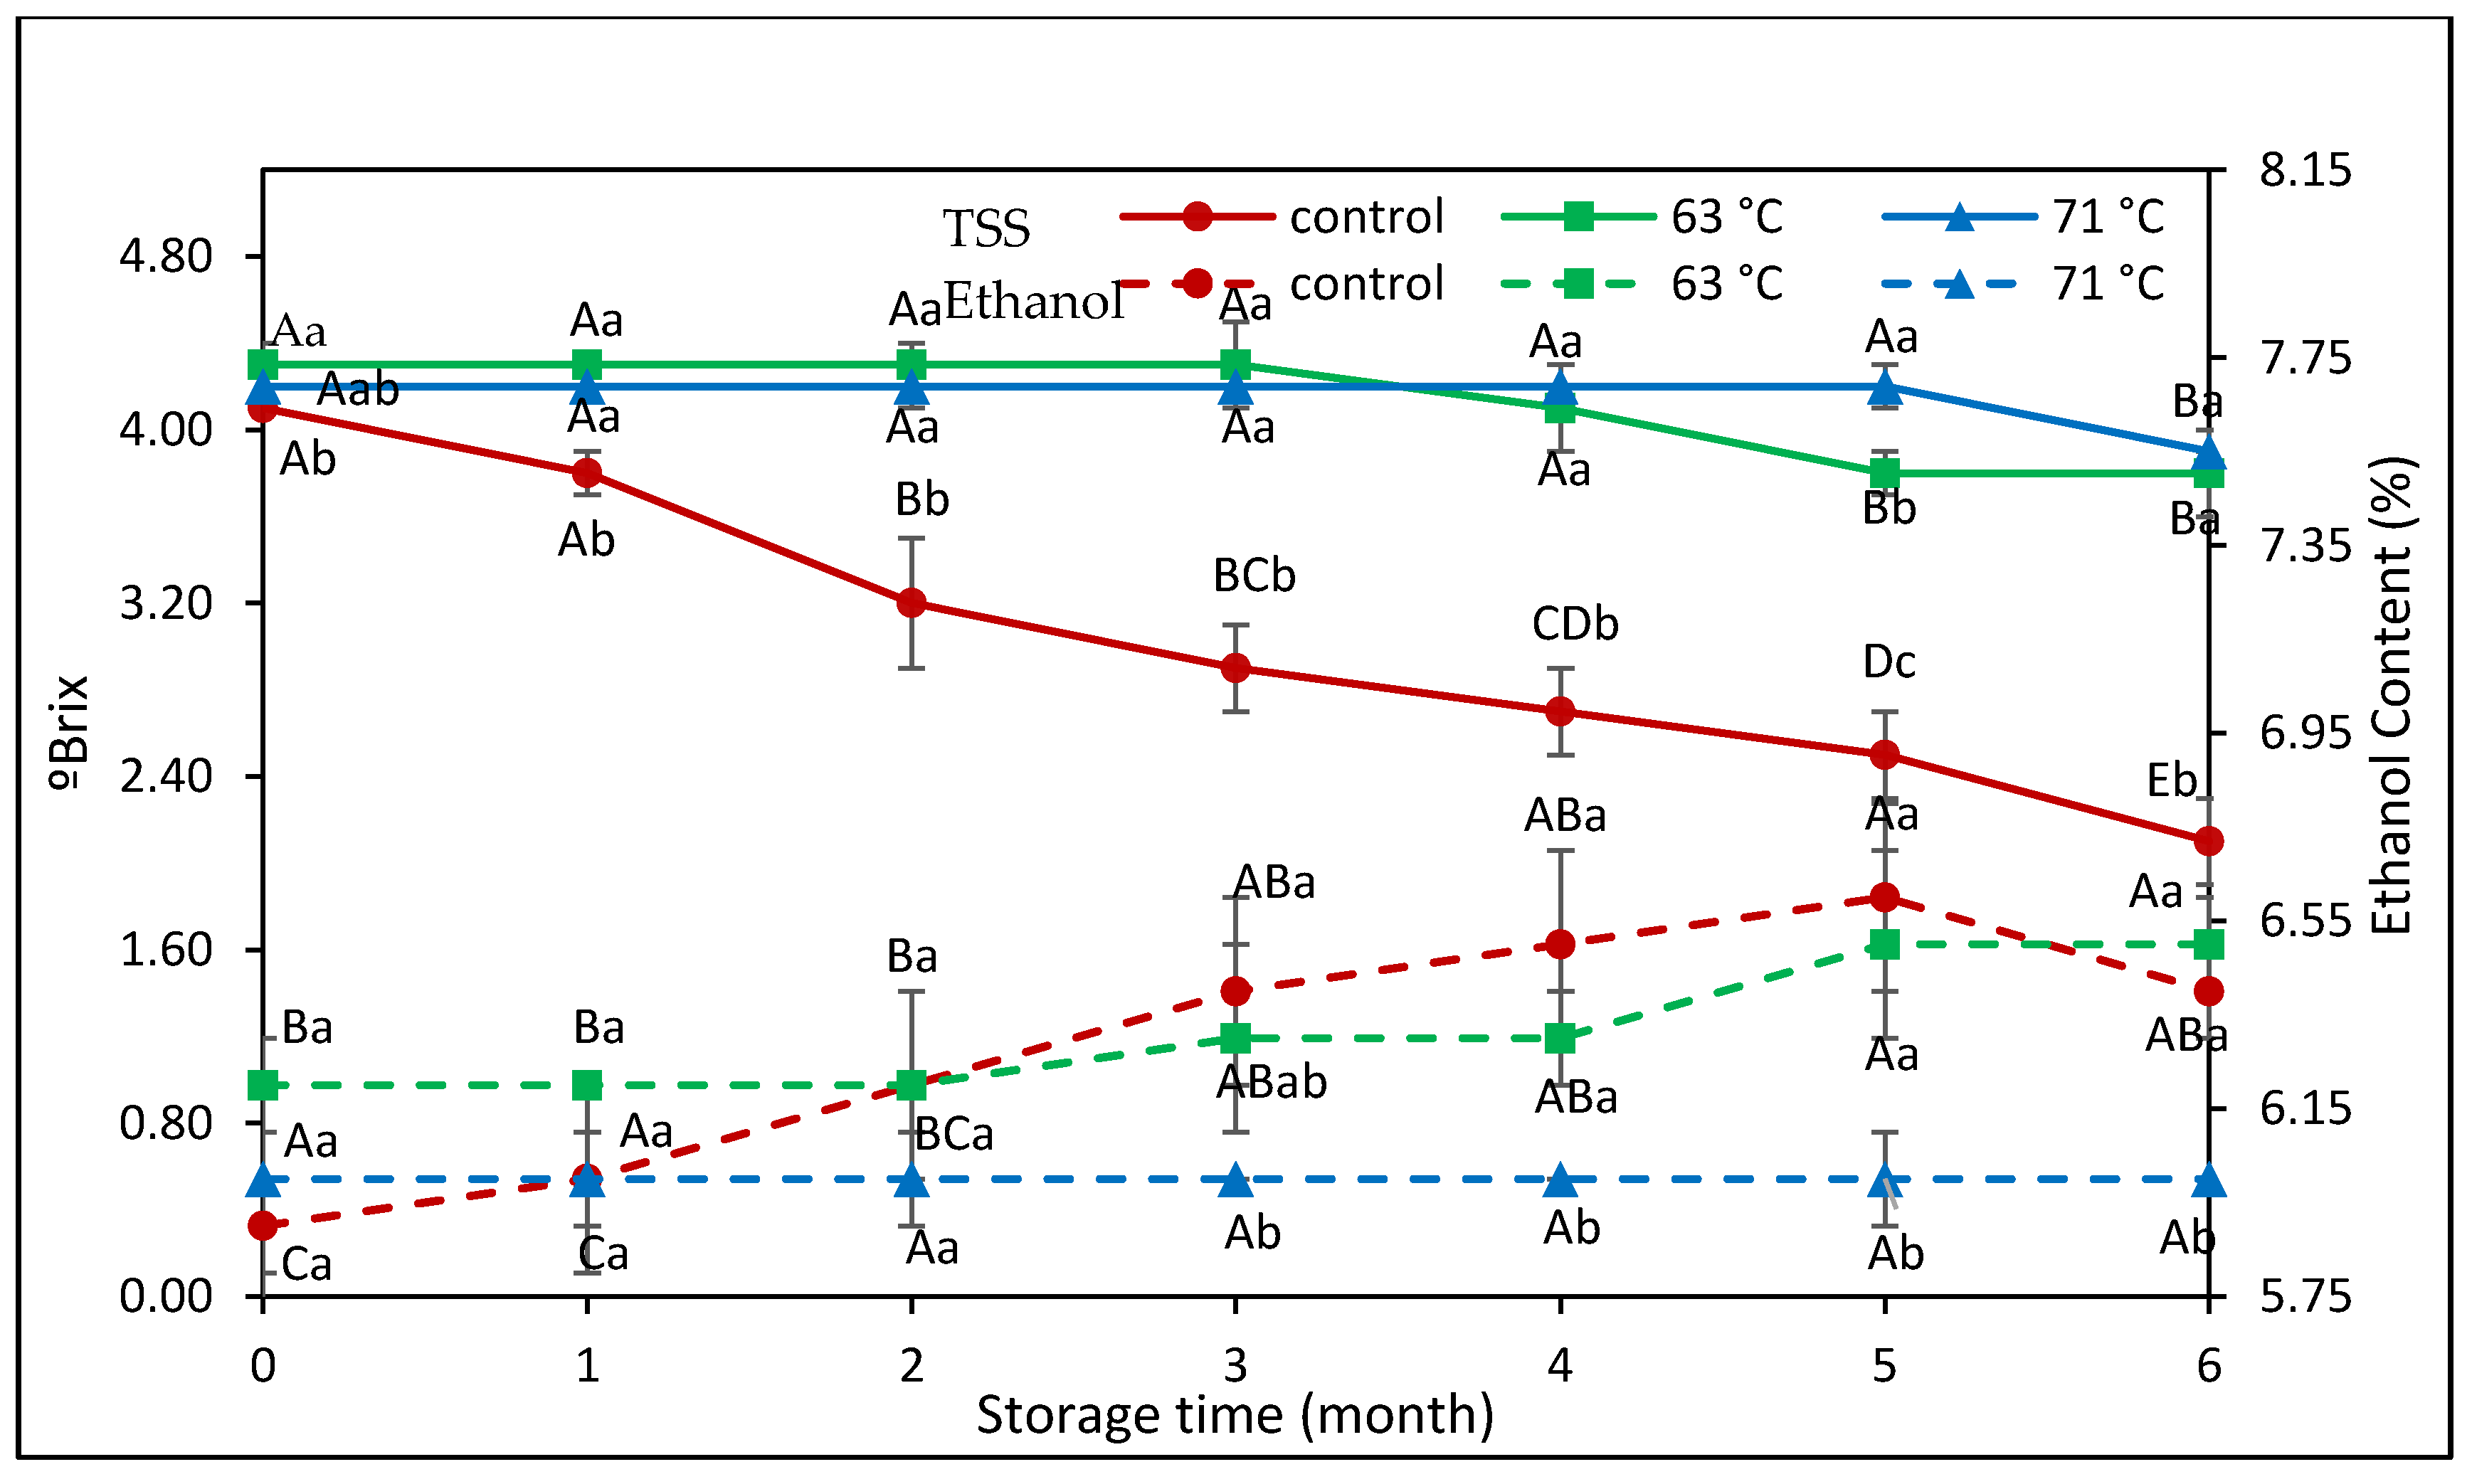
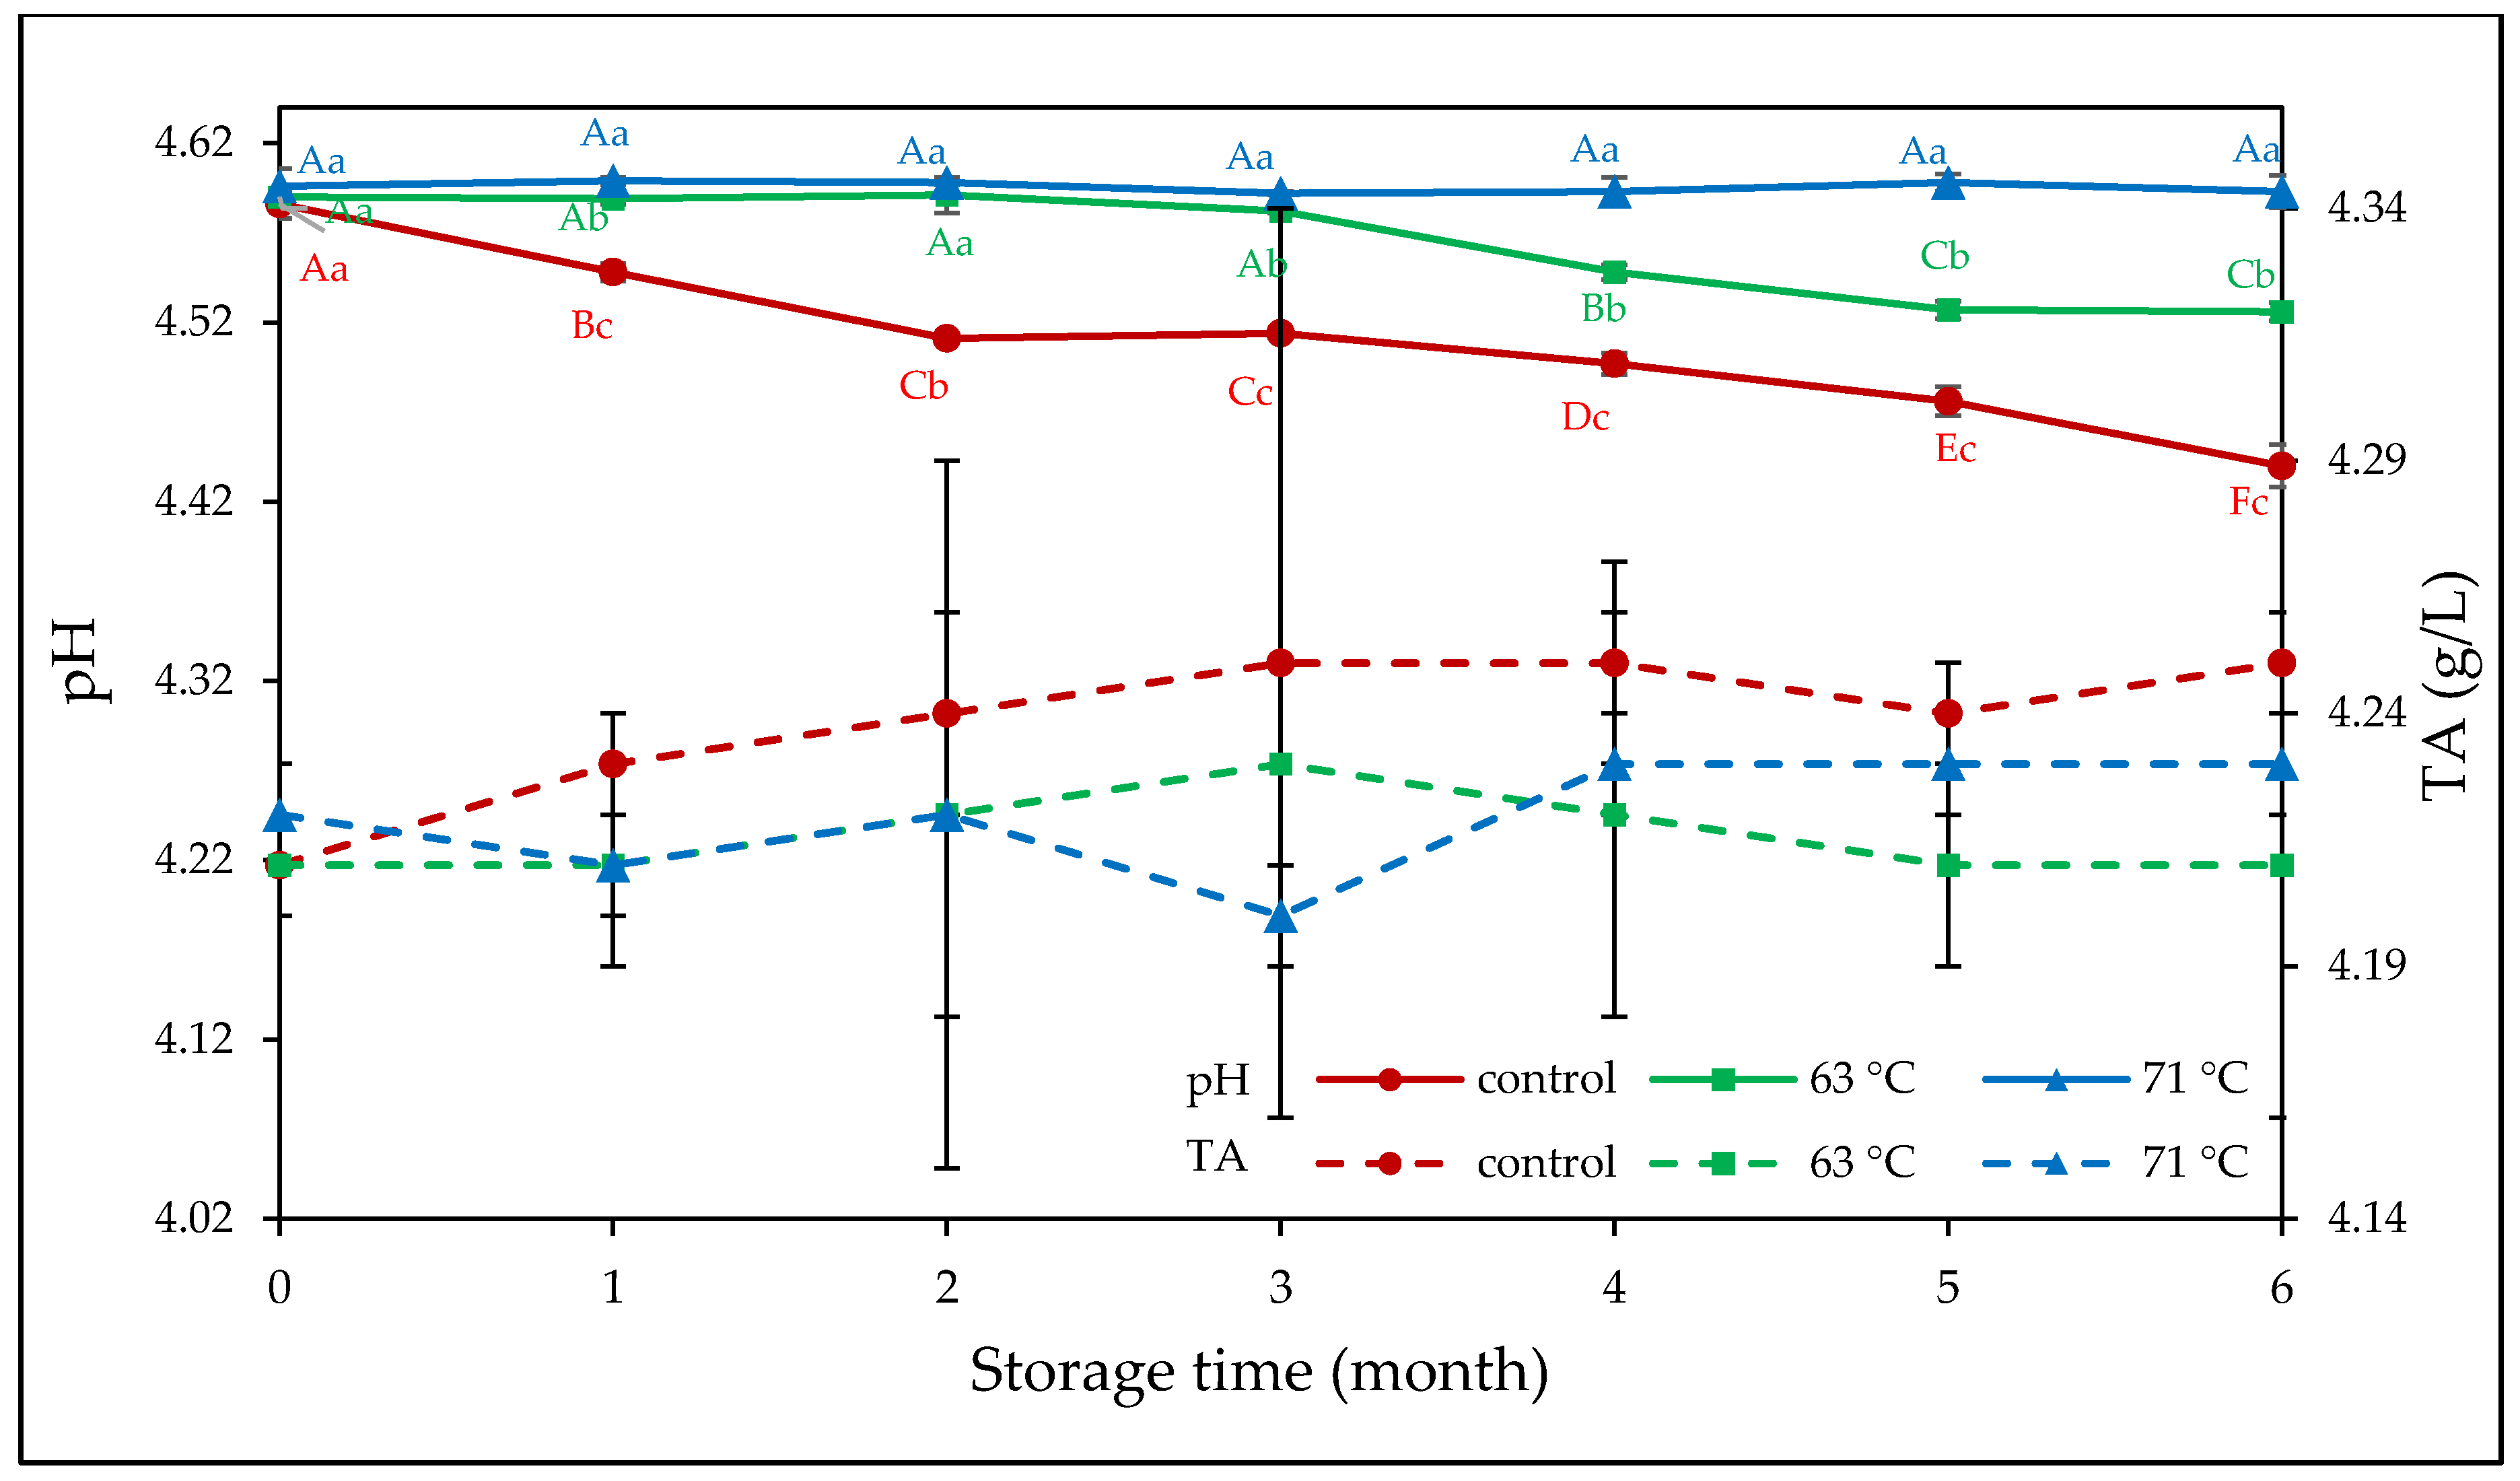
3.1. Physicochemical Properties of Rose Apple Cider

Initial TSS and ethanol content of the rose apple ciders (Figure 2) ranged within 4.1–4.3 °Brix and 5.9–6.2%, respectively. Compared to apple ciders, TSS of rose apple cider in this study was lesser due to absence of sucrose addition before fermentation [38]. The trends of TSS and ethanol contents in the samples during storage demonstrated that the control group had a noticeable decrease in TSS simultaneously with an increase in alcohol content. This phenomenon occurred as a result of the conversion of sugar to alcohol by yeast. Wanapu et al. [39] suggested that yeast utilizes dissolved solids as food for growth and alcohol production. In contrast, the pasteurized samples performed differently with more stable trends of TSS and ethanol content. On comparing the two pasteurization conditions, the lower pasteurizing temperature (63 °C) yielded a larger change with significant differences in TSS and alcohol content after 4 months, while the higher pasteurization at 71 °C resulted in only a slight change in TSS on the 6th month of storage. This is because sufficiently strong pasteurization conditions effectively inhibited the growth of yeast cells, preventing subsequent changes.
During cider fermentation, acids are generated resulting in a sour taste and aroma, which mainly determine the quality of the cider [40]. Unpasteurized rose apple cider presented a continuously decreasing trend of pH during storage, as shown in Figure 3 (p < 0.05). This could be caused by several factors. First, cellulose in juice that dissolved in ethanol solution becomes another substrate for yeast [41]. Consequently, acids are produces as a by-product that decreases pH [42]. Another possibility that may reduce pH is protons generated from nitrogen consumption by the yeast. The finding presented by Akin et al. [42], Won et al. [43], and Sigler et al. [44] supported this hypothesis. Moreover, Castrillo et al. [45] suggested that one H+ mole in solution releases as a result of the assimilation of one ammonium mole by yeasts. Last but not least, the alcohol content and pH of cider were in a range in which the spoilage bacteria can grow and lowering of pH could come from acid generated by the bacteria [42]. Pasteurization of cider at 63 °C yielded a slight reduction in pH, while samples pasteurized at the higher temperature showed no significant change. Total acidity (TA) of all sample groups was stable during the storage period (p ≥ 0.05), since it relates to buffering capacity that maintains pH [10].
Other physical properties of the cider, e.g., electrical conductivity, total nitrogen, and density were monitored during the 6 months (Table 1). Electrical conductivity is a function of food characteristics e.g., pH, TSS, salt content, and composition [46]. In this study, an increment in conductivity of the control group may be due to the decreasing pH. In pasteurized samples, the group treated at higher temperature had higher conductivity. This may occur as a result of higher °Brix and the hypothesis in agreement with the literature in fruit juice [46]. During the first month of storage, the heat-treated sample had a sharp increase in conductivity, which then continued at a slower rate (p < 0.05). The degradation of microorganisms following heat treatment influences the electrical conductivity due to protons released from dead cells [47]. Moreover, after the fermentation process, yeast cells undergo autolysis, resulting in the release of internal cellular content [48]. Total nitrogen of the cider pasteurized at 71 °C is significantly less than the others as an effect of high heat treatment that resulted in a decrease in protein content [49]. During storage, all sample groups followed the same decreasing trend as nitrogen was transformed to other substances such as ester, fatty acids, and volatile compounds by microorganisms [50,51]. The density of rose apple cider was in the range 0.996–1000 g/cm3 (Table 1). Density of cider sample correlated with the amount of sugar (and with the amount alcohol generated). The density of control group was 1000 g/cm3 which is similar to that of cider reported by Venkatachalam, Techakanon, and Thitithanakul [10]. The control group presented the largest decrease in density since the high-density sugar content decreased while low density alcohol content increased. The cider pasteurized at 63 °C followed the same trend as the control group but with smaller changes, while the group pasteurized at 71 °C had a more stable trend.

3.2. Microbial Evaluation

Microbial status (total aerobic count, yeast-mold, and E. coli) of the cider samples was evaluated monthly during 6 months of storage, as shown in Table 2. The initial aerobic count and yeast-mold were only detectable for the control group with a microbial load of 1.03 and 2 log10 CFU/g, respectively. These numbers increased continuously until the sample showed signs of deterioration after 2 months of storage. Despite the microbial counts of the pasteurized cider samples constantly increasing during storage, the treatment at 63 °C prolonged product shelf life until 3 months, and the samples processed at 71 °C had no significant change in quality until the end of the tested storage period (6 months). This is a consequence of microbial cell membrane disruption induced by heat [52]. The study by Tandon et al. [19] reported the shelf life of apple cider pasteurized at 63 °C as 14 weeks in refrigeration. Yeast and mold were detected in untreated samples at the beginning of storage at 2 log10 CFU/mL, then the number continuously increased during the studied period. This result matches the increasing ethanol content and decreasing TSS reported earlier in the physicochemical properties. Following pasteurization, the exponentially growing saccharomyces cells are inhibited by heat [52]. Thus, the number of yeast-mold count decreased with an increasing temperature. The previous outbreaks from consuming apple cider have been associated with E. coli O157:H7, the microbe causing diarrhea and HUS. In the present study, the E. coli counts ensured the safety of rose apple cider consumption until the end of the test period.

3.3. Vitamin C Contents of Cider Samples

The vitamin C contents in the cider samples were significantly affected by the pasteurization conditions and storage duration (Table 3). The results show significantly lower vitamin C content in the two treated groups compared to the control. Many studies have reported the destructive influence of thermal processing on vitamin C content [53,54,55,56]. Storage time is another vital factor enabling the degradation of vitamin C, and the vitamin C contents with all treatments decreased during storage (p < 0.05). Yeom et al. [57] and Odriozola-Serrano et al. [58] suggested that the degradation of vitamin C during long-term storage is due to atmospheric oxygen in the packaging. In addition, vitamin C loss can be caused by the oxidative mechanisms with exposure to light, heat, peroxides, and enzymes, such as ascorbate oxidase and peroxidase [59]. In this study, the bottling was carried out at 70 °C, at which time the air (oxygen) in the container was flushed out. However, loss of vitamin C was still observed during storage.

3.4. Phenolic Content and Antioxidant Activity

In general, cider products contain various antioxidant types, mostly phenolic compounds such as flavonoids, tannin, vitamin C, vitamin E, and β-carotene [60]. Our previous study reported phenolic compounds identified in the rose apple cv. Taaptimjan, such as gallic acid, chlorogenic acid, caffeic acid, p-coumaric acid, hydroxycinnamic acid, ferulic acid, vanilic acid, cyaniding−3-o-glucocide, and cyaniding−3-o-rutinocide [10]. The results in Table 3 display the same decreasing trend of all monitored parameters with pasteurization temperature and with storage time. Total phenols of unpasteurized samples were initially 87.15 mg/L. Following pasteurization at 63 °C or at 71 °C, the total phenols were reduced by 10% and by 25%, respectively. As an effect of storage time, the decrease of total phenols in control, and samples pasteurized at 63 and 71 °C were 31%, 24%, and 16%, respectively. This is in agreement with the study by Rabie et al. [61] on physalis juice heated to 90 °C for 2 min. Several methods based on different reaction mechanisms are available for evaluating antioxidant capacities of foods and beverages [62], and in the present study DPPH scavenging ability, ABTS scavenging ability, reducing power, and hydroxyl radical scavenging were determined. The findings from the present study suggest that hydroxyl radical scavenging activity of cider samples decreased more dramatically during storage than the others. Reducing power of all treatments slightly changed during 6 months of storage (5–7%), indicating a steady ability to reduce free radicals. Thermal processing at 63 °C and 71 °C reduced DPPH scavenging activity by 7% and 23%, respectively. Control cider had a higher 60–69% ABTS scavenging activity than thermally pasteurized cider at 57–66%, throughout the studied period. The initial hydroxyl radical scavenging activity of the control and pasteurized group were within 65–67% (p ≥ 0.05) and decreased to 33% at the end of storage. Since hydroxyl radicals are the most reactive species of oxygen capable of attacking most biological substrates such as DNA, proteins, and carbohydrates, consumption of cider could protect biological molecules against free radical attacks [63]. The effect of pasteurization in reducing antioxidant activities in this study are in accordance with the loss of vitamin C. The research by Odriozola-Serrano et al. [58] revealed that heating substantially affects the loss of ascorbic acid through the aerobic pathway. Moreover, the antioxidant activity result is also aligned with the quantity of phenolic compounds. Data obtained in this study suggest that low temperature pasteurization can better preserve antioxidant content than a higher temperature treatment.

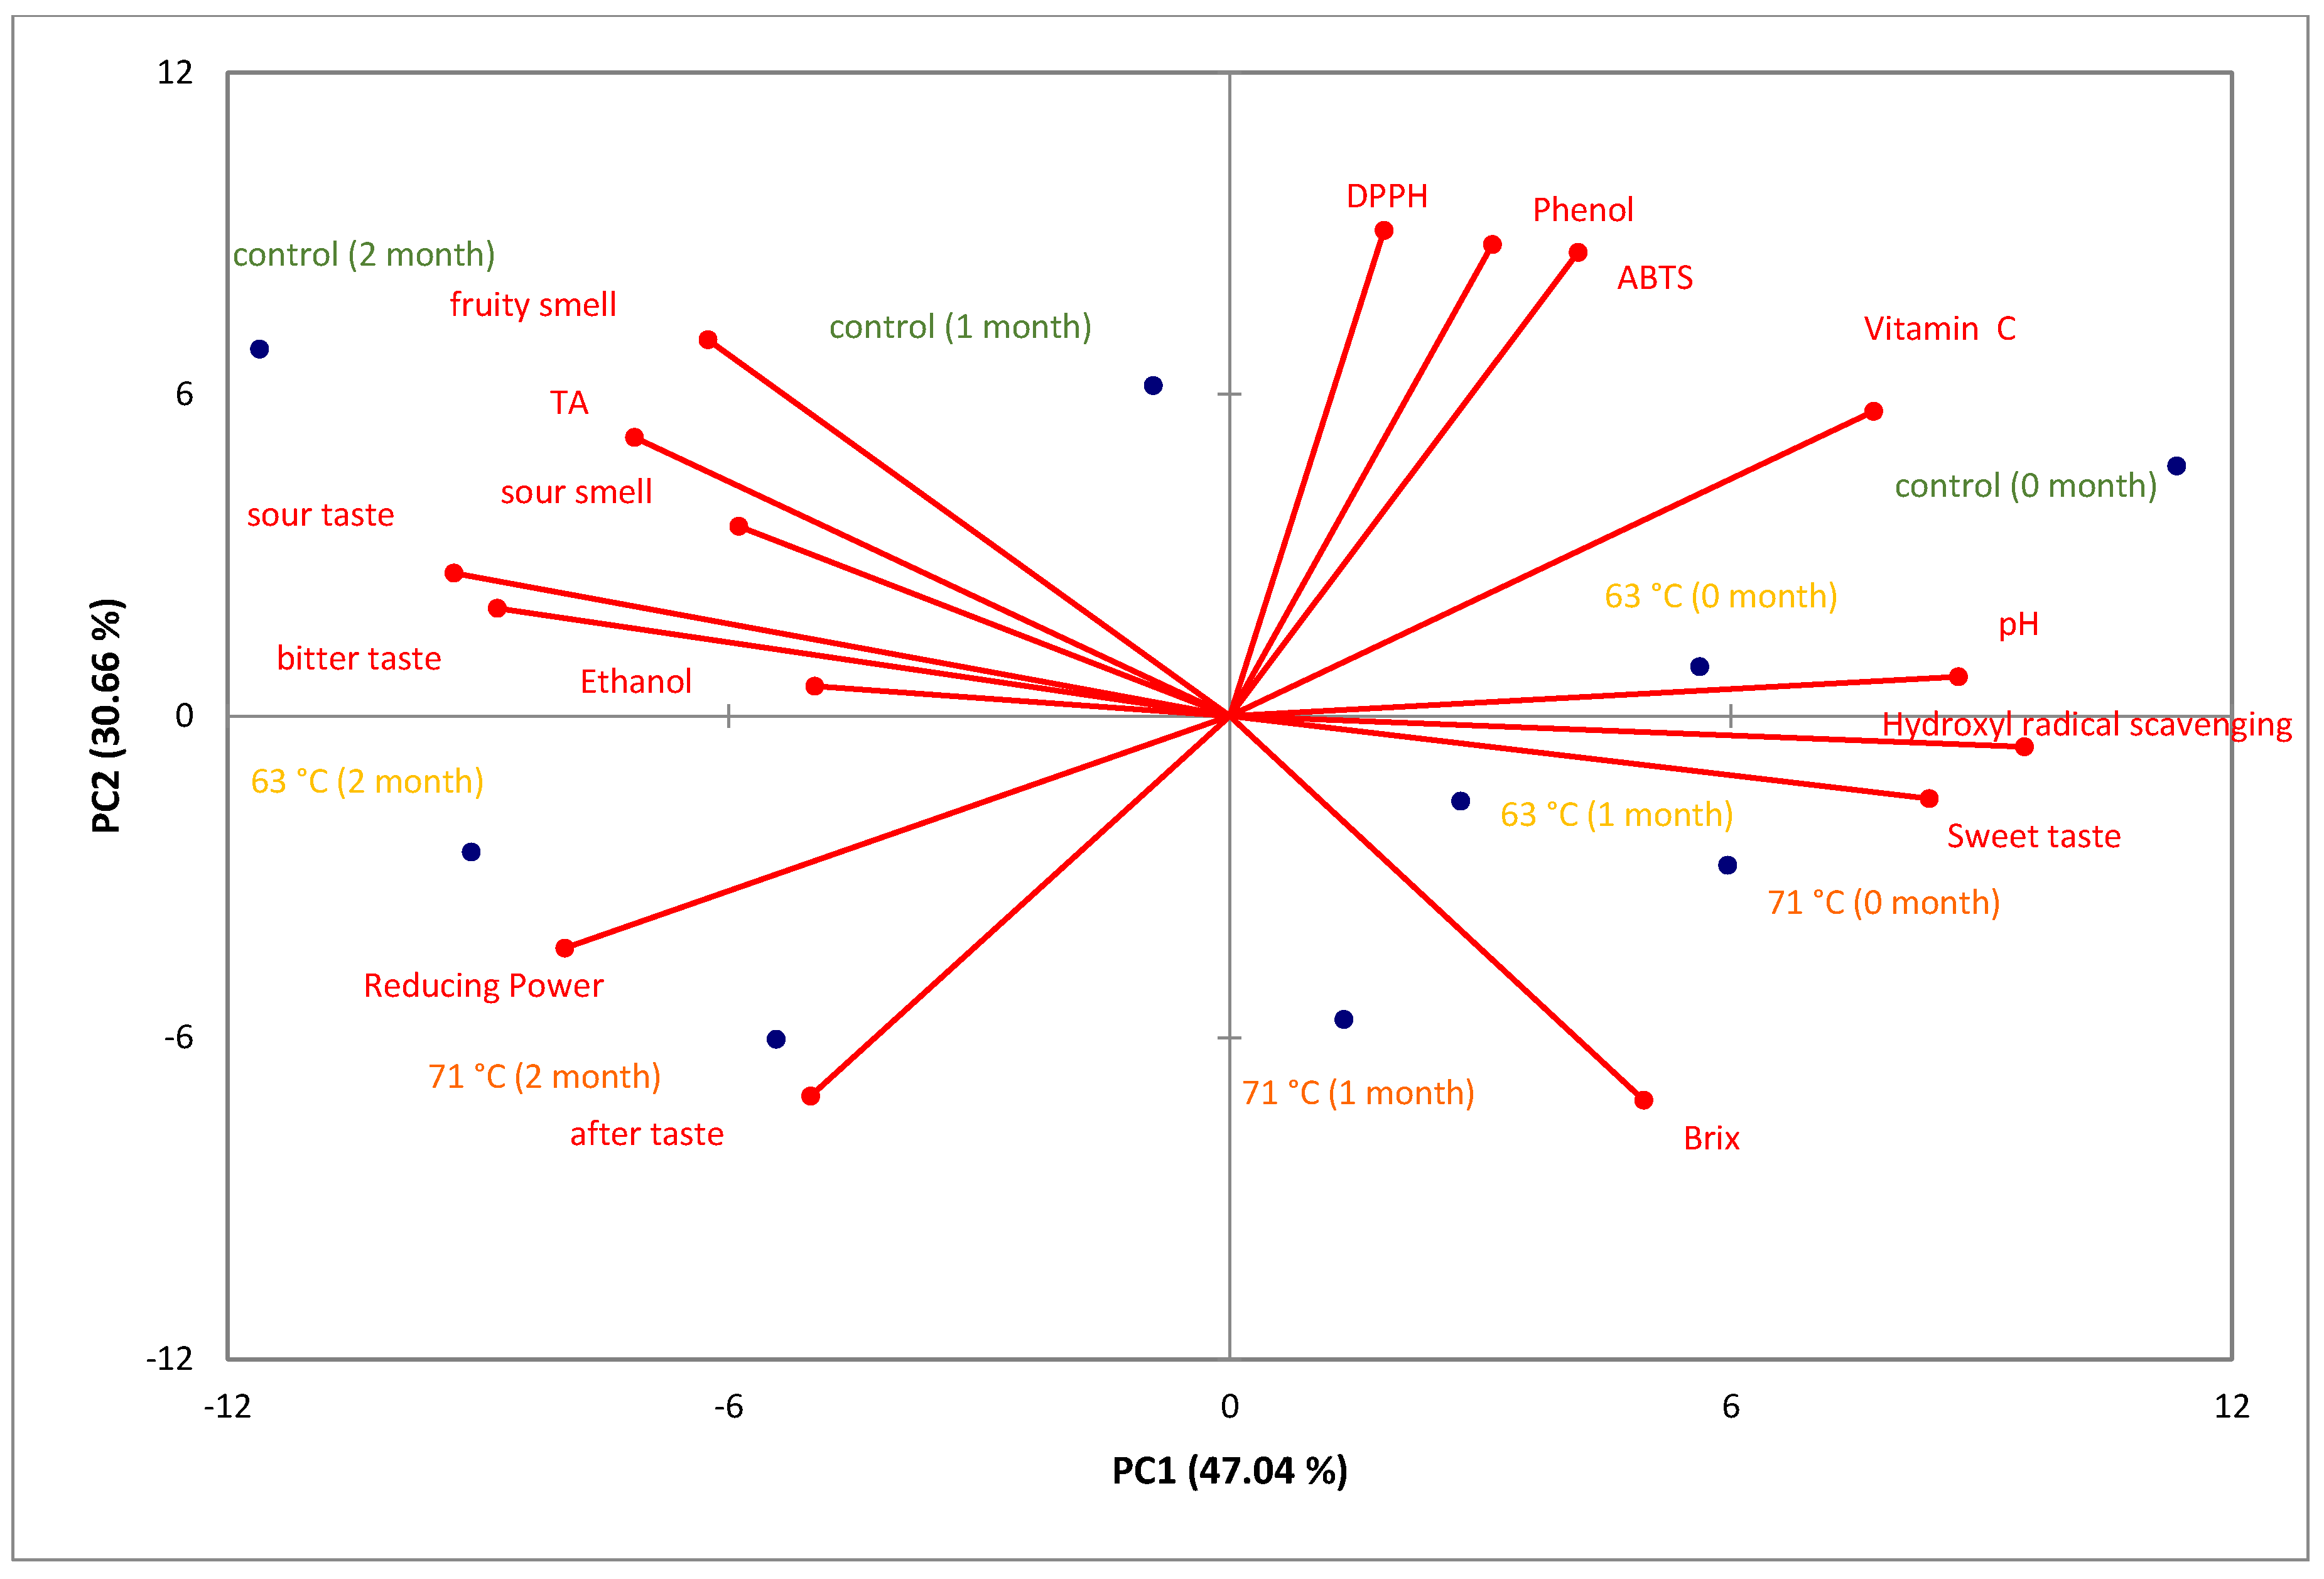
3.5. Principal Component Analysis (PCA)

3.5.1. PCA of Physicochemical Properties and Antioxidant Activity of Cider Samples during Storage

Principal component analysis (PCA) was applied in this study in order to evaluate all variables together. The first two PCs represented in the 2-D scatter plot (Figure 4) were able to explain 81.05% of the total variance, with PC1 accounting for 53.33% and PC2 for 27.72%. Storage time of cider samples was strongly weighed in PC1, indicated that long storage times (4–6 months) strongly reduced antioxidant activity (reducing power, hydroxyl radical scavenging activity, ABTS scavenging activity, and DPPH), pH, vitamin C content, and total phenols. Whereas, PC2 is more related to the effects of pasteurization on cider quality. The results indicate that the control group tended to have higher ethanol content and TA compared to the pasteurized ciders. On the contrary, the cider samples treated with 71 °C would have higher total soluble solid (°Brix) than cider samples treated with 63 °C and cider samples without heat treatment.

3.5.2. PCA of Physicochemical Properties, Antioxidant Activity, and Sensory Profiles of Cider Samples

When sensory profiles, physicochemical properties, and antioxidant activities were subjected to PCA, it was found that most parameters aligned with the first principal component (PC1) (Figure 5). The plot between PC1 and PC2 can explain 77.70% of the total variance. PC1 demonstrates some variables including pH, hydroxyl radical scavenging, vitamin C content, and sweet taste in the positive axis. In contrast, reducing power, ethanol content, bitter taste, sour taste, sour smell, and TA locate in negative area of PC. Variables with positive weights in PC2 are DPPH, ABTS, total phenols, and fruity smell, while °Brix and aftertaste are arranged in the negative area. On the negative side of PC1, a large group of strongly weighted parameters are presented. Fruity smell, total acidity, sour smell, sour taste, bitter taste, ethanol, and reducing power are clustered whereas vitamin C, pH, hydroxyl radical scavenging, and sweet taste are grouped to the opposing positive PC1. Based on the result of relationship among parameters and samples, it was possible to notice the effect of storage time on physicochemical properties, antioxidant activity, and sensory profile on PC1. The majority of samples (both control and pasteurized) that had 0-month storage time had higher values of vitamin C, pH, hydroxyl radical scavenging activity than the cider samples that were kept for 1 and 2 months. Moreover, the longer storage period was associated with higher TA, bitter taste, sour taste, fruity smell, and ethanol. The effects of thermal treatment were well separated on PC2, where the control group is located in the positive area and the pasteurized groups (63 and 71 °C) are in the negative area. DPPH, phenol, and ABTS activity were all strongly weighted on the positive side of PC2. These parameters had a negative contrast effect with aftertaste. All the control samples tended to have higher DPPH, phenol, and ABTS than the treated samples; and DPPH, phenol, and ABTS were decreased by pasteurizing the cider samples both at 63 and 71 °C. The higher pasteurizing temperature was related to higher °Brix in cider samples. In conclusion, storage time and pasteurization expressed on PC1 and PC2, respectively, were important variables affecting quality of cider. According to the larger variance from PC1, the storage time was the dominant factor for cider quality in this study.

3.6. Sensory Profile of Rose Apple Cider during Storage

Sensory profile of the cider samples was evaluated by 15 trained panelists every month for 6 months. The characteristics of control samples at the beginning of storage were intense sweet, strong sour smell, moderately sour, bitter, fruity smell, and aftertaste (Table 4). According to our previous study, the major volatile compounds found in rose apple cider were 1-butanol, 3-methyl-hexan−1-ol and 1-butanol, 3-methyl-, acetate [10]. The profile of unpasteurized cider changed to detectably less sweet, while other parameters tended to become more intense (p < 0.05). Pasteurization can extend cider shelf life, although the process caused some loss of flavor and an aftertaste. Thermal processing triggers kinetic reactions that accelerated the loss of flavor compounds and evaporation of volatile compounds [64]. The cider treated at 63 °C followed the same pattern of sensory profile change as the control group, becoming less sweet and sourer in taste, with further development until the end of storage life (3 months). These changes perceived by the panelists were in accordance with the physicochemical results discussed earlier (Figure 2). Pasteurization at 71 °C effectively inhibited further fermentation, thus preserved sweet and mild sour taste of cider during the studied 6-month period. However, the cider samples had high levels of bitter taste and aftertaste detected by the panelists and had dramatically lost fruity smell after storage for 4 months. Rose apples contain oxidative enzymes, PPO and POD, which are involved in oxidizing flavor compounds. Following a thermal treatment, the enzymes can have their activity regenerated to contribute to both the flavor loss and the unpleasant flavor development [65,66]. As storage time had a high impact on quality of the cider (visualized above with PCA), to determine a practical storage life, consumer acceptance tests should be carefully included in the criteria.

4. Conclusions

The current study introduced the utilization of rose apple to prepare an alcoholic beverage, and its properties as well as the effects of alternative pasteurization conditions were assessed. Pasteurizing at 63 °C can preserve vitamin C content and antioxidant capacity with 3-month storage life; however, this alternative did not completely inactivate the microorganisms that cause further fermentation. The microbial safety of rose apple cider was ensured by pasteurizing at 71 °C for 6 s. The shelf life of product was then extended from 2 months (control) to 6 months in refrigerated storage. However, the treatment affected physicochemical properties, degraded vitamin C, and reduced total phenols and antioxidant activities of the cider. These changes indicate the effects of thermal processing and of oxidation during storage. The sensory profiles of the cider evaluated by trained panelists revealed that pasteurization at the lower temperature alternative caused flavor loss although the other sensory parameters were comparable to the control group. Moreover, the samples processed at 71 °C presented a more desirable profile with higher level of sweetness and less sour taste. The PCA results implicate storage time as the dominant factor determining cider physicochemical properties, antioxidant activity, and sensory profiles. Therefore, pasteurizing rose apple cider should be carefully balanced between properties (economic value) and shelf life.

Author Contributions

Conceptualization, C.T.; methodology, C.S.; formal analysis, C.S.; investigation, C.T.; data curation, C.T.; validation, C.T.; writing—original draft preparation, C.T. and C.S.; writing—review and editing, C.T. All authors have read and agreed to the published version of the manuscript.

Funding

This research was funded by Prince of Songkla University, Hatyai Campus (project grant no. SIT590720S) and Prince of Songkla University, Surat Thani Campus in 2018.

Acknowledgments

The authors would like to thank Seppo Karrila for his kind support. Furthermore, the Food Innovation and Product Development (FIPD) Laboratory is strongly acknowledged here for the provided lab space and equipment support.

Conflicts of Interest

The authors declare no conflict of interest.

References

  1. Shü, Z.H.; Tirtawinata, R.; Meon, Z.; Thanarut, C. Wax apple production in selected tropical Asian countries. Acta Hortic. 2008, 773, 161–164. [Google Scholar]
  2. Supapvanich, S.; Mitrsang, P.; Srinorkham, P.; Boonyaritthongchai, P.; Wongs-Aree, C. Effects of fresh Aloe vera gel coating on browning alleviation of fresh cut wax apple (Syzygium samarangenese) fruit cv. Taaptimjaan. J. Food Sci. Technol. 2016, 53, 2844–2850. [Google Scholar] [CrossRef] [PubMed] [Green Version]
  3. Department of Agriculture Extension-Report Product Statistic. Available online: https://production.doae.go.th/service/report-product-statistic/index (accessed on 13 December 2019).
  4. Huang, C.C.; Wang, D.N.; Liou, D.T. Reduction of prevention of chilling injury by pruning and covering treatments on wax apple. Crop Environ. Bioinform. 2005, 2, 73–80. [Google Scholar]
  5. Shü, Z.H.; Shiesh, C.C.; Lin, H.L. Wax apple (Syzygium samarangense (Blume) Merr. and L.M. Perry) and related species. In Postharvest Biology and Technology of Tropical and Subtropical Fruits, 1st ed.; Yahia, E.M., Ed.; Woodhead Publishing: Cambridge, UK, 2011; Volume 4, pp. 458–473. [Google Scholar]
  6. Tilman, D.; Clark, M. Global diets link environmental sustainability and human health. Nature 2014, 515, 518–522. [Google Scholar] [CrossRef]
  7. Asioli, D.; Aschemann-Witzel, J.; Caputo, V.; Vecchio, R.; Annunziata, A.; Næs, T.; Varela, P. Making sense of the “clean label” trends: A review of consumer food choice behavior and discussion of industry implications. Food Res. Int. 2017, 99, 58–71. [Google Scholar] [CrossRef]
  8. Jarvis, B. Cider: Cyder and Hard Cider. In Encyclopedia of Food Microbiology, 2nd ed.; Batt, C.A., Tortorello, M.L., Eds.; Academic Press: Oxford, UK, 2014; Volume 1, pp. 437–443. [Google Scholar]
  9. Johnston, C.S. Medicinal Uses of Vinegar. In Complementary and Alternative Therapies and the Aging Population, 1st ed.; Watson, R.R., Ed.; Academic Press: San Diego, CA, USA, 2009; pp. 433–440. [Google Scholar]
  10. Venkatachalam, K.; Techakanon, C.; Thitithanakul, S. Impact of the ripening stage of wax apples on chemical profiles of juice and cider. ACS Omega 2018, 3, 6710–6718. [Google Scholar] [CrossRef] [Green Version]
  11. Lea, A.G.H. Bitterness and astringency: The procyanidins of fermented apple ciders. In Bitterness in Foods and Beverages; Russell, L.R., Ed.; Elsevier Science Publishers: New York, NY, USA, 1990; pp. 123–143. [Google Scholar]
  12. Besser, R.E.; Lett, S.M.; Weber, J.T.; Doyle, M.P.; Barrett, T.J.; Wells, J.G.; Griffin, P.M. An outbreak of diarrhea and hemolytic uremic Syndrome from Escherichia coli O157:H7 in fresh-pressed apple cider. JAMA 1993, 269, 2217–2220. [Google Scholar] [CrossRef]
  13. Miller, L.G.; Kaspar, C.W. Escherichia coli O157: H7 acid tolerance and survival in apple cider. J. Food Prot. 1994, 57, 460–464. [Google Scholar] [CrossRef]
  14. Senkel, I.A., Jr.; Henderson, R.A.; Jolbitado, B.; Meng, J. Use of hazard analysis critical control point and alternative treatments in the production of apple cider. J. Food Prot. 1999, 62, 778–785. [Google Scholar] [CrossRef]
  15. Riley, L.W.; Remis, R.S.; Helgerson, S.D.; McGee, H.B.; Wells, J.G.; Davis, B.R.; Herbert, R.J.; Olcott, E.S.; Johnson, L.M.; Hargrett, N.T.; et al. Hemorrhagic colitis associated with a rare Escherichia coli serotype. N. Engl. J. Med. 1983, 398, 681–685. [Google Scholar] [CrossRef]
  16. US.FDA. Hazard analysis and critical control point (HACCP), Procedures for the safe and sanitary processing and importing of juice. Fed. Regist. 2001, 66, 6137–6202. [Google Scholar]
  17. Linton, M.; Mcclements, M.J.; Patterson, M.F. Inactivation of Escherichia coli O157:H7 in orange juice using a combination of high pressure and mild heat. J. Food Prot. 1999, 62, 277–279. [Google Scholar] [CrossRef]
  18. Koutchma, T.; Popović, V.; Ros-Polski, V.; Popielarz, A. Effects of ultraviolet light and high-pressure processing on quality and health-related constituents of fresh juice products. Compr. Rev. Food Sci. Food 2016, 15, 844–867. [Google Scholar] [CrossRef] [Green Version]
  19. Tandon, K.; Worobo, R.W.; Churey, J.J.; Padilla-Zakour, O.I. Storage quality of pasteurized and UV treated apple cider. J. Food Process. Preserv. 2003, 27, 21–35. [Google Scholar] [CrossRef]
  20. Donahue, D.W.; Canitez, N.; Bushway, A.A. UV inactivation of E. coli O157:H7 in apple cider: Quality, sensory and shelf life analysis. J. Food Process. Preserv. 2004, 28, 368–387. [Google Scholar] [CrossRef]
  21. Baumann, A.R.; Martin, S.E.; Feng, H. Ultrasound treatment of Listeria monocytogenes in apple cider. J. Food Prot. 2005, 68, 2333–2340. [Google Scholar] [CrossRef]
  22. Ugarte-Romero, E.; Feng, H.; Martin, S.E.; Cadwallader, K.; Robinson, S.J. Inactivation of Escherichia coli with power ultrasound in apple cider. J. Food Sci. 2016, 71, 102–108. [Google Scholar] [CrossRef]
  23. D’amico, D.J.; Silk, T.M.; Wu, J.; Guo, M. Inactivation of microorganisms in milk and apple cider treated with Ultrasound. J. Food Prot. 2006, 69, 556–563. [Google Scholar] [CrossRef]
  24. Iu, J.; Mittal, G.S.; Griffiths, M.W. Reduction in levels of Escherichia coli O157:H7 in apple cider by pulsed electric fields. J. Food Prot. 2001, 64, 964–969. [Google Scholar] [CrossRef]
  25. Turk, M.F.; Vorobiev, E.; Baron, E. Improving apple juice expression and quality by pulsed electric field on an industrial scale. LWT Food Sci. Technol. 2012, 49, 245–250. [Google Scholar] [CrossRef]
  26. Rawson, A.; Patras, A.; Tiwari, B.K.; Noci, F.; Koutchma, T.; Brunton, N. Effect of thermal and non thermal processing technologies on the bioactive content of exotic fruits and their products: Review of recent advances. Food Res. Int. 2011, 44, 1875–1887. [Google Scholar] [CrossRef]
  27. Caminiti, I.M.; Noci, F.; Muñoz, A.; Whyte, P.; Morgan, D.J.; Cronin, D.A.; Lyng, J.G. Impact of selected combinations of non-thermal processing technologies on the quality of an apple and cranberry juice blend. Food Chem. 2011, 124, 1387–1392. [Google Scholar] [CrossRef]
  28. Splittstoesser, D.F.; Mclellan, M.R. Destruction of Escherichia coli 0157:H7 in cider Topic. In Proceedings of the Kansas Apple Cider Seminar, Topeka, KS, USA, 10 January 1997. [Google Scholar]
  29. Splittstoesser, D.F.; Mclellan, M.R.; Churey, J.J. Heat resistance of Escherichia coli 0157:H7 in apple juice. J. Food Prot. 1995, 59, 226–229. [Google Scholar] [CrossRef] [PubMed]
  30. AFDO. Apple Cider Processing Operations Requirements and Guidelines; Association of Food and Drug Officials: York, UK, 2003. [Google Scholar]
  31. Alberti, A.; Machadodos Santos, T.P.; Ferreira Zielinski, A.A.; Eleutério dos Santos, C.M.; Braga, C.M.; Demiate, I.M.; Nogueira, A. Impact on chemical profile in apple juice and cider made from unripe, ripe and senescent dessert varieties. LWT-Food Sci. Technol. 2016, 65, 436–443. [Google Scholar] [CrossRef]
  32. Babashahi-Kouhanestani, M.; Salehi, M.; Mazloomi, S.M.; Almasi-Hashyani, A. Quantitative evaluation of vitamin C in industrial lemon juice by titration method. J. Biol. Today’s World 2014, 3, 139–141. [Google Scholar] [CrossRef]
  33. Waterhouse, A.L. Determination of total phenolics. Curr. Protoc. Food Anal. Chem. 2002, 6, I1.1.1–I1.1.8. [Google Scholar]
  34. Delgado, T.; Malheiro, R.; Pereira, J.A.; Ramalhosa, E. Hazelnut (Corylus avellana L.) kernels as a source of antioxidants and their potential in relation to other nuts. Ind. Crop. Prod. 2010, 32, 621–626. [Google Scholar] [CrossRef] [Green Version]
  35. Re, R.; Pellegrini, N.; Proteggente, A.; Pannala, A.; Yang, M.; Rice-Evans, C. Antioxidant activity applying an improved ABTS radical cation decolorization assay. Free Radic. Biol. Med. 1999, 26, 1231–1237. [Google Scholar] [CrossRef]
  36. Halliwell, B.; Gutteridge, J.M.C.; Aruoma, O.I. The deoxyribose method: A simple “test-tube” assay for determination of rate constants for reactions of hydroxyl radicals. Anal. Biochem. 1987, 165, 215–219. [Google Scholar] [CrossRef]
  37. Benzie, I.F.F.; Strain, J.J. The ferric reducing ability of plasma (FRAP) as a measure of “antioxidant power”: The FRAP assay. Anal. Biochem. 1996, 239, 70–76. [Google Scholar] [CrossRef] [Green Version]
  38. Ye, M.; Yue, T.; Yuan, Y. Evolution of polyphenols and organic acids during the fermentation of apple cider. J. Sci. Food Agric. 2014, 94, 2951–2957. [Google Scholar] [CrossRef] [PubMed]
  39. Wanapu, C.; Boonkerd, N.; Dithavibool, L. Winemaker 1; Sombun Printing House: Bangkok, Thailand, 2004. [Google Scholar]
  40. Chanthai, S.; Danvirutai, P. Chemical analysis of locally produced wines. Part I. Acidity and organic compounds. J. Acad. Serv. Cent. Khon Kaen Univ. 2004, 12, 23–29. [Google Scholar]
  41. Dennis, C. Breakdown of cellulose by yeast species. Microbiology 1972, 71, 409–411. [Google Scholar] [CrossRef] [Green Version]
  42. Akin, H.; Brandam, C.; Meyer, X.M.; Strehaiano, P.A. model for pH determination during alcoholic fermentation of a grape must by Saccharomyces cerevisiae. Chem. Eng. Process Process Intensif. 2008, 47, 1986–1993. [Google Scholar] [CrossRef] [Green Version]
  43. Won, J.I.; Yang, Y.L.; Kim, B.G.; Choi, C.Y. Adaptive control of specific growth rate based on proton production in anaerobic fed-batch culture. Biotechnol. Lett. 1993, 15, 511–516. [Google Scholar] [CrossRef]
  44. Sigler, K.; Knotková, A.; Kotyk, A. Factors governing substrate-induced generation and extrusion of protons in the yeast Saccharomyces cerevisiae. Biochim. Biophys. Acta (BBA)-Biomembr. 1981, 643, 572–582. [Google Scholar] [CrossRef]
  45. Castrillo, J.I.; De Miguel, I.; Ugalde, U.O. Proton production and consumption pathways in yeast metabolism. A chemostat culture analysis. Yeast 1995, 11, 1353–1365. [Google Scholar] [CrossRef]
  46. Lamsal, B.P.; Jindal, V.K. Variation in electrical conductivity of selected fruit juices during continuous Ohmic heating. KMUTNB Int. J. Appl. Sci. Technol. 2014, 7, 47. [Google Scholar] [CrossRef] [Green Version]
  47. Carstensen, E.L.; Cox, H.A.; Mercer, W.B.; Natale, L.A. Passive electrical properties of microorganisms. Biophys. J. 1965, 5, 289–300. [Google Scholar] [CrossRef] [Green Version]
  48. Sosa-Hernández, O.; Popat, S.C.; Parameswaran, P.; Alemán-Nava, G.S.; Torres, C.I.; Buitrón, G.; Parra-Saldívar, R. Application of microbial electrolysis cells to treat spent yeast from an alcoholic fermentation. Bioresour. Technol. 2016, 200, 342–349. [Google Scholar] [CrossRef] [Green Version]
  49. Bayly, F.C.; Berg, H.W. Grape and wine proteins of white wine varietals. Am. J. Enol. Vitic. 1967, 18, 18–32. [Google Scholar]
  50. Walker, G.M.; Stewart, G.G. Saccharomyces cerevisiae in the production of fermented beverages. Beverages 2016, 2, 30. [Google Scholar] [CrossRef]
  51. Fermentativa, I.D.A.N.A.; Vinho, D. The impact of nitrogen on yeast fermentation and wine quality. Ciência Técnica Vitiv 2011, 26, 17–32. [Google Scholar]
  52. Walton, E.F.; Pringle, J.R. Effect of growth temperature upon heat sensitivity in Saccharomyces cerevisiae. Arch. Microbiol. 1980, 124, 285–287. [Google Scholar] [CrossRef] [PubMed] [Green Version]
  53. Laslo, V.; Socaci, S.; Teusdea, A.; Timar, A.; Tofana, M.; Ioana-Vicas, S. The effect of pasteurization time on phytochemical composition and antioxidant capacity of two apple cultivars juices. Bull. UASVM Food Sci. Technol. 2018, 75, 67–77. [Google Scholar] [CrossRef]
  54. Sadecka, J.; Polovka, M.; Kolek, E.; Belajova, E.; Tobolkova, B.; Daško, L.; Durec, J. Orange juice with pulp: Impact of pasteurization and storage on flavour, polyphenols, ascorbic acid and antioxidant activity. J. Food Nutr. Res. 2014, 53, 371–388. [Google Scholar]
  55. Narwojsz, A.; Borowska, E.J. Cranberry and strawberry juices-influence of method production on antioxidants content and antioxidative capacity. Pol. J. Nat. Sci. 2010, 25, 209–214. [Google Scholar] [CrossRef] [Green Version]
  56. Pérez-Conesa, D.; García-Alonso, J.; García-Valverde, V.; Iniesta, M.D.; Jacob, K.; Sánchez-Siles, L.M.; Periago, M.J. Changes in bioactive compounds and antioxidant activity during homogenization and thermal processing of tomato puree. Innov. Food Sci. Emerg. Technol. 2009, 10, 179–188. [Google Scholar] [CrossRef]
  57. Yeom, H.W.; Streaker, C.B.; Zhang, Q.H.; Min, D.B. Effects of pulsed electric fields on the quality of orange juice and comparison with heat pasteurization. J. Agric. Food Chem. 2000, 48, 4597–4605. [Google Scholar] [CrossRef]
  58. Odriozola-Serrano, I.; Soliva-Fortuny, R.; Hernández-Jover, T.; Martín Belloso, O. Carotenoid and phenolic profile of tomato juices processed by high intensity pulsed electric fields compared with conventional thermal treatments. Food Chem. 2009, 112, 258–266. [Google Scholar] [CrossRef]
  59. Davey, M.W.; Montagu, M.V.; Inze, D.; Sanmartin, M.; Kanellis, A.; Smirnoff, N.; Benzie, J.J., I; Strain, J.J.; Favell, D.; Fletcher, J. Plant L-ascorbic acid: Chemistry, function, metabolism, bioavailability and effects of processing. J. Sci. Food Agric. 2000, 80, 825–860. [Google Scholar] [CrossRef]
  60. Jirumarn, J.; Srihanam, P. Oxidants and Antioxidants: Sources and Mechanism. Acadamic J. Karasin Rajabhat Univ. 2011, 1, 59–70. [Google Scholar]
  61. Rabie, M.A.; Soliman, A.Z.; Diaconeasa, Z.S.; Constantin, B. Effect of pasteurization and shelf life on the physicochemical properties of physalis (Physalis peruviana L.) Juice. J. Food Process. Preserv. 2015, 39, 1051–1060. [Google Scholar] [CrossRef]
  62. Roginsky, V.; Lissi, E.A. Review of methods to determine chain-breaking antioxidant activity in food. Food Chem. 2005, 92, 235–254. [Google Scholar] [CrossRef]
  63. Abirami, A.; Nagarani, G.; Siddhuraju, P. In vitro antioxidant, anti-diabetic, cholinesterase and tyrosinase inhibitory potential of fresh juice from Citrus hystrix and C. maxima fruits. Food Sci. Hum. Wellness 2014, 3, 16–25. [Google Scholar] [CrossRef] [Green Version]
  64. Weerawatanakorn, M.; Wu, J.C.; Pan, M.H. Reactivity and stability of selected flavor compounds. J. Food Drug Anal. 2015, 23, 176–190. [Google Scholar] [CrossRef] [Green Version]
  65. Lu, A.T.; Whitaker, J.R. Some factors affecting rates of heat inactivation and reactivation of horseradish peroxidase. J. Food Sci. 1974, 39, 1173–1178. [Google Scholar] [CrossRef]
  66. Clemente, E.; Robinson, D.S. The thermostability of purified oranges isoperoxidases. Arq. Biol. Tecnol. 1995, 38, 109–118. [Google Scholar]
Figure 1. Process diagram.
Beverages 06 00043 g001
Figure 2. Total soluble solids and ethanol content in cider samples processed at alternative pasteurization conditions. Values with the same upper-case letter are not significantly different across storage time (p ≥ 0.05). Values with the same lower-case letter are not significantly different across treatment (p ≥ 0.05).
Beverages 06 00043 g002
Figure 3. pH and titratable acidity of cider samples processed at different pasteurization conditions. Values with the same upper-case letter are not significantly different across storage time (p ≥ 0.05). Values with the same lower-case letter are not significantly different across treatment (p ≥ 0.05).
Beverages 06 00043 g003
Figure 4. Principal component analysis (PC1 vs. PC2) of physicochemical properties and antioxidant activity of cider samples during storage (0–6 months).
Beverages 06 00043 g004
Figure 5. Principal component analysis (PC1 vs. PC2) of physicochemical properties, antioxidant activity, and sensory profiles of cider samples during storage (0–2 months).
Beverages 06 00043 g005
Table 1. Physicochemical properties of wax apple cider samples during refrigerated storage.
ConditionStorage Time (Month)
Conductivity (µS/cm)0123456
control2921 ± 16 E,a2952 ± 1 D,a2977 ± 2 C,a2986 ± 3 BC,b2987 ± 1 BC,b2991 ± 1 B,b3104 ± 1 A,a
63 °C2757 ± 2 E,c2893 ± 0 D,c2911 ± 1 C,a2911 ± 3 C,c2931 ± 4 B,c2933 ± 0 B,c2976 ± 1 A,c
71 °C2799 ± 27 C,b2949 ± 1 B,b2989 ± 18 AB,a3000 ± 1 A,a3000 ± 1 A,a3001 ± 1 A,a3008 ± 0 A,b
Total nitrogen (%)0123456
control0.063 ± 0.001 A,a0.063 ± 0.001 A,a0.064 ± 0.001 A,a0.064 ± 0.001 A,a0.056 ± 0.002 B,a0.050 ± 0.007 C,a0.044 ± 0.001 D,a
63 °C0.063 ± 0.001 A,a0.062 ± 0.001 A,a0.063 ± 0.001 A,a0.063 ± 0.001 A,a0.056 ± 0.002 B,a0.049 ± 0.001 C,a0.038 ± 0.003 D,b
71 °C0.055 ± 0.002 A,b0.054 ± 0.001 AB,b0.048 ± 0.003 C,b0.046 ± 0.001 C,b0.049 ± 0.007 BC,a0.044 ± 0.001 C,a0.036 ± 0.001 D,b
Density (g/cm3)0123456
control1000 ± 0.001 A,a0.998 ± 0.000 B,b0.997 ± 0.001 BC,b0.997 ± 0.001 BC,b0.997 ± 0.001 C,b0.996 ± 0.001 C,b0.996 ± 0.001 C,b
63 °C0.999 ± 0.001 A,a0.998 ± 0.001 B,b0.998 ± 0.001 BC,b0.997 ± 0.001 C,b0.997 ± 0.001 C,b0.997 ± 0.000 C,ab0.997 ± 0.000 C,ab
71 °C1000 ± 0.001 AB,a1000 ± 0.000 A,a1000 ± 0.001 AB,a0.999 ± 0.001 B,a0.999 ± 0.001 B,a0.999 ± 0.001 B,a0.999 ± 0.001 B,a
A, B, C, D, E means with the same superscript uppercase letter within the same row indicate no significant difference by storage time (p ≥ 0.05). a, b, c means with the same superscript lowercase letter within the same column indicate no significant difference by processing method (p ≥ 0.05).
Table 2. Microbiology profiles of cider samples during refrigerated storage.
Storage Time
(Months)
Total Plate Count
(log10 CFU/mL)
Yeast/Mold
(log10 CFU/mL)
E. Coli
(log10 CFU/mL)
Control63 °C71 °CControl63 °C71 °CControl63 °C71 °C
(4 °C)(4 °C)(4 °C)(4 °C)(4 °C)(4 °C)(4 °C)(4 °C)(4 °C)
01.03NDND2.00NDNDNDNDND
13.622.26ND3.622.26NDNDNDND
23.992.981.493.992.98NDNDNDND
34.533.912.664.523.91NDNDNDND
44.894.153.344.884.15NDNDNDND
54.944.273.774.944.26NDNDNDND
65.074.393.845.044.38NDNDNDND
Note: ND means not detected.
Table 3. Vitamin C, total phenols, and antioxidant activity of cider samples.
ConditionStorage Time (Month)
Vitamin C (mg/100 mL)0123456
Control5.87 ± 0.29 A,a4.58 ± 0.00 B,b4.29 ± 0.01 C,a4.12 ± 0.01 CD,a4.00 ± 0.06 DE,a3.91 ± 0.05 DE,a3.78 ± 0.09 E,a
63 °C5.22 ± 0.73 A,ab4.93 ± 0.00 A,a3.21 ± 0.00 B,c3.16 ± 0.01 B,b3.03 ± 0.06 B,b2.96 ± 0.02 B,b2.85 ± 0.00 B,b
71 °C4.52 ± 0.17 A,b3.80 ± 0.00 B,c3.39 ± 0.00 C,b3.12 ± 0.04 D,b2.93 ± 0.04 E,b2.80 ± 0.06 EF,c2.66 ± 0.02 F,c
Total phenols (mg/L)0123456
Control87.15 ± 0.01 A,a79.11 ± 0.78 B,a77.89 ± 0.18 C,a76.27 ± 0.35 D,a70.57 ± 0.02 E,a61.56 ± 1.15 F,a60.03 ± 0.33 G,a
63 °C78.33 ± 1.98 A,b73.31 ± 0.55 B,b69.57 ± 0.47 C,b67.91 ± 0.69 D,b66.57 ± 0.47 D,b62.19 ± 0.12 E,a59.32 ± 0.84 F,a
71 °C65.15 ± 1.39 A,c63.32 ± 0.71 B,c61.46 ± 0.02 C,c59.52 ± 0.01 D,c58.23 ± 0.19 D,c55.58 ± 0.71 E,b55.48 ± 1.28 E,b
Reducing power (mmol Fe2+/100 mL)0123456
Control30.90 ± 0.26 B,b31.03 ± 0.03 B,c31.69 ± 0.03 A,ab31.06 ± 0.03 B,b30.49 ± 0.81 B,ab29.61 ± 0.02 C,a29.17± 0.18 C,a
63 °C31.41 ± 0.05 B,a31.39 ± 0.03 B,b32.02 ± 0.29 A,a31.02 ± 0.29 C,b29.72 ± 0.12 D,b29.21 ± 0.15 E,b29.11 ± 0.26 E,a
71 °C31.15 ± 0.06 B,ab31.56 ± 0.06 A,a31.67 ± 0.00 A,b31.57 ± 0.09 A,a30.81 ± 0.29 C,a29.69 ± 0.14 D,a29.45 ± 0.22 D,a
DPPH scavenging activity (%)0123456
Control83.29 ± 0.74 A,a80.49 ± 0.07 B,a78.95 ± 0.03 C,a75.28 ± 0.37 D,a73.53 ± 0.07 E,a68.82 ± 0.45 F,a63.96 ± 0.18 G,a
63 °C77.31 ± 0.00 A,b74.30 ± 0.74 B,b71.06 ± 0.03 C,b67.13 ± 0.34 D,b64.46 ± 0.56 E,b61.70 ± 0.12 F,b57.31 ± 0.00 G,b
71 °C63.82 ± 0.02 A,c61.51 ± 0.39 B,c56.95 ± 0.06 C,c55.16 ± 0.01 D,c52.75 ± 0.09 E,c50.66 ± 1.14 F,c48.82 ± 0.02 G,c
ABTS scavenging activity (%)0123456
Control69.87 ± 0.31 A,a67.36 ± 0.54 B,a65.85 ± 0.67 C,a64.09 ± 0.12 D,a63.02 ± 0.86 E,a61.98 ± 0.13 F,a60.38 ± 0.70 G,a
63 °C66.09 ± 0.13 A,b64.71 ± 0.35 B,b63.20 ± 0.35 C,b62.47 ± 0.40 D,b61.83 ± 0.46 E,a61.02 ± 0.51 F,b59.48 ± 0.11 G,a
71 °C63.10 ± 0.99 A,c62.02 ± 0.27 AB,c61.64 ± 0.48 BC,c60.38 ± 0.70 CD,c59.58 ± 0.99 DE,b58.90 ± 0.27 EF,c57.68 ± 0.89 F,b
Hydroxyl radical scavenging (%)0123456
Control 66.69 ± 0.63 A,a59.43 ± 1.15 B,b55.02 ± 0.51 C,b53.76 ± 0.77 C,b52.21 ± 0.58 Da49.59 ± 0.83 E,ab44.37 ± 0.35 F,a
63 °C66.69 ± 1.43 A,a60.54 ± 0.95 B,ab56.13 ± 0.88 C,b55.04 ± 0.58 C,b53.24 ± 0.95 D,a50.18 ± 0.22 E,a44.35 ± 0.87 F,a
71 °C65.51 ± 0.73 A,a61.70 ± 0.17 B,a58.94 ± 0.85 C,a56.76 ± 0.70 D,a53.57 ± 0.47 E,a48.93 ± 0.24 F,b43.51 ± 0.73 G,a
Note: A, B, C, D, E, F the same superscript uppercase letter within the same row indicates no significant difference by storage time (p ≥ 0.05). a, b, c the same superscript lowercase letter within the same column indicates no significant difference by processing method (p ≥ 0.05).
Table 4. Sensory profile of cider samples.
AttributeStorage (Month)0123456
Sample
Sweet tasteControl3.80 ± 0.41 A,a3.20 ± 0.41 B,b3.07 ± 0.26 B,bNDNDNDND
63 °C3.87 ± 0.35 A,a3.60 ± 0.51 A,a3.20 ± 0.41 B,b3.00 ± 0.00 BNDNDND
71 °C 3.80 ± 0.51 A,a3.80 ± 0.41 A,a3.67 ± 0.49 A,a3.67 ± 0.49 A3.60 ± 0.51 A3.47 ± 0.52 A3.47 ± 0.52 A
Bitter tasteControl2.07 ± 0.46 B,b3.47 ± 0.52 A,a3.60 ± 0.51 A,aNDNDNDND
63 °C2.87 ± 0.35 B,a2.87 ± 0.35 B,b3.47 ± 0.52 A,a3.67 ± 0.49 ANDNDND
71 °C2.60 ± 0.26 C,a2.87 ± 0.35 BC,b2.93 ± 0.26 B,b3.47 ± 0.52 A3.67 ± 0.49 A3.80 ± 0.41 A3.80 ± 0.41 A
Sour tasteControl2.07 ± 0.26 C,a2.80 ± 0.41 B,a3.27 ± 0.46 A,aNDNDNDND
63 °C2.07 ± 0.26 C,a2.80 ± 0.41 B,a2.87 ± 0.35 B,b3.20 ± 0.41 ANDNDND
71 °C1.93 ± 0.41 B,a2.07 ± 0.26 AB,b2.20 ± 0.41 AB,c2.27 ± 0.46 A2.20 ± 0.41 AB2.27 ± 0.46 A2.20 ± 0.41 AB
Sour smellControl2.67 ± 0.49 B,a3.47 ± 0.52 A,a3.40 ± 0.51 A,aNDNDNDND
63 °C1.80 ± 0.41 C,b2.87 ± 0.35 B,b3.13 ± 0.35 B,a3.47 ± 0.52 ANDNDND
71 °C1.80 ± 0.41 C,b2.07 ± 0.26 BC,c2.20 ± 0.41 AB,b2.40 ± 0.51 AB2.20 ± 0.41 AB2.47 ± 0.52 A2.33 ± 0.49 AB
Fruity smellControl1.93 ± 0.46 B,a2.73 ± 0.46 A,a2.80 ± 0.41 A,aNDNDNDND
63 °C1.60 ± 0.51 C,a2.07 ± 0.26 B,b2.27 ± 0.46 B,b2.60 ± 0.51 ANDNDND
71 °C1.80 ± 0.41 C,a1.93 ± 0.46 BC,b2.00 ± 0.38 ABC,b2.27 ± 0.46 A2.13 ± 0.35 AB1.80 ± 0.41 C1.93 ± 0.26 BC
AftertasteControl1.73 ± 0.46 B,a1.87 ± 0.35 AB,b2.07 ± 0.26 A,bNDNDNDND
63 °C1.87 ± 0.35 B,a1.87 ± 0.35 B,b2.07 ± 0.26 AB,b2.27 ± 0.46 ANDNDND
71 °C1.80 ± 0.41 D,a2.60 ± 0.51 C,a2.87 ± 0.35 BC,a3.13 ± 0.35 AB3.27 ± 0.46 A3.20 ± 0.41 A3.27 ± 0.46 A
Note: A, B, C, D the same superscript uppercase letter within the same row indicates no significant difference by storage time (p ≥ 0.05). a, b, c the same superscript lowercase letter within the same column indicates no significant difference by processing method (p ≥ 0.05). ND means no data available.

