Article

Optimization of Beer Brewing by Monitoring α-Amylase and β-Amylase Activities during Mashing

by
Raimon Parés Viader
1,*,
Maiken Søe Holmstrøm Yde
1,
Jens Winther Hartvig
1,
Marcus Pagenstecher
2,
Jacob Bille Carlsen
3,
Troels Balmer Christensen
1 and
Mogens Larsen Andersen
2
1
GlycoSpot ApS, 2860 Søborg, Denmark
2
Department of Food Science, University of Copenhagen (KU FOOD), 1958 Frederiksberg, Denmark
3
Bryghuset Møn, 4780 Stege, Denmark
*
Author to whom correspondence should be addressed.
Submission received: 22 January 2021 / Revised: 19 February 2021 / Accepted: 22 February 2021 / Published: 2 March 2021
(This article belongs to the Special Issue Beer Quality and Flavour)

Abstract

:
(1) Background: In the current highly competitive brewing industry, most breweries may benefit from a reduction in mashing time. In this study, a novel enzymatic assay format was used to investigate the activities of α-amylase and β-amylase during different mashing profiles, with the aim to use it as a tool for optimizing the production time of an existing industrial mashing process; (2) Methods: Lab-scale mashings with eight different time-temperature programs and two different pilot brews were analyzed in terms of enzymatic activity, sugar composition, alcohol by volume in the final beer, FAN and others; (3) Results: A 20-min reduction (out of an original 73-min mashing program) was achieved by selecting a temperature profile which maintained a higher enzymatic activity than the original, without affecting the wort sugar composition and fermentability, or the ethanol concentration and foam stability of the final beer. (4) Conclusions: A method is presented which can be used by breweries to optimize their mashing profiles based on monitoring α-amylase and β-amylase activities.

1. Introduction

Beer brewing is a consolidated industry with centuries of history, which was traditionally dominated by small-scale production. Over the course of the nineteenth and twentieth century, scientific and technological advances allowed the creation of big-scale facilities, the dominion of large companies and the reduction of times and costs [1]. In the last two decades, smaller breweries with focus on beer quality and flavor have regained public attention and grown significantly in terms of market share; however, the market revenue and the overall beer production is still dominated by the biggest brewing companies. In addition to that, sustainability goals are on the agenda of most breweries, regardless of size. In this context, production efficiency and cost reduction become essential to adapt to a fast-changing competitive industry.
One of the most important steps in brewing is mashing. This process generally consists of mixing milled malted cereals, most commonly barley, with hot water to solubilize the grains’ starch and protein content. Increasing temperature in a controlled manner, including rests at constant temperature, enables the hydrolysis of starch into fermentable sugars like maltose, mainly catalyzed by the enzymes α-amylase and β-amylase. Temperature rests are chosen according to the optimal enzymatic activity. In a traditional standard infusion mashing, this includes a β-glucanase and protein rest around 45 °C, a β-amylase rest at approx. 62 °C, and an α-amylase rest at 70 °C [2,3]. Because modern malts are generally well-modified, many breweries nowadays omit the first rests and mash in directly at the temperatures where the two amylases are more active [2,4,5]. In many breweries, it is a common practice to run several batches of similar mashings on the same day. Thus, many brewers face tight production schedules, which limit the plant capacity, or result in extensive operational hours. At the same time, breweries often need to make small adaptations to the mashing time-temperature profile every year, due to seasonal changes in the barley crops and the resultant malt quality [4].
Making significant changes to the mashing profile conflicts with usual practice at brewhouses, which are generally regarded as conservative. In contrast, barley malt has improved a lot in terms of enzymatic activity. For example, many years of selection of barley malt varieties for amylolytic power since the end of Prohibition in North America have increased the β-amylase and α-amylase activities significantly [6,7]. In studies by Duke et al., the amounts of fermentable sugar produced in a gradual increase from 55 to 70 °C, which is around the β-amylase activity optimum (63–65 °C), peaked after approximately 20 min, even without a step at a constant temperature [8,9]. When simulating the mashing of barley malt based on kinetic models, Durand et al. showed that a fast temperature increase from 50 to 63 °C, followed by a rest at the latter temperature, achieved the maximum fermentable sugar concentration for the β-amylase rest also after around 20 min [10]. Furthermore, the maximum fermentable sugar composition, and dextrin concentration, was also achieved in less than 5 min after a fast increase from 63 to 72 °C [10]. These results are consistent with the ones of a recent publication by Langenaeken et al., where above 85% of the peak concentration of fermentable sugars during mashing was achieved after 20 min of the rest at 62 °C, and practically all the remaining sugars were obtained during the initial 5 min of heating towards the α-amylase rest, when the temperature was around 65 °C [11]. Notably, a major increase in fermentable sugars was reported below the starch gelatinization temperature. These studies suggests that there is room for optimization of mashing profiles by adjusting β- and α-amylase rests with the aim to reduce overall mashing time.
Knowing the enzymatic activity in the mashing wort is crucial for optimizing starch hydrolysis and thus mashing time. Previous methods used for measuring α- and β-amylase during brewing [2,7,12], based on either direct or indirect measurement of their activity, were time-consuming and/or complex lab-dependent assays, as they require long extraction times, as well as the special preparation of all reagents and/or substrates. That prevented any amendment in the mashing profile based on the measurement of the activity of these enzymes at productions sites, which usually lack the necessary facilities and personnel. In contrast, the methods used in the present paper, which have been developed for several years [13], do not require strong lab skills, a long analysis time, as well as expensive or complex lab equipment, since the substrates and reagents are prepared in individual kits, and the assay can be performed in 20 min per sample. The principle of the method (Brewer’s Dream™) is a colorimetric assay, in which the cleavage of a substrate by the specific enzyme of interest releases a chromophore, the color of which is later mathematically correlated with the enzymatic activity. Thus, by reading the absorbance of the final liquid in the assay, the activity of α- and β-amylase in malt and wort samples can be determined. In this study, we used this novel assay to investigate the evolution of enzymatic activity in different laboratory scale mashing profiles, with the aim to use it as a tool for optimizing the production time of an existing industrial program. Eight temperature profiles were investigated, with the first one being a typical one from the industry which did not include any protein rest, but a β-amylase rest at 65 °C and an α-amylase rest at 72 °C. The other seven were shorter profiles with different combinations of a protein rest at 45 to 55 °C, for 5 or 10 min, to promote β-amylase extraction into the wort, since α-amylase is usually considered to be in excess [14], and a shorter β-amylase rest at a lower temperature (63 instead of 65 °C), since this enzyme is not thermally stable in this range of temperatures [1,2,9]. Moreover, the step at 72 °C was either reduced or removed since its impact in producing further fermentable sugars and dextrins in this step has been shown to be small in previous research [10,11]. With the shortest mashing profile, we achieved a 20-min reduction of the mashing time, without affecting the concentration of fermentable sugars and free amino nitrogen (FAN) produced in the wort. The data were confirmed in a pilot scale brew, and the resulting beer was comparable to the industrial mashing program in ethanol and foam stability. This can have a big benefit for breweries with a strict schedule and help breweries to become more sustainable by reducing energy consumption.

2. Materials and Methods

2.1. Raw Materials

Barley pilsner malt produced in September 2020 was acquired from Viking Malt (Vordingborg, Denmark). The hops used in the brewing were Magnum (for bittering), Perle and Hallertau Mittelfrüh (for aroma), acquired from Caldic Nordic (Hedensted, Denmark). The yeast used during the fermentation was strain S-189 (Saccharomyces pastorianus) acquired from Fermentis (Marcq-en-Baroeul, France).

2.2. Lab-Scale Mashing and Pilot-Scale Brewing Experiments

Lab-scale mashing experiments were performed in duplicates using an LB Electronic PC Mashing bath (Lochner Labor + Technik GmbH, Berching, Germany), following eight different time-temperature profiles (Table 1). The first one (Original) was based on a typical industrial mashing procedure, whereas the other seven (A-G) were alternative shorter profiles. The heating rate was 1 °C/min in all experiments. Malt (100 g) milled at Bryghuset Møn was mashed in with 300 mL of demineralized water. Samples for enzymatic activity analysis were taken at the minutes indicated in Table 1, immediately filtrated with a fine mesh strainer, and cooled with ice to stop enzymatic activity. The sampled volumes were approximately 3 mL in the lab-scale experiments, in order to not significantly alter the grist to water ratio, and 10 mL in the pilot scale experiments. A reference beaker filled with the same grist:water ratio but unaffected by sampling was used to assess evaporation. At the end of the mashing programs, the mash was cooled to room temperature, adjusted for evaporation with demineralized water, and filtered through an open folded filter (#614 1/4, Macherey-Nagel, Düren, Germany), recycling the first 100 mL. The samples were stored at −18 °C until further analysis.
Pilot brewing experiments were performed using a 100 L Kaspar Schulz (Bamberg, Germany) pilot plant. The selected profiles were the Original and G (Table 1, from now on mentioned as “new profile”), based on the enzymatic activity and sugar profile results obtained at lab-scale. The heating rate was approx. 2 °C/min. Malt (14 kg) milled with a Sommer Maltman® 75 mill (roller gap 6.5, Osnabrück, Germany) was mashed in with 42 L of tap water. Sparging with 75 °C water resulted in a kettle-full volume of 100 L. The wort was boiled for 60 min, including three separated hop additions: Magnum within the first minute, Hallertau Mittelfrüh after 30 min and Perle one minute before the end of boiling. After the whirlpool, the approx. 97 L of cold wort were split into two fermenters in batches of 40 L each, and the S-189 dry yeast added. Fermentation occurred at 14 °C for 13 days, after which the beer was cold crashed to 3 °C, transferred to Cornelius kegs and carbonated. Samples for analysis were taken after approx. 24 days of maturation at 5 °C.

2.3. Grist Composition

The grist composition was analyzed in duplicates with a Prüfsieb JEL 200 (J. Engelsmann AG, Ludwigshafen, Germany) sieve shaker, to assess if the milling used in pilot experiments could be comparable with the milling size used in the lab scale. The mesh sizes used were 1000, 500, 250, and 160 µm. Milled grain (100 g) was put on the top sieve and timer of the sieving device set for 5 min. The weight of grists retained on the sieves as well as on the bottom were recorded relative to the original wight of the samples.

2.4. α- and β-Amylase Activity in Malt and Wort Samples

The activity of α- and β-amylase in malt and wort samples was measured using GlycoSpot Brewer’s Dream™ kits. For malt samples, α-amylase was measured by weighing 200 mg of finely milled malt in triplicates, and mixing each replica with 50 mL Brewer’s Dream™ buffer and 70 mg of 1,4-Dithiothreitol for 5 min with the Roto-Therm™ Incubated Rotator set at 35 °C. After letting it settle for 5 min, 200 µL of the supernatant of each extraction was mixed with 800 µL of Brewer’s Dream™ buffer in a tube containing GlycoSpot’s α-amylase substrate. The tubes were immediately incubated with the Roto-Therm™ Incubated Rotator set at 35 °C for 7 min. Right after, the incubation was stopped by filtering the content of the tubes with a syringe and a 0.45 µm cellulose acetate filter. For β-amylase in malt samples, 200 mg of finely milled malt was weighed in triplicates, and each replica was mixed with 25 mL Brewer’s Dream™ buffer and 35 mg of 1,4-dithiothreitol for 10 min with the Roto-Therm™ Incubated Rotator set at 35 °C. Right after the extraction, the content was filtered with a syringe and a 0.45 µm cellulose acetate filter. Then, 250 µL of the filtrate was placed in a tube containing GlycoSpot’s β-amylase substrate. The tubes were immediately incubated with the Roto-Therm™ Incubated Rotator set at 35 °C for 7 min. Right after the incubation was stopped by adding 250 µL of Brewer’s Dream™ stopping reagent.
For each wort sample, 600 µL was diluted in either 49.4 mL (α-amylase) or 24.4 mL (β-amylase) of Brewer’s Dream™ buffer. β-Amylase diluted wort samples were diafiltrated at room temperature in two rounds of 10 min at 15,000× g with a Corning® LSE™ high speed microcentrifuge, UF 10 kDa filter Amicon Ultra-0.5 mL and Brewer’s Dream™ buffer. The incubation proceeded as described for malt samples in each enzyme.
The resulting liquids from the incubation were transferred in a cuvette and the absorbance was measured in a Spectramax plus 384 spectrophotometer at 410 nm (for β-amylase) and 595 nm (α-amylase). For β-amylase samples the reference used was the sample extract mixed with the stopping reagent, in order to remove the effect of the background color of the sample. Calibration lines built with reference barley malt samples from the Malt Analytes Scheme (MAPS) and the French Institute of Beverages, Brewing and Malting (IFBM) were used to convert the absorbance into either dextrinizing units (DU) for α-amylase and Windisch–Kolbach (WK) for β-amylase, since diastatic power, defined as the combined activities of all amylolytic enzymes working together to degrade starch, is virtually always only correlated with β-amylase activity [15,16].

2.5. Standard Wort and Beer Analyses

Free amino nitrogen (FAN) in final wort and beer samples was measured in triplicates in accordance with EBC method 8.10 [17]. Specific gravity and extract were measured according to EBC method 8.2.2, using an DMA 4500 density meter (Anton Paar, Graz, Austria).
Foam stability of the final beers was determined according to EBC 9.42 using a Pentair NIBEM-T meter (Minneapolis, MN, USA), in four replicas. The beer was force-carbonated to approx. 2.5 volumes CO2 two days prior to the analysis. The stability was recorded as the time it took for the foam to collapse 30 mm below a reference point.

2.6. Fermentable Sugars and Ethanol Concentration by High-Performance Liquid Chromatography (HPLC)

Determination of fermentable sugars (glucose, maltose and maltotriose) was performed on an Agilent HPLC system (Santa Clara, CA, USA) equipped with a Hi-Plex Ca column (300 × 7.7 mm) with a Hi-Plex Ca guard column (50 × 7.7 mm). An external calibration was performed with mixtures of concentrations between 0.1 and 10 mg/mL of the respective sugars in ultrapure water. Elution was conducted with ultrapure water at 80 °C, with a flow rate of 0.6 mL/min. An amount of 1.0 mL of sample was transferred to a micro tube and centrifuged at 10,000× g for 20 min at 4 °C. The supernatant was filtered through a 0.2 µm filter and diluted by a factor of 10 times before measurement. The injection volume was 20.0 µL. Ethanol concentrations were measured on the same HPLC system equipped with an Aminex HPX-87H ion exclusion column (300 mm × 7.8 mm, Bio-Rad Laboratories, Hercules, CA, USA). An external calibration was performed in the concentration range between 1% and 10% ABV. Elution was conducted with ultrapure water at room temperature, at a flow rate of 0.6 mL/min. Samples were filtrated through a 0.2 µm filter before analysis, and the injection volume was 5 µL. An Agilent 1100 Series Refractive Index Detector was used at 40 °C in both experiments.

2.7. Statistical Analysis

Statistical significance of FAN, foam stability and fermentable sugars between samples from different mashing profiles were compared by performing a single factor analysis of variance (ANOVA) in Excel, with an alpha value of 0.05.

3. Results

3.1. Malt Analysis

Grist analyses showed that the size distribution of the malt milled with Maltman® 75 from Sommer and the one usually obtained using a large capacity industrial mill at Bryghuset Møn gave a similar range of values (Table 2). This is important to be able to repeat this profile changes in a bigger scale, as the particle size distribution influences the amount of surface area of the milled malt exposed to the water, which in turn also impacts on the speed at which starch, other nutrients and enzymes are released into the wort.
Enzymatic activities of malt certified by the supplier showed a comparable result with the ones of measured using Brewer’s Dream™ kits in terms of diastatic power (less than one standard deviation), but a bigger difference in terms of α-amylase activity (more than one standard deviation) (Table 3). One reason could be that the malt supplier measured diastatic power using the EBC methods (4.12) and α-amylase is using the Ceralpha method, whereas Brewer’s Dream™ method is calibrated using MAPS and IFBM reference samples measured with EBC methods for both diastatic power and α-amylase (EBC methods 4.12.1 and 4.13).

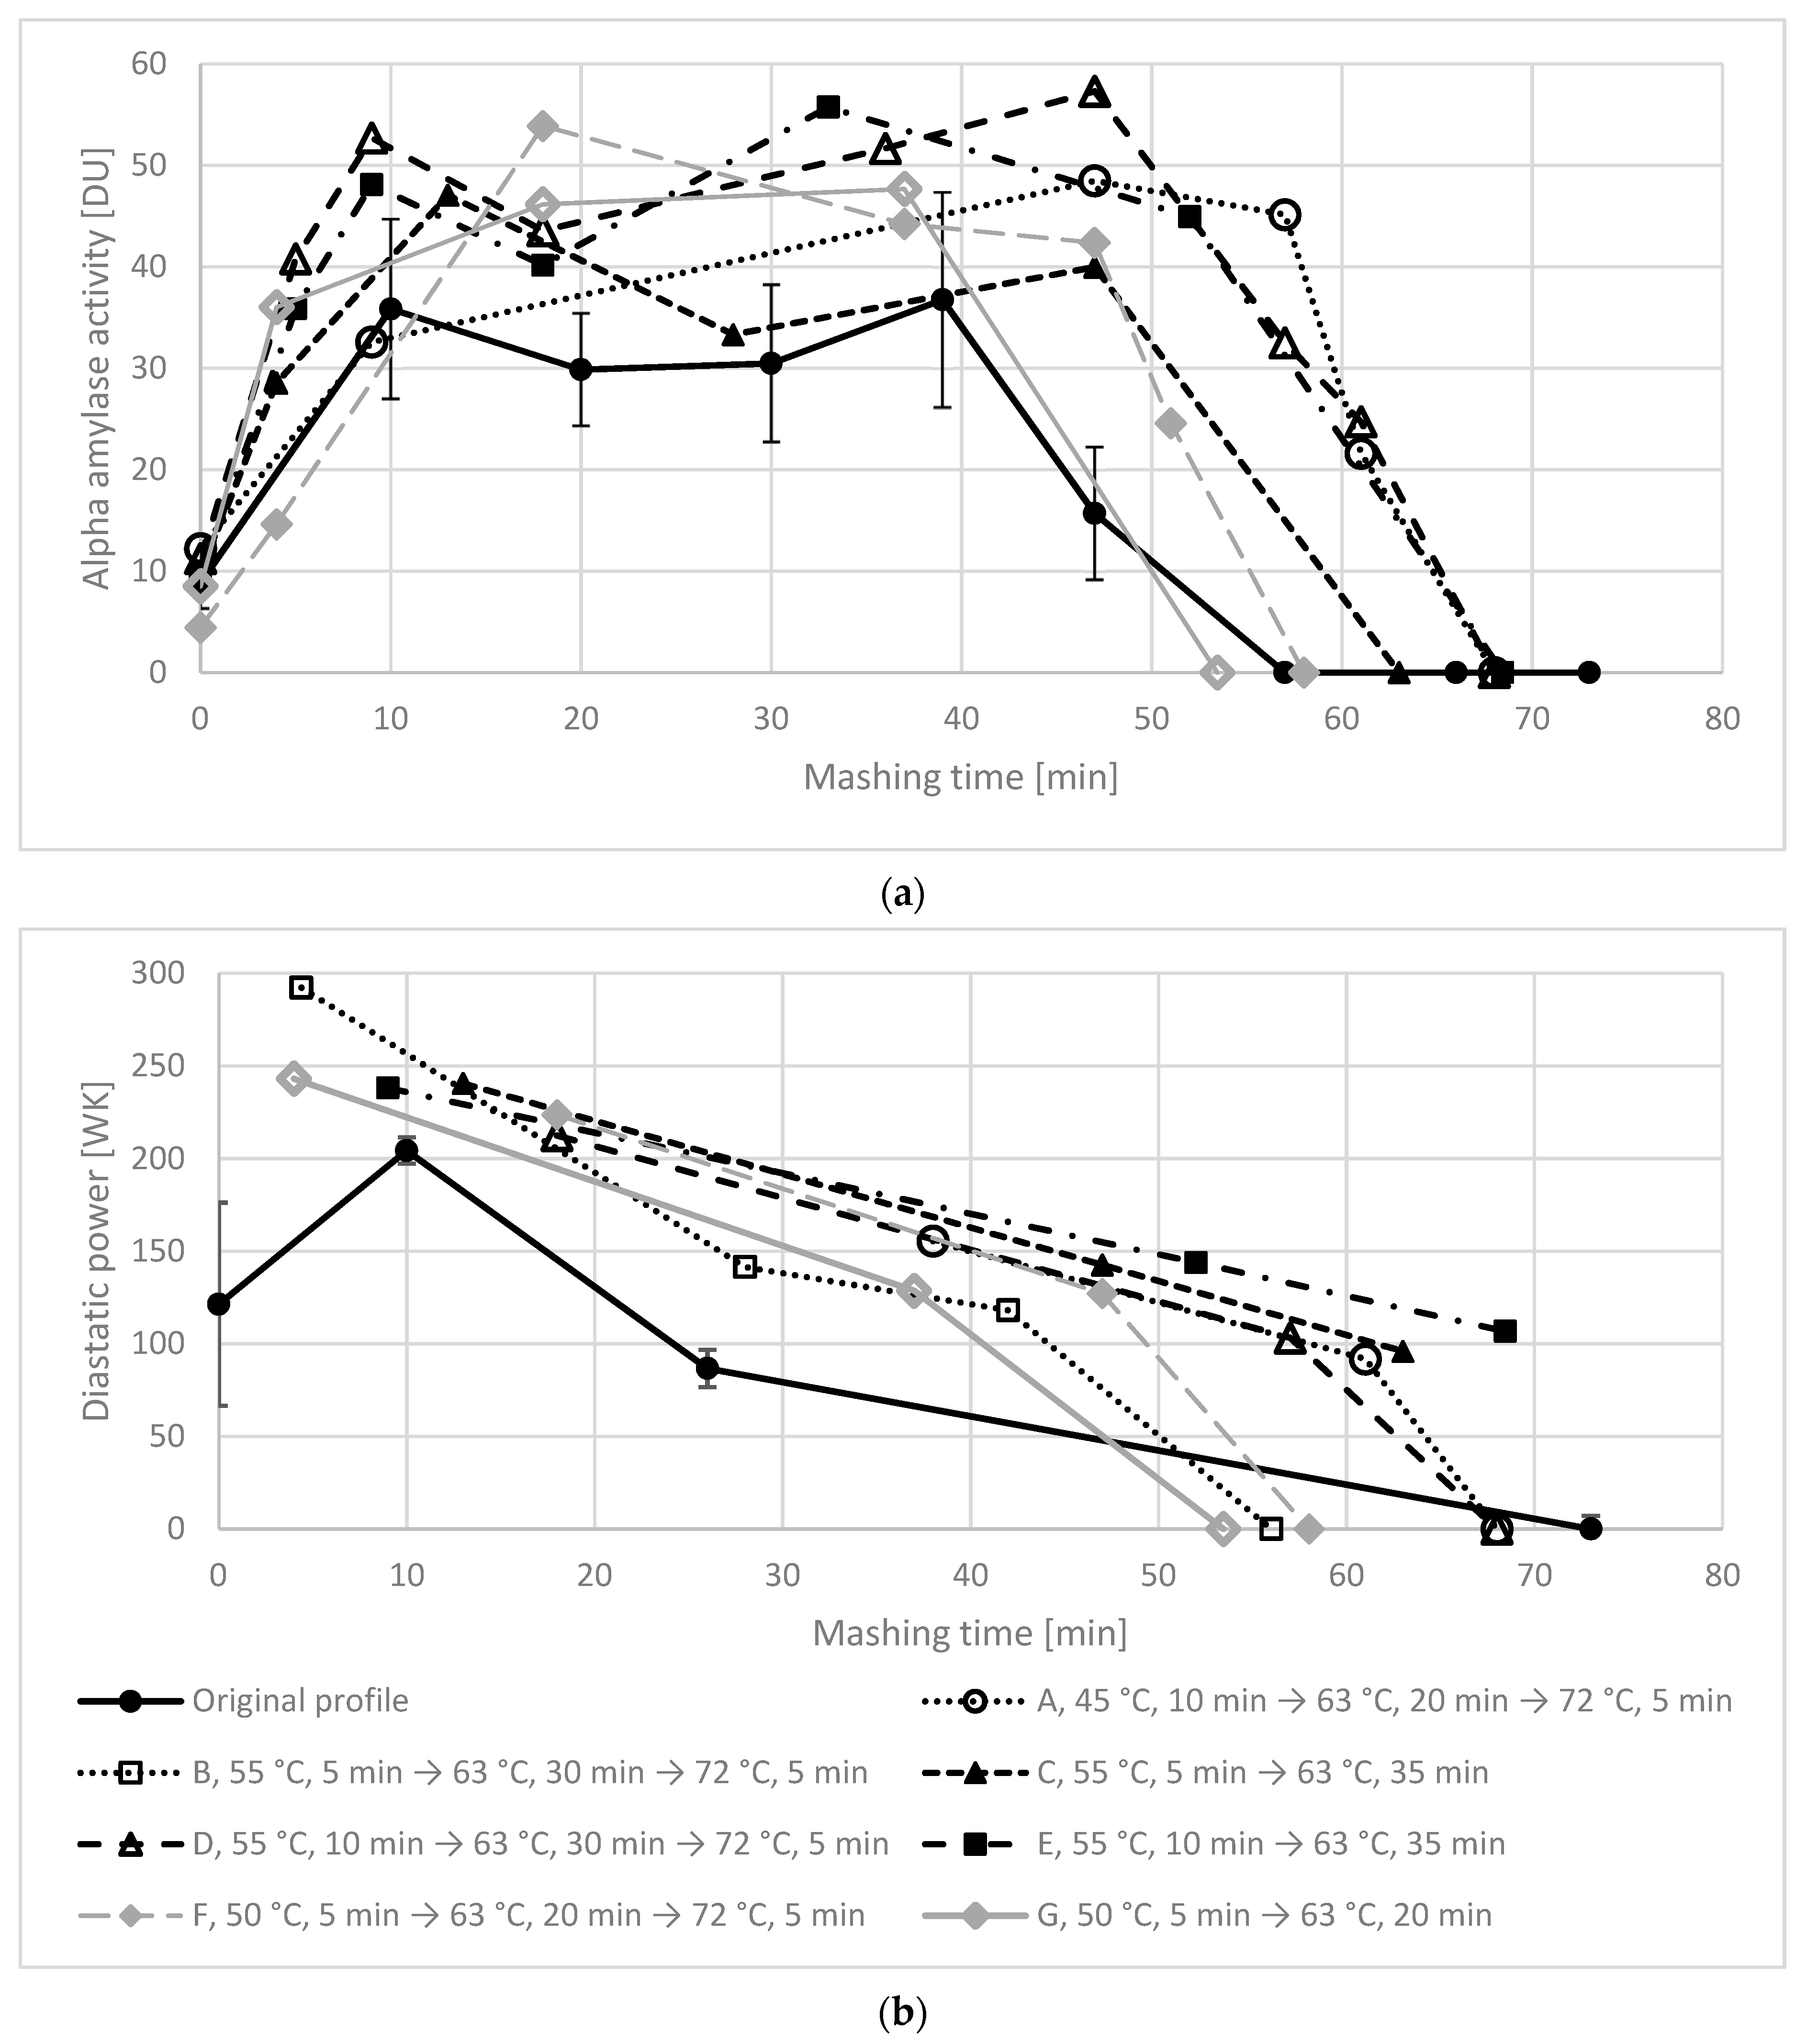
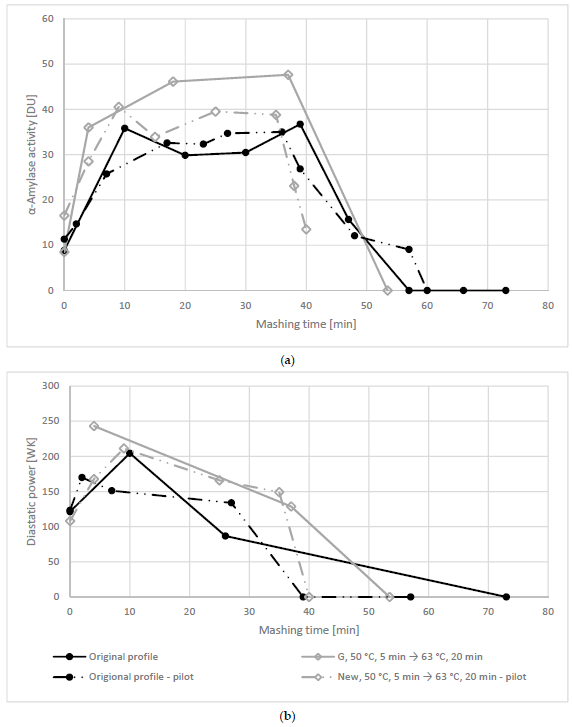
3.2. Enzymatic Activity during Mashing

The activities of solubilized amylases as measured by the Brewer’s Dream™ method during mashing is shown in Figure 1 and Figure 2, for the different time-temperature profiles. For comparison purposes, the original profile is shown with a confidence interval of 95%. For most laboratory scale results, duplicate results were comparable (<10 DU for α-amylase, <30 WK for diastatic power). The only exception was profile B, for which some of the replicates varied by more than 10 DU for α-amylase. Therefore, these results are not shown in the present study. The results of α-and β-amylase are comparable to other studies [2,7,12]. α-Amylase activity follows a reverse u-shape profile over the time, with a plateau in the 63–65 °C step. The initial increase in the first minutes is due to the release of enzymes into the wort, whereas the following plateau is due to the thermal stability of α-amylase at 63–65 °C. The sudden decrease at the end is caused by the temperature increase to 72 °C (or 78 °C), where α-amylase shows less stability [1,2,9]. β-Amylase activity decreases over the time, except for the initial increase observed if a sample is taken at the beginning of mashing. As for α-amylase, the initial increase is due to the extraction of β-amylase into the wort. The continuous decrease, more pronounced than for α-amylase, is due to the lower thermal stability of this enzyme [1,2,9].

3.3. Extract, FAN, Sugar Content, Ethanol Concentration and Foam Stability in the Wort and Final Beer

The concentrations of fermentable sugars, determined using HPLC, were similar in all lab-scale sweet worts: 120–126 g/L of maltose, 29–33 g/L of maltotriose and 15–18 g/L of glucose. Gravity measurements were also consistent in a range of 20.6 to 21.1 °P. In contrast, FAN values were 279 ppm for the original profile, whereas all alternative profiles (A–G) had all an FAN slightly higher of 287–312 ppm. Based on the increase of enzymatic activity during the mashings (Figure 1a,b) and the similarity of the sugar composition across the different mashing profiles, the shortest of the suggested mashing profiles (profile G) was chosen for the pilot brewing experiment.
The results of the pilot scale are displayed in Table 4 for kettle-full wort, and the two tanks where each wort was fermented. Performing an ANOVA (single factor), it was found that there were no statistically significant differences (p > 0.05) between FAN and fermentable sugars in the preboiled wort. The gravity of the kettle-full wort (9.3 °P, Table 4), increased to 9.6 and 9.7 °P (original and new profiles) after boiling and whirlpool, and decreased to apparent gravity values of 2.2–2.6 °P in the final beer, consistent with typical values from brewhouses [4], and achieving an apparent attenuation (fermentability) slightly higher for the original profile than for the new profile (around 77% and 74% on average, respectively, Table 4). No residual fermentable sugars were detected in the final beers, and the final %ABV of the four final beers was virtually the same (4.0–4.2%). Most notably, the foam stability of the beer from the new mashing profile was significantly higher than of the beer brewed using the original mashing program. Therefore, it can be concluded that the new suggested profile did not seem to have any negative impact into the main beer quality parameters.

4. Discussion

4.1. Enzymatic Activity Differences with the Alternative Mashing Profiles

The alternative mashing temperature profiles all gave equal or higher α- and β-amylase activities extracted into the wort over time compared to the original mashing profile (Figure 1). For α-amylase, the profiles A-G had activities that were mostly higher than the 95% confidence interval of the original profile, whereas the β-amylase activities were higher for all alternative profiles. The latter is probably due to the initial step of at least 5 min at temperatures equal to or below 55 °C, where β-amylases have a high thermal stability [16,18], thus allowing these enzymes to be extracted into the wort without denaturation. Notably, most mashing profiles lost a significant part of β-amylase activity soon after reaching temperatures close to the traditional β-amylase rest at 63–65 °C. β-Amylase is the limiting factor in the formation of fermentable sugar formation from of barley malt [14,19,20], due to its considerably lower thermal stability compared to α-amylase, which remains active for over an hour at 65 °C [16,18]. Therefore, optimizing the parameters for shorter mash time should focus on improving the β-amylase activity window. In the original mashing profile, β-amylase lost two thirds of its activity after 16 min (out of the 30 min of the rest) at 63–65 °C (Figure 1b). With an initial rest at 45–55 °C and the resulting higher β-amylase activity transfer to the wort, this traditional β-amylase rest can be reduced by up to 10 min while maintaining an overall higher activity.
For α-amylase, the overall higher activity in the A–G profiles, mostly during the β-amylase rest, is probably due to a combination of the initial step at 45–55 °C and the relatively low modification of the original malt: the Kolbach index is 37% (Table 3), slightly below the usual 39–41% for barley malt [1,4]. The friability value, usually related to the level of modification of barley, is 91.8% (Table 3), above the average values for pilsner malt [1], but friability can be overestimated in malts with high amount of total nitrogen [21] (around 1.7%, like the one of this study, Table 3) in comparison with malts with lower amounts (around 1.5%) [1,21]. During malting, aleurone cells produce enzymes such as α-amylases, β-glucanases and xylanases [1,22]. The last two groups, when acting in combination, are also responsible to break down aleurone cell walls, mostly formed by β-glucans and pentosans [1,23,24,25], thereby helping in the release of α-amylase [1]. Evidence of intact aleurone cell walls have been observed before, even in malts germinated for more than five days at room temperature [24]. At the same time, a fraction of α-amylase was found in the aleurone layer after a week of germination at 20 °C [26]. An undermodified malt could have a lower degradation of aleurone cell walls, making some of the malt’s α-amylase unavailable to the mashing wort. The initial step at 45–55 °C allows β-glucanase [4] and xylanase to further degrade those walls and enhance the α-amylase extraction into the wort. This can be possible because β-glucanase preserves part of its activity for 5 min at 50–55 °C [27] during mashing, whereas xylanases retains around 60% of its activity after 10 min at the same temperature range [25].
Knowing the evolution of the enzymatic activity in a mashing profile can help brewers to decide if the α- and β-amylase activity should be increased with a protein rest, as well as decide if the 63–67 °C and 70–72 °C rests should be reduced in time and/or temperature due to the low activity of each enzyme.

4.2. Sugar Profile, FAN and Foam Stability

The sugar composition and gravity of both the lab-scale sweet worts and the pilot scale kettle-full worts showed no major differences between the respective A–G profiles and the original mashing profile, which could be due to the fact the original profile did not give rise to any hydrolysis beyond 20 min of the β-amylase rest and beyond 5 min of the α-amylase rest. By simulating starch hydrolysis and formation of fermentable sugars during barley malt mashing, Durand et al. showed that it can take less than 20 min at 63 °C to hydrolyze above 90% of the starch and reach more than 95% of the final fermentable sugar composition of the final wort [10], consistent with other studies where wort extract peaked in less than 20 min of a constant heating from 55 to 70 °C [8,9]. A similar pattern was observed by Langenaeken et al., as almost all fermentable sugars were obtained after 20 min at 62 °C, close to the barley starch gelatinization temperature, followed by a short increase to 65 °C at a heating rate of 1 °C/min [11]. In the study from Durand et al. it was also reported that it took around 5 min from the beginning of the temperature increase from 63 °C to 72 °C to reach the maximum concentration of fermentable sugars [10]. As aforementioned, equal or higher α-and β-amylase activities were obtained with the new suggested profiles (Figure 1 and Figure 2), indicating a marginal effect of the last 10 min of the β-amylase rest and of the α-amylase rest and justifying the selected time reductions. Analogously, a higher α-amylase activity in the wort could have accelerated the fermentable sugar production during the β-amylase rest, where the amount of extracted α-amylase activity was the highest during the whole mashing (Figure 1a and Figure 2a) even though the activity optimum is at 70–75 °C [2]. The higher glucose contents on average obtained with the new profile at pilot scale (Table 4) could be due to the fact that α-glucosidase is more thermolabile than α- and β-amylase, especially above 40 °C [1,7,14]. Therefore, the initial rest at 50 °C could have allowed a marginal action of this enzyme. However, this needs to be confirmed in future studies, as there is no statistical significance (Section 3.2), partially due to the high standard deviation of the glucose concentration found in the original profile.
Mashing in and including extensive temperature rests at temperatures around 45–55 °C, where proteases are stable and active for at least a few minutes [2], is generally associated with a negative effect on beer foam [5]. In contrast, the beer brewed with the new profile, including mashing in and a five-minute rest at 50 °C, had a significantly higher foam stability (265 s, cf. Table 4) than the beer brewed with the original profile (191 s). This could be due to the lower temperatures allowing cysteine proteinases [28,29] to release foaming polypeptides from hordein, improving foam stability [29]. An additional benefit of the protease action in the protein rest of the A-G profiles would also be the degradation of inhibitor proteins of β-amylase [20,30]. The final higher FAN content for the studied profiles at lab scale could be attributed to the higher activity of carboxypeptidases at 45–55 °C than at 65 °C [2]. The increased activity of β-glucanase could also favor foam stability by the addition of small amounts of β-glucans [31]. However, this requires further study as β-glucan or protein sizes and concentrations were not measured in the present study. Nevertheless, filtration problems were not observed in any of the two studied pilot scale brews.

5. Conclusions

In the present study, we investigated the modification of an industrial mashing time-temperature profile, facilitated by measuring the enzymatic activities of α- and β-amylase during mashing. Time reductions of up to 20 min were possible, by initial mashing at lower temperatures which increased the activity of these two enzymes. At the same time, this was done without negatively affecting the major quality parameters of the wort and the produced beer, based on similar foam stability, sugar composition and final ethanol concentrations. Therefore, measurement of α- and β-amylase activities during mashing is a powerful tool for optimization of mashing with respect to time and resource utilization.

Author Contributions

Conceptualization, R.P.V., M.S.H.Y., M.P. and M.L.A.; Methodology, R.P.V., J.W.H., M.S.H.Y., M.P., J.B.C. and M.L.A.; Validation, J.B.C., T.B.C. and M.L.A.; formal analysis, R.P.V., J.W.H., M.S.H.Y. and M.P.; investigation, R.P.V., J.W.H., M.S.H.Y. and M.P.; resources, J.W.H., M.S.H.Y. and M.P.; data curation, R.P.V., J.W.H., M.S.H.Y. and M.P.; writing—original draft preparation, R.P.V. and M.P.; writing—review and editing, all authors; visualization, all authors; supervision, J.B.C., T.B.C. and M.L.A.; project administration, T.B.C. and M.L.A.; funding acquisition, T.B.C. and M.L.A. All authors have read and agreed to the published version of the manuscript.

Funding

This research was funded by the program Greater Copenhagen Food Innovation (CPH-Food), in turn funded by the European Regional Development Fund, under the framework of the project Measuring of ENzymatic activity during brewING (MENING).

Data Availability Statement

Data is contained within the article.

Acknowledgments

The authors would like to acknowledge the support from the management at Bryghuset Møn and the CEO at GlycoSpot ApS Thomas Lacentra, as well as the analytical support from Henriette Rifbjerg Erichsen and Ösp Sölvadottir from the FOOD Department of the University of Copenhagen.

Conflicts of Interest

The authors Raimon Parés Viader, Maiken Søe Holmstrøm Yde, Jens Winther Hartvig and Troels Balmer Christensen were working for GlycoSpot Aps, supplier of some of the enzymatic assays used in the present work, during the preparation of this paper. The rest of the authors declare no conflict of interest. The funders had no role in the design of the study; in the collection, analyses, or interpretation of data; in the writing of the manuscript, or in the decision to publish the results.

References

  1. Russell, G.G.S.I.; Anstruther, A. Handbook of Brewing; CRC Press, Taylor & Francis Group: Boca Raton, FL, USA, 2018. [Google Scholar]
  2. Back, W.; Narziß, L. Das Maischen. In Die Bierbrauerei; Wiley-VCH Verlag: Weinheim, Germany, 2009; pp. 233–396. [Google Scholar] [CrossRef]
  3. Kühbeck, F.; Dickel, T.; Krottenthaler, M.; Back, W.; Mitzscherling, M.; Delgado, A.; Becker, T. Effects of Mashing Parameters on Mash β-Glucan, FAN and Soluble Extract Levels. J. Inst. Brew. 2005, 111, 316–327. [Google Scholar] [CrossRef]
  4. Lewis, M.J. Brewing; Kluwer Academic/Plenum Publishers: Dordrecht, The Netherlands, 2002. [Google Scholar]
  5. Kunze, W. Technology Brewing & Malting, 5th ed.; VLB: Berlin, Germany, 2014. [Google Scholar]
  6. Duke, S.H.; Henson, C.A.; Vinje, M.A.; Walling, J.G.; Bockelman, H.E. Comparisons of Modern United States and Canadian Malting Barley Cultivars with Those from Pre-Prohibition: V. Bmy1 Intron III Alleles and Grain β-Amylase Activity and Thermostability. J. Am. Soc. Brew. Chem. 2019, 77, 62–68. [Google Scholar] [CrossRef]
  7. Henson, C.A.; Duke, S.H.; Bockelman, H.E. Comparisons of Modern U.S. and Canadian Malting Barley Cultivars with Those from Pre-Prohibition: II. Amylolytic Enzyme Activities and Thermostabilities. J. Am. Soc. Brew. Chem. 2018, 76, 38–49. [Google Scholar] [CrossRef]
  8. Duke, S.H.; Henson, C.A.; Bockelman, H.E. Comparisons of Modern U.S. and Canadian Malting Barley Cultivars with Those from Pre-Prohibition: Malt Extract and Osmolyte Concentration. J. Am. Soc. Brew. Chem. 2017, 75, 85–92. [Google Scholar] [CrossRef]
  9. Duke, S.H.; Henson, C.A.; Bockelman, H.E. Comparisons of Modern U. S. and Canadian Malting Barley Cultivars with Those from Pre-Prohibition: III. Wort Sugar Production during Mashing. J. Am. Soc. Brew. Chem. 2018, 76, 96–111. [Google Scholar] [CrossRef]
  10. Durand, G.; Corazza, M.; Blanco, A.; Corazza, F. Dynamic optimization of the mashing process. Food Control 2009, 20, 1127–1140. [Google Scholar] [CrossRef]
  11. Langenaeken, N.A.; De Schepper, C.F.; De Schutter, D.P.; Courtin, C.M. Carbohydrate content and structure during malting and brewing: A mass balance study. J. Inst. Brew. 2020, 126, 253–262. [Google Scholar] [CrossRef]
  12. Evans, D.E.; Fox, G.P. Comparison of Diastatic Power Enzyme Release and Persistence during Modified Institute of Brewing 65 °C and Congress Programmed Mashes. J. Am. Soc. Brew. Chem. 2017, 75, 302–311. [Google Scholar] [CrossRef]
  13. Schückel, J. Novel Innovation in Enzyme Analysis. Brauwelt Int. 2018, 2–5. [Google Scholar]
  14. Bamforth, C. Current perspectives on the role of enzymes in brewing. J. Cereal Sci. 2009, 50, 353–357. [Google Scholar] [CrossRef]
  15. Evans A More Cost- and Labor-Efficient Assay for the Combined Measurement of the Diastatic Power Enzymes β-Amylase, α-Amylase, and Limit Dextrinase. J. Am. Soc. Brew. Chem. 2008, 66, 215–222. [CrossRef]
  16. MacGregor, A.; Bazin, S.; Macri, L.; Babb, J. Modelling the Contribution of Alpha-Amylase, Beta-Amylase and Limit Dextrinase to Starch Degradation During Mashing. J. Cereal Sci. 1999, 29, 161–169. [Google Scholar] [CrossRef]
  17. European Brewing Convention. Analytica-EBC; Hans Carl Getränke-Fachverlag: Nürnberg, Germany, 2010. [Google Scholar]
  18. Muller, R. A mathematical model of the formation of fermentable sugars from starch hydrolysis during high-temperature mashing. Enzym. Microb. Technol. 2000, 27, 337–344. [Google Scholar] [CrossRef]
  19. Duke, S.H.; Vinje, M.A.; Henson, C.A. Comparisons of Amylolytic Enzyme Activities and β-Amylases with Differing Bmy1Intron III Alleles to Sugar Production during Congress Mashing with North American Barley Cultivars. J. Am. Soc. Brew. Chem. 2012, 70, 230–248. [Google Scholar] [CrossRef]
  20. Wefing, P.; Conradi, F.; Trilling, M.; Neubauer, P.; Schneider, J. Approach for modelling the extract formation in a continuous conducted “β-amylase rest” as part of the production of beer mash with targeted sugar content. Biochem. Eng. J. 2020, 164, 107765. [Google Scholar] [CrossRef]
  21. Darlington, H.F.; Palmer, G.H. Homogeneity of the friable flour of malting barley. J. Inst. Brew. 1996, 102, 179–182. [Google Scholar] [CrossRef]
  22. Kuntz, R.J.; Bamforth, C.W. Time Course for the Development of Enzymes in Barley. J. Inst. Brew. 2007, 113, 196–205. [Google Scholar] [CrossRef]
  23. Kanauchi, M.; Bamforth, C.W. Release of β-Glucan from Cell Walls of Starchy Endosperm of Barley. Cereal Chem. J. 2001, 78, 121–124. [Google Scholar] [CrossRef]
  24. Taiz, L.; Honigman, W.A. Production of Cell Wall Hydrolyzing Enzymes by Barley Aleurone Layers in Response to Gibberellic Acid. Plant Physiol. 1976, 58, 380–386. [Google Scholar] [CrossRef] [Green Version]
  25. Kanauchi, M.; Chijimi, A.; Ohnishi-Kameyama, M.; Bamforth, C.W. An investigation of two xylan-degrading enzymes and a novel xylanase inhibitor in malted barley. J. Inst. Brew. 2013, 119, 32–40. [Google Scholar] [CrossRef]
  26. Ranki, H.; Sopanen, T. Secretion of α-Amylase by the Aleurone Layer and the Scutellum of Germinating Barley Grain. Plant Physiol. 1984, 75, 710–715. [Google Scholar] [CrossRef] [Green Version]
  27. Jin, Y.; Speers, R.A.; Paulson, A.T.; Stewart, R.J. Barley β-Glucans and Their Degradation During Malting and Brewing. MBAA TQ 2017, 41, 231–240. [Google Scholar]
  28. Berne, A.L.M.; Jones, L. The Effect of Mashing on Malt Endoproteolytic Activities. J. Agric. Food Chem. 2002, 50, 858–864. [Google Scholar]
  29. Kapp, G.R.; Bamforth, C.W. The foaming properties of proteins isolated from barley. J. Sci. Food Agric. 2002, 82, 1276–1281. [Google Scholar] [CrossRef]
  30. Kok, Y.J.; Ye, L.; Muller, J.; Ow, D.S.-W.; Bi, X. Brewing with malted barley or raw barley: What makes the difference in the processes? Appl. Microbiol. Biotechnol. 2019, 103, 1059–1067. [Google Scholar] [CrossRef] [PubMed]
  31. Evans, D.E.; Sheehan, M.C.; Stewart, D.C. The Impact of Malt Derived Proteins on Beer Foam Quality. Part II: The Influence of Malt Foam-positive Proteins and Non-starch Polysaccharides on Beer Foam Quality varieties. J. Inst. Brew. 1999, 105, 171–177. [Google Scholar] [CrossRef]
Figure 1. (a) α-Amylase and (b) β-Amylase activity of the different mashing profiles studied at lab scale measured with Brewer’s Dream™ kits. The heating rate in all profiles was 1 °C/min. Mash out temperature was 78 °C, which was held for 1 min.
Beverages 07 00013 g001
Figure 2. (a) α-Amylase and (b) β-Amylase activity of the different mashing profiles studied at pilot scale, compared to the same time-temperature profiles at lab scale measured with Brewer’s Dream™ kits. The heating rate was 1 °C/min for lab-scale experiments, and 2 °C/min for pilot-scale experiments. Mash out temperature was 78 °C, which was held for 1 min.
Beverages 07 00013 g002
Table 1. Mashing profiles investigated in the present study.
ProfileMash InProtein Restβ-Amylase Restα-Amylase RestMash OutSamples Taken at minTotal Time
Lab/Pilot Scale (min)
Original55 °CNone65 °C, 30 min72 °C, 20 min78 °C, 1 minLab scale: 0, 10, 20, 26, 30, 39, 47, 57, 66, 73
Pilot scale: 0, 2, 7, 17, 23, 27, 36, 39, 48, 57, 60
74/61
A45 °C45 °C, 10 min63 °C, 20 min72 °C, 5 min78 °C, 1 min0, 9, 28, 38, 47, 57, 61, 6869
B55 °C55 °C, 5 min63 °C, 30 min72 °C, 5 min78 °C, 1 min0, 4, 13, 28, 42, 52, 56, 6364
C55 °C55 °C, 5 min63 °C, 35 minNone78 °C, 1 min0, 4, 13, 28, 47, 6364
D55 °C55 °C, 10 min63 °C, 30 min72 °C, 5 min78 °C, 1 min0, 5, 9, 18, 36, 47, 57, 61, 6869
E55 °C55 °C, 10 min63 °C, 35 minNone78 °C, 1 min0, 5, 9, 18, 33, 52, 6870
F50 °C50 °C, 5 min63 °C, 20 min72 °C, 5 min78 °C, 1 min0, 4, 18, 37, 47, 51, 5859
G/New50 °C50 °C, 5 min63 °C, 20 minNone78 °C, 1 minLab scale: 0, 4, 18, 37, 53
Pilot scale: 0, 4, 9, 15, 25, 35, 38, 40
55/41
Table 2. Grist analysis performed with Prufsieb JEL 200 sieve shaker (average ± standard deviation).
Sieve Size (µm)Maltman® 75Industrial Mill
100068.5 ± 2.6%60.5 ± 0.2%
50013.5 ± 0.2%16.9 ± 1.6%
2507.4 ± 0.9%10.0 ± 0.2%
1602.5 ± 0.5%3.2 ± 0.5%
bottom8.0 ± 1.4%9.3 ± 1.2%
Table 3. Malt properties.
AnalysisCertified by SupplierMeasured with GlycoSpot Kit
(Average ± Standard Deviation)
α-Amylase, DU4452 ± 7
Diastatic power, WK254264 ± 19
Total N, % of dry matter1.73-
Kolbach index, %37-
Friability, %91.8-
β-glucan in wort, mg/L155-
Table 4. Pilot scale wort and beer analysis (average ± standard deviation). n.d. = not detected.
AnalysisOriginal ProfileNew Profile:
50 °C, 5 min → 63 °C, 20 min
Kettle-Full WortFinal BeerKettle-Full WortFinal Beer
1st Tank2nd Tank1st Tank2nd Tank
FAN, ppm107.5 ± 0.949.0 ± 0.846.5 ± 2.7104.7 ± 4.868.7 ± 0.670.2 ± 3.3
Maltose, g/L46.4 ± 7.1n.d.n.d.41.5 ± 4.0n.d.n.d.
Maltotriose, g/L11.1 ± 1.8n.d.n.d.12.0 ± 1.3n.d.n.d.
Glucose, g/L5.35 ± 1.1n.d.n.d.6.4 ± 0.3n.d.n.d.
Gravity, °Plato9.282.162.329.292.482.60
Ethanol, %ABV-4.09 ± 0.064.09 ± 0.02-4.21 ± 0.064.01 ± 0.08
Attenuation, %-77.575.9-74.473.2
Foam stability, s-191 ± 7-265 ± 8
Publisher’s Note: MDPI stays neutral with regard to jurisdictional claims in published maps and institutional affiliations.

