
Absorbance Spectroscopy of Heads, Hearts and Tails Fractions in Fruit Spirits


Yeast Genetics and Fermentation Technology, Institute of Food Science and Biotechnology, University of Hohenheim, Garbenstraße 23, 70599 Stuttgart, Germany
*
Author to whom correspondence should be addressed.
Beverages 2021, 7(2), 21; https://0-doi-org.brum.beds.ac.uk/10.3390/beverages7020021
Submission received: 26 March 2021
/
Revised: 16 April 2021
/
Accepted: 20 April 2021
/
Published: 21 April 2021
(This article belongs to the Section Sensory Analysis of Beverages)
Abstract
:There is a large economic interest to characterize heads, hearts and tails fractions during fruit spirit distillation by simple, fast, low-volume and low-cost analytical methods. This study evaluated the potential of ultraviolet (UV)-visible-infrared spectroscopy (230–1000 nm) to characterize and differentiate these distillate fractions. Heads, hearts and tails fractions of 10 different fruit spirits were separated by sensory evaluation and investigated by absorbance spectroscopy. Principal component analysis indicated that UV spectroscopy at a wavelength range from 230 to 310 nm had the highest potential to differentiate all three distillate fractions. While all tails fractions showed significantly different UV spectra, a clear differentiation between heads and hearts fractions was limited. However, an additional UV spectroscopy of 100 mL subfractions sampled during the shift from heads to hearts in three additional distillations did reveal significant differences. The calculated integrals of the according best-fit trendline functions of the spectra indicated a trend towards reduced area-under-the-curve and zero-point values during the shift. This could be a new lead to implement an analytical method for in-line process control during fruit spirit production.
1. Introduction
Fruit spirit production with common thermal rectification technique is characterized by separation (cut) of the produced distillate into the three main fractions of the heads, hearts and tails. This is performed in order to separate fermentative volatiles with negative aroma attributes in heads and tails from the value product (hearts). Up to now, the decision about when to perform a fractionating cut was mainly made by sensory evaluation [1,2,3]. This is due to the fact that heads and tails contain characteristic fermentative volatiles with certain aroma attributes that can be perceived by distillate manufacturers. The heads fraction contains low boiling point compounds, for instance, acetaldehyde and ethyl acetat, which give a strong unpleasant and pungent flavor. The tails fraction contains high concentrations of fusel oils, such as propyl, butyl and amyl alcohols and their isomers. These tails compounds are also associated with unpleasant aroma attributes [4,5]. Spaho [5] (p. 134) also stated that “taste and smell still remain the most reliable method of determining when to make a cut”.
The perception of taste and odor attributes is, however, subject to individual anatomical differences and requires extended experience. In addition, anatomical changes occur during human aging in all the senses involved in food perception. On average, seniors perceive a lower flavor intensity than younger adults and they are less sensitive to changes in the flavor profile of foods [6]. Overall, there is a large industrial interest to introduce simple, fast, low-volume and low-cost analytical methods to perform reliable cut determinations. Such rapid analysis requirements seem to be present in spectroscopic analysis methods.
In the last decades, different spectroscopic methods were introduced to determine spirit authenticity [7,8,9], origin [10,11] and spirit compounds [12,13]. As described in other studies, ultraviolet (UV)-visible spectroscopy can characterize beverage samples as a vector of absorbance, which can be considered a fingerprint of that sample [14,15,16]. So far, all scientific spectroscopic investigations of spirits have focused on the value product. To the best of our knowledge, spectroscopic analysis has not been performed for the characterization of different distillate fractions besides the value product.
The aim of this study was to identify the potential to differentiate heads, hearts and tails fractions of fruit spirits by absorbance spectroscopy. In an additional approach, we investigated distillate subfractions collected during the shift from heads to hearts. The latter focused on the hypothesis that the absorbance spectra might change during this shift in batch distillation processes.
2. Materials and Methods
2.1. Mash Fermentation
Fruit juices were obtained from Kumpf Fruchtsaft GmbH & Co. KG (Markgröningen, Germany). Fruits were ordered from Hofmann Dambacher GbR (Filderstadt, Germany). Water-cleaned fruits were mashed and placed in sanitized plastic drums (Mauser Packaging Solutions, Oak Brook, IL, USA) for fermentation. Apples and pears were milled with a fruit grinder (800-R, Max Baldinger AG, Rümikon, Switzerland), while plums and peaches were thoroughly mixed with a mixing drill (product no. 6681, Schliessmann, Schwäbisch Hall, Germany) with attention to reduced seed abrasion or destruction. Fruits and juices were analyzed for soluble sugar contents by a handheld refractometer (Carl Zeiss, Jena, Germany) with a range of 0–32° Brix (Table 1). All substrates were pH adjusted to 3.3 ± 0.1, adding a phosphoric and lactic acid mixture (product no. 5862, Schliessmann, Schwäbisch Hall, Germany) and inoculated with selected Sacharomyces cerevisiae yeast strains (Aroma Plus, product no 5828, Schliessmann, Schwäbisch Hall, Germany). Juice and fruit mashes fermented for 11 and 30 ± 3 days, respectively, at 20 °C room temperature and indicated a residual sugar content of ≤1° Brix.
2.2. Distillation
In regard to the different mash volumes, juice mashes (No. 1–6) were distilled with a 20 L column still (Jacob Carl, Eislingen, Germany) [1], while fruit mash (No. 7–13) distillations were performed with a 120 L column still (Carl GmbH, Eislingen, Germany). Both steam-heated stills were equipped with three trays, a dephlegmator (= partial condenser), a copper catalyzer, a product cooler (Figure 1) and temperature sensors. Distillate fractions were categorized for heads, hearts and tails by the sensory evaluation of two experienced distillers (male, age 35–48). The hearts to tails shift was linked with 87 ± 1 °C vapor pipe temperature. Ethanol concentrations of distillate fractions were determined in triplicates via density measurement (DMA 58, Anton Paar GmbH, Ostfildern, Germany).
Heads, hearts and tails fractions of distillates from mashes No. 1–10 were collected and analyzed for volatiles and UV-visible spectra. The distillates of mashes No. 11–13 were collected in 100 mL subfractions and analyzed for their specific spectral absorption. The first hearts subfraction was defined as f0 and regarded as the reference point, while prior heads or later hearts subfractions were labeled according to the volumetric difference; for instance, f-100 for heads subfraction sampled 100 mL prior to f0.
2.3. Volatiles Analysis
Volatile concentrations of 1-propanol, 2-propanol, acetaldehyde, acetone, ethyl acetate, isobutanol and methanol were determined in heads, hearts and tails fractions of mashes 1–10. All samples were adjusted to 40% (v/v) anhydrous alcohol (aa) and quantifications were performed in triplicates with a headspace gas chromatograph (GC-2010 Plus, Shimadzu Scientific Instruments, Kyoto, Japan) equipped with a flame ionization detector (FID) and a Rtx-Volatiles column (Restek Corp., Bellefonte, PA, USA). All standards for GC-FID analysis were obtained from Merck KGaA (Darmstadt, Germany) to perform the five-point standard calibrations (R2 ≥ 0.99).
2.4. Absorbance Spectroscopy of Distillate Fractions
Absorbance spectroscopy of distillate fractions was performed with a Tecan Infinite 200PRO (TECAN, Zurich, Switzerland) microplate reader. The spectra were recorded in a 230–1000 nm wavelength range in steps of 5 nm. Three spectra were averaged for each sample. The spectral absorption of heads, hearts and tails fractions of mashes No. 1–10 were identified in 1:1 water dilution. Principal component analysis (PCA) of a total of 4620 data points was performed with statistical analysis software SPSS 25 (IBM Corp., Armonk, NY, USA) to identify the wavelength range of the absorbance spectra that explains the most data variance in heads, hearts and tails.
Additionally, the absorbance spectra of 100 mL heads and hearts subfractions of mashes No. 11–13 were identified with the same methodology in triplicates after water dilution to 40% (v/v) ethanol. To be able to define and compare changes in the absorbance spectra of the sub-fractions the best-fit ‘trendline’ of each graph was calculated with software Excel (Microsoft Office 2010, Microsoft Corporation, Redmond, DC, USA). The fit of the trendline was evaluated via R2 values, indicating the grade of value relevance between the trendline and the original absorbance spectrum. Subsequently, the function of the best-fit trendline was used for integration. The integral of the best-fit trendline function was calculated using the limits of the specific absorbance spectrum as lower and upper bound, which represents the area-under-the-(absorbance)-curve. In addition, the zero point of the best-fit trendline function was evaluated. The area and zero point of the best-fit trendline were determined and compared between subfraction samples f-300 to f+200. Significance tests were performed with SPSS 25 one-way analysis of variance (ANOVA) with the Tukey post hoc test on a significance level of p < 0.05.
3. Results and Discussion
3.1. Ethanol Yields
The distillate products of 13 fruit mashes were separated by heads, hearts and tails. They showed a specific total ethanol yield of 4.1–8.6% (v/v) based on the mash volume (Table 2). The heads/hearts/tails ethanol ratio was 0.12 ± 0.05:0.70 ± 0.05:0.18 ± 0.04. As expected, the hearts fraction held the highest share in every distillate product and showed ethanol concentrations of 82.9–88.8% (v/v) aa. The mash-specific total ethanol yields were higher than proposed by the German custom authority [17] with 3.5% (v/v) for peaches, 3.6% (v/v) for apples, pears and apple juice, 4.6% (v/v) for zwetschge plums, 4.8% (v/v) for mirabelle plums and 6.0% (v/v) for grape juice. This is likely due to originally higher soluble sugar contents in the fruits compared to average values [18,19,20].
3.2. Volatiles Composition
Table 3 shows the volatiles composition in heads, hearts and tails. As expected, acetaldehyde and ethyl acetate concentrations significantly reduced from heads to hearts [21,22]. This indicated an efficient separation of both volatiles from the value product. Significantly higher 1-propanol concentrations were detected in hearts compared to heads. Isobutanol did not show significant differences between the three fractions. Methanol indicated a typical behavior for batch distillation processes with no significant difference between its concentration in heads, hearts and tails [1,5,23]. 2-propanol and acetone were only detected in small quantities in the present study.
3.3. Absorbance Spectroscopy
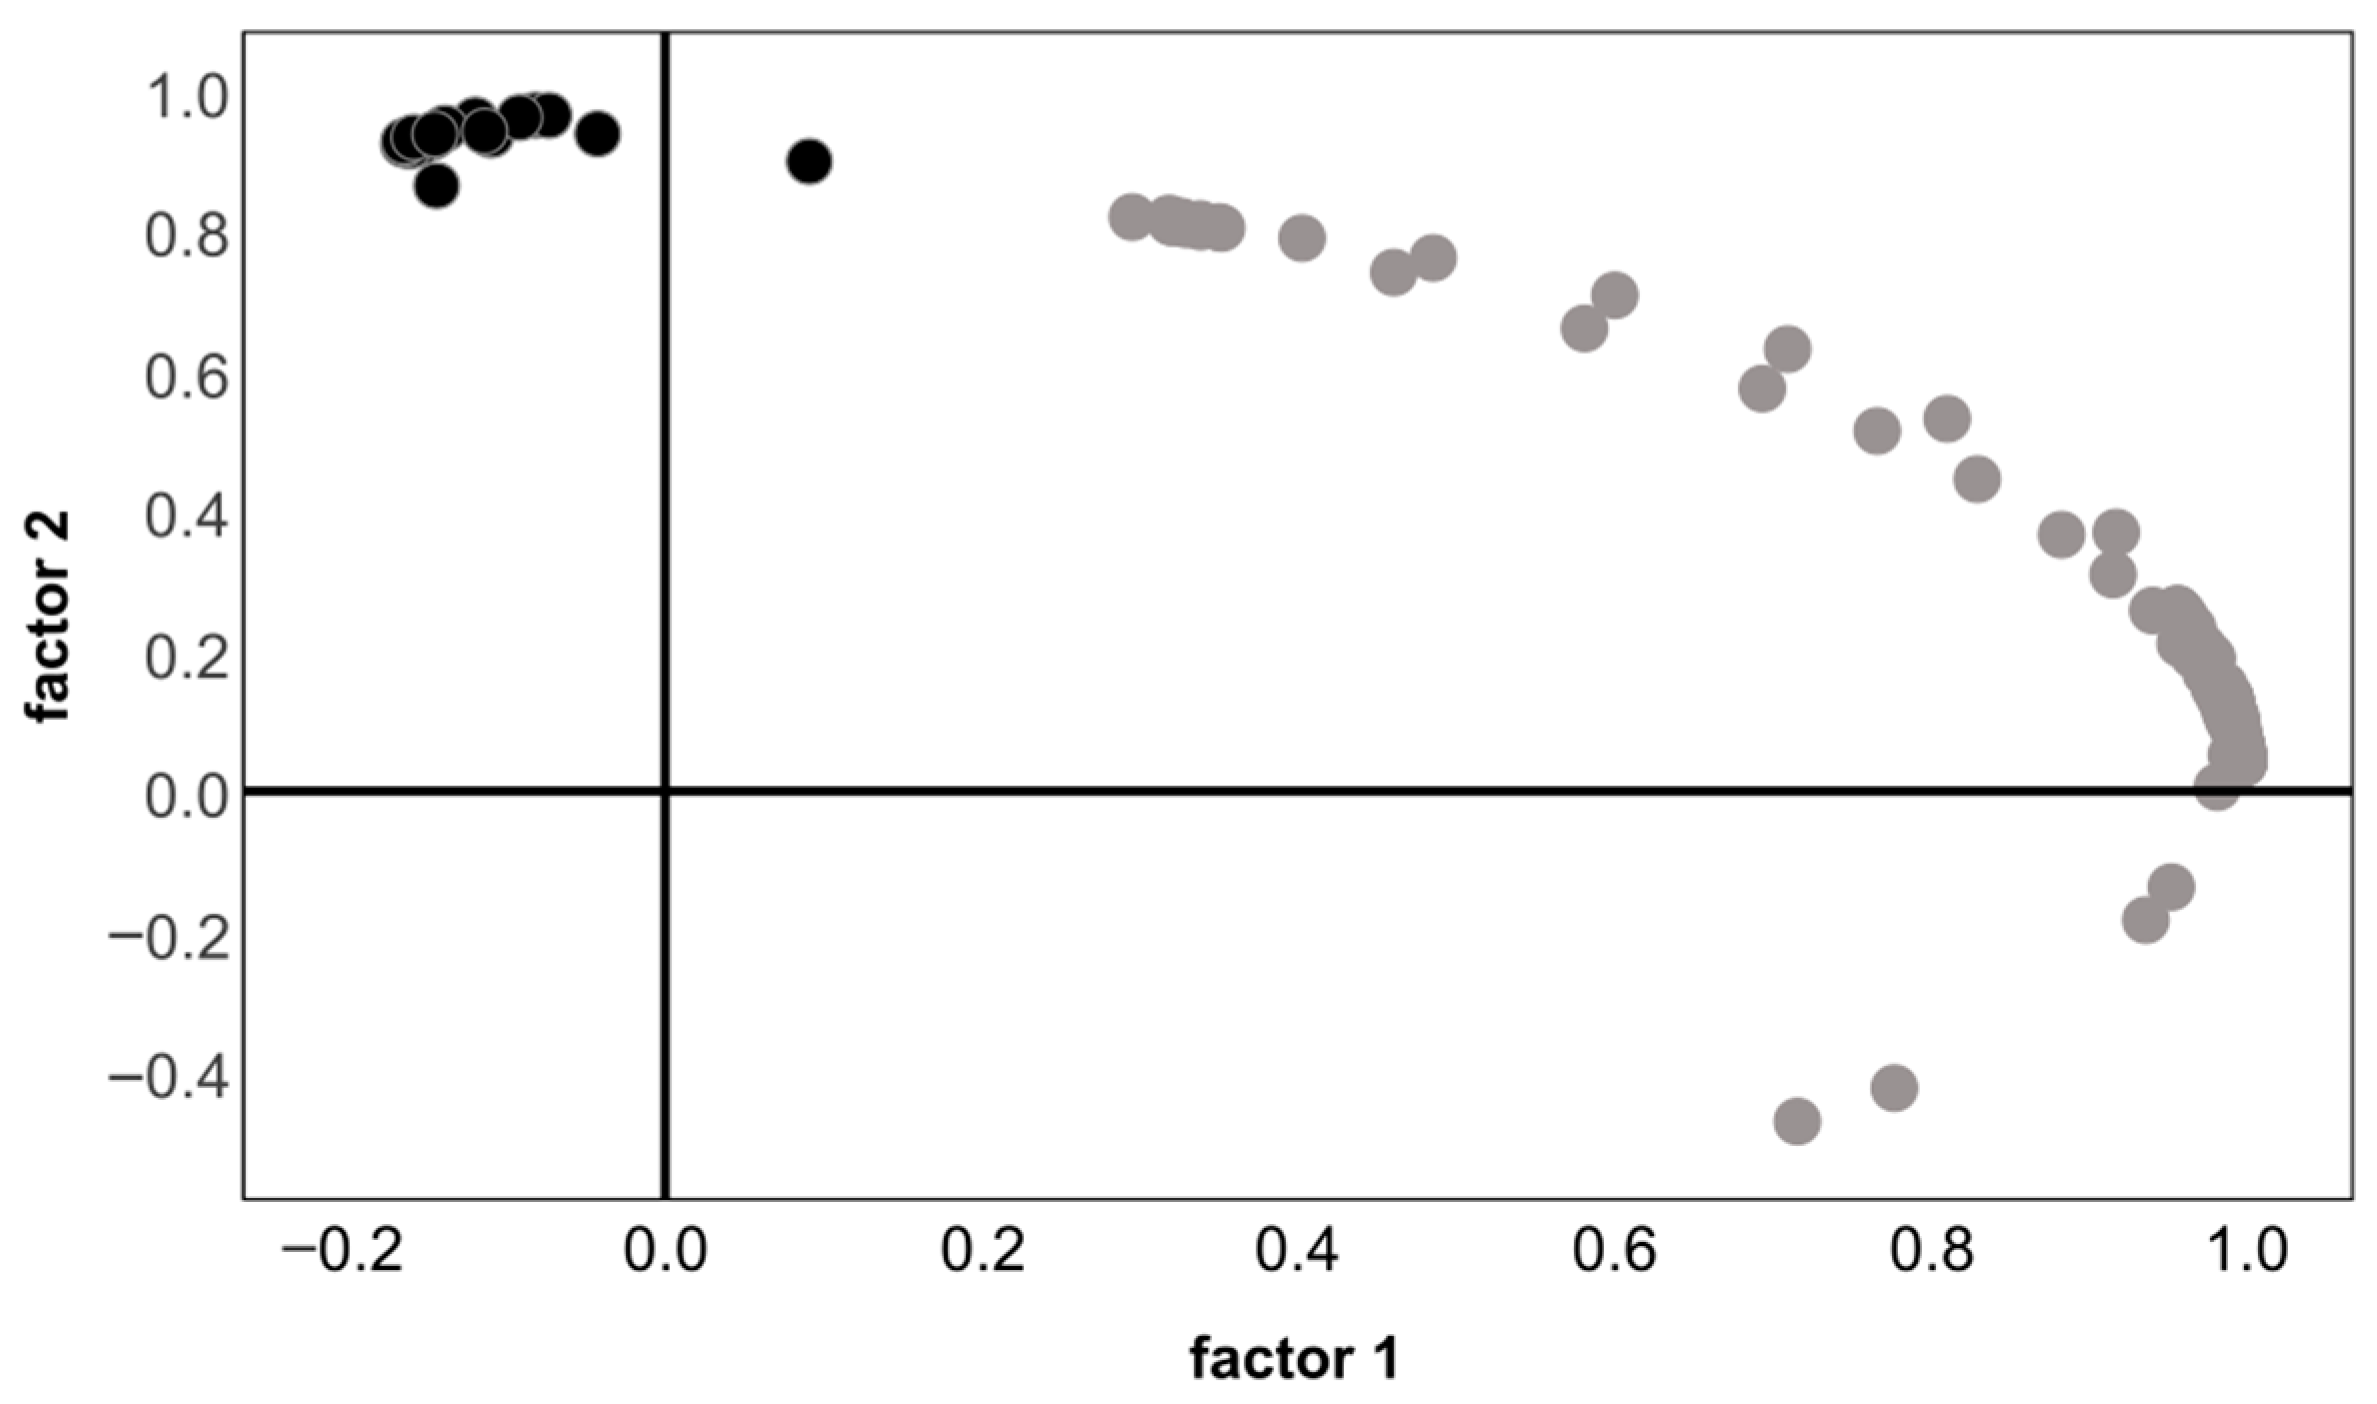
The PCA of absorbance data of heads, hearts and tails obtained wavelengths from 230 to 1000 nm and resulted in two main factors explaining 95.2% of the total data variance. Factor 1 explained 78.8% of the data variance and indicated a formation of two data groups (Figure 2). Factor 2 further explained 16.4% of the total data variance. The data points of absorbance spectra gained at wavelengths from 230 to 310 nm clearly separated from the other spectral data points as they gathered in an area <0.1 of factor 1 and >0.8 of factor 2. As this PCA pattern stood out against all other data points, we concluded that the wavelength range of 230–310 nm had the highest potential to differentiate heads, hearts and tails fractions by absorbance spectroscopy. Therefore, further analysis was performed with this UV wavelength spectrum. The results also match other scientific studies which identified the spectrum from 205 to 282 nm as the most relevant in terms of spirit comparison or spirit content analysis [14,15,24].
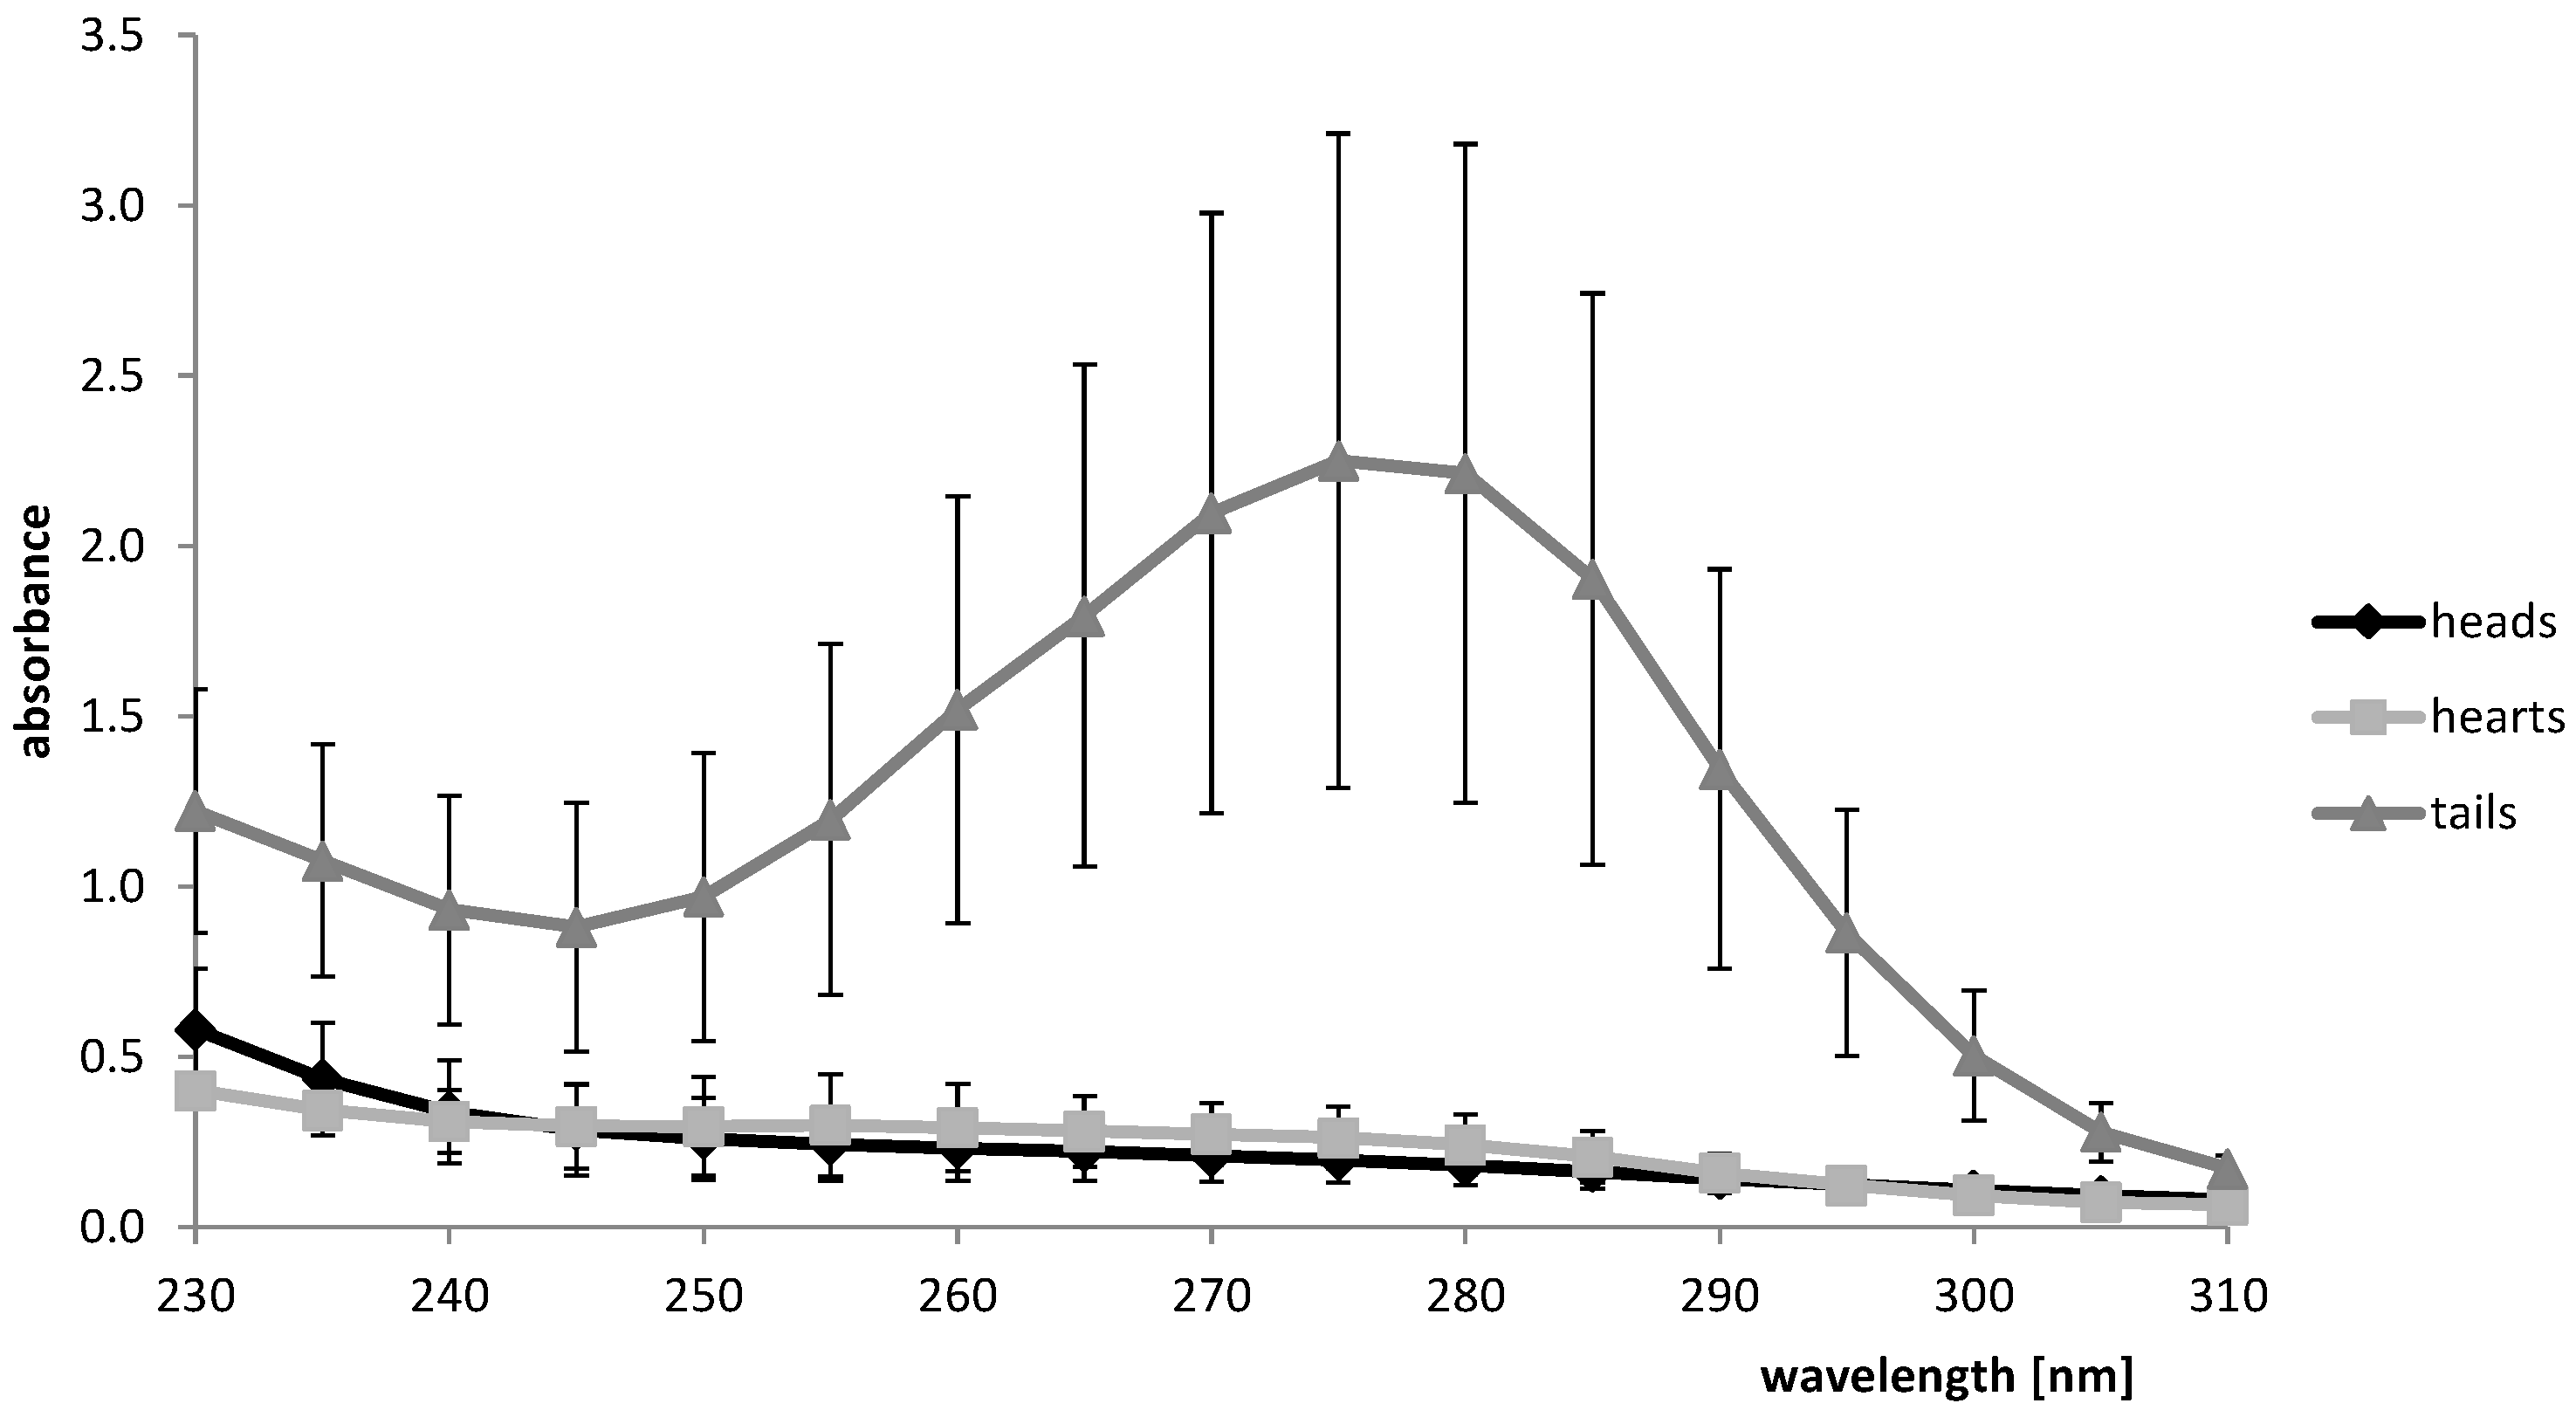
Figure 3 shows the UV absorbance spectra of heads, hearts and tails fractions collected from the distillates of mashes No. 1–10. Tails fractions showed a significantly stronger (Z ≥ −3.48; p ≤ 0.001) absorption intensity compared to heads and hearts fractions. This indicated that the tails fraction could clearly be determined from heads and hearts by simple UV spectroscopy methods. It is likely that this can be attributed to strongly reduced ethanol concentrations in the tails fractions. A significant difference between heads and hearts fractions was only determined at excitation wavelengths 230 nm (Z = −3.02; p = 0.002), 275 nm (Z = −2.04; p = 0.041) and 305 nm (Z = −2.46; p = 0.014). This indicated that a clear differentiation of the total heads and hearts fractions was limited in terms of absorbance spectroscopy at a wavelength spectrum from 230 to 310 nm. Therefore, subsequent experiments investigated the spectral absorbance in subfractions sampled during the shift from heads to hearts.
3.4. Subfraction Analysis
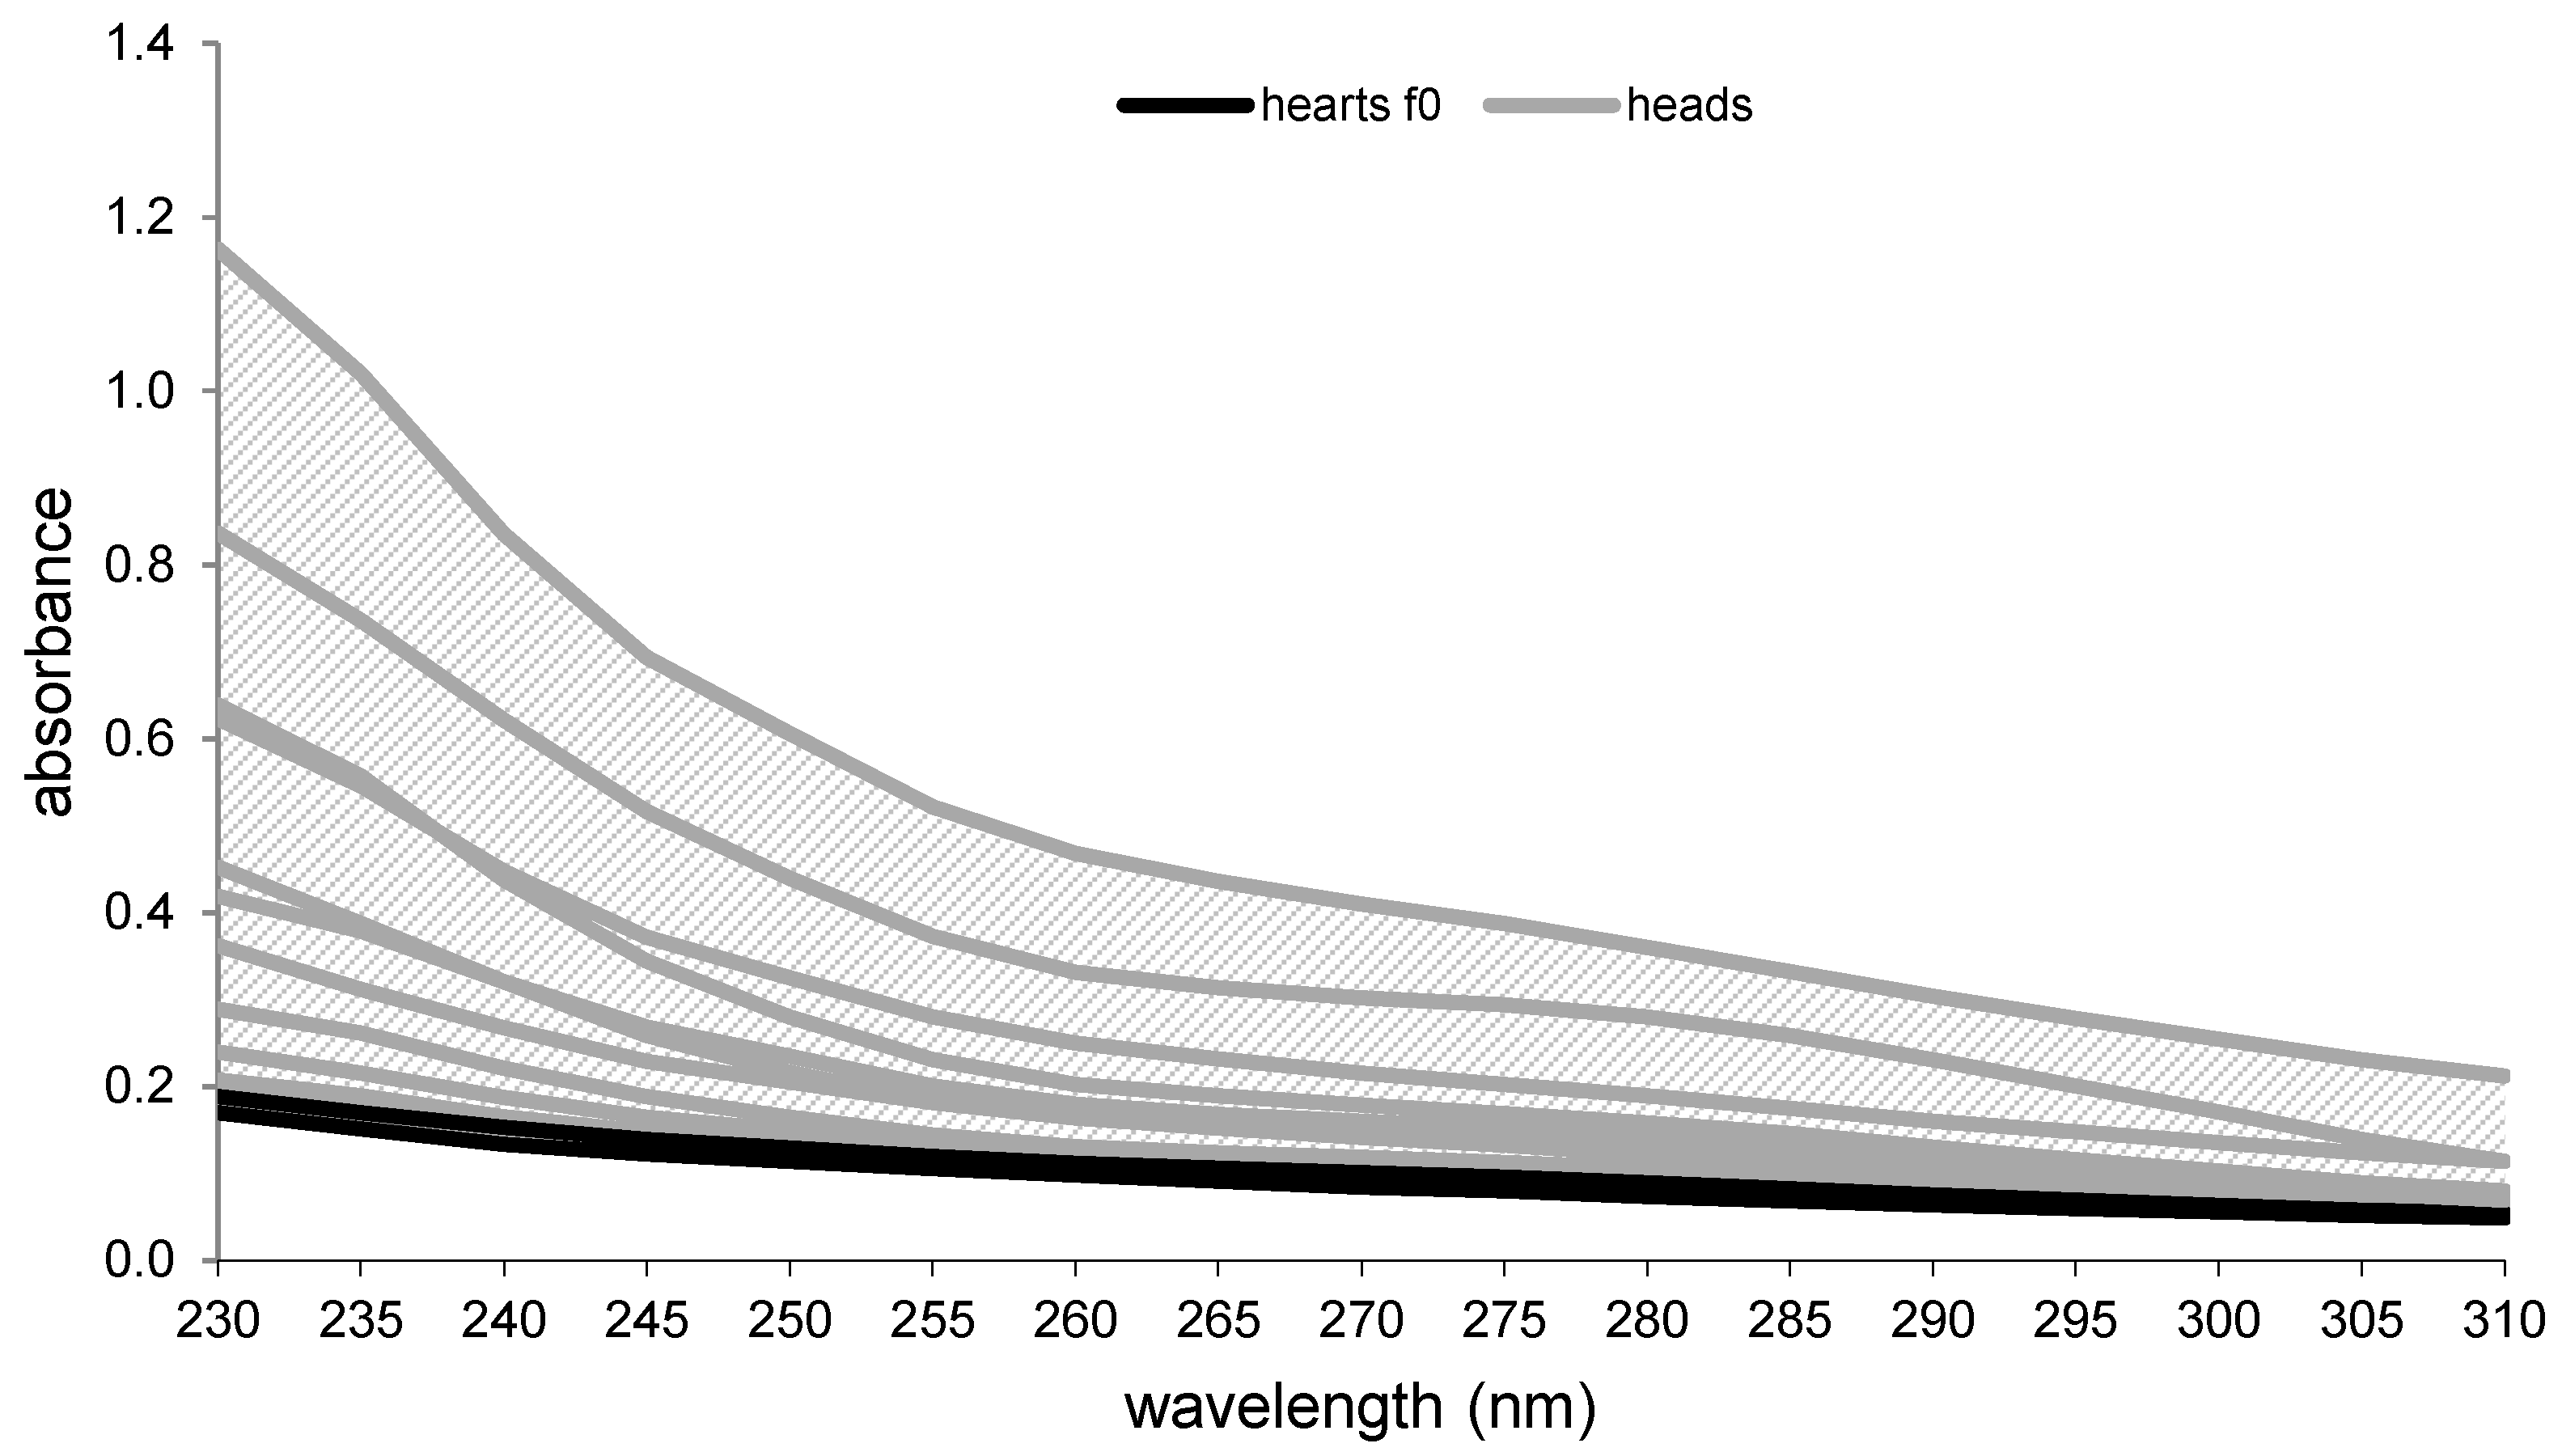
Mashes No. 11–13 were distilled and the spectral absorption analyzed for heads sub-fractions f-300, f-200 and f-100 and hearts subfractions f0, f+100 and f+200. Figure 4 shows the spectra of fractions f-300 to f0. The graphs visualized that the shift from heads subfractions to hearts subfraction was linked to a declining trend of the area-under-the-curve of the absorbance spectra. In addition, Table 4 shows the integrated area-under-the-curve values and zero-point values of the calculated best-fit trendline. The best-fit trendline was evaluated as the exponential function of the absorbance spectra (R2 ≥ 0.98). The first hearts fraction f0 was linked to an area of 7.9 ± 0.5 and a zero point of 5.9 ± 1.3. Significant differences in area and zero-point values were found between subfraction f-300 and all other subfractions. The results from Figure 4 and Table 4 indicate that the spectra and the calculated integrals are linked to a reduction of the area-under-the-curve and the zero-point values during the shift from the heads to hearts fraction. This declining trend may be of importance for future research work, which could investigate the compounds responsible for fluorescence [9] in the heads fraction such as acetaldehyde and ethyl acetate.
4. Conclusions
Absorbance spectroscopy has become a powerful tool for fast quality assurance analysis in the food industry. With success in implementing this tool in distillate fraction analysis, it is likely that it will gain more applications in the fruit spirit producing industry. The obtained data showed that different distillation fractions were indeed distinguishable by their absorbance spectra. The investigated wavelength spectra of the tested tails fractions were all significantly different from the heads and hearts fractions. Therefore, absorbance spectroscopy has the potential to clearly differentiate tails fractions from heads and hearts fractions. In contrast, the collected heads and hearts fractions showed limited spectral differences. However, a more detailed analysis of subfractions during the shift from heads to hearts fraction did show significantly different spectra. Furthermore, the calculated integrals of the according best-fit trendlines of the spectra indicated a declining trend towards reduced area-under-the-curve and zero-point values during the shift from heads to hearts fractions. This could be a new lead to implement a simple, fast, low-volume and low-cost analytical method for in-line process control during fruit spirit production.
Author Contributions
Conceptualization, D.E.; Data curation, J.B. and S.R.; Methodology, D.E.; Project administration, D.E.; Supervision, D.E.; Visualization, D.E.; Writing—original draft, D.E.; Writing—review & editing, L.H. and D.H. All authors have read and agreed to the published version of the manuscript.
Funding
This research received no external funding.
Acknowledgments
The authors are grateful for the analytical and technical support by Julia Asch, Julia Pesl and Oliver Reber.
Conflicts of Interest
The authors declares no conflict of interest.
References
- Einfalt, D.; Meissner, K.; Kurz, L.; Intani, K.; Müller, J. Fruit Spirit Production from Coffee Cherries—Process Analysis and Sensory Evaluation. Beverages 2020, 6, 57. [Google Scholar] [CrossRef]
- García-Llobodanin, L.; Roca, J.; López, J.R.; Pérez-Correa, J.R.; López, F. The lack of reproducibility of different distillation techniques and its impact on pear spirit composition. Int. J. Food Sci. Technol. 2011, 46, 1956–1963. [Google Scholar] [CrossRef]
- Spaho, N.; Dürr, P.; Grba, S.; Velagić-Habul, E.; Blesić, M. Effects of distillation cut on the distribution of higher alcohols and esters in brandy produced from three plum varieties. J. Inst. Brew. 2013, 119, 48–56. [Google Scholar] [CrossRef]
- Jacques, K.A.; Lyons, T.P.; Kelsall, D.R. The Alcohol Textbook, 4th ed.; Nottingham University Press: Nottingham, UK, 2003. [Google Scholar]
- Spaho, N. Distillation Techniques in the Fruit Spirits Production. In Distillation-Innovative Applications and Modeling; Mendes, M., Ed.; IntechOpen: London, UK, 2017; pp. 129–152. [Google Scholar]
- Doets, E.L.; Kremer, S. The silver sensory experience—A review of senior consumers’ food perception, liking and intake. Food Qual. Prefer. 2016, 48, 316–332. [Google Scholar] [CrossRef]
- Sádecká, J.; Tóthová, J.; Májek, P. Classification of brandies and wine distillates using front face fluorescence spectroscopy. Food Chem. 2009, 117, 491–498. [Google Scholar] [CrossRef]
- Tóthová, J.; Sadecka, J.; Májek, P. Total luminescence spectroscopy for differentiating between brandies and wine distillates. Czech J. Food Sci. 2009, 27, 425–432. [Google Scholar] [CrossRef] [Green Version]
- Tomková, M.; Sádecká, J.; Hroboňová, K. Synchronous Fluorescence Spectroscopy for Rapid Classification of Fruit Spirits. Food Anal. Methods 2014, 8, 1258–1267. [Google Scholar] [CrossRef]
- Sádecká, J.; Uríčková, V.; Hroboňová, K.; Májek, P. Classification of Juniper-Flavoured Spirit Drinks by Multivariate Analysis of Spectroscopic and Chromatographic Data. Food Anal. Methods 2014, 8, 58–69. [Google Scholar] [CrossRef]
- Sádecká, J.; Jakubíková, M.; Májek, P.; Kleinová, A. Classification of plum spirit drinks by synchronous fluorescence spectroscopy. Food Chem. 2016, 196, 783–790. [Google Scholar] [CrossRef] [PubMed]
- Dambergs, R.G.; Kambouris, A.; Francis, I.L.; Gishen, M. Rapid Analysis of Methanol in Grape-Derived Distillation Products Using Near-Infrared Transmission Spectroscopy. J. Agric. Food Chem. 2002, 50, 3079–3084. [Google Scholar] [CrossRef] [PubMed]
- Anjos, O.; Santos, A.J.; Estevinho, L.M.; Caldeira, I. FTIR–ATR spectroscopy applied to quality control of grape-derived spirits. Food Chem. 2016, 205, 28–35. [Google Scholar] [CrossRef] [PubMed] [Green Version]
- Boggia, R.; Casolino, M.C.; Hysenaj, V.; Oliveri, P.; Zunin, P. A screening method based on UV–Visible spectroscopy and multivariate analysis to assess addition of filler juices and water to pomegranate juices. Food Chem. 2013, 140, 735–741. [Google Scholar] [CrossRef] [PubMed]
- Martins, A.R.; Talhavini, M.; Vieira, M.L.; Zacca, J.J.; Braga, J.W.B. Discrimination of whisky brands and counterfeit identification by UV–Vis spectroscopy and multivariate data analysis. Food Chem. 2017, 229, 142–151. [Google Scholar] [CrossRef] [PubMed]
- Li, X.; Tsuta, M.; Tanaka, F.; Tsukahara, M.; Tsukahara, K. Assessment of Japanese Awamori Spirits Using UV–VIS Spectroscopy. Food Anal. Methods 2020, 13, 726–734. [Google Scholar] [CrossRef]
- German Customs, Abfindungs- und Stoffbesitzerbrennen—Zugelassene Rohstoffe (§§ 9 und 11 Alkoholsteuergesetz) und Festgelegte Amtliche Ausbeutesätze; Generalzolldirektion: Bonn, Germany, 2018.
- Mukarev, M.I.; Walsh, K.B. Prediction of Brix Values of Intact Peaches with Least Squares-Support Vector Machine Regression Models. J. Near Infrared Spectrosc. 2012, 20, 647–655. [Google Scholar] [CrossRef]
- Sahamishirazi, S.; Moehring, J.; Claupein, W.; Graeff-Hoenninger, S. Quality assessment of 178 cultivars of plum regarding phenolic, anthocyanin and sugar content. Food Chem. 2017, 214, 694–701. [Google Scholar] [CrossRef] [PubMed]
- Tewari, J.; Joshi, M.; Gupta, A.; Mehrotra, R.; Chandra, S. Determination of Sugars and Organic Acid Concentration in Apple Juices Using Infrared Spectroscopy. J. Sci. Ind. Res. 1999, 58, 19–24. [Google Scholar]
- Claus, M.J.; Berglund, K.A. Fruit brandy production by batch dolumn distillation with reflux. J. Food Process Eng. 2005, 28, 53–67. [Google Scholar] [CrossRef]
- García-Llobodanin, L.; Senn, T.; Ferrando, M.; Güell, C.; López, F. Influence of the fermentation pH on the final quality of Blanquilla pear spirits. Int. J. Food Sci. Technol. 2010, 45, 839–848. [Google Scholar] [CrossRef]
- Faletar, J.; Blesic, M.; Smajic, M.; Begic-Akagic, A.; Alihodzic, A.; Spaho, N. Dynamics of Evaporation of Certain Volatiles during Plum Brandy Distillation. In Proceedings of the 24th International Scientific-Expert-Conference of Agriculture and Food Industry, Sarajevo, Bosnia and Herzegovina, 25–28 September 2013. [Google Scholar]
- Boscolo, M.; Andrade-Sobrinho, L.G.; Lima-Neto, B.S.; Franco, D.W.; Ferreira, M.M.C. Spectrophotometric determination of caramel content in spirits aged in oak casks. J. Assoc. Off. Anal. Chem. 2002, 85, 744–750. [Google Scholar] [CrossRef] [Green Version]
Figure 1.
Schematic drawing of both column stills equipped with three trays (a), dephlegmator (b), copper catalyzer (c) and product cooler (d), thin dashed arrow line = vapor phase.
Figure 1.
Schematic drawing of both column stills equipped with three trays (a), dephlegmator (b), copper catalyzer (c) and product cooler (d), thin dashed arrow line = vapor phase.

Figure 2.
Principal component analysis of absorbance spectra of heads, hearts and tails fractions gained from distillates of mashes No. 1–10. Factor 1 explains 78.8% of the data variance. Factor 2 explains 16.4% of the data variance (cumulated = 95.2%). Wavelengths 230–310 nm (black), wavelengths 315–1000 nm (grey).

Figure 3.
Ultraviolet absorbance spectra of heads, hearts and tails fractions gained from distillates of mashes No. 1–10. Each graph indicates the average spectrum with standard deviation (n = 10).
Figure 3.
Ultraviolet absorbance spectra of heads, hearts and tails fractions gained from distillates of mashes No. 1–10. Each graph indicates the average spectrum with standard deviation (n = 10).

Figure 4.
Absorbance spectra of 100 mL subfractions of heads (grey) and first hearts fraction f0 (black). Each line indicates the average spectrum. Standard deviation ≤0.01.
Figure 4.
Absorbance spectra of 100 mL subfractions of heads (grey) and first hearts fraction f0 (black). Each line indicates the average spectrum. Standard deviation ≤0.01.


Table 1.
Overview of substrates for mash preparation.
| Mash No. | Substrate | Extract (°Brix) | Mash Volume (L) |
|---|---|---|---|
| 1 | apple juice | 13.4 | 20 |
| 2 | apple juice | 13.4 | 20 |
| 3 | apple juice | 13.4 | 20 |
| 4 | grape juice | 16.9 | 20 |
| 5 | grape juice | 16.9 | 20 |
| 6 | grape juice | 16.9 | 20 |
| 7 | zwetschge plum | 14.3 | 88 |
| 8 | peach | 11.4 | 90 |
| 9 | mirabelle plum | 19.2 | 92 |
| 10 | pear | 11.9 | 120 |
| 11 | pear | 11.7 | 100 |
| 12 | apple ‘Jona Gold’ | 13.6 | 98 |
| 13 | apple ‘Jona Gold’ | 13.6 | 93 |
Table 2.
Ethanol yields of heads, hearts and tails fractions. Ethanol concentrations determined in triplicates. Standard deviation ≤0.01.
Table 2.
Ethanol yields of heads, hearts and tails fractions. Ethanol concentrations determined in triplicates. Standard deviation ≤0.01.
| Mash No. | Heads | Hearts | Tails | Total Ethanol Yield Based on 100 L Mash | |||
|---|---|---|---|---|---|---|---|
| Volume | Ethanol | Volume | Ethanol | Volume | Ethanol | ||
| L | % (v/v) aa | L | % (v/v) aa | L | % (v/v) aa | % (v/v) | |
| 1 | 0.30 | 82.0 | 0.95 | 84.8 | 0.55 | 53.3 | 6.7 |
| 2 | 0.35 | 82.7 | 1.05 | 83.3 | 0.38 | 42.3 | 6.6 |
| 3 | 0.28 | 84.1 | 0.93 | 87.3 | 0.70 | 37.8 | 6.5 |
| 4 | 0.25 | 83.1 | 1.40 | 88.8 | 0.50 | 55.4 | 8.6 |
| 5 | 0.25 | 80.9 | 1.40 | 88.4 | 0.40 | 63.2 | 8.5 |
| 6 | 0.20 | 81.9 | 1.40 | 87.2 | 0.55 | 61.7 | 8.6 |
| 7 | 0.39 | 86.0 | 4.00 | 84.6 | 2.50 | 35.2 | 5.2 |
| 8 | 0.65 | 88.7 | 3.00 | 84.4 | 1.30 | 44.6 | 4.1 |
| 9 | 0.55 | 80.9 | 5.10 | 85.6 | 1.80 | 37.1 | 6.0 |
| 10 | 0.99 | 87.3 | 6.00 | 82.9 | 2.50 | 45.0 | 5.8 |
| 11 | 0.50 | 87.1 | 4.50 | 85.3 | 3.20 | 39.0 | 5.5 |
| 12 | 0.40 | 85.9 | 5.10 | 84.0 | 2.60 | 55.0 | 6.2 |
| 13 | 0.40 | 92.6 | 5.70 | 85.4 | 2.50 | 44.3 | 6.9 |
aa = anhydrous alcohol.
Table 3.
Volatiles in distillate fractions of mashes No. 1–10.
| Substance | Heads | Hearts | Tails |
|---|---|---|---|
| 1-propanol | 0.5 ± 0.1 a | 1.5 ± 0.6 b | 0.7 ± 0.3 ab |
| 2-propanol | <0.1 | <0.1 | <0.1 |
| acetaldehyde | 1.2 ± 0.5 a | 0.1 ± 0.1 b | 0.1 ± 0 b |
| acetone | <0.1 | <0.1 | <0.1 |
| ethyl acetate | 4.7 ± 1.9 a | 0.3 ± 0.1 b | 0.1 ± 0.0 b |
| isobutanol | 0.3 ± 0.2 a | 0.6 ± 0.2 a | 0.5 ± 0.1 a |
| methanol | 8.8 ± 5.7 a | 5.3 ± 3.2 a | 7.3 ± 4.5 a |
Different superscript letters within each row indicate significant differences (Tukey tests: p < 0.05). Unit in g/L aa.
Table 4.
Area-under-the-product absorbance curve and zero-point values of the calculated integrals. Integrals were evaluated via the according exponential function of heads and hearts subfraction spectra (n = 3) with a lower bound of 230 and an upper bound of 310.
Table 4.
Area-under-the-product absorbance curve and zero-point values of the calculated integrals. Integrals were evaluated via the according exponential function of heads and hearts subfraction spectra (n = 3) with a lower bound of 230 and an upper bound of 310.
| Distillate Fraction | Fraction Label | Area | Zero Point |
|---|---|---|---|
| heads | f − 300 | 20.7 ± 4.9 a | 70.2 ± 32.8 a |
| f − 200 | 13.0 ± 4.1 b | 24.5 ± 18.1 b | |
| f − 100 | 9.9 ± 1.4 b | 11.2 ± 5.5 b | |
| hearts | f0 | 7.9 ± 0.5 b | 5.9 ± 1.3 b |
| f + 100 | 7.3 ± 0.8 b | 5.5 ± 1.4 b | |
| f + 200 | 8.0 ± 0.5 b | 4.6 ± 0.6 b |
Data with different superscript letters within each column are significantly different (Tukey tests: p < 0.05).
Publisher’s Note: MDPI stays neutral with regard to jurisdictional claims in published maps and institutional affiliations. |
© 2021 by the authors. Licensee MDPI, Basel, Switzerland. This article is an open access article distributed under the terms and conditions of the Creative Commons Attribution (CC BY) license (https://creativecommons.org/licenses/by/4.0/).
Share and Cite
MDPI and ACS Style
Bohn, J.; Roj, S.; Hoppert, L.; Heller, D.; Einfalt, D. Absorbance Spectroscopy of Heads, Hearts and Tails Fractions in Fruit Spirits. Beverages 2021, 7, 21. https://0-doi-org.brum.beds.ac.uk/10.3390/beverages7020021
AMA Style
Bohn J, Roj S, Hoppert L, Heller D, Einfalt D. Absorbance Spectroscopy of Heads, Hearts and Tails Fractions in Fruit Spirits. Beverages. 2021; 7(2):21. https://0-doi-org.brum.beds.ac.uk/10.3390/beverages7020021
Chicago/Turabian StyleBohn, Jens, Simon Roj, Luis Hoppert, Daniel Heller, and Daniel Einfalt. 2021. "Absorbance Spectroscopy of Heads, Hearts and Tails Fractions in Fruit Spirits" Beverages 7, no. 2: 21. https://0-doi-org.brum.beds.ac.uk/10.3390/beverages7020021
Note that from the first issue of 2016, this journal uses article numbers instead of page numbers. See further details here.