
Adapting Polarized Projective Mapping to Investigate Fruitiness Aroma Perception of White Wines from Oregon


Department of Food Science & Technology, Oregon State University, Corvallis, OR 97333, USA
*
Author to whom correspondence should be addressed.
Beverages 2021, 7(3), 46; https://0-doi-org.brum.beds.ac.uk/10.3390/beverages7030046
Submission received: 29 April 2021
/
Revised: 29 May 2021
/
Accepted: 22 June 2021
/
Published: 5 July 2021
(This article belongs to the Special Issue Feature Papers in Sensory Analysis of Beverages Section)
Abstract
:Fruitiness is a highly desirable aroma quality in white wines. This study aimed to investigate the fruitiness aroma perception of white wines using a rapid sensory method and to compare the sensory maps obtained from wine experts and trained consumers. A polarized projective mapping (PPM) method was adapted by using fruit standards as fixed poles. Twenty-one white wines were selected for this study. Ten wine experts and twelve trained consumers participated in the adapted PPM followed by ultra-flash profiling (UFP). While experts and trained consumers used different poles to characterize the Pinot Gris and Viogniers, both panels used the stone fruit pole for the Chardonnays. UFP revealed that the Pinot Gris and Viognier samples presented fruity and floral aromas and most Chardonnay wines presented non-fruity aromas. The white wines investigated presented a wide range of fruity aromas. The use of aroma standards instead of products as poles seems to be a reliable alternative to investigate fruitiness in white wines. This study helped us to understand the predominant aromas of varietal white wines from Oregon and emphasized the importance of adapting sensory methods to investigate fruitiness perception.
1. Introduction
Fruitiness is a highly desired sensory quality of white wine aroma [1,2,3]. Rapid and holistic descriptive methods have become more and more common to determine the sensory aspects of wine. In past years, traditional descriptive methods, such as descriptive analysis (DA), were the principal methodology used to measure human stimuli perception to the sensory characteristics of wine [4]. While DA is undoubtedly a reliable method, the long hours of training and expense make it unattractive and unaffordable in many scenarios [5]. Novel sensory techniques, such as projective mapping or Napping® [6] and polarized sensory positioning (PSP) [7], offer a holistic approach. They are rapid, low-cost, require little or no training and can be used with both trained and naïve subjects [5,8]. Several studies have used Napping® [9,10,11,12] and PSP [13] to gather descriptive information about wine aroma. Although these two techniques present valuable results, they entail two main disadvantages: the number of samples per session in Napping® and the descriptive information in PSP are very limited [14].
Polarized projective mapping (PPM) is a novel sensory method that combines the positive aspects of Napping® and PSP [14]. In PPM, three reference samples or poles are placed at fixed positions on a paper sheet. Assessors are asked to evaluate the poles and samples and place the samples on the paper sheet according to their similarities and differences to the poles and the samples themselves [14]. In this scheme, samples that are similar to one another are placed close together, and dissimilar samples are placed farther apart. The main advantage of PPM over Napping® and PSP is that this method enables the comparison of product maps of different sensory sessions if the same poles are used. In addition to this, PPM can be paired with ultra-flash profiling (UFP) to allow the collection of more elaborate descriptive information of the samples than PSP. Despite the feasibility of this method, to date, PPM has been applied only to powdered drinks [14,15,16], meat products [17] and one study evaluating white wines [18].
Although all sensory studies using PPM have used three poles [14,15,16,17,18], there is no clear specification of the number of poles used in PSP [19]. Typically, the selection of poles for PPM is done after the sensory space is analyzed using Napping® [14], in which the best poles generally are the products closest to the center of each cluster [19]. The use of poles in PPM comes from the PSP method [14] and the recommendation for the selection of poles in PSP is that poles should be representative of the products’ differences, be stable over time and be available in future sessions in order to allow data aggregation and comparisons [19]. It is well-known that wines are not stable products and that their availability is limited, which is a problem for the application of this method to wine aroma investigation and risks affecting the reliability of the results. In this regard, aroma standards are stable products and are easily reproducible in sensory descriptive analysis studies. Therefore, aroma standards could serve as poles instead of wines in a PPM method investigating wine aroma.
Wine sensory analysis carried out by the Oenology Sensory Laboratory at Oregon State University has shown that tropical fruit, stone fruit, pome fruit, citrus and melon are important aroma descriptors for Oregon white wines [20,21]. Discerning the fruity notes in wine is a complex task and requires many hours of training. However, in situations when money and time are limited, rapid methods that facilitate stimuli discrimination and description should be evaluated and adapted to the objectives of the study. PPM has been shown to be a reliable sensory technique [16] that allows great discrimination and description of products [19].
Therefore, the objective of this study was to investigate the fruitiness aroma perception of commercial white wines from Oregon. To accomplish this objective, an adaptation of the PPM method was performed. Normally, for PPM, the poles comprise specific products being evaluated, such as wines, but, in this study, the poles were aroma standards representing the five fruity aromas of interest. In this framework, it is expected that wines with dominant fruity aromas are placed near one or more poles and wines described by non-fruity terms are placed farther from the poles. Trained consumers and wine experts are often the subjects in wine sensory analysis [22,23,24]; thus, a second objective was to compare their results.
2. Material and Methods
2.1. Wines
A total of 30 commercially available white wines from OR, USA were purchased from local wine retailers. After a preliminary tasting panel (data not shown), a total of 21 wines, including seven Chardonnays, Pinot Gris and Viogniers each, were selected (Table 1). Wines that were faulty, very similar or overall oaked were excluded.
2.2. Chemical Analysis
Basic wine analyses (pH, titratable acidity (TA), residual sugars, malic acid, acetic acid, ethanol and total SO2) were performed within approximately 2 months after sensory analysis (Table S1). A pH meter was used to determine the concentration of hydrogen ions in solution (ThermoFisher Scientific, Waltham, MA, USA) and TA was measured by titration with 0.1 M NaOH [25]. Residual sugars, malic acid and acetic acid were measured by enzymatic test kits (Megazyme, Bray, Ireland) and ethanol was determined using an Alcolyzer (Anton Paar, Santner Foundation, Graz, Austria). Finally, free and bound SO2 were determined by the aeration–oxidation method and their concentrations were summed to obtain the total SO2 content of the wines [25]. Wine pH, TA, ethanol and total SO2 analyses were performed in triplicate while residual sugars, malic acid and acetic acid analyses were performed in duplicate.
2.3. Sensory Analysis
First, 20 mL aliquots of wine were poured approximately 30 min before testing. Samples were served at room temperature (18–21 °C) in ISO standard tasting black glasses [26], labeled with random three-digit codes and covered with PET plastic cup lids (Choice Foodservice Products, China). The wines were presented in randomized order for each panelist following a partially balanced incomplete block design [27]. Subjects evaluated the 30 wines across 3 sets, each set containing 10 wines (Table 2). Wine C7 was described as oaky during preliminary tasting and was served in every set to assess panelist performance on the methodology and as a negative control. Samples were assessed in individual white booths under a mix of natural and artificial light. The ambient temperature was 21 °C ± 1 °C and air purifiers (Winix Inc., Model 5300, Gyeonggido, South Korea) were used to ensure that the environment was free of odors. Panelists were asked to evaluate the orthonasal smell of samples. To reduce fatigue, panelists had a 10 min rest between sets. They were provided with paper instructions and all data from polarized projective mapping (PPM) and ultra-flash profile (UFP) were recorded on paper sheets (61 cm × 45.7 cm, drawing paper, Strathmore®).
2.4. Sensory Panels
The first panel comprised 10 expert wine professionals (winemakers, oenologists and winery owners) from the Oregon wine industry. This group consisted of six males and four females (21–65+ years old). Each panelist participated in a single two-hour session where they performed PPM and UFP tests. They had previously participated in sensory studies using the Napping® and UFP procedures, so they were not trained on the methodology prior to sensory analysis.
The second panel was composed of 12 trained wine consumers consisting of students and staff members at Oregon State University, and community members that regularly participated in sensory descriptive analysis studies. The panel consisted of eight males and four females (21–65+ years old) who all attended a one-hour training session with a set of six representative white wines to become familiar with the adapted PPM and UFP procedures. Two days after the training session, panelists participated in the full sensory panel.
Inclusion criteria required all participants to consume white wine at least once a week, be over 21 years of age, speak English, not smoke, not have any taste deficits or oral disorders and not be pregnant or nursing (female subjects). The procedures for wine experts and trained consumers were the same. Both panels were carried out within a month of each other, in August and September 2018.
2.5. Procedures
2.5.1. Selection and Positioning of Poles
For the purpose of this study, PPM [14] with an additional variation was employed. Unlike other PPM, in which the poles comprise specific products being evaluated, the poles comprised standards to evoke specific fruity aromas (Table 3).
The selection of fruits was based on fruit descriptors related to the white wine styles that were investigated in this study and previous research done on fruity aroma in white wines [20,21]. The sensory poles spanned the sensory space, and their distances were designed to capture the differences in the fruity aromas between samples determined in preliminary sensory tests (data not shown). Considering the bottom-left corner as the origin, the five poles were placed on the paper sheet at the (X, Y) coordinates: melon (6.1 cm, 40.7 cm), citrus (28.6 cm, 40.9 cm), tropical (4.2 cm, 16.7 cm), pear (29.6 cm, 5.8 cm), stone fruit (47.2 cm, 17.3 cm) (Figure 1).
2.5.2. Polarized Projective Mapping (PPM)
Panelists were first instructed to smell the five “fixed poles” on the paper sheet, followed by the “free-moving” wine samples, in order from left to right [18]. They were instructed to place the samples on the paper sheet according to the similarities and differences to the fixed poles and other samples. Wines with aromas similar to the specified poles were placed near the pole and wines that were not similar were placed further away. Subjects were instructed to use their own criteria to place the samples on the sheet and they were told that there was not a wrong or right answer.
2.5.3. Ultra-Flash Profiling (UFP)
After positioning the samples using the PPM protocol, panelists were asked to write two or three aroma descriptors next to the samples. Both panels received a list of fruit aroma descriptors for UFP, but they were also allowed to use aroma descriptors not in the list. While panelists were instructed to first perform PPM and then UFP, several panelists were observed first performing UFP and then PPM. A blank sheet of paper was provided to help them organize their thoughts.
2.6. Statistical Analysis
The PPM and UFP data for wine experts and trained consumers were analyzed separately. PPM data were analyzed using multiple factor analysis (MFA). For all samples, the X and Y coordinates were manually measured from the sheet of each panelist, considering the bottom-left corner of the sheet as the origin. The coordinates for each panelist were treated as tables in the MFA, resulting in 10 tables containing 10 × 2 columns for wine experts and 12 tables with 12 × 2 columns for trained consumers. The poles were treated as supplementary variables as their positions were determined by the researchers prior to sensory analysis. Thus, the poles did not participate in the construction of the plots; rather, they were projected onto the multidimensional space [18]. Hierarchical clustering (HC) was used to determine the number of clusters from the MFA coordinates and k-means clustering was used to determine which wines were in each cluster [28,29].
UFP data were analyzed using correspondence analysis (CA). Similar descriptors were grouped into categories following the wine aroma wheel proposed by Noble et al. (1987) [30]. Descriptors that were cited by a minimum of 20% were retained for statistical analysis. As with MFA data, HC was used to determine the number of clusters from the CA coordinates and k-means clustering was used to determine which wines were in each cluster [28,29].
One-way ANOVA was performed to establish statistical differences in chemical parameters between wine samples. Mean differences between samples were compared using Tukey’s HSD test. Results were considered significant if the associated p-value was <0.05. All multivariate analyses and the one-way ANOVA analysis were carried out using XLSTAT-Sensory version 2019.3.1.61246 (Addinsoft, Paris, France).
3. Results
3.1. Polarized Projective Mapping
3.1.1. Wine Experts
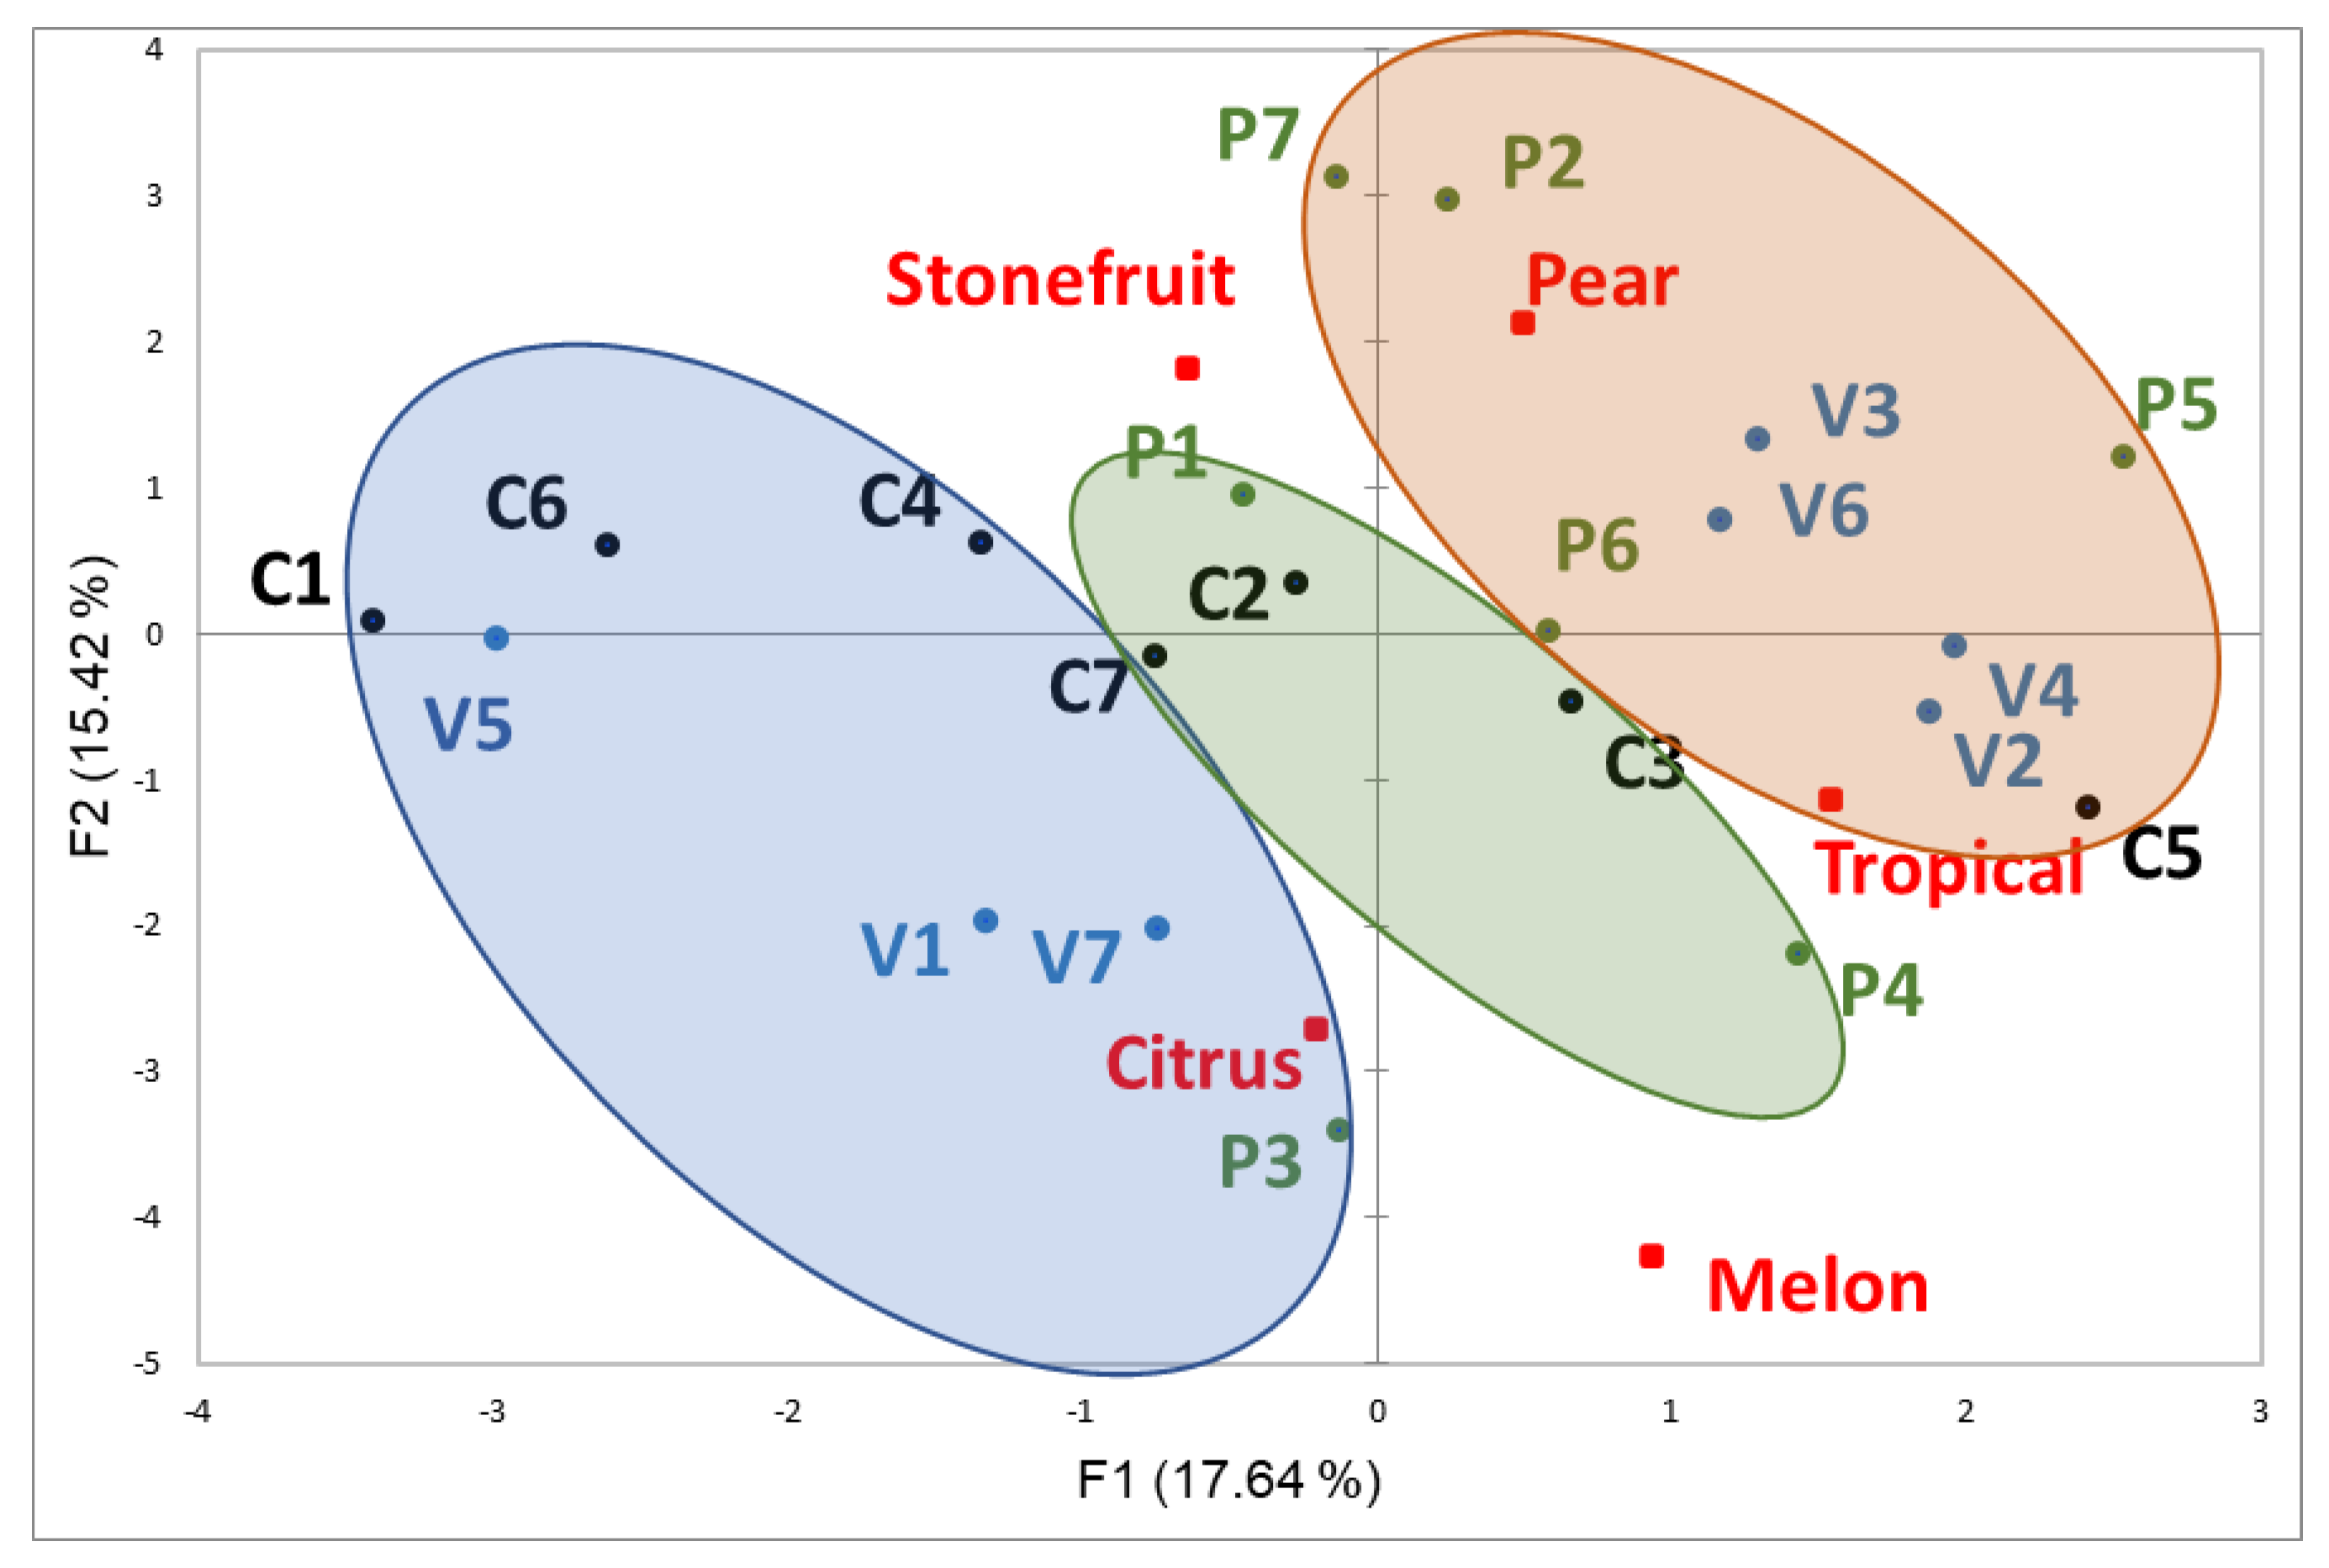
The first two factors of the MFA explained 33.06% of the variance (F1 = 17.64% and F2 = 15.42%, Figure 2). Wine replicates were generally found close together and were combined to facilitate data visualization (Figure S1). Wines located along the positive F1 axis were described as pear, tropical fruit and melon. Wines located along the negative F1 axis were described as stone fruit and citrus. F2 consisted of the separation of wines described as stone fruit and pear in the positive axis and wines described as citrus, melon and tropical fruit in the negative axis.
Three clusters were identified by k-means clustering. Wines C1, C4, C6, V1, V5, V7 and P3 were clustered with the citrus pole. Wines C2, C3, C7, P1 and P4 were in the same group, but not associated with any fruit pole. Wines C5, V2, V3, V4, V6, P2, P5, P6 and P7 were clustered with the pear and tropical fruit poles. Finally, the poles melon and stone fruit were not associated with any clusters.
Wines were not clustered by varietal, although some similarities could be seen. The Chardonnay wines were found in each of the three clusters and were clearly spread across the F1 axis. The Viognier wines were clearly separated into two different groups: one group consisting of V5, V1 and V7 and the second group of V3, V6, V2 and V4. While the Pinot Gris wines were in two different clusters, they were more similar to each other (except P3) than the Chardonnay or Viognier wines.
3.1.2. Trained Consumers
The first two factors of the MFA explained 32.3% of the variance (F1 = 18.15% and F2 = 14.15%, Figure 3). Replicates were combined to facilitate data visualization (Figure S2). Wines located along the positive F1 and negative F2 axes were described as citrus, melon, tropical fruit and pear, and wines located along the negative F1 and positive F2 axes were described as stone fruit. Trained consumers placed the wines in relation to poles differently to wine experts as the projection of the poles on the MFA plots was clearly different from the wine experts’ projected poles (Figure 2 and Figure 3).
Trained consumers were able to provide a better separation of the wines by varietal compared to wine experts. Except for wine P7, all Pinot Gris wines were clustered with the citrus pole. All Chardonnays were placed in the positive F2 axis. While wines C2, C4, C5 and C7 were grouped with the stone fruit pole, wines C1, C3 and C6 were grouped with the pear pole. Conversely, Viogniers were spread along both directions of F1 and F2 and found in every cluster. The poles tropical fruit and melon were not associated with any groupings.
Both wine experts and trained consumers had wines V4 and V2 and, to a lesser extent, wines V3 and V6 placed closer together. Chardonnays were distinctively described by the stone fruit pole, and the Pinot Gris were characterized by a mix of pear, citrus, melon and tropical fruit aromas by F1 and F2.
3.2. Ultra-Flash Profiling
3.2.1. Wine Experts
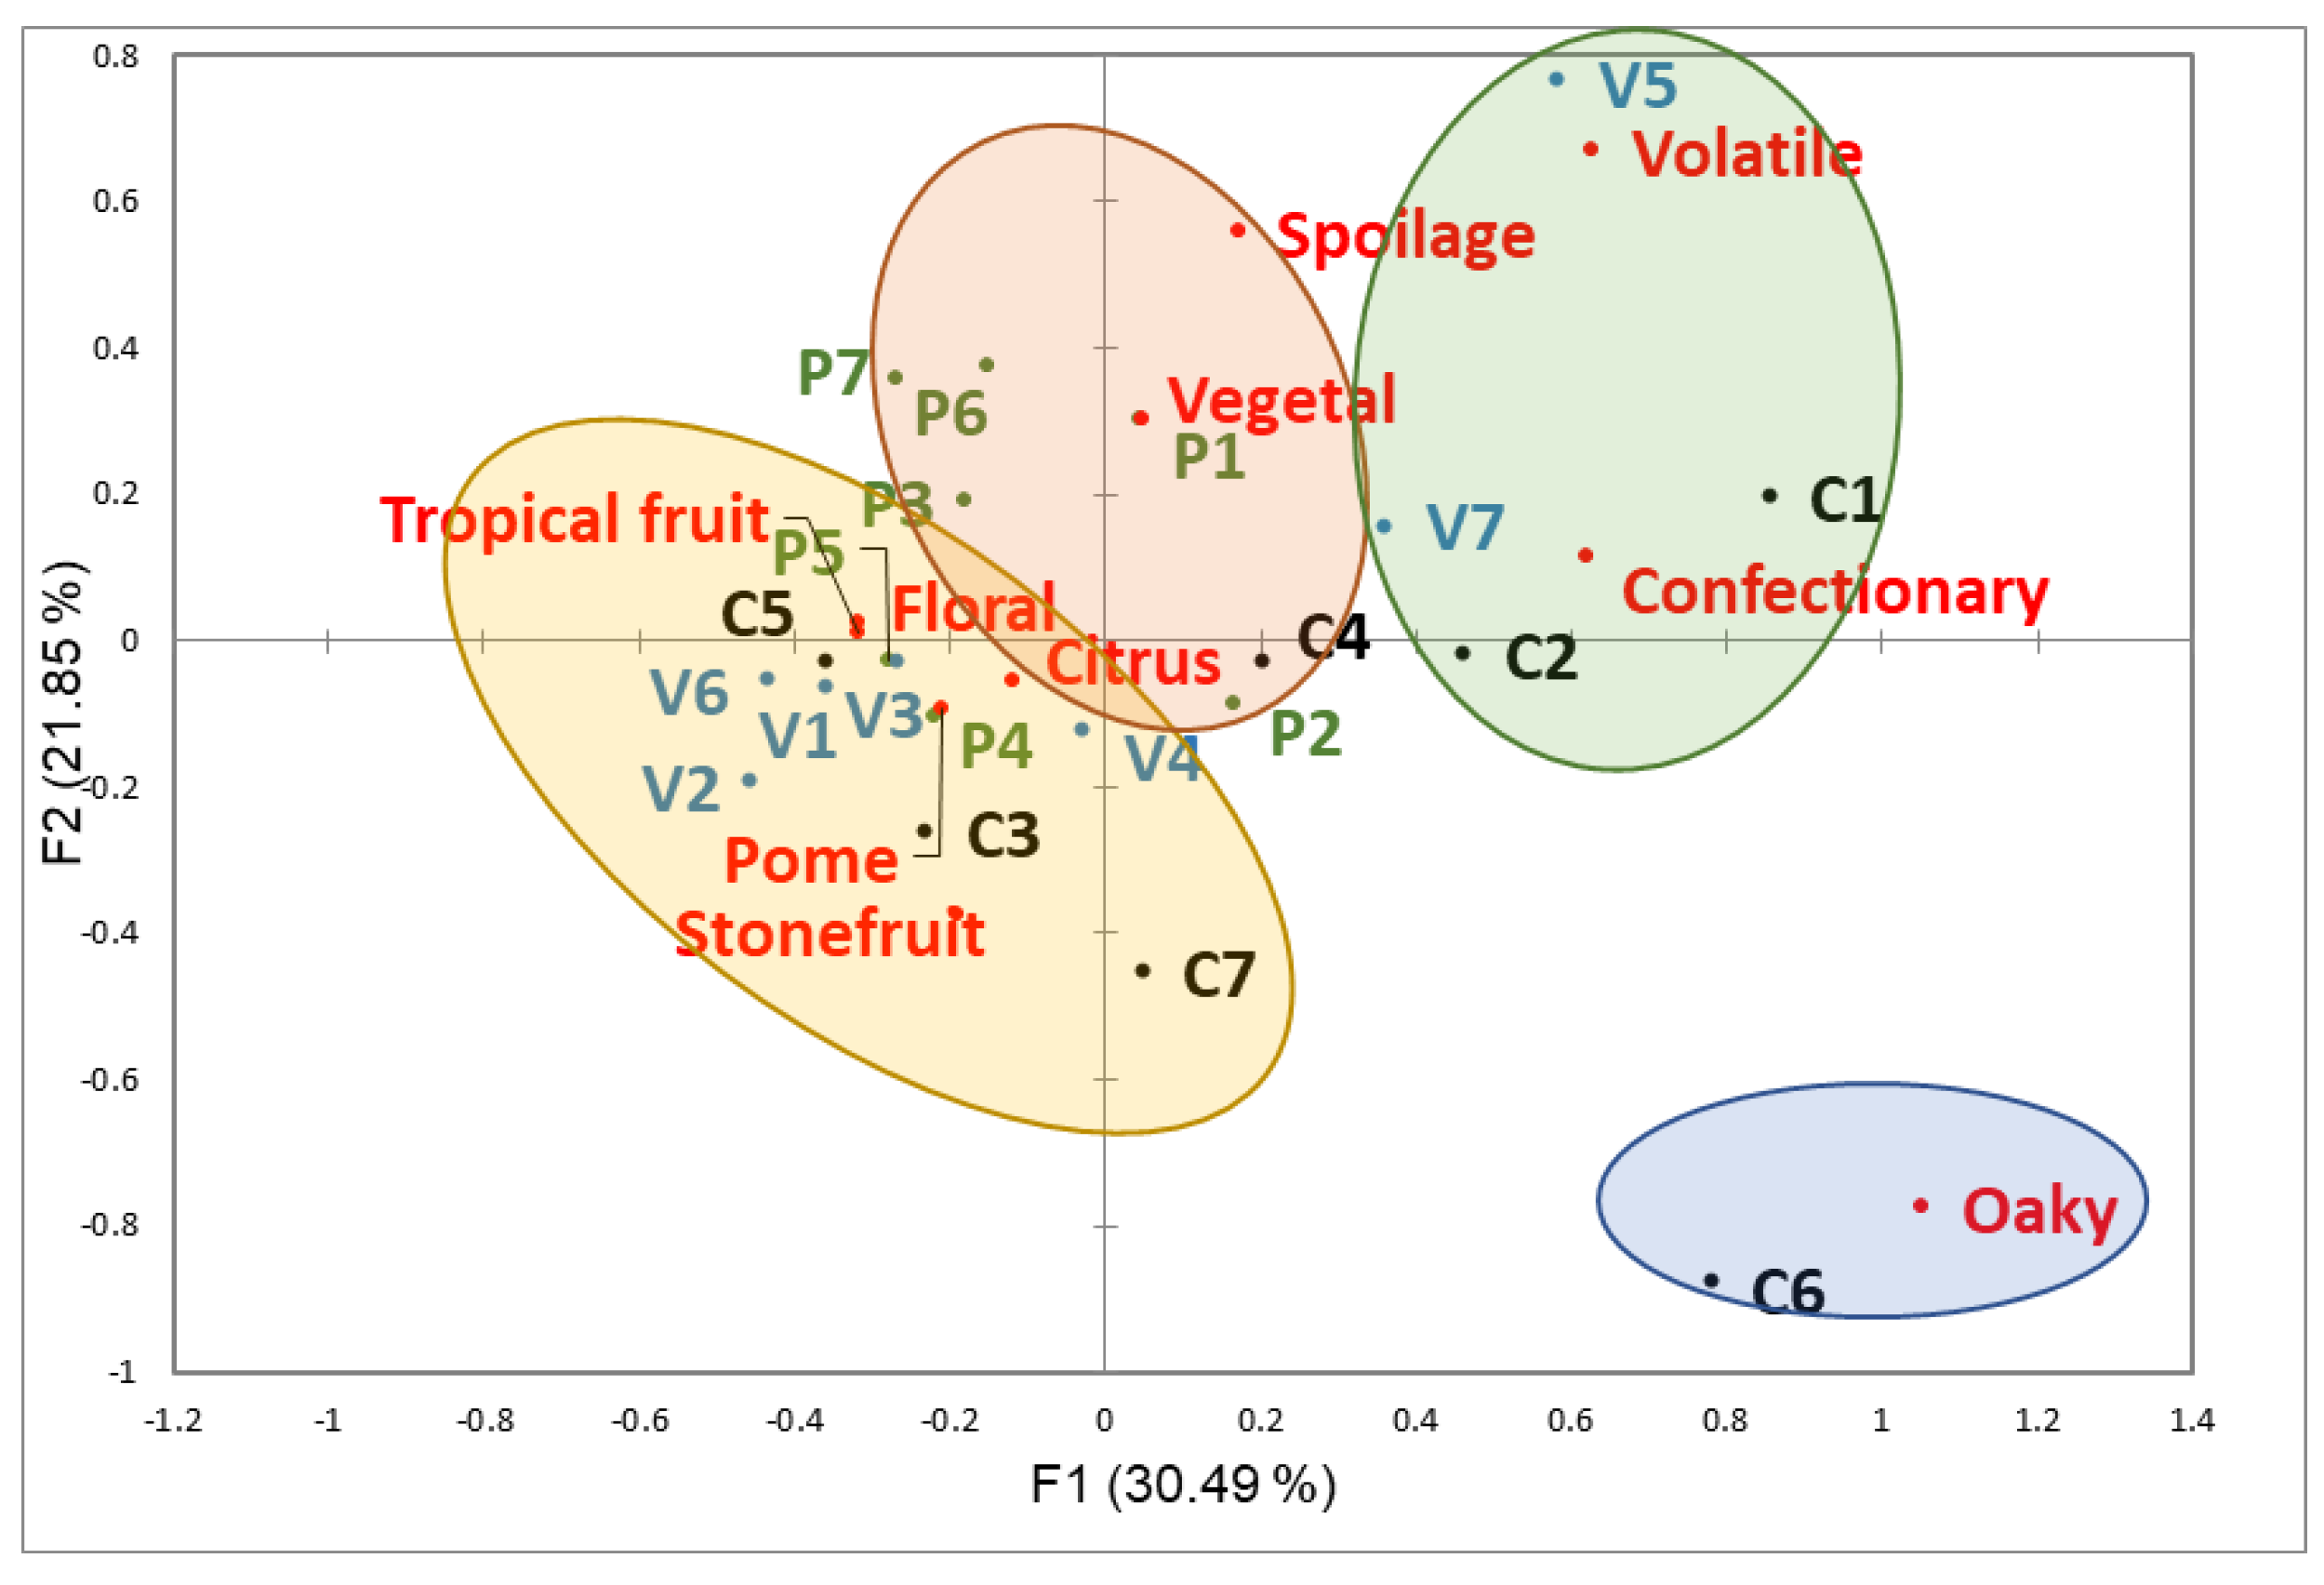
The first three factors of CA explained 52.34% of the variance (F1 = 30.49% and F2 = 21.85%, Figure 4). This figure shows the samples and the projection of the aroma descriptors used to describe them. A total of ten terms were utilized to describe the aroma of the wines (Table S2). While floral and all fruit terms (tropical fruit, stone fruit, citrus and pome) were located in the negative F1 axis, the positive F1 axis comprised non-fruit descriptors, which were used to characterize the aroma of specific wines.
Four groupings were identified according to k-means clustering. Wines C3, C5, C7, V1, V2, V3, V4, V6, P4 and P5 were clustered with the tropical fruit, stone fruit, pome (apple and pear) and floral terms. Wines C4, P2, P3, P6 and P7 were associated with vegetal and spoilage terms. Wines C1, C2, V5 and V7 were grouped with the volatile and confectionery terms. Lastly, wine C6 was strongly associated with the oaky descriptor. Although clustering by varietal was not observed, it is worth noting that five out of the seven Viognier wines selected for this study were located in the first cluster, where the floral and fruit descriptors were also located.
3.2.2. Trained Consumers
The first two factors of CA explained 42.83% of the variance (F1 = 25.60% and F2 = 17.23%, Figure 5). Twelve terms were used to characterize the wines (Table S3). Most fruit descriptors and the floral term were in the negative F1 axis. The remaining terms were located in the positive F1 axis. The F2 axis showed a clear separation of berry (red and black fruits) and confectionery (candy) from all the other terms.
Similarly to the CA plots of wine experts, no strong clustering by varietal was observed. Clusters were formed by three groupings of wines from different grape varietals. Several Pinot Gris and Chardonnay wines (V2, V3, V4, P2, P5, P6 and P7) were grouped with the tropical fruit, stone fruit and floral terms. A mix of the three varietal wines (C5, V1, P1, P3 and P4) was clustered with the citrus, pome, vegetal and faint (neutral in aroma) descriptors. Interestingly, most Chardonnays (C1, C2, C4, C6 and C7) and wine V5 were grouped together and characterized by volatile, berry and confectionery terms. Finally, although wine C3 was located between two clusters, this wine did not participate in any groupings.
4. Discussion
The objective of using fruit standards instead of wines as poles was to identify the dominant fruit characteristics of the wines in conjunction with UFP for a thorough description of the samples and to remove some of the ambiguity that occurs with other methodology. Traditionally, UFP has been used with mapping methodologies, such as Napping® and PPM, to obtain descriptive information [9,18]. It can be difficult at times to discern the descriptive information for each wine as panelists use their own terms, which do not always agree amongst each other [5,8]. Although the results show that it was possible to place wines in the space using the poles, wines were not as clearly separated as anticipated.
The chosen poles were all fruit aromas associated with young white wines, such as Chardonnay, Pinot Gris and Viognier [3,31,32,33]. They are also fairly distinctive fruit aromas and it was interesting that the tropical fruit and melon poles were placed near each other when poles were included as supplementary variables in MFA. It is worth noting that passion fruit, mango, guava, grapefruit and melon are all considered tropical fruits since they grow in tropical and subtropical regions [34]. However, the volatile composition of these fruits, particularly melon, is quite different, resulting in the perception of diverse tropical fruit aromas [35].
Another interesting result was that experts and trained consumers did not perceive sample C7 as oaky. As previously described, this sample was present in every set and was characterized as having an intense oaky aroma in preliminary tastings. We expected this sample to be far from the fruit poles and the other wines. Surprisingly, both panels placed it near the stone fruit pole, thus showing the dominant aroma perceived by the subjects (Figure 2 and Figure 3). Results displayed by UFP did show that sample C7 was described with oaky characteristics, mainly by the trained consumers (Figure 5). However, its oaky aroma was not strong enough to place this sample far from the others. There are two possible reasons for this result: (1) the oaky aroma of sample C7 was not as strong as its stone fruit aroma to place this sample far from the others or (2) individuals placed the sample near the stone fruit pole when the variable oak was not present as a pole (the dumping effect).
Normally, wine experts and trained consumers are used in the sensory descriptive analyses of wines [22,23,24,36], with trained consumers considered equivalent to using wine experts. Although training wine consumers is very time-consuming, wine experts can have limited availability. Therefore, their performance was compared using this methodology, to determine if trained consumers could be used as an equivalent alternative to wine experts. There were very few similarities in the ways in which wine experts and trained consumers evaluated the samples using the PPM methodology (Figure 2 and Figure 3). Sample P3 was perceived by both panels as citrus and samples P7 and V6 were described as pear. More similarities in the results were observed with the UFP method. Wines V2, V3, V4, V6 and P5 were clustered with the tropical fruit, stone fruit and floral descriptors. Wines P1 and P3 were grouped with the vegetal term and wines C1, C2 and V5 were in the same group as the confectionery and volatile descriptors. Lastly, wine C6 was grouped with the oaky term, though wine experts strongly associated this term with this wine.
Overall, experts were more successful at differentiating the wines using the poles than trained consumers. While poles were spread throughout the experts’ PPM map, consumers had all fruit poles, except stone fruit, in the fourth quadrant (Figure 3). This result indicates that trained consumers were not able to differentiate the various fruity aromas of the samples as well as the experts. In addition to this, consumers did not have many wines located near the fruit poles (Figure 3). This result was unexpected as their UFP showed that wines did have fruity characteristics (Figure 5). A possible explanation is that the fruity characteristics were not as dominant in the wines for consumers, so they felt that the samples should not be located near the poles, which had strong fruit aromas. It may be necessary to train consumers more on the fruit poles in order to enable them to discern the subtle differences between the wines. In general, wine experts have a superior ability to discriminate wines when compared to trained consumers because they regularly evaluate wines and are attuned to the many subtle differences [22]. All these discrepancies illustrate the difficulty of using mapping methodologies to describe complex products with subtle differences, such as wine [18].
While the use of fruit standards as poles was not as successful as anticipated, we were still able to collect information on other major fruity aromas of the wines using the UFP procedure. All Pinot Gris and Viognier wines placed in the negative F1 axis were described as having tropical fruit, citrus, stone fruit and floral aroma notes by both panels (Figure 4 and Figure 5). To date, few studies have described the sensory perception of Pinot Gris and Viognier wines from other locations. Although terroir and winemaking play important roles in the aroma quality of wine, Pinot Gris from Canada [37] and Viognier from several locations [32,33,38] presented similar fruity profiles to Oregon wines. The UFP results also illustrated the different styles of Chardonnay (Figure 4 and Figure 5). Chardonnay is produced under a wide variety of winemaking techniques, which is known for dramatically changing the sensory characteristics of this wine [39]. For example, sample C3 is an unwooded Chardonnay fermented in a stainless-steel tank and was described as tropical fruit and citrus by both panels. On the other hand, wine C6 was aged for 14 months in an oak barrel (30% new French oak) and experts and trained consumers described it as oaky. Previous work has shown that aging wine in wood barrels reduces their fruitiness perception due to the masking effect that volatile compounds derived from oak have on fermentation esters [40].
Several wines were described with volatile and spoilage aroma terms (Figure 4 and Figure 5). Volatile acidity is an aroma defect typically caused by acetic acid and its esterification into ethyl acetate [41]. Table S1 shows the acetic acid concentration of the wines. The aroma threshold of acetic acid in white wine is 0.2 g/L [42] and it can be clearly seen that most wines whose acetic acid concentrations were above 0.3 g/L were located in the positive UFP F1 axis by both panels. High concentrations of acetic acid in wine are known for masking fruitiness [43] and it can be clearly seen that the higher concentrations of acetic acid had a negative effect on the aroma perception of the evaluated wines.
This study showed the different sensory aroma profiles of varietal wines from Oregon. It is important to note that the Oregon wine labeling regulations require a minimum of 90% of grapes from the named variety, as opposed to a minimum of 75% for the rest of the United States [44]. In general, commercial wines are produced with a variation in viticultural and enological practices, such as skin contact, stainless-steel or barrel fermentation, fermentation temperature, yeast selection, malolactic fermentation and aging in barrels with or without lees, etc. [39]. These factors, as well as grape terroir and storage conditions, can highly impact their sensory characteristics [11,45,46,47]. Detailed information on viticultural and enological practices was not collected for these wines. However, even though there may have been differences in winemaking practices, several aromatic qualities were shared among the different varietals, as previously discussed, which are most likely due to their varietal origins.
Besides the different approaches that the experts and trained consumers used to evaluate the wine samples, it is believed that the differences in the results between panels may have been due to the sample size, the difficulty of the test and the aroma intensity of the poles. Although PPM enables the analysis of a larger sample size [18], experts and trained consumers evaluated the 30 samples in a single session. Panelists had two mandatory 10 min breaks in the session, but the elevated number of samples might have fatigued their olfactory senses. Furthermore, the PPM with fruity poles requires two cognitive processes: (1) compare samples to poles and (2) compare samples to other samples. These two thought processes may have increased the perceived difficulty of the method. Finally, the poles were composed of fruit juices or fruit purees and this might have caused both panels to place the samples farther from the poles because the fruit aromas of the samples were not as intense as the poles themselves. Another source of variation in the results is that both panels were carried out within one month of each other. Although the wines were stored at a cool temperature (12 °C) and the time between panels was relatively short, it is known that the aromas of wine evolve with time [11,48,49] and the wine might have suffered slight changes in volatile composition.
Overall, this methodology provided valuable results regarding the aromas of white wines from Oregon. However, the feasibility of using aroma standards as poles in the PPM methodology can be improved. We recommend a reduction in the number of samples. The use of a non-fruity wine as a control is recommended to evaluate the panel’s consistency on the methodology. Additionally, the poles should be diluted in dearomatized or neutral wine in order to make them more representative of the products. Lastly, although wine experts provided better PPM results, their availability is limited compared to consumer panels. Wine consumers can be used if they are trained both on the methodology and products prior to the actual sensory analysis.
5. Conclusions
The white wines from Oregon investigated in this study presented a wide range of fruity aromas, most commonly tropical fruit, citrus and stone fruit. Floral, oaky, vegetal and spoilage aromas were also observed to a lesser extent in specific wines. Due to their stability and easy reproducibility, the use of aroma standards instead of products showed positive results; thus, it seems to be a reliable alternative for the investigation of fruitiness aroma perception. The adapted PPM enables the comparison of wines analyzed in different panels and this method could be routinely used to evaluate wines. Wine experts and trained consumers produced different sensory maps, with wine experts presenting better discriminability among wines and poles. Although wine experts showed superior results, it was concluded that trained consumers could be used instead of wine experts in future studies if they are trained both on the methodology (i.e., use of poles) and aroma discrimination and identification.
Supplementary Materials
The following are available online at https://0-www-mdpi-com.brum.beds.ac.uk/article/10.3390/beverages7030046/s1, Table S1: Wine chemical analysis, Table S2: Frequency table of the aroma descriptors elicited by the wine experts panel in the UFP procedure, Table S3: Frequency table of the aroma descriptors elicited by the trained consumers panel in the UFP procedure, Figure S1: MFA plot showing wine experts’ PPM results of the separated replicate wines for the first and second factors. Ellipses identify groups according to k-means clustering. Varietal wines are shown in different colors, Figure S2: MFA plot showing trained consumers’ PPM results of the separated replicate wines for the first and second factors. Ellipses identify groups according to k-means clustering. Varietal wines are shown in different colors.
Author Contributions
Conceptualization, A.I. and E.T.; methodology, E.T.; formal analysis, A.I.; resources, E.T.; writing—original draft preparation, A.I. and E.T.; visualization, A.I.; supervision, E.T.; project administration, E.T.; funding acquisition, E.T. Both authors have read and agreed to the published version of the manuscript.
Funding
This research was funded by the American Vineyard Foundation, grant number 2479.
Conflicts of Interest
The authors declare no conflict of interest.
References
- Lund, C.M.; Thompson, M.K.; Benkwitz, F.; Wohler, M.W.; Triggs, C.M.; Gardner, R.; Heymann, H.; Nicolau, L. New Zealand Sauvignon blanc Distinct Flavor Characteristics: Sensory, Chemical, and Consumer Aspects. Am. J. Enol. Vitic. 2009, 60, 1–12. [Google Scholar]
- King, E.; Osidacz, P.; Curtin, C.; Bastian, S.; Francis, I. Assessing desirable levels of sensory properties in Sauvignon Blanc wines—Consumer preferences and contribution of key aroma compounds. Aust. J. Grape Wine Res. 2011, 17, 169–180. [Google Scholar] [CrossRef]
- Capone, D.; Barker, A.; Williamson, P.; Francis, I. The role of potent thiols in Chardonnay wine aroma. Aust. J. Grape Wine Res. 2017, 24, 38–50. [Google Scholar] [CrossRef]
- Murray, J.; Delahunty, C.; Baxter, I. Descriptive sensory analysis: Past, present and future. Food Res. Int. 2001, 34, 461–471. [Google Scholar] [CrossRef]
- Varela, P.; Ares, G. Sensory profiling, the blurred line between sensory and consumer science. A review of novel methods for product characterization. Food Res. Int. 2012, 48, 893–908. [Google Scholar] [CrossRef]
- Risvik, E.; McEwan, J.A.; Colwill, J.S.; Rogers, R.; Lyon, D.H. Projective mapping: A tool for sensory analysis and consumer research. Food Qual. Prefer. 1994, 5, 263–269. [Google Scholar] [CrossRef]
- Teillet, E.; Schlich, P.; Urbano, C.; Cordelle, S.; Guichard, E. Sensory methodologies and the taste of water. Food Qual. Prefer. 2010, 21, 967–976. [Google Scholar] [CrossRef]
- Valentin, D.; Chollet, S.; Lelievre-Desmas, M.; Abdi, H. Quick and dirty but still pretty good: A review of new descriptive methods in food science. Int. J. Food Sci. Technol. 2012, 47, 1563–1578. [Google Scholar] [CrossRef]
- Perrin, L.; Symoneaux, R.; Maître, I.; Asselin, C.; Jourjon, F.; Pagès, J. Comparison of three sensory methods for use with the Napping® procedure: Case of ten wines from Loire valley. Food Qual. Prefer. 2008, 19, 1–11. [Google Scholar] [CrossRef]
- Ross, C.F.; Weller, K.M.; Alldredge, J.R. Impact of Serving Temperature on Sensory Properties of Red Wine as Evaluated Using Projective Mapping by a Trained Panel. J. Sens. Stud. 2012, 27, 463–470. [Google Scholar] [CrossRef]
- Liu, D.; Xing, R.-R.; Li, Z.; Yang, D.-M.; Pan, Q.-H. Evolution of volatile compounds, aroma attributes, and sensory perception in bottle-aged red wines and their correlation. Eur. Food Res. Technol. 2016, 242, 1937–1948. [Google Scholar] [CrossRef]
- Kemp, B.; Pickering, G.; Willwerth, J.; Inglis, D. Investigating the use of partial napping with ultra-flash profiling to identify flavour differences in replicated, experimental wines. J. Wine Res. 2018, 29, 302–309. [Google Scholar] [CrossRef]
- Otheguy, M.; Chatelet, B.; Pouzalgues, N.; Valentin, D.; Honoré-Chedozeau, C. Combining polarized sensory positioning and pivot profile©: What can we expect for wines? In Proceedings of the Pangborn Sensory Science Symposium, Edinburgh, Scotland, 28 July–1 August 2019.
- Ares, G.; De Saldamando, L.; Vidal, L.; Antúnez, L.; Giménez, A.; Varela, P. Polarized Projective Mapping: Comparison with Polarized Sensory Positioning approaches. Food Qual. Prefer. 2013, 28, 510–518. [Google Scholar] [CrossRef]
- De Saldamando, L.; Antúnez, L.; Giménez, A.; Varela, P.; Ares, G. Influence of Poles on Results from Reference-Based Sensory Characterization Methodologies: Case Study with Polarized Projective Mapping Consumers. J. Sens. Stud. 2015, 30, 439–447. [Google Scholar] [CrossRef]
- De Saldamando, L.; Antúnez, L.; Torres-Moreno, M.; Giménez, A.; Ares, G. Reliability of Polarized Projective Mapping with Consumers. J. Sens. Stud. 2015, 30, 280–294. [Google Scholar] [CrossRef]
- Horita, C.; Esmerino, E.; Vidal, V.; Farah, J.; Amaral, G.; Bolini, H.; Cruz, A.; Pollonio, M. Sensory profiling of low sodium frankfurter containing garlic products: Adequacy of Polarized Projective Mapping compared with trained panel. Meat Sci. 2017, 131, 90–98. [Google Scholar] [CrossRef] [PubMed]
- Wilson, C.; Brand, J.; du Toit, W.; Buica, A. Polarized projective mapping as a rapid sensory analysis method applied to South African Chenin Blanc wines. LWT 2018, 92, 140–146. [Google Scholar] [CrossRef]
- Teillet, E. Polarized sensory positioning methodologies. In Novel Techniques in Sensory Characterization and Consumer Profiling; Varela, P., Ares, G., Eds.; Routledge: Boca Raton, FL, USA, 2016; pp. 255–269. ISBN 9781138034273. [Google Scholar]
- Iobbi, A.; Tomasino, E. Tropical fruit aromas in white wines—Compound Interactions with esters and volatile thiols. In Proceedings of the 3rd International Flavor and Fragrance Conference, Viña del Mar, Chile, 1–4 October 2019. [Google Scholar]
- Tomasino, E.; Song, M.; Fuentes, C. Odor Perception Interactions between Free Monoterpene Isomers and Wine Composition of Pinot Gris Wines. J. Agric. Food Chem. 2020, 68, 3220–3227. [Google Scholar] [CrossRef] [PubMed]
- Zamora, M.C.; Guirao, M. Performance comparison between trained assessors and wine experts using specific sensory attributes. J. Sens. Stud. 2004, 19, 530–545. [Google Scholar] [CrossRef]
- Perrin, L.; Symoneaux, R.; Maître, I.; Asselin, C.; Jourjon, F.; Pagès, J. Comparison of Conventional Profiling by a Trained Tasting Panel and Free Profiling by Wine Professionals. Am. J. Enol. Vitic. 2007, 58, 508–517. [Google Scholar]
- Ballester, J.; Mihnea, M.; Peyron, D.; Valentin, D. Exploring minerality of Burgundy Chardonnay wines: A sensory approach with wine experts and trained panellists. Aust. J. Grape Wine Res. 2013, 19, 140–152. [Google Scholar] [CrossRef]
- Iland, P.G.; Bruer, N.; Edwards, G.; Weeks, S.; Wilkes, E. Chemical Analysis of Grapes and Wine: Techniques and Concepts; Patrick Iland Wine Promotions: Campbelltown, Australia, 2004. [Google Scholar]
- International Organization for Standardization. ISO 3591: Sensory Analysis—Apparatus—Wine-Tasting Glass; ISO: Geneva, Switzerland, 1977. [Google Scholar]
- Ball, R.D. Incomplete block designs for the minimisation of order and carry-over effects in sensory analysis. Food Qual. Prefer. 1997, 8, 111–118. [Google Scholar] [CrossRef]
- Jamir, S.M.R.; Stelick, A.; Dando, R. Cross-cultural examination of a product of differing familiarity (Hard Cider) by American and Chinese panelists using rapid profiling techniques. Food Qual. Prefer. 2020, 79, 103783. [Google Scholar] [CrossRef]
- Pelonnier-Magimel, E.; Mangiorou, P.; Philippe, D.; De Revel, G.; Jourdes, M.; Marchal, A.; Marchand, S.; Pons, A.; Riquier, L.; Tesseidre, P.-L.; et al. Sensory characterisation of Bordeaux red wines produced without added sulfites. OENO One 2020, 54, 733–743. [Google Scholar] [CrossRef]
- Noble, A.C.; Arnold, R.A.; Buechsenstein, J.; Leach, E.J.; Schmidt, J.O.; Stern, P.M. Modification of a standardized system of wine aroma terminology. Am. J. Enol. Vitic. 1987, 38, 143–146. [Google Scholar]
- Saliba, A.J.; Heymann, H.; Blackman, J.W.; MacDonald, J.B. Consumer-sensory evaluation of Australian Chardonnay. Wine Vitic. J. 2013, 64–66. [Google Scholar] [CrossRef]
- Brighenti, E.; Brighenti, A.F.; Filho, J.L.M.; Allebrandt, R.; Würz, D.A.; de Bem, B.P.; Rufato, L. New white wine varieties for Brazilian highlands: Chemical and sensory characterization. In Proceedings of the 39th OIV Congress, Bento Gonçalves, Brazil, 24–28 October 2016. [Google Scholar]
- Siebert, T.E.; Barker, A.; Pearson, W.; Barter, S.R.; de Barros Lopes, M.A.; Darriet, P.; Herderich, M.J.; Francis, I.L. Volatile Compounds Related to ‘Stone Fruit’ Aroma Attributes in Viognier and Chardonnay Wines. J. Agric. Food Chem. 2018, 66, 2838–2850. [Google Scholar] [CrossRef] [PubMed]
- Martin, F.W.; Campbell, C.W.; Ruberté, M.R. Perennial Edible Fruits of the Tropics: An Inventory; United States Department of Agriculture: Washington, DC, USA, 1987.
- El Hadi, M.A.M.; Zhang, F.-J.; Wu, F.-F.; Zhou, C.-H.; Tao, J. Advances in Fruit Aroma Volatile Research. Molecules 2013, 18, 8200–8229. [Google Scholar] [CrossRef]
- Hopfer, H.; Heymann, H. Judging wine quality: Do we need experts, consumers or trained panelists? Food Qual. Prefer. 2014, 32, 221–233. [Google Scholar] [CrossRef]
- Morgan, S.C.; Tantikachornkiat, M.; Scholl, C.M.; Benson, N.L.; Cliff, M.A.; Durall, D.M. The effect of sulfur dioxide addition at crush on the fungal and bacterial communities and the sensory attributes of Pinot gris wines. Int. J. Food Microbiol. 2019, 290, 1–14. [Google Scholar] [CrossRef]
- Siebert, T.E.; Barter, S.R.; Lopes, M.D.B.; Herderich, M.J.; Francis, I.L. Investigation of ‘stone fruit’ aroma in Chardonnay, Viognier and botrytis Semillon wines. Food Chem. 2018, 256, 286–296. [Google Scholar] [CrossRef]
- Gambetta, J.M.; Bastian, S.; Cozzolino, D.; Jeffery, D. Factors Influencing the Aroma Composition of Chardonnay Wines. J. Agric. Food Chem. 2014, 62, 6512–6534. [Google Scholar] [CrossRef]
- Atanasova, B.; Thomas-Danguin, T.; Langlois, D.; Nicklaus, S.; Chabanet, C.; Etiévant, P. Perception of wine fruity and woody notes: Influence of peri-threshold odorants. Food Qual. Prefer. 2005, 16, 504–510. [Google Scholar] [CrossRef]
- Waterhouse, A.L.; Sacks, G.L.; Jeffery, D.W. Understanding Wine Chemistry; Wiley: Hoboken, NJ, USA, 2016; ISBN 978-1-118-62780-8. [Google Scholar]
- Guth, H. Identification of Character Impact Odorants of Different White Wine Varieties. J. Agric. Food Chem. 1997, 45, 3022–3026. [Google Scholar] [CrossRef]
- Bartowsky, E.J.; Henschke, P.A. Acetic acid bacteria spoilage of bottled red wine—A review. Int. J. Food Microbiol. 2008, 125, 60–70. [Google Scholar] [CrossRef] [PubMed]
- Oregon Liquor Control Comission (OLCC). Oregon Administrative Rules 845-010-0915 Grape Variety Names. Available online: https://secure.sos.state.or.us/oard/viewSingleRule.action?ruleVrsnRsn=213092 (accessed on 12 December 2020).
- Pérez-Coello, M.; González-Viñas, M.; García-Romero, E.; Díaz-Maroto, M.; Cabezudo, M. Influence of storage temperature on the volatile compounds of young white wines. Food Control. 2003, 14, 301–306. [Google Scholar] [CrossRef]
- Tomasino, E.; Harrison, R.; Sedcole, R.; Frost, A. Regional Differentiation of New Zealand Pinot noir Wine by Wine Professionals Using Canonical Variate Analysis. Am. J. Enol. Vitic. 2013, 64, 357–363. [Google Scholar] [CrossRef]
- Willwerth, J.J.; Reynolds, A.G.; Lesschaeve, I. Sensory Analysis of Riesling Wines from Different Sub-Appellations in the Niagara Peninsula in Ontario. Am. J. Enol. Vitic. 2015, 66, 279–293. [Google Scholar] [CrossRef]
- Loscos, N.; Orte, M.P.H.; Cacho, J.; Ferreira, V. Evolution of the aroma composition of wines supplemented with grape flavour precursors from different varietals during accelerated wine ageing. Food Chem. 2010, 120, 205–216. [Google Scholar] [CrossRef]
- Ugliano, M. Oxygen Contribution to Wine Aroma Evolution during Bottle Aging. J. Agric. Food Chem. 2013, 61, 6125–6136. [Google Scholar] [CrossRef]
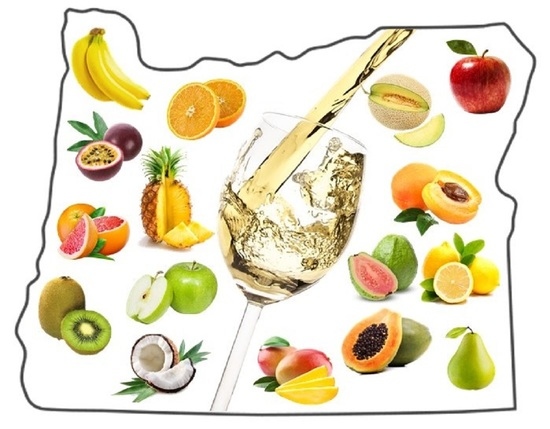
Figure 1.
Example of the polarized projective mapping sheet. Fixed poles: M = melon, C = citrus, T = tropical fruit, P = pear, S = stone fruit.
Figure 1.
Example of the polarized projective mapping sheet. Fixed poles: M = melon, C = citrus, T = tropical fruit, P = pear, S = stone fruit.

Figure 2.
MFA plot showing wine experts’ PPM results for first and second factors. Ellipses identify groups according to k-means clustering. Varietal wines are shown in different colors.
Figure 2.
MFA plot showing wine experts’ PPM results for first and second factors. Ellipses identify groups according to k-means clustering. Varietal wines are shown in different colors.

Figure 3.
MFA plot showing wine consumers’ PPM results for first and second factors. Ellipses identify groups according to k-means clustering. Varietal wines are shown in different colors.
Figure 3.
MFA plot showing wine consumers’ PPM results for first and second factors. Ellipses identify groups according to k-means clustering. Varietal wines are shown in different colors.

Figure 4.
CA plot showing wine experts’ UFP data. Ellipses identify groups according to k-means clustering. Varietal wines are shown in different colors.
Figure 4.
CA plot showing wine experts’ UFP data. Ellipses identify groups according to k-means clustering. Varietal wines are shown in different colors.

Figure 5.
CA map showing trained consumers’ UFP data. Ellipses identify groups according to k-means clustering. Varietal wines are shown in different colors.
Figure 5.
CA map showing trained consumers’ UFP data. Ellipses identify groups according to k-means clustering. Varietal wines are shown in different colors.


Table 1.
Wines selected for this study.
| Code | Grape Variety | Vintage | Region |
|---|---|---|---|
| C1 | Chardonnay | 2016 | Willamette Valley |
| C2 | Chardonnay | 2014 | Willamette Valley |
| C3 | Chardonnay | 2016 | Willamette Valley |
| C4 | Chardonnay | 2014 | Willamette Valley |
| C5 | Chardonnay | 2015 | Willamette Valley |
| C6 | Chardonnay | 2016 | Willamette Valley |
| C7 | Chardonnay | 2016 | Willamette Valley |
| P1 | Pinot Gris | 2017 | Willamette Valley |
| P2 | Pinot Gris | 2016 | Willamette Valley |
| P3 | Pinot Gris | 2016 | Willamette Valley |
| P4 | Pinot Gris | 2016 | Willamette Valley |
| P5 | Pinot Gris | 2016 | Willamette Valley |
| P6 | Pinot Gris | 2016 | Willamette Valley |
| P7 | Pinot Gris | 2017 | Willamette Valley |
| V1 | Viognier | 2015 | Rogue Valley |
| V2 | Viognier | 2015 | Rogue Valley |
| V3 | Viognier | 2016 | Rogue Valley |
| V4 | Viognier | 2016 | Willamette Valley |
| V5 | Viognier | 2015 | Willamette Valley |
| V6 | Viognier | 2016 | Rogue Valley |
| V7 | Viognier | 2015 | Rogue Valley |
Table 2.
Experimental design.
| Wine | Set 1 | Set 2 | Set 3 |
|---|---|---|---|
| C1 | ✔ | ||
| C2 | ✔ | ✔ | |
| C3 | ✔ | ||
| C4 | ✔ | ✔ | |
| C5 | ✔ | ||
| C6 | ✔ | ||
| C7 * | ✔ | ✔ | ✔ |
| P1 | ✔ | ✔ | |
| P2 | ✔ | ||
| P3 | ✔ | ✔ | |
| P4 | ✔ | ✔ | |
| P5 | ✔ | ||
| P6 | ✔ | ||
| P7 | ✔ | ||
| V1 | ✔ | ||
| V2 | ✔ | ||
| V3 | ✔ | ✔ | |
| V4 | ✔ | ||
| V5 | ✔ | ||
| V6 | ✔ | ✔ | |
| V7 | ✔ |
✔ = included in the set; * = sample served in every set.
Table 3.
Composition of the poles used in PPM.
| Aroma | Definition | Composition (Ratios) |
|---|---|---|
| Citrus | Aroma of citrus fruits (e.g., lemom and lime) | 1:1:1 lemon, lime, and orange (fruit juices) |
| Stone fruit | Aroma of stone fruits (e.g., peach, apricot and nectarine) | 1:1:½ nectarine (fruit juice), peach puree (The Perfect Purée®) and apricot puree (The Perfect Purée®) |
| Tropical | Aroma of tropical fruits (e.g., pineapple, guava and mango) | 2:1 pineapple (fruit juice) and mango puree (The Perfect Purée®) |
| Melon | Aroma of melon | 100 mL honeydew melon (fruit juice) and 3 drops honeydew flavor blend (Silver Cloud®) |
| Pear | Aroma of pear | Pear puree (The Perfect Purée®) |
Publisher’s Note: MDPI stays neutral with regard to jurisdictional claims in published maps and institutional affiliations. |
© 2021 by the authors. Licensee MDPI, Basel, Switzerland. This article is an open access article distributed under the terms and conditions of the Creative Commons Attribution (CC BY) license (https://creativecommons.org/licenses/by/4.0/).
Share and Cite
MDPI and ACS Style
Iobbi, A.; Tomasino, E. Adapting Polarized Projective Mapping to Investigate Fruitiness Aroma Perception of White Wines from Oregon. Beverages 2021, 7, 46. https://0-doi-org.brum.beds.ac.uk/10.3390/beverages7030046
AMA Style
Iobbi A, Tomasino E. Adapting Polarized Projective Mapping to Investigate Fruitiness Aroma Perception of White Wines from Oregon. Beverages. 2021; 7(3):46. https://0-doi-org.brum.beds.ac.uk/10.3390/beverages7030046
Chicago/Turabian StyleIobbi, Angelica, and Elizabeth Tomasino. 2021. "Adapting Polarized Projective Mapping to Investigate Fruitiness Aroma Perception of White Wines from Oregon" Beverages 7, no. 3: 46. https://0-doi-org.brum.beds.ac.uk/10.3390/beverages7030046
Note that from the first issue of 2016, this journal uses article numbers instead of page numbers. See further details here.