
TTB Labeling and Formula Processes: Evaluating Burden among Craft Brewers


1
Department of Kinesiology, Nutrition, & Recreation, Southeast Missouri State University, Cape Girardeau, MO 63701, USA
2
School of Management and Marketing, Southern Illinois University—Carbondale, Carbondale, IL 62901, USA
*
Author to whom correspondence should be addressed.
Beverages 2021, 7(3), 64; https://0-doi-org.brum.beds.ac.uk/10.3390/beverages7030064
Submission received: 2 July 2021
/
Revised: 20 August 2021
/
Accepted: 27 August 2021
/
Published: 3 September 2021
(This article belongs to the Topic Alcoholic Beverage Research (Agriculture, Processing, Business and Circular Economy, Climate Effect))
Abstract
:Previous research indicates that craft breweries experience difficulties with the Certificate of Labeling Approval (COLA) and formula approval processes established by the Alcohol and Tobacco Tax and Trade Bureau (TTB). This study evaluated the relationship between brewery characteristics and regulatory outcomes. Brewery characteristics of interest were number of full-time personnel, permit age, production volume, regulatory submission volume, and resource utilization. The outcomes evaluated were resubmission frequency of COLA and formula submissions, expense burden, and information burden. The results indicate that correspondence with TTB officials decreases resubmission frequency of formula submissions, while volume of resources used during submission preparation is positively correlated with the resubmission frequency of COLA submissions. Regarding expense burden, advice from fellow brewers and coworkers decreases burden associated with formula submissions and COLA submissions, respectively. The results indicate that the COLA and formula processes are associated with substantial information burden and are significantly associated with certain brewery characteristics.
1. Introduction
The Alcohol and Tobacco Tax and Trade Bureau (TTB) is responsible for regulatory oversight of the alcohol production (import and wholesale), as well as tobacco manufacturing and importing businesses in the United States (US). As such, one of the TTB’s objectives is to ensure beverage industry compliance with alcohol permits, labeling, and marketing requirements [1]. Consequently, the TTB presides over the approval process(es) for the formulation and labeling of craft beer.
Previous research suggests that these processes have resulted in a complicated interchange between the American craft brewing industry and the TTB. Craft brewers’ misunderstanding of regulations and frustration with the labeling and formula approval process(s) have resulted in untimely or inefficient approvals, and/or costs in the form of staff time, lost revenue, or legal assistance [2]. For TTB officials, the ambiguous communication has resulted in a substantial volume of flawed label and formula submissions, which is associated with an increased resubmission volume [3]. This issue has intensified due to a substantial increase in the volume of regulatory submissions.
Governance of alcohol production in the United States has roots that date back to the repeal of Prohibition in 1934. In the previous decades, regulation evolved so that alcohol producers were subject to multiple forms of oversight at the local, state, and federal levels. This separate, yet simultaneous regulation from multiple entities translated to substantial regulatory burden for alcohol producers, including breweries. Depending on the state, there may be as many as 12 alcohol-specific regulatory procedures (all with associated wait times and costs) that brewers must complete prior to bringing their product to market: moreover, all of these procedures represent obligations beyond that which is expected of any new business owner (i.e., zoning ordinances, incorporation rules, etc.) [4]. Consequently, it is critical to acknowledge that the labeling process and associated formula approval process represent just one of many regulatory hurdles experienced by brewers. Despite these challenges, the craft brewing industry has experienced significant growth in recent history: From 2008 to 2019, the number of operating craft breweries increased from approximately 1570 to over 8500 [5]. In the past decade, annual industry growth rates have been as high as 18% (in 2013 and 2014) but have recently slipped to more conservative values. In 2019, the growth rate was just under 4% [6,7,8]. The Brewers Association (a trade organization that represents the US craft brewing industry) defines a brewery as “craft” if it meets the following three criteria: (1) the brewery must be “small,” with production of six million barrels of beer or less annually, (2) the brewery must be independent, with no more than 25% ownership by a non-craft beverage alcohol industry member, and (3) the brewery must have a valid TTB Brewer’s Notice and produce beer [9].
All malt beverages that are intended for interstate distribution must be approved through the TTB’s Certificate of Labeling Approval (COLA) approval process. In addition, some products are subject to the formulation approval process as part of the labeling approval process. Formula approval for malt beverages is conducted by a TTB “Formula Specialist,” and is typically required when flavoring or coloring materials have been added [10]. TTB Ruling(s) 2014-4 and 2015-1 lessened the number of products that required formula approval by providing a list of ingredients and processes that were considered “traditional” and thus did not require submitters to submit a formula approval as part of the labeling approval process [11]. Previous research suggests that identification of appropriate ingredients is among the largest hurdles associated with formula approvals. Despite the provision of guidance documents from the TTB, it is still unclear to some brewers which items require formula approval [2].
While a number of online and face-to-face instructional resources exist to inform brewers of TTB regulations and expectations, research indicates that these resources are nonspecific and arguably difficult to navigate. Qualitative data suggests that brewers associated with smaller breweries rely heavily on guidance from other brewers, especially those that exist in the same geographic community. In contrast, brewers associated with larger breweries rely on an internal system to satisfactorily complete labeling and formula approvals [2]. The aforementioned resources available to craft brewers related to the labeling and formula approval process include the following:
- TTB’s “Beer Labeling” webpage [12];
- TTB-provided seminars and workshops (i.e., the “TTB Bootcamp,” held at the Craft Brewers Conference);
- Advice/guidance from fellow brewers;
- Guidance/training from fellow employees or managers;
- Correspondence with TTB officials;
- Items on the Brewers Association webpage;
- Attachment 1 of TTB Ruling 2015-1 [13].
Craft Breweries as Small Businesses
The National Small Business Association (NSBA) is an advocacy organization representing the interests of small businesses in the United States. The NSBA currently has 65,000 members “in every state and every industry” [14]. In 2017, the NSBA released the results of their “Small Business Regulations Survey,” which indicated that governmental regulation of small businesses is associated with significant burden for small business owners in the form of expense, time, and legislative complexity [15]. Another study by Kaya (2020), using the United States Small Business Friendliness Survey, pointed out that more regulations, administrative burden, and government intervention led to less entrepreneurial activity in the United States [16].
Regulatory burden is defined as “the costs imposed on businesses by the regulatory framework” [17]. The items that comprise regulatory burden include compliance costs, as well as administrative and paperwork costs and disincentives associated with regulations. Regulatory burden is associated with frustration of the overall business performance of the regulated entity [17]. Research with craft brewers indicated that the regulations surrounding product formulas and labels were burdensome. Brewers indicated the burden may take multiple forms, including lost sales revenue from delayed product launches, time spent reviewing regulations, time spent in correspondence with TTB officials regarding submissions, and expense for consulting or legal assistance, among others [2].
At its most extreme, regulatory burden can be characterized as “regulatory overload,” which occurs when the volume and complexity of regulations is such that it reduces compliance, innovation, and increases uncertainty [17]. Previous research with craft brewers indicated that the nature of the labeling and formula approval processes may encumber creativity: “We make some really creative beers, but because of the formula submittal process, it keeps us from sending that stuff outside our own walls” [2].
Additionally, regulatory overload may ultimately reduce safety because regulated entities are overwhelmed with an unclear and/or complex regulatory regime, which hinders their ability to appropriately comply [17]. This is evidenced in previous research where some brewers associated with smaller breweries may make operational decisions that allow them to “fly under the regulatory radar,” which is counter to TTB’s mission of protecting consumers [2].
Fairman and Yapp (2005) assert that regulatory compliance can be analyzed using an economic perspective, in which it is expected that firms will conform to a regulation if the costs associated with “getting caught” exceed the benefit(s) of noncompliance. In their research involving small and medium sized enterprises (SMEs) (specifically, food trade bodies) and regulatory authorities, they found that the compliance process is decidedly reactive with businesses responding to outside intervention rather than proactively initiating compliance activities [18]. Research with brewers indicates that label and formula approvals for craft beer are characterized in part by back-and-forth communication between submitters and regulatory officials [2]. Communication of this nature may indicate that brewers circumvent the information cost associated with error-free submissions, instead relying on the process and feedback from officials to correct their submissions. However, this interchange increases approval times and can frustrate productivity of a brewery. Furthermore, this drastically increases the workload for TTB reviewers [3].
A 2017 audit of the TTB’s label and formula approval processes indicated that there existed an opportunity to improve the efficiency of labeling and formula approvals, particularly through modification of their resubmission policy. The results of the audit indicated that resubmitted applications for labels drastically increased the TTB workload. Data from 2014 indicated that resubmissions represented approximately 31% of the submitted Certificate of Labeling Approval (COLA) applications: 207,000 total applications were processed, of which 142,000 were initial applications [3]. The TTB’s response to the analysis of their resubmission policy was that increased processing times were due to industry misunderstanding. Thus, they (the TTB) were not interested in modifying the resubmission policy [3].
According to the NSBA regulations survey, the average small-business owner spends approximately USD 12,000 per year on items stemming from regulation. Among the 1000 business owners surveyed in the NSBA’s research, approximately half of participants indicated that they spend USD 5000 annually in direct regulatory expenses, and an additional USD 5000 in indirect regulatory expenses [15]. In their survey, direct costs included employee pay adjustments, daily work routine changes, attorney fees, and workplace upgrades. Indirect costs included time taken away from other business tasks to understand regulations, and time taken to meet with specialists [15]. Likewise, research conducted by the United States Chamber of Commerce suggests that the economic cost of federal regulations annually is USD 1.9 trillion, with costs for smaller businesses (those with 50 employees or fewer) estimated to be 20% higher than the mean for all firms [19]. Regarding time, 25% of small business owners report spending more than 10 h per month on federal regulatory compliance, and 14% report spending more than 20 h per month [15].
Bickerdyke and Lattimore (1997) defined compliance costs as those associated with requirements imposed on firms by governmental regulations or taxes [17]. Bradford (2004) asserts that many regulations are associated with economies of scale in compliance; specifically, that an inverse relationship exists between firm size and the compliance costs [20]. Consequently, compliance costs for small business may be extensive relative to those of their large corporate counterparts, in part because the fixed costs of compliance land on a smaller income base [17].
Craft brewers’ report extensive use of operational resources in securing federal regulatory label and formula approvals. For some breweries, the use of outside legal assistance is used to expedite the process, while others devote significant staff time to preparing submissions and corresponding with the TTB following initial submissions to clarify or correct errors. Additionally, craft brewers have indicated that the cumbersome nature of labeling and formula regulations may result in lost sales revenue and a limited ability to expand their product offering [2]. This phenomenon is not strange when considering the historically strained relationship between beverage alcohol producers and regulatory entities in the United States. For example, regulation of whiskey labeling had undesirable consequences for certain producers in the 1940s and beyond: labeling regulations set forth by the Federal Alcohol Administration (FAA) ultimately limited the diversification of whiskey products (particularly American “light whiskey”) and encouraged consumer deception. Although the FAA was tasked with the prevention of dishonest labeling, as well as the promotion of competition among whiskey producers, discriminatory labeling regulations were arguably prohibitive to production of American “light whiskey” [21].
Regulatory burden may also manifest as information burden, which refers to difficulties associated with comprehending and applying regulations. Bradford (2004) asserts that burden of this nature is perhaps “the most overlooked cost of government regulation.” Information burden can include the tasks associated with (1) staying current with new or revised regulations, (2) interpreting regulations to determine their application, and (3) verifying the steps necessary for compliance [20]. Previous research with craft brewers indicates that assimilating existing regulations, as well as staying abreast of new regulations has proven difficult in their operations. For some brewers, information burden has materialized as inefficient label and/or formula approvals [2]. This supports Bradford’s (2004) assertion that small businesses are at a disadvantage in monitoring and interpreting regulations [20].
The nature of regulations may partially comprise information burden. Small business owners indicated that complexity of rules, volume of rules, interpretational difficulty, and the contradictory nature of some rules represented significant burden [15]. Research with craft brewers indicates that the volume and ambiguous nature of TTB rulings related to labeling and formula approval have been difficult, especially in their communication with TTB officials. Regarding labeling approvals, craft brewers partially attributed confusion to inconsistencies in policy interpretation among TTB reviewers. Brewers may receive approval for one label but receive pushback on a subsequent label for a product claim or product name that had previously been approved [2]. Furthermore, brewers reported receiving inconsistent feedback per label in the back-and-forth communication with the TTB regarding applications, due in part to different reviewers. Additionally, use of language specific to craft beer styles (i.e., “Saison”, “Irish ale”) has proven to be a point of contention between craft brewers and TTB officials [2].
“Regulatory capture” is an economic idea that individuals working within a governmental agency become in fact agents for the very industries they are tasked with regulating [22]. They see the regulations from the perspective of the companies they are supposed to be regulating and eventually, either from self-interest or by the public good, find it best to work with and support the needs of these actors. Regulatory capture has been abused in various industries such as railroads, utilities, and financial services, however, it does not always have to be corrosive. Kay (2010) suggests that regulators need information to fulfill their job effectively, therefore they work with the companies they are regulating. In doing, they see these managers as honest and committed individuals with no ill regard or hostility to the common good [23].
Smaller businesses typically employ fewer personnel, which may translate to less specialization in job duties. The results of the NSBA regulations survey indicate that small business owners are the “number one regulatory expert” in most instances and shoulder the majority of regulatory obligations in their firms [15]. Similarly, proper navigation of the labeling and formula approval process is just one of many responsibilities a craft brewer must consider while operating their business. Consequently, improved instruction of regulations amongst brewers may improve the quality of their formula and label submissions, thereby decreasing the time investment required by regulatory officials.
In order to improve the efficiency and clarity of the label and formula approval processes among craft brewers, it is necessary to better understand brewery characteristics that impact outcomes associated with regulatory submissions. To date, the brewer experience with regulations that specifically govern the labeling and formula approval processes is largely unstudied. Consequently, this research aims to inform industry and academia on the present state of the brewer regulatory experience as they navigate COLA and formula submissions.
2. Materials and Methods
2.1. Study Purpose
The purpose of this study was to evaluate the role of craft brewery characteristics on success with the federal labeling and formula process(es) in the United States. The assertions of Bickerdyke and Lattimore (1997) and Bradford (2004) suggest that firm size and scope impact the prowess with which a business can navigate regulatory requirements [17,20]. Consequently, this study aimed to evaluate if the following characteristics impacted the success of TTB regulatory submissions: number of personnel, production volume (in BBL/year), TTB permit age, volume of label and formula approval submissions, volume of resources utilized during preparation, and type of resources utilized during submission. Success of regulatory submissions was operationalized using resubmission frequency, measures of expense burden, and measures of information burden.
2.2. Research Questions
- Research Question 1: What is the relationship between brewery characteristics and resubmission frequency of labeling and formula submissions?
- Research Question 2: What is the relationship between brewery characteristics and expense burden of label and formula submissions?
- Research Question 3: What is the relationship between brewery characteristics and information burden of label and formula submissions?
2.3. Sample
The population of interest for this study was American craft breweries that met the definition of “craft” as established by the Brewers Association. Consequently, the Brewers Association member directory was used to develop an email list of potential study participants. Email addresses for this study were retrieved by visiting each of the brewery member websites and locating the email contact. The final email list contained 1581 email addresses.
For final data collection, the survey was advertised and implemented using the Dillman et al. (2009) method [24]. A survey pre-notice, invitation to participate, and four reminders were sent to potential study participants. Survey participation was incentivized by a chance to win free registration to the 2020 Craft Brewers Conference, hosted by the Brewers Association.
2.4. Instrument
An online survey was developed and distributed to 1581 craft brewers nationwide. A copy of this instrument is provided in the Supplementary File. The survey contained two qualifying items that allowed participation in the study. The first of these qualifying items ensured that the participant was associated with a brewery that had prepared at least one COLA submission. The second item asked the participant to characterize his/her involvement (not involved, somewhat involved, very involved) in the COLA submission process to ensure he/she could adequately answer the remaining items: participants that indicated they were not involved in the COLA process were thanked for their participation and directed to the end of the survey. The remaining sections of the survey were as follows:
2.4.1. Brewery Information
Participants were asked to provide background information on the brewery with which they were affiliated, including number of full-time personnel, annual production volume in BBL/year (a BBL is approximately 31 gallons), Brewers Association category, and year that the TTB’s Brewers Permit was secured.
2.4.2. Certificate of Label Approval (COLA) Submission Experience and Formula Submission Experience
Participants were asked to answer items related to their experience with the (1) COLA submission process and (2) formula submission process (if applicable) in two separate survey sections. Items included annual submission volume, time (in hours) spent per submission, and time spent in correspondence with TTB officials per submission. Participants were also asked to indicate their frequency of use of certain resources during the submission process(es). In the COLA section, specifically, participants were asked to indicate their experience with keg and retail submissions.
Participants were asked to evaluate the level of information burden associated with COLA and formula submissions by rating the following four items on a scale from one (not burdensome) to six (very burdensome): (1) complexity of rules, (2) quantity of rules, (3) inconsistency among TTB reviewers, and (4) contradictions between TTB rulings and rulings of other agencies (i.e., state or local rulings). These four items were adapted from the NSBA 2017 Small Business Regulations Survey. A six-point scale was used to capture a clear assessment of the tendency (not burdensome or very burdensome) by avoidance of a midpoint. Furthermore, some psychometric research indicates that use of a six-point scale may yield higher reliability than use of a five-point scale [25].
Information burden was also evaluated through use of two, three-item agreement scales regarding navigation of TTB regulations and available resources (one for COLA submissions, one for formula submissions). The items in the scale included the following: (1) The TTB [labeling/formula] requirements are difficult to navigate, (2) existing resources meet the needs of craft brewers as they prepare [COLA/formula] submissions, (3) additional resources for craft brewers would improve success with the [COLA/formula] process. These items were informed by themes that emerged from previous qualitative research and were developed by the primary investigator [2].
Participants were asked to indicate the level of expense burden associated with COLA and/or formula submissions by indicating “yes” or “no” to past absorption of the following expenses: employee pay adjustment, daily work routine changes, consulting/attorney fees, lost sales revenue, time taken away from other business tasks to understand regulations, and time to meet with consultants. These items were adapted from the 2017 NSBA Small Business Regulations survey. Inclusion of these items were further justified following qualitative research with craft brewers that indicated the described expenses were commonly experienced as part of label and formula submissions.
2.4.3. Resubmission Frequency
Following completion of the COLA experience and formula experience survey section(s), participants were asked to indicate if they had been required to resubmit an approval submission due to errors. If respondents answered “yes,” they were asked to indicate what percentage of their previous COLA/formula submissions required resubmission. Subsequently, participants were asked to indicate the types of errors their submission contained.
2.4.4. Additional Resources
Participants were asked to indicate if they were interested in resources that addressed the following content areas: COLA submission, formula submissions, and/or submission of ingredients for inclusion on the TTB exemption list.
2.5. Variables
Brewery characteristics that served as independent variables were as follows: number of personnel, production volume (in BBL/year), TTB permit age, volume of label and formula approval submissions, volume of resources utilized during preparation, and type of resources utilized during submission. The data for these variables were collected using the following survey questions:
- Personnel: How many full-time personnel (personnel working 40 or more hours per week) are currently employed by your brewery? (ex: 14, 5.5, 30, etc.)
- Production volume: What was your brewery’s production in BBL/year for its most recent fiscal year? (Please enter a whole number)
- Permit age: In what year did your brewery secure its TTB Brewer’s Permit? Following data collection, the “Permit Age” variable was created by subtracting participant responses from the year in which the analysis was conducted.
- Submission volume: Approximately how many total [bottle COLA/keg COLA/formula] submissions has your brewery submitted for TTB approval?: 1–5 submissions, 5–10 submissions, 11–20 submissions, greater than 20 submissions. Submission volume data for bottle COLA, keg cola, and formula submissions was collected through three different survey items.
- Resource Volume: The number of substantive responses (sometimes, most of the time, always) to the frequency scale for the following matrix item were totaled per participant. This resulted in a value between zero and five for total number of label resources used, and a value between zero and six for total number of formula resources used.
Matrix item: How often does your brewery use the following resources to assist with [COLA/formula] submissions? (TTB website, Brewers Association website, advice from fellow brewers, advice/training from a coworker or boss, correspondence with TTB officials) (answer options: always, most of the time, sometimes, rarely, never).
- Resource Type: Utilized the matrix evaluated for “Resource Volume.”
The dependent variables of interest were resubmission frequency, information burden, and expense burden. The data for these variables were collected and operationalized using the following survey items:
- Resubmission frequency: Approximately how many of your brewery’s [COLAs/formula submissions] have required resubmission? (Participants responded with use of a sliding scale).
- Information burden: Information burden was operationalized in part through a summation variable that totaled participant responses to the four-item burden matrix, described previously. These data were collected separately for COLA submissions and formula submissions. A second summation variable was created using participant responses to the three-item matrix that assessed brewer perceptions of regulatory navigation and available resources.
- Expense burden: The “Expense Burden” variable was created by totaling the number of “yes” responses to the list of potential expenses associated with regulatory submissions. This variable could take on a value from zero to six. These data were collected separately for COLA submissions and formula submissions.
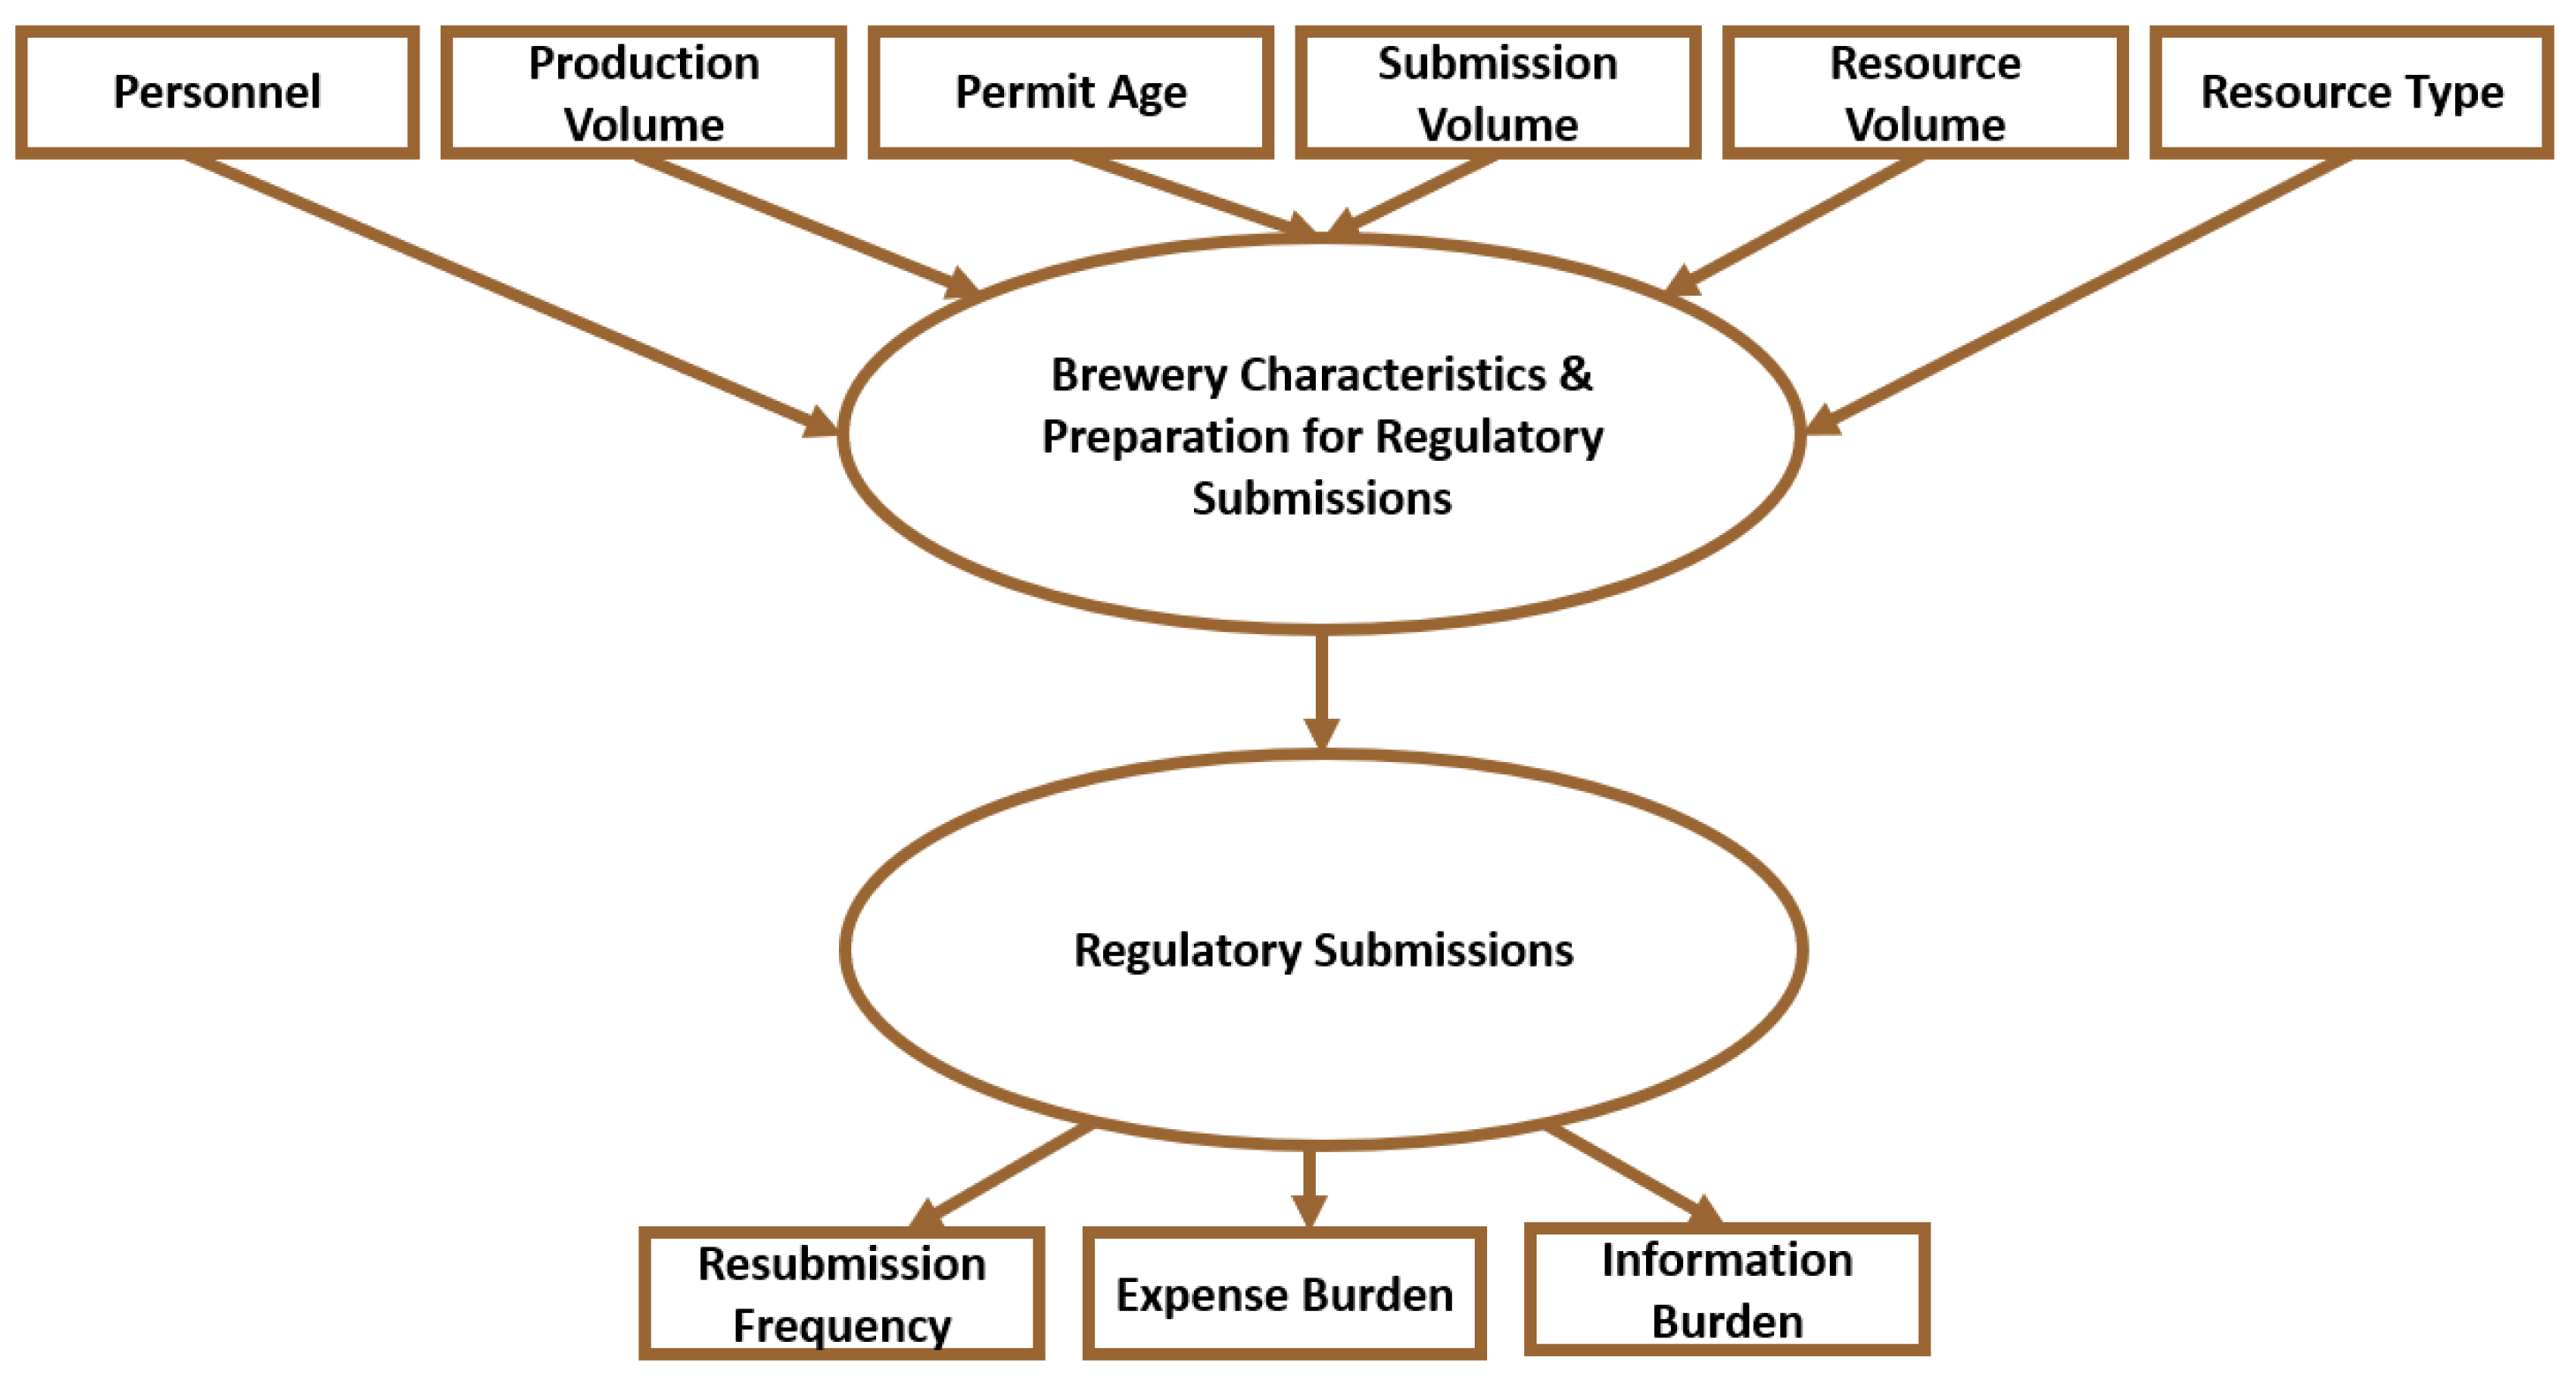
The research model is presented in Figure 1:
The instrument was piloted in July 2019. Additionally, the survey was reviewed by a panel of experts, which included a Brewers Association official, a state craft brewers guild director, and a Professor of Fermentation at Southern Illinois University—Carbondale.
3. Results
The final sample was comprised of 142 members of the Brewers Association. There were 218 survey responses with 76 incomplete submissions due to disqualification from one of the screening items or participant failure to finish the survey. The survey instrument was designed with branching logic: based on the nature of their responses, participants were asked to answer between 19 and 47 items. One of the constructs associated with branching logic was previous experience with the TTB’s formula submission process: 78 survey participants indicated that they had previously prepared a formula submission.
Table 1 provides a breakdown of the brewery types represented by the final sample. Microbreweries were the most represented brewery type in the final sample, followed by brewpubs and taproom breweries, with regional breweries and contract breweries possessing the least representation.
Table 2 provides operational characteristics of the final sample, including production volume, permit age, and number of full-time personnel. The mean permit age for the final sample was approximately seven years, with a mean production volume of approximately 7000 BBL/year. The mean number of full-time personnel was approximately 14, although this value was associated with a relatively large standard deviation (SD = 38.83).
Pearson’s correlations were conducted to evaluate the relationship between brewery characteristics. As indicated in Table 3, there were statistically significant positive correlations observed between permit age, production volume, and personnel, which suggests that these markers of operational scope are related in a traditional manner: older breweries are associated with greater production volume and employment of more personnel.
Table 4 provides submission volume frequency data for bottle COLA, keg COLA, and formula submissions. For both retail (bottle/can) COLA submissions, and keg COLA submission, the majority of participants had previously prepared greater than 20 submissions. Regarding formula submissions, the majority of participants had previously prepared 1–5 submissions.
Table 5 contains descriptive data regarding participant use of provided resources. This descriptive data suggests that the most frequently used resource during preparation of COLA and formula submissions was the TTB Website. During formula preparation, it appears that the TTB Ingredient Exemption List was frequently used among submitters.
3.1. Resubmission Frequency
Descriptive data for resubmission frequencies are provided in Table 6. As indicated, the mean volume of COLA submissions requiring resubmission was 33.0%; the mean volume of formula submissions requiring resubmission was 14.6%.
Research Question 1: What is the Relationship between Brewery Characteristics and Resubmission Frequency of Labeling and Formula Submissions?
Research Question 1 was evaluated in part through a series of simple linear regressions using personnel, production volume, and permit age as independent variables and resubmission frequency as the dependent variable. There was no significant prediction of resubmission frequency using any of the identified independent variables. Additionally, univariate analysis of variance (ANOVA) was used to evaluate if there was a difference in resubmission frequencies among breweries of different submissions volumes. There was no significant difference in resubmission frequencies among submission volume categories.
To evaluate the role of resource use in resubmission frequency, a series of five simple linear regressions were performed using each of the provided resources for COLA preparation as independent variables. These results are provided in Table 7. The data suggest that there was no significant prediction of COLA resubmission frequency using resource types as independent variables. Similarly, six simple linear regressions were conducted using each of the provided resources for formula preparation as independent variables (also provided in Table 7). Correspondence with TTB officials during preparation significantly predicted formula resubmission frequency (F (1, 70) = 5.53, p = 0.022, R2 = 0.073). This model contained a negative coefficient, which suggests that as correspondence with TTB officials increases, formula resubmission frequency decreases.
Research Question 1 was also evaluated through use of Pearson’s correlations, using number of resources used and resubmission frequency as variables. Descriptive data regarding the mean volume of resources used during submission preparation are provided in Table 8.
The results of the Pearson’s correlation analyses are provided in Table 9. There was a significant but weak positive correlation between the number of resources used and resubmission frequency of COLA submissions. The positivity of this correlation is unexpected, as it suggests that as the volume of resources utilized increases, the resubmission frequency increases as well.
3.2. Expense Burden
Frequency data for the expense burden variable are provided in Table 10. On average, participants reported past absorption of two of the six listed expenses associated with the COLA and formula submission process. The most frequently cited expense associated for both COLA and formula submissions was “time taken away to understand other business tasks”.
Research Question 2: What is the Relationship between Brewery Characteristics and Expense Burden of Label and Formula Submissions?
Research Question 2 was evaluated in part through a series of simple linear regressions using expense burden as the dependent variable and number of personnel, production volume, and permit age as independent variables. There was no significant prediction of expense burden of COLA or formula completion using production volume, personnel, or permit age as predictors.
A series of simple linear regressions were performed to evaluate the role of resource type in predicting Expense Burden, using each of the provided resources for COLA and formula preparation as independent variables. The results of these analyses are provided in Table 11. Advice or training from a boss/coworker significantly predicted expense burden of COLA submissions (F (1,134) = 11.92, p = 0.001, R2 = 0.082). Regarding formula preparation: Advice from a fellow brewer significantly predicted Expense Burden (F (1,73) = 5.903, p = 0.018, R2 = 0.075). These models contained negative coefficients, which indicates that as use of these resources increases, brewers experience fewer expenses related to the labeling/formula preparation.
3.3. Information Burden
Descriptive statistics for information burden using the burden scale are provided in Table 12. Inconsistency among TB reviewers had the highest burden mean score associated with COLA and Formula Submissions, followed by Complexity of Rules, Quantity of Rules, and Contradictions between TTB Rulings of Other Agencies.
Descriptive data for brewer perceptions of regulatory navigation and available resources are provided in Table 13. The mean participant responses suggest that existing regulations are challenging, and additional resources would be beneficial during preparation.
Research Question 3: What is the Relationship between Brewery Characteristics and Information Burden of Label and Formula Submissions?
Research Question 3 was evaluated in part through a series of simple linear regressions using personnel, production volume, and permit age as independent variables and total information burden score as the dependent variable. There was no significant prediction of information burden for COLAs or formulas using any of the chosen independent variables.
Additionally, a series of simple linear regressions were performed using personnel, production volume, and permit age as independent variables, and the total perception score as the dependent variable. These results are provided in Table 14. The results indicate that production volume significantly predicts brewer perception of regulatory navigation and resource availability of label submissions (F (1,139) = 3.923, p = 0.050); although it is worth noting that this prediction is associated with a small effect size (R2 = 0.027).
Univariate analysis of variance (ANOVA) tests were conducted to evaluate if total regulatory perception scores differed between participants associated with differing submission volumes. The results of these analyses are provided in Table 15. The analyses indicated that there were differing perceptions among submission volume categories of Keg COLA submissions (F (3,103) = 3.97, p = 0.01); although analysis of the descriptive data indicates that the trend of mean responses is unclear as submission volume increases: Tukey post hoc analysis indicates that there is a significant difference between the “11-20” submission volume group and the “greater than 20” submission volume group.
The analyses indicated there were differing perceptions among formula submission categories as well (F (3,71) = 3.14, p = 0.03). Analysis of the descriptive data indicate that perceptions toward the TTB formula regulations are more favorable as submission volume increases. Tukey post hoc analysis indicates that there is a significant difference between the “1-5” submission volume group and the “greater than 20” submission volume group. There were no significant differences in perception scores between Bottle COLA submission volume categories.
Each of the provided resources for COLA and formula preparation were used as independent variables in the regression analyses. These results are displayed in Table 16. Regarding COLA preparation: use of the Brewers Association website (F (1,134) = 5.97, p = 0.016, R2 = 0.043), advice from fellow brewers (F (1,134) = 8.798, p = 0.004, R2 = 0.061), and correspondence with TTB officials (F (1,134) = 6.396 p = 0.013, R2 = 0.044) significantly predicted information burden of COLA submissions. Each of the regression coefficients for these linear regression models were negative, indicating that as use of these resources increased, information burden decreased.
Regarding formula preparation: advice from a fellow brewer (F (1,73) = 9.379, p = 0.003, R2 = 0.114), and advice from a boss/coworker (F (1,73) = 6.899, p = 0.011, R2 = 0.087) significantly predicted information burden. The negativity of the regression coefficients suggests that as brewers use these resources, information burden decreases.
Participants were asked to indicate their interest in additional resources in the following three areas: (1) COLA submissions, (2) formula submissions, (3) submissions to include ingredients on the TTB ingredient exemption list. Frequency data for participant resource interest is provided in Table 17.
4. Discussion
4.1. Resubmission Frequency
The findings from this study indicate that brewery characteristics are not a justified predictor of resubmission frequency of COLA or formula submissions. These findings seem to be in alignment with the OIG’s evaluation of the data collected during the 2017 audit of the TTB’s submission processes. While the TTB asserted that noncompliant submissions (and thus, high resubmission frequencies) were the result of new industry members, review of this data by the OIG found that this difference was not substantial [3]. The results of this study do not suggest that new industry members (indicated by permit age) have statistically higher resubmission frequencies.
Consequently, further evaluation of the online processes for regulatory submissions is warranted. While the indicators for information burden all yielded meaningful descriptive results, the most burdensome item for COLA submissions was “inconsistency among TTB reviewers,” which may indicate that the provision of a unified regulatory interpretation may assist both parties (TTB officials and brewers) in efficient submissions and subsequent approvals. This is further evidenced by evaluation of the indicators for expense burden: “time taken away from other business tasks to understand regulations” was the most frequently cited expense for both label and formula submissions.
The results of this study indicate that there are not strong relationships between resource use and the frequency of COLA and formula resubmissions. The data suggested that there is a significant prediction of formula resubmissions using “correspondence with TTB officials” as a predictor; however, this was the only statistically significant relationship identified in the analysis of resource type and resubmission frequency.
Furthermore, the number of resources used during submission preparation was related to resubmission frequency in an unexpected manner: the number of resources used during formula preparation was not significantly related to resubmission frequency, and the number of resources used during COLA preparation was positively correlated with resubmission frequency. This finding is counter to conventional expectation, as it suggests that resubmission frequency increases as submitters employ more resources during COLA preparation. Although this finding is likely associated with multiple implications, it may suggest that the provided resources do more harm than good in informing brewers of COLA expectations.
4.2. Expense Burden
Brewery characteristics seem to be largely unrelated to the expense burden associated with regulatory submissions. There was no significant prediction of expense burden using operational characteristics such as number of full-time personnel, production volume, or permit age. This finding is not in alignment with literature regarding regulation of small businesses: while previous research indicates that firm size is negatively correlated with expense burden, these findings related to craft breweries suggest that regulatory expenses associated with label and formula approvals are not necessarily more burdensome as brewery size increases or decreases.
The results suggest that advice from a boss and/or coworker during label preparation is associated with less expense burden, while brewer advice significantly predicted less expense burden in the preparation of formula submissions. These findings indicate that gathering the perspectives of fellow craft brewing industry members is useful for brewers as they prepare submissions, while use of traditional resources does not reduce expense burden.
4.3. Information Burden
While descriptive data indicate that there is substantial information burden associated with COLA and formula submissions, brewery characteristics were not predictive of the first measure of information burden used in this study. However, information burden was also evaluated using a perception score that captured brewer perceptions of navigational difficulty of regulations and available resources. Although brewery production volume was a significant predictor of this perception score, this relationship was associated with a very small effect size (R2 = 0.027), indicating that there is a great deal of unexplained variance. There were significant differences in perception scores using submission volume of formula submissions and Keg COLAs. As submission volume of formulas increases, perception of the navigational difficulty and available resources trends more favorably. This may indicate that increased experience with formula submissions is associated with decreased information burden.
Regarding COLA preparation, the results indicate information burden decreased with increased use of (1) advice from fellow brewers and (2) correspondence with TTB officials. Regarding formula preparation, the results suggest that (1) advice from a boss/coworker and (2) advice from fellow brewers significantly predicted information burden: as use of these resources increased, information burden decreased.
Regarding additional resources, the survey results indicated that brewers are most interested in content related to COLA preparation, although over half (52.1%) of respondents indicated interest in formula preparation resources as well. While there was less interest in resources regarding ingredient inclusion on the TTB Ingredient Exemption List, only 3.5% of survey respondents indicated that they had previous experience preparing an ingredient submission. Consequently, many brewers may not have good context for this process and the benefit/lack thereof potentially associated with additional resources.
5. Conclusions
The results of this study indicate that the TTB labeling and formula processes are burdensome for brewers, with burden primarily manifesting as resubmission of COLA and formula submissions and substantial information burden. Overall, brewery characteristics do not provide meaningful prediction of regulatory burden, which is in alignment with the Office of Inspector General’s review of the TTB’s COLA and formula submission processes (2017) [3]. Consequently, future research should identify and evaluate other variables that impact the brewer experience with regulatory submissions. Perhaps the most unexpected finding was the lack of relationship between number of full-time personnel and expense burden, information burden, and resubmission frequency. While the small-business literature suggests that more personnel would lessen regulatory burden due to greater job specialization, the findings of this study indicate otherwise. While further research should aim to identify variables with predictive ability regarding resubmission frequency, the lack of relation between brewer preparation and operational characteristics may provide justification for critical evaluation of current regulations.
The data suggest that correspondence with fellow brewers, TTB officials, and coworkers and/or bosses are more meaningful in predicting the success of regulatory submissions. Participants tended to “agree” that additional resources would be beneficial in submission preparation and “disagree” that current resources meet brewers’ needs. Consequently, future research should also aim to determine the types of resources that would best facilitate brewer success with the labeling and formula processes.
Additionally, future research should evaluate the perceptions of regulatory officials as it pertains to labeling and formula approvals. Data regarding the types of errors most commonly committed by brewers in regulatory submissions would be valuable in informing industry, as well as in the instructional design of resources. It is important to recognize that the TTB has provided a number of resources to brewers as they prepare submissions, including: extensive availability of officials to craft brewers via phone call or email, a substantial volume of information on their website, TTB seminars at industry conferences, as well as an online “decision tree” that assists brewers in determining if their product(s) requires a formula approval. Consequently, future research should involve the TTB to comprehensively address brewer hurdles to labeling and formula approval. Furthermore, future research should identify the needs of TTB reviewers as they process label and formula approvals for craft beer: qualitative results indicate that TTB reviewers may have a limited understanding of craft beer styles and types [2]. In this sense, regulatory capture could be applied that would help inform and educate TTB regulators while improving the labeling and formula approval process for the breweries. Assessing the knowledge of TTB reviewers as it pertains to craft beer production may assist in identifying solutions that can be helpful to both government and industry.
The limitations associated with this study should be noted. Many of the items were contingent on participant memory, which may be subject to bias and mistakes. Perhaps the largest limitation associated with this study was the low survey response rate.
Supplementary Materials
The following are available online at www.mdpi.com/article/10.3390/beverages7030064/s1, Supplementary File: Survey Instrument.
Author Contributions
Conceptualization, C.C.; methodology, C.C.; validation, C.C.; formal analysis, C.C.; investigation, C.C.; resources, C.C.; data curation, C.C.; writing—original draft preparation, C.C.; writing—review and editing, S.S.; visualization, C.C.; supervision, S.S.; project administration, S.S. Both authors have read and agreed to the published version of the manuscript.
Funding
This research received no external funding.
Institutional Review Board Statement
The study protocol was approved by the Human Subjects Committee of Southern Illinois University—Carbondale (Assurance Number: 00005334).
Informed Consent Statement
All subjects gave their informed consent for inclusion before they participated in the study.
Data Availability Statement
Data is available upon request.
Conflicts of Interest
The authors declare no conflict of interest.
References
- Alcohol and Tobacco Tax and Trade Bureau (TTB). About Us: What We Do. Available online: https://www.ttb.gov/about-ttb#:~:text=Our%20mission%20is%20to%20collect,marketing%20requirements%20to%20protect%20consumers (accessed on 1 April 2021).
- Cervantes, C.; Smith, S.; Null, D. Malt Beverage Formulation and Labeling: Brewers’ Perceptions and Need for Resources. Int. J. Hosp. Beverage Manag. 2021, 7, 64. [Google Scholar]
- Office of Inspector General (OIG): Department of the Treasury. (3 October 2017); Audit Report: Opportunities Exist to Enhance TTB’s COLAs and Formulas Online Programs. Available online: https://www.oversight.gov/sites/default/files/oig-reports/OIG-18-001.pdf (accessed on 1 April 2021).
- Mitchell, M.; Koopman, C. Bottling up Innovation in Craft Brewing: A Review of the Current Barriers and Challenges. Mercatus Policy. 2014. Available online: https://www.mercatus.org/system/files/MitchellKoopman-CraftBrewing-MOP.pdf (accessed on 1 April 2021).
- Brewers Association. National Beer Sales and Production Data. Available online: https://www.brewersassociation.org/statistics-and-data/national-beer-stats/ (accessed on 1 March 2021).
- Brewers Association. Brewers Association Announces 2013 Craft Brewer Growth. Available online: https://www.brewersassociation.org/press-releases/brewers-association-announces-2013-craft-brewer-growth/#:~:text=As%20a%20primary%20driver%20of,6.5%20percent%20the%20previous%20year (accessed on 1 March 2021).
- Brewers Association. Craft Brewer Volume Share of US Beer Market Reaches Double Digits in 2014. Available online: https://www.brewersassociation.org/press-releases/craft-brewer-volume-share-of-u-s-beer-market-reaches-double-digits-in-2014/ (accessed on 1 March 2021).
- Brewers Association. Brewers Association Releases Annual Growth Report. Available online: https://www.brewersassociation.org/press-%20releases/brewers-association-releases-annual-growth-report/ (accessed on 1 March 2021).
- Brewers Association. Craft Brewer Definition. Available online: https://www.brewersassociation.org/statistics-and-data/craft-brewer-definition/ (accessed on 1 April 2021).
- Alcohol and Tobacco Tax and Trade Bureau (TTB). Formulation – Alcohol Beverage Formula Approval. Available online: https://www.ttb.gov/formulation (accessed on 1 March 2021).
- Alcohol and Tobacco Tax and Trade Bureau (TTB). Ingredients and Processes Used in the Production of Beer Not Subject to Formula Requirements. Available online: https://www.ttb.gov/images/pdfs/rulings/ttb-ruling-2015-1-malt-beverage-formulas.pdf (accessed on 1 February 2021).
- Alcohol and Tobacco Tax and Trade Bureau (TTB). Beer Labeling. Available online: https://www.ttb.gov/beer/labeling (accessed on 1 January 2020).
- Alcohol and Tobacco Tax and Trade Bureau (TTB). Exempt Ingredients and Processes Determined to be Traditional Under TTB Ruling 2015-1. Available online: https://www.ttb.gov/images/pdfs/rulings/ttb-ruling-2015-1-attachment-1.pdf (accessed on 1 March 2021).
- National Small Business Association (NSBA). About NSBA. Available online: https://nsba.biz/about-us/ (accessed on 1 March 2021).
- National Small Business Association 2017. NSBA Small Business Regulations Survey. Available online: https://www.nsba.biz/wp-content/uploads/2017/01/Regulatory-Survey-2017.pdf (accessed on 1 March 2021).
- Kaya, H. Business friendliness and small firm characteristics. J. Manag. Res. 2020, 20, 47–59. [Google Scholar]
- Bickerdyke, I.; Lattimore, R. Reducing the Regulatory Burden: Does Firm Size Matter? Industry Commission Staff Research Paper; Industry Commission: Melbourne, Australia, 1997. [Google Scholar]
- Fairman, R.; Yapp, C. Enforced Self-Regulation, Prescription, and Conceptions of Compliance within Small Businesses: The Impact of Enforcement. Law Policy. 2005, 27, 491–519. [Google Scholar] [CrossRef]
- US Chamber of Commerce Foundation. The Regulatory Impact on Small Business: Complex, Cumbersome, Costly. 2017. Available online: https://www.uschamberfoundation.org/blog/post/regulations-impact-small-business-and-heart-americas-economy (accessed on 1 April 2021).
- Bradford, S. Does size matter? An economic analysis of small business exemptions from regulation. J. Small Emerg. Bus. Law 2004, 8, 1–37. [Google Scholar]
- Urban, R.; Mancke, R. Federal regulation of whiskey labelling: From the repeal of Prohibition to the present. J. Law Econ. 1972, 15, 411–426. [Google Scholar] [CrossRef]
- Bower, J.; Cox, H. How Scottish & Newcastle became the U.K.’s largest brewer: A case of regulatory capture? Bus. Hist. Rev. 2012, 86, 43–68. [Google Scholar]
- Kay, J. Better a distant judge than a pliant regulator. Financ. Times 2010, 2. [Google Scholar]
- Dillman, D.; Smyth, J.; Christian, L.M. Internet, Phone, Mail, and Mixed Mode Surveys: The Tailored Design Method, 4th ed.; John Wily & Sons Inc.: Hoboken, NJ, USA, 2014. [Google Scholar]
- Chomeya, R. Quality of Psychology Test between Likert Scale 5 and 6 Points. J. Soc. Sci. 2010, 6, 399–403. [Google Scholar]
- Brewers Association. Craft Beer Industry Market Segments. Available online: https://www.brewersassociation.org/statistics/market-segments/ (accessed on 1 April 2021).
Figure 1.
Prediction of Regulatory Submission Outcomes Using Brewery Characteristic Indicators.


Table 1.
Brewery Sample Characteristics: Brewery Type.
| Brewer’s Association Brewery Type 1 | Frequency | Sample Percentage (%) | Population Percentage (2019) (%) 2 |
|---|---|---|---|
| Brewpub | 24 | 16.9 | 37.8 |
| Microbrewery | 76 | 53.5 | 21.7 |
| Contract Brewing Company | 2 | 1.4 | N/A 3 |
| Regional Brewery | 10 | 7.0 | 2.9 |
| Taproom Brewery | 24 | 16.9 | 37.6 |
| Other | 6 | 4.2 | |
| Total | 142 | 100.0 | 100.0 |
1 The craft brewing market segments are defined as follows: Brewpub: A restaurant-brewery that operates “significant food services” in addition to producing beer. Brewpubs must sell 25% of more their beer onsite. Microbrewery: A brewery that produces less than 15,000 barrels of beer per year and sells most (75% or more) off-site. Contract Brewing Company: A business or brewery that employs another brewery to produce its beer. Regional Brewery: A brewery that produces 15,000–6,000,000 barrels of year annually. Taproom Brewery: A brewery that sells 25% or more of its beer onsite [26].2 It is important to note that the Brewers Association identified “Taproom Brewery” as an additional market segment category of craft breweries the year in which data collection occurred (2019). In 2015–2018, the microbrewery segment represented 55.9–59.3% of the breweries in the craft brewing industry. In 2019, with the addition of “Taproom Brewery,” this representation dropped to 21.7% as many breweries previously classified as “Microbreweries” transitioned to “Taproom Breweries.” Given the timing of data collection and the combined industry representation of 59.3% between “Microbreweries” and “Taproom Breweries”, there is reason to suggest that the overrepresentation of “Microbreweries” in the sample is related changes in market segment definitions rather than sampling error [5]. 3 Data not available from the Brewers Association.
Table 2.
Brewery Sample Characteristics: Permit Age, Production Volume, Personnel.
| Characteristic | M | SD | Min | Max |
|---|---|---|---|---|
| Permit Age | 7.36 | 6.19 | 1.00 | 34.00 |
| Production Volume (BBL/Year) 1 | 7117.71 | 42,304.5 | 0.00 | 500,000.00 |
| Personnel (FTE) | 14.02 | 38.83 | 0.00 | 400.00 |
1 Reported in BBL/Year: A barrel of beer is 31 gallons.
Table 3.
Correlations Between Brewery Permit Age, Number of Personnel, and Production Volume.
| 1 | 2 | 3 | |
|---|---|---|---|
| 1. Personnel | 1.00 | ||
| 2. Production Volume | 0.899 ** | 1.00 | |
| 3. Permit Age | 0.283 ** | 0.262 ** | 1.00 |
** p < 0.01.
Table 4.
Brewery Sample Characteristics: Frequency Data for Submission Volume of COLAs and Formulas.
Table 4.
Brewery Sample Characteristics: Frequency Data for Submission Volume of COLAs and Formulas.
| Submission Volume | Bottle/Can COLA Submissions | Keg COLA Submissions | Formula Submissions | |||
|---|---|---|---|---|---|---|
| N | % | N | % | N | % | |
| 1–5 labels/formulas | 31 | 26.7 | 29 | 27.1 | 43 | 55.1 |
| 6–10 labels/formulas | 15 | 12.9 | 13 | 12.1 | 13 | 16.7 |
| 11–20 labels/formula | 30 | 25.9 | 20 | 18.7 | 10 | 12.8 |
| Greater than 20 labels/ Formulas | 40 | 34.5 | 45 | 42.1 | 12 | 15.4 |
| Total | 116 | 100.0 | 107 | 100.0 | 78 | 100.0 |
Table 5.
Brewers’ Use of Labeling and Formula Resources During Submission Preparation.
| COLA Submissions | Formula Submissions | |||
|---|---|---|---|---|
| Resource | M | SD | M | SD |
| TTB Website | 1.70 | 0.90 | 1.91 | 1.07 |
| Brewers Association Website | 3.76 | 1.15 | 4.01 | 0.93 |
| Advice from Fellow Brewer(s) | 3.46 | 1.03 | 3.65 | 1.02 |
| Advice from a Coworker/Boss | 3.98 | 1.18 | 3.95 | 1.16 |
| Correspondence with TTB Officials | 3.13 | 1.02 | 3.12 | 1.07 |
| TTB Ingredient Exemption List (TTB Attachment 2015-1) | 1.80 | 1.05 | ||
Participants were asked to indicate the frequency with which they use resources listed above. Reponses were coded as follows: 1: always, 2: most of the time, 3: sometimes, 4: rarely, 5: never.
Table 6.
Mean Resubmission Frequencies for COLA and Formula Submissions.
| Submission Type | M (%) | SD | Min | Max |
|---|---|---|---|---|
| COLA Submissions | 33.00 | 33.65 | 0.00 | 100.00 |
| Formula Submissions | 14.60 | 24.12 | 0.00 | 99.00 |
Table 7.
Prediction of Resubmission Frequency Using Resource Type.
| COLA Submissions | Formula Submissions | |||||||
|---|---|---|---|---|---|---|---|---|
| Resource | B | SE B | β | p | B | SE B | β | p |
| TTB Website | 1.28 | 3.16 | 0.03 | 0.69 | 5.09 | 2.59 | 0.23 | 0.05 |
| Brewers Association Website | −1.53 | 2.54 | −0.05 | 0.55 | 2.18 | 3.05 | 0.09 | 0.48 |
| Advice from Fellow Brewer(s) | −5.35 | 2.79 | −0.16 | 0.06 | −0.74 | 2.78 | −0.03 | 0.79 |
| Advice from Boss/Coworker | −3.97 | 2.44 | −0.14 | 0.11 | −2.89 | 2.44 | −0.14 | 0.24 |
| Correspondence with Alcohol and Tobacco Tax and Trade Bureau (TTB) Officials | −5.40 | 2.78 | −0.16 | 0.06 | −6.20 | 2.64 | −0.27 | 0.02 * |
| TTB Ingredient Exemption List (TTB Attachment 2015-1) | −0.49 | 2.70 | −0.02 | 0.86 | ||||
* p < 0.05.
Table 8.
Mean Volume of Resources Used During Label and Formula Submission Preparation.
| Submission Type | M | SD |
|---|---|---|
| COLA Submissions | 2.78 | 1.16 |
| Formula Submissions | 3.53 | 1.40 |
Table 9.
Relationship between the Volume of Resources Used and Resubmission Frequency.
| Resource | R | p |
|---|---|---|
| COLA Submissions | 0.20 | 0.02 * |
| Formula Submission | −0.05 | 0.70 |
* p < 0.05.
Table 10.
Frequency of Brewers that Reported “Yes” to Expenses Associated with COLA and Formula Submissions.
Table 10.
Frequency of Brewers that Reported “Yes” to Expenses Associated with COLA and Formula Submissions.
| COLA Submissions | Formula Submissions | |||
|---|---|---|---|---|
| Item | ||||
| Employee pay adjustment | 7.7% | 5.3% | ||
| Daily work routine changes | 49.3% | 48.0% | ||
| Consulting/attorney fees | 22.5% | 16.0% | ||
| Lost sales revenue | 31.7% | 29.3% | ||
| Time taken away from other business tasks to understand regulations | 74.6% | 74.7% | ||
| Time to meet with consultants | 15.5% | 17.3% | ||
| M | SD | M | SD | |
| Total Expense Burden * | 2.01 | 1.45 | 1.91 | 1.43 |
* The “yes” responses to each of the six expense items were totaled per participant to create a “Total Expense Burden” variable. The “Total Expense Burden” variable ranged from zero to six.
Table 11.
Prediction of Expense Burden Using Resource Type.
| COLA Submissions | Formula Submissions | |||||||
|---|---|---|---|---|---|---|---|---|
| Resource | B | SE B | Β | p | B | SE B | β | p |
| TTB Website | 0.08 | 0.14 | 0.05 | 0.58 | −0.10 | 0.16 | −0.08 | 0.52 |
| Brewers Association Website | −0.14 | 0.11 | −0.11 | 0.22 | −0.16 | 0.18 | −0.10 | 0.38 |
| Advice from Fellow Brewer(s) | −0.23 | 0.12 | −0.16 | 0.06 | −0.38 | 0.16 | −0.27 | 0.02 * |
| Advice from Boss/Coworker | −0.35 | 0.10 | −0.29 | 0.001 ** | −0.15 | 0.14 | −0.12 | 0.31 |
| Correspondence with TTB Officials | −0.17 | 0.12 | −0.12 | 0.17 | 0.01 | 0.16 | 0.01 | 0.96 |
| TTB Ingredient Exemption List (TTB Attachment 2015-1) | −0.04 | 0.16 | −0.03 | 0.79 | ||||
* p ≤ 0.05; ** p ≤ 0.01.
Table 12.
Information Burden Associated with COLA and Formula Submissions.
| COLA Submissions | Formula Submissions | |||
|---|---|---|---|---|
| Item 1 | M | SD | M | SD |
| Complexity of rules | 4.37 | 1.49 | 4.53 | 1.46 |
| Quantity of rules | 4.12 | 1.46 | 4.23 | 1.56 |
| Inconsistency among TTB reviewers | 4.79 | 1.53 | 4.41 | 1.72 |
| Contradictions between TTB rulings of other agencies (i.e., state or local rulings) | 4.09 | 1.75 | 3.70 | 1.89 |
| Total Information Burden Score | 17.27 | 5.18 | 16.83 | 5.44 |
1 Participants responded to all items on a scale of 1 (Not burdensome) to 6 (Very burdensome). Only extreme ends of the scale 457 had qualifiers.
Table 13.
Brewer Perceptions: Regulatory Navigation and Available Resources.
| COLA Submissions | Formula Submissions | |||
|---|---|---|---|---|
| Resource 1 | M | SD | M | SD |
| The TTB (formula/labeling) requirements are difficult to navigate | 3.55 | 1.04 | 3.65 | 0.94 |
| Existing resources meet the needs of craft brewers as they prepare (formula/labeling) submissions | 2.72 | 1.01 | 2.65 | 0.95 |
| Additional resources for craft brewers would improve success with the (formula/labeling) submission process | 3.96 | 0.85 | 4.03 | 0.70 |
| Total perception score | 10.79 | 2.35 | 11.03 | 1.95 |
1 Reponses were coded as follows: 1: strongly disagree, 2: disagree, 3: neutral, 4: agree, 5: strongly agree. To create the Total Information Burden Score, Item 2 was reverse coded to align the agreement direction with Items 1 and 3.
Table 14.
Prediction of Regulatory Perception Score Using Brewery Characteristics.
| COLA Submissions | Formula Submissions | |||||||
|---|---|---|---|---|---|---|---|---|
| Resource | B | SE B | β | p | B | SE B | β | p |
| Personnel | 0.01 | 0.005 | 0.12 | 0.17 | 0.01 | 0.00 | 0.13 | 0.28 |
| Production Volume | 0.00 | 0.00 | 0.17 | 0.05 * | 0.00 | 0.00 | 0.22 | 0.06 |
| Permit Age | 0.00 | 0.03 | 0.00 | 0.97 | 0.01 | 0.04 | 0.03 | 0.82 |
* p ≤ 0.05.
Table 15.
ANOVA Results: Perception Scores among Submission Volume Categories.
| Submission Type | n | M | F | p |
|---|---|---|---|---|
| Bottle COLA | 0.18 | 0.91 | ||
| 1. 1–5 labels | 31 | 10.52 | ||
| 2. 6–10 labels | 14 | 11.00 | ||
| 3. 11–20 labels | 30 | 10.90 | ||
| 4. Greater than 20 labels | 40 | 10.70 | ||
| Keg COLA | 3.97 | 0.01 ** | ||
| 1. 1–5 labels | 29 | 11.03 | ||
| 2. 6–10 labels | 13 | 10.85 | ||
| 3. 11–20 labels | 20 | 12.05 | ||
| 4. Greater than 20 labels | 45 | 10.09 | ||
| Formula | 3.14 | 0.03 * | ||
| 1. 1–5 labels | 40 | 11.50 | ||
| 2. 6–10 labels | 13 | 11.23 | ||
| 3. 11–20 labels | 10 | 10.40 | ||
| 4. Greater than 20 labels | 12 | 9.75 |
* p ≤ 0.05; ** p ≤ 0.01.
Table 16.
Prediction of Information Burden Using Resource Type.
| COLA Submissions | Formula Submissions | |||||||
|---|---|---|---|---|---|---|---|---|
| Resource | B | SE B | β | p | B | SE B | β | p |
| TTB Website | −0.11 | 0.49 | −0.02 | 0.83 | −0.24 | 0.59 | −0.05 | 0.69 |
| Brewers Association Website | −0.91 | 0.37 | −0.21 | 0.02 * | −1.312 | 0.68 | −0.22 | 0.06 |
| Advice from Fellow Brewer(s) | −1.20 | 0.40 | −0.25 | 0.004 ** | −1.78 | 0.59 | −0.34 | 0.003 ** |
| Advice from Boss/Coworker | −0.61 | 0.36 | −0.14 | 0.10 | −1.40 | 0.53 | −0.30 | 0.01 * |
| Correspondence with TTB Officials | −1.06 | 0.42 | −0.21 | 0.01 * | −0.97 | 0.58 | −0.20 | 0.10 |
| TTB Ingredient Exemption List (TTB Attachment 2015-1) | −0.37 | 0.60 | −0.07 | 0.54 | ||||
* p < 0.05; ** p < 0.01.
Table 17.
Frequency of Participants that Indicated Interest in Additional COLA and Formula Resources.
Table 17.
Frequency of Participants that Indicated Interest in Additional COLA and Formula Resources.
| Resource Topic | Frequency (%) |
|---|---|
| COLA submissions | 64.8% |
| Formula submissions | 52.1% |
| Submitting ingredients for inclusion on the TTB exemption list | 45.1% |
Reponses were coded as follows: 0: did not check box to indicate interest. 1: checked box to indicate interest.
Publisher’s Note: MDPI stays neutral with regard to jurisdictional claims in published maps and institutional affiliations. |
© 2021 by the authors. Licensee MDPI, Basel, Switzerland. This article is an open access article distributed under the terms and conditions of the Creative Commons Attribution (CC BY) license (https://creativecommons.org/licenses/by/4.0/).
Share and Cite
MDPI and ACS Style
Cervantes, C.; Smith, S. TTB Labeling and Formula Processes: Evaluating Burden among Craft Brewers. Beverages 2021, 7, 64. https://0-doi-org.brum.beds.ac.uk/10.3390/beverages7030064
AMA Style
Cervantes C, Smith S. TTB Labeling and Formula Processes: Evaluating Burden among Craft Brewers. Beverages. 2021; 7(3):64. https://0-doi-org.brum.beds.ac.uk/10.3390/beverages7030064
Chicago/Turabian StyleCervantes, Charlotte, and Sylvia Smith. 2021. "TTB Labeling and Formula Processes: Evaluating Burden among Craft Brewers" Beverages 7, no. 3: 64. https://0-doi-org.brum.beds.ac.uk/10.3390/beverages7030064
Note that from the first issue of 2016, this journal uses article numbers instead of page numbers. See further details here.