
The Importance of Informational Components of Sparkling Wine Labels Varies with Key Consumer Characteristics


1
Department of Biological Sciences, Brock University, St. Catharines, ON L2S 3A1, Canada
2
Department of Psychology, Brock University, St. Catharines, ON L2S 3A1, Canada
3
Cool Climate Oenology and Viticulture Institute, Brock University, St. Catharines, ON L2S 3A1, Canada
4
National Wine and Grape Industry Centre, Charles Sturt University, Wagga Wagga, NSW 2678, Australia
*
Author to whom correspondence should be addressed.
Beverages 2022, 8(2), 27; https://0-doi-org.brum.beds.ac.uk/10.3390/beverages8020027
Submission received: 2 April 2022
/
Revised: 21 April 2022
/
Accepted: 24 April 2022
/
Published: 26 April 2022
(This article belongs to the Topic Alcoholic Beverage Research (Agriculture, Processing, Business and Circular Economy, Climate Effect))
Abstract
:Wine label information is an important aid for consumers in making purchase decisions. However, the influence of label information types in the context of sparkling wines is poorly understood, despite the global growth of this product class. Using an online survey of 576 Ontario sparkling wine consumers, we sought to examine this knowledge gap using two complementary approaches. First, participants were presented with a set of two mock sparkling wine labels, selected at random, from a set of eight conditions. One condition (control) contained all seven of the information types previously identified (endorsements, parentage, attributes, target end use, target end user, manufacture, nonpareil), whereas the other seven omitted one of each of these elements. Respondents then rated their willingness to buy, willingness to pay, and the perception of quality. Lastly, they self-rated the importance placed on 14 different label information statements when purchasing sparkling wine (5-point Likert scale from 1–not at all important to 5–extremely important). Results show that including a description of the wine’s sensory attributes on sparkling wine labels is important to consumers overall, except for those with a high subjective knowledge of sparkling wine, and those who normally spend more than CAD 30 per bottle, as these groups are more willing to buy, willing to pay, and rate their perception of quality higher for labels that do not include attribute information. Grape variety/blend and production region information are rated high in importance. Alcohol content is more important to young consumers and those who prefer Prosecco-style sparkling wines, whereas vintage/year is more important to consumers who prefer Champagne-style sparkling wines. Expert endorsements are rated low in importance, and younger consumers are more willing to buy sparkling wine with the endorsement information removed. We conclude that sparkling wine label information content should be optimised for different market segments and consumer characteristics. This study provides important insights that can guide sparkling wine marketers and retailers in this process.
1. Introduction
1.1. Wine Labels and Consumer Behaviour
Consumers’ perception of quality and purchase behaviour are strongly influenced by both the intrinsic and extrinsic cues of the product [1]. Intrinsic cues refer to the elements that pertain to the product itself. In the case of wine, examples include the taste, aroma, and color. Extrinsic cues are separate from the physical product, such as price, bottle size/shape, label design/content, and brand name. How these cues are used by consumers varies with several experiential and psychological factors, including wine involvement [2] and wine knowledge [3,4,5], and with demographic variables such as age, gender, and socioeconomic status [6,7,8]. However, a growing body of literature suggests that extrinsic cues often play a larger role than intrinsic cues in wine consumer purchase behaviour [6,9,10,11], with wine labels being a key component.
Wine labels contain both informational (e.g., style and production overview) and design (e.g., color, illustration) features. While several studies focus on label design and its role in branding and consumer purchase intent (e.g., [12,13]), it is likely that the information component of wine labels has primacy in affecting choice and purchase behaviour [8,10,13,14,15]. A notable exception is in the case of millennials (consumers born between approximately 1981 and 1996), who place relatively high value on design elements [6]. Bottled wine typically has two main labels where information is conveyed—the front and back labels. Several studies report that the front labels are more important to consumers’ purchasing decisions than the back labels [8,9,10,16]. The front labels are often the first line of communication to catch the attention of the consumer, so it is perhaps unsurprising that consumers generally give prominence to them over the back labels. However, the back label information is regarded positively by consumers when making purchase decisions [16], with some informational components perhaps more important than others [14].
Wine Label Information
What are the informational components of wine labels? Thomas and Pickering [8] adopted a conceptual framework based on the work of Shaw et al. [17] that articulates seven wine label information types (Table 1). The authors then tested the relative importance of each of these information types in an empirical experiment, where consumers viewed one of several mock wine labels in which one information element was omitted, and then answered several questions around willingness to pay and purchase intent [8]. They conclude that parentage, endorsements, and wine attributes have the strongest effects on influencing purchase intent and note that relative importance varies with demographics and level of wine involvement.
While the typology proposed by Shaw et al. [17], and adopted by Thomas and Pickering [8], has been criticized as being more complex than the ‘simpler’ criteria consumers use when assessing wine, there are only a limited number of other empirical studies regarding these considerations (rather than studies that simply rely on consumers’ self-reporting of the importance of purchase motivators). Mueller et al. [16] employ a discrete choice experiment to assess individual label attribute preferences for Australian consumers. They created 10 back label information statements (e.g., taste descriptions, food pairings) on mock labels and different choice sets that represented various purchasing situations. Overall, information on the history of a winery, elaborate taste descriptions, and food pairing advice were most valued; conversely, ingredient information caused a strong adverse reaction in some consumers. Sáenz-Navajas et al. [15] employed choice and auction experiments in a wine shop environment to examine French consumers’ purchasing behaviour. They conclude that the showcase of awards, additional cues linked to tradition such as “special cuvée”, being produced by independent winemakers, or a claim that the wine has potential for ageing are particularly important back label elements with respect to willingness to pay. Finally, Kelley et al. [11], using mock labels with varying information elements and forms, highlight the importance of food–wine pairing information on willingness to purchase for US wine consumers.
1.2. Sparkling Wine
The aforementioned studies focus on table wines, yet very little is known about the relative importance of sparkling wine label information types on consumer behaviour. Such research is timely, given the surge in interest in sparkling wines in recent years. This product class is valued at USD 34 billion globally and is anticipated to reach USD 51.7 billion by 2027 [18]. Additionally, consumer research findings for table wine may not necessarily translate directly to sparkling wine. For instance, different methods of production (and often grapes) are used, a narrower range of styles exist, packaging and closures are typically different, and there are separate appellations in some regions. Further, in contrast to table wine, consumers tend to purchase sparkling wine for celebration, rather than for their own consumption [7,19,20,21]. Indeed, one of the conclusions from the multinational survey of Charters et al. [22] is that consumers view table and sparkling wines as separate products.
Research with Croatian consumers suggests that consumers give prominence to intrinsic factors when choosing to purchase sparkling wine [20], although Verdonk et al. [21] report that several extrinsic factors are important drivers for Australian sparkling wine consumers. Generational differences also exist with respect to perceptions of, and preferences for, different sparkling wine styles [7,23]. There is, however, very sparse literature on the relative importance of information types on sparkling wine labels, and none have considered this question using experimental approaches. Empirical studies of this nature, such as utilizing mock labels that employ an omission design [8], have higher predictive validity for assessing real purchasing behaviour, as compared to studies that simply ask consumers to comment on their purchase/choice motivators.
1.3. The Current Study
The main objective of this study was to apply the conceptual framework of Shaw et al. [17], and the positioning statements of Thomas and Pickering [8], to sparkling wine labels, in order to determine the relative importance of information types on the quality perceptions and purchase intent of Ontario wine consumers. We also wished to assess how the importance of sparkling wine label information varies between demographical groups, levels of sparkling wine consumption, knowledge, involvement, and wine style. A secondary objective was to explore the relationship between these results, and those obtained by having the respondents self-rate the importance of individual information elements of sparkling wine labels.
Ontario provides an interesting and relevant case study in exploring these questions. It is Canada’s most populated province and the largest wine producer. Within Ontario, the Niagara Peninsula is the country’s largest viticultural area, containing two regional appellations, and 10 sub-appellations, regulated and administered by the Vintners Quality Alliance of Ontario (VQAO). Ontario sparkling wine production is increasing significantly with, for instance, a 140% rise in volume between the 2014–2019 vintages, resulting in approx. 1.5 million L of sparkling wine being produced [24,25]. Both traditional and Charmat styles are produced. Significant market potential within Ontario has recently been identified [26]. Fuller insights into what consumers place importance on when making sparkling wine choice and purchase decisions, including the role of label information, will help marketers and retailers take full advantage of these growth opportunities.
2. Materials and Methods
An online questionnaire was developed using the survey software Qualtrics [27]. Ontario sparkling wine consumers were recruited using the market research firm Dynata™ (Plano, TX, USA). A total of 1035 participants began the survey; however, incomplete responses, and those who completed the survey in under 200 s, were removed, thus, leaving 576 responses (51% male, 49% female) retained for data analysis. The median completion time was 5 min 33 s. All subjects gave their informed consent for inclusion before they participated in the study. The study was conducted in accordance with the Declaration of Helsinki, and the protocol was approved by the Brock University Research Ethics Board (# 19-130 PICKERING).
2.1. Demographics, Knowledge, and Wine Involvement
In addition to basic demographic information (e.g., age, gender, household income), the first section of the survey asked participants about their alcohol and sparkling wine consumption, and their behaviour when purchasing sparkling wine (e.g., how much money they typically spend per bottle; Table A1). Participants also identified their preferred sparkling wine style: “Fruity, sweeter sparkling wine styles (e.g., Prosecco, Asti)”, “Creamy, bready, drier, sparkling wine styles (e.g., Champagne, Crémant)” or “I don’t know” (Table A1). Subjective sparkling wine knowledge was determined by asking participants to indicate how knowledgeable they were about sparkling wine (novice/beginner, intermediate, high, or expert/very high). Objective sparkling wine knowledge was determined by the number of correct responses to six sparkling wine specific true/false questions: Sparkling wine made in Italy is known as “Cava” (f); Pinot Noir and Chardonnay are the two most widely used varietals for the production of sparkling wine in Champagne (t); In sparkling wine made using the “Traditional Method”, bubbles are produced from a secondary fermentation that occurs in a stainless steel tank (f); Crémant is a type of sparkling wine made in France using the same technique as Champagne (t); Most Ontario sparkling wine is produced in the Niagara Peninsula and Prince Edward County (t); The process of aging sparkling wines on lees (or dead yeast cells) is called ‘Charmat’ (f).
Finally, both wine involvement and sparkling wine involvement were determined using the general approach of Mueller et al. [5]. Respondents rated their level of agreement with 2 sets of 3 items on a 5-point Likert scale: wine involvement—I have a strong interest in wine; wine is important to me in my lifestyle; drinking wine gives me pleasure; and sparkling wine involvement—I have a strong interest in sparkling wine; sparkling wine is important to me in my lifestyle; drinking sparkling wine gives me pleasure. Based on their responses, each participant received a score that ranged from 3 (low) to 15 (high) for each involvement measure. Table 2 summarizes the sociodemographic and other background information collected.
2.2. Mock Label Information Manipulation
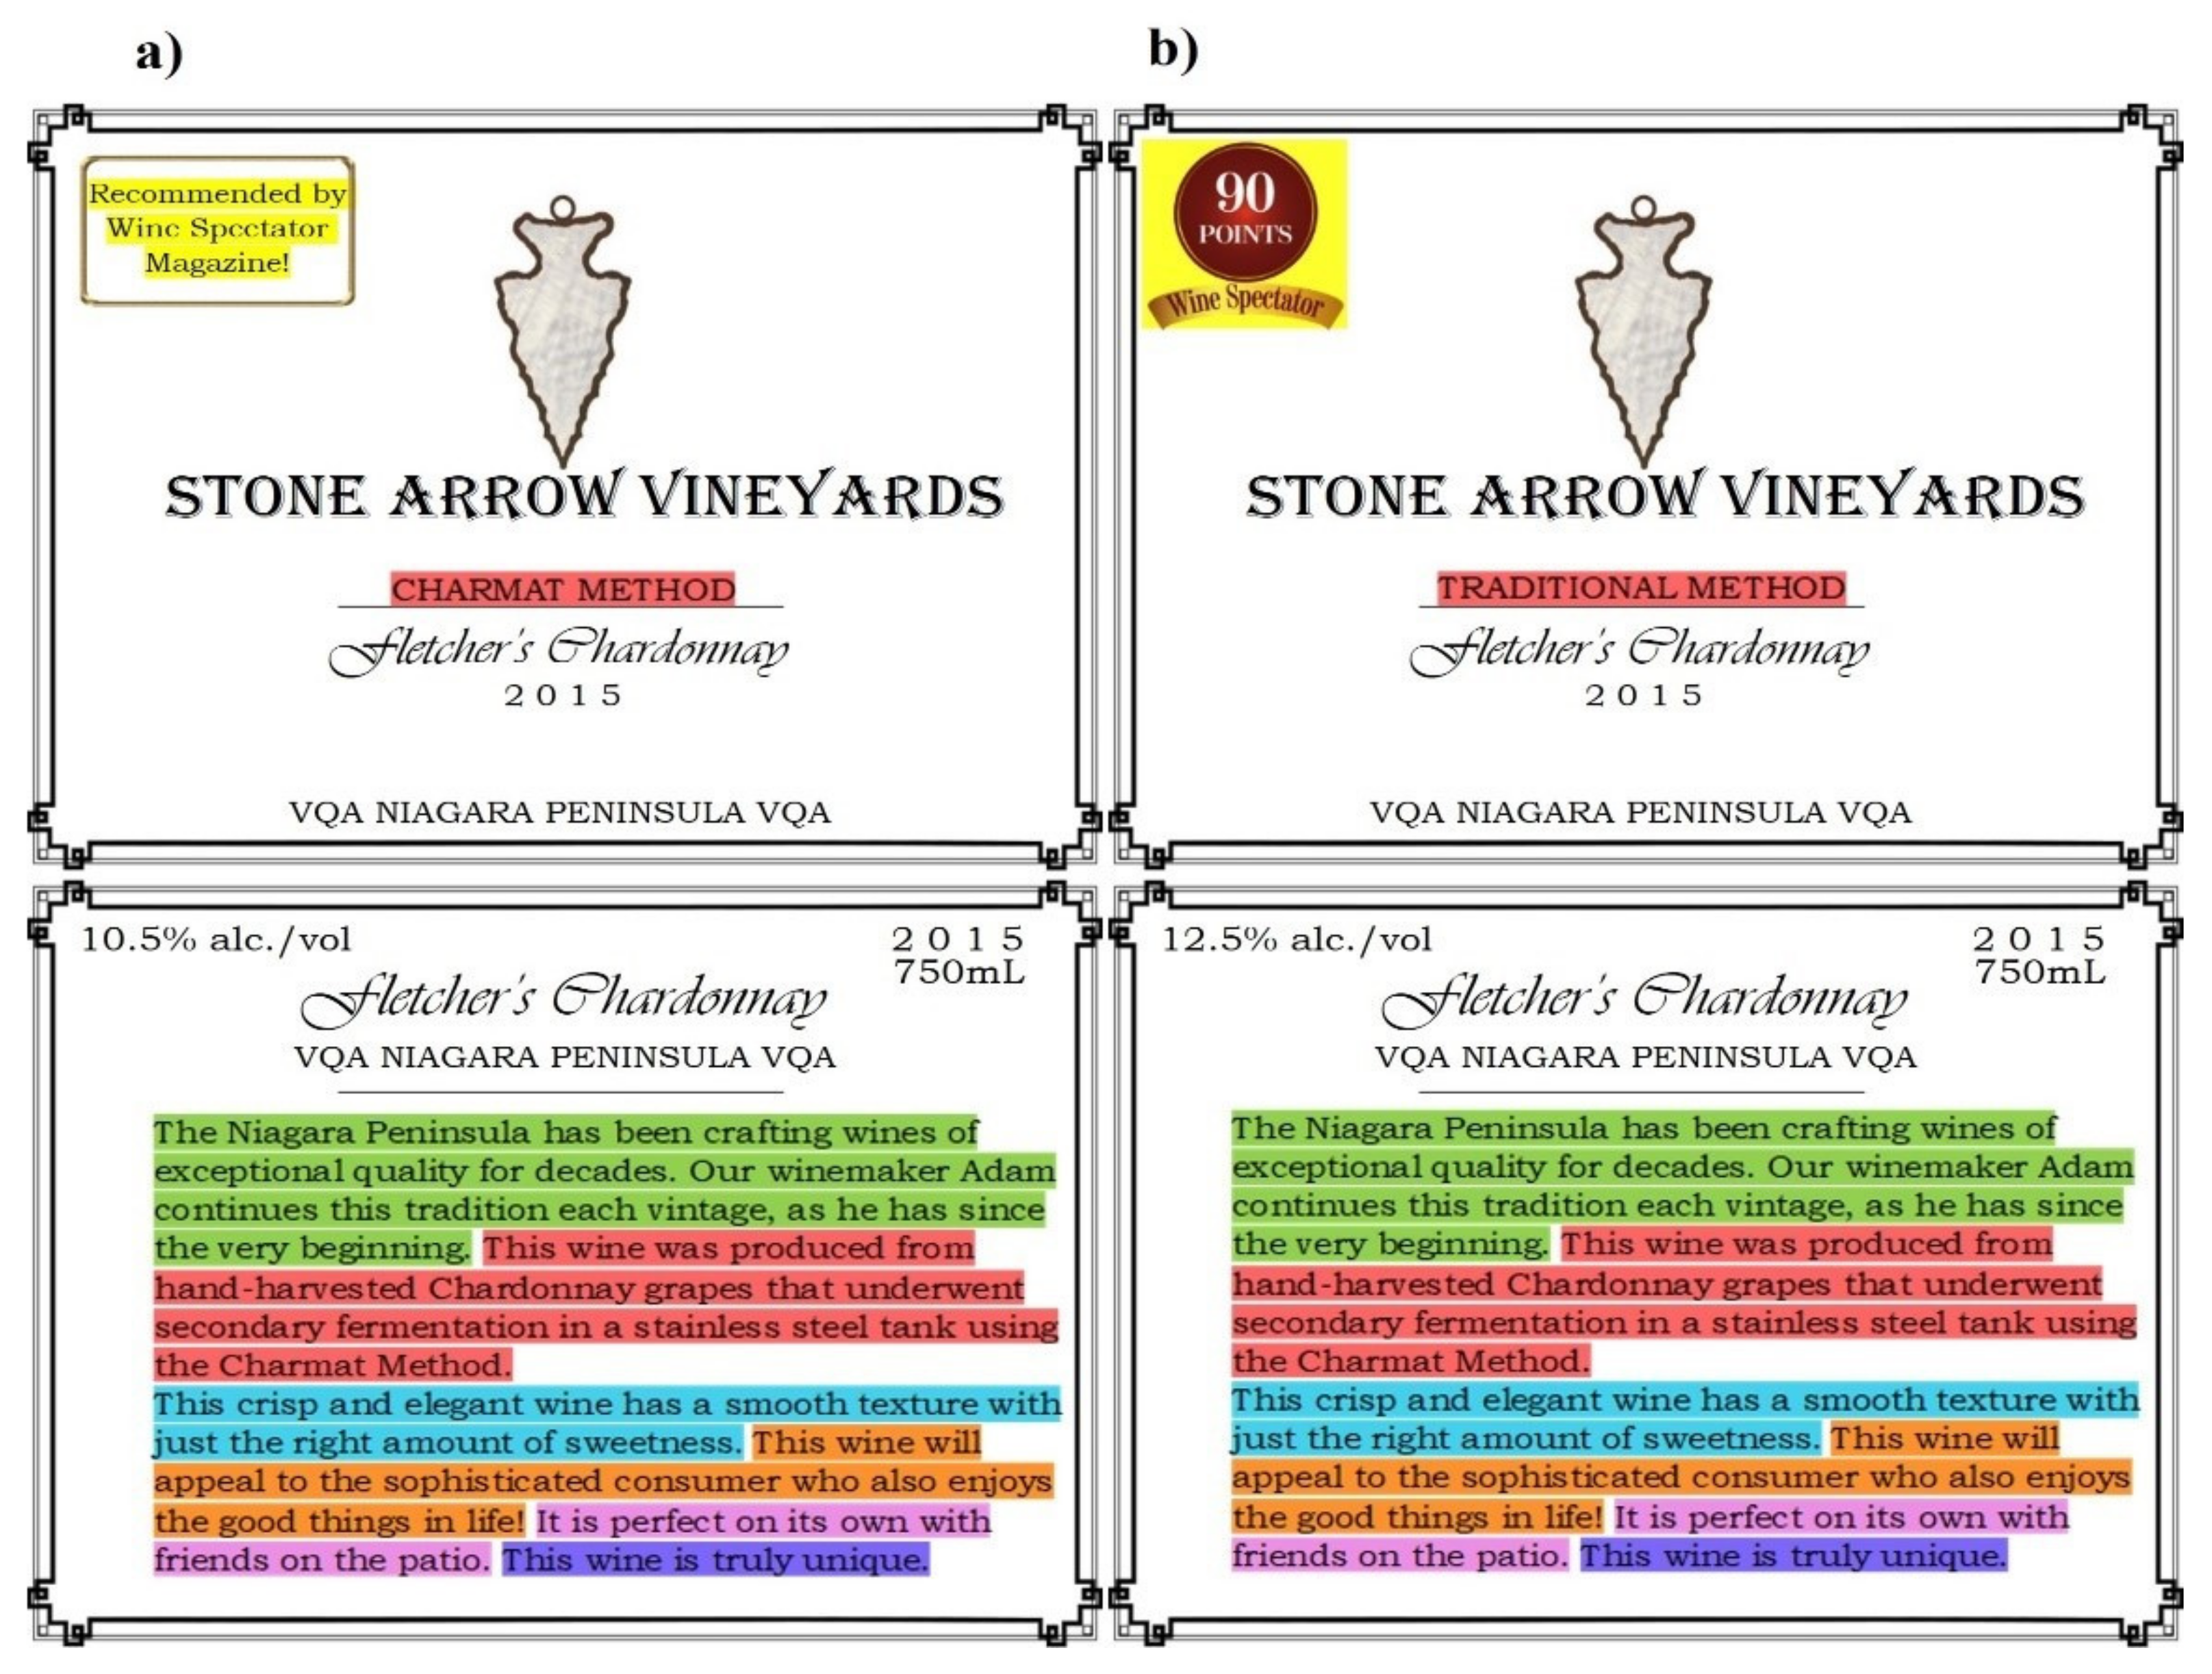
Next, two mock labels were presented once to each participant in randomized order, with each label representing a different style of sparkling wine. One style represented a dry, bready, creamy sparkling wine, produced using the traditional method, and the other a sweeter, fruity sparkling wine, produced using the Charmat method. These specific styles were chosen because they are representative of common sparkling wine styles, such as Champagne and Prosecco, and are the most liked by Ontario consumers [26]. The pair of labels viewed by each participant was selected at random from a set of eight conditions, with respondents only receiving one of the eight possible pairs. One condition (control) contained all seven of the information elements from Shaw et al. [17], whereas the other seven omitted one of each of these elements. Specific positional statements were chosen to represent each information element after an informal survey of commercial sparkling wine labels and bench testing to ensure the validity and realism of the labels. For each condition, two versions of the label were created (and randomly assigned), as some of the information statements are expressed in different ways. For instance, endorsements can take the form of expert opinions stated on the label or shown as wine awards/medals. Finally, the images presented to participants consisted of both a front and back label. Although all information, other than expert endorsements, were located on the back label, a front label was included to aid with realism. The winery name, logo, vintage, and product name were generic and constant across all the label treatments. Figure 1 shows a representation of the labels. After viewing each label, participants were asked how willing they would be to buy the wine (7-point Likert scale: 1–very unlikely to 7–very likely), how much they would be willing to pay (enter a whole number), and what their perceived quality of the wine is (5-point scale: 1–poor to 5–excellent).
2.3. Self-Rated Importance of Label Information
The final section of the survey asked participants to rate the importance that they placed on different pieces of information found on sparkling wine labels (5-point Likert scale, 1–not at all important to 5–extremely important). The 14 information statements were those used by Thomas and Pickering [8] (Table 1). In order to provide a better situational context, and relate the task to products of greater saliency for participants, a short introduction was provided, which referenced their preferred sparkling wine style (determined by each participant’s response to the preference question asked earlier in the survey). Specifically, they received either the cue “When thinking about buying dry, creamy, bready sparkling wine styles (e.g., Champagne, Crémant), rate the importance that you place on each of the following pieces of information found on labels” or “When thinking about buying fruity, sweeter sparkling wine styles (e.g., Prosecco, Asti), rate the importance that you place on each of the following pieces of information found on labels”.
2.4. Data Treatment and Analysis
All data analysis was conducted using XLSTAT (version 2020.3.1, Paris, France). Extreme outliers for willingness to pay were determined by the Grubbs test and removed from further data analysis. Where appropriate (e.g., distribution patterns or low frequency counts for some categories), independent variables were categorized, or categories pooled prior to analysis, to increase robustness. Age was collapsed to four groupings: 18–35 (n = 136), 36–45 (n = 107), 46–55 (n = 116), and 56+ (n = 213); subjective sparkling wine knowledge to three groupings: novice/beginner (n = 214), intermediate (n = 272), and high/expert (n = 86); annual sparkling wine intake to three groupings: low (n = 185), medium (n = 246), and high (n = 141); and money typically spent on a bottle of sparkling wine to three groupings: CAD 8–19.99 (n = 297), CAD20–29.99 (n = 212), and CAD 30+ (n = 63).
Once the independent variables were organized appropriately, a series of one-way ANOVAs were conducted to determine if/how they influenced consumers’ willingness to buy (WTB), willingness to pay (WTP), and perception of quality (POQ), irrespective of the label treatment. A series of two-way ANOVAs were then conducted for WTB, WTP, and POQ, to investigate the effect of label treatments, and their interaction with other independent variables. Tukey’s (HSD) pairwise comparison tests were used for separation of means. The mean importance ratings for the 14 types of label information were then compared using one-way ANOVA. Two-way ANOVAs were used to determine if there was a significant difference between the importance of different information elements and independent variables for each of the wine styles. Alpha was set at 0.05 for all analyses.
3. Results
3.1. Self-Reported Importance of Label Information
This section of the survey assesses what respondents say is important to them when purchasing sparkling wine. The overall mean importance for each information type is shown in Table 3. The category wine attributes is rated higher in importance than any other information element, followed by grape variety/blend. In contrast, unique or unrivalled is rated as least important. Perhaps surprisingly, the category expert endorsements is rated of low importance. Wine region history and winemaker history are rated significantly different from each other, even though they are both components of parentage, suggesting that this is not viewed as a unitary construct by consumers.
The mean importance scores for each information statement varies between the two sparkling wine styles for alcohol content and vintage/year. Respondents who prefer Prosecco-like sparkling wines place more importance on alcohol content, compared to people who prefer drier, Champagne-like sparkling wines (F = 8.71, p = 0.003). The opposite result is shown for vintage/year (F = 3.88, p = 0.049). Other information elements do not differ with wine style.
Overall, the importance that respondents place on these pieces of information varies with wine knowledge, involvement with sparkling wine, and annual intake (Table A2). Respondents who are less knowledgeable or involved in sparkling wine tend to place lower importance on label information elements, compared to those with higher knowledge or involvement. The same trend is observed for yearly intake. By contrast, gender, income, and how much consumers spend per bottle have little to no impact on importance ratings. However, there are some differences based on age when the 18–25 and 56+ groups are compared. Specifically, alcohol content, who the wine would appeal to, what occasion the wine is for, how to use the wine, expert endorsement, and unique or unrivalled are rated as more important by the younger cohort (p(t) < 0.05). With respect to the rank order of importance of information elements, the greatest difference is observed for alcohol content and who the wine would appeal to. These are rated 2nd and 3rd most important, respectively, for those aged 18–25 years, and 7th and 12th most important, respectively, for the older group. No differences in importance scores are found between these groups for wine style.
3.2. Mock Labels
Firstly, we examine willingness to buy (WTB), willingness to pay (WTP), and perception of quality (POQ) collapsed across all mock label conditions, to help identify how our labels are perceived overall, and whether there are differences attributable to key participant characteristics. Top level observations are presented here, with full results given in Table A3.
Consumers who prefer Prosecco-style sparkling wine indicate that they are more willing to buy the Prosecco-style labels than Champagne-style labels; however, there is no difference in purchase intent between styles for those who prefer Champagne styles. However, participants who prefer Champagne-style wines are willing to pay more for both wine styles than those who prefer Prosecco-style wine.
In general, POQ is less influenced by participant characteristics than WTB and WTP, although gender is significant for POQ for both wine styles, such that females rate wines as higher quality than males do. Perhaps not surprisingly, income is significant for WTP (but not WTB or POQ); respondents with higher incomes are willing to pay more for both sparkling wines styles than those with a lower income. Younger respondents are more willing to buy and willing to pay compared to older respondents for both wine styles. The magnitude of the difference in WTP is sizeable; those aged 18–25 are willing to pay between 55% (Champagne-style) and 64% (Prosecco-style) more than consumers aged 56+ (Table A3). As consumers’ knowledge (subjective and objective) and involvement (wine and sparkling wine) increases, so does their WTB and WTP. Similar trends are seen for POQ, although they are restricted to the “High” knowledge and involvement groups when compared with lower categories.
3.2.1. Manipulation of Label Information
Consumers received two labels (Charmat method, corresponding to Prosecco-style wine, and traditional method, corresponding to Champagne-style wine), which were missing one of seven label information types. One-eighth of participants received control labels where no information was omitted. ANOVA shows no main effects of label treatment or wine style for WTB, WTP, or POQ (p(F) < 0.05). However, two-way ANOVAs with label condition and consumer characteristics in the model show significant interactions for WTB, WTP, and POQ, and these are presented below.
Willingness to Buy (WTB)
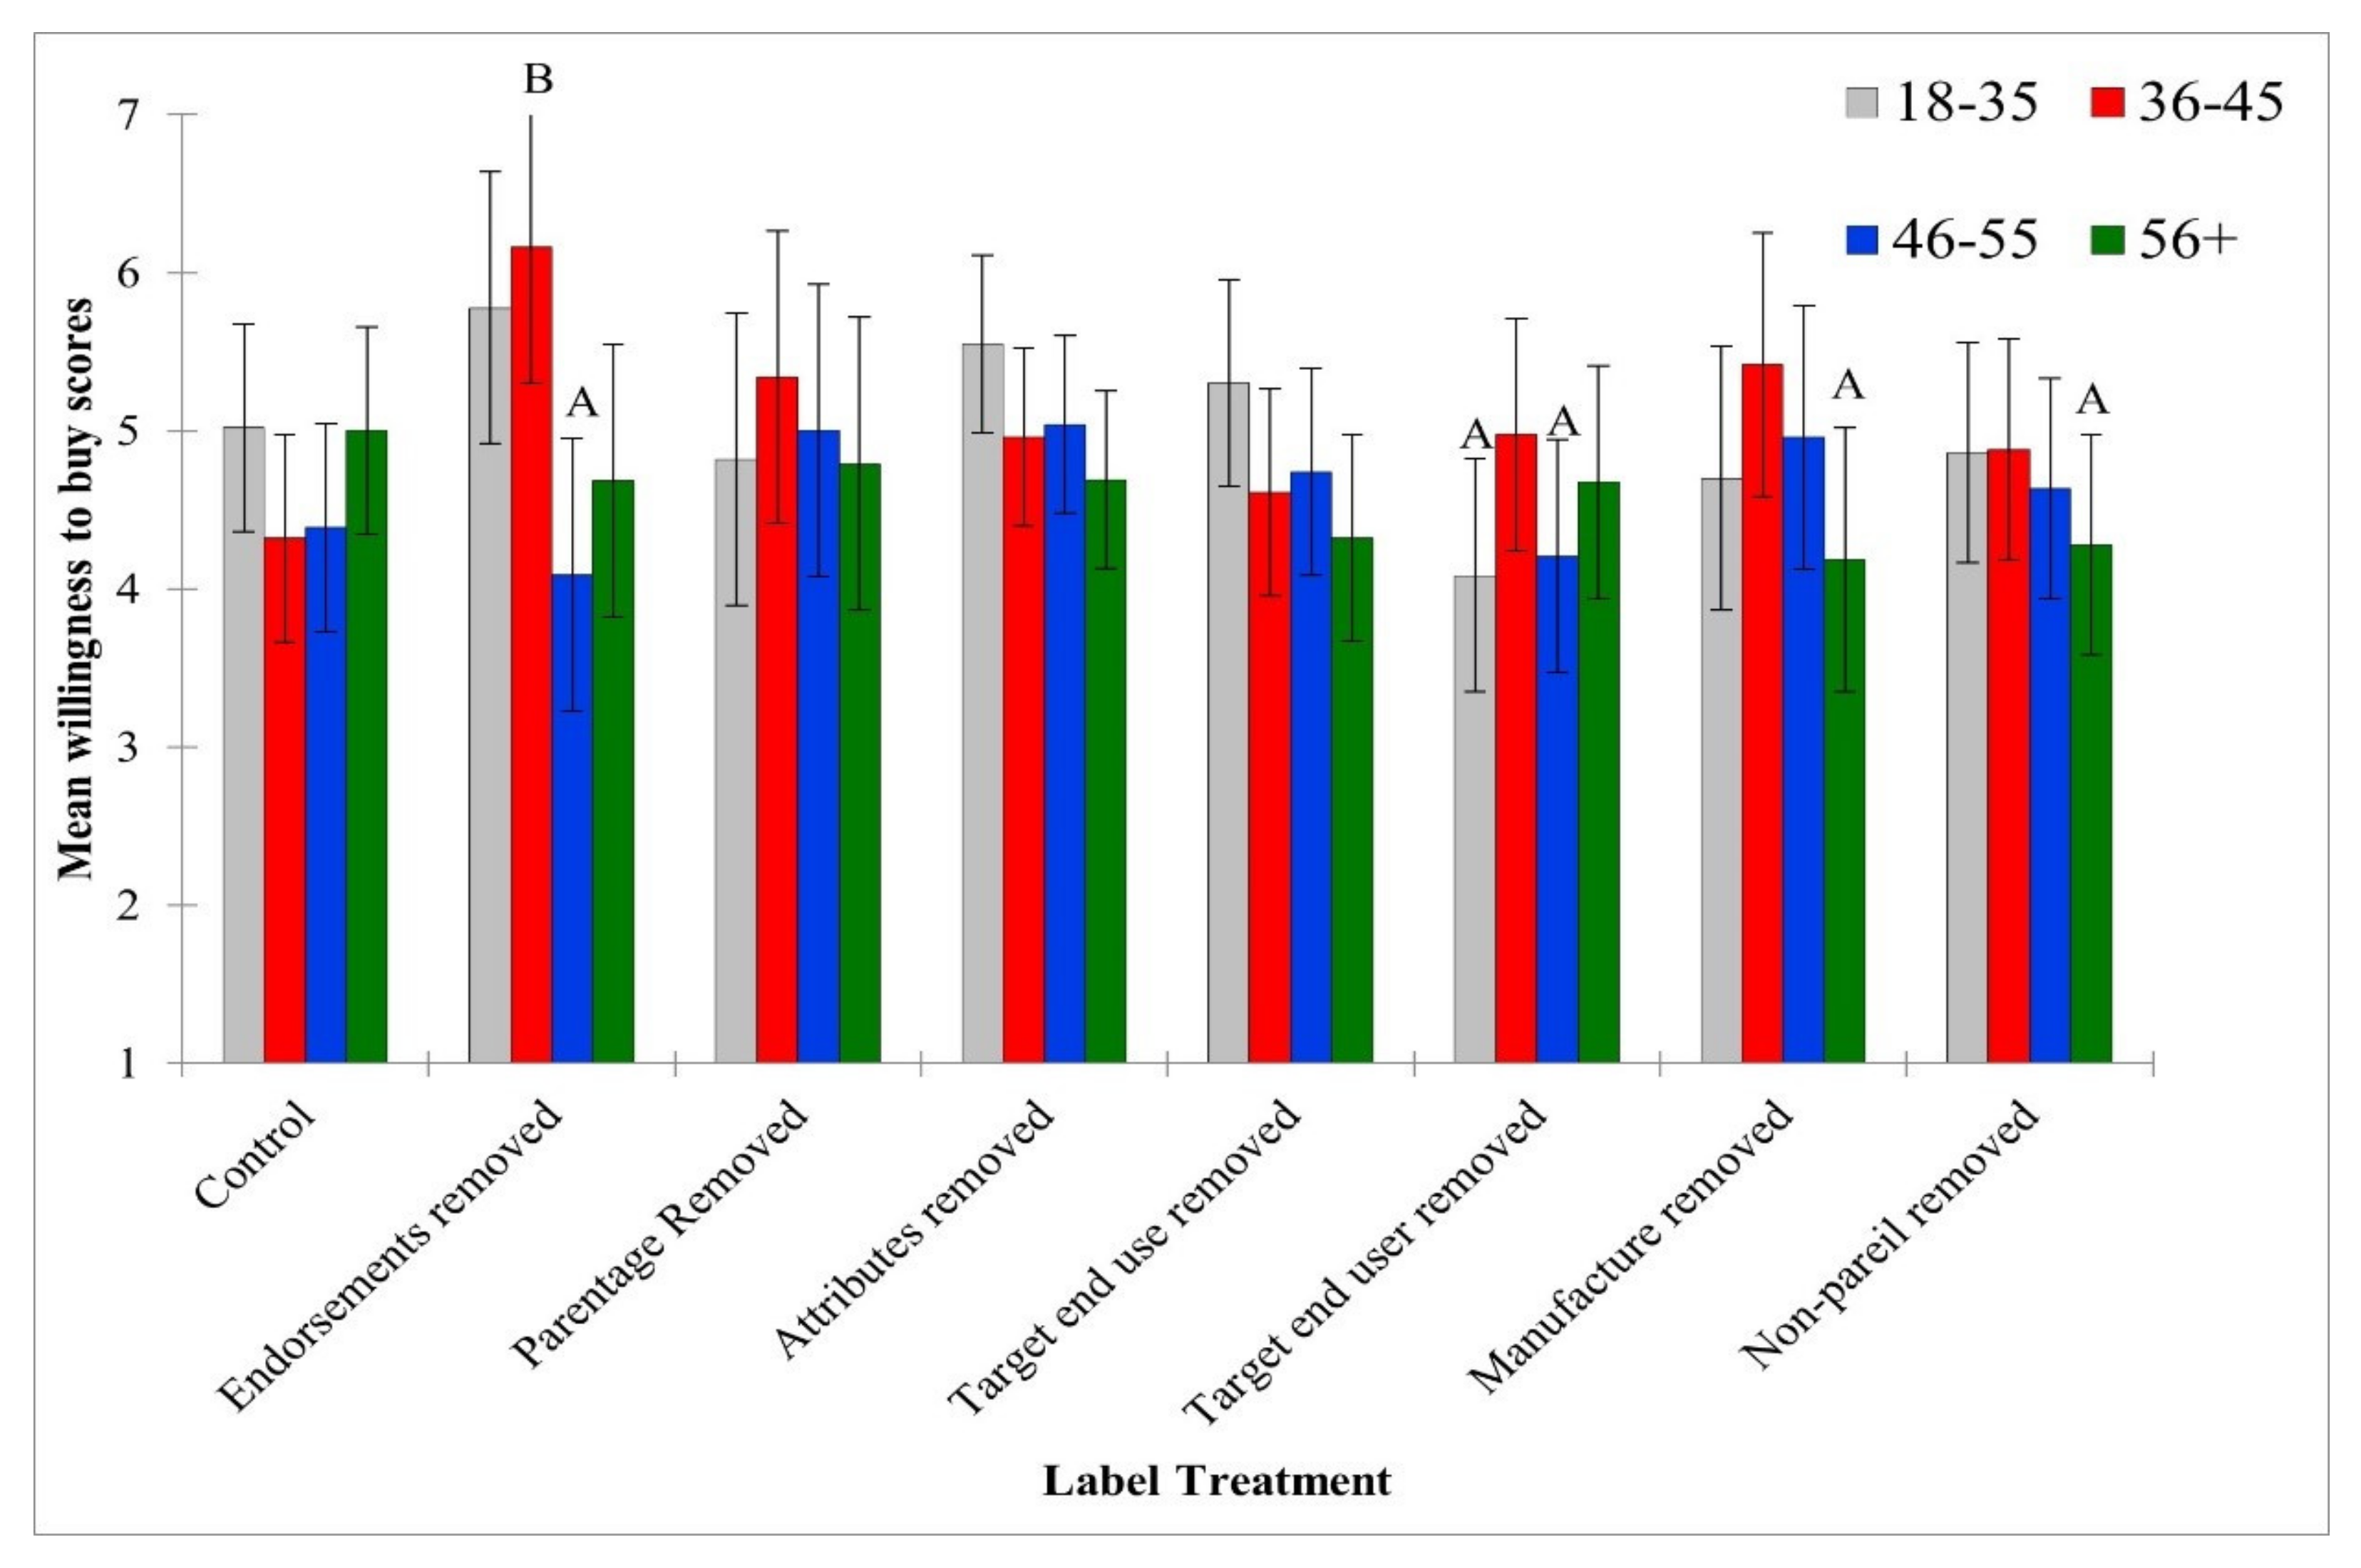
For the Prosecco-style label, respondents aged 36–45 who receive the endorsements removed label treatment rate their WTB higher, compared to those aged 46–55 from the same label treatment (F(21,524) = 1.77, p = 0.019; Figure 2). Similarly, younger respondents tend to be more willing to buy the endorsements removed treatment compared to the control. There are no significant interactions for the Champagne-style label; however, the same trends are observed (data not shown).
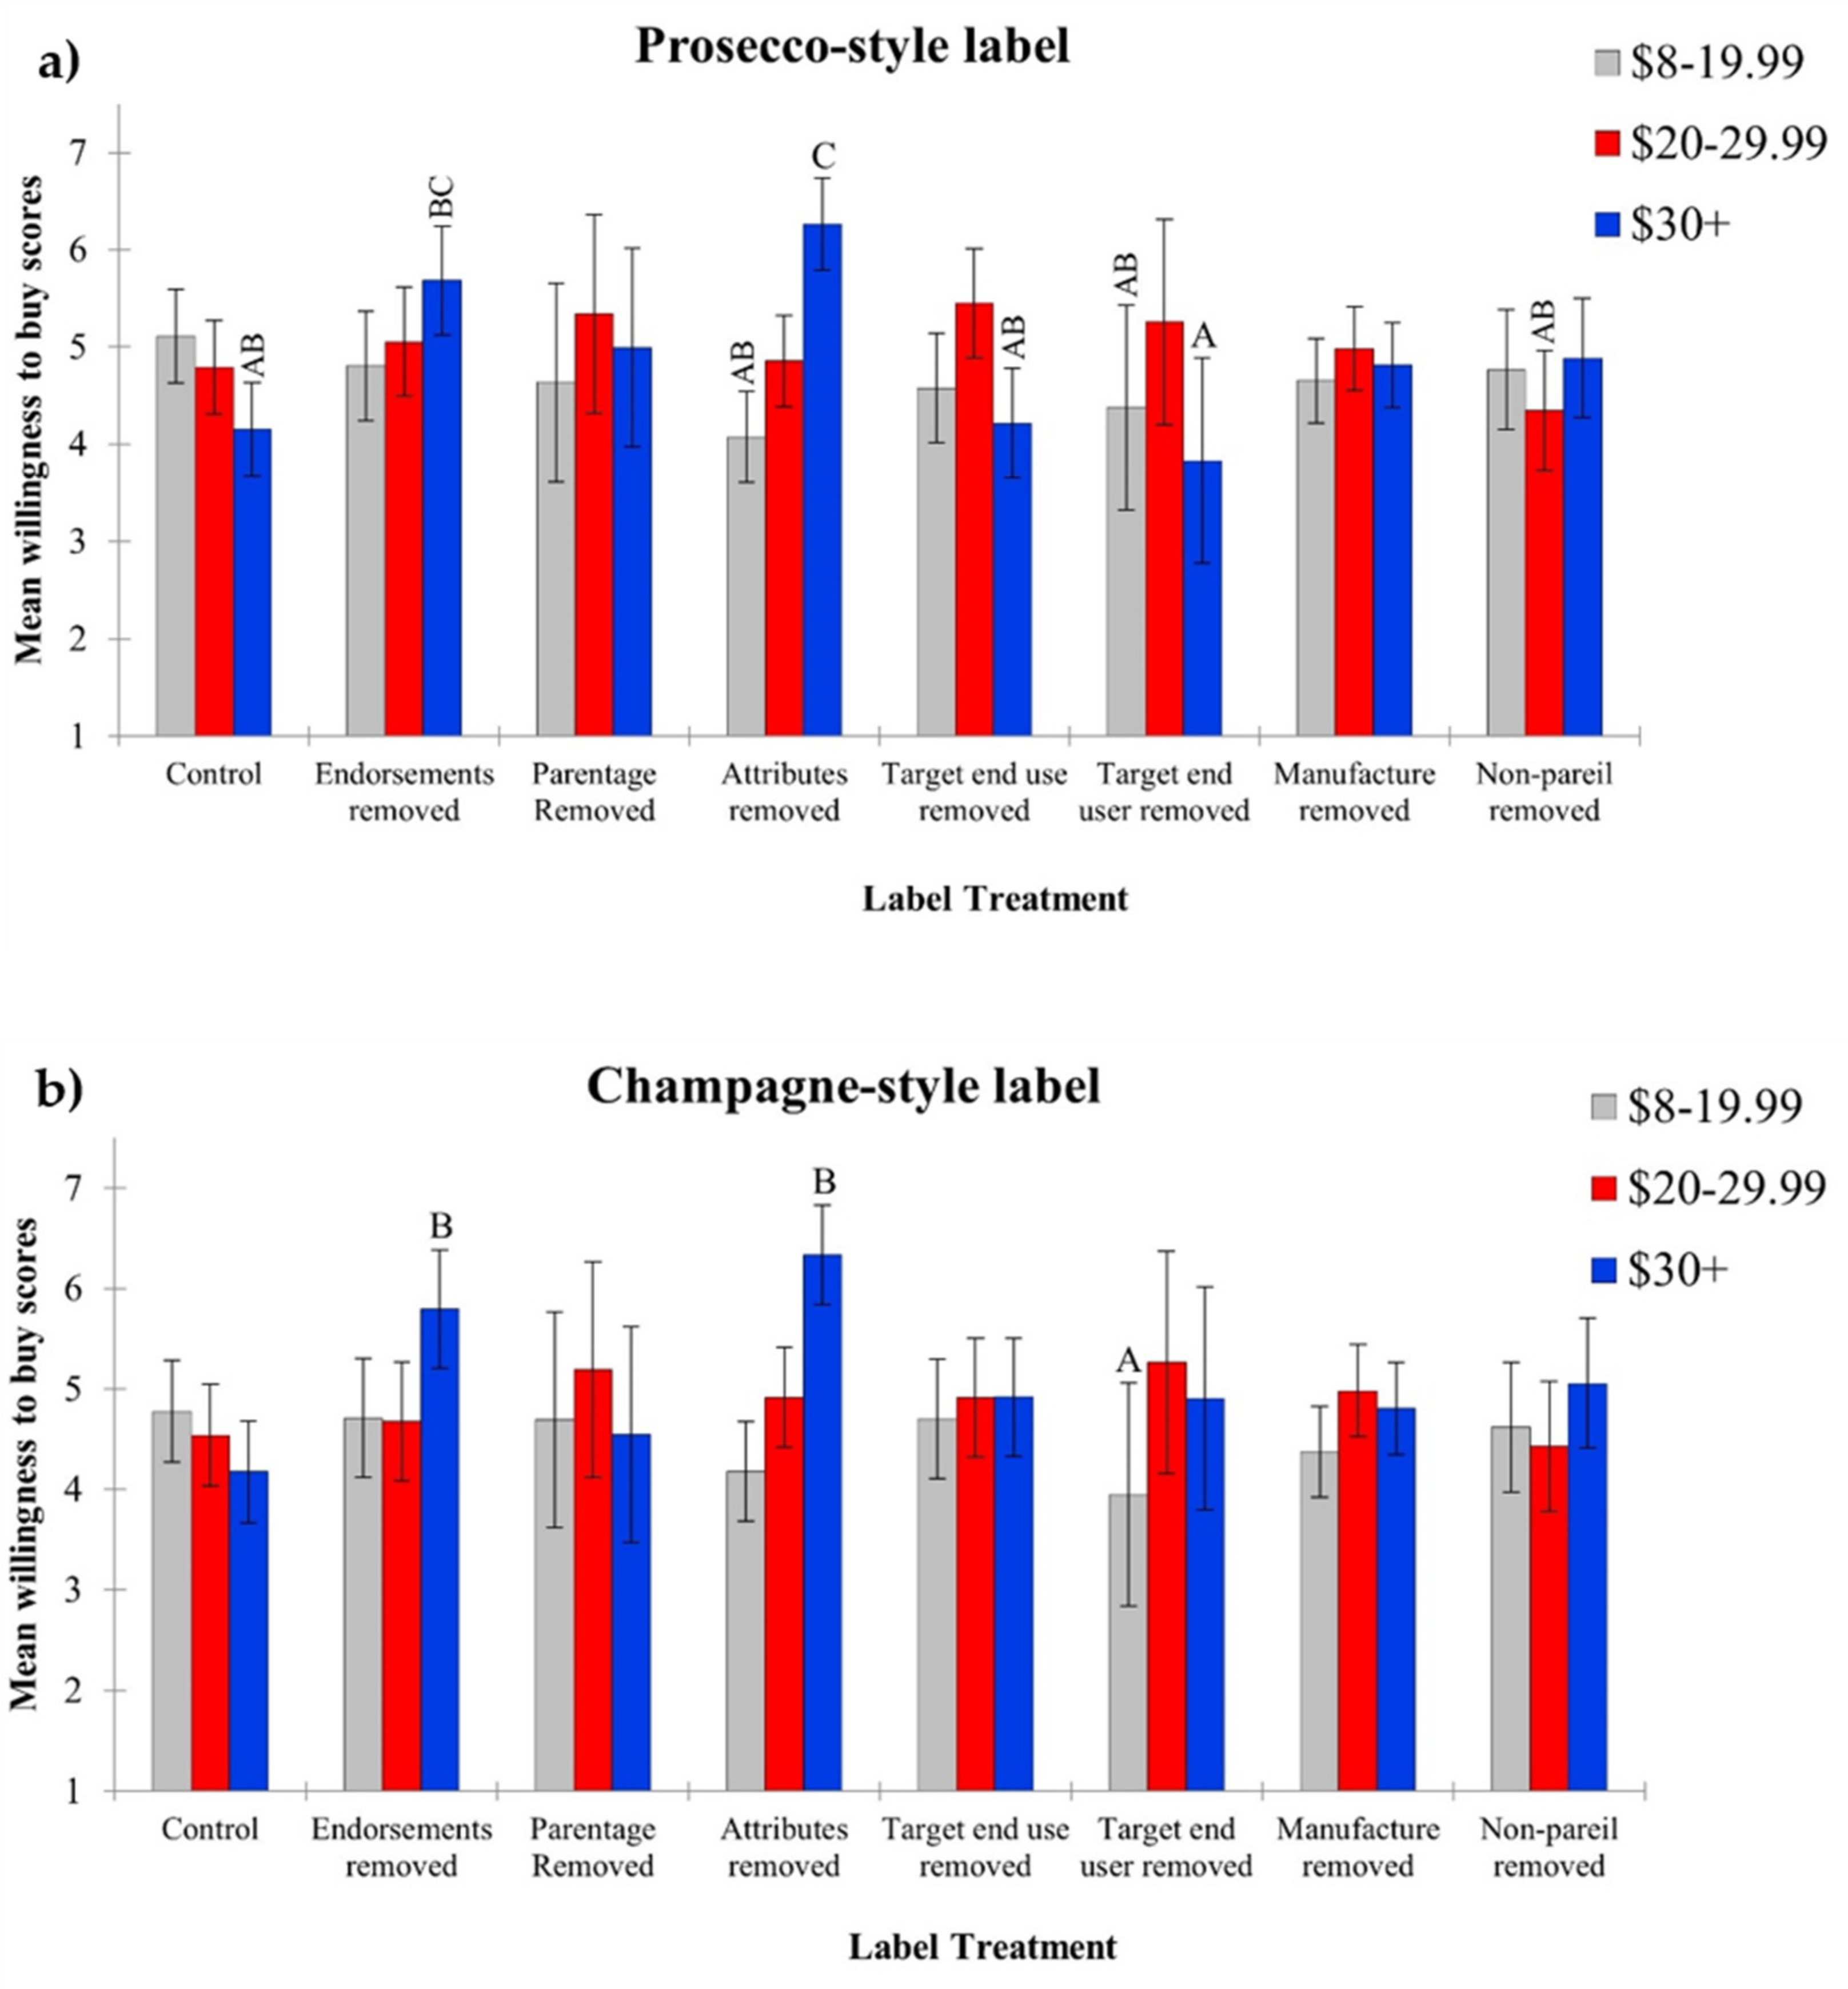
Significant interactions between label treatment and money typically spent on a bottle of sparkling wine are also found for WTB (Figure 3). For the Prosecco-style label, consumers who spend more than CAD 30 per bottle are more willing than several other groups, including the control, to buy the label that has information on the wine’s attributes removed, with a similar pattern observed for the Champagne-style label. Similarly, there is a trend for participants who normally spend CAD 30+ per bottle to be more willing to buy labels with endorsements removed compared to other groups.
Willingness to Pay (WTP)
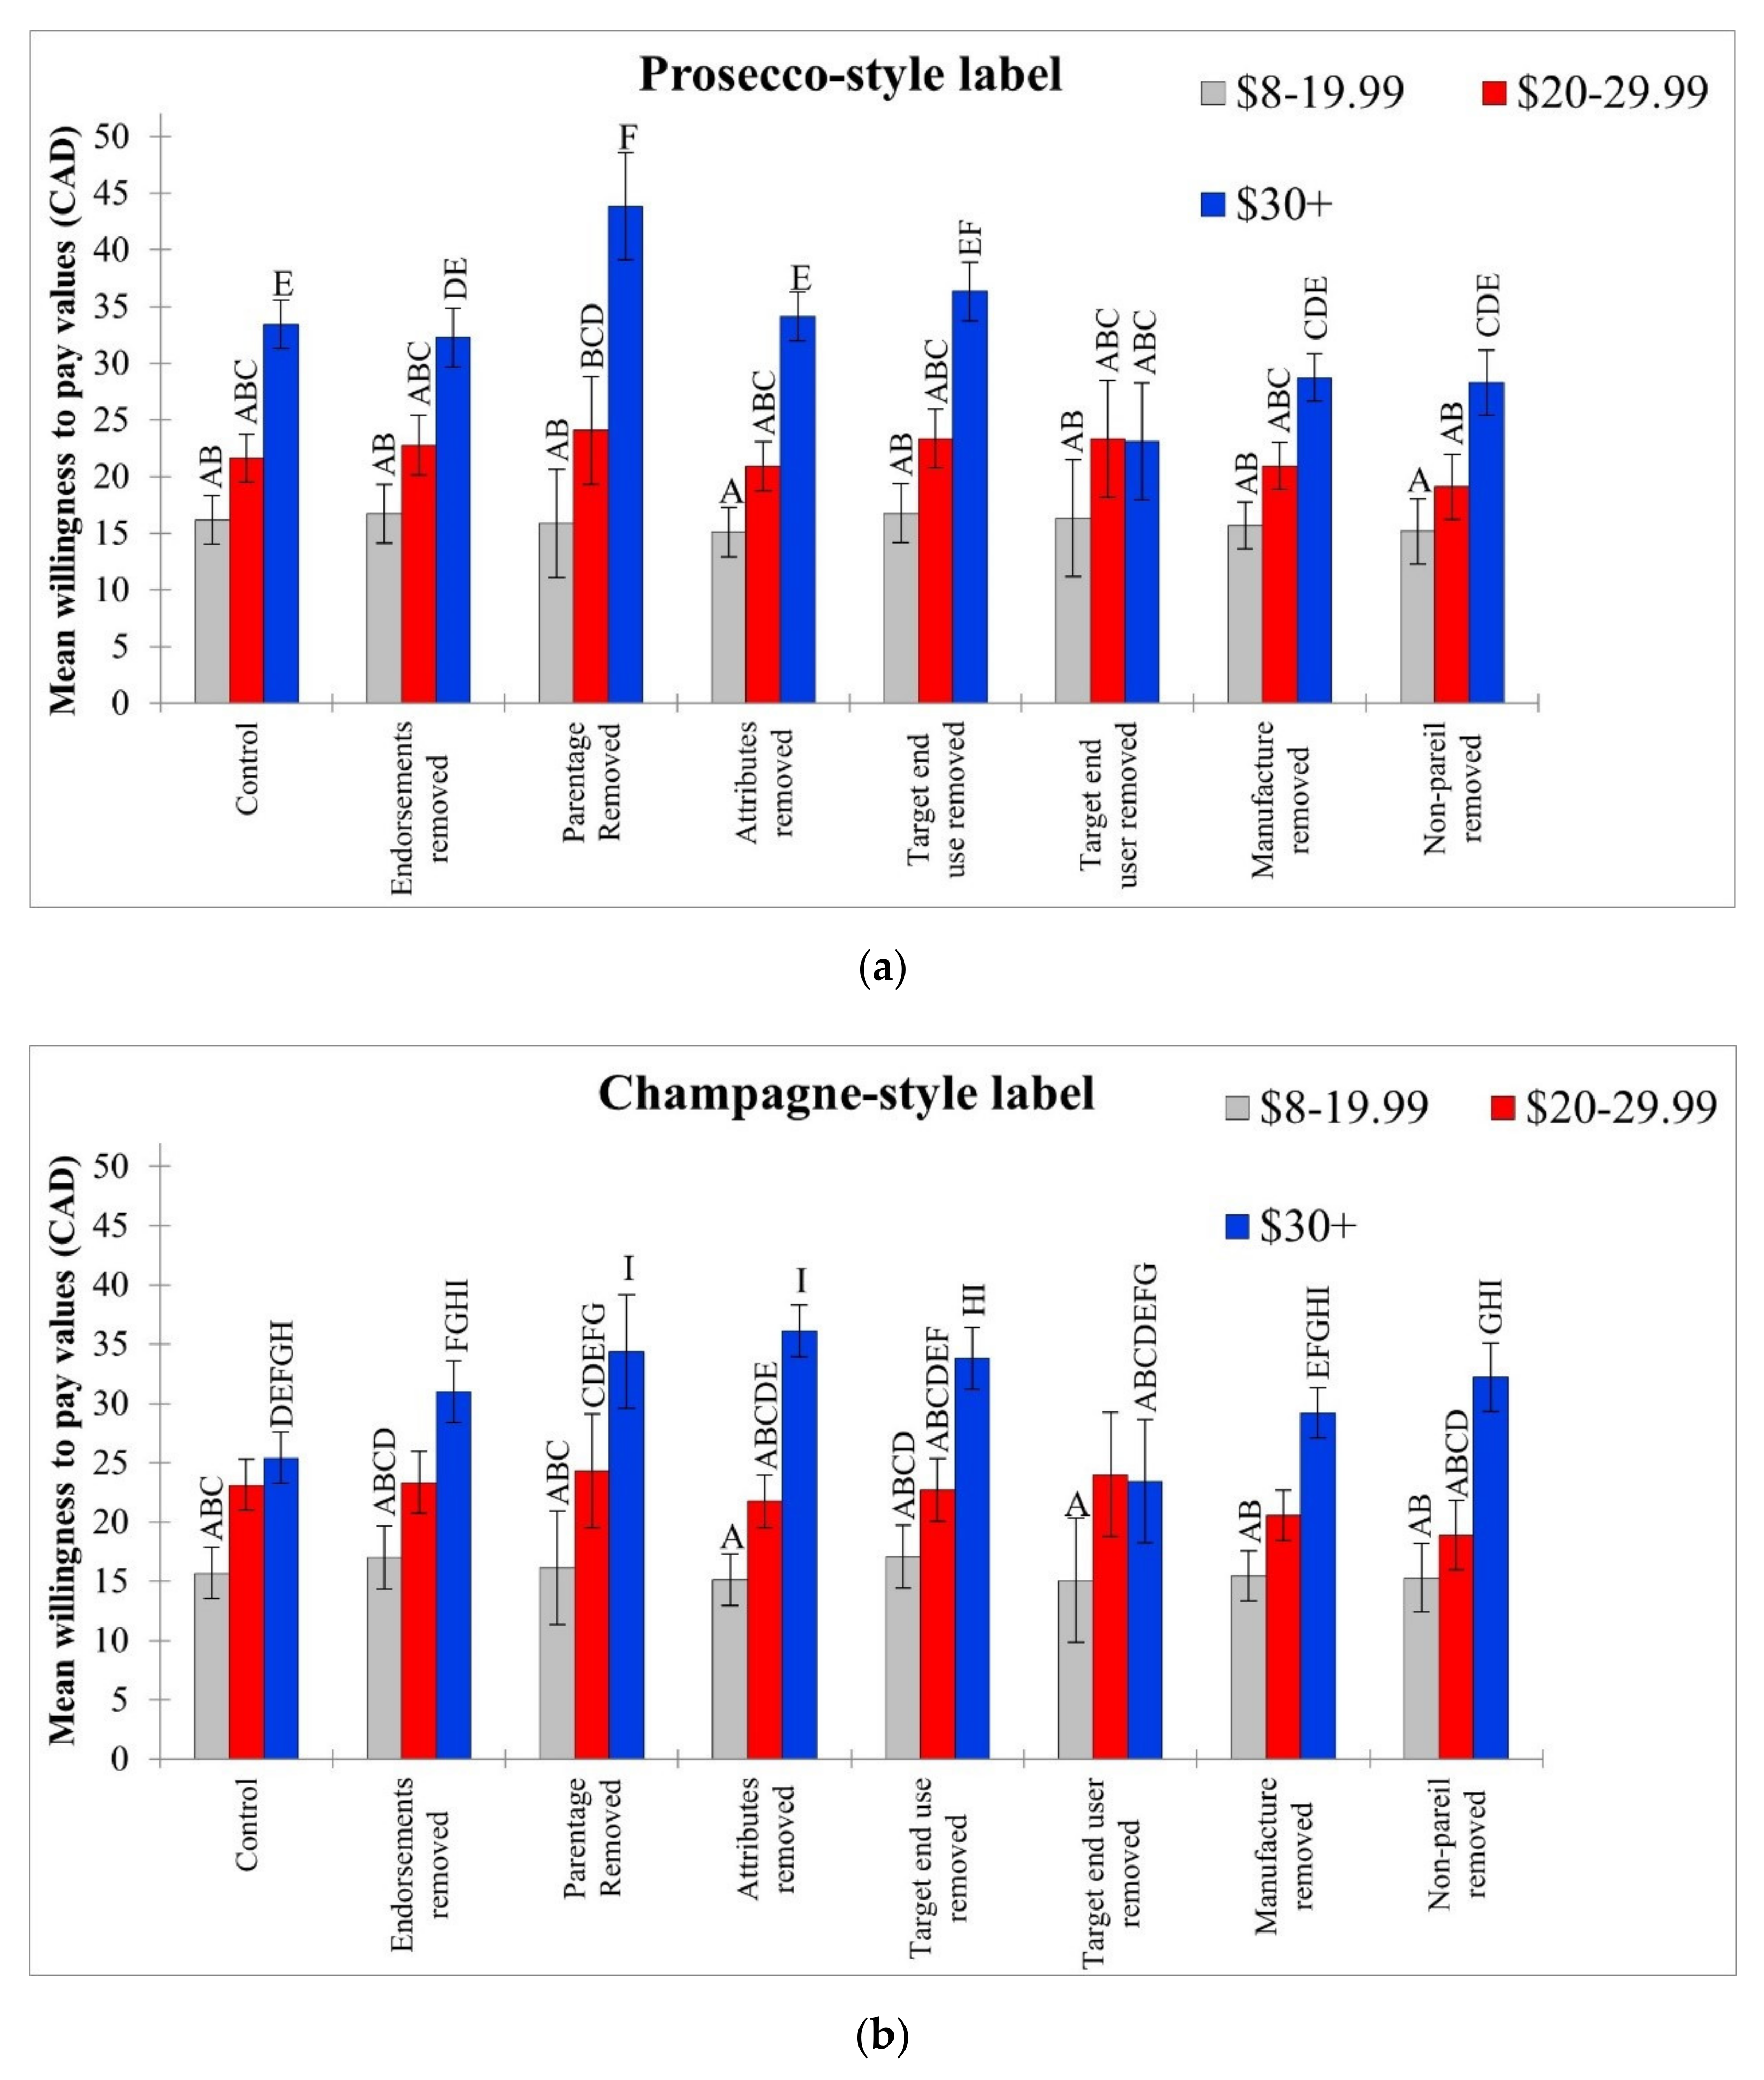
As previously noted, WTP increases with the amount typically paid for both wine styles (Figure 4). Significant interactions between label treatment and amount typically paid are observed for both Prosecco- (F(14,524) = 2.82, p ≤ 0.001) and Champagne-style (F(14,526) = 2.10, p = 0.011) wines. Specifically, consumers who normally pay CAD 30+ for sparkling wine are willing to pay more than control (full information) for both the parentage removed and target end use removed labels in the case of Prosecco, and for the parentage removed and attributes removed labels for Champagne.
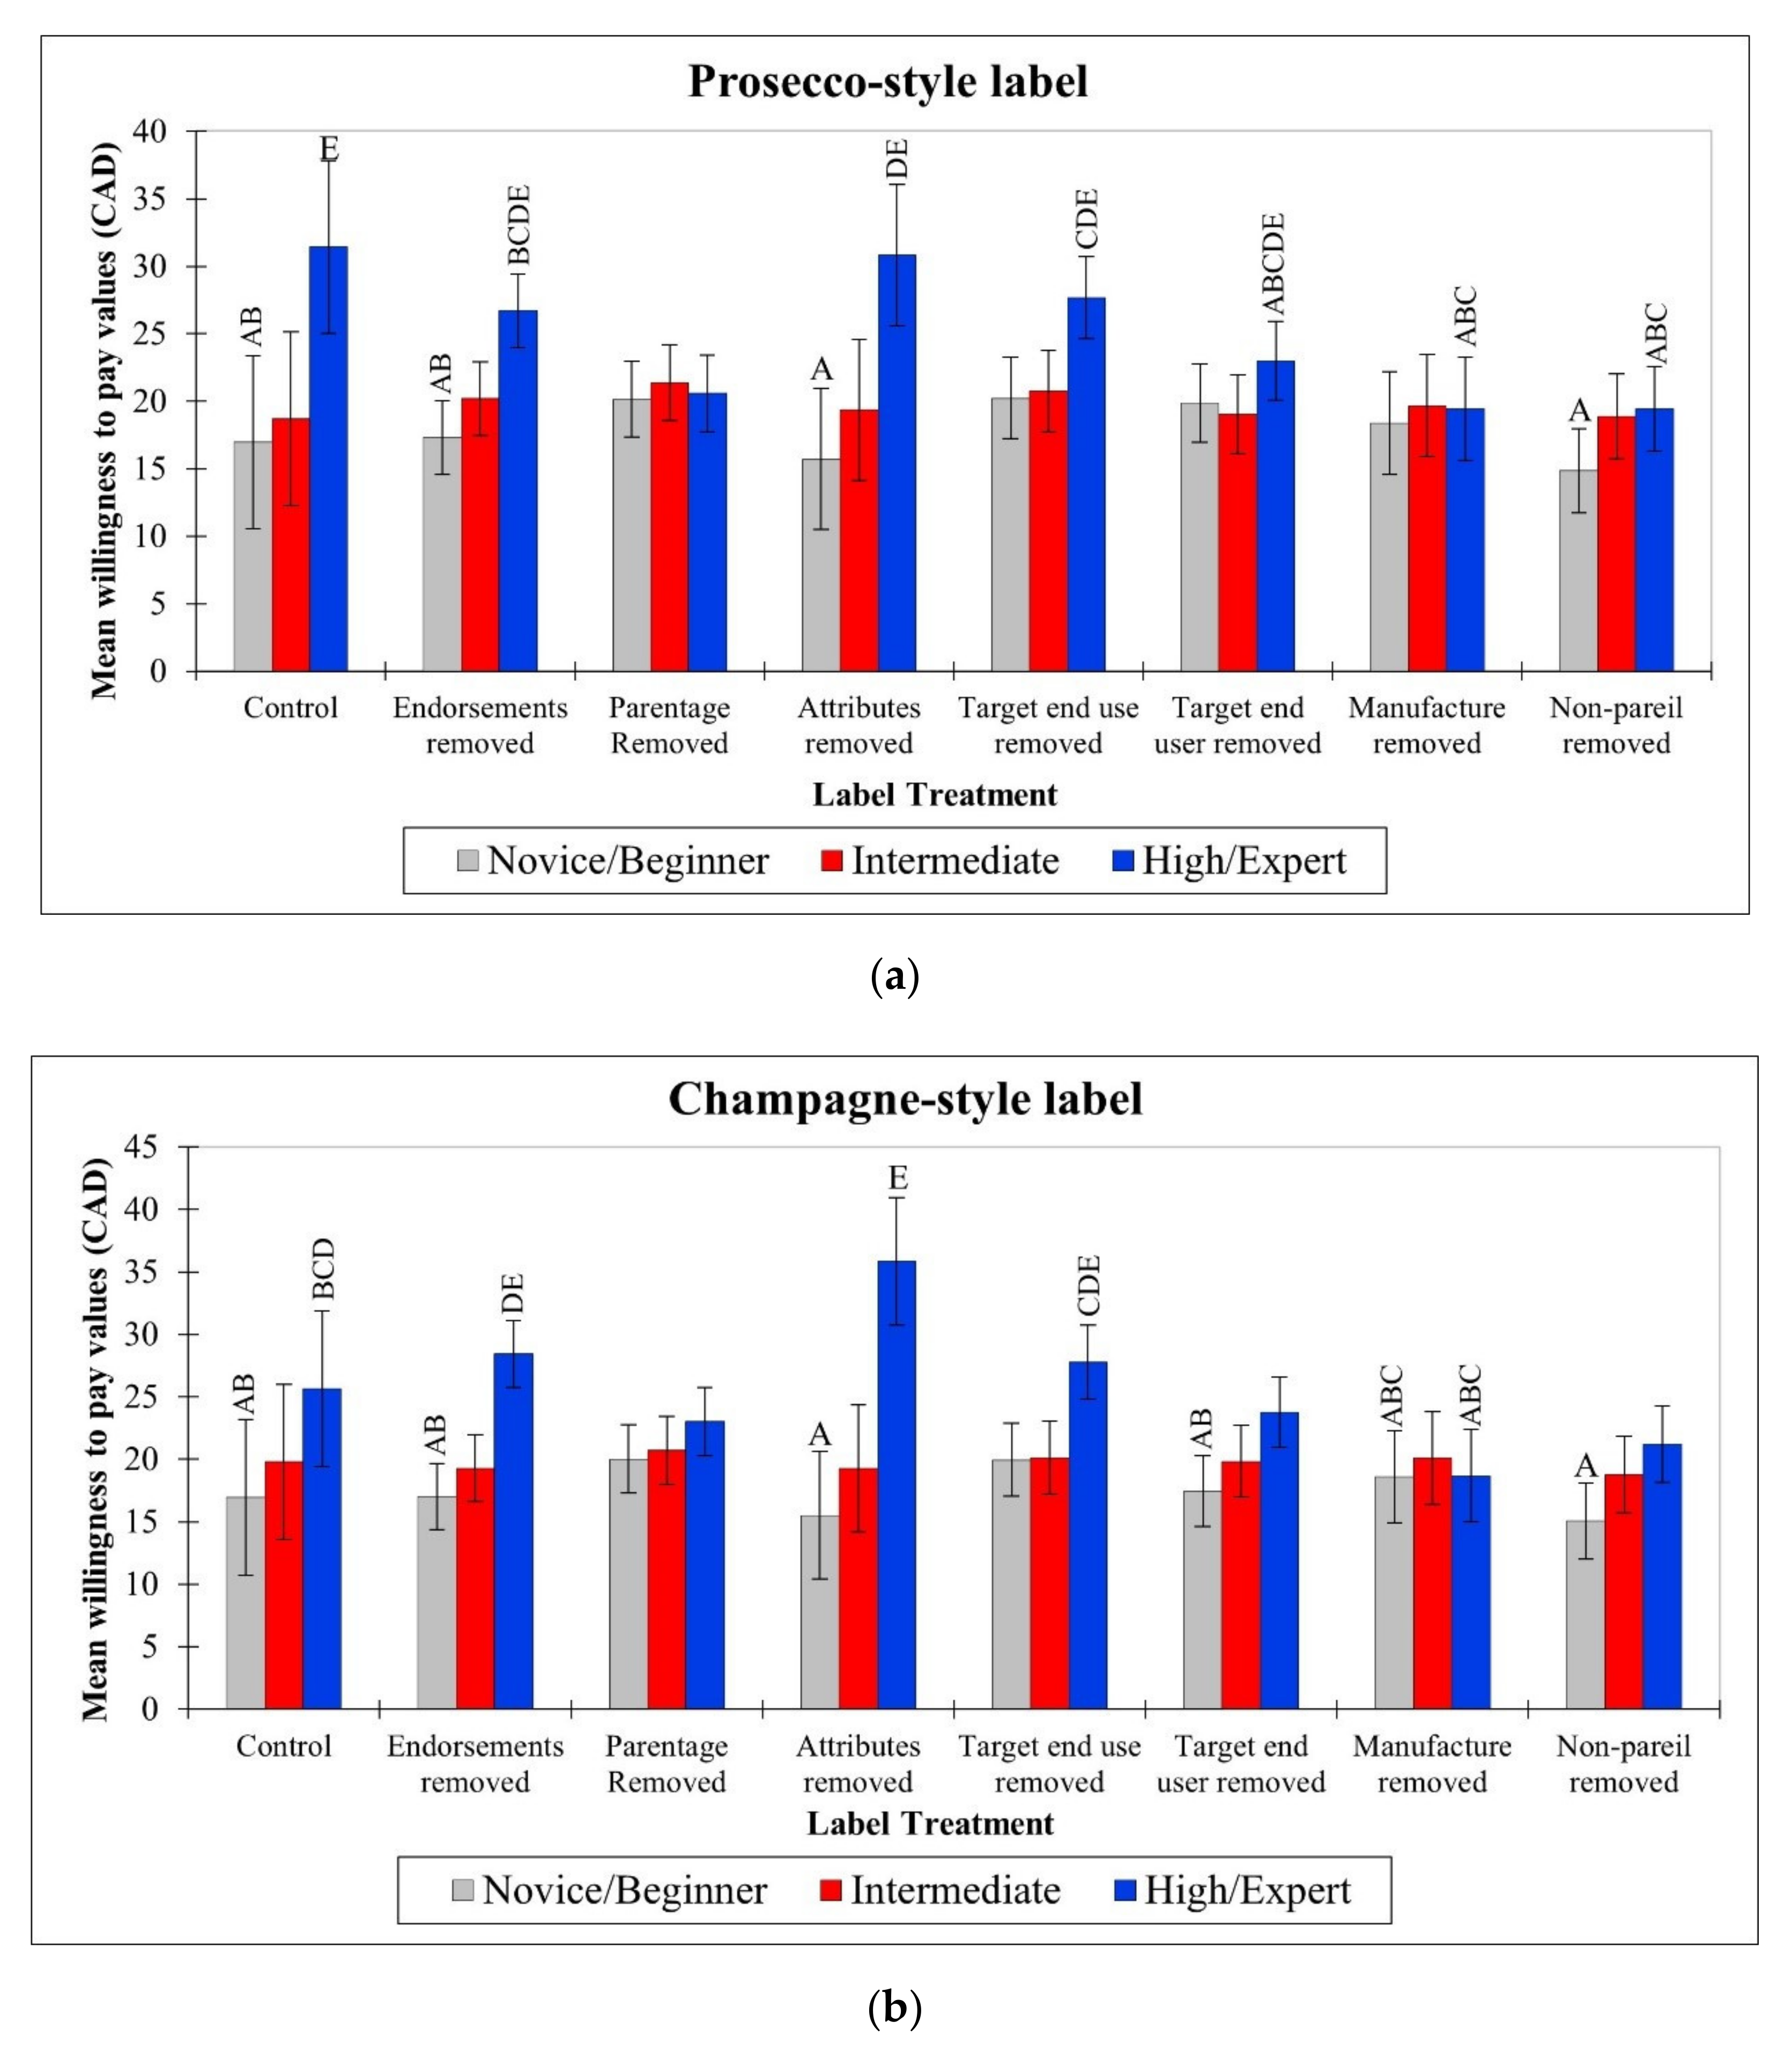
Respondents who consider themselves as having a high sparkling wine knowledge are willing to pay more for the Prosecco-style wine in several label conditions, as compared to consumers who consider themselves as having a low–medium knowledge (F(14,540) = 1.95, p = 0.020), with the same pattern observed for Champagne-like wine (F(14,542) = 2.06, p = 0.013; Figure 5). The difference is often non-trivial; for instance, approximately 47% more in the case of the Prosecco control label.
Furthermore, for the Prosecco-style label, respondents with a high subjective knowledge rate their WTP lower for the parentage removed, manufacture removed, and nonpareil removed treatments compared to the control, suggesting that these are important elements of Prosecco labels for this group. For the Champagne-style label, high sparkling wine knowledge respondents who receive the attributes removed treatment rate their WTP higher compared to those who receive the control label, suggesting that inclusion of this information component de-values the product for this group. For both wine styles, respondents with a high subjective knowledge rate WTP higher in the attributes removed treatment compared to those who have low–medium knowledge. This effect is also observed for the endorsements removed treatment for the Champagne-style label (Figure 5).
Perception of Quality (POQ)
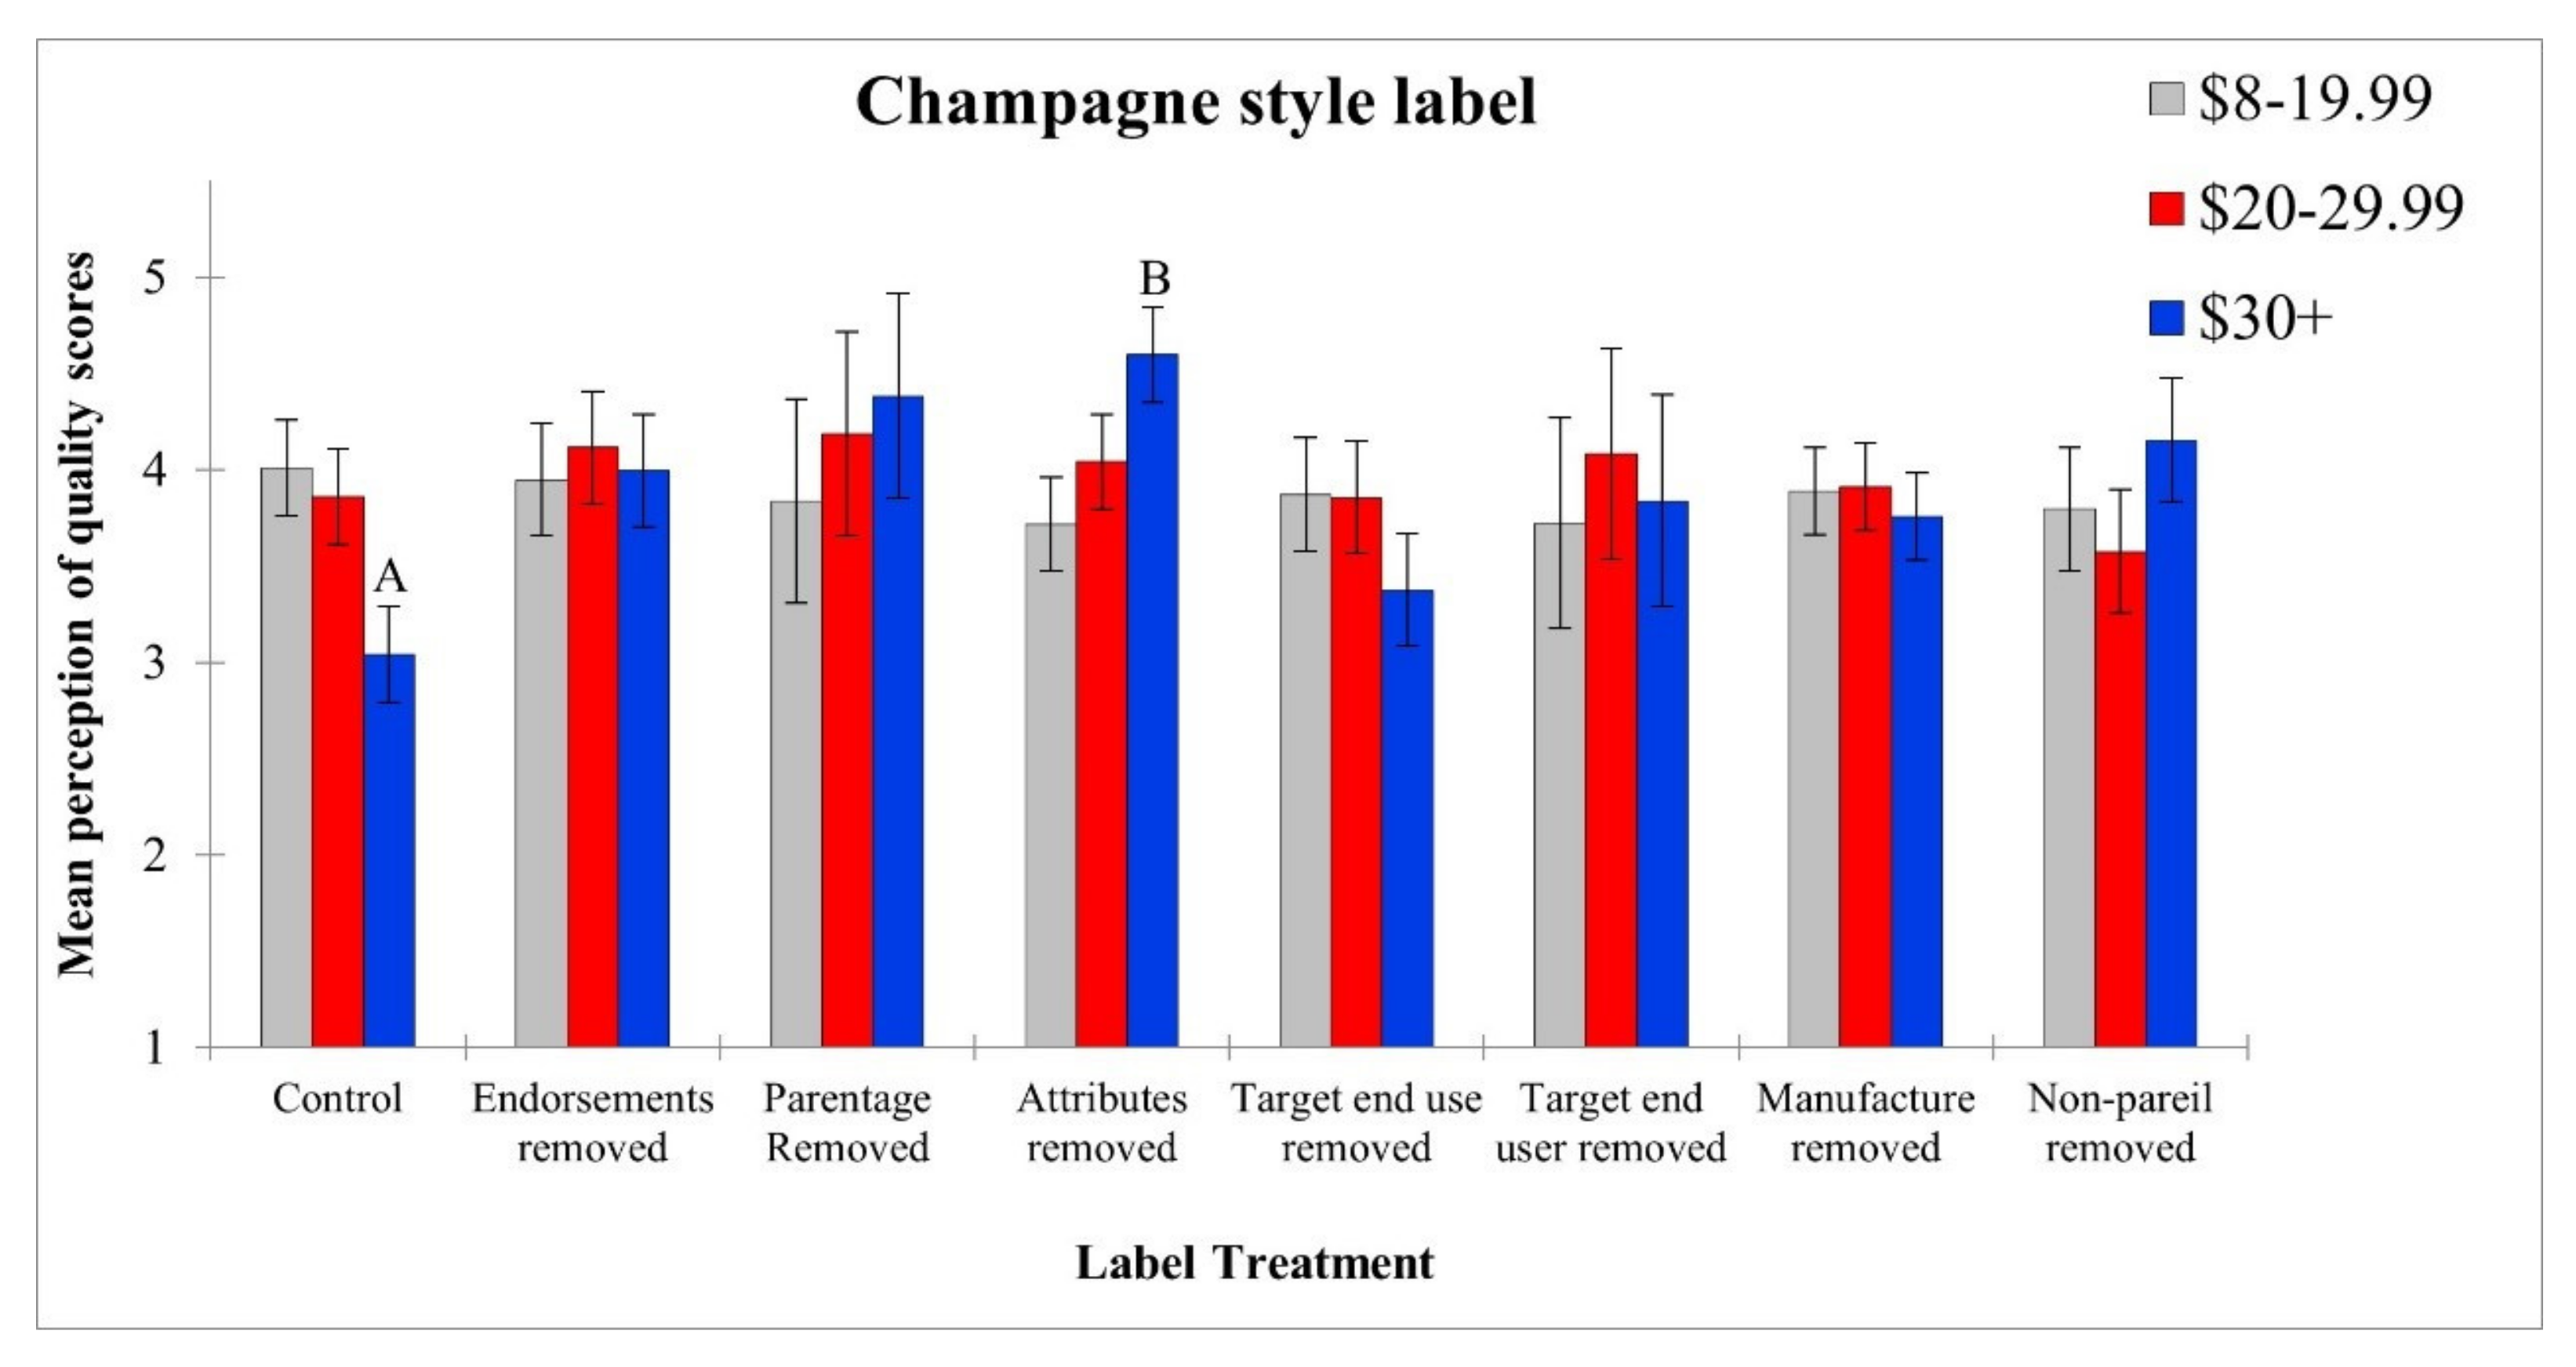
There is a significant interaction between label treatment and age for POQ for both the Prosecco- (F(21,524) = 1.76, p = 0.020) and Champagne-style (F(21,524) = 1.72, p = 0.024) wines. However, Tukey’s HSD test fails to separate the means for the former, and for Champagne, the results are trivial, with those aged 18–35 who receive the endorsements removed treatment rating POQ higher than those aged 18–35 who receive the target end use removed label (data not shown). There is also a significant interaction between label treatment and price typically paid for both Prosecco- (F(14,524) = 2.06, p = 0.013) and Champagne-style (F(14,524) = 2.40, p = 0.003) wines. As shown in Figure 6, consumers who pay CAD 30+ per bottle of sparkling wine rate the quality of the attributes removed label treatment higher than the control. A very similar pattern is observed for the Prosecco-style label, but Tukey’s HSD test failed to separate the means (data not shown).
4. Discussion
4.1. Self-Rated Importance of Label Information Elements
Our result on the importance of wine attributes is relatively consistent with previous research on table wine [8,9,10]. These prior studies demonstrate that a description of the wine’s attributes has value to consumers; however, our finding that it is rated highest in importance suggests that consumers place more importance on it when making sparkling wine purchases than when buying table wine. A possible explanation for this is that consumers use the attribute information as an indication of sparkling wine style. For instance, some consumers prefer light, fruity, sweeter styles, and they rely on the label for this information, rather than on direct knowledge that different production methods or regions of origin are associated with that style. Our result that grape variety/blend is the second most important information element to sparkling wine consumers broadly agrees with the saliency of this attribute for table wine consumers [8,10].
The relatively higher importance of alcohol content for consumers who prefer Prosecco-style wines (and younger respondents), and the relatively higher importance of vintage/year for those who prefer Champagne-style wines may reflect a taxonomy of different types of sparkling wine consumers, as proposed by Morton et al. [19]. That is, the Prosecco-style preferers consume it primarily to enjoy the effects of the alcohol and use it more in a celebration or social drink context [19,20,21], and as such fit the beverage wine drinker or new wine drinker categories [19]. In contrast, the higher importance placed on vintage/year by Champagne-style preferers fits with the connoisseurs or aspirational drinker types, who also display greater interest and knowledge in sparkling wine compared to the other consumer groups [19].
Consistent with Thomas and Pickering [8] with table wine, information statements that represent parentage are rated differently from one another, suggesting that consumers do not view parentage as a single entity. In our study, they clearly place more importance on the wine region than the winemaker. Interestingly, the importance ranking of “who the wine would appeal to” is much higher for the youngest cohort, compared to the oldest, suggesting that young consumers are perhaps less confident in themselves to choose an appropriate wine for the purchase occasion and, as a result, rely on the label to inform them of the type of person who the wine suits. If sparkling wine is often purchased for social gatherings, it may be that younger consumers use this information as a representation of how they would like to appear to others.
The relatively high self-rated importance of the production region for our cohort agrees with the findings of Lerro et al. [7] and Verdonk et al. [21], also with sparkling wine. Overall, how the wine is made only holds intermediate importance for our consumers. It is ranked higher for older consumers compared to younger ones, consistent with Cerjak et al. [20], and is also ranked higher by those who prefer Champagne-style wine than those who prefer Prosecco-style wine. Interestingly, Vecchio et al. [23] found that when detailed information on the production methods is provided, consumers prefer the traditional method wines more than Charmat method wines.
4.2. Mock Labels
Across all label treatments, younger consumers are more willing to buy, and willing to pay more, for sparkling wine compared to older consumers. Prior research shows that older generations purchase and consume sparkling wine less than younger generations [7]. Furthermore, our finding that females rate the POQ and WTB for sparkling wines higher than males agrees with Lerro et al. [7]. This can perhaps be attributed to sparkling wine being perceived as a more ‘feminine’ drink, with men typically being less interested [22]. Product involvement plays an important role in consumers’ perception of quality and purchase intent [2,28]; we extend this finding here to sparkling wine. If one is more involved in a product, it is understandable that they are more willing to buy, and pay more for, it. Similar interpretations can be made for sparkling wine knowledge, where we find that both subjective and objective sparkling wine knowledge associated with higher scores for WTB, WTP, and POQ, irrespective of wine style. These behavioural measures are also influenced by the interaction between consumer characteristics and specific label information type and are discussed below.
Influence of Specific Information Types
An important finding is that younger respondents are more willing to buy a sparkling wine without label endorsements compared to older groups. Partial support for this result comes from previous research with younger European sparkling wine consumers [20], although Verdonk et al. [21] report that endorsements/recommendations play an important part in the sparkling wine purchase decisions of Australia consumers under 35 years of age. Willingness to buy scores for people who spend CAD 30+ per bottle of sparkling wine show that these consumers have an aversion to wine attributes being shown on the label. We interpret this finding as attributable to a lowering of perceived quality, as the attributes removed treatment is rated higher than the control for POQ in this group. That is, these ‘big spenders’ are expecting a higher degree of quality, and a description of the wine’s sensory attributes detracts from the perceived quality. Perhaps these consumers believe that higher quality is implicit in higher priced wine, and ‘selling’ the consumer on the product, by listing the wine’s sensory attributes, is not only unnecessary, but signals a lower quality product that they are not willing to buy. These speculations require further investigation.
Our results also show that consumers who classify themselves as knowledgeable about sparkling wine place greater value on certain pieces of information than others. For several of the label treatments, the high subjective knowledge respondents are willing to pay more than respondents in the beginner–intermediate groups. Like those who spend CAD 30+, the high subjective knowledge respondents react negatively to a wine’s attributes being shown on the label. However, price paid per bottle and sparkling wine knowledge are only weakly associated (r = 0.247). Perhaps these discerning consumers view wine attributes as being ‘fluff’ that distracts from the information they find most important, or even distract from the prestige of the wine [22,29]. Similarly, more knowledgeable consumers may have a greater understanding of the subjective nature of a wine’s characteristics.
4.3. Managerial Implications
The results from this study provide the Ontario sparkling wine industry with insights on consumer preferences for label information. Recommendations to sparkling wine producers and marketers based on our findings largely support those from prior research in this field. However, we also contribute some unique insights not articulated in previous studies. Marketing practitioners should benefit from recognizing the importance of production region, grape variety/blend, and winery/wine company information on sparkling wine labels. We provide evidence that information on sensory attributes is also beneficial on sparkling wine labels, with an important caveat; sparkling wine priced higher than CAD 30 should not include this information, at least in the context of Ontario consumers.
When marketing to younger consumers, we recommended including label information on who the wine would appeal to, as well as a clear indication of the alcohol content. We recommend against including expert endorsements or awards for this cohort. For fruity, light, Prosecco-style wine, vintage/year information is much less important to include than it is for creamy, bready, Champagne-like sparkling wine styles.
In Canada, there are standards set by the government that require wine labels to include specific pieces of information, such as alcohol content, wine name, and producer. Additionally, in Ontario, the Vintners Quality Alliance (VQA) Act has requirements for label information that must be adhered to in order to be certified as a VQA sparkling wine (e.g., method of production, vintage date, and sweetness indicators such as ‘brut’, ‘dry’, and ‘sweet’) [30]. Sparkling wine producers should consider all these requirements, since some types of label information are mandated by law, regardless of how important they are to consumers. Marketers might also consider distribution channels, as certain label information may be more important to consumers based on where they purchase the wine. For instance, parentage information may be more important in purchase decisions made at a winery than at a liquor store, because consumers can directly interact with the winery retail staff and perhaps learn more about the history of the region, the winemaker, or other information about the winery.
4.4. Comparison of Methods and Study Limitations
One of the strengths of our study is the use of two methods with the same sample (self-report and experimental manipulation) to examine the relative importance of sparkling wine label information types. The design of the label manipulation trial seeks to better simulate the product evaluation and purchase decision processes of consumers [8]. A comparison of results from the two methods shows consistency for key findings. For instance, the endorsements information element was rated consistently low in importance, supporting the finding that younger respondents are more willing to buy the endorsements removed label treatment compared to the control. However, discrepancies between the two methods exist. The high subjective knowledge and high ‘spend per bottle’ groups show an aversion towards wine attributes in the experimental manipulation, yet the sample overall self-rated this attribute as an important label element. This may indicate that in some contexts, motivators and cues may not align perfectly with consumers’ perceptions of why they make the purchase decisions that they do. An advantage of comparing both methods in the same sample is the discovery (from the mock label trial) that some common label information elements elicit a negative response (e.g., reduced WTB, WTP and POQ) in consumers. This would not have been evident if we had only asked participants to self-rate the relative importance of different information types.
Since this study focuses on label information, the mock labels developed were basic in design, in an attempt to have information as the focus for the participants, and thus, may not reflect commercial wine labels or differences between the two wine styles as well as hoped. Furthermore, the information shown on the mock labels was developed in order to represent the different information types (parentage, attributes, manufacture, etc.) effectively, but also to maintain a degree of realism. This was done by surveying many commercial sparkling wines from Ontario and choosing representative words to fit each information statement. However, one limitation is the specific words chosen. For instance, a consumer may put high importance on wine attributes, but if they do not happen to like the attributes shown on the mock label, their responses may not capture their beliefs accurately. We did develop multiple versions of information statements for each information type to help compensate for this possibility.
We encourage further research with different markets, and a wider range of sparkling wine styles, to explore how generalizable our findings are. Additionally, future work should consider and manipulate the purchase/consumption occasion to assess how this affects the relative value of different label information elements.
5. Conclusions
Wine label information provides important cues for consumers to aid and influence them in their purchase behaviour. This research used two different methodological approaches to better understand the relative importance of seven label information types applied to two sparkling wine styles. Overall, wine sensory attributes, grape variety/blend, and production region are important information components to include on sparkling wine labels. However, consumers who consider themselves knowledgeable about sparkling wine, and those who pay more than CAD 30 per bottle show reduced willingness to buy, willingness to pay, and perception of quality when wine attributes are included on labels. Information on alcohol content is more important to young consumers and consumers who prefer Prosecco-style sparkling wine, whereas vintage/year information is more important to consumers who prefer Champagne-style sparkling wines. In addition, our results show that expert endorsements are not important to younger sparkling wine consumers. The findings of this study contribute to our knowledge of sparkling wine consumer behaviour and perception of quality from a label information perspective and have implications for sparkling wine marketers and producers.
Author Contributions
Conceptualization, G.J.P. and B.K.; methodology, G.J.P. and M.D.; formal analysis, G.J.P. and M.D.; investigation, G.J.P. and M.D.; resources, G.J.P. and B.K.; data curation, G.J.P. and M.D.; writing—original draft preparation, G.J.P. and M.D.; writing—G.J.P. and M.D.; supervision, G.J.P. and B.K.; project administration, G.J.P.; funding acquisition, G.J.P. and B.K. All authors have read and agreed to the published version of the manuscript.
Funding
This research was funded by the Ontario Grape and Wine Research Inc. (Project Grant # 002100 to G.J.P. and B.K.).
Institutional Review Board Statement
The study was conducted in accordance with the Declaration of Helsinki, and approved by the Brock University Research Ethics Board (#19-130 PICKERING).
Informed Consent Statement
Informed consent was obtained from all subjects involved in the study.
Data Availability Statement
The data presented in this study are available on request from the corresponding author.
Acknowledgments
Thank you to Hannah Pickering, Margaret Thibodeau, and Gillian Dale, Brock University, for technical/editorial assistance.
Conflicts of Interest
The authors declare no conflict of interest.
Appendix A

Table A1.
Measures of intake, sparkling wine style preference, and purchasing behaviour.
| Measure | Question Wording | Categories |
|---|---|---|
| Yearly alcohol intake | How frequently do you consume alcohol? |
|
| Yearly sparkling wine intake | How frequently do you consume sparkling wine? |
|
| Preferred sparkling wine style | Which of the following sparkling wine styles do you prefer? |
|
| Money typically spent per bottle of sparkling wine | When buying sparkling wine, how much do you typically spend per bottle? (CAD) |
|
Appendix B
Table A2.
Mean importance ratings for label information elements that varied with consumer characteristics. Letters represent significantly different means (ANOVA followed by Tukey’s (HSD0.05)); *, **, and ***; p values ≤0.05, ≤0.01, and ≤0.00.1 respectively. “ns”, not significant.
Table A2.
Mean importance ratings for label information elements that varied with consumer characteristics. Letters represent significantly different means (ANOVA followed by Tukey’s (HSD0.05)); *, **, and ***; p values ≤0.05, ≤0.01, and ≤0.00.1 respectively. “ns”, not significant.
| Variables | Information Elements | ||||||
|---|---|---|---|---|---|---|---|
| Wine Region History | Wine-Maker History | Brand Name | Wine Company | How the Wine Is Made | Wine’s Attributes | How to Use the Wine | |
| Gender of consumer | * | * | |||||
| Female | ns | ns | ns | 3.28 a | ns | 3.88 a | ns |
| Male | ns | ns | ns | 3.09 b | ns | 3.68 b | ns |
| Age | ** | ||||||
| 18–25 | ns | ns | ns | ns | ns | ns | 3.42 b |
| 26–35 | ns | ns | ns | ns | ns | ns | 3.29 ab |
| 36–45 | ns | ns | ns | ns | ns | ns | 3.39 b |
| 46–55 | ns | ns | ns | ns | ns | ns | 3.14 ab |
| 56+ | ns | ns | ns | ns | ns | ns | 2.89 a |
| Subjective knowledge | *** | *** | *** | *** | *** | ** | |
| Novice/beginner | 2.88 a | 2.67 a | 2.92 a | 2.94 a | 2.85 a | ns | 2.95 a |
| Intermediate | 3.31 b | 3.06 b | 3.22 b | 3.22 b | 3.26 b | ns | 3.17 a |
| High | 3.76 c | 3.61 c | 3.56 c | 3.70 c | 3.74 c | ns | 3.50 b |
| Objective knowledge | *** | *** | *** | *** | *** | *** | *** |
| Beginner | 2.87 a | 2.66 a | 2.85 a | 2.88 a | 2.72 a | 3.52 a | 2.88 a |
| Intermediate | 3.41 b | 3.21 b | 3.30 b | 3.32 b | 3.37 b | 3.87 b | 3.26 b |
| High | 3.45 b | 3.15 b | 3.47 b | 3.52 b | 3.67 b | 4.13 b | 3.38 b |
| Wine involvement | *** | *** | *** | *** | *** | *** | *** |
| Low | 2.53 a | 2.28 a | 2.62 a | 2.61 a | 2.62 a | 3.29 a | 2.59 a |
| Medium | 3.19 b | 2.98 b | 3.11 b | 3.12 b | 3.11 b | 3.73 b | 3.13 b |
| High | 3.59 c | 3.37 c | 3.51 c | 3.59 c | 3.57 c | 4.12 c | 3.39 c |
| Sparkling wine involvement | *** | *** | *** | *** | *** | *** | *** |
| Low | 2.82 a | 2.58 a | 2.76 a | 2.77 a | 2.74 a | 3.46 a | 2.86 a |
| Medium | 3.26 b | 3.05 b | 3.21 b | 3.22 b | 3.22 b | 3.82 b | 3.12 b |
| High | 3.78 c | 3.58 c | 3.72 c | 3.84 c | 3.81 c | 4.23 c | 3.67 c |
| Yearly sparkling wine intake | *** | *** | *** | *** | *** | ** | ** |
| Once a year | 2.72 a | 2.51 a | 2.66 a | 2.70 a | 2.67 a | 3.40 a | 2.75 a |
| 2–4 times per year | 3.06 ab | 2.88 ab | 3.08 b | 3.03 ab | 3.07 ab | 3.72 ab | 3.05 ab |
| 5–10 times per year | 3.22 bc | 2.99 bc | 3.11 b | 3.22 bc | 3.09 ab | 3.76 abc | 3.10 abc |
| Once a month | 3.42 bc | 3.18 bc | 3.35 bc | 3.44 c | 3.52 bc | 4.10 c | 3.27 bc |
| 2–3 times a month | 3.53 c | 3.26 bc | 3.37 bc | 3.40 bc | 3.39 bc | 3.93 bc | 3.33 bc |
| One or more times per week | 3.73 c | 3.52 c | 3.71 c | 3.71 c | 3.60 c | 3.90 abc | 3.58 c |
| Variables | Information Elements | ||||||
| What Occasion the Wine Is for | Who the Wine would Appeal to | Expert Endorsements | Unique or Unrivalled | Alcohol Content | Grape Variety/ Blend | Vintage/ Year | |
| Age | * | *** | ** | ** | ** | ||
| 18–25 | 3.55 a | 3.58 b | 3.36 b | 3.10 b | 3.61 b | ns | ns |
| 26–35 | 3.25 a | 3.12 ab | 3.11 b | 2.87 b | 3.33 ab | ns | ns |
| 36–45 | 3.39 a | 3.30 b | 2.94 ab | 2.94 b | 3.49 ab | ns | ns |
| 46–55 | 2.98 a | 2.80 a | 2.78 ab | 2.71 ab | 3.21 a | ns | ns |
| 56+ | 3.11 a | 2.84 a | 2.70 a | 2.44 a | 3.08 a | ns | ns |
| Income (CAD) | ** | ||||||
| Under 25 k | ns | ns | ns | ns | 3.68 b | ns | ns |
| 25–45 k | ns | ns | ns | ns | 3.36 ab | ns | ns |
| 46–65 k | ns | ns | ns | ns | 3.42 ab | ns | ns |
| 66–85 k | ns | ns | ns | ns | 3.31 ab | ns | ns |
| 86–100 k | ns | ns | ns | ns | 3.29 ab | ns | ns |
| 101–140 k | ns | ns | ns | ns | 3.04 a | ns | ns |
| 141–200 k | ns | ns | ns | ns | 3.00 a | ns | ns |
| 200 k+ | ns | ns | ns | ns | 3.03 a | ns | ns |
| Subjective knowledge | * | * | *** | *** | * | *** | *** |
| Novice/beginner | 3.03 a | 2.88 a | 2.64 a | 2.43 a | 3.08 a | 3.11 a | 2.88 a |
| Intermediate | 3.23 ab | 3.00 a | 2.90 b | 2.73 b | 3.27 ab | 3.51 b | 3.21 b |
| High | 3.45 b | 3.36 b | 3.35 c | 3.28 c | 3.52 b | 3.88 c | 3.73 c |
| Objective knowledge | * | * | *** | *** | *** | *** | *** |
| Beginner | 2.98 a | 2.82 a | 2.61 a | 2.43 a | 2.97 a | 3.01 a | 2.77 a |
| Intermediate | 3.30 b | 3.14 b | 3.03 b | 2.90 b | 3.41 b | 3.62 b | 3.36 b |
| High | 3.33 b | 3.04 ab | 2.99 b | 2.72 ab | 3.33 b | 3.77 b | 3.48 b |
| Wine involvement | *** | *** | *** | *** | *** | *** | *** |
| Low | 2.71 a | 2.54 a | 2.30 a | 2.24 a | 2.90 a | 2.68 a | 2.36 a |
| Medium | 3.17 b | 3.01 b | 2.83 b | 2.60 b | 3.18 a | 3.35 b | 3.16 b |
| High | 3.45 c | 3.23 b | 3.22 c | 3.12 c | 3.51 b | 3.89 c | 3.55 c |
| Sparkling wine involvement | *** | *** | *** | *** | *** | *** | *** |
| Low | 2.90 a | 2.68 a | 2.44 a | 2.25 a | 2.83 a | 2.94 a | 2.73 a |
| Medium | 3.23 b | 3.05 b | 2.94 b | 2.72 b | 3.29 b | 3.48 b | 3.24 b |
| High | 3.58 c | 3.47 c | 3.42 c | 3.43 c | 3.81 c | 4.08 c | 3.72 c |
| Yearly sparkling wine intake | ** | *** | *** | *** | *** | *** | |
| Once a year | ns | 2.66 a | 2.35 a | 2.19 a | 2.81 a | 2.84 a | 2.51 a |
| 2–4 times per year | ns | 2.90 a | 2.73 ab | 2.55 ab | 3.13 ab | 3.38 b | 3.16 b |
| 5–10 times per year | ns | 3.06 ab | 2.99 bc | 2.68 b | 3.21 abc | 3.40 b | 3.23 b |
| Once a month | ns | 3.14 ab | 3.02 bc | 2.92 bc | 3.29 bc | 3.70 b | 3.32 b |
| 2–3 times a month | ns | 3.14 ab | 3.08 bc | 2.93 bc | 3.55 cd | 3.65 b | 3.40 b |
| One or more times per week | ns | 3.48 b | 3.46 c | 3.42 c | 3.81 d | 3.77 b | 3.65 b |
| Preferred style | ** | * | |||||
| Fruity, sweeter, sparkling wine | ns | ns | ns | ns | 3.36 b | ns | 3.13 a |
| Creamy, bready, drier, sparkling wine | ns | ns | ns | ns | 3.09 a | ns | 3.32 b |
Appendix C
Table A3.
Mean values for significant effects on willingness to buy (WTB) (7-point Likert scale); willingness to pay (WTP) (CAD); and perception of quality (POQ) (5-point Likert scale) for mock sparkling wine labels (data collapsed across label conditions). Letters represent significantly different means (ANOVA followed by Tukey’s (HSD0.05)); NS = not significant. *, **, and ***; p values ≤0.05, ≤0.01, and ≤0.00.1, respectively.
| Variables | Means and Statistical Significance | |||||
|---|---|---|---|---|---|---|
| WTB | WTP | POQ | ||||
| Prosecco Style Label | Champagne Style Label | Prosecco Style Label | Champagne Style Label | Prosecco Style Label | Champagne Style Label | |
| Age | ** | * | *** | *** | ||
| 18–25 | 5.13 a | 4.97 a | 29.61 a | 28.26 a | ns | ns |
| 26–35 | 4.96 abc | 4.87 ab | 19.80 bc | 19.89 bc | ns | ns |
| 36–45 | 5.08 ab | 4.95 a | 21.07 b | 21.09 b | ns | ns |
| 46–55 | 4.66 bc | 4.54 ab | 20.89 b | 20.51 b | ns | ns |
| 56+ | 4.53 c | 4.49 b | 18.08 c | 18.23 c | ns | ns |
| Gender of consumer | ** | *** | *** | |||
| Female | 4.95 a | ns | ns | ns | 3.98 a | 3.99 a |
| Male | 4.59 b | ns | ns | ns | 3.75 b | 3.79 b |
| Income (CAD) | ** | * | ||||
| Under 45 k | ns | ns | 17.55 a | 18.20 a | ns | ns |
| 46–65 k | ns | ns | 18.40 ab | 18.32 a | ns | ns |
| 66–85 k | ns | ns | 20.89 bc | 19.78 ab | ns | ns |
| 86–100 k | ns | ns | 18.93 ab | 19.42 a | ns | ns |
| 101–140 k | ns | ns | 20.22 bc | 19.96 ab | ns | ns |
| 140 k+ | ns | ns | 21.74 c | 22.00 b | ns | ns |
| Subjective knowledge | *** | *** | *** | *** | * | ** |
| Novice/beginner | 4.44 a | 4.29 a | 17.78 a | 17.51 a | 3.86 a | 3.86 a |
| Intermediate | 4.90 b | 4.79 b | 20.08 b | 19.87 b | 3.82 ab | 3.85 a |
| High | 5.21 b | 5.31 c | 26.32 c | 27.22 c | 4.04 b | 4.09 b |
| Objective knowledge | *** | *** | *** | *** | * | * |
| Beginner | 4.43 a | 4.39 a | 17.81 a | 17.51 a | 3.80 a | 3.81 a |
| Intermediate | 4.98 b | 4.79 b | 21.18 b | 20.87 b | 3.87 ab | 3.89 a |
| High | 4.94 b | 5.06 b | 22.61 b | 23.78 c | 4.02 b | 4.07 b |
| Wine involvement | *** | *** | *** | *** | *** | *** |
| Low | 4.30 a | 4.25 a | 17.01 a | 17.14 a | 3.74 a | 3.75 a |
| Medium | 4.84 b | 4.72 b | 20.62 b | 20.07 b | 3.86 a | 3.86 a |
| High | 5.36 c | 5.32 c | 24.18 c | 25.18 c | 4.12 b | 4.21 b |
| Sparkling wine involvement | *** | *** | *** | *** | *** | *** |
| Low | 4.06 a | 4.11 a | 16.74 a | 16.88 a | 3.70 a | 3.74 a |
| Medium | 4.89 b | 4.75 b | 20.50 b | 20.18 b | 3.85 b | 3.86 a |
| High | 5.67 c | 5.50 c | 25.28 c | 25.54 c | 4.22 c | 4.26 b |
| Yearly sparkling wine intake | *** | *** | *** | *** | * | |
| Once a year | 3.74 a | 3.85 a | 15.71 a | 15.92 a | 3.72 a | |
| 2–4 times per year | 4.69 b | 4.55 b | 19.36 b | 19.43 b | 3.80 ab | |
| 5–10 times per year | 4.88 bc | 4.62 b | 19.83 b | 19.77 b | 3.90 abc | |
| Once a month | 5.02 bc | 4.99 c | 21.01 b | 20.77 b | 3.90 abc | |
| 2–3 times a month | 5.13 c | 5.06 c | 21.41 b | 21.05 b | 3.94 bc | |
| One or more times per week | 5.73 d | 5.48 c | 28.17 c | 27.92 c | 4.13 c | ns |
| Amount spent per bottle of sparkling wine (CAD) | ** | ** | *** | *** | ||
| 8–14.99 | 4.24 a | 4.28 a | 13.08 a | 13.29 a | ns | ns |
| 15–19.99 | 4.70 ab | 4.51 ab | 16.91 b | 16.59 b | ns | ns |
| 20–24.99 | 4.99 b | 4.81 abc | 21.21 c | 21.42 c | ns | ns |
| 25–29.99 | 5.00 b | 5.00 abc | 23.74 d | 24.25 d | ns | ns |
| 30–39.99 | 4.97 b | 5.25 c | 33.82 e | 32.89 e | ns | ns |
| 40–49.99 | 5.20 b | 5.20 bc | 37.90 e | 35.80 e | ns | ns |
| 50+ | 4.71 ab | 4.88 abc | 33.06 e | 32.71 e | ns | ns |
| Preferred style | ** | * | *** | |||
| Fruity, sweeter, sparkling wine | 4.97 a | ns | 19.79 a | 19.53 a | ns | ns |
| Creamy, bready, drier, sparkling wine | 4.60 b | ns | 21.45 b | 21.75 b | ns | ns |
References
- Olson, J.C. Cue Utilization in the Quality Perception Process: A Cognitive Model and an Empirical Test. Ph.D. Thesis, Purdue University, West Lafayette, IN, USA, 1972. [Google Scholar]
- Cox, D. Predicting consumption, wine involvement and perceived quality of Australian red wine. J. Wine Res. 2009, 20, 209–229. [Google Scholar] [CrossRef]
- Dodd, T.H.; Laverie, D.A.; Wilcox, J.F.; Duhan, D.F. Differential effects of experience, subjective knowledge, and objective knowledge on sources of information used in consumer wine purchasing. J. Hosp. Tour. Res. 2005, 29, 3–19. [Google Scholar] [CrossRef]
- Frøst, M.B.; Noble, A.C. Preliminary study of the effect of knowledge and sensory expertise on liking for red wines. Am. J. Enol. Vitic. 2002, 53, 275–284. [Google Scholar]
- Mueller, S.; Francis, L.; Lockshin, L. The Relationship between Wine Liking, Subjective and Objective Wine Knowledge: Does It Matter Who Is Your ‘Consumer’ Sample? Ph.D. Thesis, AWBR Academy of Wine Business Research, Dijon, France, 2008. [Google Scholar]
- Elliot, S.; Barth, J.E. Wine label design and personality preferences of millennials. J. Prod. Brand. Manag. 2012, 21, 183–191. [Google Scholar] [CrossRef]
- Lerro, M.; Vecchio, R.; Nazzaro, C.; Pomarici, E. The growing (good) bubbles: Insights into US consumers of sparkling wine. Br. Food J. 2020, 122, 2371–2384. [Google Scholar] [CrossRef]
- Thomas, A.; Pickering, G. The importance of wine label information. Int. J. Wine Mark. 2003, 15, 58–74. [Google Scholar] [CrossRef]
- Charters, S.; Lockshin, L.; Unwin, T. Consumer responses to wine bottle back labels. J. Wine Res. 1999, 10, 183–195. [Google Scholar] [CrossRef]
- Barber, N.; Almanza, B.A. Influence of wine packaging on consumers’ decision to purchase. J. Foodserv. Bus. Res. 2007, 9, 83–98. [Google Scholar] [CrossRef]
- Kelley, K.; Hyde, J.; Bruwer, J. US wine consumer preferences for bottle characteristics, back label extrinsic cues and wine composition: A conjoint analysis. Asia Pac. J. Mark. Logis. 2015, 27, 516–534. [Google Scholar] [CrossRef]
- Boudreaux, C.A.; Palmer, S.E. A charming little Cabernet: Effects of wine label design on purchase intent and brand personality. Int. J. Wine Bus. Res. 2007, 19, 170–186. [Google Scholar] [CrossRef]
- Sherman, S.; Tuten, T. Message on a bottle: The wine label’s influence. Int. J. Wine Bus. Res. 2011, 23, 221–234. [Google Scholar] [CrossRef]
- Barber, N.; Ismail, J.; Taylor, D.C. Label fluency and consumer self-confidence. J. Wine Res. 2007, 18, 73–85. [Google Scholar] [CrossRef]
- Sáenz-Navajas, M.-P.; Campo, E.; Sutan, A.; Ballester, J.; Valentin, D. Perception of wine quality according to extrinsic cues: The case of Burgundy wine consumers. Food Qual. Prefer. 2013, 27, 44–53. [Google Scholar] [CrossRef]
- Mueller, S.; Lockshin, L.; Saltman, Y.; Blanford, J. Message on a bottle: The relative influence of wine back label information on wine choice. Food Qual. Prefer. 2010, 21, 22–32. [Google Scholar] [CrossRef]
- Shaw, M.; Keeghan, P.; Hall, J. Consumers judge wine by its label, study shows. Aust. N.Z. Wine Ind. J. 1999, 14, 84–87. [Google Scholar]
- Allied Market Research (AMR). Global Sparkling Wines Market, Opportunities and Forecast, 2021–2027. Available online: https://www.alliedmarketresearch.com/sparkling-wines-market-A08370 (accessed on 28 March 2022).
- Morton, A.L.; Rivers, C.; Healy, M. Beyond the bubbles: Identifying other purchase decision variables beyond country of origin effect that make Australians buy Champagne. In Proceedings of the ANZIBA Conference 2004: Dynamism and Challenges in Internationalisation, Canberra, Australia, 5–6 November 2004; pp. 1–20. [Google Scholar]
- Cerjak, M.; Tomić, M.; Fočić, N.; Brkić, R. The importance of intrinsic and extrinsic sparkling wine characteristics and behavior of sparkling wine consumers in Croatia. J. Int. Food Agribus. 2016, 28, 191–201. [Google Scholar] [CrossRef]
- Verdonk, N.; Wilkinson, J.; Culbert, J.; Ristic, R.; Pearce, K.; Wilkinson, K. Toward a model of sparkling wine purchasing preferences. Int. J. Wine Bus. Res. 2017, 29, 58–73. [Google Scholar] [CrossRef]
- Charters, S.; Velikova, N.; Ritchie, C.; Fountain, J.; Thach, L.; Dodd, T.H.; Fish, N.; Herbst, F.; Terblanche, N. Generation Y and sparkling wines: A cross-cultural perspective. Int. J. Wine Bus. Res. 2011, 23, 161–175. [Google Scholar] [CrossRef]
- Vecchio, R.; Lisanti, M.T.; Caracciolo, F.; Cembalo, L.; Gambuti, A.; Moio, L.; Siani, T.; Marotta, G.; Nazzaro, C.; Piombino, P. The role of production process and information on quality expectations and perceptions of sparkling wines. J. Sci. Food Agric. 2019, 99, 124–135. [Google Scholar] [CrossRef] [Green Version]
- Vintners Quality Alliance Ontario 2015 Annual Report. Available online: https://www.vqaontario.ca/Library/AnnualReports/vqa_annual_report_15.pdf (accessed on 1 August 2019).
- Vintners Quality Alliance (VQA). Our Mandate. Available online: https://www.vqaontario.ca/AboutVQA (accessed on 30 August 2020).
- Pickering, G.; Kemp, B. Focus the Fizz: Using Consumer Insights to Inform Branding, Labelling and Development of Ontario Sparkling Wine; Ontario Grape and Wine Research Inc.: St. Catharines, ON, Canada; p. 43. Available online: https://ontariograpeandwineresearch.com/file/download/hGCtL5whAd4irTcVwaHUvQ2020 (accessed on 25 April 2022).
- Qualtrics Version May 2020. Copyright © 2020 Qualtrics. Qualtrics and All Other Qualtrics Product or Service Names Are Registered Trademarks or Trademarks of Qualtrics, Provo, UT, USA. Available online: https://www.qualtrics.com (accessed on 25 April 2022).
- Quester, P.G.; Smart, J. The influence of consumption situation and product involvement over consumers’ use of product attribute. J. Consum. Mark. 1998, 3, 220–238. [Google Scholar] [CrossRef]
- Culbert, J.; Verdonk, N.; Ristic, R.; Olarte Mantilla, S.; Lane, M.; Pearce, K.; Cozzolino, D.; Wilkinson, K. Understanding consumer preferences for Australian sparkling wine vs. French Champagne. Beverages 2016, 2, 19. [Google Scholar] [CrossRef]
- VQA Ontario. Quick Reference Labelling Guide. Available online: https://www.vqaontario.ca/Library/Documents/VQAQuickReferenceLabellingGuide.pdf (accessed on 30 August 2020).
Figure 1.
Color coded examples of the control labels used in the study representing different information types. Yellow = endorsements, green = parentage, turquoise = attributes, pink = target end use, orange = target end user, red = manufacture, and blue = nonpareil. Image (a) is a Champagne-style, traditional method sparkling wine, whereas (b) is a Charmat method-produced sparkling wine. The colors were not presented to the participants.

Figure 2.
Label treatment × age interactions (n = 572) +/− SE for willingness to buy scores (7-point Likert scale) for the Prosecco-style label. Letters above bars represent significantly different groups (ANOVA followed by Tukey’s (HSD0.05)).
Figure 2.
Label treatment × age interactions (n = 572) +/− SE for willingness to buy scores (7-point Likert scale) for the Prosecco-style label. Letters above bars represent significantly different groups (ANOVA followed by Tukey’s (HSD0.05)).

Figure 3.
Willingness to buy scores (7-point Likert scale, n = 572) +/− SE for sparkling wine—interaction between label treatments and the amount typically spent per bottle of sparkling wine. Results for (a) Prosecco-style wine, F(14,524) = 2.60, p = 0.001, and (b) Champagne-style wine, F(14,524) = 1.82, p = 0.033. Letters above bars represent significantly different groups across all label treatments (Tukey’s (HSD0.05) following two-way ANOVA.

Figure 4.
Willingness to pay (CAD, n = 566) +/− SE for sparkling wine—interaction between label treatments and the amount typically spent per bottle of sparkling wine. Results for (a) Prosecco-style wine and (b) Champagne-style wine. Letters above bars represent significantly different groups across all label treatments (Tukey’s (HSD0.05) following two-way ANOVA.

Figure 5.
Willingness to pay (CAD, n = 572) +/− SE for sparkling wine—interaction between label treatments and subjective wine knowledge. Results for (a) Prosecco-style wine and (b) Champagne-style wine. Letters above bars represent significantly different groups across all label treatments (Tukey’s (HSD0.05) following two-way ANOVA.

Figure 6.
Perception of quality for Champagne-style wine (5-point Likert scale; n = 572) +/− SE—interaction between label treatments and price typically spend per bottle of sparkling wine. Letters above bars represent significantly different groups across all label treatments (Tukey’s (HSD0.05) following two-way ANOVA.

Table 1.
Label information elements rated by respondents for importance when purchasing sparkling wine.
Table 1.
Label information elements rated by respondents for importance when purchasing sparkling wine.
| Information Types | Informational Statements |
|---|---|
| Endorsements | Expert endorsements (e.g., awards, expert opinions) |
| Parentage | Wine region history |
| Winemaker history | |
| Brand name | |
| Wine company | |
| Attributes | Wine attributes (e.g., taste and flavour descriptors) |
| Target end use | How to use the wine (e.g., food pairings) |
| What occasion the wine is for | |
| Target end user | Who the wine would appeal to |
| Manufacture | How the wine is made (production process) |
| Nonpareil | A statement that the wine is unrivalled or unique |
| Additional information | Alcohol content |
| Grape variety/blend | |
| Vintage/year |
Table 2.
Characteristics of the sample (n = 576).
| Frequency | Proportion (%) | ||
|---|---|---|---|
| Gender | Male | 282 | 49 |
| Female | 294 | 51 | |
| Age | 18–25 | 31 | 5.4 |
| 26–35 | 106 | 18.4 | |
| 36–45 | 107 | 18.6 | |
| 46–55 | 116 | 20.1 | |
| 56+ | 216 | 37.5 | |
| Income (CAD) | Under 25 k | 34 | 5.9 |
| 25–45 k | 55 | 9.6 | |
| 46–65 k | 78 | 13.6 | |
| 66–85 k | 96 | 16.8 | |
| 86–100 k | 94 | 16.4 | |
| 101–140 k | 121 | 21.1 | |
| 141–200 k | 69 | 12 | |
| 200 k+ | 26 | 4.5 | |
| Subjective knowledge | Novice/beginner | 214 | 37.2 |
| Intermediate | 275 | 47.7 | |
| High | 76 | 13.2 | |
| Expert/very high | 11 | 1.9 | |
| Objective knowledge | Beginner | 209 | 36.3 |
| Intermediate | 281 | 48.8 | |
| High | 86 | 14.9 | |
| Wine involvement | Low | 76 | 13.2 |
| Medium | 334 | 58 | |
| High | 166 | 28.8 | |
| Sparkling wine involvement | Low | 174 | 30.2 |
| Medium | 303 | 52.6 | |
| High | 99 | 17.2 | |
| Yearly alcohol intake | Less than once a month | 30 | 5.2 |
| Once a month | 26 | 4.5 | |
| 2–4 times per month | 148 | 25.7 | |
| 2–4 times per week | 258 | 44.8 | |
| More than 4 times per week | 114 | 19.8 | |
| Yearly sparkling wine intake | Once a year | 97 | 16.8 |
| 2–4 times per year | 152 | 26.4 | |
| 5–10 times per year | 88 | 15.3 | |
| Once a month | 96 | 16.7 | |
| 2–3 times a month | 95 | 16.5 | |
| One or more times per week | 48 | 8.3 | |
| Preferred sparkling wine style | Fruity, sweeter, sparkling wine (e.g., Prosecco) | 351 | 60.9 |
| Creamy, bready, drier, sparkling wine (e.g., Champagne) | |||
| Unsure | 205 | 35.6 | |
| 20 | 3.5 | ||
| Money typically spent per bottle of sparkling wine (CAD) | 8–14.99 | 76 | 13.2 |
| 15–19.99 | 221 | 38.4 | |
| 20–24.99 | 149 | 25.9 | |
| 25–29.99 | 66 | 11.5 | |
| 30–39.99 | 37 | 6.4 | |
| 40–49.99 | 10 | 1.7 | |
| 50+ | 17 | 3 |
Table 3.
The mean importance ratings (5-point Likert scale) for each sparkling wine information element. Differences in ratings determined using Tukey’s Honestly Significant Difference (HSD0.05).
Table 3.
The mean importance ratings (5-point Likert scale) for each sparkling wine information element. Differences in ratings determined using Tukey’s Honestly Significant Difference (HSD0.05).
| Information Statement | Mean | SE | Information Type | Groups | |||||
|---|---|---|---|---|---|---|---|---|---|
| Wine’s attributes | 3.81 | 0.042 | Attributes | A | |||||
| Grape variety/blend | 3.46 | 0.044 | - | B | C | ||||
| Wine region history | 3.26 | 0.046 | Parentage | B | C | ||||
| Alcohol content | 3.26 | 0.044 | - | C | D | ||||
| Wine company | 3.22 | 0.044 | Parentage | C | D | ||||
| Occasion wine is for | 3.21 | 0.050 | Target end use | C | D | ||||
| How wine is made | 3.21 | 0.046 | Manufacture | C | D | ||||
| Vintage/year | 3.20 | 0.047 | - | C | D | ||||
| Brand name | 3.19 | 0.042 | Parentage | C | D | ||||
| How to use the wine | 3.15 | 0.046 | Target end user | C | D | ||||
| Who wine appeals to | 3.03 | 0.050 | Target end use | D | E | ||||
| Winemaker history | 3.02 | 0.045 | Parentage | D | E | ||||
| Expert endorsements | 2.90 | 0.047 | Endorsements | E | F | ||||
| Unique or unrivalled | 2.74 | 0.049 | Nonpareil | F | |||||
Publisher’s Note: MDPI stays neutral with regard to jurisdictional claims in published maps and institutional affiliations. |
© 2022 by the authors. Licensee MDPI, Basel, Switzerland. This article is an open access article distributed under the terms and conditions of the Creative Commons Attribution (CC BY) license (https://creativecommons.org/licenses/by/4.0/).
Share and Cite
MDPI and ACS Style
Pickering, G.J.; Duben, M.; Kemp, B. The Importance of Informational Components of Sparkling Wine Labels Varies with Key Consumer Characteristics. Beverages 2022, 8, 27. https://0-doi-org.brum.beds.ac.uk/10.3390/beverages8020027
AMA Style
Pickering GJ, Duben M, Kemp B. The Importance of Informational Components of Sparkling Wine Labels Varies with Key Consumer Characteristics. Beverages. 2022; 8(2):27. https://0-doi-org.brum.beds.ac.uk/10.3390/beverages8020027
Chicago/Turabian StylePickering, Gary J., Marcus Duben, and Belinda Kemp. 2022. "The Importance of Informational Components of Sparkling Wine Labels Varies with Key Consumer Characteristics" Beverages 8, no. 2: 27. https://0-doi-org.brum.beds.ac.uk/10.3390/beverages8020027
Note that from the first issue of 2016, this journal uses article numbers instead of page numbers. See further details here.