3.1. Agonist-Optimization of the Human AHR PAS-B Model: Comparison between Models, Docking Results, and Experimental Validation of VLS Hits
With the goal of identifying novel agonists of the human AHR, we sought to create a homology model of the ligand-binding domain that could complement HTS methods by efficiently and accurately screening large and chemically diverse libraries. As described in the
Experimental section, we generated a homology model for the human AHR PAS-B domain based on an experimentally-determined structure of HIF-2α [
15], docked the strong agonist TCDD into the binding pocket, and subsequently optimized the protein side chains near the ligand to search for an energetically-favorable complex. The resulting model, which we will refer to as the “agonist-optimized” model throughout the text, deviates from the template HIF-2α structure by 0.53 Å root-mean-square-deviation (rmsd) over 109 Cα atoms and the main differences in chain path occur at αE and the βH-βI loop (
Figure 2a). As in our previous homology model of the
apo AHR PAS-B [
6], our agonist-optimized model contains the standard secondary structural elements of PAS-B domains: four α-helices and five β-strands denoted (in order from
N-terminus to
C-terminus) βA, βB, αC, αD, αE, αF, βG, βH, and βI (
Figure 2a) [
6]. The agonist-optimized homology model revealed an increase of 105 Å
3 in the binding pocket volume compared to the
apo model (
Figure 2b) [
6]. This difference is principally due to the movement of the Gln383 and Leu353 side chains, which in the agonist-optimized model expanded the cavity toward αC and αD (
Figure 2b). Importantly, this made the pocket more accessible for the docking of larger ligands during VLS, and with this agonist-optimized model we were able to obtain docking scores [
22] for a benchmarking of known AHR agonists (
Table 1).
Not surprisingly, the compound from the benchmarking analysis with the best docking score was TCDD (−24), for which the model was optimized to interact with, establishing a hydrogen bond with the side chain of Ser365 (
Figure 2c,
Table 1). The side chain of His291 on the opposite side of the pocket was also available to hydrogen bond to TCDD depending on the tautomerization state (
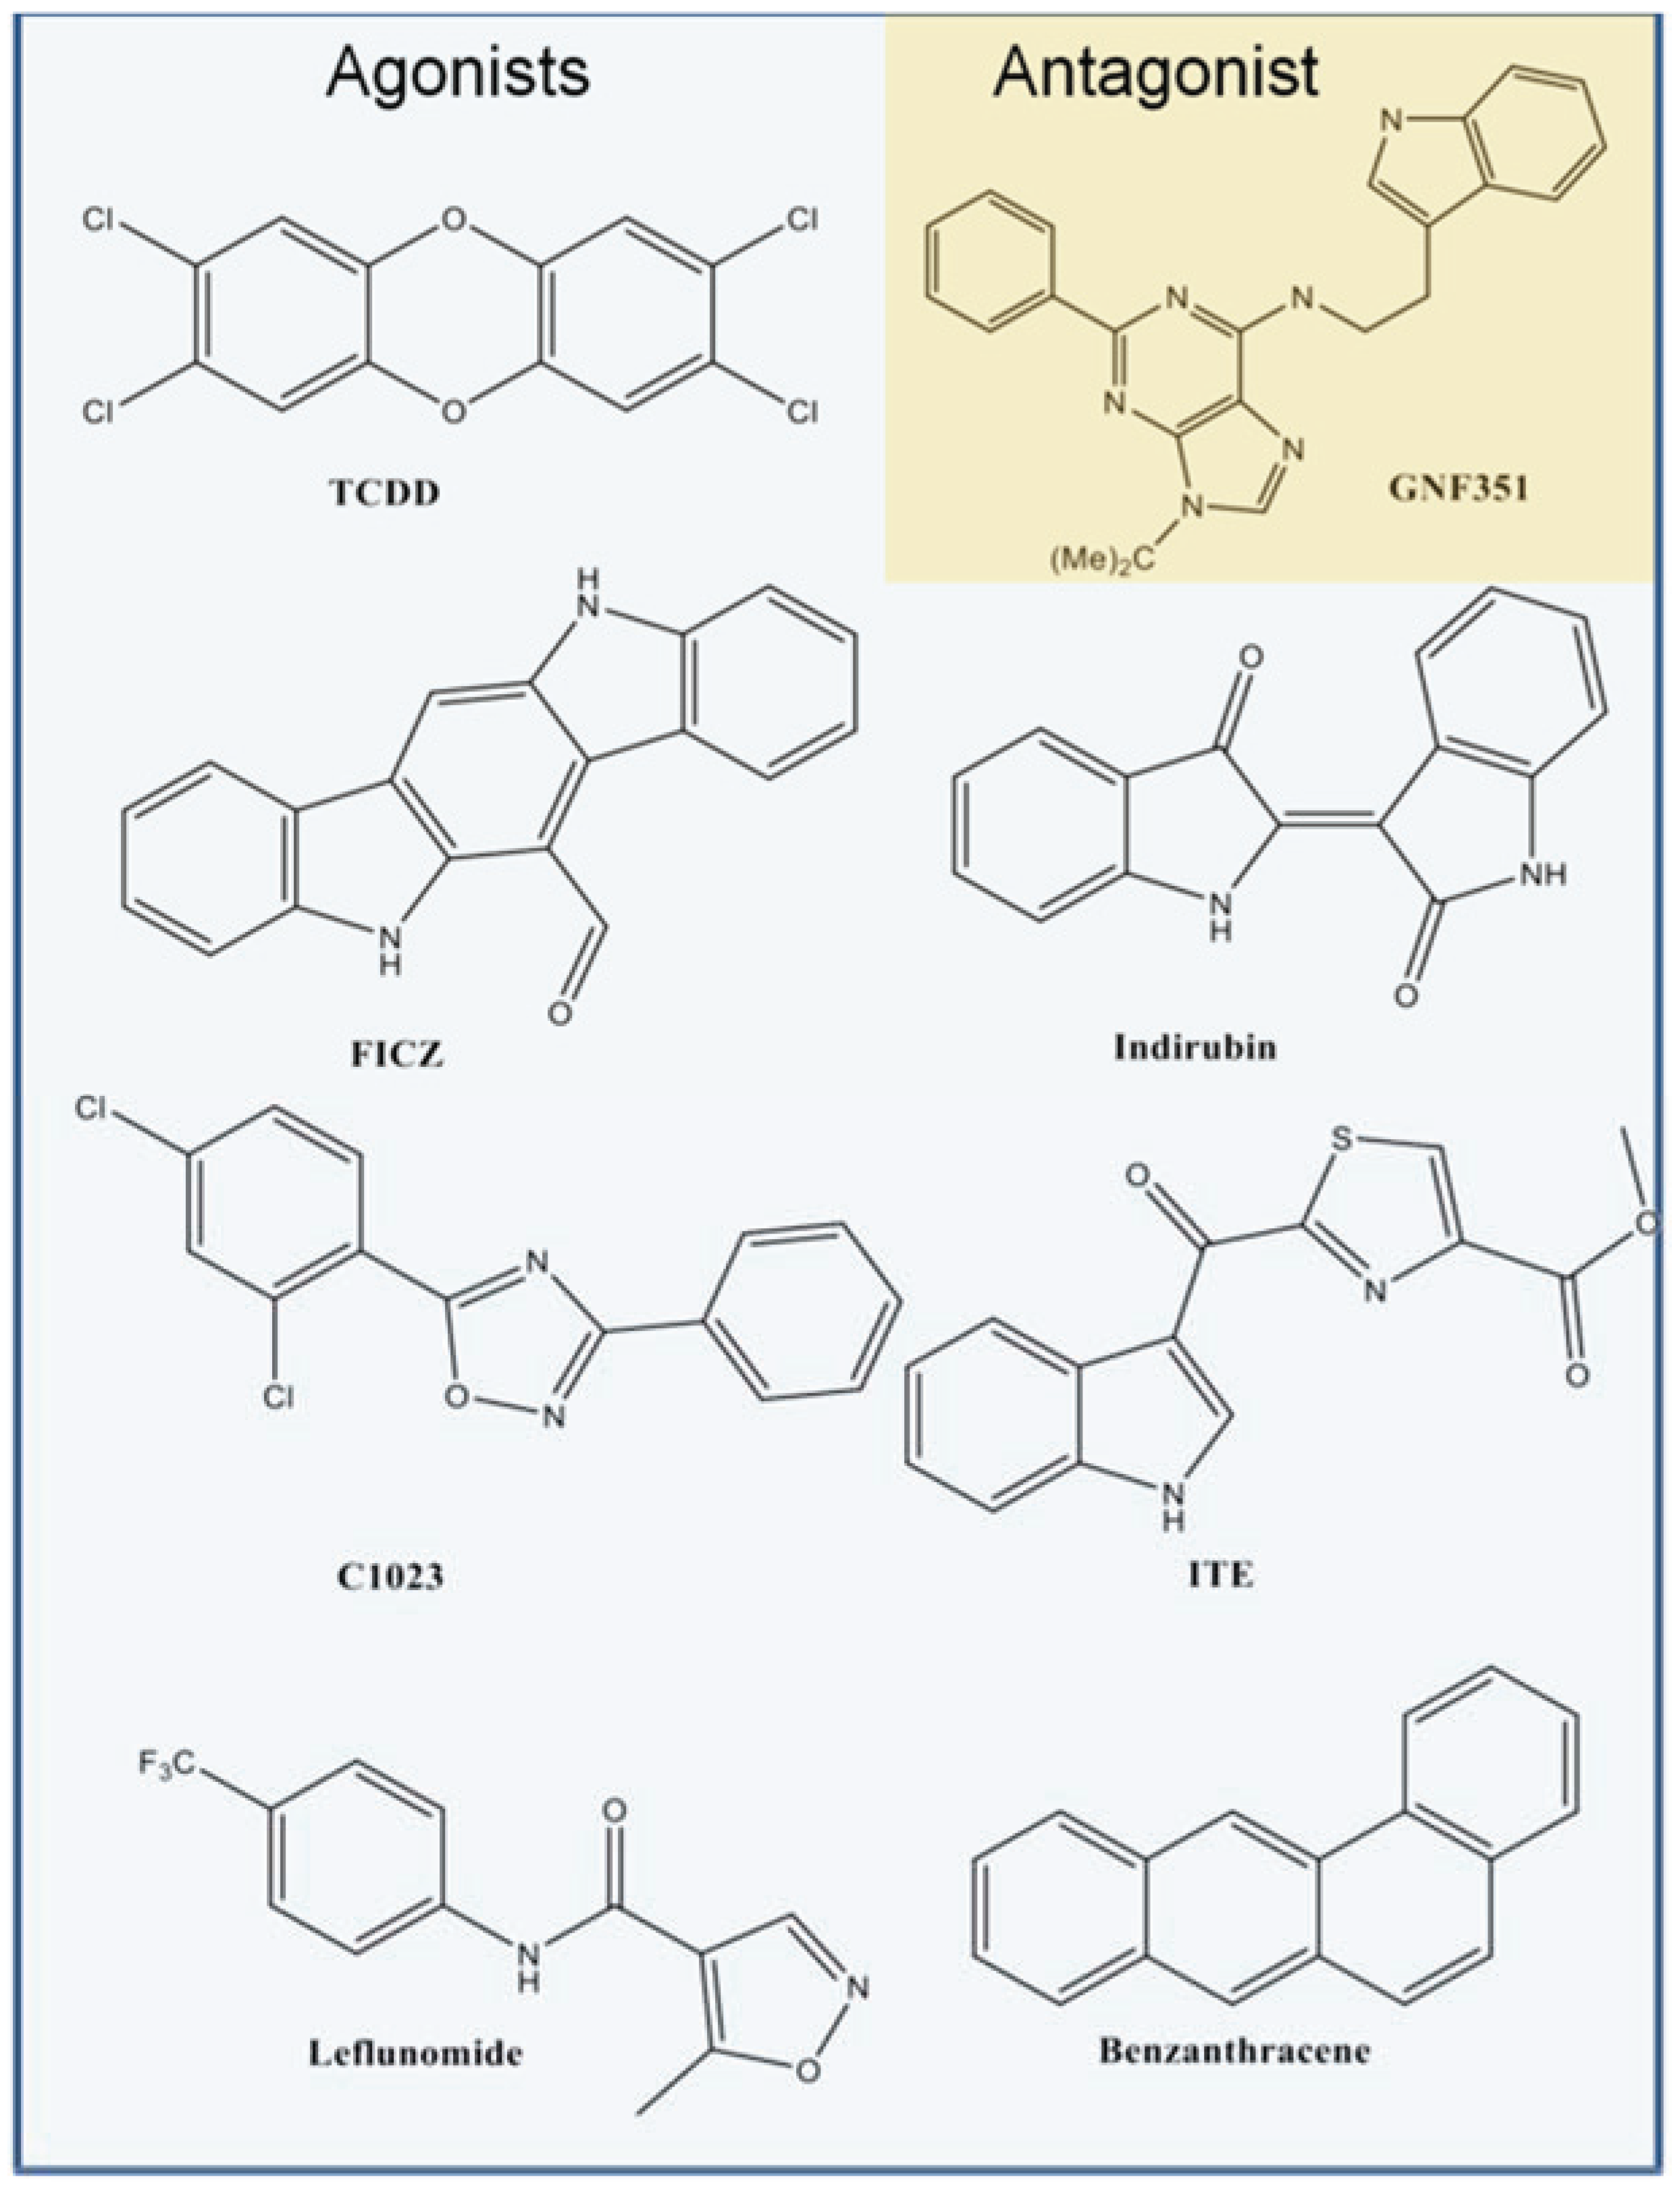
Figure 2c). From our benchmarking analysis we discovered that about half of the other known agonists we docked—including 6-formylindolo[3,2-b]carbazole (FICZ), indirubin, Cl1023, 2-(1ꞌH-indole-3'-carbonyl)-thiazole-4-carboxylic acid methyl ester (ITE), and leflunomide—exhibited TCDD-like binding interactions, forming a hydrogen bond with either His291, Ser365, or both (
Figure 3). This commonality suggested to us that interactions with both His291 and Ser365 could be key to agonist affinity, and indeed mutagenesis studies on the murine AHR have demonstrated that mutation of the homologous residues Ser359 and His285 decreases TCDD binding by ca. 50% and ca. 100%, respectively [
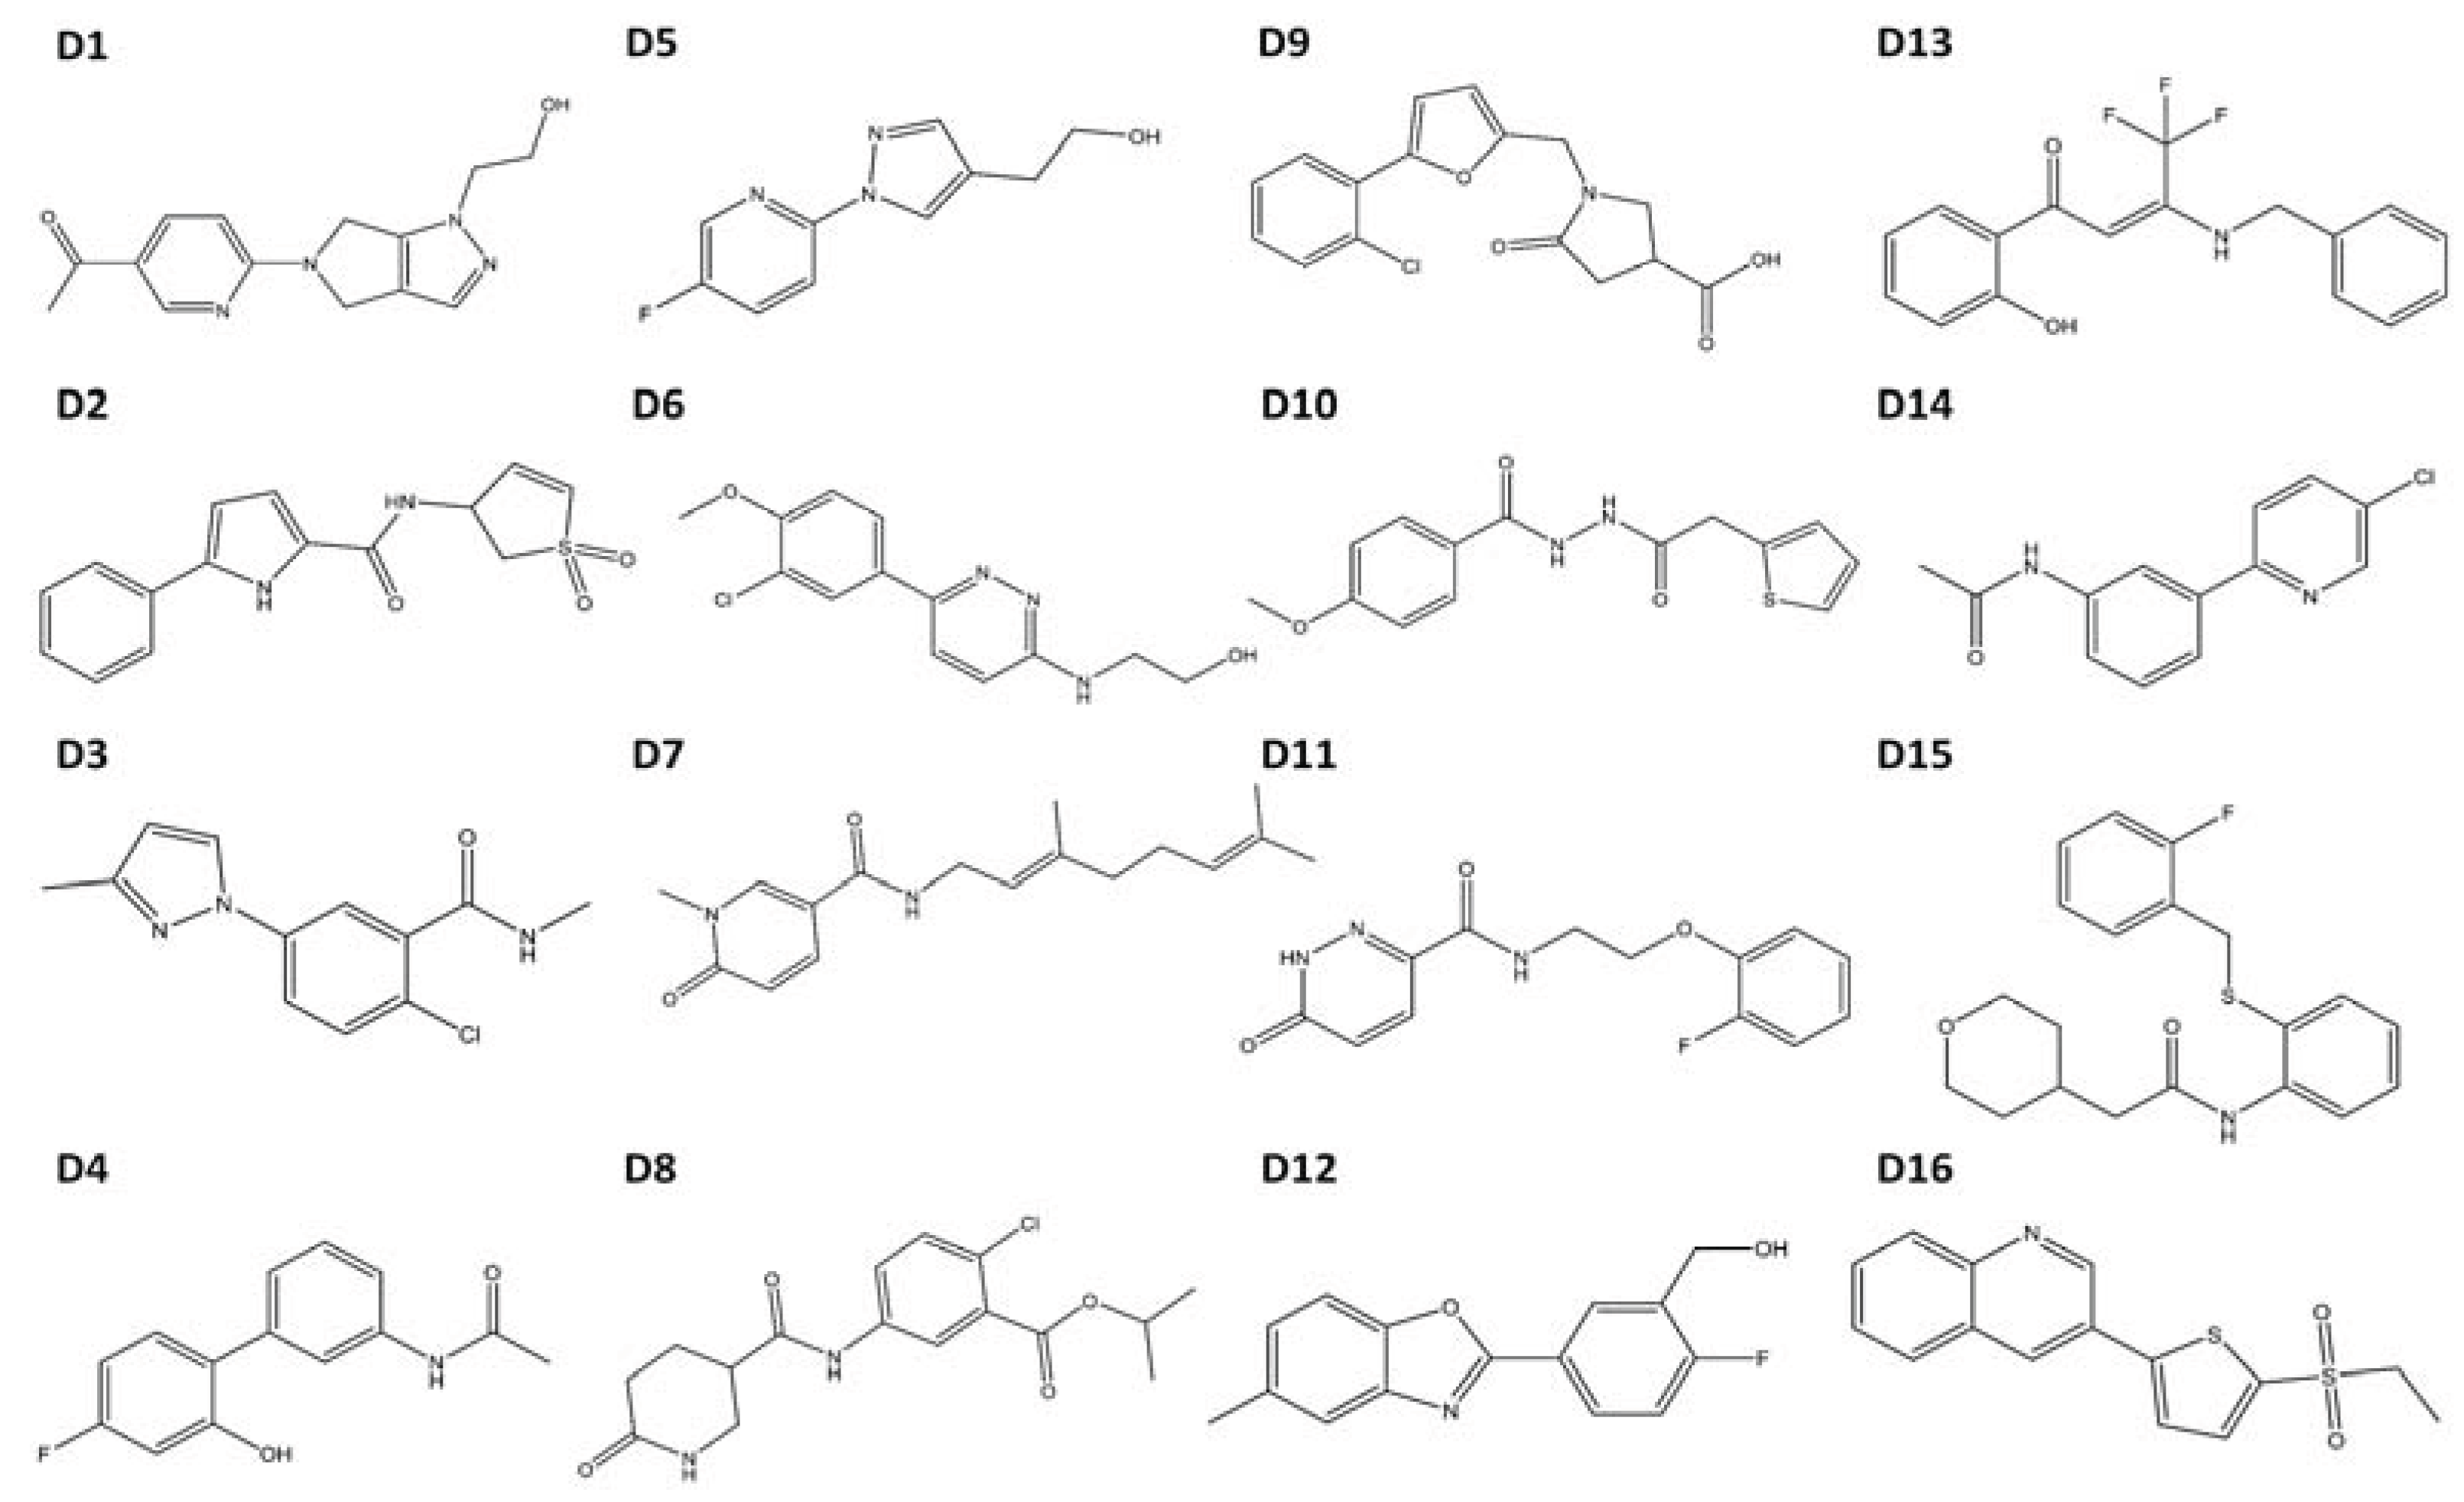
14]. Therefore our initial search for AHR agonists was based solely on docking results from VLS with a chemically diverse database of ca. 50,000 drug-like compounds, and we then attempted to enrich our selections by choosing high-scoring molecules which established a hydrogen bond to either His291 or Ser365 (
Table 2). We subsequently ordered these compounds (
D1–
D16) and tested them experimentally to determine if they were in fact AHR agonists (
Figure 4).
Figure 2.
Agonist-optimized model of human AHR PAS-B. (A) Comparison of the agonist-optimized model (grey) with its template structure hypoxia inducible factor 2α (HIF-2α) Per/ARNT/Sim (PAS)-B (purple, PDB code 1p97). Standard PAS-B secondary structures are labeled. The helix αE is distinguished with an (*) because it adopts nearly helical geometry in the agonist-optimized model. The highest energy strain in the agonist-optimized model occurs at residues Phe324 (αE), Leu370 (βH), and Ile380 (βI). (B) The AHR PAS-B homology models pre-optimization and post-optimization are shown. The binding pocket is displayed in blue, with the pocket calculated as the solvent-accessible surface area using a spherical probe with a radius of 1.4 Å. Residues Leu353 and Gln383 are displayed as spheres and colored with oxygens red, nitrogens blue, and carbons brown or grey. (C) The docking orientation of 2,3,7,8-tetrachlorodibenzo-p-dioxin (TCDD) in the agonist-optimized model is shown, which forms hydrogen bonds to Ser365 and His291.
![Biology 03 00645 g002]()
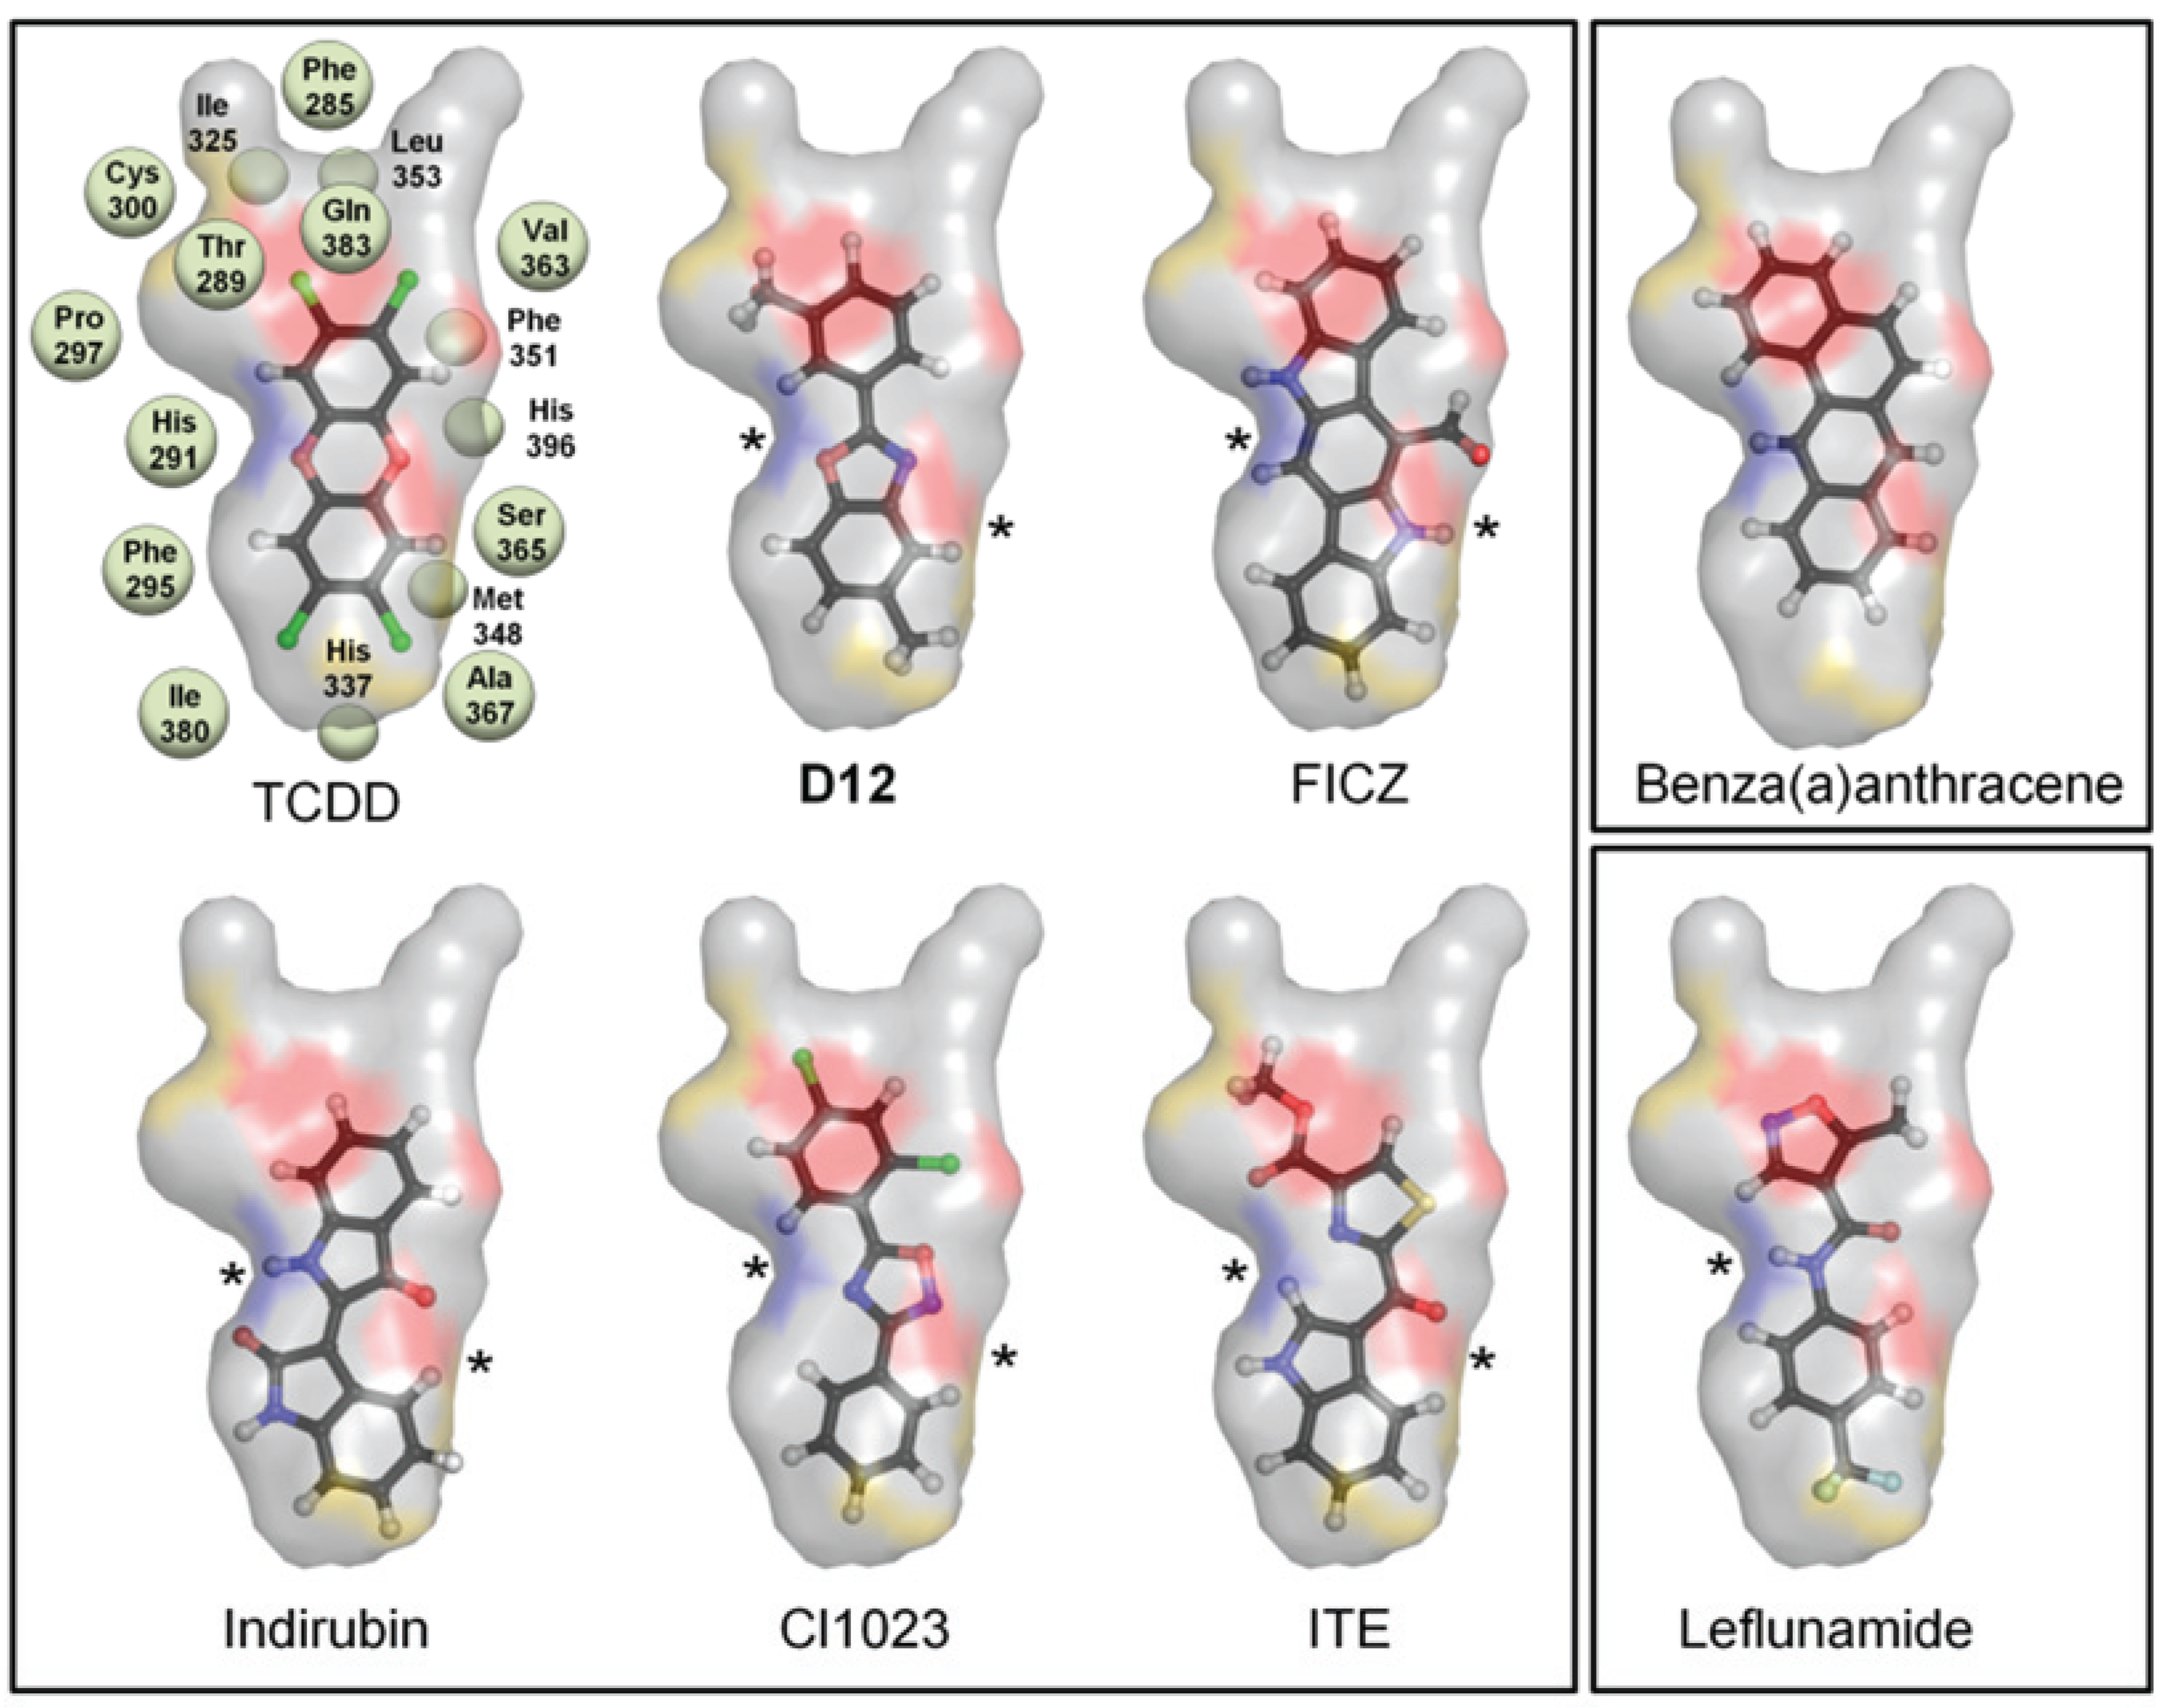
Figure 3.
Binding pattern of AHR agonists. The top-scoring poses of selected AHR agonists docked into the agonist-optimized model are shown, with the pocket surface area contributed by the protein shown as transparent surface and calculated as in
Figure 2. Atoms are colored by type (hydrogen-white, carbon-grey, oxygen-red, nitrogen-blue, sulfur-yellow, halogen-green). The residues constituting the pocket are indicated as grey spheres for TCDD. Some compounds shown docked in a TCDD-like manner, with the ability to form hydrogen bonds to both His291 and Ser365 (left panel, hydrogen bonds denoted with *). Leflunomide (bottom right panel) docked in a similar position but is only able to form a hydrogen bond with His291. Benza(a)anthracene (upper right panel) is apolar and so cannot form hydrogen bonds to these residues. We note that although Thr289 and Gln383 also contribute a polar region to the binding pocket, only 2-(1'H-indole-3'-carbonyl)-thiazole-4-carboxylic acid methyl ester (ITE) and Leflunomide docked with polar groups that could possibly form hydrogen bond interactions to these residues.
![Biology 03 00645 g003]()
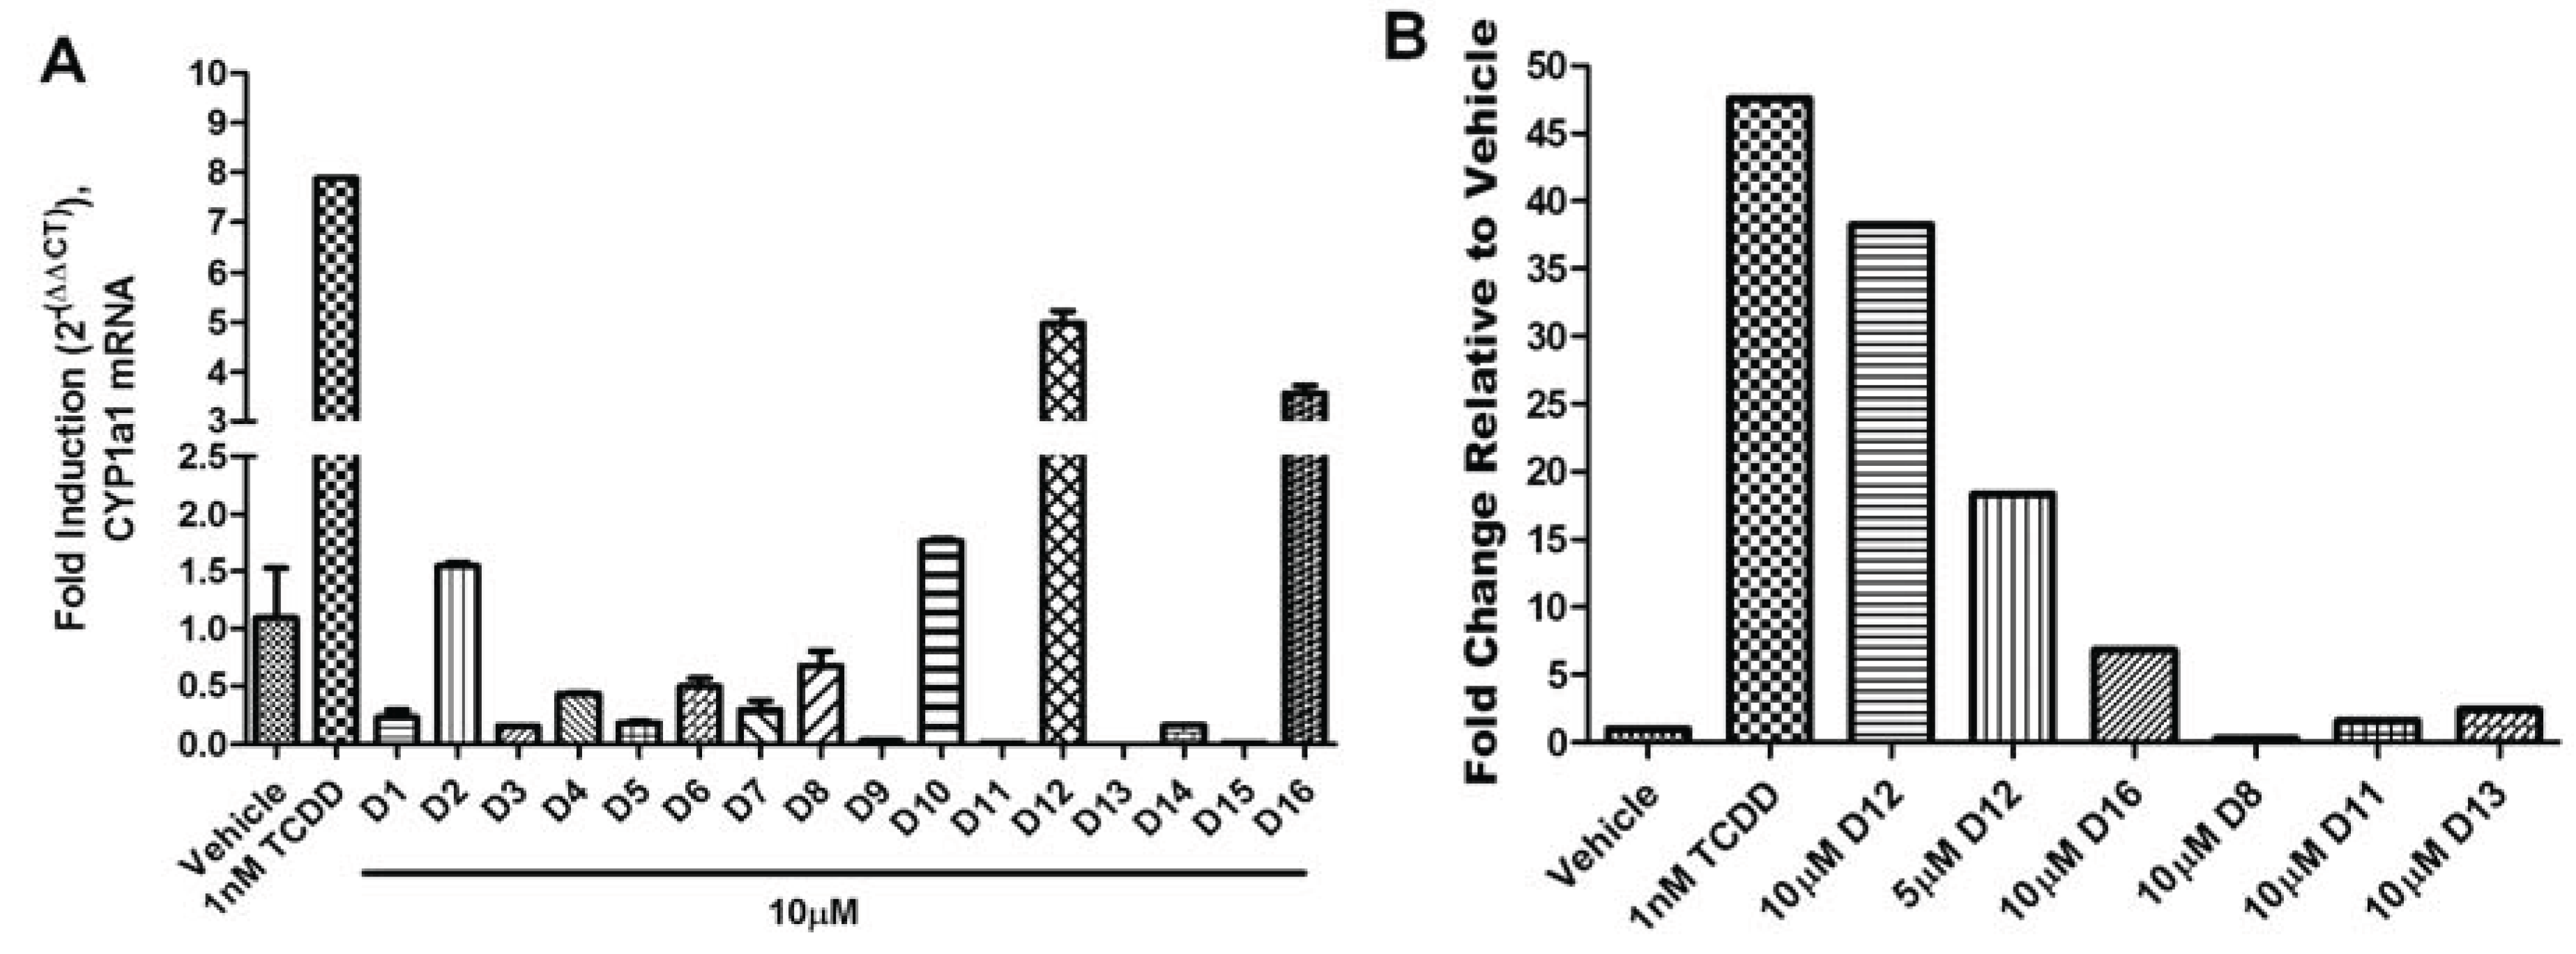
The agonist response has two components: the translocation of AHR from the cytosol to the nucleus and induction of AHR target genes. To validate the hits identified from VLS, we first measured each compound’s ability to induce two different AHR target genes in human hepatoma cells (
Figure 5). Out of the sixteen compounds screened,
D12 and
D16 were found to activate the endogenous AHR target gene
CYP1A1 (
Figure 5a) and AHR-dependent reporter gene (
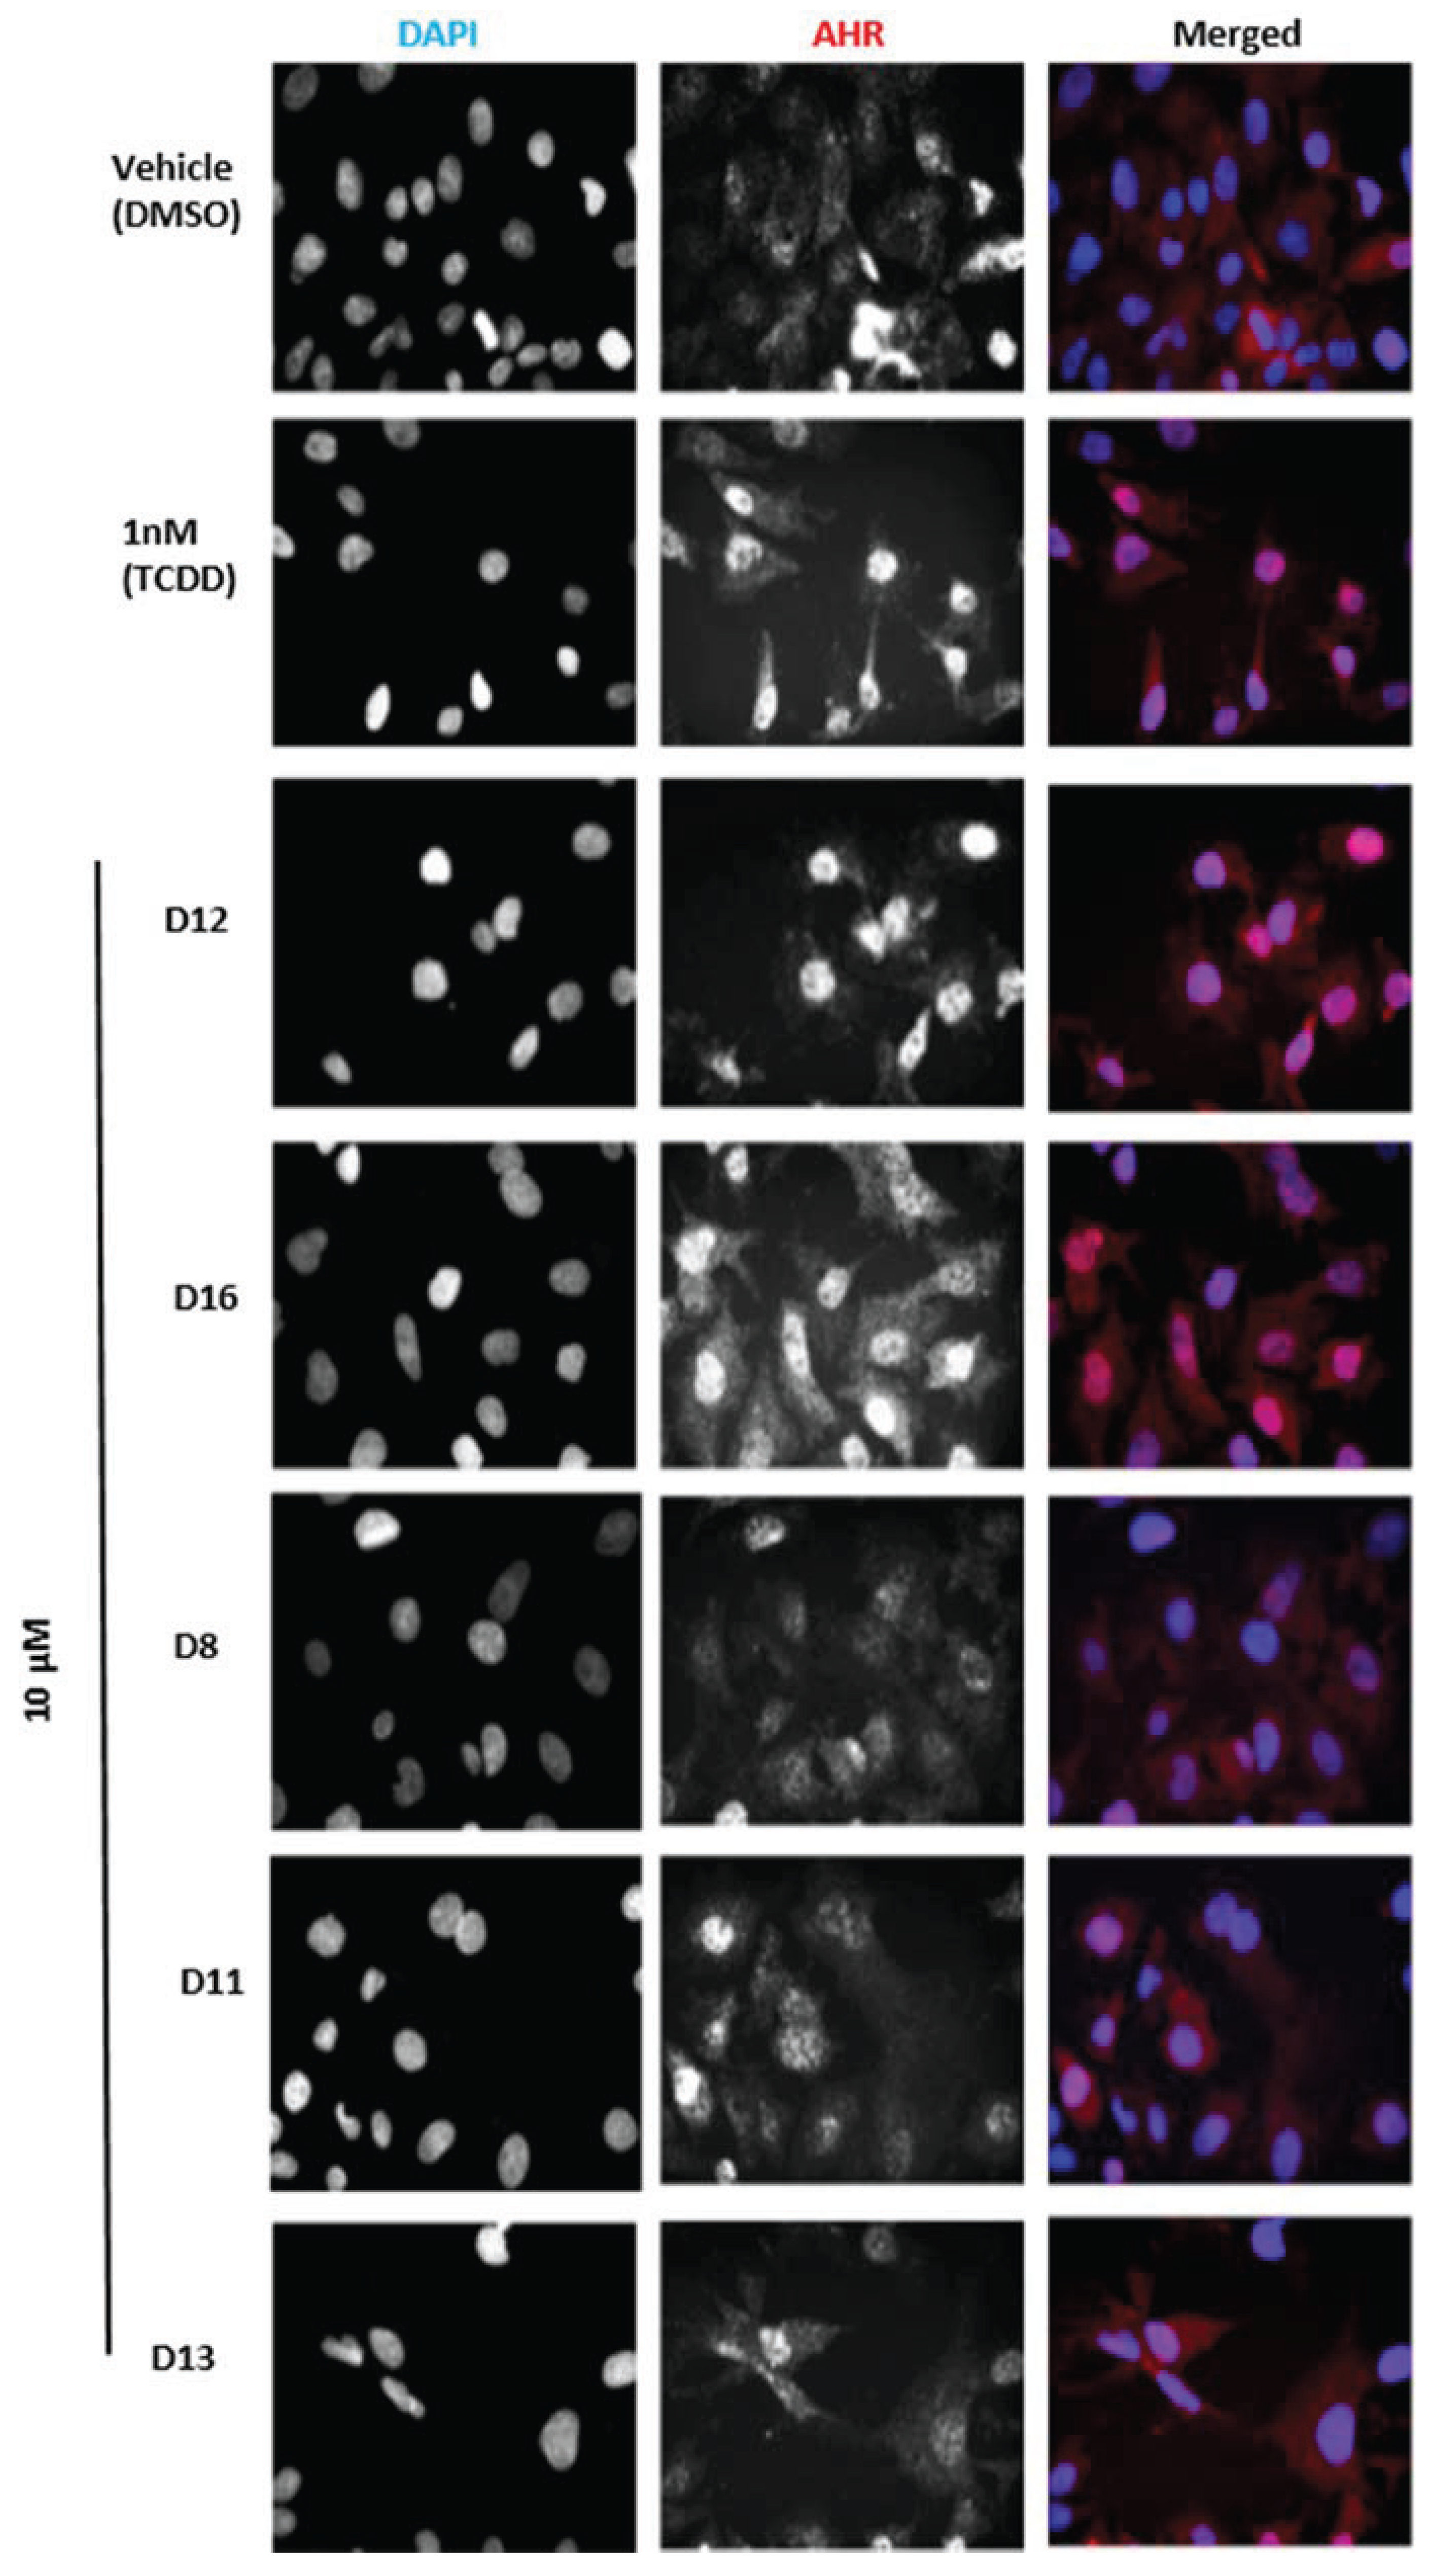
Figure 5b). To determine if this induction was indeed due to the translocation of AHR to the nucleus, we treated human hepatoma cells with Compounds
D1–
D16 and analyzed AHR localization through immunostaining. We found that the two hits
D12 and
D16 significantly promoted nuclear translocation of endogenous AHR from the cytosol (
Figure 6). Thus, both Compounds
D12 and
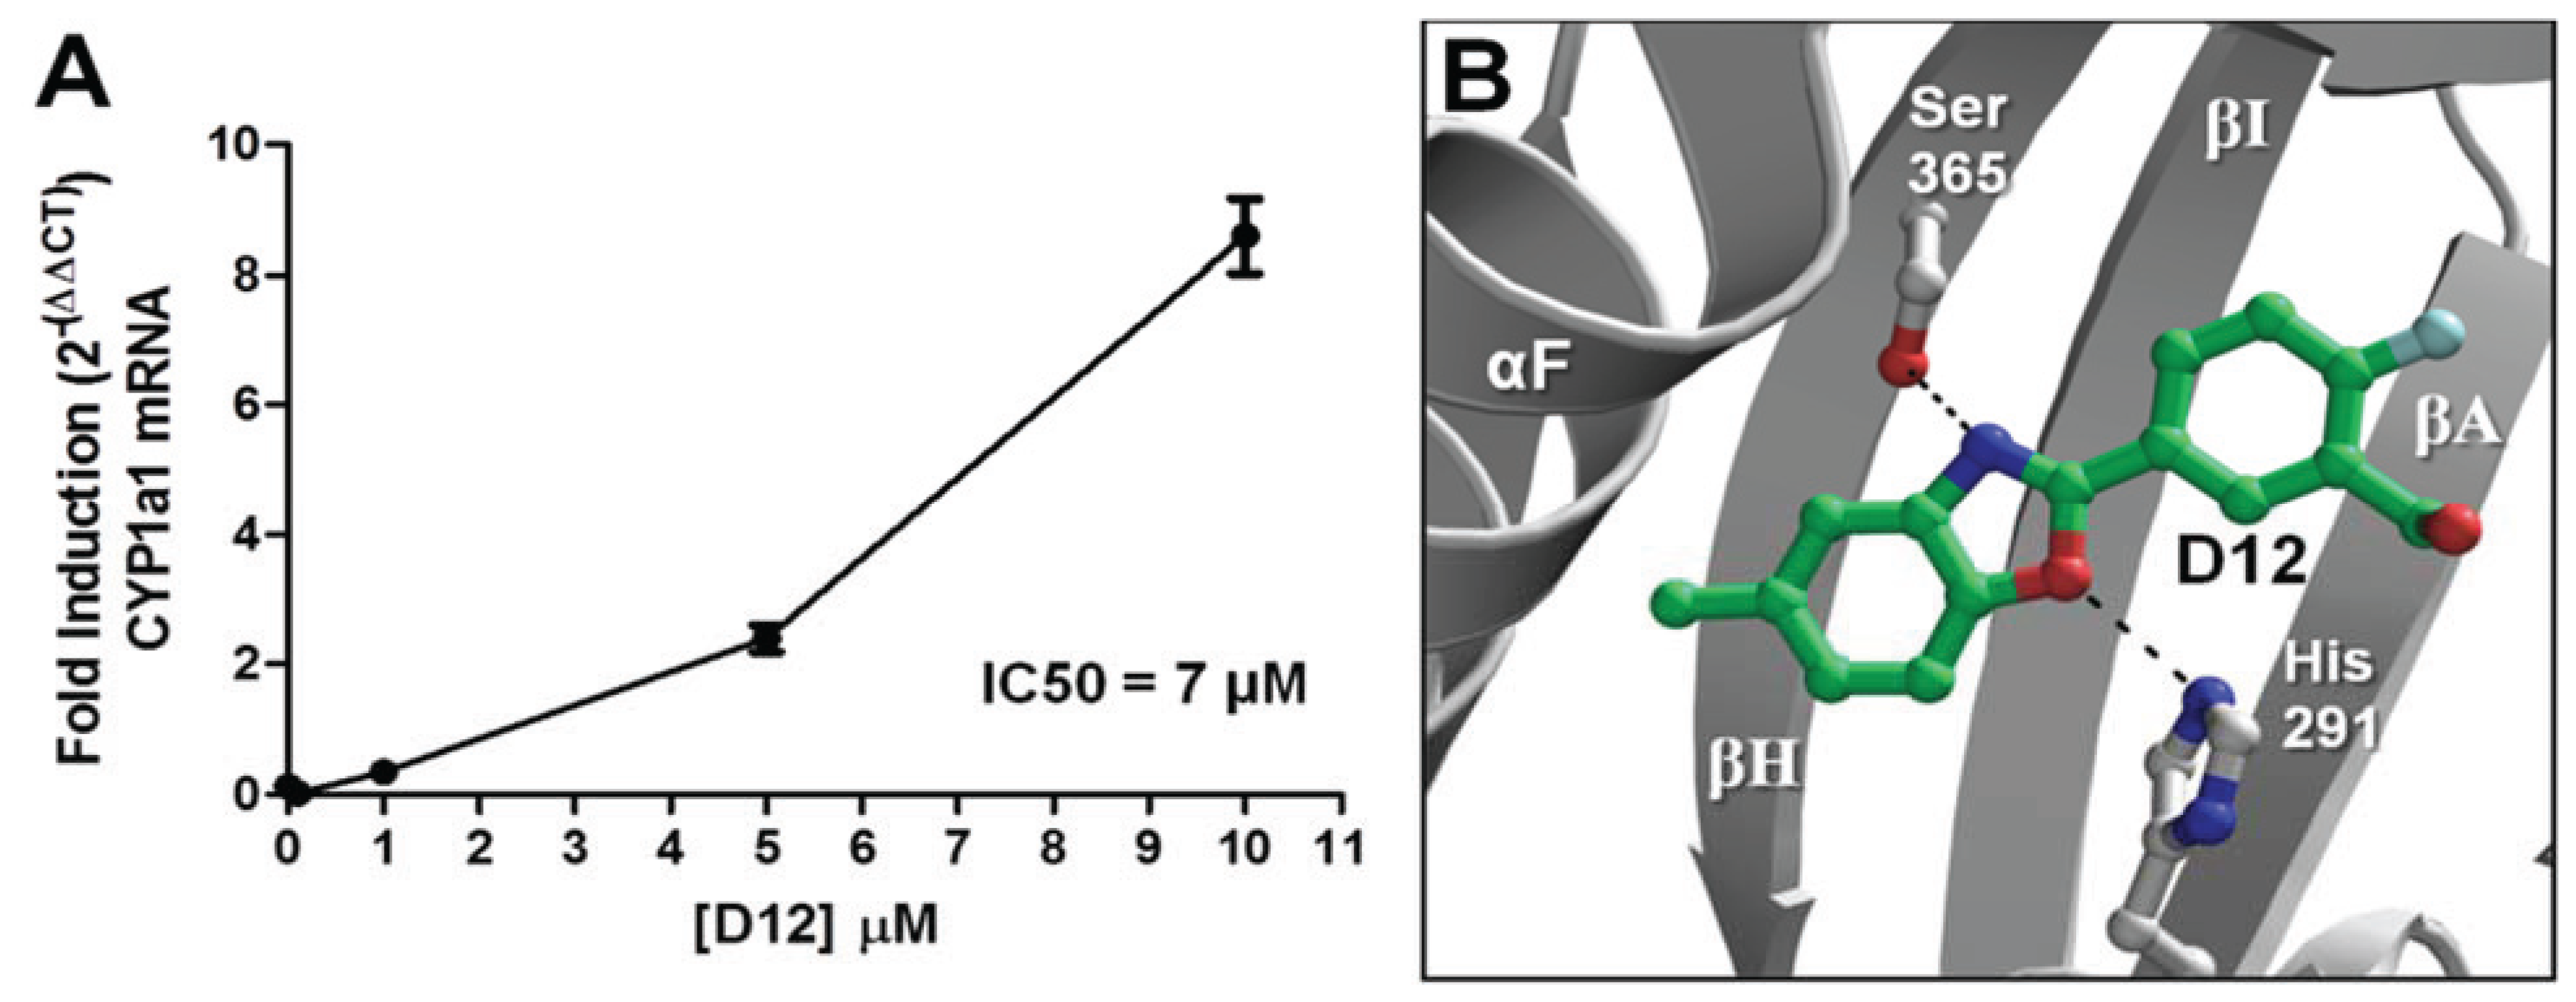
D16 elicited the characteristic agonist response, and were confirmed to be AHR agonists. The stronger of the two agonists was [2-fluoro-5-(5-methyl-1,3-benzoxazol-2-yl)phenyl]methanol (
D12), and was found to activate
CYP1A1 in a dose- dependent manner with an IC
50 of 7 μM (
Figure 7a). In our VLS, this compound docked into the AHR PAS-B binding pocket with a score of −26.02 and has two hydrogen bond accepting groups interacting with both His291 and Ser365, similarly to TCDD (
Figure 7b,
Table 1).
Figure 4.
Structures of compounds selected for experimental testing. Compounds D1–D16 scored highly during VLS and also displayed a TCDD-like binding pattern.
Figure 4.
Structures of compounds selected for experimental testing. Compounds D1–D16 scored highly during VLS and also displayed a TCDD-like binding pattern.
Figure 5.
AHR target gene induction of Compounds D1–D16. (A) Quantitative RT-PCR for AHR target gene CYP1A1 (Cytochrome p450 1A1) in HepG2 cells following exposure to vehicle (DMSO), TCDD (1 nM), and D1–D16 (10 µM) for 12 h. Glyceraldehyde 3-phosphate dehydrogenase (GAPDH) expression was used as a control for normalization of CYP1A1 expression. Experiments were run in triplicate. (B) Human HepG2 cells transfected with the AHR response element (AHRE)/xenobiotic response element (XRE)-luciferase reporter were treated with vehicle (DMSO), TCDD (1 nM), D12 (5 and 10 µM), and D16 (10 µM) for 24 h and assayed for reporter gene activity. For comparison representative compounds D8, D11, and D13 are shown, which were found to be inactive.
Figure 6.
Subcellular localization of AHR in HepG2 cells. Cells were treated with the indicated compounds at 10 µM for 120 min, fixed, and then immunostained with AHR followed by cyanine3 (Cy3)-conjugated secondary antibody. Cells were stained by 4,6-diamino-2-phenylindole (DAPI) to visualize nuclei and were imaged by ImageXpressMICRO wide-field high content imaging system. Experiments were run in triplicate.
Figure 7.
Agonist activity of Compound
D12. (
A) For dose-dependency of
D12, quantitative reverse transcription-polymerase chain reaction (RT-PCR) for AHR target gene
CYP1A1 (Cytochrome p450 1A1) is shown at various [
D12] following exposure for 12 h. GAPDH expression was used a control. Experiments were run in triplicate. (
B) The docking orientation of
D12 into the agonist-optimized homology model is shown with the ligand displayed as sticks and colored by atom type as in
Figure 2 but with the ligand carbons colored dark green and halogen colored cyan.
3.2. Molecular Dynamics Simulations
Using our agonist-optimized model as a template for the starting coordinates, we conducted in-solution molecular dynamics simulations with AMBER12 [
31] to study the differences between the agonist-bound and antagonist-bound forms of AHR PAS-B. We simulated three different versions of our agonist-optimized model:
apo (no ligand in the binding pocket), agonist (TCDD)-bound, and antagonist (GNF351)-bound, and the simulations came to equilibration by 50–60 ns. In our analysis we focus on the conformations observed at the end stages of simulation, and to distinguish these equilibrated molecular dynamics models from the homology models discussed in the text, we will refer to them as
apoMD, agonist
MD, and antagonist
MD.
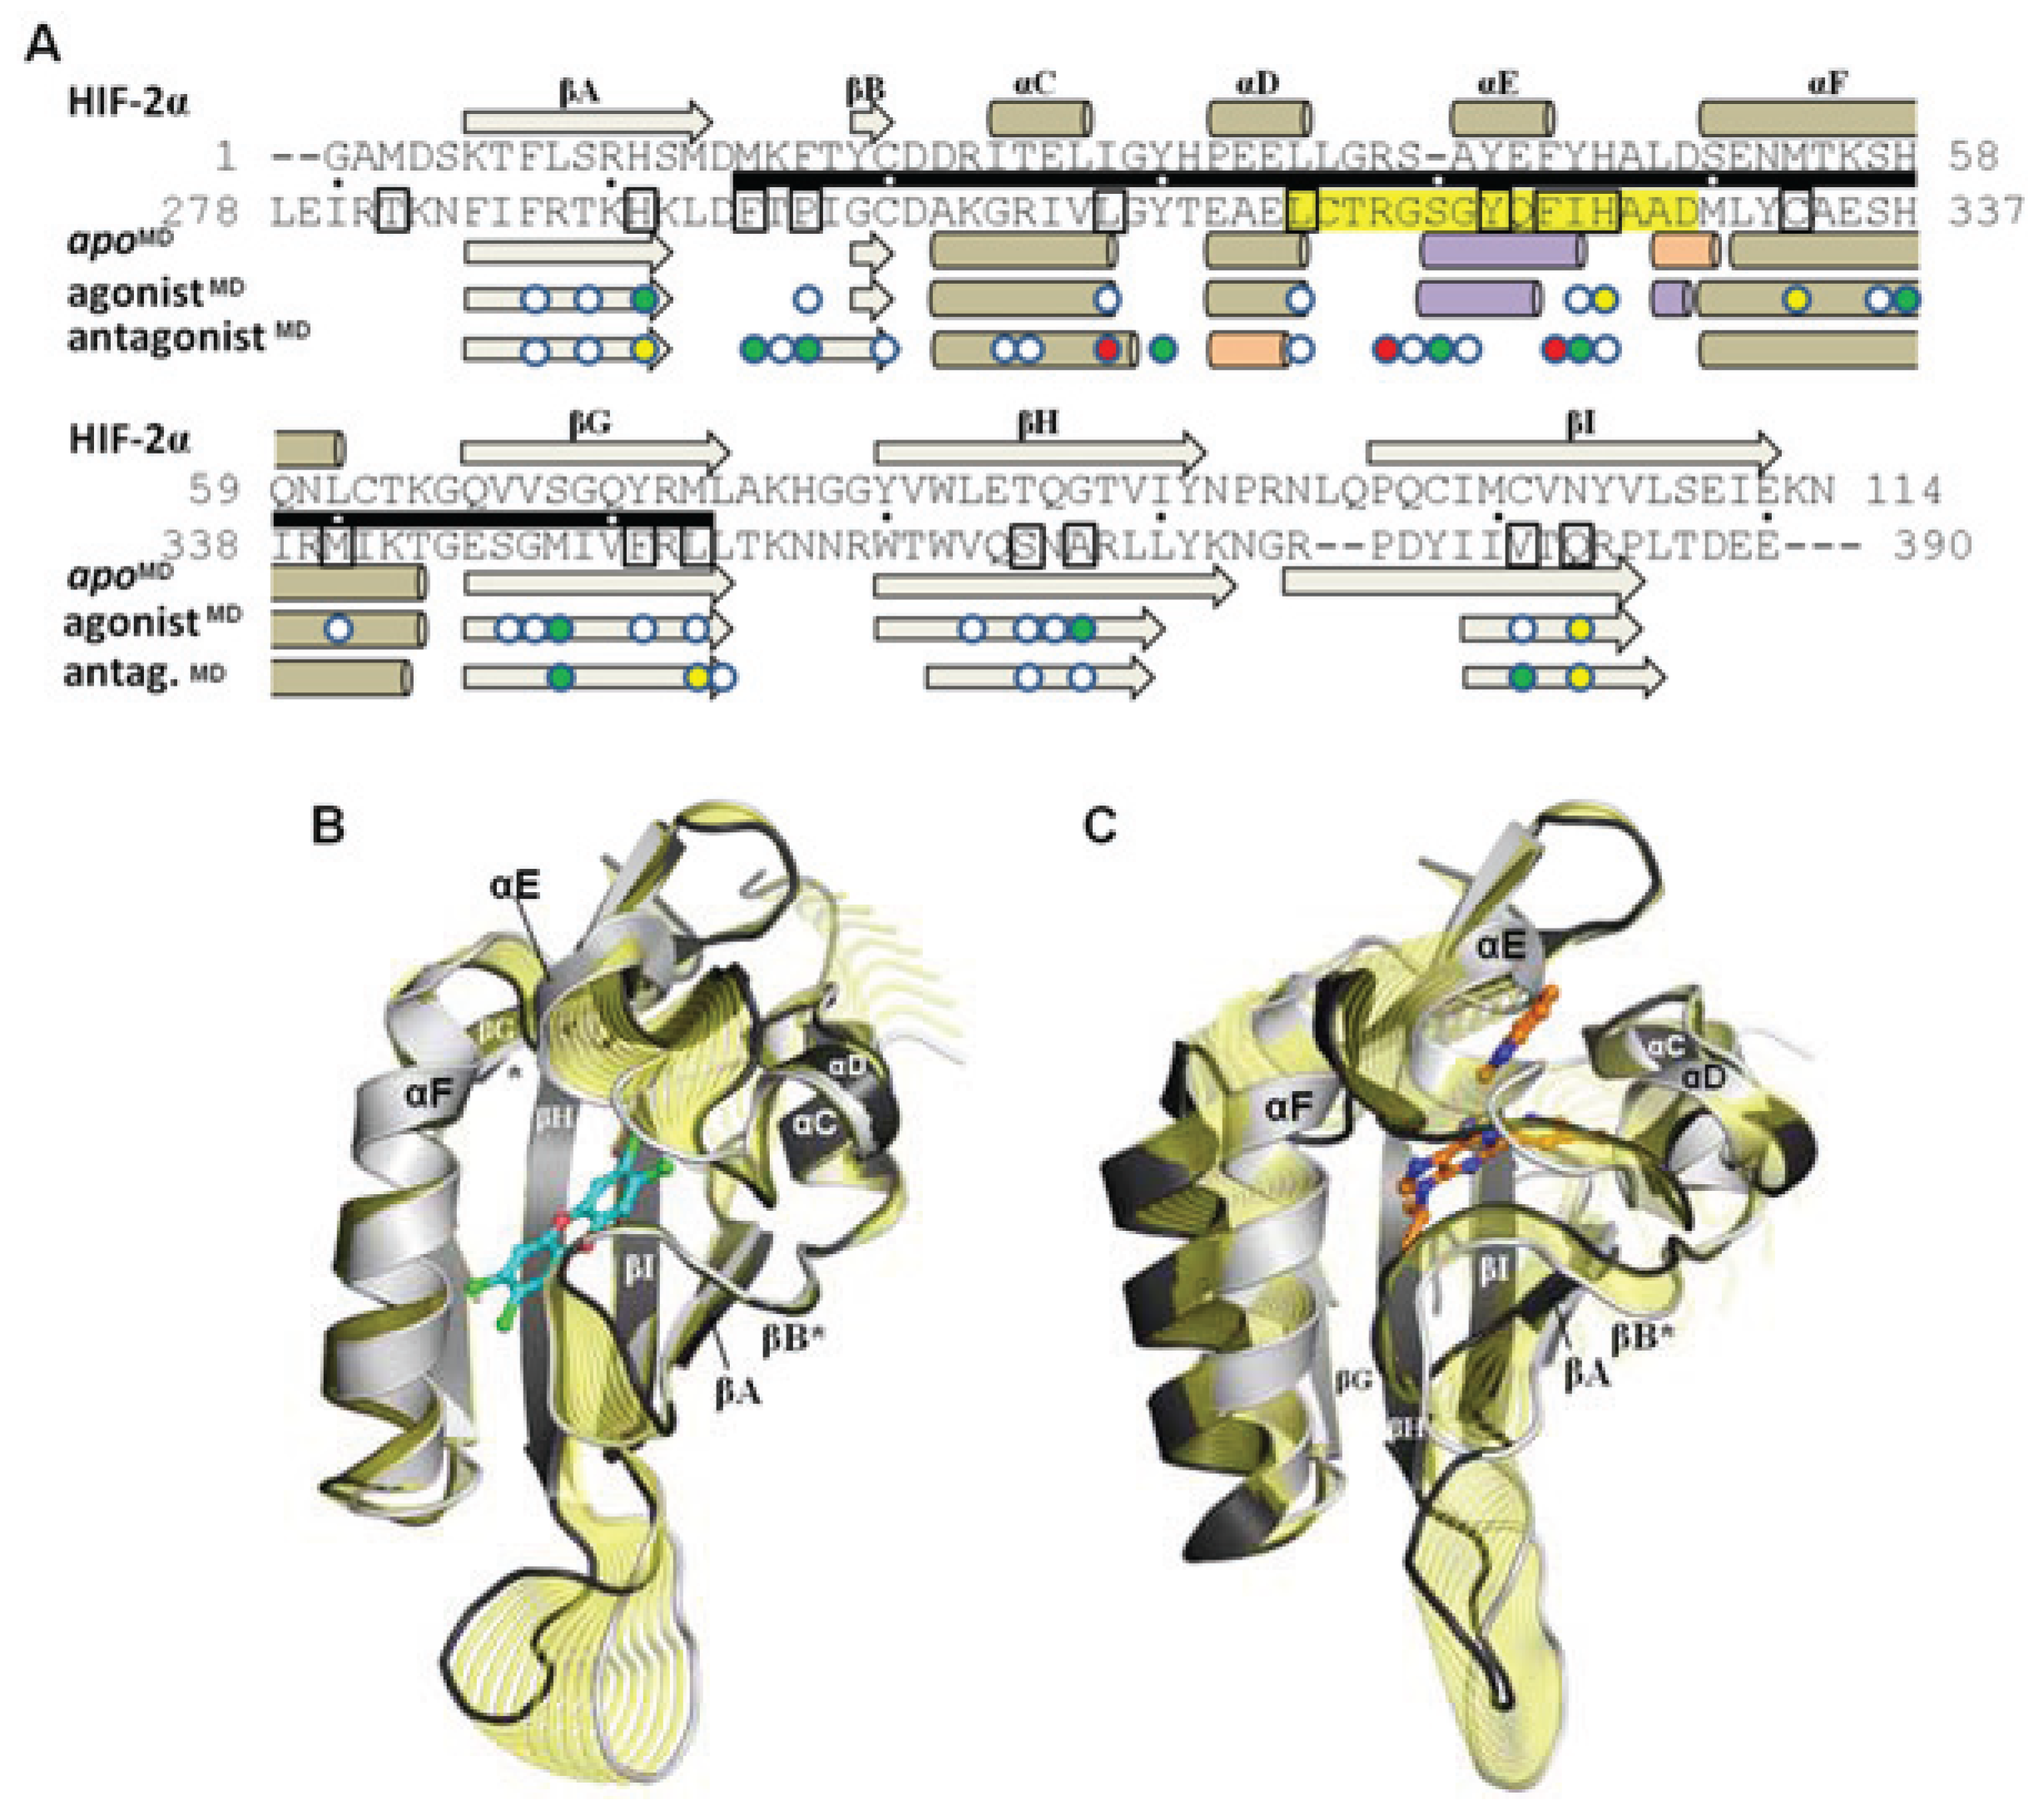
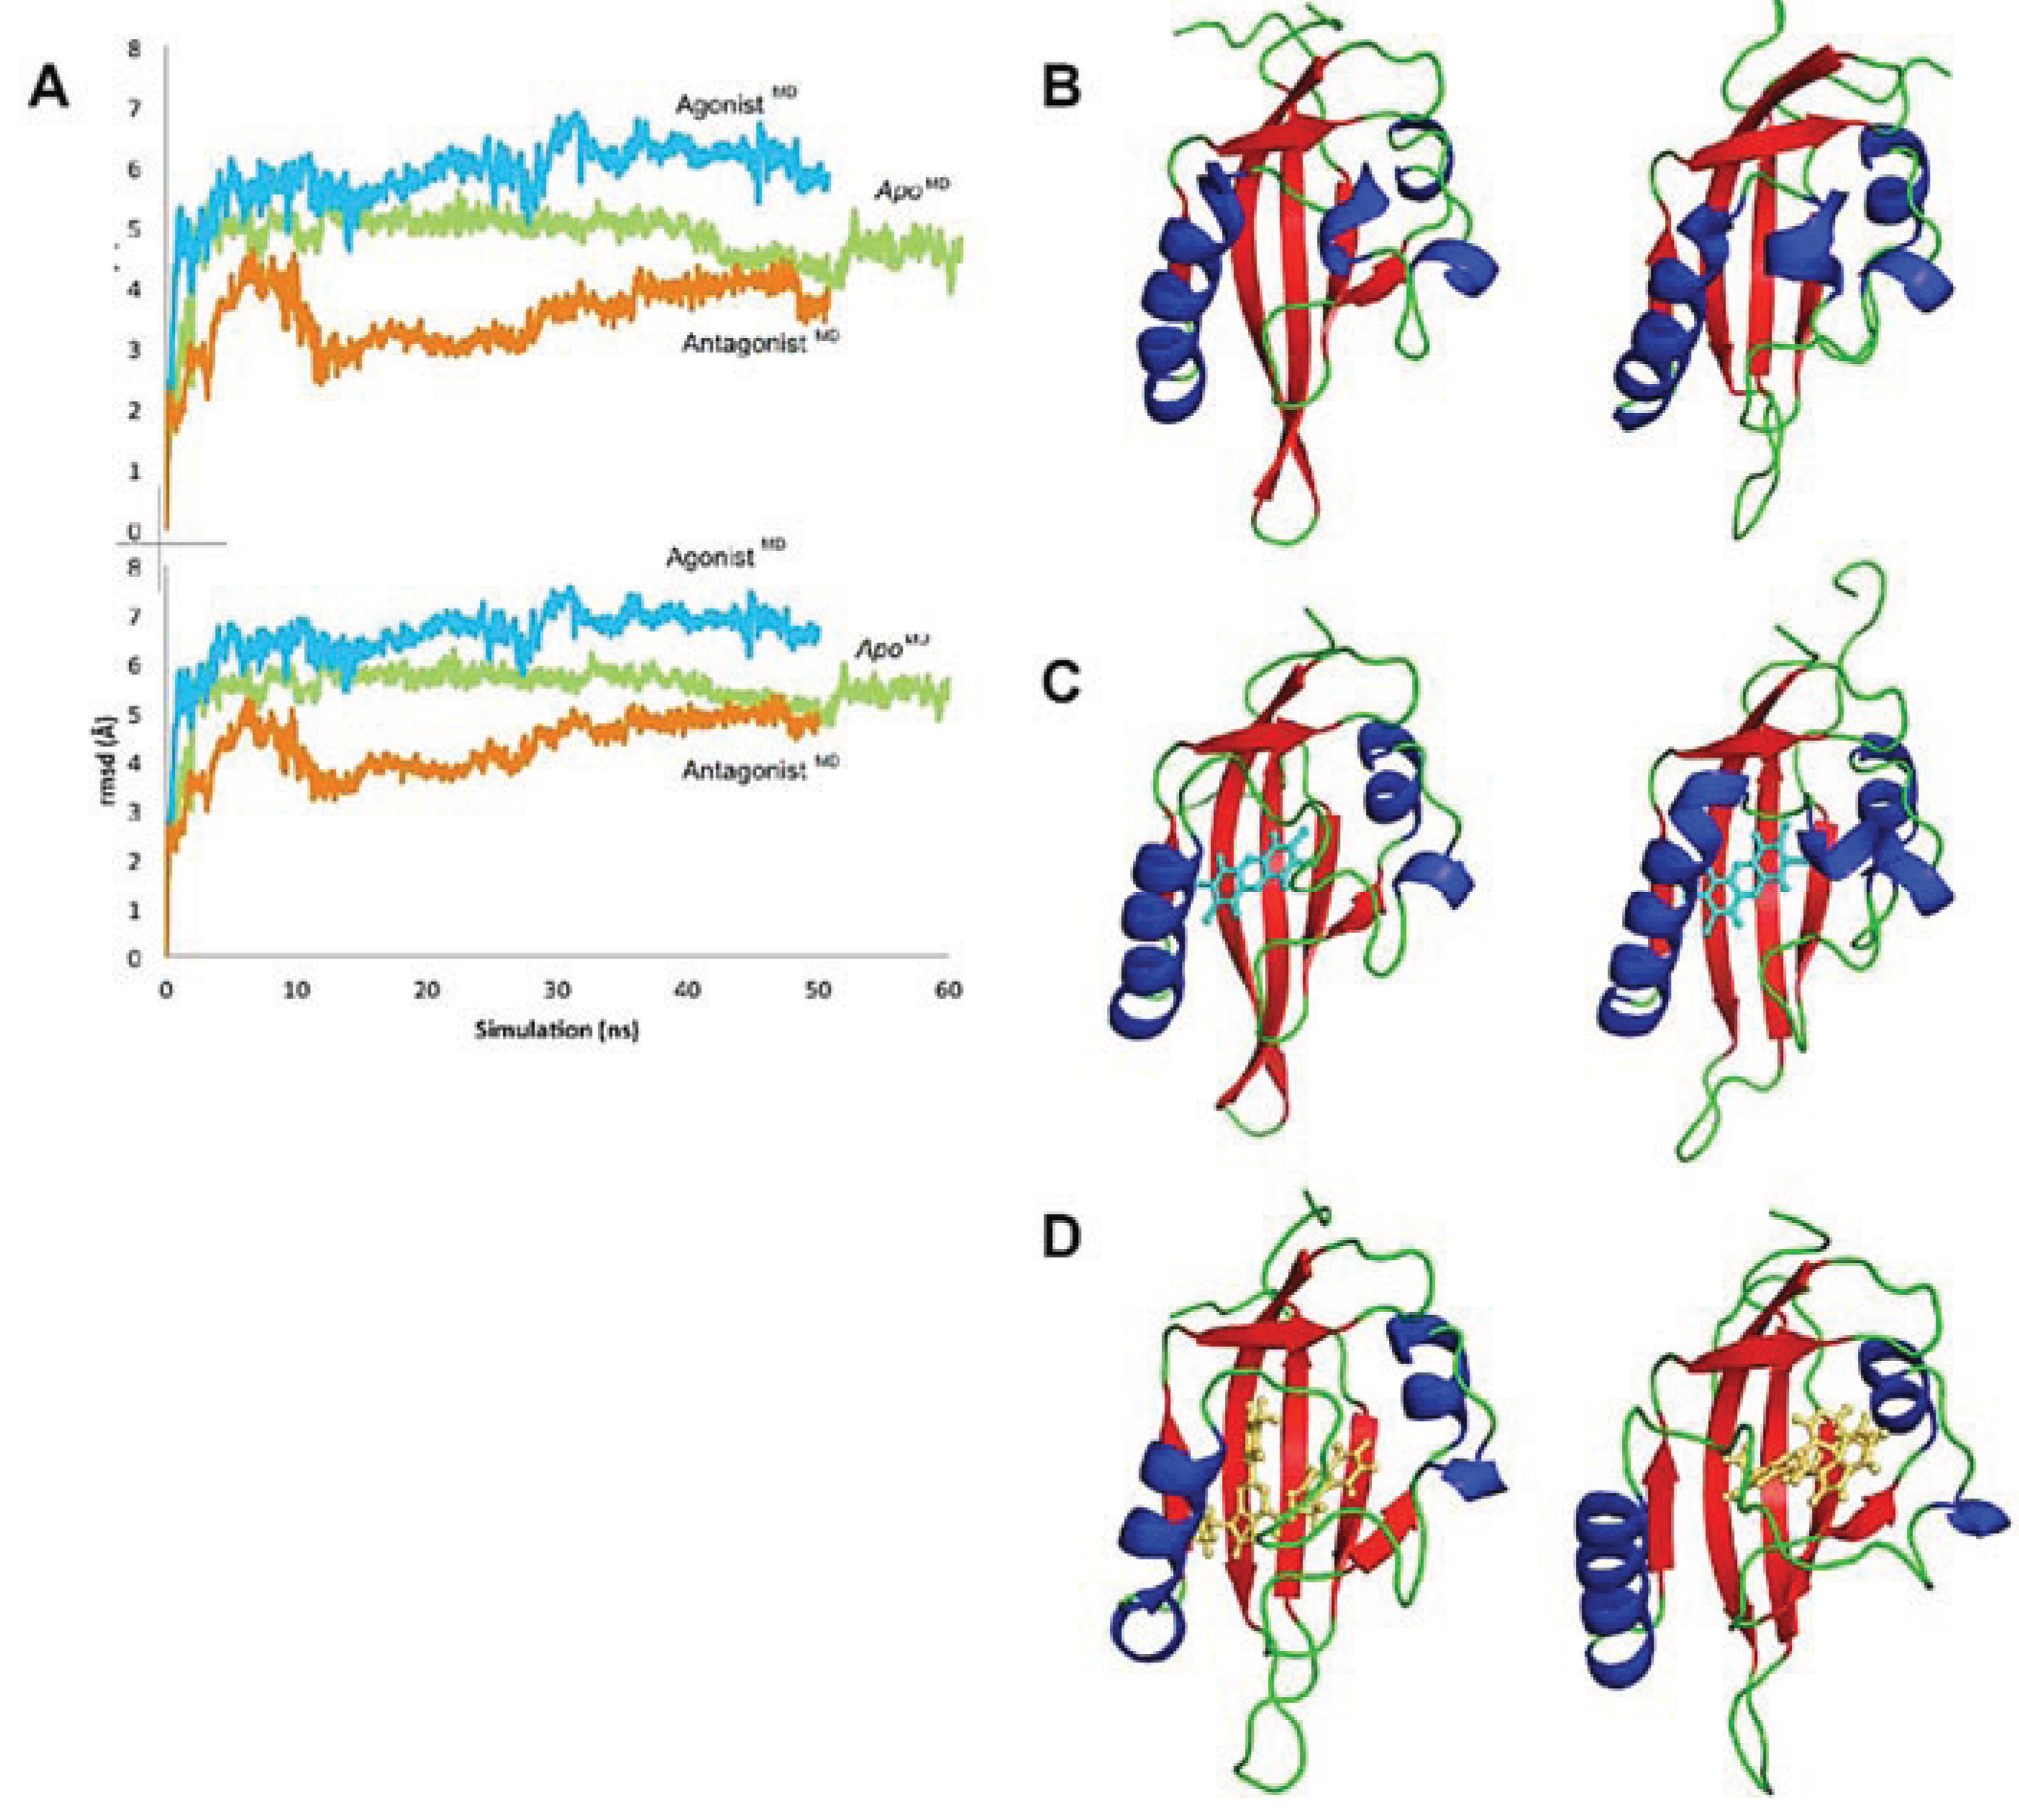
Although the models evolved over the course of the simulation, the secondary structure elements were generally retained and the equilibrated models were highly similar to the HIF-2α NMR template from which the starting coordinates of the homology model were derived (
Figure 8a). Over ca. 60 Cα atoms, the
apoMD model differed by ca. 1 Å rmsd from HIF-2α and the agonist
MD and antagonist
MD models differed by ca. 1 Å rmsd from
apoMD. When comparing the three molecular dynamics models at equilibrium it is apparent that conformational changes occurred during the simulation as a result of the bound ligands, and residues which had substantial contact with the ligands experienced the largest conformational perturbations (
Figure 8a). The
apoMD model experienced shifts mostly at loop regions and at the
N- and
C-terminus (
Figure 8a). The
apoMD and agonist
MD models are generally similar to each other, with the agonist-bound form having lost some of the helical element of αE (
Figure 8b). In contrast, antagonist
MD shows substantial rearrangements in the 307–329 region, with αE completely disrupted and αD shortened and converted to a 3
10-helix (
Figure 8c).
Figure 8.
Influence of agonist and antagonist binding on AHR PAS-B structure. (
A) A structure-based sequence alignment is shown between HIF-2α and the equilibrated AHR molecular dynamics models. The standard secondary structure elements of PAS-B domains are indicated for HIF-2α and the AHR models, with grey arrows depicting β-strands, tan cylinders as α-helices, pink as 3
10-helices, and purple as pi-helices. Every ten residues are denoted with (.) for the sequence of AHR and residues which have been shown through mutagenesis to be important for agonist binding are noted in black boxes [
13,
18]. The region of the murine AHR PAS-B that was shown to interact with HSP90 is denoted with a black bar. Colored circles indicate residues contacted by the bound ligands at 50 ns of simulation time, with white indicating ≥1 Å
2 buried, green for ≥10 Å
2 buried, yellow for ≥20 Å
2 buried, and red for ≥30 Å
2 buried. (
B) A morph between the
apoMD (light grey) and agonist
MD (dark grey, TCDD shown with blue carbons) conformations is shown, with yellow highlighting the structural differences between the
apo and the bound state. The secondary structural elements are depicted. The βB and βG regions are noted with an asterisk (*) as they exhibit near β-strand geometry. (
C) A morph between the
apoMD (light grey) and antagonist
MD (dark grey, GNF351 shown with orange carbons).
![Biology 03 00645 g008]()
3.3. Conformational Dynamics Prior to Equilibration
We analyzed the conformational changes during the progression toward equilibrium to gain insight into the mechanics of the domain (
Figure 9a) [
32]. The
apoMD changed little over time, including a shift in the positions of the αE and αF helices prior to 20 ns (
Figure 9). The shortening of the βH and βI to coil occurred later in the simulation, as did the slight repositioning of the αC helix. Given that the ligand-binding cavity is proposed to be in the core of the protein [
6,
13], we were interested to know how the
apo cavity would appear after solvation and in the absence of its chaperone partner HSP90. As the
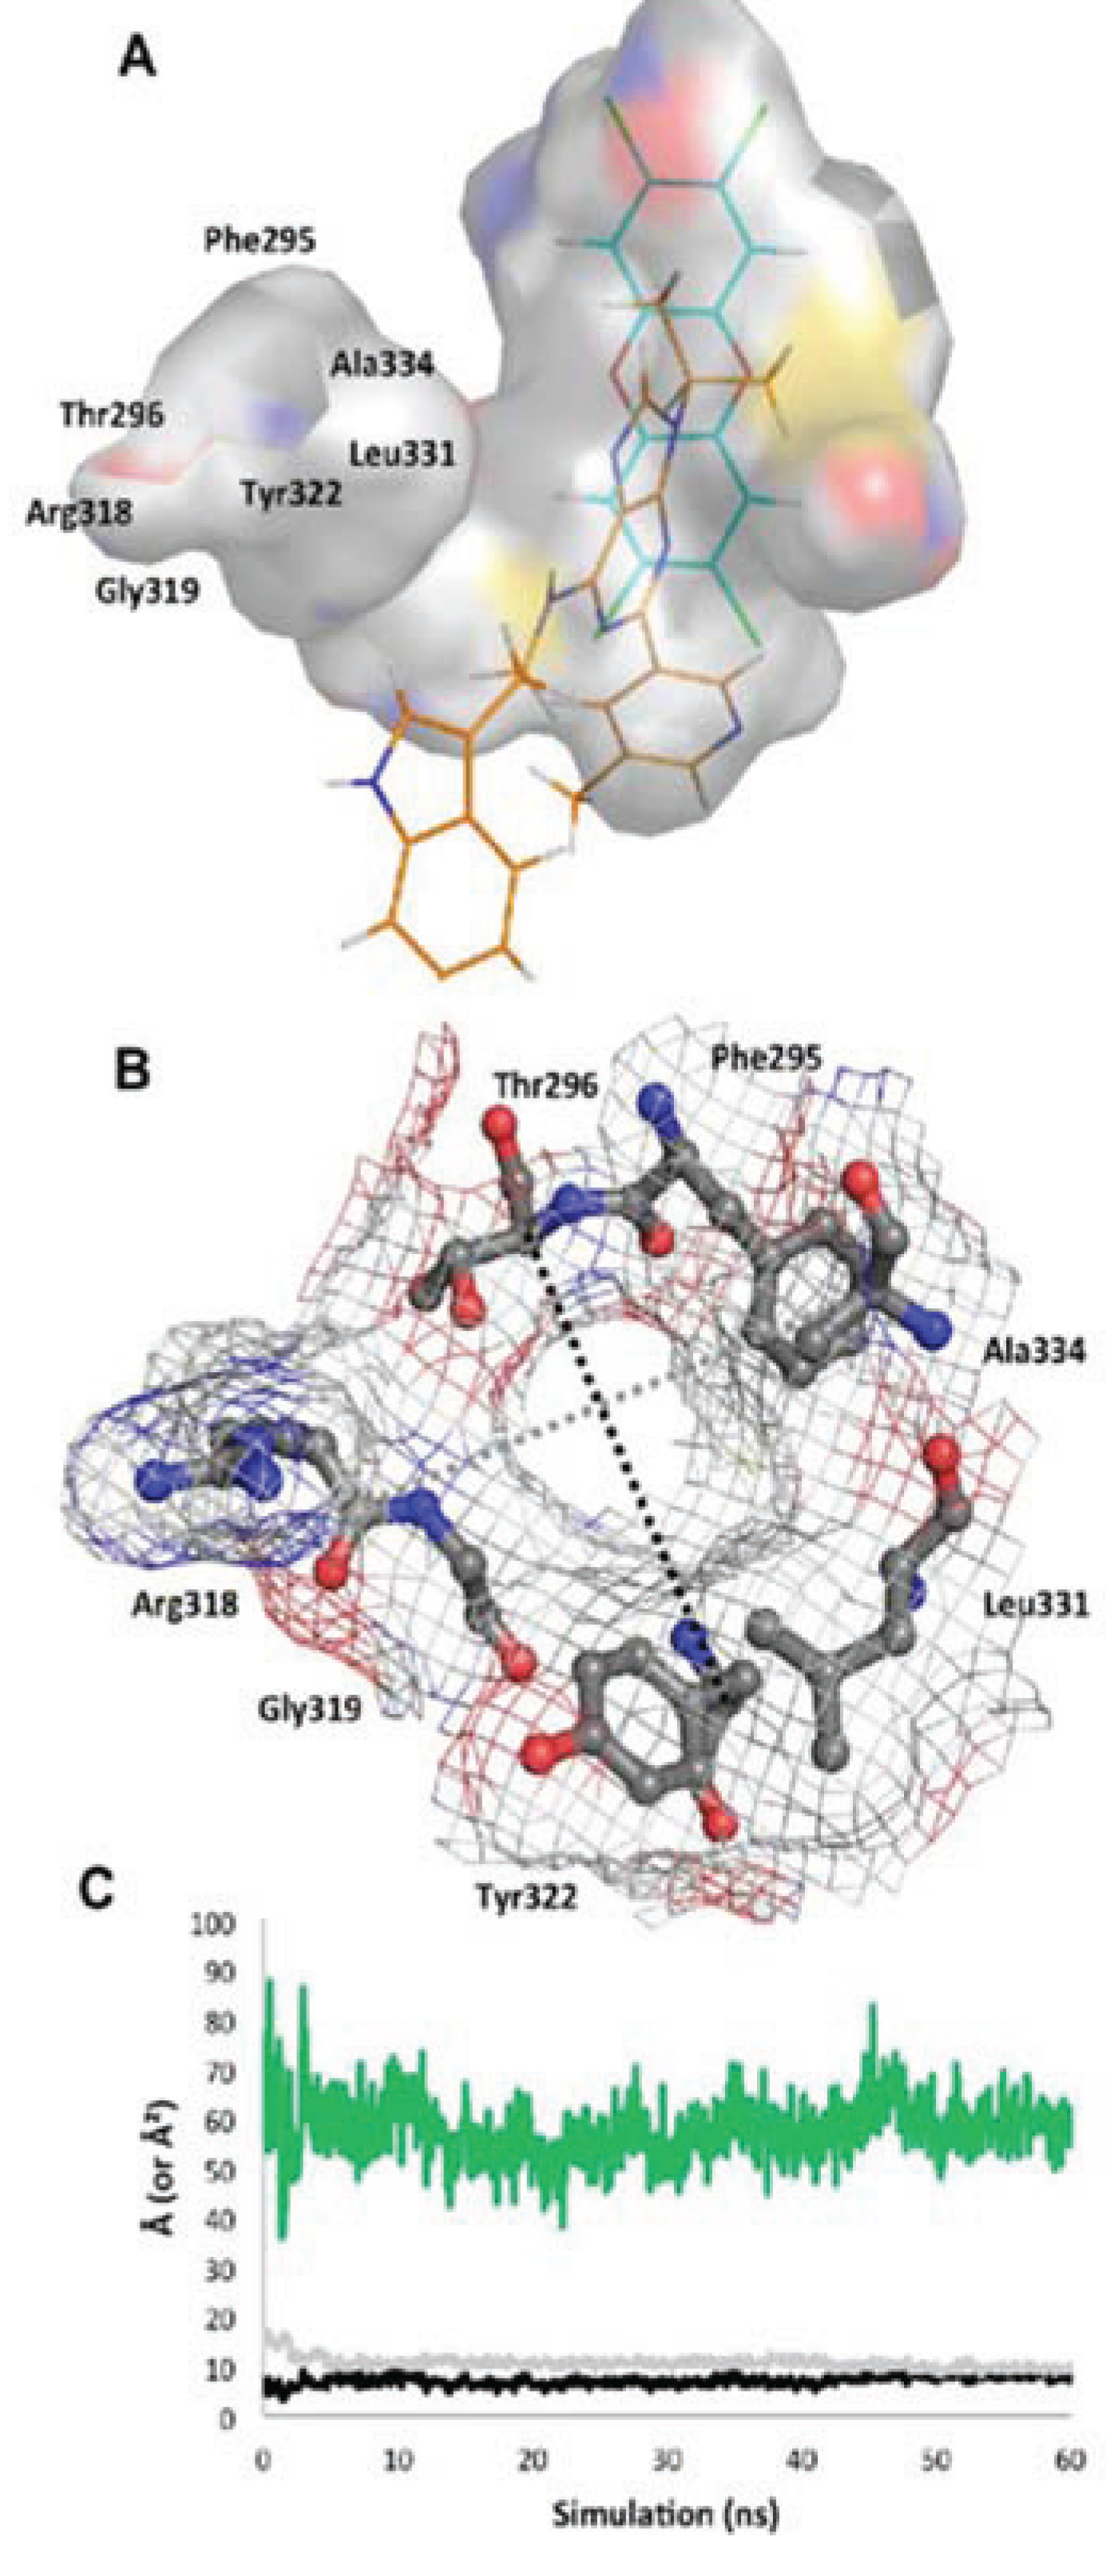
apoMD simulation progressed, the only entrance to the binding pocket, delineated by residues from the βA-βB loop, αE, and αF, shifted from slightly elliptical to circular, becoming stable in a “closed” conformation by ca. 5 ns with a narrow entrance opening of only ca. 50 Å
2 (
Figure 10). Though the binding site in this state would not be accessible to a ligand without additional conformational changes, the pocket interior did not collapse and was roughly the same size and shape as in the agonist
MD (
Figure 10).
Figure 9.
Evolution of the AHR PAS-B structures over time. (A) The rmsd at every 100 frames is shown for the backbone atoms of apo (green), agonist-bound (cyan), and antagonist-bound (orange) simulations in the top panel; the rmsd for all protein atoms is shown in the lower panel. The equilibrated agonistMD model deviates from the equilibrated apoMD by 0.9 Å (69 Cα atoms) and from the HIF-2α PAS-B structure by 1.1 Å (68 Cα atoms), and the equilibrated antagonistMD model deviates from the apoMD by 1.1 Å (55 Cα atoms) and 1.2 Å (61 Cα atoms) from HIF-2α. (b–d) Conformation changes during the course of simulation are shown. The structure at 0 ns is shown left and at the end of the simulation is shown right for apo (B), agonist-bound (C), and antagonist-bound (D) simulations. The models are colored by secondary structure: helices, blue; strands, red; loops, green and the ligands are shown as cyan sticks (TCDD) or orange sticks (GNF351)
In the agonist
MD model, the αE helix was initially disrupted but was mostly regained by the end of the simulation, although in a slightly shifted position (
Figure 9). The
N-terminal end of the αF helix was also disrupted at the beginning of the simulation, but was recovered and actually converted to a pi-helix, which contributed to a constriction of the binding pocket around the ligand. As seen in the close similarity between 0 ns and 50 ns time points, the TCDD shifted very little over the course of the agonist
MD simulation, an indication that the conformation of the starting model was energetically favorable (
Figure 9). At equilibration, the entrance canal is closed off and the shape adopted by the pocket fits the ligand tightly, with ca. 230 Å
2 contact area between the ligand and protein (
Figure 11a). In our VLS we hypothesized that hydrogen bonds from Ser365 and/or His291 may be a fingerprint for agonist binding, as these interactions were common to many of the docked agonists (
Figure 3). In the agonist
MD simulation we observed that Ser365 and His291 side chains formed transient hydrogen bonds with the ligand and were at least in contact with the ligand throughout the entirety of the simulation (
Figure 11a). A binding profile over the final 10 ns of simulation revealed that the 20 residues contacting the ligand correlate well with positions that have been demonstrated to impact TCDD binding in mutagenesis studies (
Figure 11b)[
13,
18].
Figure 10.
Structure of the
apo binding pocket. (
A) The environment of the ligand cavity is shown for
apoMD (at 60 ns) colored by atom: carbon, grey; oxygen, red; nitrogen, blue; sulfur, yellow with the pocket area calculated as in
Figure 2. The ligands of the agonist
MD (cyan) and antagonist
MD (orange) models are superimposed as lines. (
B) Seven residues constituting the entrance to the binding site are noted. The pocket entrance is shown, with delineating residues displayed as sticks and surface displayed as mesh colored by atom. (
C) The approximate size of the pocket entrance over time is shown, estimated by plotting in Å the molecular surface gap (distance between atoms subtracted by molecular surface) between the Cα atoms of residues Ala334 and Arg318 (grey line in b) and Thr296 and Tyr322 (black line in b); the area of the ellipse that would be formed by these two distances is plotted in green in Å
2.
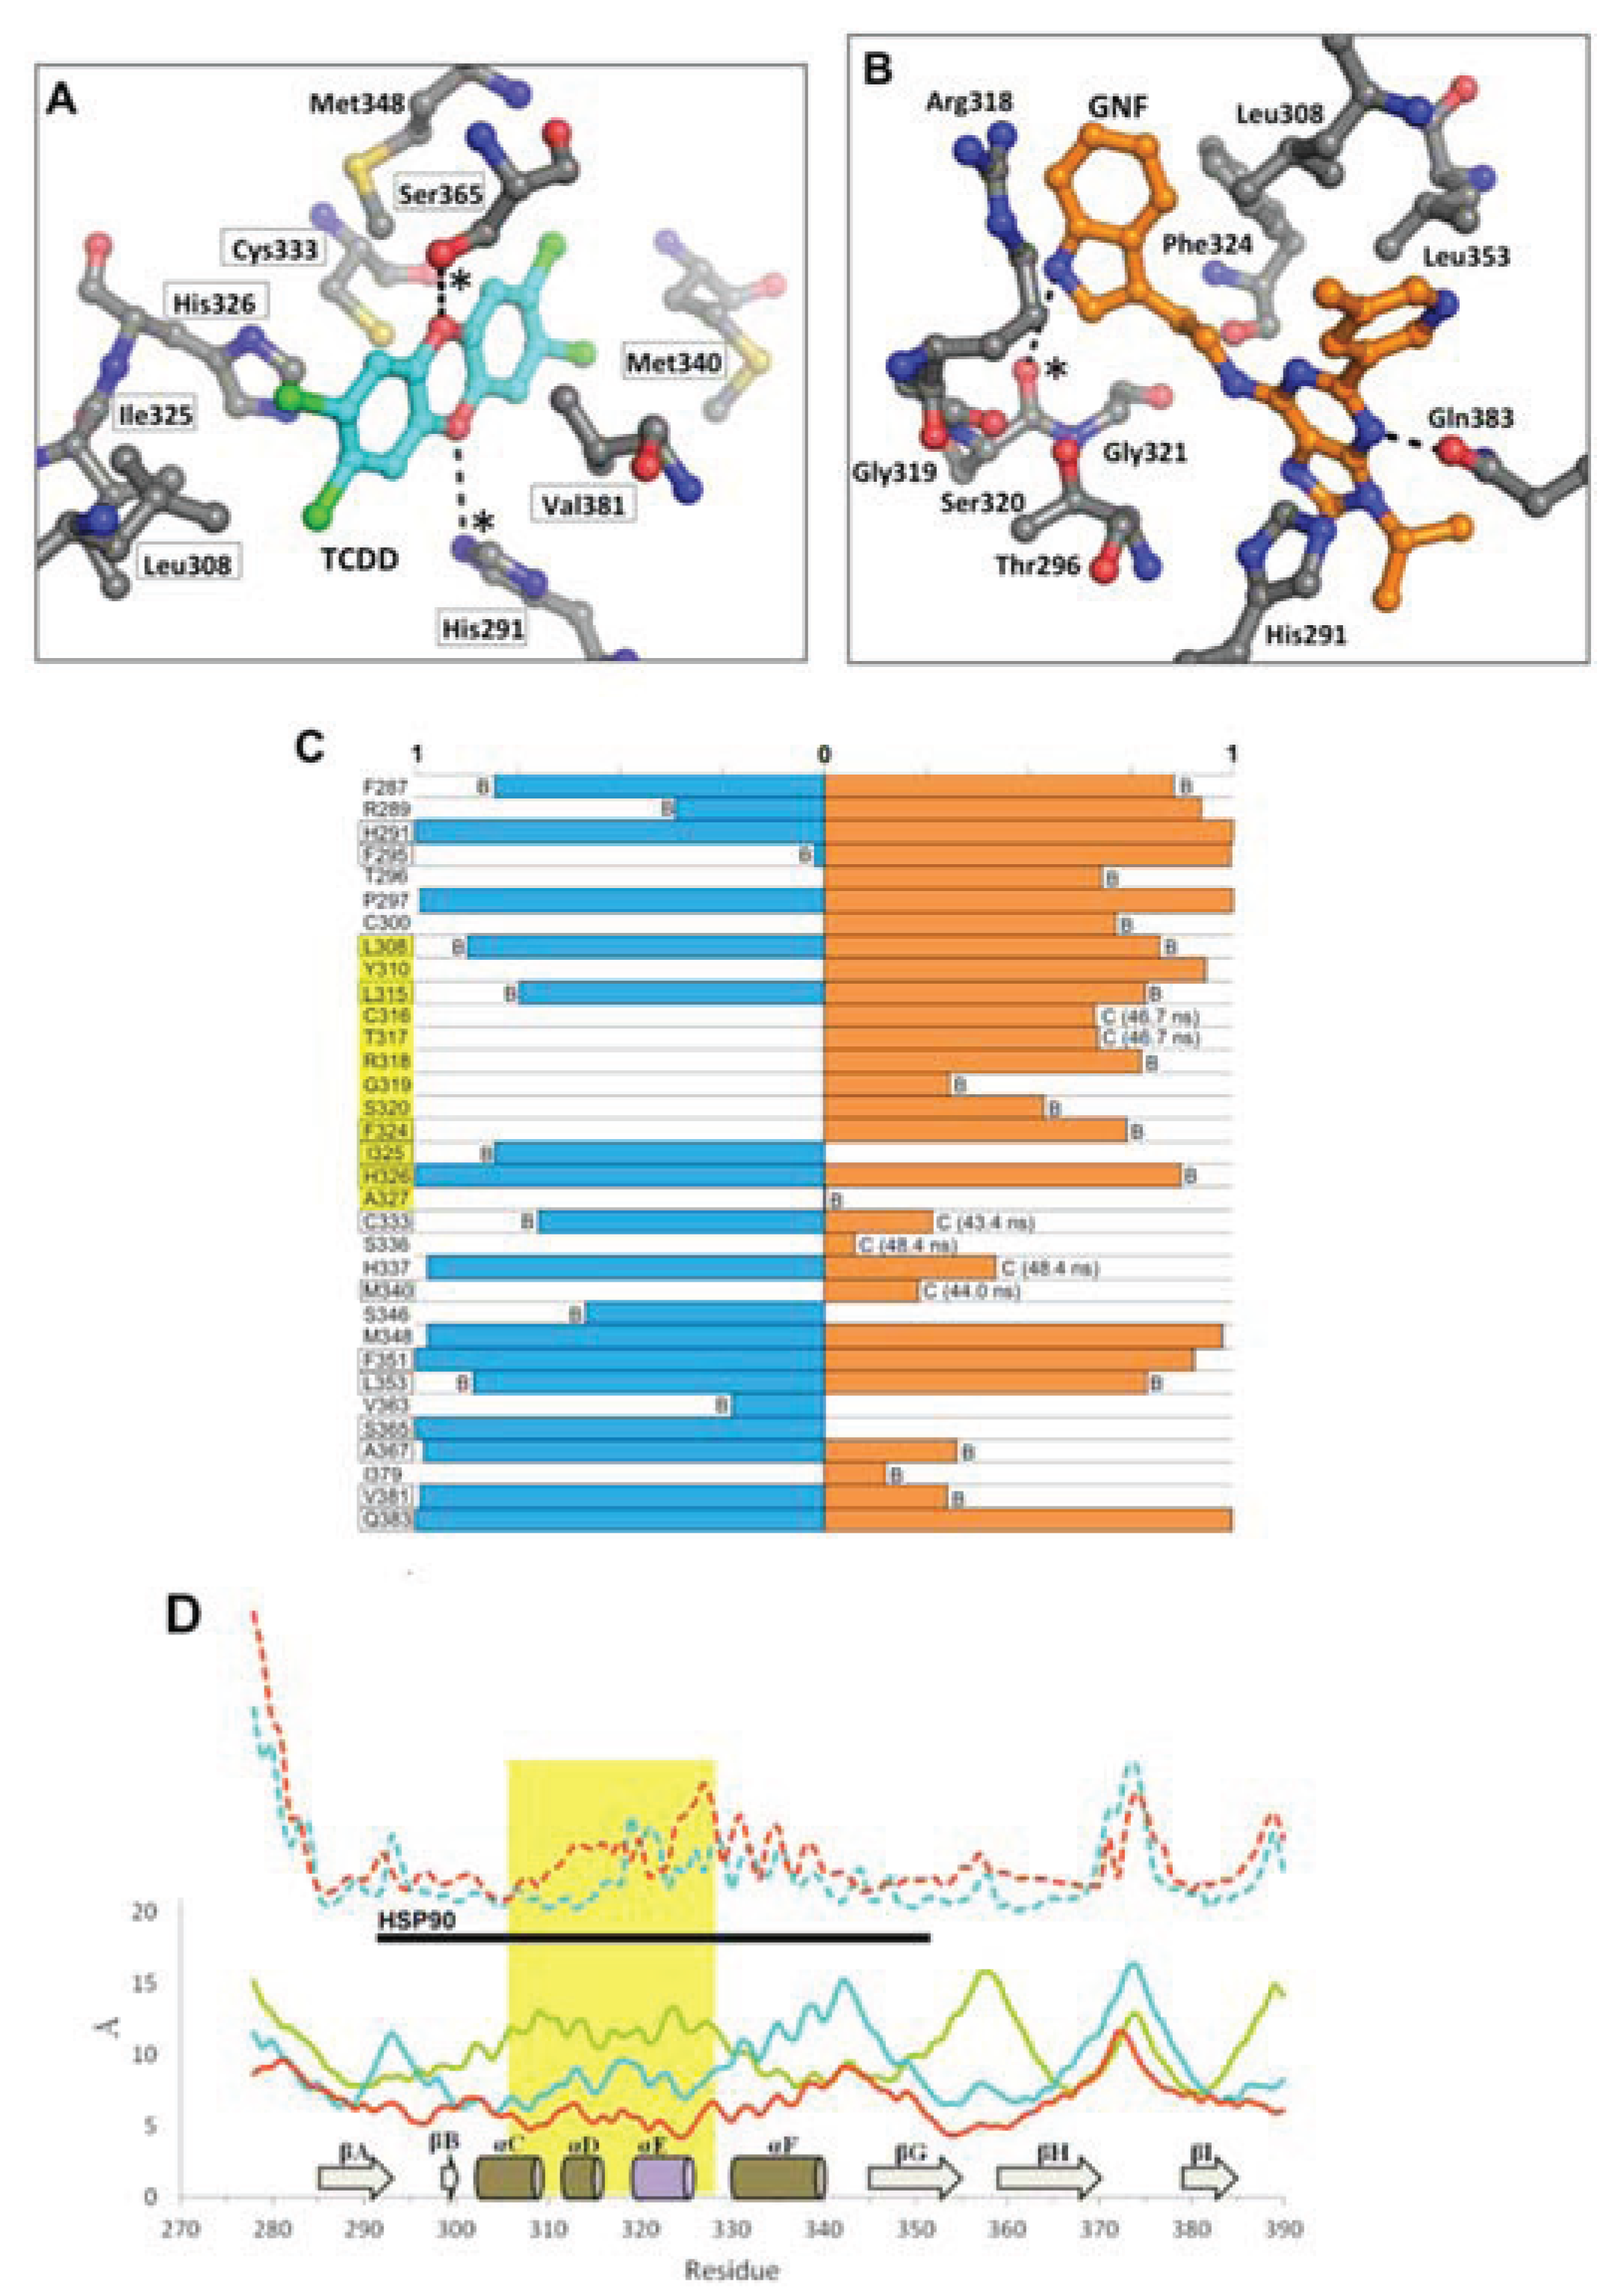
Figure 11.
Environment and interactions of the bound ligands. (
A) The environment of the ligand-binding cavity is shown for the equilibrated agonist
MD model (at 50 ns) colored by atom: carbon, grey; oxygen, red; nitrogen, blue; sulfur, yellow. TCDD is depicted with sticks (with carbon atoms colored in cyan); active site residues that form transient hydrogen bonds with the buried polar groups of the ligand are noted with (*). The important interacting residues of the bound TCDD are shown, and residues which have been investigated via mutagenesis and found to influence TCDD binding are noted in black boxes [
13,
18]. (
B) As in panel A, the active site cavity is shown for the equilibrated antagonist
MD model (at 50 ns). (
C) Residues contacting the ligand (within 4 Å) during the final 10 ns of simulation are shown with the percentage of contact time noted for agonist
MD (blue) and antagonist
MD (orange). For those with less than 90% contact time over the final 10 ns, we note whether this is due to fluctuation from being on the pocket boundary (denoted with “B”) or due to a conformational shift (denoted with “C”), for which we also note the time of occurrence. (
D) Shown is a plot of root mean square fluctuation of Cα atoms to illustrate structural dynamics for
apoMD (solid green) agonist
MD (solid cyan), antagonist
MD (solid orange) as calculated by VMD [
33] during the last 5 ns of simulation. The Cα shifts between
apoMD and agonist
MD (dashed cyan) and between
apoMD and antagonist
MD (dashed orange) are also shown on the same scale, but for clarity their values are adjusted +20 Å. The 307–329 segment is highlighted in gold, with the secondary structure of the
apoMD given for reference, and the regions interacting with HSP90 in the murine system are noted by the black bar.
![Biology 03 00645 g011]()
Of the three simulations, the antagonist
MD model exhibited the most substantial conformation changes over time. The αE helix was disrupted during pre-production molecular dynamics and was never recovered, and the αF helix was seen to become distended from the protein core (
Figure 9d). The binding profile is also quite different for antagonist
MD (
Figure 11). Unlike TCDD, however, to our knowledge no experimental analysis has yet been done to determine what residues are important for binding GNF351. The GNF351 binding profile may therefore serve as an initial analysis to provide guidance for future mutagenesis studies directed at probing antagonist interactions (
Figure 11). Overall, the GNF351 had much more extensive contact with residues of the 307–329 region than did TCDD, and consequently the antagonist
MD exhibited an altered chain path for the entirety of Leu308-His326 (
Figure 11). For both the ligand-bound simulations we also observed considerable alterations in the dynamics of the domain, with the 307–329 segment and the βG-βH regions more stabilized relative to
apoMD (
Figure 11d). In summary, these simulations showed the agonist and antagonist-bound forms of AHR to undergo changes in structure and dynamics. The antagonist required the 307–329 segment to adapt by flexing to a greater degree than when an agonist was bound, and these rearrangements caused substantial distortions to the domain’s structure.


 ,
, 


