
Skeletal Muscle Transcriptome Analysis of Hanzhong Ma Duck at Different Growth Stages Using RNA-Seq


College of Animal Science and Technology, Northwest A&F University, Yangling 712100, Shaanxi, China
*
Author to whom correspondence should be addressed.
Biomolecules 2021, 11(2), 315; https://0-doi-org.brum.beds.ac.uk/10.3390/biom11020315
Submission received: 24 January 2021
/
Revised: 12 February 2021
/
Accepted: 14 February 2021
/
Published: 19 February 2021
(This article belongs to the Section Molecular Genetics)
Abstract
:As one of the most important poultry worldwide, ducks (Anas platyrhynchos) are raised mainly for meat and egg products, and muscle development in ducks is important for meat production. Therefore, an investigation of gene expression in duck skeletal muscle would significantly contribute to our understanding of muscle development. In this study, twenty-four cDNA libraries were constructed from breast and leg muscles of Hanzhong Ma ducks at day 17, 21, 27 of the embryo and postnatal at 6-month-old. High-throughput sequencing and bioinformatics were used to determine the abundances and characteristics of transcripts. A total of 632,172,628 (average 52,681,052) and 637,213,938 (average 53,101,162) reads were obtained from the sequencing data of breast and leg muscles, respectively. Over 71.63% and 77.36% of the reads could be mapped to the Anas platyrhynchos genome. In the skeletal muscle of Hanzhong duck, intron variant (INTRON), synonymous variant (SYNONYMOUS_CODING), and prime 3′ UTR variant (UTR_3_PRIME) were the main single nucleotide polymorphisms (SNP) annotation information, and “INTRON”, “UTR_3_PRIME”, and downstream-gene variant (DOWNSTREAM) were the main insertion-deletion (InDel) annotation information. The predicted number of alternative splicing (AS) in all samples were mainly alternative 5′ first exon (transcription start site)-the first exon splicing (TSS) and alternative 3′ last exon (transcription terminal site)-the last exon splicing (TTS). Besides, there were 292 to 2801 annotated differentially expressed genes (DEGs) in breast muscle and 304 to 1950 annotated DEGs in leg muscle from different databases. It is worth noting that 75 DEGs in breast muscle and 49 DEGs in leg muscle were co-expressed at all developmental points of comparison, respectively. The RNA-Seq data were confirmed to be reliable by qPCR. The identified DEGs, such as CREBL2, RHEB, GDF6, SHISA2, MYLK2, ACTN3, RYR3, and STMN1, were specially highlighted, indicating their strong associations with muscle development in the Hanzhong Ma duck. KEGG pathway analysis suggested that regulation of actin cytoskeleton, oxidative phosphorylation, and focal adhesion were involved in the development of skeletal muscle. The findings from this study can contribute to future investigations of the growth and development mechanism in duck skeletal muscle.
1. Introduction
Skeletal muscle has a primary function of locomotion and protection, and it is also responsible for the structure and metabolic regulation of the body [1]. Besides, skeletal muscle mass represents up to 40% of total body weight in animals, which is an important trait in poultry breeding due to its high economic value [2,3]. In recent years, there have been many studies on the muscle development of poultry embryos [4]. The mechanism of myofibers formation involves the activation of progenitor cells, which proliferate as mononuclear myoblasts and eventually fuse to form multinucleated myotubes. Besides, many genes, non-coding RNAs, and transcription factors are involved in the regulation of muscle proliferation and differentiation [5,6]. Some studies have analyzed the gene expression changes involved in the muscle development of poultry [7,8]. However, the molecular mechanism of skeletal muscle development currently remains unclear.
RNA-Seq is a useful tool to measure gene transcription and better understand the physiology behind specific phenotypes. In the past few years, transcriptome sequencing has been applied to livestock and poultry and helped to select candidate genes related to important traits by comparing the global gene expression profiles between different animal populations in specific traits [9,10,11]. So far, RNA-Seq has been used to find and study the specific genes and pathways of muscle development under different conditions including cattle [12], sheep [13], pig [14], chicken [15], duck [16], and goose [17]. Hanzhong Ma duck is a local duck breed in China, which is mainly distributed in Hanzhong City, Shaanxi Province, China. It is small in size and light in weight. The average weight of male and female adult Hanzhong Ma ducks is 1.172 kg and 1.238 kg respectively, which greatly limits their meat value. Moreover, comparative transcriptomic studies on breast and leg muscle of Hanzhong Ma duck at different growth stages have been scarce.
In this study, the skeletal muscle transcriptomes of Hanzhong Ma duck at different growth stages were compared using RNA-Seq technology, and single nucleotide polymorphisms (SNP), InDel, and alternative splicing (AS) were detected. Besides, the functions of these differentially expressed genes (DEGs) were annotated and analyzed by the Gene Ontology (GO) and Kyoto Encyclopedia of Genes and Genomes (KEGG) database in order to identify the genes and genetic pathways related to the development of skeletal muscle in Hanzhong Ma ducks. The purpose of this study is to understand the genetic basis of breast and leg muscle development in ducks at the transcriptome level and to provide new insights into skeletal muscle development in poultry.
2. Materials and Methods
2.1. Animal and Tissue Collection
After disinfection, one hundred eggs of Hanzhong Ma ducks (HZ) were incubated in a standard incubator. On 17d (E17), 21d (E21), and 27d (E27) of incubation, 8 eggs were randomly selected to collect breast and leg muscles for DNA and RNA extraction. The DNA of duck muscle was amplified to determine the sex of embryonic ducks using gCHD primers [18], and the identified female embryos were selected as the research objects (Table 1). Besides, 6-month-old female ducks (M6), raised under the same environmental conditions with free access to water and commercial corn-soybean-based diets (Table S1), were slaughtered quickly to separate breast and leg muscles. The separated muscle tissues were immediately frozen in liquid nitrogen and then stored at −80 °C until use. Animal care, slaughter, and experimental procedures were approved by the Institutional Animal Care and Institutional Ethics Committee of Northwest A&F University (ethic code: #0330/2019), and all efforts were made to minimize suffering.
2.2. Library Construction and Sequencing
Total RNA was extracted using the QIAzol Lysis Reagent (QIAGEN, Berlin, Germany) following the manufacturer’s protocol. The OD260/280 and OD260/230 were measured to confirm the purity of the RNA sample, and the ranges were 1.8–2.0 and >2.0, respectively. The RNA purity was verified by agarose gel electrophoresis, and the RNA integrity was detected using the Bioanalyzer 2100 system (Agilent Technologies, San Jose, USA) with a minimum RNA integrity number (RIN) value of 7.3 (Table S2). Twenty-four sequencing libraries were made using the TruSeq PE Cluster Kit v4-cBot-HS (Illumia, San Diego, CA, USA)) according to the manufacturer’s protocol. The libraries were sequenced on the Illumina platform (Illumina HiSeq X Ten platform, San Diego, CA, USA) to produce 150 bp paired-end reads.
2.3. Mapping of the Reads to Reference Genome
By discarding reads containing adapters or poly-N and more than 10% of unknown nucleotides, and rejecting reads with more than 50% of low-quality (Q-value ≤ 10) bases, the high-quality clean data were obtained for subsequent analyses. Then the quality parameters for filtered data including Q30, GC content, and sequence-duplication level were calculated. The filtered reads were mapped to the Anas platyrhynchos genome sequence (https://0-www-ncbi-nlm-nih-gov.brum.beds.ac.uk/genome/?term=DUCK; Accessed on: 27 December 2019) and annotated transcripts (https://0-www-ncbi-nlm-nih-gov.brum.beds.ac.uk/assembly/GCF_003850225.1; Accessed on: 27 December 2019), and the unmapped or multi-position matched reads (≥2 mismatch reads) were excluded from further analyses. A duck genome map was drawn by using the HISAT 2 tool (http://0-ccb-jhu-edu.brum.beds.ac.uk/software/hisat2/index.shtml; Accessed on: 27 December 2019).
2.4. Analysis of SNP/InDel
According to the results of the HISAT 2 comparison between the reads and the Anas platyrhynchos genome sequence, the potential SNP sites and the InDels were identified and detected by the GATK software (GATK2, Broad Institute, Cambridge, MA, USA, https://software.broadinstitute.org/gatk/; Accessed on: 30 December 2019).
2.5. Identification of AS Events
AS events were identified, and the types of AS corresponding expression in each sample were obtained by using the ASprofile software (ASprofile, The Center for Computational Biology at Johns Hopkins University, Washington, USA) (http://0-ccb-jhu-edu.brum.beds.ac.uk/software/ASprofile/; Accessed on: 30 December 2019). There were 12 main types of AS events in duck skeletal muscle: (A) TSS: Alternative 5′ first exon (transcription start site) the first exon splicing; (B) TTS: Alternative 3′ last exon (transcription terminal site) the last exon splicing; (C) SKIP: Skipped exon single exon skipping; (D) XSKIP: Approximate SKIP single exon skipping (fuzzy boundary); (E) MSKIP: Multi-exon SKIP multi-exon skipping; (F) XMSKIP: Approximate MSKIP multi-exon skipping (fuzzy boundary); (G) IR: Intron retention single intron retention; (H) XIR: Approximate IR single intron retention (fuzzy boundary); (I) MIR: Multi-IR multi-intron retention; (J) XMIR: Approximate MIR multi-intron retention (fuzzy boundary); (K) AE: Alternative exon ends (5′, 3′, or both); (L) XAE: Approximate AE variable 5′ or 3′ end (fuzzy boundary).
2.6. Analysis of Differentially Expressed Genes (DEGs)
The level of gene expression for each gene was measured using the FPKM (fragments per kilobase per transcript per million mapped reads), and the FPKM was calculated based on the length of the gene and read counts mapped to the gene. The formula is as follows:
Where cDNA Fragments is the number of fragments compared to a transcript; Mapped Fragments (Millions) is the total number of fragments compared to a transcript, in 1 × 10⁶ units; Script Length (kb) is the length of the transcript, in 1 × 10³ bases units. The normalized FPKM (FPKM > 1) was used as gene expression level for differential expression analysis by the DESeq software (DESeq2-1.28.1, Bioconductor, Buffalo, NY, USA) (http://www.bioconductor.org/packages/release/bioc/html/DESeq.html; Accessed on: 30 December 2019). A false discovery rate (FDR) was applied to determine the threshold of p-value in multiple tests and analyses. The DEGs were evaluated by fold-change ≥ 2 and FDR < 0.01.
2.7. Analysis of GO Enrichment and KEGG Pathway Enrichment
GO enrichment analysis of DEGs was implemented using the GOseq R packages (https://bioconductor.org/packages/release/bioc/html/goseq.html; Accessed on: 28 December 2019), and the number of DEGs in each term was calculated. The statistical enrichment of DEGs in the KEGG pathways was tested for further understanding the high-level functions of a biological system by the KOBAS (http://kobas.cbi.pku.edu.cn/kobas3/?t=1; Accessed on: 30 December 2019). Besides, gene functions were annotated with the following databases, including NR (NCBI non-redundant protein sequences, ftp://ftp.ncbi.nih.gov/blast/db/; Accessed on: 30 December 2019); Nt (NCBI non-redundant nucleotide sequences); Pfam (Protein family, http://pfam.xfam.org/; Accessed on: 30 December 2019); KOG/COG (Clusters of Orthologous Groups of proteins, http://0-www-ncbi-nlm-nih-gov.brum.beds.ac.uk/COG/; http://0-www-ncbi-nlm-nih-gov.brum.beds.ac.uk/KOG/; Accessed on: 30 December 2019); Swiss-Prot (a manually annotated and reviewed protein sequence database, http://www.uniprot.org/; Accessed on: 30 December 2019); GO (Gene Ontology, http://www.geneontology.org/; Accessed on: 30 December 2019); KO (KEGG Ortholog database).
2.8. qPCR Verification
To verify the repeatability and precision in the muscles sampled at different growth stages, 6 DEGs were randomly selected from the transcriptome data for qPCR analysis. The RNA extracted from the same samples with a RIN ≥ 7.3, A260/280 > 1.8, and A260/230 > 2.0, and the first strand of cDNA was synthesized according to the manual of reverse transcription kit (abm, Richmond, Canada). Six pairs of primers and β-actin were designed by the Primer 5.0 software (Table 1), and the stability of β-actin was tested in this system. qPCR was performed using EcoRT48 (OSA, London, UK), and the reaction system comprised 5 μL of 2 × TransStart Tip Green qPCR SuperMix (Transgen, Beijing, China), 0.3 μL of each primer (10 μM), 0.8 μL cDNA (400 ng/μL) and 3.6 μL ddH2O, reaching a total volume of 10 μL. The optimal reaction procedure included 95 °C for 30 s, followed by 40 cycles of 95 °C for 5 s, 60 °C for 30 s, then 95 °C for 15 s, 55 °C for 15 s, 95 °C for 15 s. The relative expression levels of DEGs were standardized to the internal reference gene β-actin by 2−ΔΔCt calculation method. Data were presented as mean±SD. The difference was analyzed using one-way analysis of variance (ANOVA) followed by Dunnet’s t-test and Tukey’s test.
3. Results
3.1. Analysis of RNA-Seq Data
The transcriptomes of breast and leg muscle yielded approximately 316 million (26,340,526 on average) and 318 million (26,550,580 on average) clean reads, respectively. The GC content and Q30 percentages of the breast muscle transcriptomes were 50.72% to 55.32% and 92.56% to 93.71%, respectively, whereas those of the leg muscle transcriptomes were 50.92% to 54.16% and 92.90% to 93.29%, respectively (Table 2).
A total of 1,269,386,566 reads (breast muscle: 632,172,628 with an average of 52,681,052 in each sample, leg muscle: 637,213,938 with an average of 53,101,162 in each sample) were obtained from the transcriptome libraries. The number of mapped reads were 30,008,951 (71.63%) to 48,999,024 (81.85%). While the number of uniquely mapped reads and multiple mapped reads were not less than 28,241,302 (50.04%) and 4,134,800 (9.50%), respectively (Table S3).
3.2. Annotation and Classification of SNP/InDel
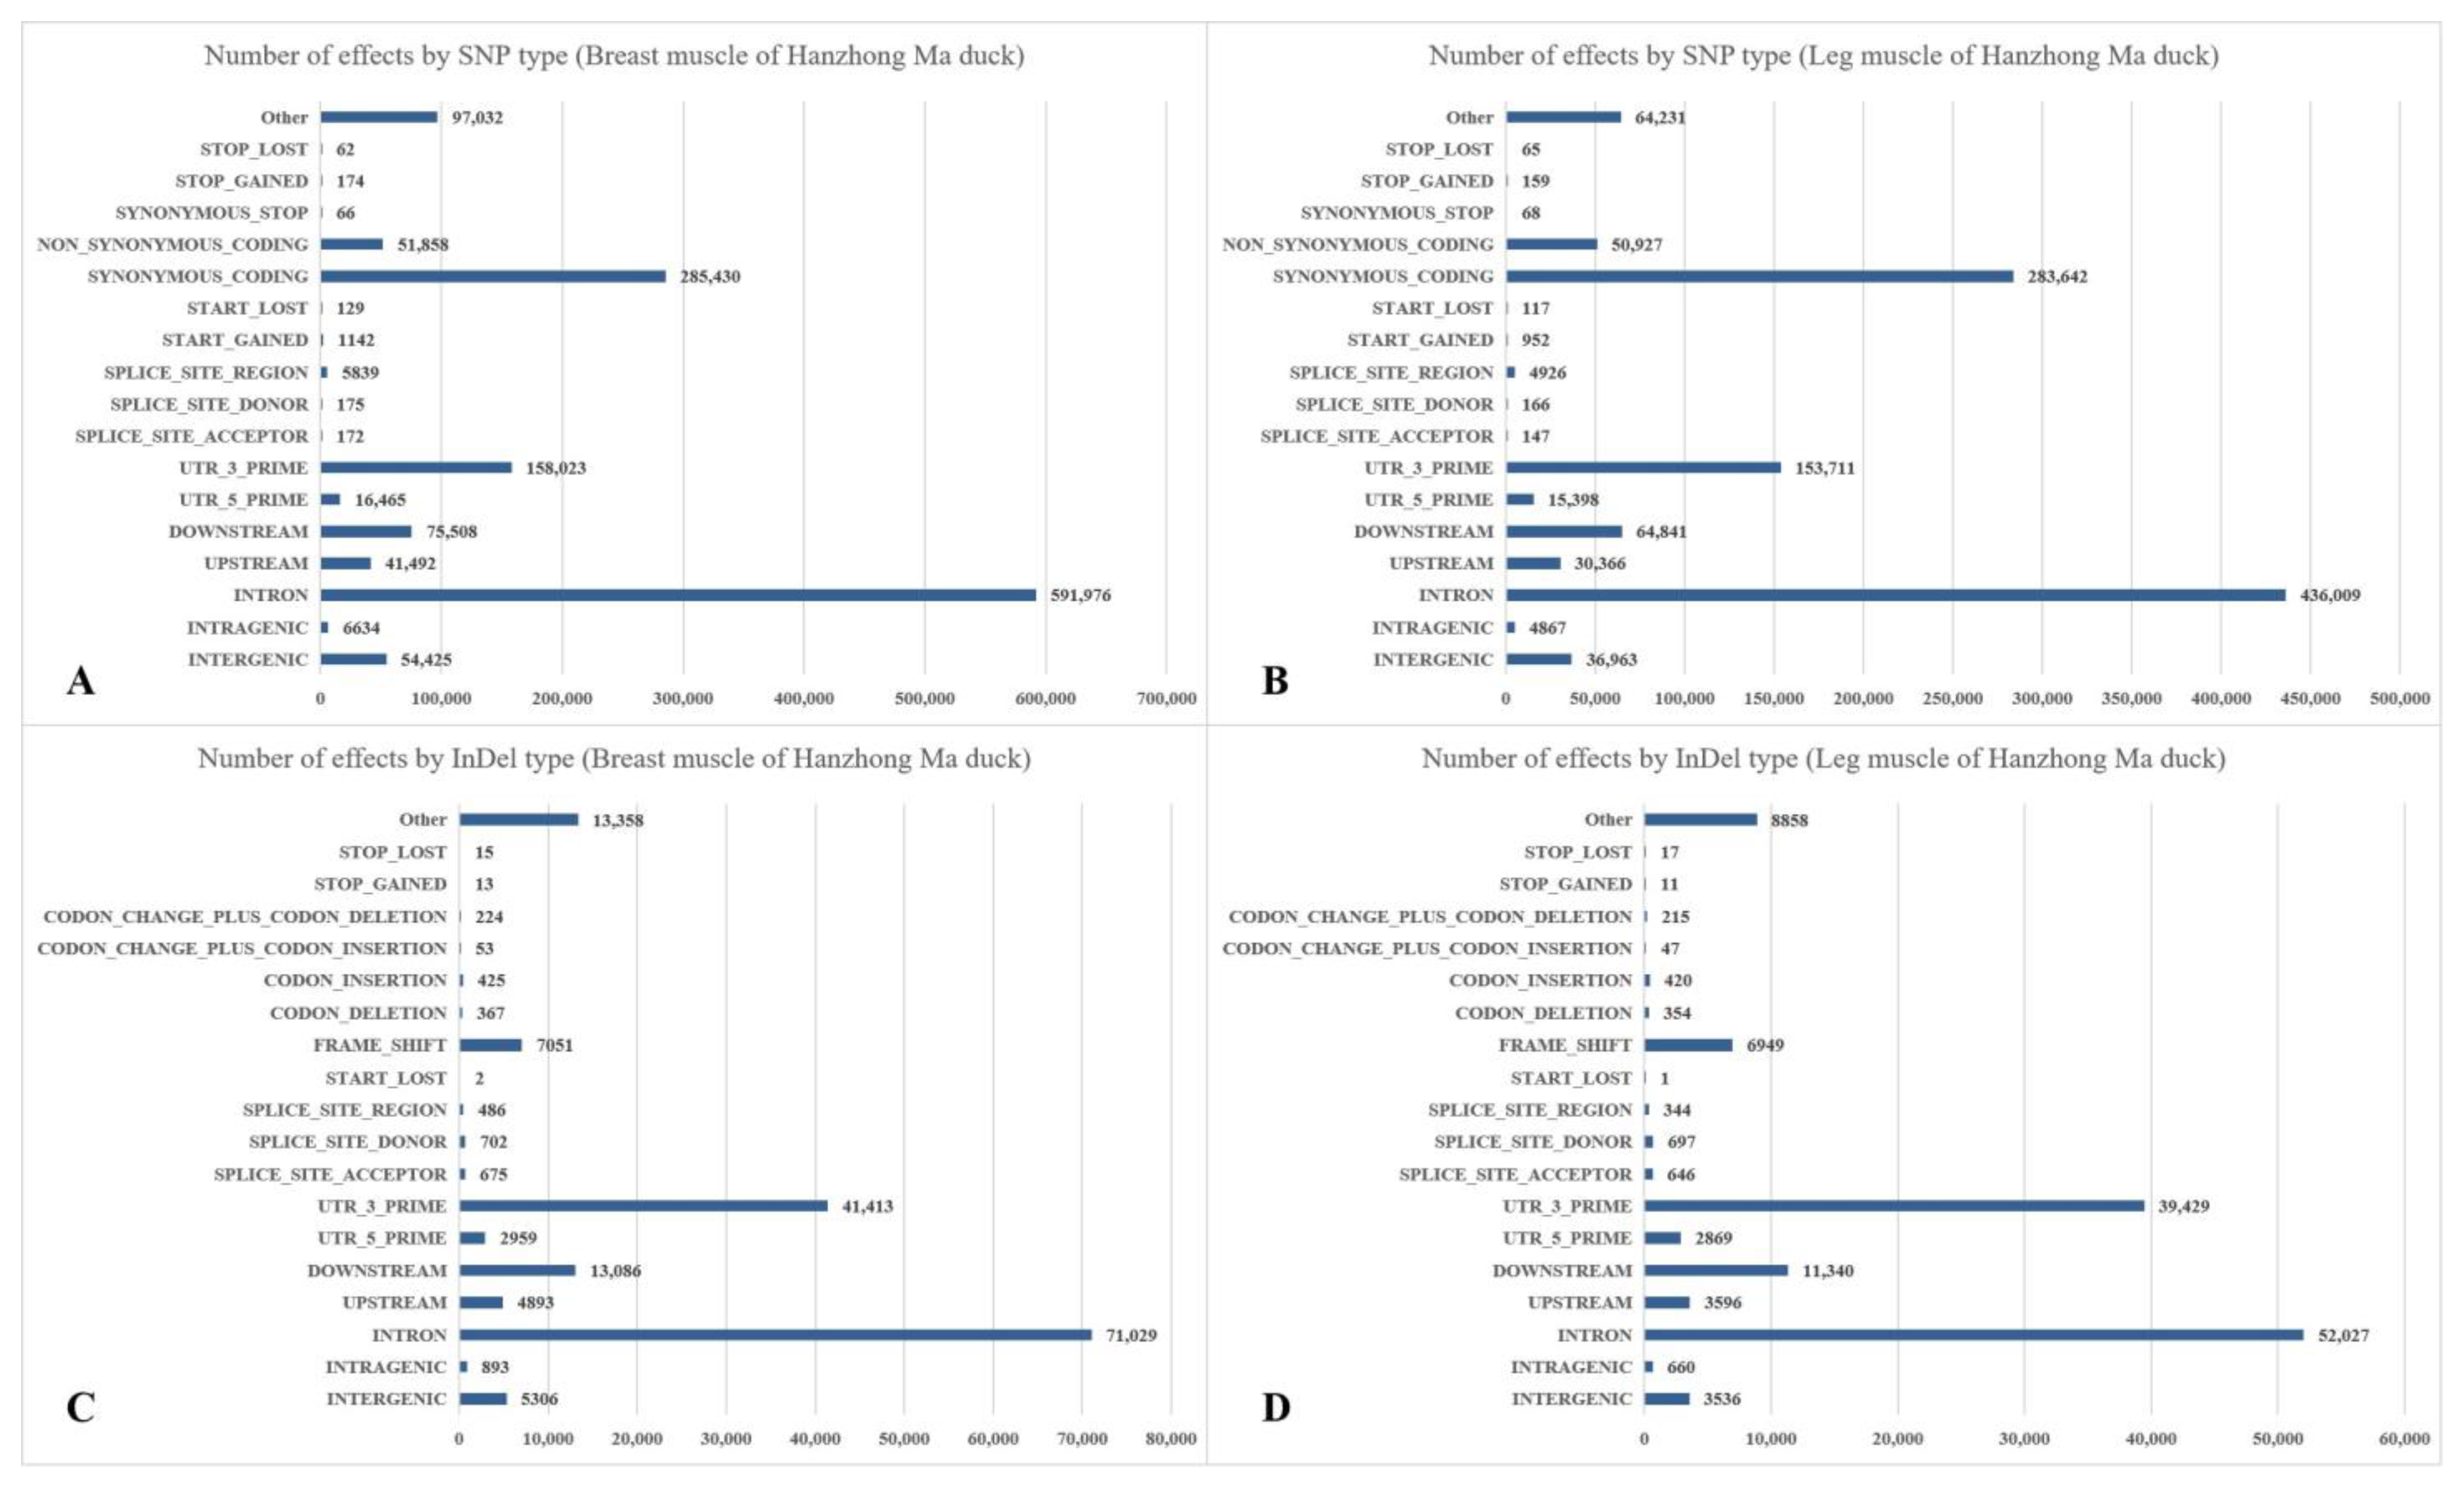
There were 56,327 to 164,499 SNPs in breast muscle, with the genic SNPs ranging from 51,586 to 147,615 and the intergenic SNPs ranging from 4,741 to 16,884, respectively. The total numbers of SNPs in leg muscle were 59,750 to 142,086 (the genic SNPs were 54,384 to 128,232 and the intergenic SNPs were 5,366 to 13,854). Besides, the proportions of transversion-type SNPs in all SNP sites were between 73.51% and 76.06% in breast muscle, and the ratio in leg muscle was between 73.75% and 75.91%. The percentages of the heterozygous SNPs in all SNPs of breast and leg muscle ranged from 35.17% to 41.44% and 36.43% to 41.34%, respectively (Table S4). The most common change was G->A, followed by C->T, A->G, and T->C (Table 3). The annotation results of SNPs and InDels are shown in Figure 1. The first three were “INTRON”, “SYNONYMOUS_CODING”, and “UTR_3_PRIME” in the annotations of SNPs. Besides, the first three were “INTRON”, “UTR_3_PRIME”, and “DOWNSTREAM” in the annotations of InDels.
3.3. Prediction of AS events
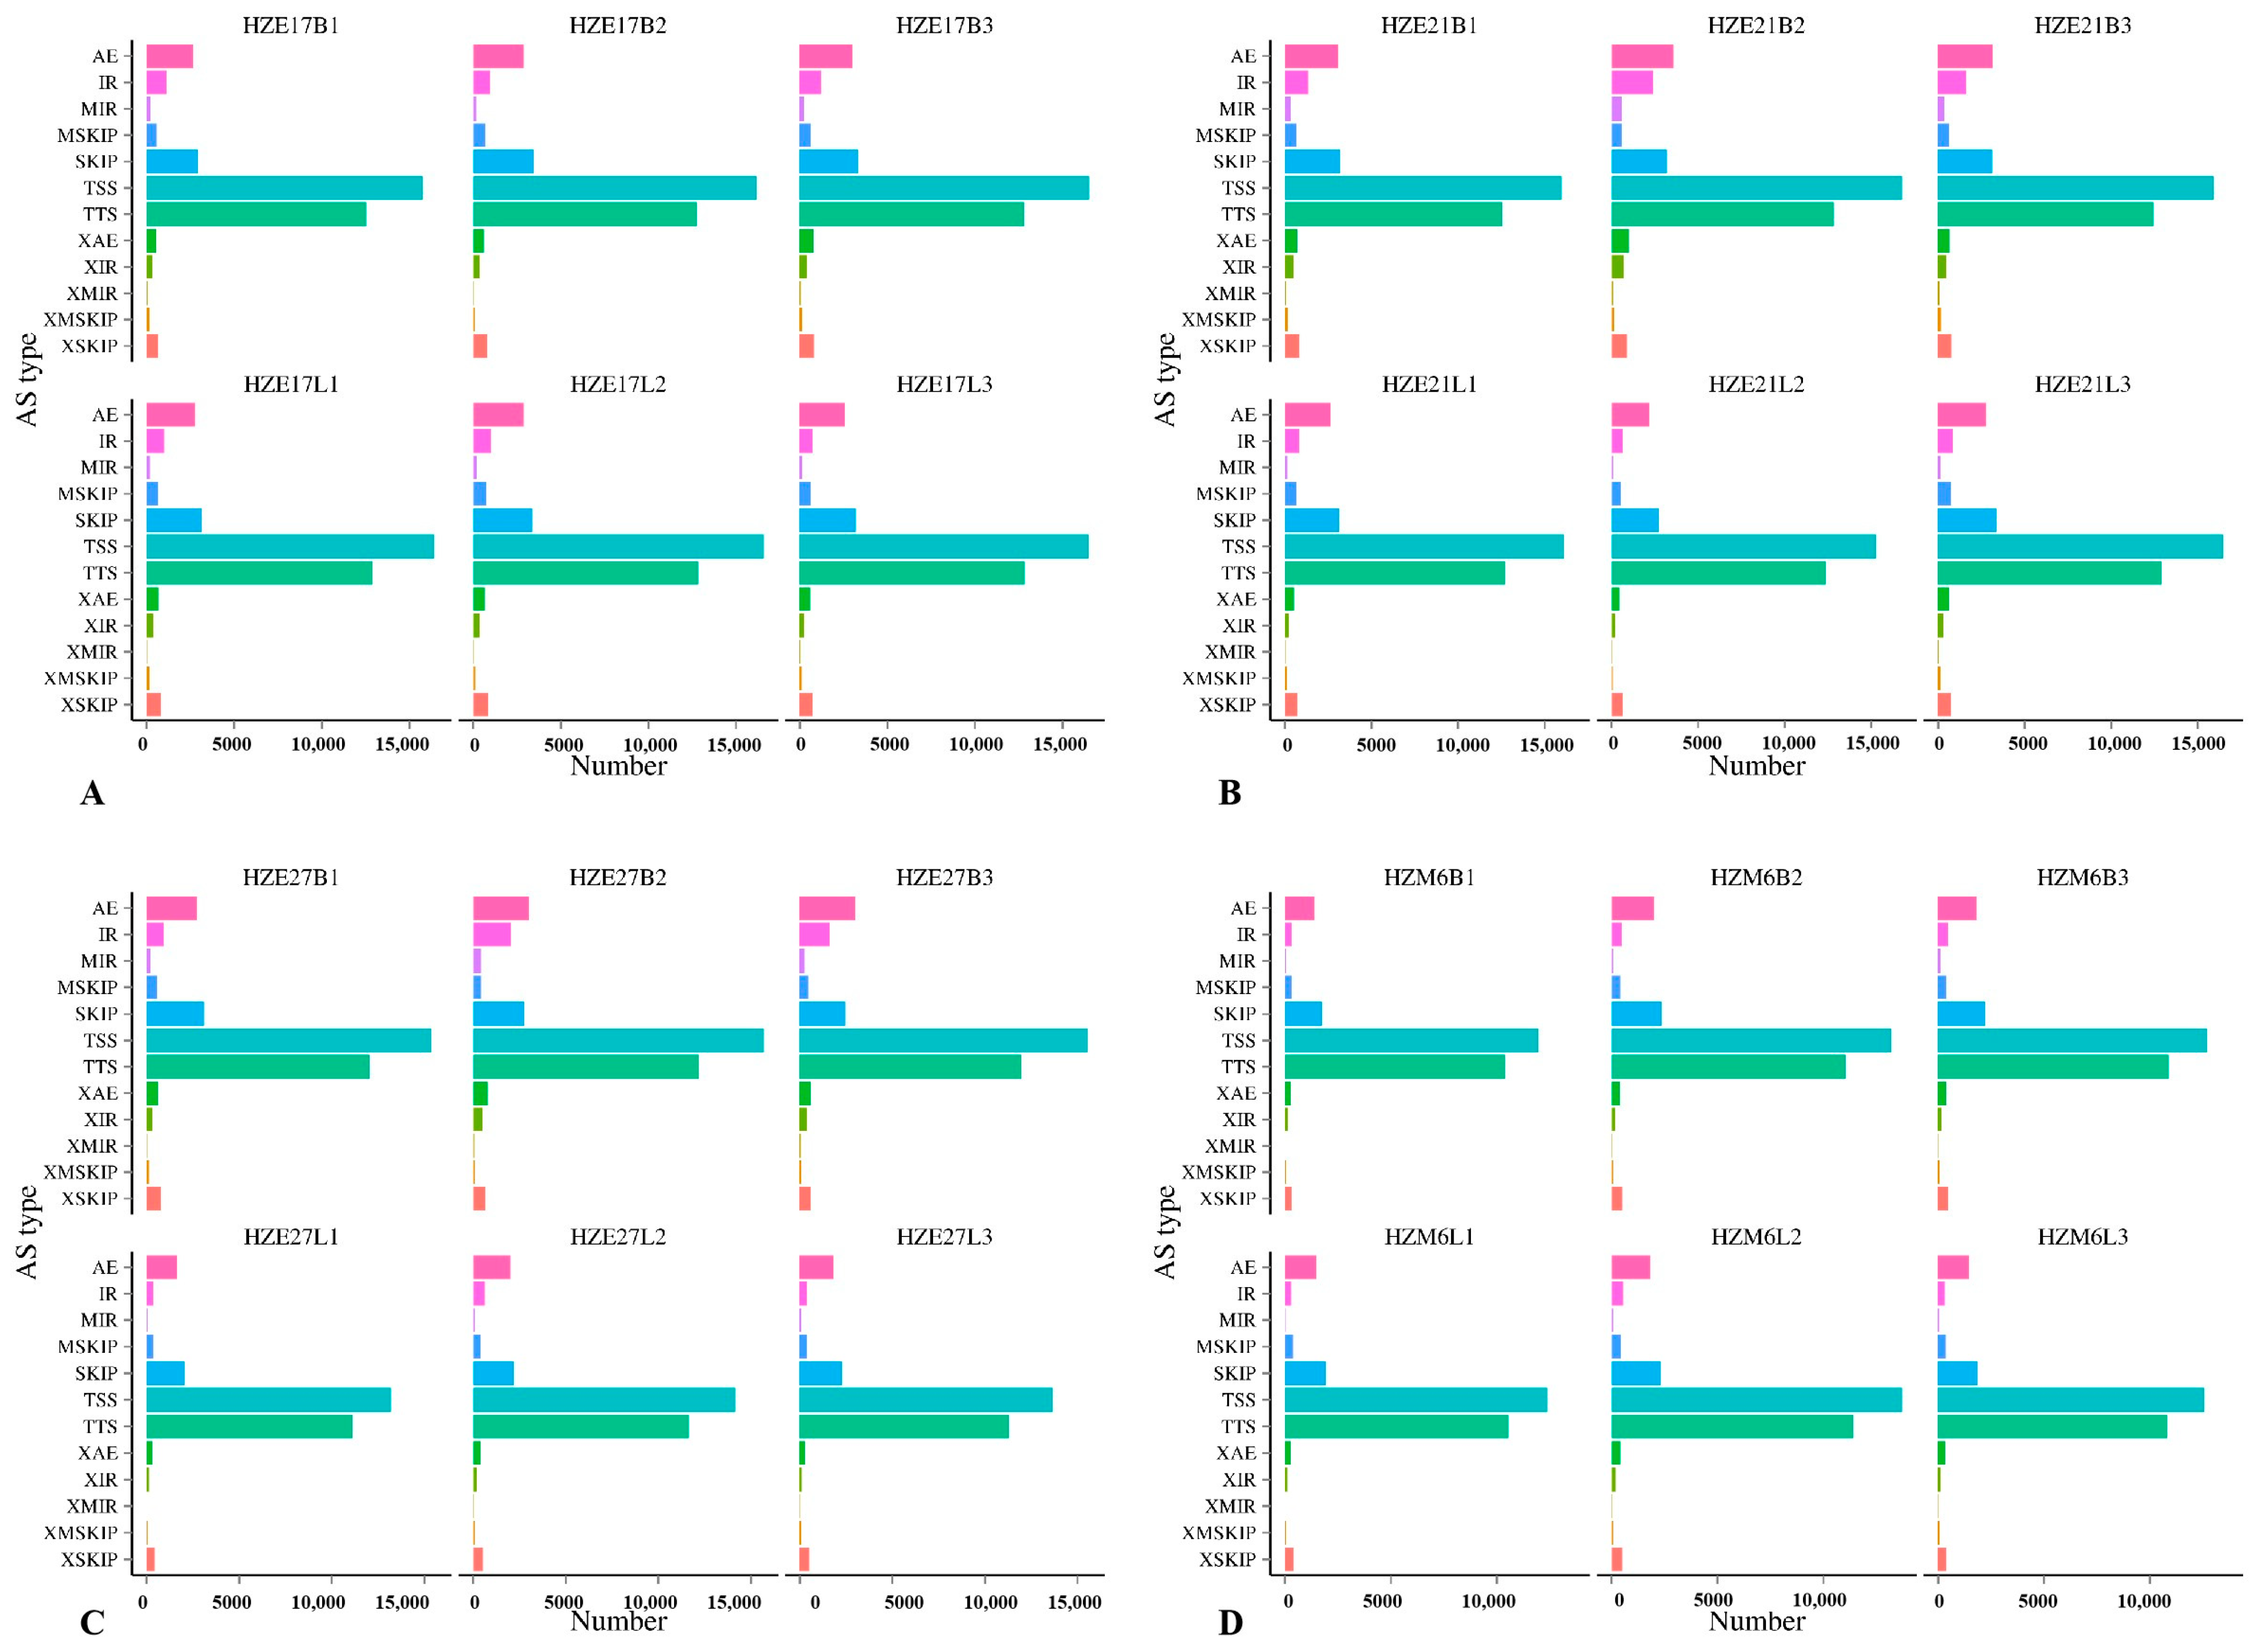
In skeletal muscle of Hanzhong Ma ducks at the embryonic day 17, 21, 27, and postnatal 6-months-old, the predicted number of AS were mainly concentrated in alternative 5′ first exon (transcription start site)-the first exon splicing (TSS) and alternative 3′ last exon (transcription terminal site)-the last exon splicing (TTS), indicating that TSS and TTS were the most common AS events in Hanzhong Ma ducks (Figure 2).
3.4. Gene Functional Annotation and Classification
Based on the sequence of Anas platyrhynchos genome, mapped reads were spliced by the StringTie software (https://0-ccb-jhu-edu.brum.beds.ac.uk/software/stringtie/index.shtml; Accessed on: 30 December 2019). In order to complement and improve the previous genome annotated information, these reads were compared with the Anas platyrhynchos genome annotated information to discover uncommented transcription regions and the new genes. Most notably, there were 292 to 2801 annotated DEGs in breast muscle and 304 to 1950 annotated DEGs in leg muscle from different databases (Table 4).
3.5. Analysis of Differential Expressed Genes
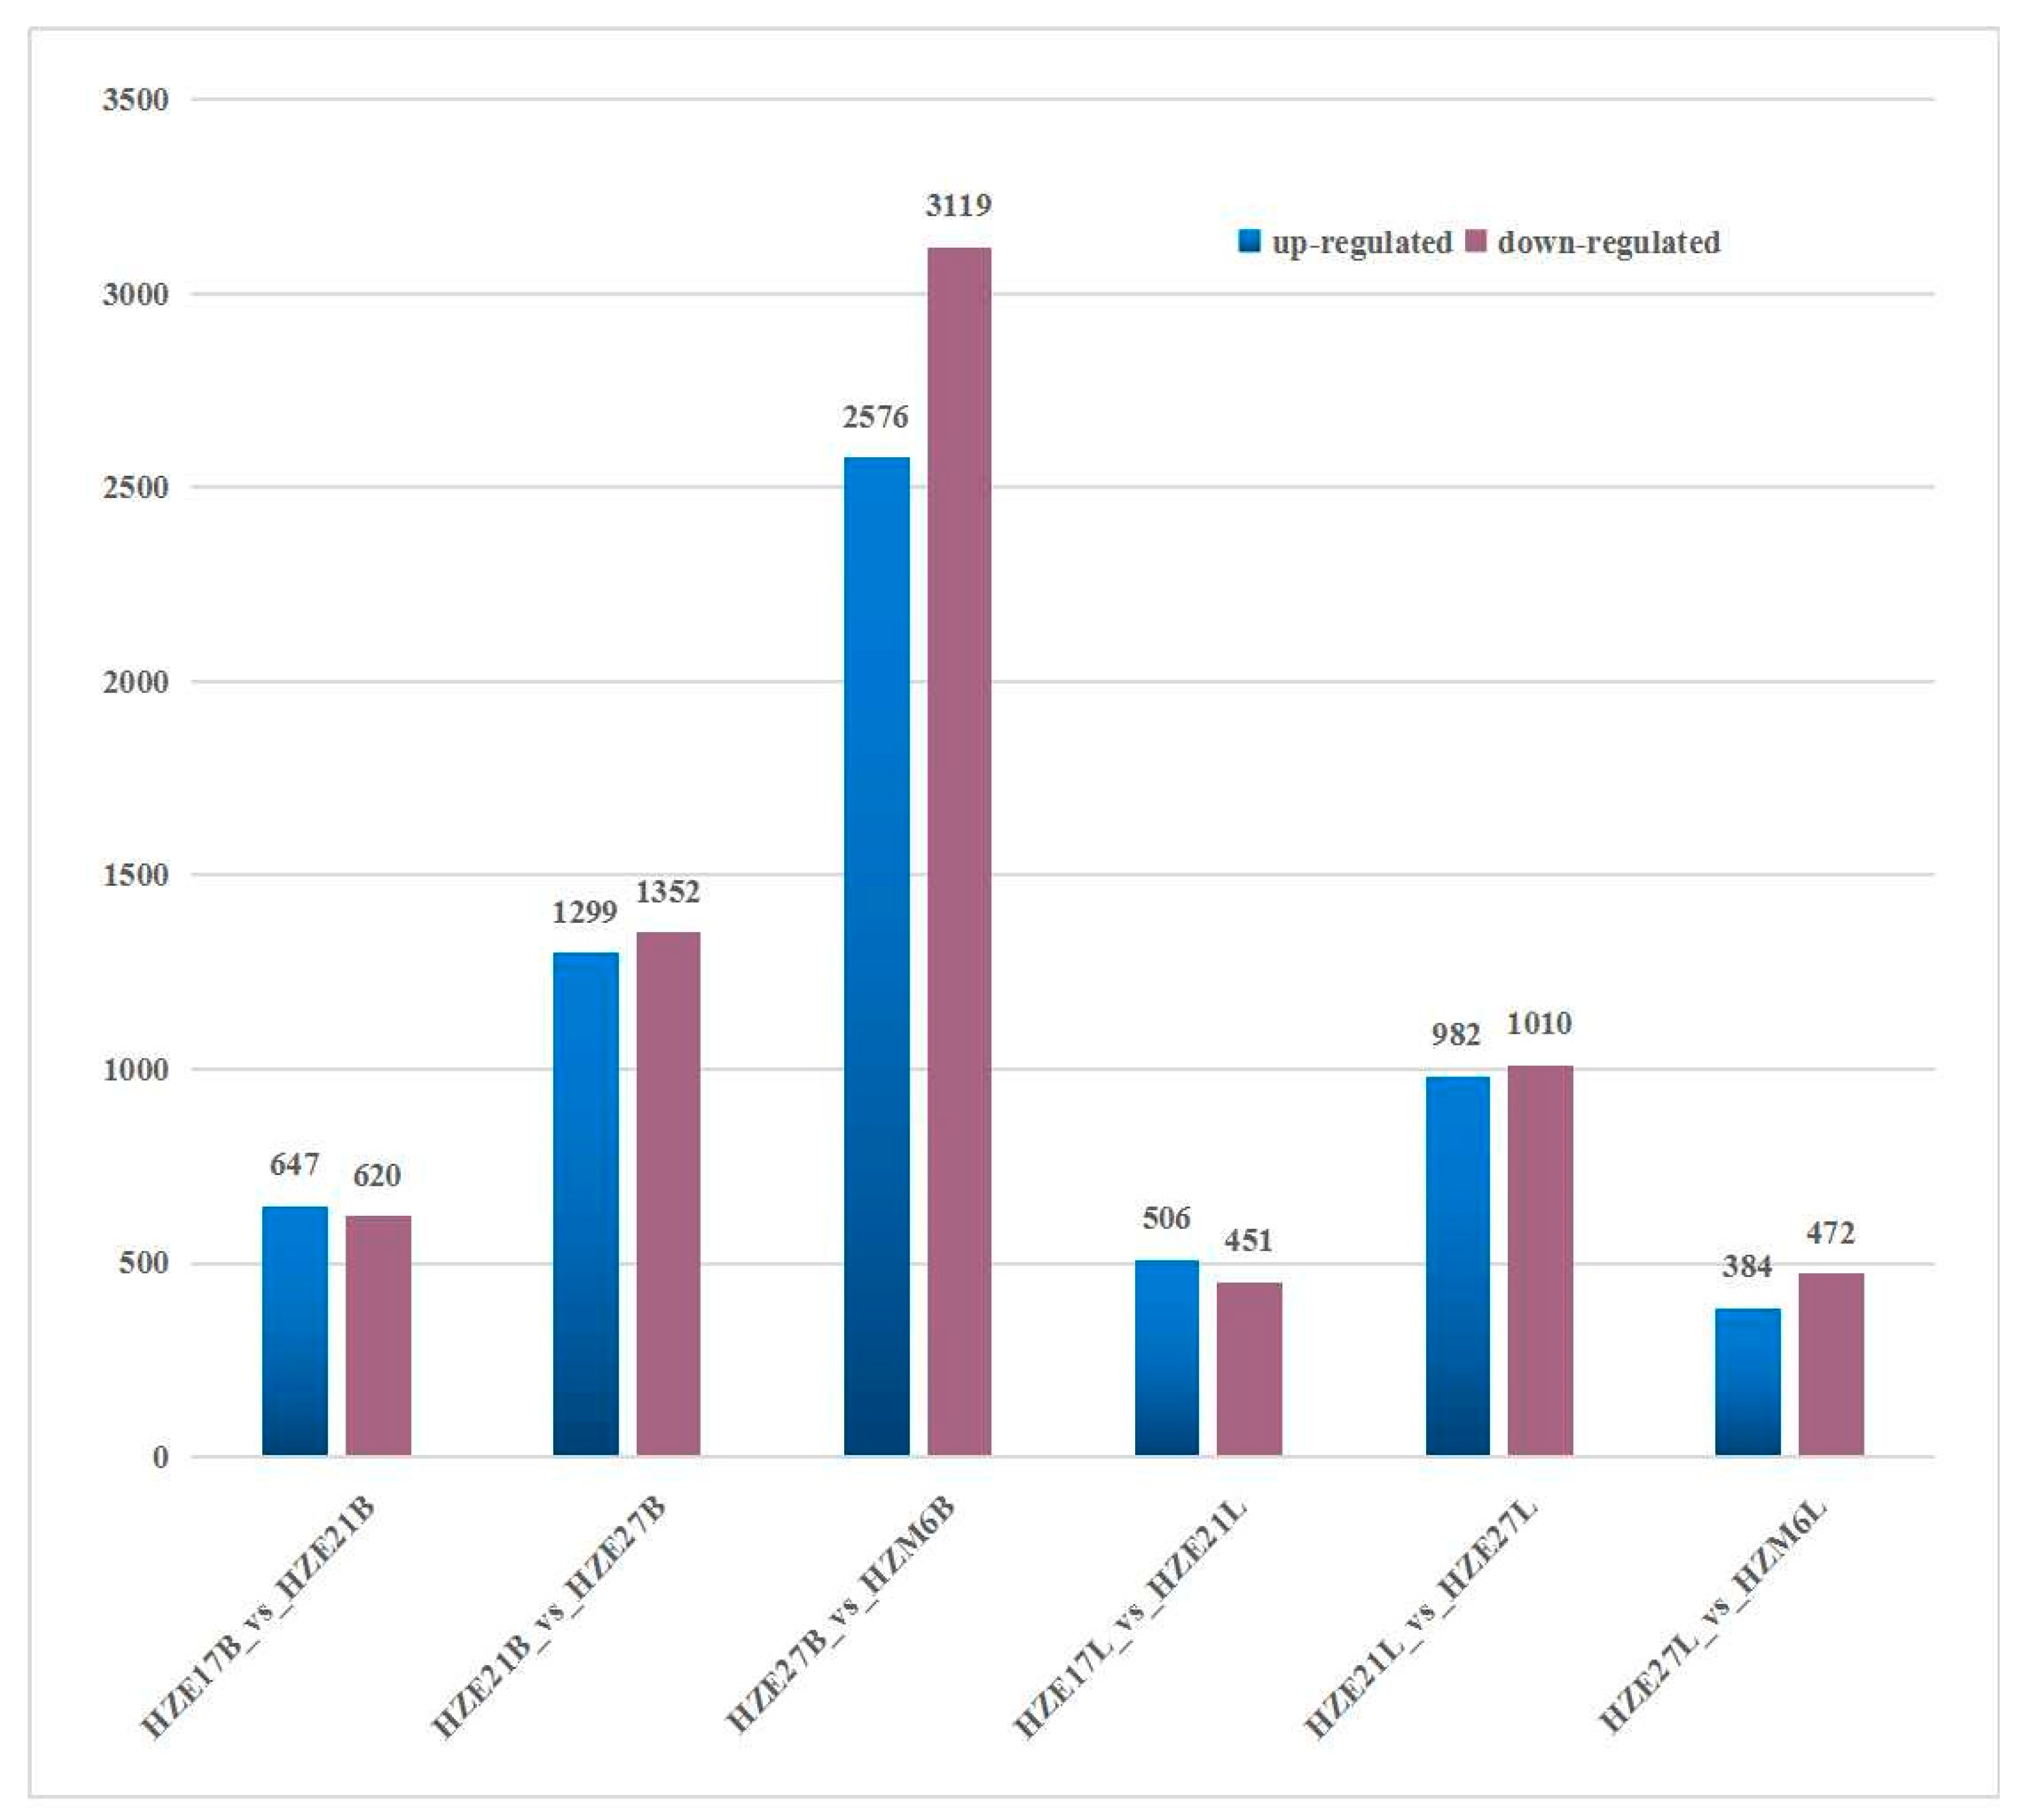
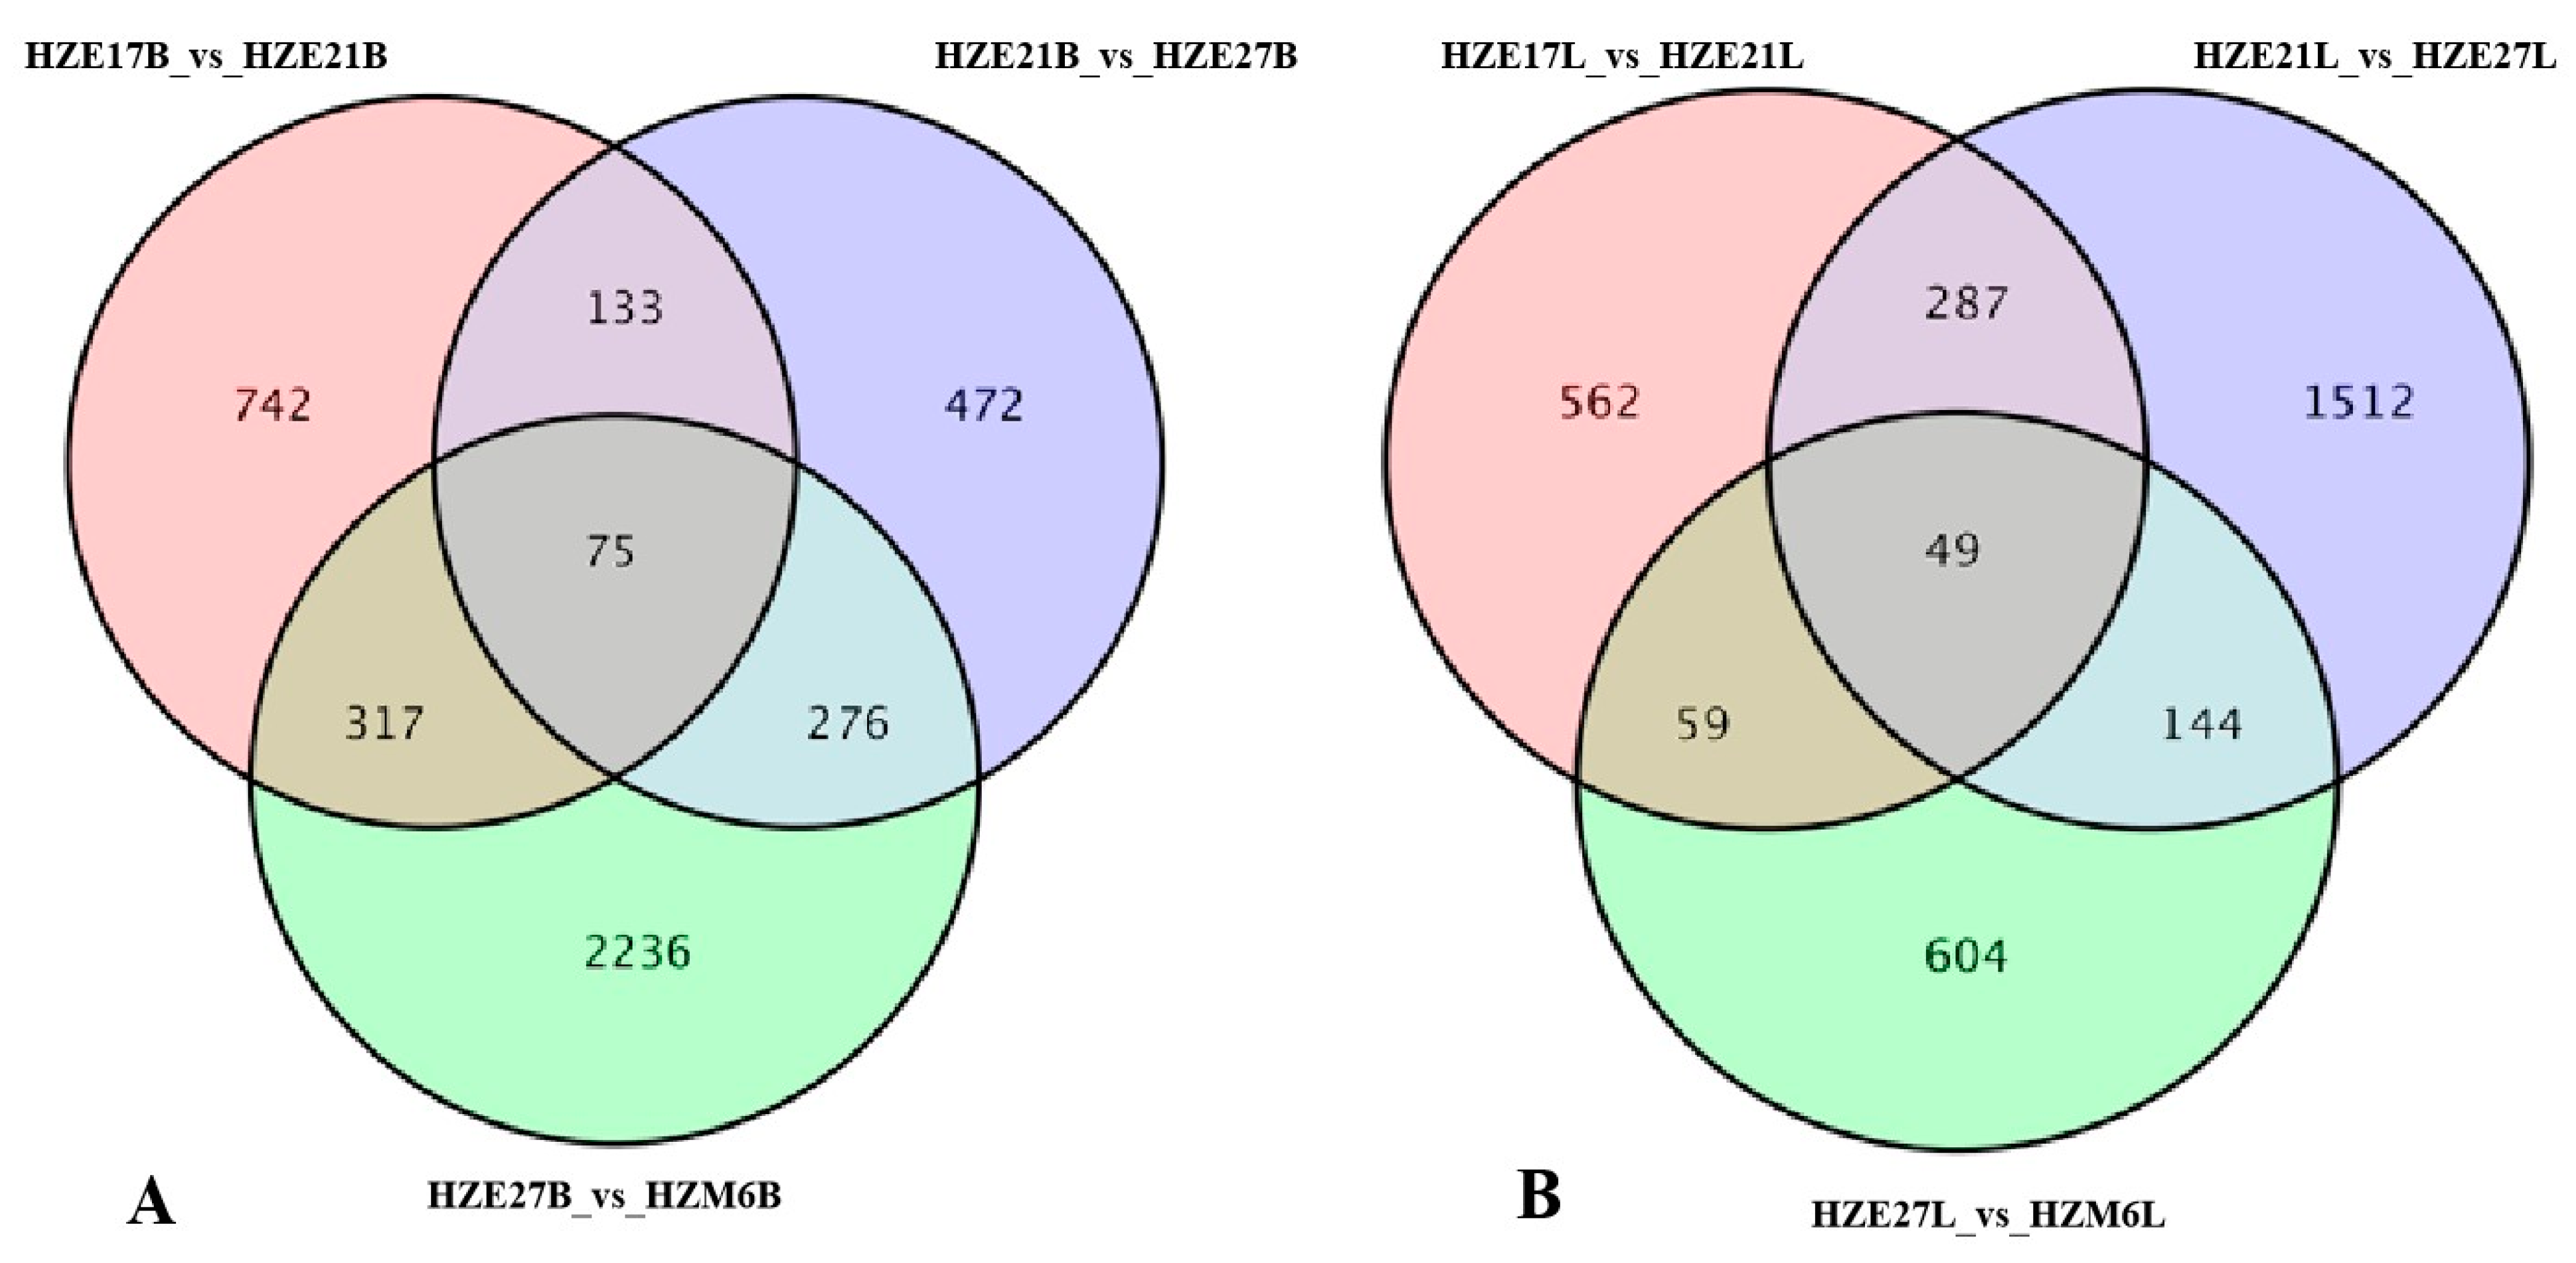
DEGs were identified by taking fold-change ≥ 2 and FDR < 0.01 as the cutoff. In the breast muscle of Hanzhong Ma ducks, a total of 1267 DEGs were detected, with 647 up-regulated genes and 620 down-regulated genes in HZE17B_vs_HZE21B. There were 2651 DEGs significantly differentially expressed in HZE21B_vs_HZE27B, which include 1299 up-regulated genes and 1352 down-regulated genes. Moreover, 5695 DEGs were identified in HZE27B_vs_HZM6B, among which 2576 were up-regulated genes and 3119 were down-regulated genes. In leg muscle, a total of 957 DEGs were found in HZE17L_vs_HZE21L, of which 506 were up-regulated genes and 451 were down-regulated genes. A total of 1992 DEGs were detected in HZE21L_vs_HZE27L, and the up-regulated genes were 982 and the down-regulated genes were 1010. In addition, 856 DEGs were discovered in HZE27L_vs_ HZM6L, and 384 DEGs were up-regulated genes and 472 DEGs were down-regulated genes (Figure 3). Notably, a total of 75 DEGs in breast muscle and 49 DEGs in leg muscle were co-expressed at all developmental points of comparison, respectively (Figure 4).
3.6. GO Annotation and KEGG Pathway Analysis
GO and KEGG analysis was performed to further understand the biological functions of the genes within the significant gene expression profiles. The DEGs were categorized into three main GO categories: biological process, cellular component, and molecular function (Figure 5). Results show that “myosin complex”, “muscle-tendon junction” and “myofibril” were significantly enriched in the cellular component category. As for the molecular function category, most DEGs were assigned to “extracellular matrix structural constituent”, “microtubule motor activity”, and “muscle alpha-actinin binding”. In the biological process, the DEGs were significantly enriched in “negative regulation of skeletal muscle tissue development”, “embryonic skeletal system morphogenesis”, and “regulation of skeletal muscle contraction” (Table S5). These RNA-Seq results reaffirmed the differential expression of several genes between skeletal muscles at different growth stages, such as CREBL2, RHEB, GDF6, SHISA2, and MYLK2. In addition, the genes ACTN3, RYR3, and STMN1, which play crucial roles in muscle development, were observed to be differentially expressed. The identified DEGs might function in transcriptional regulation of skeletal muscle development at different growth stages.
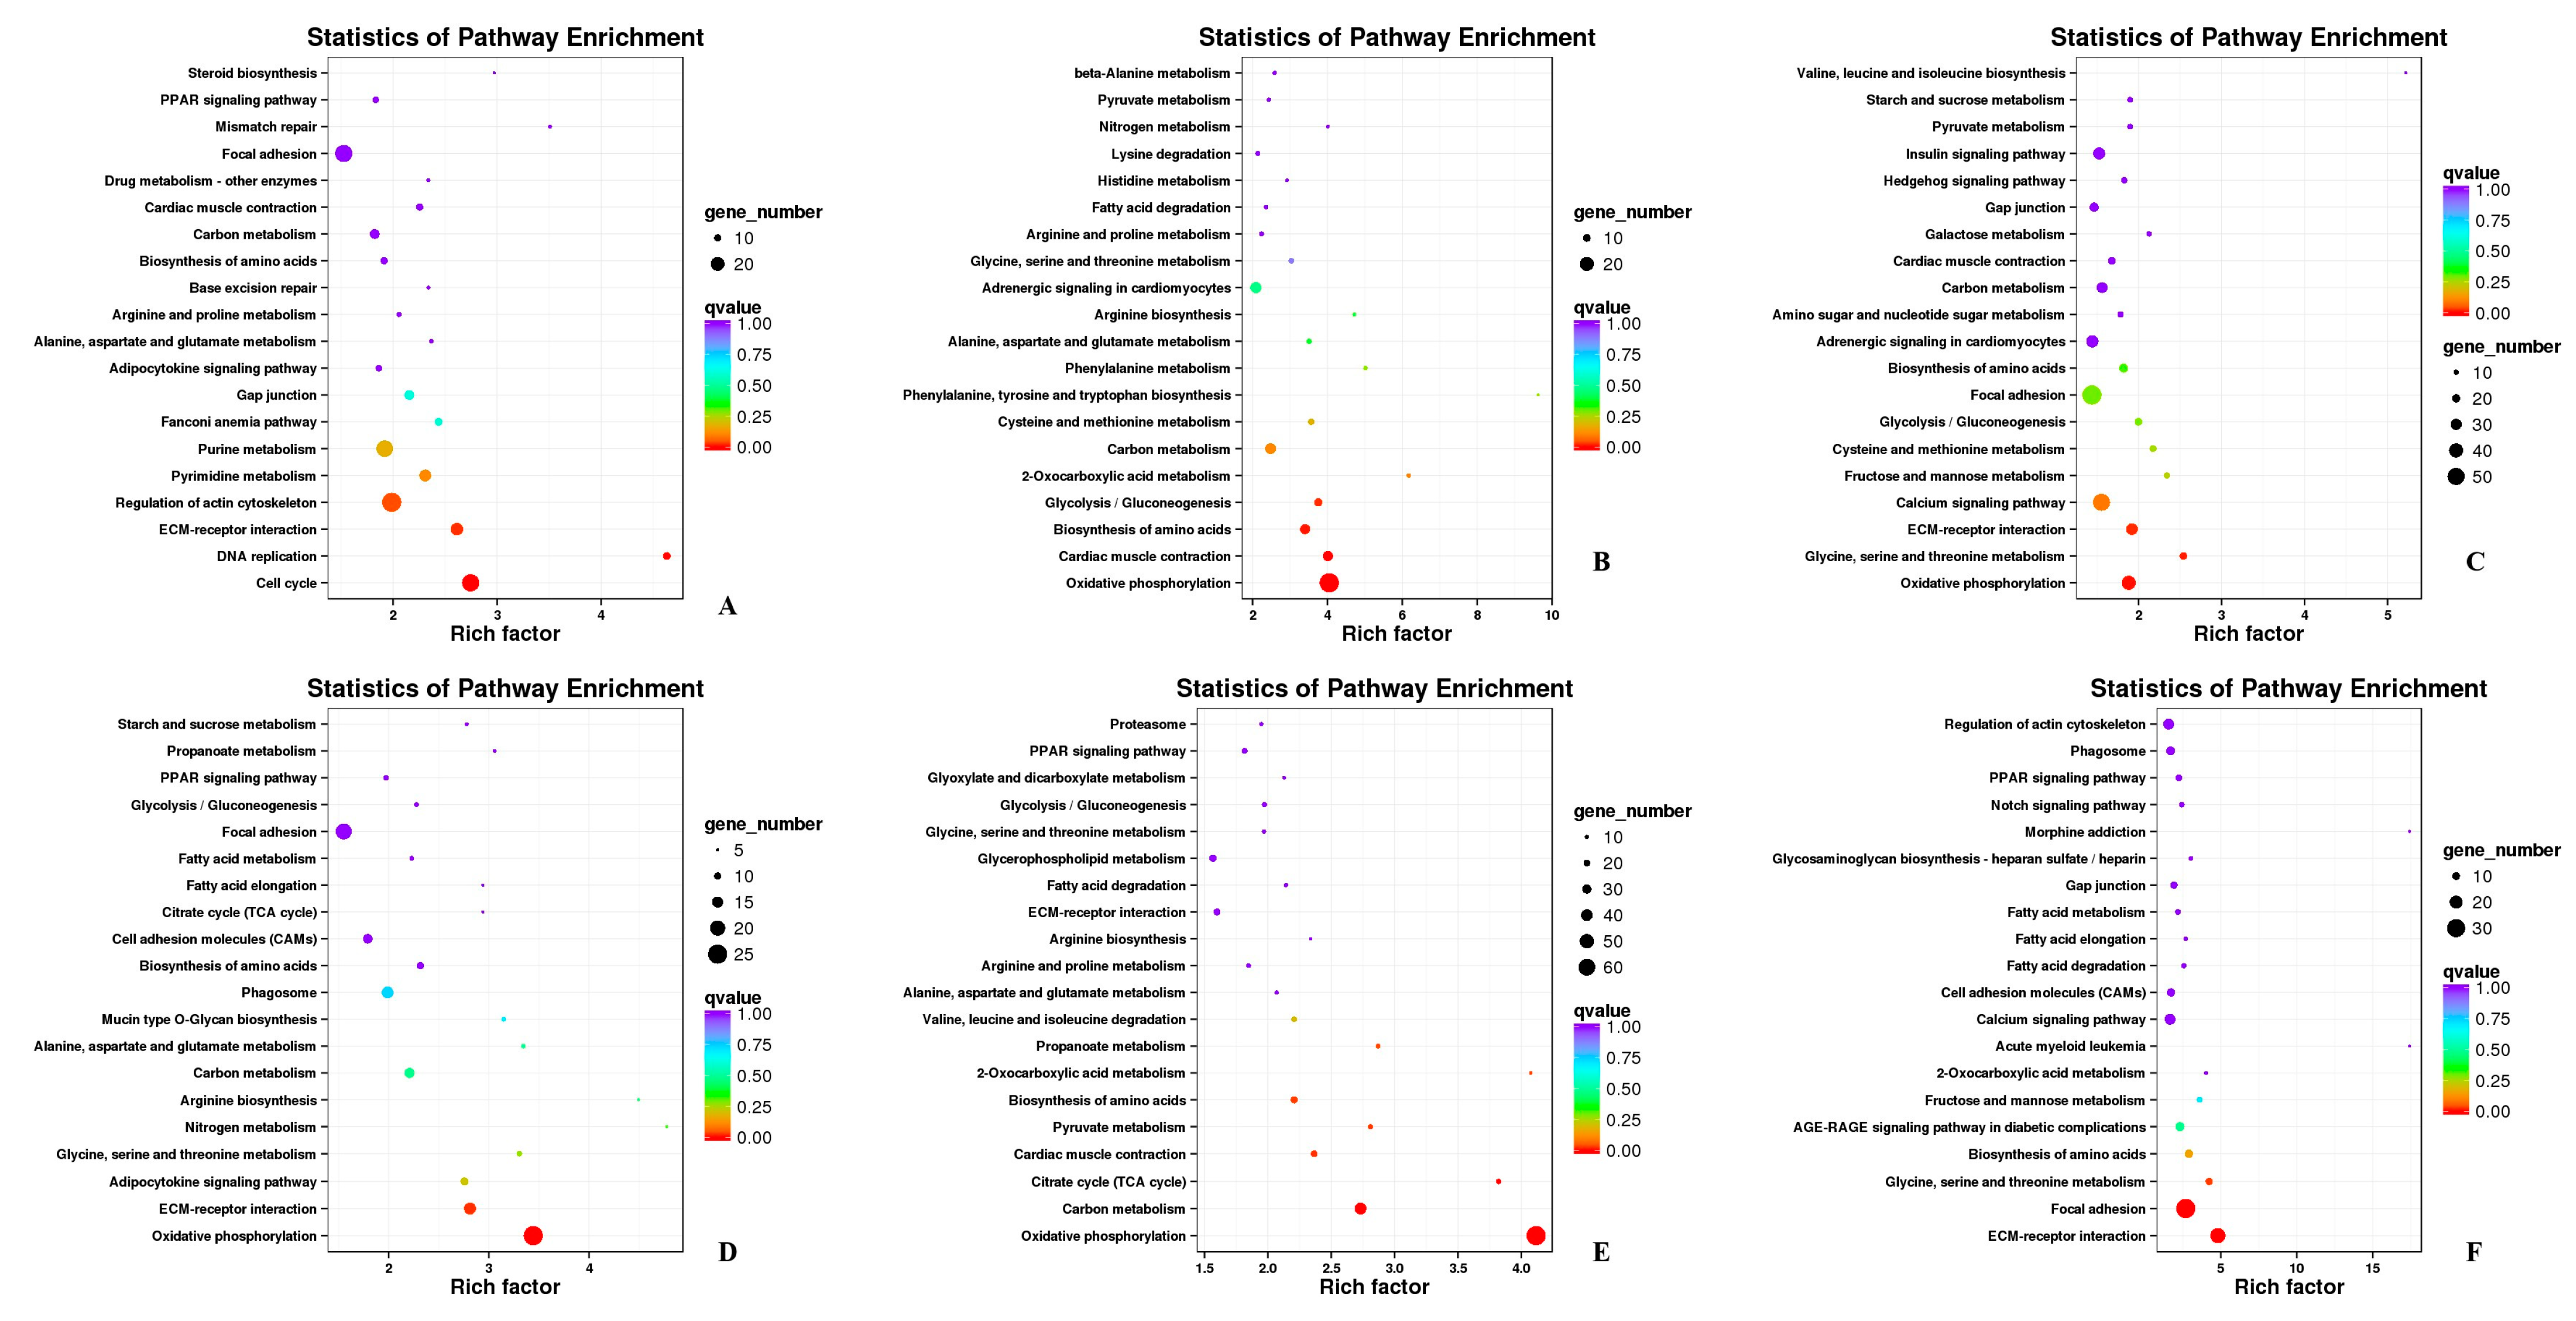
The KEGG pathways of DEGs were shown in Table S6. The enriched pathways included “regulation of actin cytoskeleton”, “oxidative phosphorylation”, “carbon metabolism”, “calcium signaling pathway”, “focal adhesion”, “ECM-receptor interaction”, and “MAPK signaling pathway”, in which “regulation of actin cytoskeleton”, “oxidative phosphorylation”, and “focal adhesion” were significantly enriched (Figure 6).
3.7. Validation of RNA-Seq Results
To validate the reliability of results from RNA-Seq, 6 DEGs (ERN2, D2HGDH, KLHL31, ALKBH4, SHISA2, and PIEZO2) were randomly selected to further examine using qPCR. All the selected DEGs showed concordant expression patterns between the RNA-Seq and qPCR results (Figure 7).
4. Discussion
Because meat yield directly determines the level of economic income, there has recently been great interest in achieving higher growth performance and better meat quality in livestock and poultry [19,20]. Muscle development is strictly regulated by related genes, transcriptional regulatory factors, or non-coding RNAs (lncRNA or circRNA) [21,22,23]. In this study, a transcriptome level analysis of mRNAs was performed in breast and leg muscles of female Hanzhong Ma ducks at four distinct stages, and a comprehensive understanding of the dynamic changes was obtained from the transcriptome during muscle development. The reason why we chose female ducks was that they account for the majority of duck farms, and the same sex can avoid errors in sequencing data. Transcriptomic sequencing data from breast and leg muscles of Hanzhong Ma ducks at all time points received 632,172,628 and 637,213,938 reads, respectively. The percentages of aligned reads to the Anas platyrhynchos genome were high, over 71.63% and 77.36%, respectively. This suggests that the sequencing data have high coverage and the cDNA libraries were created successfully. In gene functional annotation and classification, there were 292 to 2801 annotated DEGs in the breast muscle and 304 to 1950 annotated DEGs in the leg muscle from different databases, which can greatly supplement and improve the annotation information of the duck genome. The expression profiles of the genes chosen for qPCR verification were entirely consistent with the transcriptome results, indicating that the transcriptome data were valid.
4.1. Annotation and Classification of SNP/InDel in Skeletal Muscle Developmental Process
SNP is a kind of efficient genetic marker based upon the variability at the nucleotide level and it has been widely used in genetic studies and breeding applications in animal species [24,25]. SNPs are more abundant in organisms, which have greater stability over generations and are more accurately genotyped. InDel mutation is defined by the addition or loss of one or more nucleotides of a DNA sequence throughout the genome and it contains valuable phylogenetic information. InDels in the coding regions of a gene can either cause frameshifts or amino acid insertions/deletions, which may affect protein function [26]. Therefore, it is meaningful to study the roles of SNPs and InDels in duck skeletal muscle development.
Based on the alignment of the reads to the Anas platyrhynchos genome, the potential SNP sites and the InDels were identified by using the GATK software. A total of 56,327 to 164,499 SNPs in breast muscle and 59,750 to 142,086 SNPs in leg muscle were detected. The first four changes were G->A, followed by C->T, A->G, and T->C. The annotation results of SNP were mainly “INTRON”, “SYNONYMOUS_CODING”, and “UTR_3_PRIME”. It is helpful for us to understand the most common base changes and the types of SNP annotations in duck skeletal muscle, which can be used as important molecular markers in the genetic breeding of Hanzhong Ma duck. Besides, the types of InDel annotations in skeletal muscle of Hanzhong Ma duck were “INTRON”, “UTR_3_PRIME”, and “DOWNSTREAM”, which may play an important role in the evaluation of duck economic traits. Through continued research, the findings of these SNPs and InDels may reveal genomic markers controlling genetic variation in economically important duck muscle phenotypes by improving our knowledge of the underlying trait biology.
4.2. AS Events in Skeletal Muscle Developmental Process
AS is a tightly regulated biological process and it is the main source of transcriptome and proteome diversity, which largely contributes to the complexity of eukaryotes [27]. AS of eukaryotic pre-mRNA is an important mechanism for regulating tissue- or development-specific gene expression [28], and it greatly expands the coding capacities of genetic information. By using different splicing sites, two or more mRNAs are generated from the same pre-mRNA, that is, many varied proteins are produced from a single gene. The resulting mRNAs have distinct regulatory functions in the cell, such as localization, stability, and translational efficiency [29]. Therefore, AS plays an important role in the regulatory mechanism and functional properties of eukaryotic organisms [30]. Fiszbein A et al. found that AS played a role in myogenic differentiation [31]. At present, there are few functional studies about the AS events in duck at different growth stages. In this study, the TSS and TTS of the AS events were the most (>10,000) in skeletal muscle at embryonic day 17, 21, 27, and at postnatal 6-month-old, suggesting that they are the most common AS events in skeletal muscle of Hanzhong Ma duck. The identification of AS events will contribute to a better understanding of the regulatory mechanisms during the duck skeletal muscle myogenesis.
4.3. DEGs Analyzed at All Time Points
Differential gene expression is considered to be the main cause of genetic variation in animal muscle development, indicating that the regulation mechanism of muscle development may have changed. Xue Q et al. identified the candidate genes involved in the muscle growth of chicken and found that MYOD1, GH, IGF2BP2, IGFBP3, SMYD1, CEBPB, FGF2, and IGFBP5 were well known to be related to chicken growth [7]. Ayuso M et al. investigated the gene expression and transcriptional regulation of pigs at two developmental stages, several genes, such as SIM1, PVALB, MEFs, TCF7L2, FOXO1, PVALB, KLF1, or IRF2 were identified, which were involved in muscle tissues development [32]. According to the DEGs of Hanzhong duck skeletal muscle at different growth stages, several genes that may affect the development of skeletal muscle were identified, such as CREBL2, RHEB, GDF6, SHISA2, MYLK2, ACTN3, RYR3, and STMN1. In addition, some studies have shown that these regulatory transcription factors interacted with each other in regulating muscle development.
The cAMP-response element-binding protein (CREB), a direct downstream target for AMPK [33], participates in metabolic regulation [34]. Many growth factors and inflammatory signals induce the activation and expression of CREB and then mediate the transcription of various genes containing cAMP response elements [35]. Pugazhenthi S et al. indicated that IGFI induced anti-apoptotic protein Bcl-2 promoter activity through CREB. Similarly, CREB-like 2 (CREBL2) is also a regulator of cellular metabolism [36]. Tiebe M et al. found that CREBL2 regulated cell metabolism of C2C12 myoblasts [37]. Ras homolog enriched in the brain (RHEB), a monomeric protein with a molecular weight of about 21 kDa, is broadly expressed in human and animal tissues [38]. It is well known that rapamycin complex 1 (mTORC1) is a major regulator of cell growth and metabolism, and the small G protein RHEB activates mTORC1 in response to growth factor signals [39,40]. Besides, the Rheb-mTOR/Raptor pathway negatively regulates myogenic differentiation by inhibiting the IRS1-PI3K-AKT signaling pathway [41]. Under the induction of amino acids and insulin, the formation of the RHEB-mTOR complex in the skeletal muscle of newborn piglets may be related to the activation of mTORC1 that regulates skeletal muscle protein synthesis [42]. MacLea KS et al. suggested that RHEB regulated the development of skeletal muscle in the blackback land crab [43]. Growth/differentiation factors 6 (GDF6), also known as bone morphogenetic protein (BMP13) and cartilage-derived morphogenetic protein (CDMP-2), forms part of the transforming growth factor-β superfamily and is highly expressed during embryogenesis [44]. GDF6 is highly conserved in vertebrates and has been shown to play a key role in limb joint formation and chondrogenesis. It is expressed in many mesenchymal derivatives, such as the tendon and cartilage, but is less expressed in the intestine, skeletal muscle, and placenta. Mikic B et al. demonstrated that GDF6 without mutation was associated with a significant decrease of collagen content in the tail tendon of 4-week-old male mice [45]. Shisa family member 2 (SHISA2) antagonizes FGF and Wnt signaling [46]. SHISA2 promotes the maturation and transition of somitic precursors in Xenopus laevis embryos by individually inhibiting Wnt and FGF signal transduction [47]. Similarly, SHISA2 affects chicken embryo development by regulating FGF and Wnt signaling [48], and its expression is regulated by Notch signal [49]. The deletion of SHISA2 inhibits the fusion of myoblasts without affecting the proliferation, and overexpression of SHISA2 inhibits its proliferation and promoted premature fusion.
Myosin light chain kinase 2 (MYLK2) encodes a calcium/calmodulin-dependent serine/threonine kinase (myosin light chain kinase, MLCK), which is expressed in skeletal muscle and cardiac muscle [50] and activates the actin contraction with myosin. With the increase of local Ca2+ concentrations, the sarcoplasmic reticulum releases large amounts of Ca2+, which binds to troponin C followed by myosin-actin cross-bridge formation. In this process, MLCK enhances the peak tension of skeletal muscle, as well as the force and rate of cross-bridge recruitment of cardiomyocytes [51,52,53]. Zhang XM et al. revealed that MYLK2 played a vital role in regulating distinct early porcine embryonic myogenic processes between Wuzhishan and Landrace pigs [54]. ACTNs (α-actinins) are widely expressed cytoskeleton proteins that cross-link actin filaments at the adherens junctions in epithelial and focal adhesions at the leading edge of migrating cells [55,56], and play a key role in the maintenance and regulation of the cytoskeleton. In mammalian cells, there are four kinds of ACTNs, which are the components of all three kinds of stress fibers (ventral stress fibers, dorsal stress fibers, and transverse arcs) [57,58]. ACTN3 is a prominent actin filament associated protein that is expressed in skeletal muscle [59], and its function is to maintain the microfilament spacing at the Z-disc. Mice lacking ACTN3 activity show a shift to aerobic metabolism, resulting in efficient muscle function and increased endurance [60]. Holterhoff CK et al. suggested that the variation of ACTN3 expression may promote the physiological diversity of vertebrate muscle function [61]. RyR (ryanodine receptor), a Ca2+ release channel in the sarcoplasmic reticulum in vertebrate skeletal muscle, plays an important role in excitation-contraction coupling [62]. RYR3 is expressed at low levels in the brain, smooth muscle, and slow-twitch skeletal muscle [63]. The expression of RYR3 is related to the augmented spontaneous Ca2+ activity in muscle fibers and cultured myotubes, and it is also associated with increased frequency and size of Ca2+ sparks [64,65]. Perni S et al. found that RYR3 may play a preferred role in physiological processes of CICR (Ca2+-induced Ca2+ release) in skeletal muscle and some other tissues [66]. In avian skeletal muscle, RYR1 and RYR3 are expressed simultaneously [67]. STMN1 (Stathmin1), a cytosolic phosphoprotein, is involved in regulating the microtubule dynamics in response to the cell’s need [68] and plays an important role in mitotic spindle formation and cell mitosis [69]. The expression of STMN1 is strongly regulated during tissue development and maturation, and it is considered to be a general relay integrating diverse intracellular signaling pathways [70]. STMN1 has been shown to significantly reduce the SMA (spinal muscular atrophy) phenotype independent of restoring SMN protein [71].
All these studies have identified that the DEGs have important functions in skeletal muscle development. Therefore, the differential expression of genes that were in the breast and leg muscles of Hanzhong Ma ducks, may have an important regulatory effect on the mechanism of skeletal muscle development.
4.4. Analysis of GO and KEGG Pathway
The KEGG pathways play crucial roles in muscle growth and development in animals. Wu PF et al. carried out a transcriptome study on the breast muscles of Jinghai yellow chickens and they found that extracellular matrix (ECM)-receptor interaction, the mitogen-activated protein kinase (MAPK) signaling pathway, and focal adhesion were the most enriched for the DEGs in KEGG pathway enrichment [72]. Zhang ZR et al. also found that the ECM-receptor interaction, MAPK signaling pathway, and focal adhesion, were the most enriched DEGs in breast muscle of chickens [15]. Zhao YQ et al. found that focal adhesion, protein digestion and absorption, GABAergic synapse, axon guidance, ECM-receptor interaction, MAPK signaling pathway, arginine, and proline metabolism were closely related to skeletal muscle of Tongcheng pigs, while oxidative phosphorylation, Huntington’s disease, ribosome biogenesis in eukaryotes, metabolic pathways, Alzheimer’s disease, glycolysis/gluconeogenesis, and proteasome were found to be more associated with the DEGs in skeletal muscle of Yorkshire pigs at developmental stages [73]. The biological processes categories in this study, including “negative regulation of skeletal muscle tissue development”, “embryonic skeletal system morphogenesis”, and “regulation of skeletal muscle contraction”, were significantly regulated by the DEGs, indicating that these DEGs played a key role in regulating duck skeletal muscle development at different stages. KEGG pathways, including regulation of actin cytoskeleton, oxidative phosphorylation, and focal adhesion were confirmed to be involved in the skeletal muscle development of the Hanzhong Ma duck.
Focal adhesions (FAs) are dynamic macromolecular structures based on large integrin, which connect the extracellular matrix (ECM) with the intracellular actin cytoskeleton. The FA components include the linkage between the integrin receptor and the actin cytoskeleton, which determine the dynamics of FAs (the formation, maturation, and disassembly of FAs) and the organization of the cytoskeleton [74]. FAs provide traction and transmit signals that drive cell migration by expanding and altering its composition, which is crucial for a variety of biological processes, including development, wound healing, and cancer metastasis. FA-related signaling networks dynamically regulate the strength of the linkage between integrin and actin and control the organization of the actin cytoskeleton [75,76]. Focal adhesion kinase (FAK) transmits two-way signals at FAs between the ECM and the intracellular milieu, and the FAK complex plays a signal role in the triggering of adaptive changes in the fiber. Activation of FAK can initiate intracellular signal transduction cascade, including those involved in the mitogen-activated protein kinase (MAPK) effector cascades and cytoskeleton remodeling, which in turn regulate cell migration, growth, and differentiation [77]. Besides, FAK is highly overexpressed in hypertrophied skeletal muscle [78], which is activated by integrin-mediated cell adhesion to the ECM and stimulates the activity of a variety of intracellular signaling pathways, such as paxillin and phosphatidylinositol-3 kinase (PI3K) pathways. Quach NL et al. found that FAK signaling was essential for both costamerogenesis and myofibrillogenesis in differentiated skeletal muscle cells in vitro [79]. Wang D et al. showed that FAK and paxillin promoted migration and adhesion of swine skeletal muscle satellite cells to fibronectin [80]. Therefore, FAs may play a key role in duck muscle development in this study.
Cell motility plays a central role in many biological processes, such as embryonic development, tissue repair, immune response, and cancer metastasis. Motility requires precise integration and regulation of various cellular processes, including dynamic cytoskeleton remodeling [81,82]. The cytoskeleton is a dynamic filamentous system containing actin filaments and microtubules, and it is an integral part of skeletal muscle structure [83]. The contraction of skeletal muscle depends on the release of Ca2+ [84]. Johnson BD et al. found that hormones and neurotransmitters may interact with the cytoskeleton in a key way to regulate Ca2+ channel activity through the PKA signal transduction pathway [85]. The actin cytoskeleton forms a very dynamic structural network, which is constantly remodeled in eukaryotic cells to control and coordinate a variety of cellular processes, including the establishment and maintenance of cell polarity, polarized cell migration, cell adhesion, cytokinesis, and intracellular transport [86,87]. In this study, the function of the actin cytoskeleton may be essential in the development of duck skeletal muscle.
Oxidative phosphorylation (OXPHOS) is the main process responsible for ATP production in most animal cells. Skeletal muscle is a kind of tissue with high energy requirement, and OXPHOS plays an important role in skeletal muscle energy homeostasis under various physiological conditions [88,89,90]. Skeletal myoblasts specifically change from a highly glycolytic state to mainly dependent on OXPHOS upon differentiation [91]. In skeletal muscle, slow-twitch fibers (type Ⅰ) and fast-twitch fibers (type Ⅱa) are rich in mitochondria, and their ATP supply mainly depends on OXPHOS, while fast-twitch fibers (type Ⅱb) lack mitochondria and are mainly produced by effective glycolytic ATP [92,93]. Ca2+ is believed to regulate mitochondrial OXPHOS, which helps to maintain cell energy homeostasis [94]. Besides, Vinnakota KC et al. found that Ca2+ can regulate OXPHOS of skeletal muscle mitochondria [95]. Therefore, during the embryonic stages, the development of duck skeletal muscle requires a large amount of energy supply, and OXPHOS may be an important energy supply pathway.
5. Conclusions
In this study, transcriptome sequencing of Hanzhong Ma duck skeletal muscle at different growth stages was carried out. A large number of SNPs, InDels, and AS events were detected across all the stages. Several genes that may be important candidate genes involved in skeletal muscle development were screened and discussed, such as CREBL2, RHEB, GDF6, SHISA2, MYLK2, ACTN3, RYR3, and STMN1. Besides, the key regulatory pathways, namely, regulation of actin cytoskeleton, oxidative phosphorylation, and focal adhesion, played a crucial regulatory role in skeletal muscle development. This study is helpful for understanding the genetic architecture of the Hanzhong Ma duck transcriptome and provides a useful resource and markers for functional genomics research in the future. At the same time, the results may help us understand the developmental molecular process of skeletal muscle, which is an economically important carcass trait for duck production.
Supplementary Materials
The following are available online at https://0-www-mdpi-com.brum.beds.ac.uk/2218-273X/11/2/315/s1, Table S1. The feed composition of duck; Table S2. The concentrations and RINs of sample RNA; Table S3. Statistics of sequence comparison between sample sequencing data and Anas platyrhynchos genome; Table S4. SNPs from breast and leg muscle of Hanzhong Ma duck; Table S5. The most enriched GO terms related to muscle development; Table S6. Top 5 in KEGG enrichment.
Author Contributions
Conceptualization: Z.H. and X.L.; laboratory experiments: L.G. and H.Z.; bioinformatic analyses and biological interpretation: Z.H. and J.C.; writing-original draft preparation: Z.H. and J.Z. All authors have read and agreed to the published version of the manuscript.
Funding
This study was supported by funds from the National Waterfowl Industrial Technology System of China (CARS-42-2).
Institutional Review Board Statement
Animal care, slaughter, and experimental procedures were approved by the Institutional Animal Care and Institutional Ethics Committee of Northwest A&F University (ethic code: #0330/2019), and all efforts were made to minimize suffering.
Informed Consent Statement
Not applicable.
Data Availability Statement
The datasets generated for this study can be found in the NCBI SRA. The Submission of Hanzhong Ma duck: SUB8201145 and SUB8202437, Bioproject #PRJNA665331 and Biosamples #SAMN16251816-SAMN16251827 (Breast muscle); Bioproject #PRJNA665334 and Biosamples #SAMN16251828-SAMN16251839 (Leg muscle).
Conflicts of Interest
The authors declare no conflict of interest.
References
- Mitchell, P.O.; Mills, S.T.; Pavlath, G.K. Calcineurin differentially regulates maintenance and, growth of phenotypically distinct muscles. Am. J. Physiol. Cell. Physiol. 2002, 282, C984–C992. [Google Scholar] [CrossRef] [Green Version]
- Guller, I.; Russell, A.P. MicroRNAs in skeletal muscle: Their role and regulation in development, disease and function. J. Physiol. 2010, 588, 4075–4087. [Google Scholar] [CrossRef] [PubMed] [Green Version]
- Bi, P.P.; Ramirez-Martinez, A.; Li, H.; Cannavino, J.; McAnally, J.R.; Shelton, J.M.; Sánchez-Ortiz, E.; Bassel-Duby, R.; Olson, E.N. Control of muscle formation by the fusogenic micropeptide myomixer. Science 2017, 356, 323–327. [Google Scholar] [CrossRef] [Green Version]
- Velleman, S.G. Muscle development in the embryo and hatchling. Poult. Sci. 2007, 86, 1050–1054. [Google Scholar] [CrossRef]
- Tang, Z.L.; Yang, Y.L.; Wang, Z.S.; Zhao, S.P.; Mu, Y.L.; Li, K. Integrated analysis of miRNA and mRNA paired expression profiling of prenatal skeletal muscle development in three genotype pigs. Sci. Rep. 2015, 5, 15544. [Google Scholar] [CrossRef] [PubMed] [Green Version]
- Neguembor, M.V.; Jothi, M.; Gabellini, D. Long noncoding RNAs, emerging players in muscle differentiation and disease. Skelet. Muscle 2014, 4, 8. [Google Scholar] [CrossRef] [Green Version]
- Xue, Q.; Zhang, G.X.; Li, T.T.; Ling, J.J.; Zhang, X.Q.; Wang, J.Y. Transcriptomic profile of leg muscle during early growth in chicken. PLoS ONE 2017, 12, e0173824. [Google Scholar] [CrossRef]
- Wu, P.F.; Dai, G.J.; Chen, F.X.; Chen, L.; Zhang, T.; Xie, K.Z.; Wang, J.Y.; Zhang, G.X. Transcriptome profile analysis of leg muscle tissues between slow- and fast-growing chickens. PLoS ONE 2018, 13, e0206131. [Google Scholar] [CrossRef] [PubMed] [Green Version]
- Ye, P.F.; Ge, K.; Li, M.; Yang, L.; Jin, S.H.; Zhang, C.; Chen, X.Y.; Geng, Z.Y. Egg-laying and brooding stage-specific hormonal response and transcriptional regulation in pituitary of Muscovy duck (Cairina moschata). Poult. Sci. 2019, 98, 5287–5296. [Google Scholar] [CrossRef]
- Yang, J.; Qu, Y.H.; Huang, Y.; Lei, F.M. Dynamic transcriptome profiling towards understanding the morphogenesis and development of diverse feather in domestic duck. BMC Genomics 2018, 19, 391. [Google Scholar] [CrossRef] [Green Version]
- Yang, Y.L.; Liang, G.M.; Niu, G.L.; Zhang, Y.Y.; Zhou, R.; Wang, Y.F.; Mu, Y.L.; Tang, Z.L.; Li, K. Comparative analysis of DNA methylome and transcriptome of skeletal muscle in lean-, obese-, and mini-type pigs. Sci. Rep. 2017, 7, 39883. [Google Scholar] [CrossRef]
- Guo, B.; Greenwood, P.L.; Cafe, L.M.; Zhou, G.H.; Zhang, W.G.; Dalrymple, B.P. Transcriptome analysis of cattle muscle identifies potential markers for skeletal muscle growth rate and major cell types. BMC Genomics 2015, 16, 177. [Google Scholar] [CrossRef] [Green Version]
- Sun, L.M.; Bai, M.; Xiang, L.J.; Zhang, G.S.; Ma, W.; Jiang, H.Z. Comparative transcriptome profiling of longissimus muscle tissues from Qianhua Mutton Merino and Small Tail Han sheep. Sci. Rep. 2016, 6, 33586. [Google Scholar] [CrossRef] [Green Version]
- Ropka-Molik, K.; Pawlina-Tyszko, K.; Żukowski, K.; Piórkowska, K.; Żak, G.; Gurgul, A.; Derebecka, N.; Wesoły, J. Examining the Genetic Background of Porcine Muscle Growth and Development Based on Transcriptome and miRNAome Data. Int. J. Mol. Sci. 2018, 19, 1208. [Google Scholar] [CrossRef] [Green Version]
- Zhang, Z.R.; Du, H.R.; Yang, C.W.; Li, Q.Y.; Qiu, M.H.; Song, X.Y.; Yu, C.L.; Jiang, X.Y.; Liu, L.; Hu, C.M.; et al. Comparative transcriptome analysis reveals regulators mediating breast muscle growth and development in three chicken breeds. Anim. Biotechnol. 2019, 30, 233–241. [Google Scholar] [CrossRef]
- Zhu, C.H.; Song, W.T.; Tao, Z.Y.; Liu, H.X.; Xu, W.J.; Zhang, S.J.; Li, H.F. Deep RNA sequencing of pectoralis muscle transcriptomes during late-term embryonic to neonatal development in indigenous Chinese duck breeds. PLoS ONE 2017, 12, e0180403. [Google Scholar] [CrossRef] [PubMed] [Green Version]
- Tang, J.; Shen, X.; Ouyang, H.J.; Luo, W.; Huang, Y.M.; Tian, Y.B.; Zhang, X.Q. Transcriptome analysis of pituitary gland revealed candidate genes and gene networks regulating the growth and development in goose. Anim. Biotechnol. 2020, 2, 1–11. [Google Scholar] [CrossRef] [PubMed]
- Liu, H.X.; Hu, Y.; Ji, G.G.; Li, H.F. Rapid-Sexing Poultries via a New Pair of Universal Primers. J. Agr. Biotechnol. 2014, 22, 1567–1574. (In Chinese) [Google Scholar]
- Silva-Vignato, B.; Coutinho, L.L.; Cesar, A.S.M.; Poleti, M.D.; Regitano, L.C.A.; Balieiro, J.C.C. Comparative muscle transcriptome associated with carcass traits of Nellore cattle. BMC Genomics 2017, 18, 506. [Google Scholar] [CrossRef] [PubMed] [Green Version]
- Norring, M.; Valros, A.; Valaja, J.; Sihvo, H.K.; Immonen, K.; Puolanne, E. Wooden breast myopathy links with poorer gait in broiler chickens. Animal 2019, 13, 1690–1695. [Google Scholar] [CrossRef] [Green Version]
- Glass, D.J. Signalling pathways that mediate skeletal muscle hypertrophy and atrophy. Nat. Cell. Biol. 2003, 5, 87–90. [Google Scholar] [CrossRef] [PubMed]
- Deries, M.; Thorsteinsdóttir, S. Axial and limb muscle development: Dialogue with the neighbourhood. Cell. Mol. Life Sci. 2016, 73, 4415–4431. [Google Scholar] [CrossRef] [PubMed]
- Scaal, M.; Marcelle, C. Chick muscle development. Int. J. Dev. Biol. 2018, 62, 127–136. [Google Scholar] [CrossRef] [Green Version]
- Wiggans, G.R.; Cole, J.B.; Hubbard, S.M.; Sonstegard, T.S. Genomic Selection in Dairy Cattle: The USDA Experience. Annu. Rev. Anim. Biosci. 2017, 5, 309–327. [Google Scholar] [CrossRef] [Green Version]
- Li, X.P.; Lu, Y.L.; Liu, X.F.; Xie, X.L.; Wang, K.; Yu, D.B. Identification of chicken FSHR gene promoter and the correlations between polymorphisms and egg production in Chinese native hens. Reprod. Domest. Anim. 2019, 54, 702–711. [Google Scholar] [CrossRef] [PubMed]
- Hawkins, J.A.; Jones, S.K., Jr.; Finkelstein, I.J.; Press, W.H. Indel-correcting DNA barcodes for high-throughput sequencing. Proc. Nctl. Acad. Sci. USA 2018, 115, E6217–E6226. [Google Scholar] [CrossRef] [PubMed] [Green Version]
- Nilsen, T.W.; Graveley, B.R. Expansion of the eukaryotic proteome by alternative splicing. Nature 2010, 463, 457–463. [Google Scholar] [CrossRef] [PubMed] [Green Version]
- Black, D.L. Protein diversity from alternative splicing: A challenge for bioinformatics and post-genome biology. Cell 2000, 103, 367–370. [Google Scholar] [CrossRef] [Green Version]
- Bhadra, M.; Howell, P.; Dutta, S.; Heintz, C.; Mair, W.B. Alternative splicing in aging and longevity. Hum. Genet. 2020, 139, 357–369. [Google Scholar] [CrossRef]
- Braunschweig, U.; Gueroussov, S.; Plocik, A.M.; Graveley, B.R.; Blencowe, B.J. Dynamic integration of splicing within gene regulatory pathways. Cell 2013, 152, 1252–1269. [Google Scholar] [CrossRef] [Green Version]
- Fiszbein, A.; Kornblihtt, A.R. Alternative splicing switches: Important players in cell differentiation. Bioessays 2017, 39, 1600157. [Google Scholar] [CrossRef]
- Ayuso, M.; Fernández, A.; Núñez, Y.; Benítez, R.; Isabel, B.; Fernández, A.I.; Rey, A.I.; González-Bulnes, A.; Medrano, J.F.; Cánovas, Á.; et al. Developmental Stage, Muscle and Genetic Type Modify Muscle Transcriptome in Pigs: Effects on Gene Expression and Regulatory Factors Involved in Growth and Metabolism. PLoS ONE 2016, 11, e0167858. [Google Scholar] [CrossRef] [Green Version]
- Thomson, D.M.; Herway, S.T.; Fillmore, N.; Kim, H.; Brown, J.D.; Barrow, J.R.; Winder, W.W. AMP-activated protein kinase phosphorylates transcription factors of the CREB family. J. Appl. Physiol. 2008, 104, 429–438. [Google Scholar] [CrossRef] [Green Version]
- Altarejos, J.Y.; Montminy, M. CREB and the CRTC co-activators: Sensors for hormonal and metabolic signals. Nat. Rev. Mol. Cell. Biol. 2011, 12, 141–151. [Google Scholar] [CrossRef] [PubMed] [Green Version]
- Dronadula, N.; Rizvi, F.; Blaskova, E.; Li, Q.; Rao, G.N. Involvement of cAMP-response element binding protein-1 in arachidonic acid-induced vascular smooth muscle cell motility. J. Lipid. Res. 2006, 47, 767–777. [Google Scholar] [CrossRef] [PubMed] [Green Version]
- Pugazhenthi, S.; Miller, E.; Sable, C.; Young, P.; Heidenreich, K.A.; Boxer, L.M.; Reusch, J.E. Insulin-like Growth Factor-I Induces bcl-2 Promoter through the Transcription Factor cAMP-Response Element-binding Protein. J. Biol. Chem. 1999, 274, 27529–27535. [Google Scholar] [CrossRef] [Green Version]
- Tiebe, M.; Lutz, M.; Tiebe, D.S.; Teleman, A.A. Crebl2 regulates cell metabolism in muscle and liver cells. Sci. Rep. 2019, 9, 19869. [Google Scholar] [CrossRef]
- Heard, J.J.; Fong, V.; Bathaie, S.Z.; Tamanoi, F. Recent progress in the study of the Rheb family GTPases. Cell Signal. 2014, 26, 1950–1957. [Google Scholar] [CrossRef] [Green Version]
- Laplante, M.; Sabatini, D.M. mTOR signaling in growth control and disease. Cell 2012, 149, 274–293. [Google Scholar] [CrossRef] [PubMed] [Green Version]
- Mahoney, S.J.; Narayan, S.; Molz, L.; Berstler, L.A.; Kang, S.A.; Vlasuk, G.P.; Saiah, E. A small molecule inhibitor of Rheb selectively targets mTORC1 signaling. Nat. Commun. 2018, 9, 548. [Google Scholar] [CrossRef]
- Ge, Y.J.; Yoon, M.S.; Chen, J. Raptor and Rheb Negatively Regulate Skeletal Myogenesis through Suppression of Insulin Receptor Substrate 1 (IRS1). J. Biol. Chem. 2011, 286, 35675–35682. [Google Scholar] [CrossRef] [Green Version]
- Suryawan, A.; Davis, T.A. Amino Acid- and Insulin-Induced Activation of mTORC1 in Neonatal Piglet Skeletal Muscle Involves Sestrin2-GATOR2, Rag A/C-mTOR, and RHEB-mTOR Complex Formation. J. Nutr. 2018, 148, 825–833. [Google Scholar] [CrossRef] [PubMed]
- MacLea, K.S.; Abuhagr, A.M.; Pitts, N.L.; Covi, J.A.; Bader, B.D.; Chang, E.S.; Mykles, D.L. Rheb, an activator of target of rapamycin, in the blackback land crab, Gecarcinus lateralis: Cloning and effects of molting and unweighting on expression in skeletal muscle. J. Exp. Biol. 2012, 215, 590–604. [Google Scholar] [CrossRef] [PubMed] [Green Version]
- Portnoy, M.E.; McDermott, H.J.; Antonellis, A.; Margulies, E.H.; Prasad, A.B.; NISC Comparative Sequencing Program; Kingsley, D.M.; Green, E.D.; Mortlock, D.P. Detection of potential GDF6 regulatory elements by multispecies sequence comparisons and identification of a skeletal joint enhancer. Genomics 2005, 86, 295–305. [Google Scholar] [CrossRef] [PubMed]
- Mikic, B.; Rossmeier, K.; Bierwert, L. Identification of a tendon phenotype in GDF6 deficient mice. Anat. Rec. 2009, 292, 396–400. [Google Scholar] [CrossRef] [Green Version]
- Furushima, K.; Yamamoto, A.; Nagano, T.; Shibata, M.; Miyachi, H.; Abe, T.; Ohshima, N.; Kiyonari, H.; Aizawa, S. Mouse homologues of Shisa antagonistic to Wnt and Fgf signalings. Dev. Biol. 2007, 306, 480–492. [Google Scholar] [CrossRef]
- Nagano, T.; Takehara, S.; Takahashi, M.; Aizawa, S.; Yamamoto, A. Shisa2 promotes the maturation of somitic precursors and transition to the segmental fate in Xenopus embryos. Development 2006, 133, 4643–4654. [Google Scholar] [CrossRef] [Green Version]
- Hedge, T.A.; Mason, I. Expression of Shisa2, a modulator of both Wnt and Fgf signaling, in the chick embryo. Int. J. Dev. Biol. 2008, 52, 81–85. [Google Scholar] [CrossRef] [Green Version]
- Liu, Z.J.; Wang, C.; Liu, X.Q.; Kuang, S.H. Shisa2 regulates the fusion of muscle progenitors. Stem Cell Res. 2018, 31, 31–41. [Google Scholar] [CrossRef]
- Soung, Y.H.; Lee, J.W.; Kim, S.Y.; Nam, S.W.; Park, W.S.; Lee, J.Y.; Yoo, N.J.; Lee, S.H. Mutational analysis of the kinase domain of MYLK2 gene in common human cancers. Pathol. Res. Pract. 2006, 202, 137–140. [Google Scholar] [CrossRef]
- Kamm, K.E.; Stull, J.T. Dedicated myosin light chain kinases with diverse cellular functions. J. Biol. Chem. 2001, 276, 4527–4530. [Google Scholar] [CrossRef] [PubMed] [Green Version]
- Stelzer, J.E.; Patel, J.R.; Moss, R.L. Acceleration of stretch activation in murine myocardium due to phosphorylation of myosin regulatory light chain. J. Gen. Physiol. 2006, 128, 261–272. [Google Scholar] [CrossRef] [Green Version]
- Moss, R.L.; Fitzsimons, D.P. Myosin light chain 2 into the mainstream of cardiac development and contractility. Circ. Res. 2006, 99, 225–227. [Google Scholar] [CrossRef] [PubMed] [Green Version]
- Mukhina, S.; Wang, Y.L.; Murata-Hori, M. Alpha-actinin is required for tightly regulated remodeling of the actin cortical network during cytokinesis. Dev. Cell. 2007, 13, 554–565. [Google Scholar] [CrossRef] [Green Version]
- Edlund, M.; Lotano, M.A.; Otey, C.A. Dynamics of alpha-actinin in focal adhesions and stress fibers visualized with alpha-actiningreen fluorescent protein. Cell. Motil. Cytoskeleton. 2001, 48, 190–200. [Google Scholar] [CrossRef]
- Naumanen, P.; Lappalainen, P.; Hotulainen, P. Mechanisms of actin stress fibre assembly. J. Microsc. 2008, 231, 446–454. [Google Scholar] [CrossRef] [PubMed]
- Hotulainen, P.; Lappalainen, P. Stress fibers are generated by two distinct actin assembly mechanisms in motile cells. J. Cell. Biol. 2006, 173, 383–394. [Google Scholar] [CrossRef] [Green Version]
- Zhang, X.M.; Cai, S.F.; Chen, L.X.; Yuan, R.Q.; Nie, Y.P.; Ding, S.Y.; Fang, Y.; Zhu, Q.; Chen, K.R.; Wei, H.; et al. Integrated miRNA-mRNA transcriptomic analysis reveals epigenetic-mediated embryonic muscle growth differences between Wuzhishan and Landrace pig. J. Anim. Sci. 2019, 97, 1967–1978. [Google Scholar] [CrossRef]
- Beggs, A.H.; Byers, T.J.; Knoll, J.H.; Boyce, F.M.; Bruns, G.A.; Kunkel, L.M. Cloning and characterization of two human skeletal muscle alpha-actinin genes located on chromosomes 1 and 11. J. Biol. Chem. 1992, 267, 9281–9288. [Google Scholar] [CrossRef]
- MacArthur, D.G.; Seto, J.T.; Raftery, J.M.; Quinlan, K.G.; Huttley, G.A.; Hook, J.W.; Lemckert, F.A.; Kee, A.J.; Edwards, M.R.; Berman, Y.; et al. Loss of ACTN3 gene function alters mouse muscle metabolism and shows evidence of positive selection in humans. Nat. Genet. 2007, 39, 1261–1265. [Google Scholar] [CrossRef]
- Holterhoff, C.K.; Saunders, R.H.; Brito, E.E.; Wagner, D.S. Sequence and expression of the zebrafish alpha-actinin gene family reveals conservation and diversification among vertebrates. Dev. Dyn. 2009, 238, 2936–2947. [Google Scholar] [CrossRef] [Green Version]
- Franzini-Armstrong, C.; Protasi, F. Ryanodine receptors of striated muscles: A complex channel capable of multiple interactions. Physiol. Rev. 1997, 77, 699–729. [Google Scholar] [CrossRef] [PubMed]
- Meissner, G. The structural basis of ryanodine receptor ion channel function. J. Gen. Physiol. 2017, 149, 1065–1089. [Google Scholar] [CrossRef] [PubMed]
- Ward, C.W.; Schneider, M.F.; Castillo, D.; Protasi, F.; Wang, Y.; Chen, S.R.; Allen, P.D. Expression of ryanodine receptor RyR3 produces Ca2+ sparks in dyspedic myotubes. J. Physiol. 2000, 525, 91–103. [Google Scholar] [CrossRef]
- Essin, K.; Maik Gollasch, M. Role of Ryanodine Receptor Subtypes in Initiation and Formation of Calcium Sparks in Arterial Smooth Muscle: Comparison with Striated Muscle. J. Biomed. Biotechnol. 2009, 2009, 135249. [Google Scholar] [CrossRef] [Green Version]
- Perni, S.; Marsden, K.C.; Escobar, M.; Hollingworth, S.; Baylor, S.M.; Franzini-Armstron, C. Structural and functional properties of ryanodine receptor type 3 in zebrafish tail muscle. J. Gen. Physiol. 2015, 145, 173–184. [Google Scholar] [CrossRef] [Green Version]
- Percival, A.L.; Williams, A.J.; Kenyon, J.L.; Grinsell, M.M.; Airey, J.A.; Sutko, J.L. Chicken skeletal muscle ryanodine receptor isoforms: Ion channel properties. Biophys. J. 1994, 67, 1834–1850. [Google Scholar] [CrossRef] [Green Version]
- Rubin, C.I.; Atweh, G.F. Role of stathmin in regulation of cell cycle. J. Cell. Biochem. 2004, 93, 242–250. [Google Scholar] [CrossRef]
- Hu, X.Q.; Zhang, H.P.; Zheng, X.D.; Lin, Z.M.; Feng, G.F.; Chen, Y.M.; Pan, Q.H.; Ni, F.F. STMN1 and MKI67 Are Upregulated in Uterine Leiomyosarcoma and Are Potential Biomarkers for its Diagnosis. Med. Sci. Monit. 2020, 26, e923749. [Google Scholar] [CrossRef]
- Balogh, A.; Mège, R.M.; Sobel, A. Growth and Cell Density-Dependent Expression of Stathmin in C2 Myoblasts in Culture. Exp. Cell. Res. 1996, 224, 8–15. [Google Scholar] [CrossRef]
- Villalón, E.; Kline, R.A.; Smith, C.E.; Lorson, Z.C.; Osman, E.Y.; O’Day, S.; Murray, L.M.; Lorson, C.L. AAV9-Stathmin1 gene delivery improves disease phenotype in an intermediatemouse model of spinal muscular atrophy. Hum. Mol. Genet. 2019, 28, 3742–3754. [Google Scholar] [CrossRef] [PubMed]
- Zhao, Y.Q.; Li, J.; Liu, H.J.; Xi, Y.; Xue, M.; Liu, W.H.; Zhuang, Z.H.; Lei, M.G. Dynamic transcriptome profiles of skeletal muscle tissue across 11 developmental stages for both Tongcheng and Yorkshire pigs. BMC Genomics 2015, 16, 377. [Google Scholar] [CrossRef] [Green Version]
- Wu, P.F.; Zhang, X.C.; Zhang, G.X.; Chen, F.X.; He, M.L.; Zhang, T.; Wang, J.Y.; Xie, K.Z.; Dai, G.J. Transcriptome for the breast muscle of Jinghai yellow chicken at early growth stages. Peer. J. 2020, 8, e8950. [Google Scholar] [CrossRef] [PubMed] [Green Version]
- Hirata, H.; Sokabe, M.; Lim, C.T. Molecular Mechanisms Underlying the Force-Dependent Regulation of Actin-to-ECM Linkage at the Focal Adhesions. Prog. Mol. Biol. Transl. Sci. 2014, 126, 135–154. [Google Scholar] [CrossRef] [PubMed]
- Burridge, K.; Guilluy, C. Focal adhesions, stress fibers and mechanical tension. Exp. Cell. Res. 2016, 343, 14–20. [Google Scholar] [CrossRef] [PubMed] [Green Version]
- Gupton, S.L.; Waterman-Storer, C.M. Spatiotemporal feedback between actomyosin and focal-adhesion systems optimizes rapid cell migration. Cell 2006, 125, 1361–1374. [Google Scholar] [CrossRef] [Green Version]
- Mitra, S.K.; Hanson, D.A.; Schlaepfer, D.D. Focal adhesion kinase: In command and control of cell motility. Nat. Rev. Mol. Cell. Biol. 2005, 6, 56–68. [Google Scholar] [CrossRef] [PubMed]
- Fluck, M.; Carson, J.A.; Gordon, S.E.; Ziemiecki, A.; Booth, F.W. Focal adhesion proteins FAK and paxillin increase in hypertrophied skeletal muscle. Am. J. Physiol. 1999, 277, C152–C162. [Google Scholar] [CrossRef]
- Quach, N.L.; Rando, T.A. Focal adhesion kinase is essential for costamerogenesis in cultured skeletal muscle cells. Dev. Biol. 2006, 293, 38–52. [Google Scholar] [CrossRef] [Green Version]
- Wang, D.; Gao, C.Q.; Chen, R.Q.; Jin, C.L.; Li, H.C.; Yan, H.C.; Wang, X.Q. Focal adhesion kinase and paxillin promote migration and adhesion to fibronectin by swine skeletal muscle satellite cells. Oncotarget 2016, 7, 30845–30854. [Google Scholar] [CrossRef] [Green Version]
- Pollard, T.D.; Borisy, G.G. Cellular motility driven by assembly and disassembly of actin filaments. Cell 2003, 112, 453–465. [Google Scholar] [CrossRef] [Green Version]
- Ridley, A.J.; Schwartz, M.A.; Burridge, K.; Firtel, R.A.; Ginsberg, M.H.; Borisy, G.; Parsons, J.T.; Horwitz, A.R. Cell migration: Integrating signals from front to back. Science 2003, 302, 1704–1709. [Google Scholar] [CrossRef] [Green Version]
- Charras, G.; Brieher, W.M. Regulation and integrated functions of the actin cytoskeleton. Mol. Biol. Cell. 2016, 27, 881. [Google Scholar] [CrossRef] [PubMed] [Green Version]
- Sweeney, H.L.; Hammers, D.W. Muscle Contraction. Cold Spring Harb. Perspect. Biol. 2018, 10, a023200. [Google Scholar] [CrossRef] [Green Version]
- Johnson, B.D.; Scheuer, T.; Catterall, W.A. Convergent regulation of skeletal muscle Ca2+ channels by dystrophin, the actin cytoskeleton, and cAMP-dependent protein kinase. Proc. Natl. Acad. Sci. USA 2005, 102, 4191–4196. [Google Scholar] [CrossRef] [Green Version]
- Gunning, P.; O’Neill, G.; Edna Hardeman, E. Tropomyosin-Based Regulation of the Actin Cytoskeleton in Time and Space. Physiol. Rev. 2008, 88, 1–35. [Google Scholar] [CrossRef] [Green Version]
- Rodgers, L.S.; Fanning, A.S. Regulation of Epithelial Permeability by the Actin Cytoskeleton. Cytoskeleton (Hoboken) 2011, 68, 653–660. [Google Scholar] [CrossRef] [PubMed] [Green Version]
- Fiorenza, M.; Lemminger, A.K.; Marker, M.; Eibye, K.; Iaia, F.M.; Bangsbo, J.; Hostrup, M. High-intensity exercise training enhances mitochondrial oxidative phosphorylation efficiency in a temperaturedependent manner in human skeletal muscle: Implications for exercise performance. FASEB J. 2019, 33, 8976–8989. [Google Scholar] [CrossRef] [PubMed] [Green Version]
- Korzeniewski, B. The modeling of oxidative phosphorylation in skeletal muscle. Jpn. J. Physiol. 2004, 54, 511–516. [Google Scholar] [CrossRef] [Green Version]
- Wilson, D.F. Oxidative phosphorylation: Unique regulatory mechanism and role in metabolic homeostasis. J. Appl. Physiol. 2017, 122, 611–619. [Google Scholar] [CrossRef] [PubMed]
- Sin, J.; Andres, A.M.; Taylor, D.J.R.; Weston, T.; Hiraumi, Y.; Stotland, A.; Kim, B.J.; Huang, C.Q.; Doran, K.S.; Gottlieb, R.A. Mitophagy is required for mitochondrial biogenesis and myogenic differentiation of C2C12 myoblasts. Autophagy 2016, 12, 369–380. [Google Scholar] [CrossRef] [PubMed] [Green Version]
- Kunz, W.S. Control of oxidative phosphorylation in skeletal muscle. Biochim. Biophys. Acta 2001, 1504, 12–19. [Google Scholar] [CrossRef] [Green Version]
- Schiaffino, S.; Reggiani, C. Fiber types in mammalian skeletal muscles. Physiol. Rev. 2011, 91, 1447–1531. [Google Scholar] [CrossRef] [PubMed] [Green Version]
- Glancy, B.; Willis, W.T.; Chess, D.J.; Balaban, R.S. Effect of Calcium on the Oxidative Phosphorylation Cascade in Skeletal Muscle Mitochondria. Biochemistry 2013, 52, 2793–2809. [Google Scholar] [CrossRef] [PubMed]
- Vinnakota, K.C.; Singhal, A.; Van den Bergh, F.; Bagher-Oskouei, M.; Wiseman, R.W.; Beard, D.A. Open-Loop Control of Oxidative Phosphorylation in Skeletal and Cardiac Muscle Mitochondria by Ca2+. Biophys. J. 2016, 110, 954–961. [Google Scholar] [CrossRef] [PubMed] [Green Version]
Figure 1.
Annotation and classification of SNPs and InDels in Hanzhong Ma ducks. (A) SNPs of breast muscle; (B) SNPs of leg muscle; (C) InDels of breast muscle; (D) InDels of leg muscle.
Figure 1.
Annotation and classification of SNPs and InDels in Hanzhong Ma ducks. (A) SNPs of breast muscle; (B) SNPs of leg muscle; (C) InDels of breast muscle; (D) InDels of leg muscle.

Figure 2.
The predicted number of alternative splicing in Hanzhong Ma ducks during different growth stages. (A–D) represent the predicted number of alternative splicing in Hanzhong Ma ducks on day 17, 21, 27 of incubation, and postnatal 6-month-old, respectively.
Figure 2.
The predicted number of alternative splicing in Hanzhong Ma ducks during different growth stages. (A–D) represent the predicted number of alternative splicing in Hanzhong Ma ducks on day 17, 21, 27 of incubation, and postnatal 6-month-old, respectively.

Figure 3.
Number of DEGs during skeletal muscle development in Hanzhong Ma ducks.

Figure 4.
Venn diagram of DEGs among the three comparison groups. (A) The co-expressed DEGs in breast muscle of Hanzhong Ma ducks; (B) The co-expressed DEGs in leg muscle of Hanzhong Ma ducks.
Figure 4.
Venn diagram of DEGs among the three comparison groups. (A) The co-expressed DEGs in breast muscle of Hanzhong Ma ducks; (B) The co-expressed DEGs in leg muscle of Hanzhong Ma ducks.

Figure 5.
GO enrichment analysis of DEGs in Hanzhong Ma ducks. (A) HZE17B_vs_HZE21B; (B) HZE21B_vs_HZE27B; (C) HZE27B_vs_HZM6B; (D) HZE17L_vs_HZE21L; (E) HZE21L_vs_HZE27L; (F) HZE27L_vs_HZM6L. Note: The abscissa was GO terms, the ordinate on the left was the percentage of genes in all genes annotated with GO, right was the number of genes.

Figure 6.
Annotation of DEGs in KEGG. (A) HZE17B_vs_HZE21B; (B) HZE21B_vs_HZE27B; (C) HZE27B_vs_HZM6B; (D) HZE17L_vs_PHZE21L; (E) HZE21L_vs_HZE27L; (F) HZE27L_vs_HZM6L. Note: In the figure, each circle represented a KEGG pathway, the name of which was shown on the left legend. Abscissa was enrichment factors, showing the proportion of (a) to (b), (a) was the ratio of differentially expressed genes in the pathway with all DEGs in all pathways; (b) was the ratio of genes in the pathway with all genes in all pathways. The bigger the Rich factor is, the more significant the pathway is. The color of the circle represented the q value which is the adjusted p-value by multiple hypothesis testing. Thus, the smaller the q value is, the more significant the pathway is; the circle size represented the number of differentially expressed genes annotated with the pathway, the bigger circle size is, the higher the number of genes.

Figure 7.
qPCR verification of DEGs. “*” was considered significant difference (p < 0.05); “**” was considered extremely significant difference (p < 0.01).
Figure 7.
qPCR verification of DEGs. “*” was considered significant difference (p < 0.05); “**” was considered extremely significant difference (p < 0.01).


Table 1.
Primers sequence used in this work for qPCR validation and sex-determination.
| Groups | Primer Name | Primer Sequence (5′-3′) | Size | Regulated |
|---|---|---|---|---|
| gCHD | F: TGCAGAAGCAATATTACAAGT | Male: 467 bp | ||
| R: AATTCATTATCATCTGGTGG | Female: 467 bp, 326 bp | |||
| HZE17B_vs_HZE21B | ERN2 | F:GCTACCTCACCTTCCACTCG | 144 bp | UP |
| R:CCAGTGAGGTCAAGGCGTAG | ||||
| HZE21B_vs_ HZE27B | SHISA2 | F:AACTCTGTCTCTTGGCGGAC | 140 bp | DOWN |
| R:GAAGTCGCAGCACAACCTTC | ||||
| HZE27B_vs_ HZM6B | D2HGDH | F:CTACGGCCACTTGGGAGATG | 138 bp | UP |
| R:CCATGCTCGGCACTGATACT | ||||
| HZE17L_vs_ HZE21L | PIEZO2 | F:GAGGGAGTTCGTGAGTGGTG | 153 bp | DOWN |
| R:CGATGCGTACAGTCCCATGA | ||||
| HZE21L_vs_ HZE27L | KLHL31 | F:AACCAGTGCGTGACAGTGAT | 171 bp | UP |
| R:GCTGAAGTGGGTACGCTTCT | ||||
| HZE27L_vs_ HZM6L | ALKBH4 | F:CTTGCTCTGTGCTAGGTGGT | 156 bp | UP |
| R:TGGAGAGCACGGTGTTTGAG | ||||
| β-actin | F: CCCTGTATGCCTCTGGTCG | 194 bp | ||
| R: CTCGGCTGTGGTGGTGAAG |
Table 2.
RNA-Seq data from breast and leg muscle of Hanzhong Ma ducks.
| Samples | Clean Reads | Clean Bases | GC Content | Q30 Value |
|---|---|---|---|---|
| HZE17B1 | 21,762,267 | 6,501,302,702 | 51.05% | 93.11% |
| HZE17B2 | 27,394,948 | 8,181,272,166 | 50.72% | 93.71% |
| HZE17B3 | 29,162,348 | 8,705,985,402 | 51.30% | 93.06% |
| HZE17L1 | 27,479,839 | 8,207,191,364 | 51.34% | 92.90% |
| HZE17L2 | 27,736,375 | 8,286,040,228 | 50.92% | 93.27% |
| HZE17L3 | 24,349,210 | 7,267,672,312 | 51.27% | 93.04% |
| HZE21B1 | 26,420,707 | 7,891,652,864 | 51.40% | 92.56% |
| HZE21B2 | 28,097,657 | 8,385,363,516 | 51.13% | 93.00% |
| HZE21B3 | 27,589,171 | 8,240,063,270 | 51.19% | 92.73% |
| HZE21L1 | 26,743,965 | 7,984,802,282 | 51.25% | 93.27% |
| HZE21L2 | 22,304,168 | 6,655,180,216 | 51.39% | 93.03% |
| HZE21L3 | 29,933,693 | 8,920,698,448 | 51.09% | 92.93% |
| HZE27B1 | 30,600,812 | 9,149,184,640 | 52.14% | 92.99% |
| HZE27B2 | 25,569,769 | 7,639,778,632 | 51.34% | 92.58% |
| HZE27B3 | 27,794,014 | 8,301,392,200 | 51.66% | 92.72% |
| HZE27L1 | 26,774,058 | 7,994,219,756 | 51.77% | 93.02% |
| HZE27L2 | 27,147,241 | 8,098,721,002 | 52.00% | 93.29% |
| HZE27L3 | 27,135,496 | 8,108,815,318 | 52.42% | 92.97% |
| HZM6B1 | 20,948,194 | 6,261,607,884 | 55.32% | 93.28% |
| HZM6B2 | 28,678,868 | 8,557,762,996 | 54.45% | 93.16% |
| HZM6B3 | 22,067,559 | 6,594,491,658 | 53.08% | 93.25% |
| HZM6L1 | 25,190,674 | 7,526,783,110 | 54.01% | 93.18% |
| HZM6L2 | 27,248,765 | 8,136,824,248 | 52.27% | 93.05% |
| HZM6L3 | 26,563,485 | 7,931,120,332 | 54.16% | 92.96% |
Note: Clean reads: Paired-end numbers of Clean Data; HZE17B: Breast muscle of Hanzhong Ma duck on the day 17 of the incubation period; HZE17L: Leg muscle of Hanzhong Ma duck on the day 17 of the incubation period; The same below.
Table 3.
Single nucleotide polymorphisms (SNP) mutation type from breast and leg muscle of Hanzhong Ma ducks.
Table 3.
Single nucleotide polymorphisms (SNP) mutation type from breast and leg muscle of Hanzhong Ma ducks.
| Sample | A->G | G->A | C->T | T->C | A->C | C->A | A->T | T->A | C->G | G->C | G->T | T->G |
|---|---|---|---|---|---|---|---|---|---|---|---|---|
| HZE17B1 | 22,365 | 23,409 | 23,406 | 22,291 | 3902 | 4103 | 3284 | 3258 | 3810 | 3774 | 3952 | 3955 |
| HZE17B2 | 23,579 | 24,692 | 24,688 | 23,381 | 4229 | 4342 | 3393 | 3473 | 4009 | 3980 | 4124 | 4263 |
| HZE17B3 | 25,022 | 26,021 | 26,262 | 25,165 | 4530 | 4626 | 3643 | 3755 | 4257 | 4312 | 4451 | 4568 |
| HZE17L1 | 23,222 | 24,485 | 24,837 | 23,694 | 4132 | 4398 | 3413 | 3404 | 4115 | 3934 | 4160 | 4200 |
| HZE17L2 | 25,603 | 26,918 | 26,759 | 25,514 | 4713 | 4804 | 3770 | 3793 | 4454 | 4419 | 4550 | 4692 |
| HZE17L3 | 20,922 | 21,871 | 22,038 | 20,657 | 3651 | 3664 | 2953 | 3046 | 3545 | 3503 | 3710 | 3644 |
| HZE21B1 | 25,318 | 26,301 | 26,223 | 24,981 | 4599 | 4627 | 3768 | 3792 | 4332 | 4305 | 4558 | 4565 |
| HZE21B2 | 29,584 | 30,912 | 30,895 | 29,527 | 5437 | 5481 | 4561 | 4514 | 5129 | 5147 | 5465 | 5602 |
| HZE21B3 | 23,938 | 24,986 | 24,785 | 23,657 | 4362 | 4392 | 3559 | 3586 | 4089 | 4138 | 4289 | 4440 |
| HZE21L1 | 20,592 | 21,845 | 21,750 | 20,480 | 3677 | 3779 | 2921 | 3052 | 3547 | 3462 | 3659 | 3633 |
| HZE21L2 | 17,187 | 18,200 | 18,172 | 17,303 | 2909 | 2978 | 2377 | 2385 | 2843 | 2743 | 3021 | 2993 |
| HZE21L3 | 20,918 | 22,245 | 22,658 | 21,283 | 3654 | 3811 | 3070 | 3130 | 3603 | 3630 | 3754 | 3836 |
| HZE27B1 | 21,716 | 22,786 | 22,936 | 21,570 | 3837 | 3885 | 3126 | 3095 | 3670 | 3597 | 3848 | 3847 |
| HZE27B2 | 24,859 | 25,867 | 25,853 | 24,937 | 4571 | 4601 | 3837 | 3772 | 4178 | 4276 | 4596 | 4602 |
| HZE27B3 | 18,307 | 19,263 | 19,446 | 18,163 | 3217 | 3223 | 2591 | 2650 | 3056 | 2965 | 3231 | 3255 |
| HZE27L1 | 12,356 | 13,325 | 13,428 | 12,510 | 2031 | 2029 | 1657 | 1693 | 1970 | 1914 | 2001 | 2034 |
| HZE27L2 | 15,727 | 16,779 | 16,715 | 15,626 | 2644 | 2676 | 2125 | 2204 | 2644 | 2531 | 2735 | 2719 |
| HZE27L3 | 13,577 | 14,624 | 14,728 | 13,583 | 2162 | 2250 | 1821 | 1772 | 2207 | 2149 | 2232 | 2187 |
| HZM6B1 | 10,199 | 11,011 | 11,094 | 10,541 | 1627 | 1665 | 1318 | 1380 | 1582 | 1547 | 1667 | 1693 |
| HZM6B2 | 13,446 | 14,322 | 14,200 | 13,523 | 2222 | 2248 | 1862 | 1903 | 2166 | 2167 | 2265 | 2254 |
| HZM6B3 | 12,499 | 13,708 | 13,539 | 12,882 | 2129 | 2164 | 1753 | 1732 | 2080 | 1987 | 2047 | 2112 |
| HZM6L1 | 10,989 | 11,662 | 11,732 | 10,975 | 1779 | 1794 | 1461 | 1464 | 1704 | 1660 | 1741 | 1779 |
| HZM6L2 | 15,108 | 16,062 | 15,937 | 14,998 | 2510 | 2595 | 2073 | 2169 | 2522 | 2452 | 2583 | 2583 |
| HZM6L3 | 11,394 | 12,207 | 12,301 | 11,403 | 1837 | 1860 | 1521 | 1511 | 1808 | 1783 | 1817 | 1815 |
Table 4.
Annotated number of DEGs in breast muscle and leg muscle of Hanzhong Ma ducks.
| DEG Set | Total | COG | GO | KEGG | KOG | NR | Pfam | Swiss-Prot | eggNOG |
|---|---|---|---|---|---|---|---|---|---|
| HZE17B_vs_HZE21B | 1190 | 381 | 922 | 787 | 813 | 1186 | 1044 | 863 | 1123 |
| HZE21B_vs_HZE27B | 919 | 292 | 736 | 613 | 637 | 916 | 847 | 628 | 881 |
| HZE27B_vs_HZM6B | 2801 | 965 | 2266 | 1889 | 2041 | 2784 | 2581 | 1992 | 2728 |
| HZE17L_vs_HZE21L | 917 | 304 | 741 | 619 | 615 | 912 | 853 | 678 | 894 |
| HZE21L_vs_HZE27L | 1950 | 710 | 1627 | 1398 | 1430 | 1939 | 1843 | 1407 | 1915 |
| HZE27L_vs_ HZM6L | 825 | 277 | 660 | 579 | 589 | 820 | 777 | 627 | 808 |
Publisher’s Note: MDPI stays neutral with regard to jurisdictional claims in published maps and institutional affiliations. |
© 2021 by the authors. Licensee MDPI, Basel, Switzerland. This article is an open access article distributed under the terms and conditions of the Creative Commons Attribution (CC BY) license (http://creativecommons.org/licenses/by/4.0/).
Share and Cite
MDPI and ACS Style
Hu, Z.; Cao, J.; Zhang, J.; Ge, L.; Zhang, H.; Liu, X. Skeletal Muscle Transcriptome Analysis of Hanzhong Ma Duck at Different Growth Stages Using RNA-Seq. Biomolecules 2021, 11, 315. https://0-doi-org.brum.beds.ac.uk/10.3390/biom11020315
AMA Style
Hu Z, Cao J, Zhang J, Ge L, Zhang H, Liu X. Skeletal Muscle Transcriptome Analysis of Hanzhong Ma Duck at Different Growth Stages Using RNA-Seq. Biomolecules. 2021; 11(2):315. https://0-doi-org.brum.beds.ac.uk/10.3390/biom11020315
Chicago/Turabian StyleHu, Zhigang, Junting Cao, Jianqin Zhang, Liyan Ge, Huilin Zhang, and Xiaolin Liu. 2021. "Skeletal Muscle Transcriptome Analysis of Hanzhong Ma Duck at Different Growth Stages Using RNA-Seq" Biomolecules 11, no. 2: 315. https://0-doi-org.brum.beds.ac.uk/10.3390/biom11020315
Note that from the first issue of 2016, this journal uses article numbers instead of page numbers. See further details here.