
Investigation of Anaerobic Digestion of the Aqueous Phase from Hydrothermal Carbonization of Mixed Municipal Solid Waste


Department of Civil & Environmental Engineering, Old Dominion University, Norfolk, VA 23529, USA
*
Author to whom correspondence should be addressed.
Biomass 2021, 1(1), 61-73; https://0-doi-org.brum.beds.ac.uk/10.3390/biomass1010005
Submission received: 30 April 2021
/
Revised: 15 July 2021
/
Accepted: 26 August 2021
/
Published: 6 September 2021
Abstract
:In 2017, the United States Environmental Protection Agency (EPA) reported that Americans generated over 268 million tons of municipal solid waste (MSW). The majority (52%) of this waste ends up in landfills, which are the third largest source of anthropogenic methane emissions. Improvements in terms of waste management and energy production could be solved by integrating MSW processing with hydrothermal carbonization (HTC) and anaerobic digestion (AD) for converting organic carbon of MSW to fuels. The objectives of this study were to (a) investigate HTC experiments at varying temperatures and residence times (b) evaluate aqueous phase and solids properties, and (c) perform AD bench scale bottle test on the aqueous phase. A mixture of different feedstock representing MSW was used. HTC at 280 °C and 10 min yielded the highest total organic carbon (TOC) of 8.16 g/L with biogas yields of 222 mL biogas/g TOC. Results showed that AD of the aqueous phase from a mixed MSW feedstock is feasible. The integrated approach shows organic carbon recovery of 58% (hydrochar and biogas). This study is the first of its kind to investigate varying temperature and times for a heterogeneous feedstock (mixed MSW), and specifically evaluating HTC MSW aqueous phase anaerobic biodegradability.
1. Introduction
In 2017, the United States Environmental Protection Agency (EPA) reported that Americans generated over 268 million tons of municipal solid waste (MSW); 52% (landfilled), 13% (incinerated), and 35% (recycled/composted) [1]. MSW landfills are the third largest source of anthropogenic methane emissions which have 23 times more greenhouse gas trapping potential than CO2. Improvements in terms of waste management and energy production could be solved by integrating MSW processing with hydrothermal carbonization (HTC) and anaerobic digestion (AD) to reduce waste to landfills and maximize the organic carbon and resource recovery.
HTC is defined as a combined dehydration and decarboxylation of an organic feedstock under subcritical water/hydrothermal medium to enrich its carbon content making it comparable to bituminous grade coal’s heating values (24–27 MJ/kg). Literature reports operating conditions of HTC ranging from 180 °C to 320 °C based on different feedstock which produces three main products and average product yields; hydrochar “green coal” (45–70%), aqueous phase (5–25%) and gases which are mainly CO2 (2–5%) [2]. HTC is observed as a scalable technique to convert wet biomass (e.g., MSW) to carbon-rich solid fuels. HTC offers many advantages as one of the most efficient processes for carbon fixation in solid fuels for a wet feedstock in a short residence time; however, heat recovery and aqueous phase (with 20–45% total organic carbon (TOC)) recycling are essential to its waste to energy feasibility. Previous studies [2,3,4,5,6] have shown that the HTC aqueous phase can be amendable for subsequent biological treatment, such as AD. A recent study that used HTC of corn silage followed by AD of the aqueous phase (without any pretreatment) achieved 16.3 L CH4/Kg of wet fresh matter, further proving that the aqueous phase has much potential for higher biogas yields [4]. Another group [3] performed batch HTC experiments using agricultural residue as feedstock; and calculated biogas potential for the resulting process water (aqueous phase) after HTC. For the aqueous phase, they reported, TOC (12–26 g/L) and pH (3–5), supporting the idea that the aqueous phase has great potential for further treatment with AD. However, the research studies on anaerobic biodegradability of HTC MSW aqueous phase has not been done [2]. There are several chemical compounds present in the HTC aqueous phase such as organic acids (e.g., lactic acid and acetic acid), aromatics, and phenolic compounds [7]. Some of these compounds could potentially be recovered as byproducts or further processed after pretreatments to increase biogas yields. Nationwide AD systems are projected to reduce cumulative energy consumption by nearly 15 million T/J and reduce GHG emissions by 7.2 billion tons of CO2 over 50 years and have been used to treat MSW; however, they are not large scale in the U.S. because of economic feasibility and disadvantages including weeks to months of solids retention time for biogas energy production [8].
There have been fewer studies conducted on complex waste streams for sustainable waste management, but HTC offers an innovative way to treat MSW feedstocks that contain high moisture and high carbon content. Berge et al. investigated HTC of MSW because little work has been done exploring the carbonization of theses complex waste streams in order to evaluate HTC as a sustainable waste management technique. The purpose of their study was to determine the feasibility of hydrothermally carbonizing model municipal waste streams especially those that would typically go to the landfill. Their objectives included evaluating the environmental implications associated with the carbonization of representative municipal waste streams, evaluating properties of hydrochar, and determining carbonization energetics associated with each waste stream. One major finding was that 20–37% of initial carbon was transferred to the aqueous phase after HTC of mixed MSW feedstock, which can be recovered for energy; however, in their study, carbonization experiments were not optimized, and the aqueous phase was not tested for digestibility [2].
Advantages of using HTC over conventional waste management methods include no required separation of feedstock, wet feedstocks can be used without drying, and using lower temperatures and less energy compared to other thermal treatments such as incineration and pyrolysis. AD residence time of the aqueous phase has been shown to be faster than conventional solids (MSW organics) digestion [9]. The importance of this research is timely in terms of solid waste management and waste to energy. Commercial scale HTC is an emerging industry with three large scale operational plants in the world; handling of the aqueous phase is an important factor in terms of upscaling HTC for sustainable waste management practices [10]. If this proposed integrated (HTC + AD) process using MSW is proven to be feasible techno-economically, this could be monumental in terms of mitigating many environmental issues associated with conventional incineration and landfilling such as air pollution, groundwater water pollution and limited landfill space.
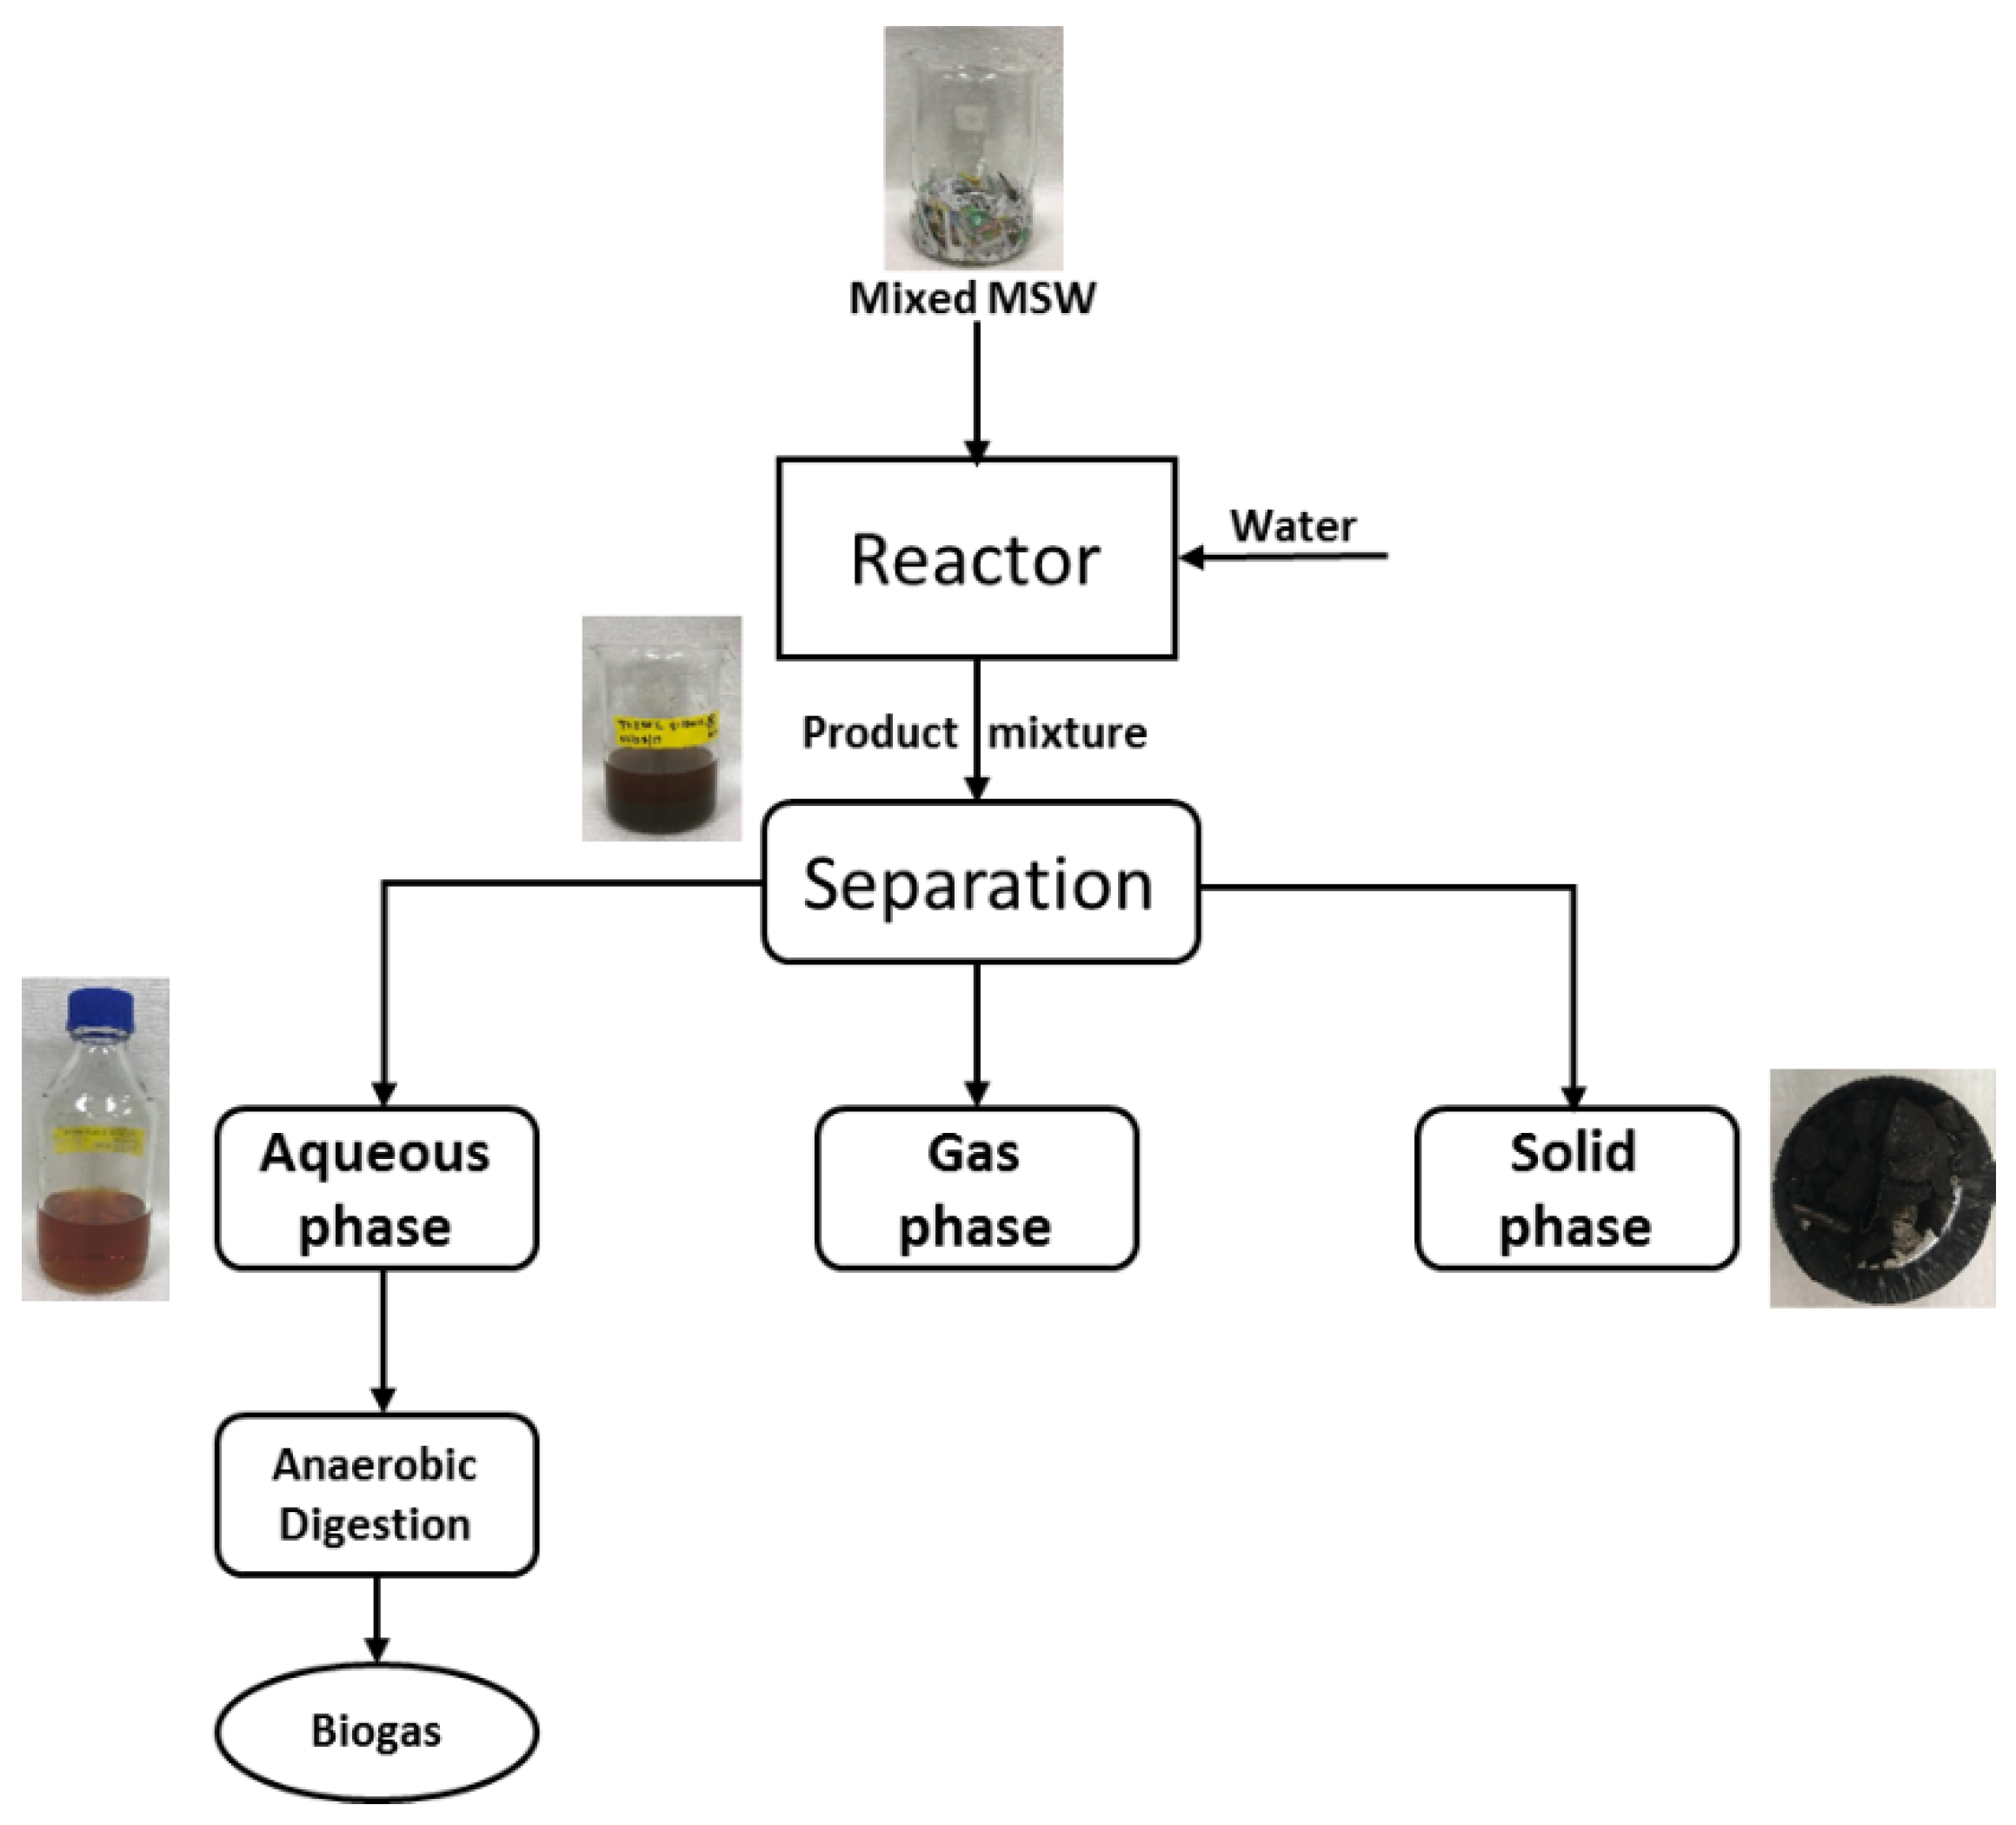
To specifically understand product composition after HTC of mixed MSW, and HTC MSW aqueous phase biodegradability while building on some of the work done by Berge et al., the purpose of this particular study was to (a) investigate carbonization experiments at different temperatures (250, 280, 310 °C) and residence times (10 min, 1 h, 6 h) (b) evaluate aqueous phase and hydrochar properties (c) perform AD bench scale bottle test on the aqueous phase to generate experimental data on biogas yields to understand biodegradability (Figure 1). There are many studies on hydrothermal treatment of a homogeneous biomass feedstock (e.g., grasses, woods, foods) and a few studies combining HTC and AD [3,4,9,11,12,13]. This study is the first of its kind to investigate varying temperature and times for a heterogeneous feedstock such as model mixed MSW that would typically go to the landfill, and further evaluating HTC MSW aqueous phase anaerobic biodegradability.
2. Materials and Methods
2.1. Feedstock
A mixture of known composition (paper, plastic, metal, glass, food) representing waste that typically goes to the landfill was created for the HTC feedstock (wt.% basis). Mixed MSW was simulated using the following materials, and deionized water (DI) was added to the mixture to obtain a solids concentration of 20 wt.%; 45.5% paper (shredded discarded office paper), 9.6% glass (crushed glass bottles), 16.4% plastic (shredded plastic bottles), 17.6% food (rabbit food pellets), 10.9% metal (shredded aluminum cans) [2].
2.2. Hydrothermal Carbonization Experiments
HTC of the mixed MSW feedstock was conducted using a 500 mL high pressure batch reactor (PARR 4570 Series). Literature reports HTC conditions ranging from 180–320 °C and residence times ranging from 5 min-12 h [14]. The following process conditions (250, 280, 310 °C) and (10 min, 1 h and 6 h) were chosen based on lower (250 °C) and high range (310 °C) HTC temperatures with a short, mid and long duration residence time, to compare HTC MSW end products and carbon distribution.
After the mixed MSW simulation feedstock was made and DI water was added for 20 wt.% solids, the experiment was run at 250, 280, 310 °C for 10 min, 1 h and 6 h in triplicate. It should be noted that 310 °C was only run for 10 min and 1 h. The process included a heating phase, reaction phase (when subcritical conditions and desired temperature were met), and cooling phase. After maintaining the desired temperature and time under autogenous pressure conditions, the reactor was rapidly cooled to ambient conditions using water through a cooling coil. After the reaction had taken place, the resulting mixture was placed in a beaker and the pH of aqueous phase was measured. The product mixture was vacuum filtered (1.5 µm, Whatman 47 mm glass microfiber filters). Subsequently, solids were placed in the oven at 105 °C for 24 h to remove moisture and the aqueous phase was measured and stored in the freezer (4 °C) for further analysis.
2.3. Anaerobic Digestion
Methods and Test Apparatus
AD was carried out using a batch bottle test and biogas yields were measured using water displacement. Graduated cylinders were inverted in 45 L bins (Sterilite) filled with water and gas production was monitored daily in mL of biogas produced. The following five HTC MSW aqueous phases were used for analysis; 250 °C (10 min, 1 h), 280 °C (10 min, 1 h), 310 °C (1 h); each condition was done in triplicate. For AD, an average of 1 g of chemical oxygen demand (COD) (~0.3 g TOC) was added to the bottles and 400 mL of inoculum. The inoculum (TS = 4.5%, VS = 77%) was obtained from anaerobic digesters at Hampton Roads Sanitation District (HRSD) Atlantic wastewater treatment plant (Virginia Beach, VA, USA). DI water was added to the 450 mL line to ensure equal headspace. The bottles were purged with nitrogen for 1 min to ensure anaerobic conditions in the headspace and were immediately sealed with rubber caps designed with inlets for gas measurements. One-eighth inch plastic tubes (Aqua Culture Standard Airline Tubing) were placed on the inlets and the tubes were connected from the bottle into the inverted graduated cylinder in the tubs filled with water. For 15 days, digestion bottles were placed in a heated water bath shaker (New Brunswick Scientific G-76D) at 37 °C (to maintain mesophilic conditions) and 40 rpm for mixing. Biogas was monitored daily and recorded in mL of biogas produced. Gas volume was corrected for water vapor, normal conditions (0 °C and 1 atm) and measured by subtracting the gas yield from the inoculum as a control. Gas chromatography (SRI 8610C) equipped with TCD/FID detectors was used to monitor presence of methane and carbon dioxide.
2.4. Analytical Methods
2.4.1. Hydrothermal Carbonization and Products: Solids and Gases
All solids (HTC MSW starting material and hydrochar) were tested for total solids, volatile solids and ash as described in ASTM E1756-08, EPA Method 1684, ASTM E1755-01, respectively. Elemental analysis (Thermo Finnigan Flash EA 1112 elemental analyzer) with 2,5-Bis (5-tert-butylbenzoxazol-2-yl) thiophene (BBOT) standard (certified no. 202147-10/03/2015, ThermoFisher Scientific, Cambridge, UK) was done in triplicate for starting material and HTC MSW hydrochar. Solids wt.% yield and higher heating value (HHV) using a modified Dulong equation [15], was calculated for the HTC MSW hydrochar. Thermogravimetric analysis (TGA) of hydrochar was performed using TGA-50H (Shimadzu Corporation) following ASTM D7582-15 standards to evaluate the fuel properties of the hydrochar. Burning profiles from the TGA are used to evaluate classes of coal (e.g., lignite, bituminous); thus, the burning profile was evaluated using 10 mg of the 280 °C at 10 min hydrochar. Compressed air was used at 50 mL/min with temperature ramped from 25 °C to 750 °C at 12.5 °C/min for 60 min and was held at 750 °C for 30 min. Brunauer, Emmett, and Teller (BET) analysis was carried out using a NOVA 2200e surface area and pore size analyzer (Quantachrome Instruments) to determine surface area of HTC MSW hydrochar; 0.2 g of sample was degassed for 4 h at 95 °C. Following a backfill with helium, the mass of the degassed sample was recorded. The sample cell containing the sample was then bathed in liquid nitrogen at −196 °C during the analysis period. The multi-point BET surface area of the sample was then measured. HTC MSW gas phase yields were calculated using the difference of the solid and aqueous phase yields.
2.4.2. Aqueous Phase
HTC MSW aqueous phase was analyzed for total solids, volatile solids and ash as described in ASTM E1756-08, EPA Method 1684, ASTM E1755-01, respectively. They were also tested for TOC and TN (total organic carbon/total nitrogen (TOC/TN) analyzer TOC-VCSN, Shimadzu equipped with an ASI-V auto sampler), COD using (HACH COD 20–1500 mg/L) digestion tubes and HACH DR/890 Colorimeter, and pH (Fisherbrand pH paper). Sugars and organic acids were measured by Thermo Scientific Dionex Ultimate 3000 HPLC equipped with Aminex HPX-87P column (sugars), and Aminex HPX-87H column (organic acids), and RefractoMax521 RI (refractive index) detector. All analyses were done in triplicate.
3. Results and Discussion
3.1. Hydrothermal Carbonization and Carbon Distribution
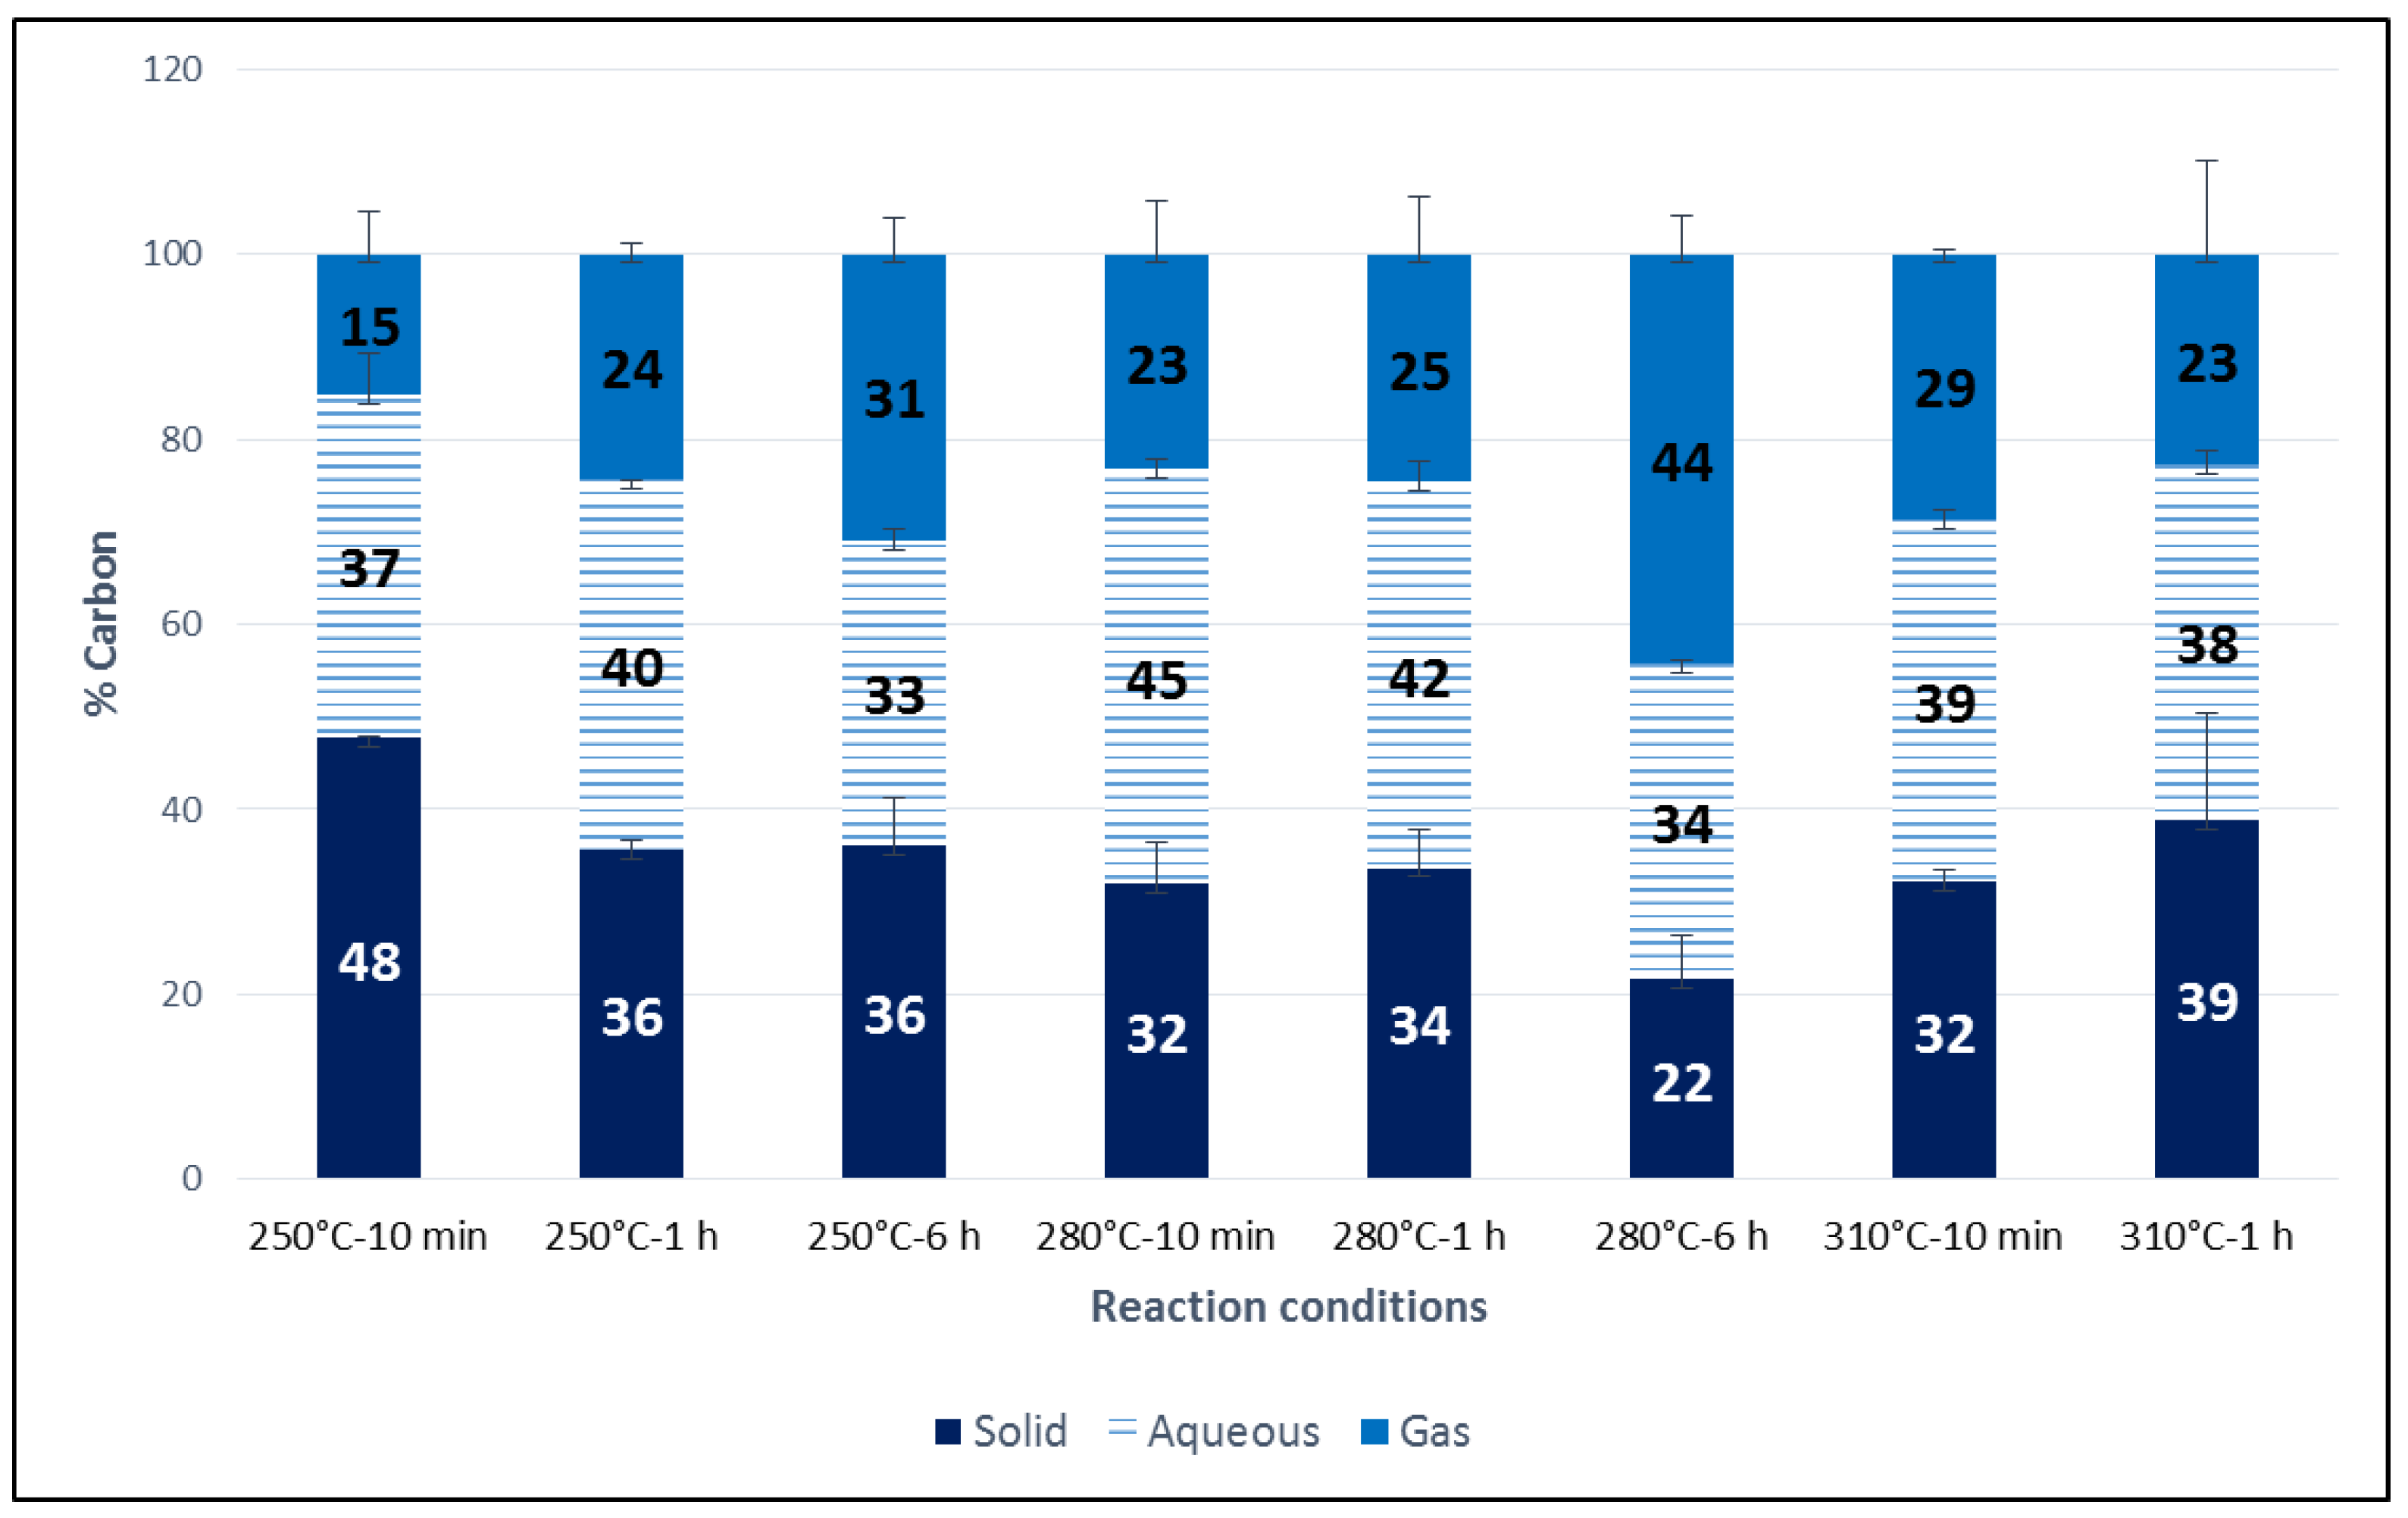
HTC was carried out at three different temperatures (250, 280, 310 °C) and three residence times (10 min, 1 h, 6 h) in order to investigate the effects of varying temperature and times for the mixed MSW feedstock. These temperatures were chosen as low, medium, and high range temperatures. Although residence times vary, times were chosen to represent a shorter to longer residence time. Any time over 6 h was ruled out because increased energy usage; HTC at 310 °C for a residence time of 6 h was not performed because of this higher temperature range. One previous study (using a 160 mL reactor at 250 °C for 20 h) was done for this mixed MSW feedstock; however, varying temperature and times were not investigated or optimized as it was not the focus of their research [2]. For this set of experiments, mass balance shows that 22–48% of carbon remained in the solid phase (hydrochar), 33–45% in the aqueous phase and 15–44% in the gas phase (Figure 2). The gas phase was calculated from the subtraction of aqueous and solid phases. Literature reports that the main composition of the HTC gas phase is carbon dioxide and trace amounts of CO, CH4, and H2 gases [16]. It should be stated as in many studies on HTC, that it is difficult to make direct comparisons especially with hydrochar content as all HTC factors (temperature, time, pressure, reactor design, concentration) all influence carbonization. The condition of 280 °C and 10 min yielded the highest carbon percentage in the aqueous phase (45%). By raising the temperature 30 °C from 250 °C, the residence time was decreased from 6 h to 10 min producing more carbon in the aqueous phase, less gas, and a solids percentage that of a longer residence time (Figure 2).
3.2. Aqueous Phase Composition
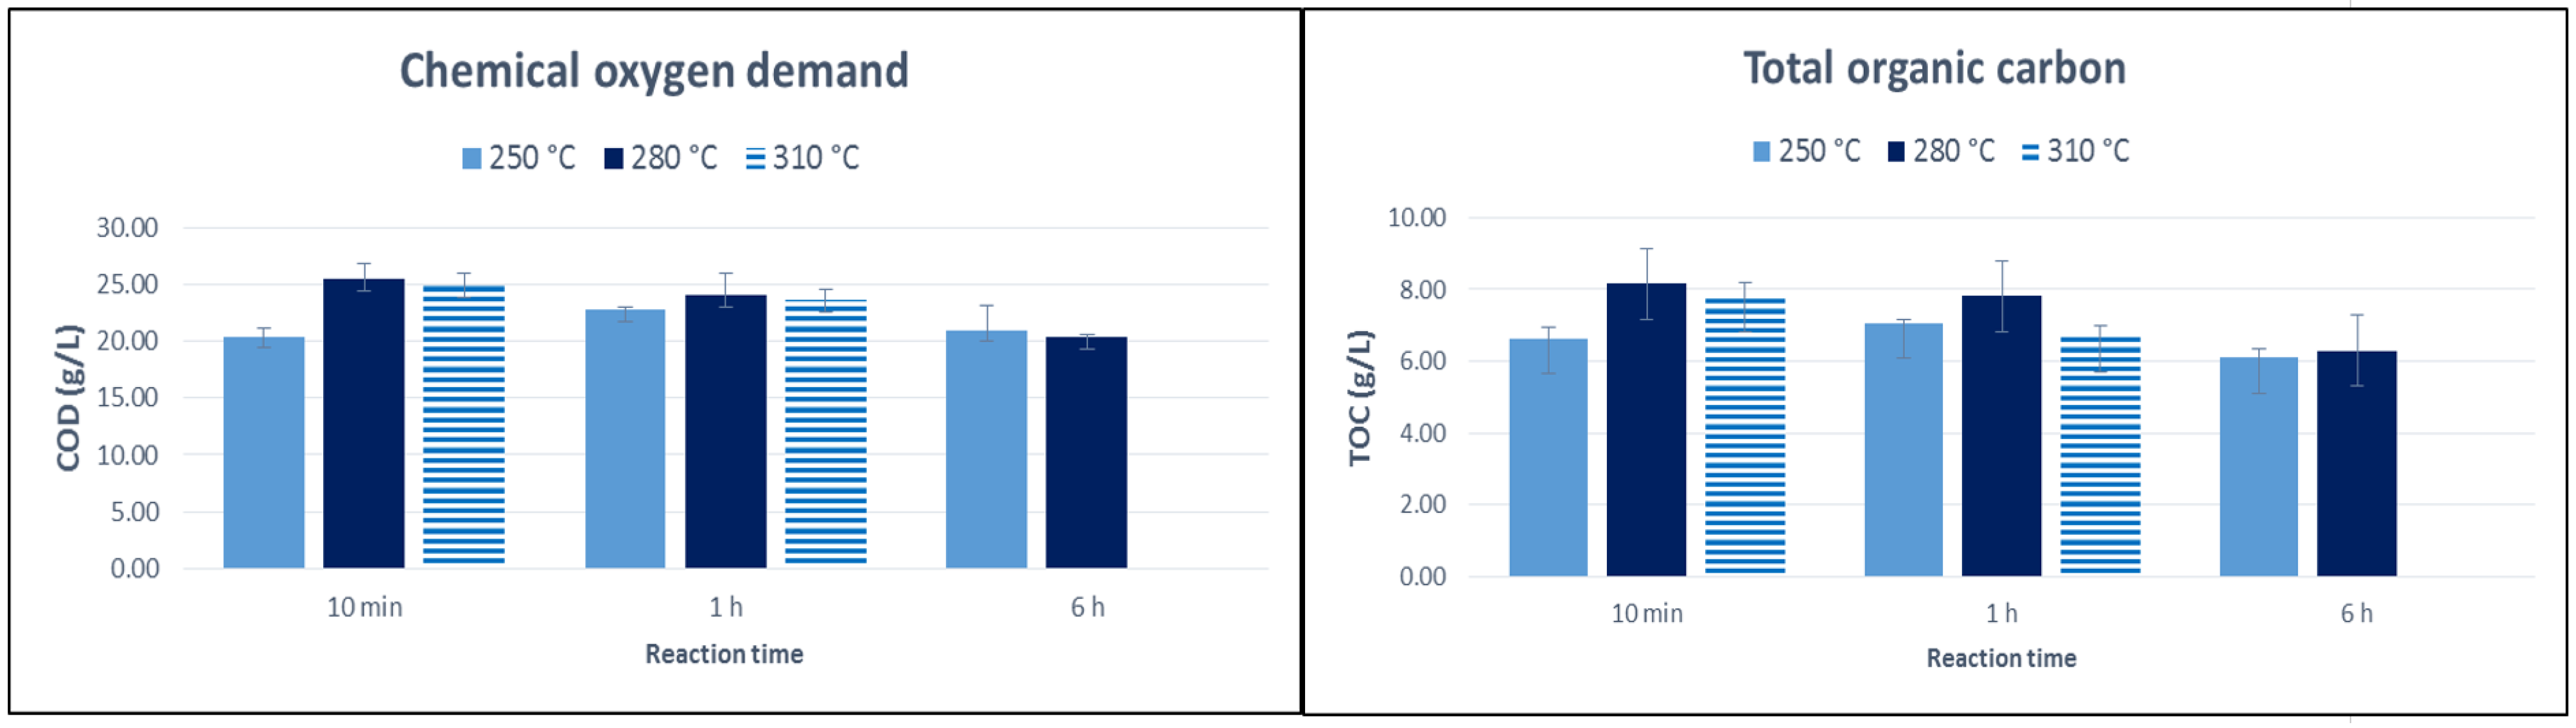
HTC MSW aqueous phase carbon percent yields ranged from 34–45% aligning with previous literature [3,4]. The condition of 280 °C at 10 min yielded the highest TOC at 8.16 g/L with others ranging from 6–7 g/L (Figure 3). Literature reports HTC aqueous phase ranging from 5–20 g/L [3]. A similar study done by Berge et al. using a similar feedstock reported aqueous phase TOC of 20 g/L and COD of 60 g/L. This reaction took place in a much smaller reactor (160 mL) for a longer time (20 h) at 250 °C, which could be a reason for higher aqueous phase TOC and COD yields compared to those done with a 500 mL reactor used for this study. TOC tended to decrease as temperature increased. An explanation for this is that the water soluble organics are intermediates in the formation of gas and oil/char; a higher percentage of gaseous compounds are a result of longer carbonization as can be seen with the reactions at 6 h [17]. COD values yielded higher amounts than TOC, which shows the presence of inorganics in the aqueous phase [9].
Several organic acids (e.g., lactic and acetic) and sugars were detected in the HTC MSW aqueous phase. The presence of sugars and organic acids are mainly due to the hydrolysis of cellulose and hemicelluloses and their degradation products such as furfural and hydroxymethylfurfural (HMF) [7,9]. HTC aqueous phase is a very complex mixture consisting of many different compounds as reported in literature [7]. The analysis of HTC MSW aqueous phase showed the major organic compounds were acetic acid and lactic acid (Table 1). Major sugars included mannose and xylose. Among other compounds, were trace amounts of formic acid, HMF and furfural. The condition of 280 °C and 10 min yielded 13.3 g/L of lactic acid which has potential for recovery. The pH for all aqueous phase samples ranged from 3–4 due to the presence of organic acids. A similar study reported only qualitative data for compounds present the in HTC MSW aqueous phase including acetic acid that was quantified in this study [2]. In this same study, phenols were also identified, and are commonly reported as a hinderances to anaerobic biodegradability.
The main TOC contributions for the HTC MSW aqueous phase are attributed to the carbonization of the organic components in the feedstock such as paper, food, and plastic. Shredded office paper contributes 45%, almost half of the total HTC feedstock weight, and moreover, is the main material (paper) discarded in landfills. A study conducting HTC on waste paper and recycling of the subsequent process water with process conditions of 200 °C for 16 h reported aqueous phase TOC and COD as 9.15 g/L and 24.8 g/L, respectively [18]. The results in this experiment at 280 °C for 10 min aqueous phase TOC and COD is 8.16 g/L and 25.48 g/L, respectively (Figure 3). They also identified lactic acid as the most abundant identified organic acid, which is also the case for this experimental data for the HTC MSW experiments. Although reaction conditions vary between the studies, these similarities could provide insight on the influence of paper on HTC aqueous phase composition.
3.3. Anaerobic Digestion of HTC MSW Aqueous Phase
The aqueous phases recovered from five HTC conditions were tested to investigate its biodegradability using the AD process. Table 2 shows total biogas production and mL of biogas produced per gram of TOC and COD. Biogas production ranged from 48–327 mL biogas/g TOC.
For these AD batch test, biogas was quantified as the combination of CH4 and CO2. A retention time of 15 days was used because the aqueous phase requires less time to degrade compared to conventional solid substrates with weeks to months of residence time.
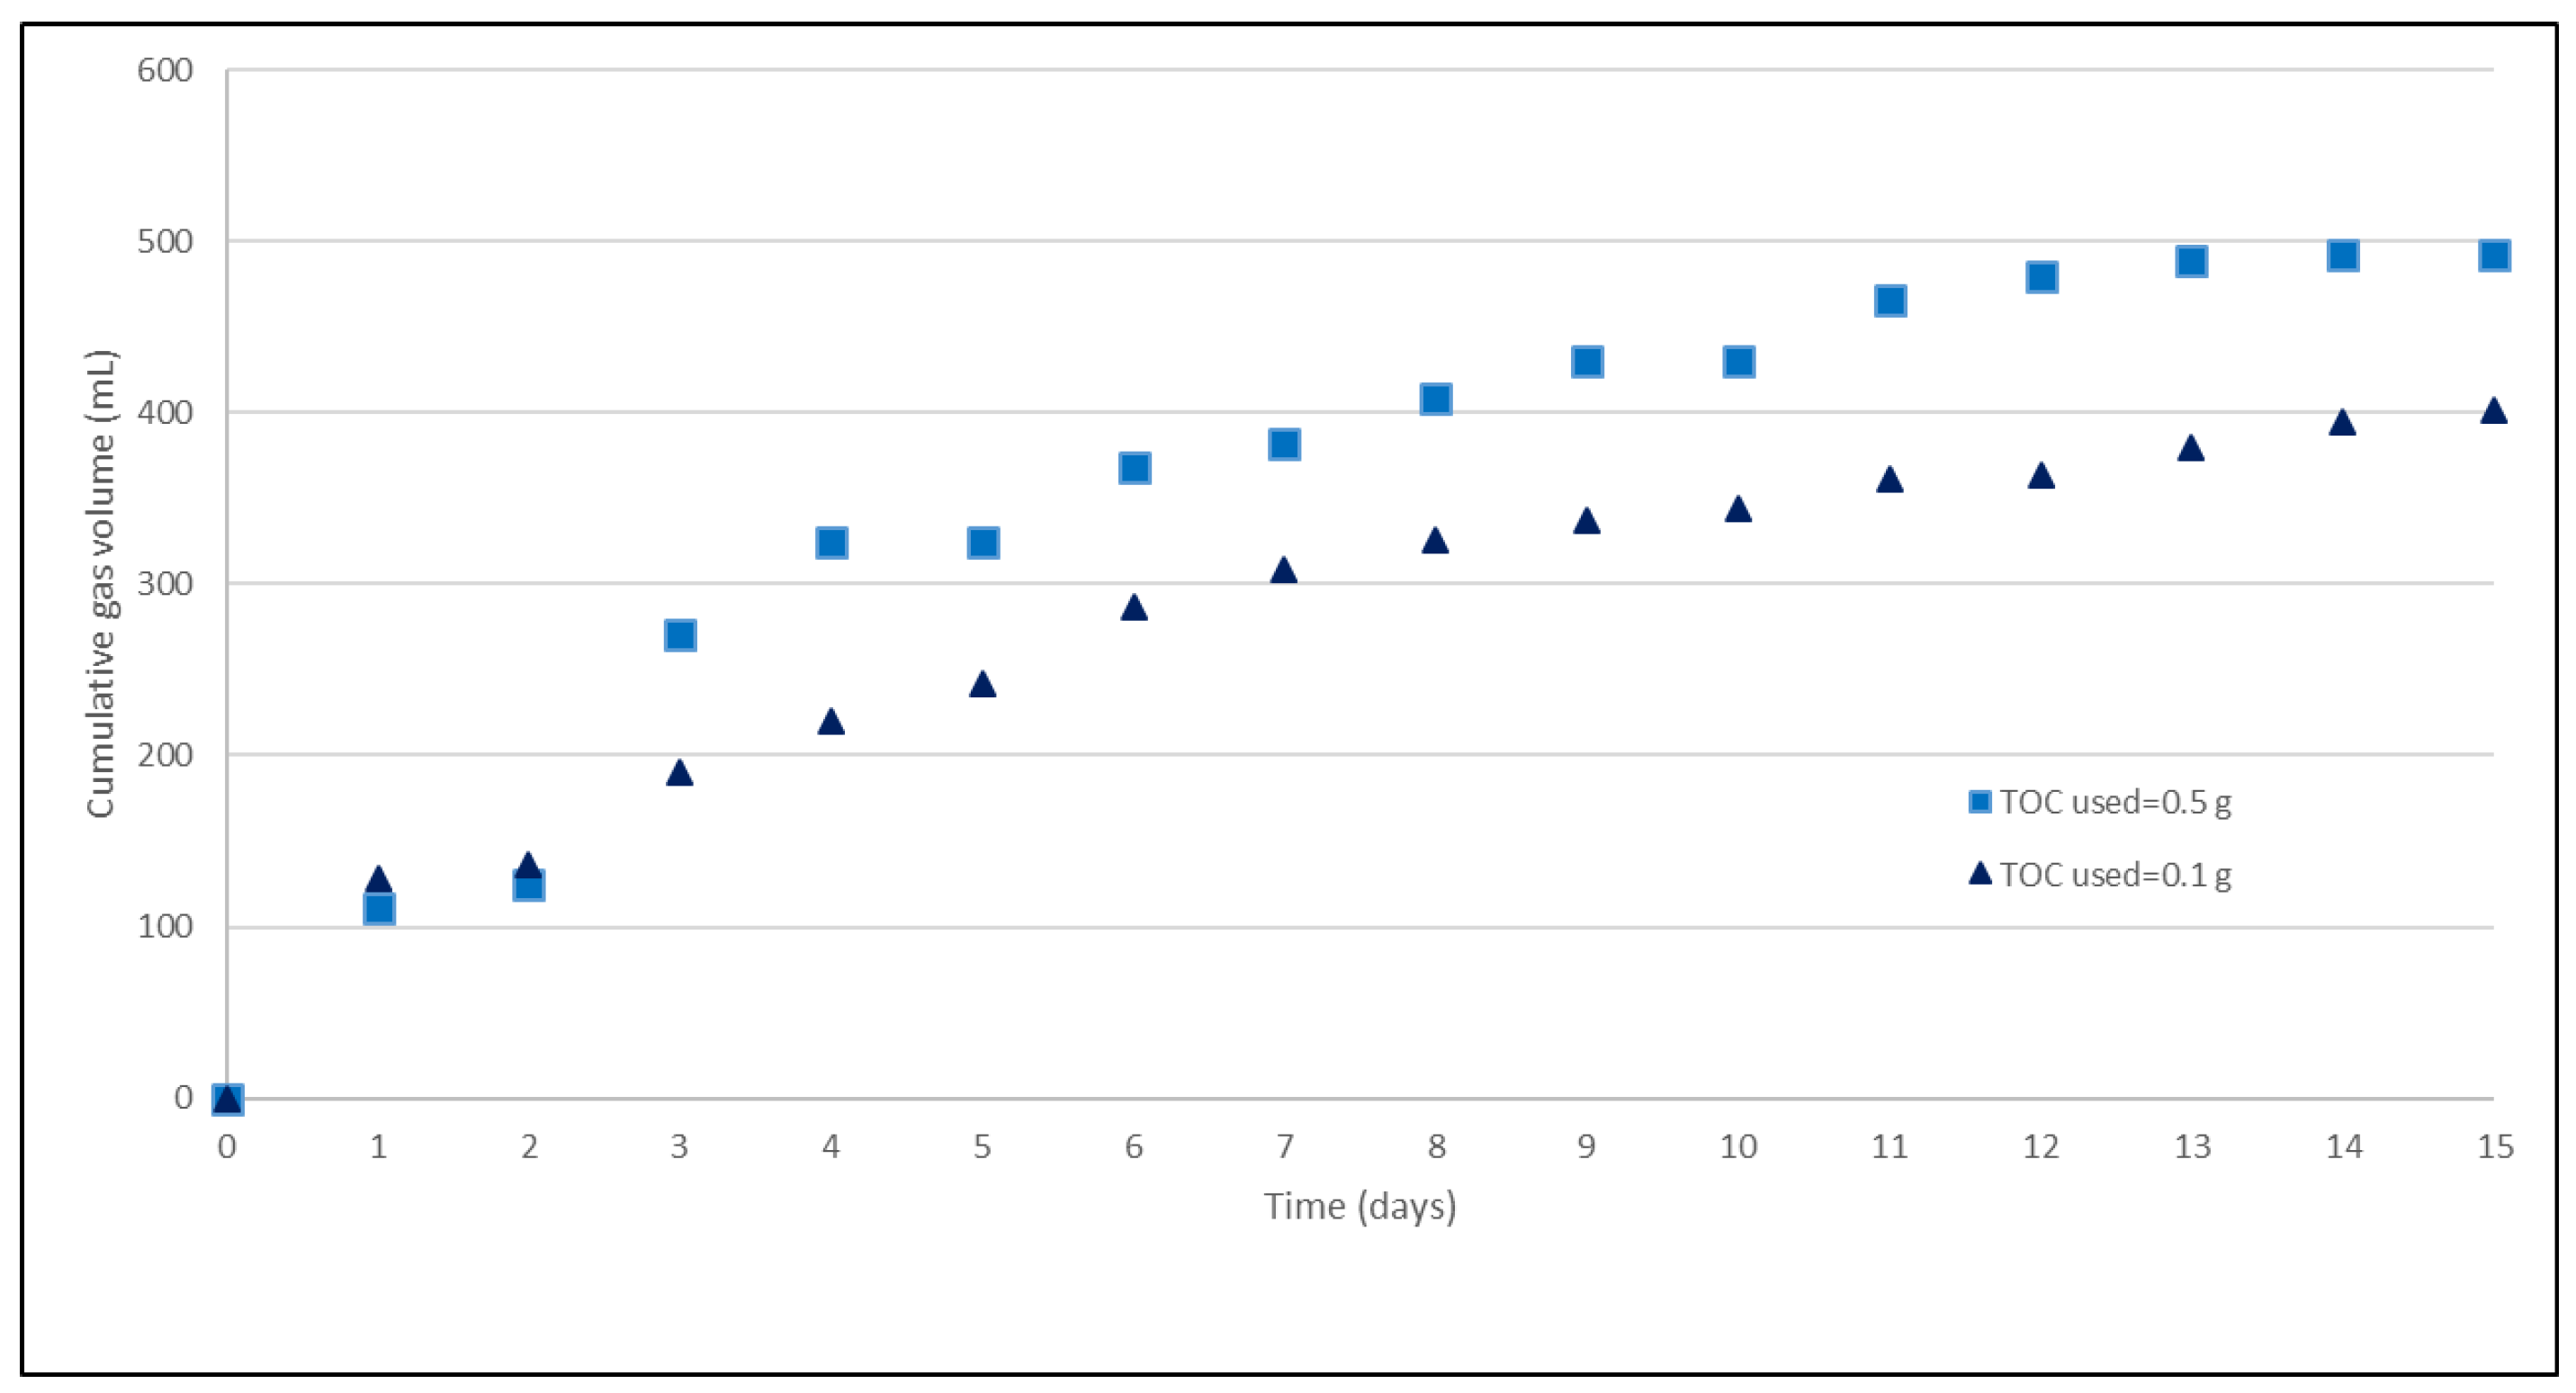
The condition of 280 °C and 10 min was highlighted to be the most ideal condition in these set of experiments due to its highest TOC yield in the aqueous phase, midrange temperature and shortest residence time of 10 min. Figure 4 shows two set of experiments varying the amount of TOC used at this condition and cumulative gas production of the two TOC concentrations (0.1 g and 0.5 g) at 280 °C for 10 min. Increasing the amount of TOC showed to increase the biogas yield. Literature reports daily biogas production increasing rapidly in the first 7 days due to readily available organics, which was also observed in this set of experiments [9]. Phenols are well known inhibitory compounds to AD performance. Literature reports that with phenol concentrations less than 500 mg/L, substrates were fermented to methane. Phenol concentrations ranging from 800–1200 mg/L, digestion was neither enhanced nor inhibited, but with phenol concentrations greater than 2000 mg/L, inhibition occurred [19]. To rule out any possible phenol inhibition to AD, total phenolics were tested for the 280 °C for 10 min condition which resulted in 16.1 mg/L which is well below reported values of phenol inhibition to AD.
On average 1 g COD was used for AD testing. Biochemical methane potential (BMP) is a procedure to determine methane production of an organic substrate during anaerobic biodegradability. BMPCOD theoretical is calculated based on the conversion of 1 g COD producing 0.35 L CH4 at normal temperature and pressure, to get a sense of the biodegradability of the HTC MSW aqueous phase. Theoretically, 1 g COD could produce 464 mL biogas assuming 60% of the biogas mixture is CH4 [20]. Literature reports biogas yields of 1.9–22.8 mL/mL of HTC wastewater used with batch experiments [5]. Other studies have shown biogas yields for sewage sludge process water of 500 mL biogas/g TOC, and 600 mL CH4/g TOC using corn silage HTC wastewater [21].
It is well known that AD involves the complex processes of hydrolysis, acidogenesis, acetogenesis, and methanogenesis. Methanogenesis is the energy yielding phase, or the phase which energy yielding products (CH4 and CO2) are produced. A major organic component of the HTC MSW aqueous phase was lactic acid ranging from 8.7–13.7 g/L. A study was done that investigated the influence of lactic acid on AD of kitchen waste, as lactic acid is the main fermentation product of kitchen waste during AD. Their study concluded that lactic acid had a negative influence on the performance of methanogenesis as a lower biogas productivity rate was seen during AD [22]. The condition of 280 °C and 10 min was the focus of these experiments mainly because of the highest TOC yield in the shortest residence time. Although this condition produced the highest TOC, the condition of 250 °C produced the highest biogas yield per gram of TOC (327.4 mL biogas/g TOC). Based on the previously mentioned study, lactic acid could affect the production of biogas in the energy producing step methanogenesis. The effects of lactic acid could be monitored for the potential of recovery and/or to improve biogas yields. Paper accounted for almost half the weight percent in the original mixed MSW feedstock. A study on HTC of waste paper performed BMP on the aqueous phase and biogas yields were 730 mL biogas/g of organic dry matter (ODM); they also noted a trend of faster biodegradability over the first several days due to readily available organic acids [18]. Along with pH, temperature, and concentration, the carbon to nitrogen (C/N) ratio is an important parameter in overall AD functionality and biogas production. Literature reports ammonia concentrations below 200 mg/L are beneficial to the AD process as nitrogen is essential to anaerobic microorganisms [23]. Biogas yields are highly dependent on the C/N ratio and optimal ranges are reported as 20–30 [24]. Table 2 also reports the C/N ratio of the HTC MSW aqueous phases used for this set of experiments. The condition of 250 °C and 10 min yielded the highest mL biogas/g TOC and subsequently had the lowest C/N ratio of 40—the lowest C/N ratio of all other conditions tested. All other C/N ratios were in the lower sixties which could explain the lower biodegradability.
To date and to the best of knowledge, there have been no other studies to test HTC aqueous phase of a mixed MSW feedstock which is the importance of these batch test, to show that it is feasible and can be done. These experiments are a proof of concept that the readily available TOC in the HTC MSW aqueous phase can be a feasible substrate for biogas production. Further studies should investigate using higher TOC concentrations, lactic acid recovery, and potential addition of a co-substrate to increase and maximize biogas production. Nitrogen addition and improving C/N ratio is essential in increasing the overall biogas yields and improving the AD system.
3.4. Solid Phase Composition
Hydrochar yields ranged from 35–56% (Table 3). The study using a similar feedstock has yields ranging from 29–63% [2]. The larger yields are due to the unmodified compounds such as the glass and metal. The char type material resulted mainly from the carbonization of the paper, food, and plastic. The lowest hydrochar yield came from the condition of 280 °C for 6 h and the highest at 250 °C for 10 min. At the lower temperature 250 °C for 10 min, the paper was still in the form of the original feedstock of shredded paper, showing that for this temperature, 10 min was not enough time to fully carbonize the feedstock to hydrochar.
The elemental composition of hydrochar is presented in Table 3. HTC of the mixed MSW feedstock resulted in HTC MSW hydrochar with higher percentages of carbon with reduced oxygen and ash. From the original feedstock (paper, plastic, food), there was a 40% increase in the HHV. Ash values ranged from 4.8–21.7%, increasing as residence time and temperature increased. The highest ash value of 21.7% resulted from the reaction condition of 310 °C for 1 h. Higher heating values were calculated using a modified Dulong’s equation [15] with values ranging from 19–25 (MJ/kg) which compares to the HHV of lower rank coals (e.g., lignite and sub-bituminous).
In other studies, HTC hydrochar trends have shown that as reaction temperature increases, energy content increases and hydrochar yields decrease. Generally, carbon content of hydrochar increases as temperature increases, resulting in an increase of HHV [21]. A trend that was observed for these experiments, is as time increased, HHV increased. Temperature increase causes the decomposition and removal of oxygen rich hemicellulose; therefore, increasing the HHV and fuel value
TGA and BET
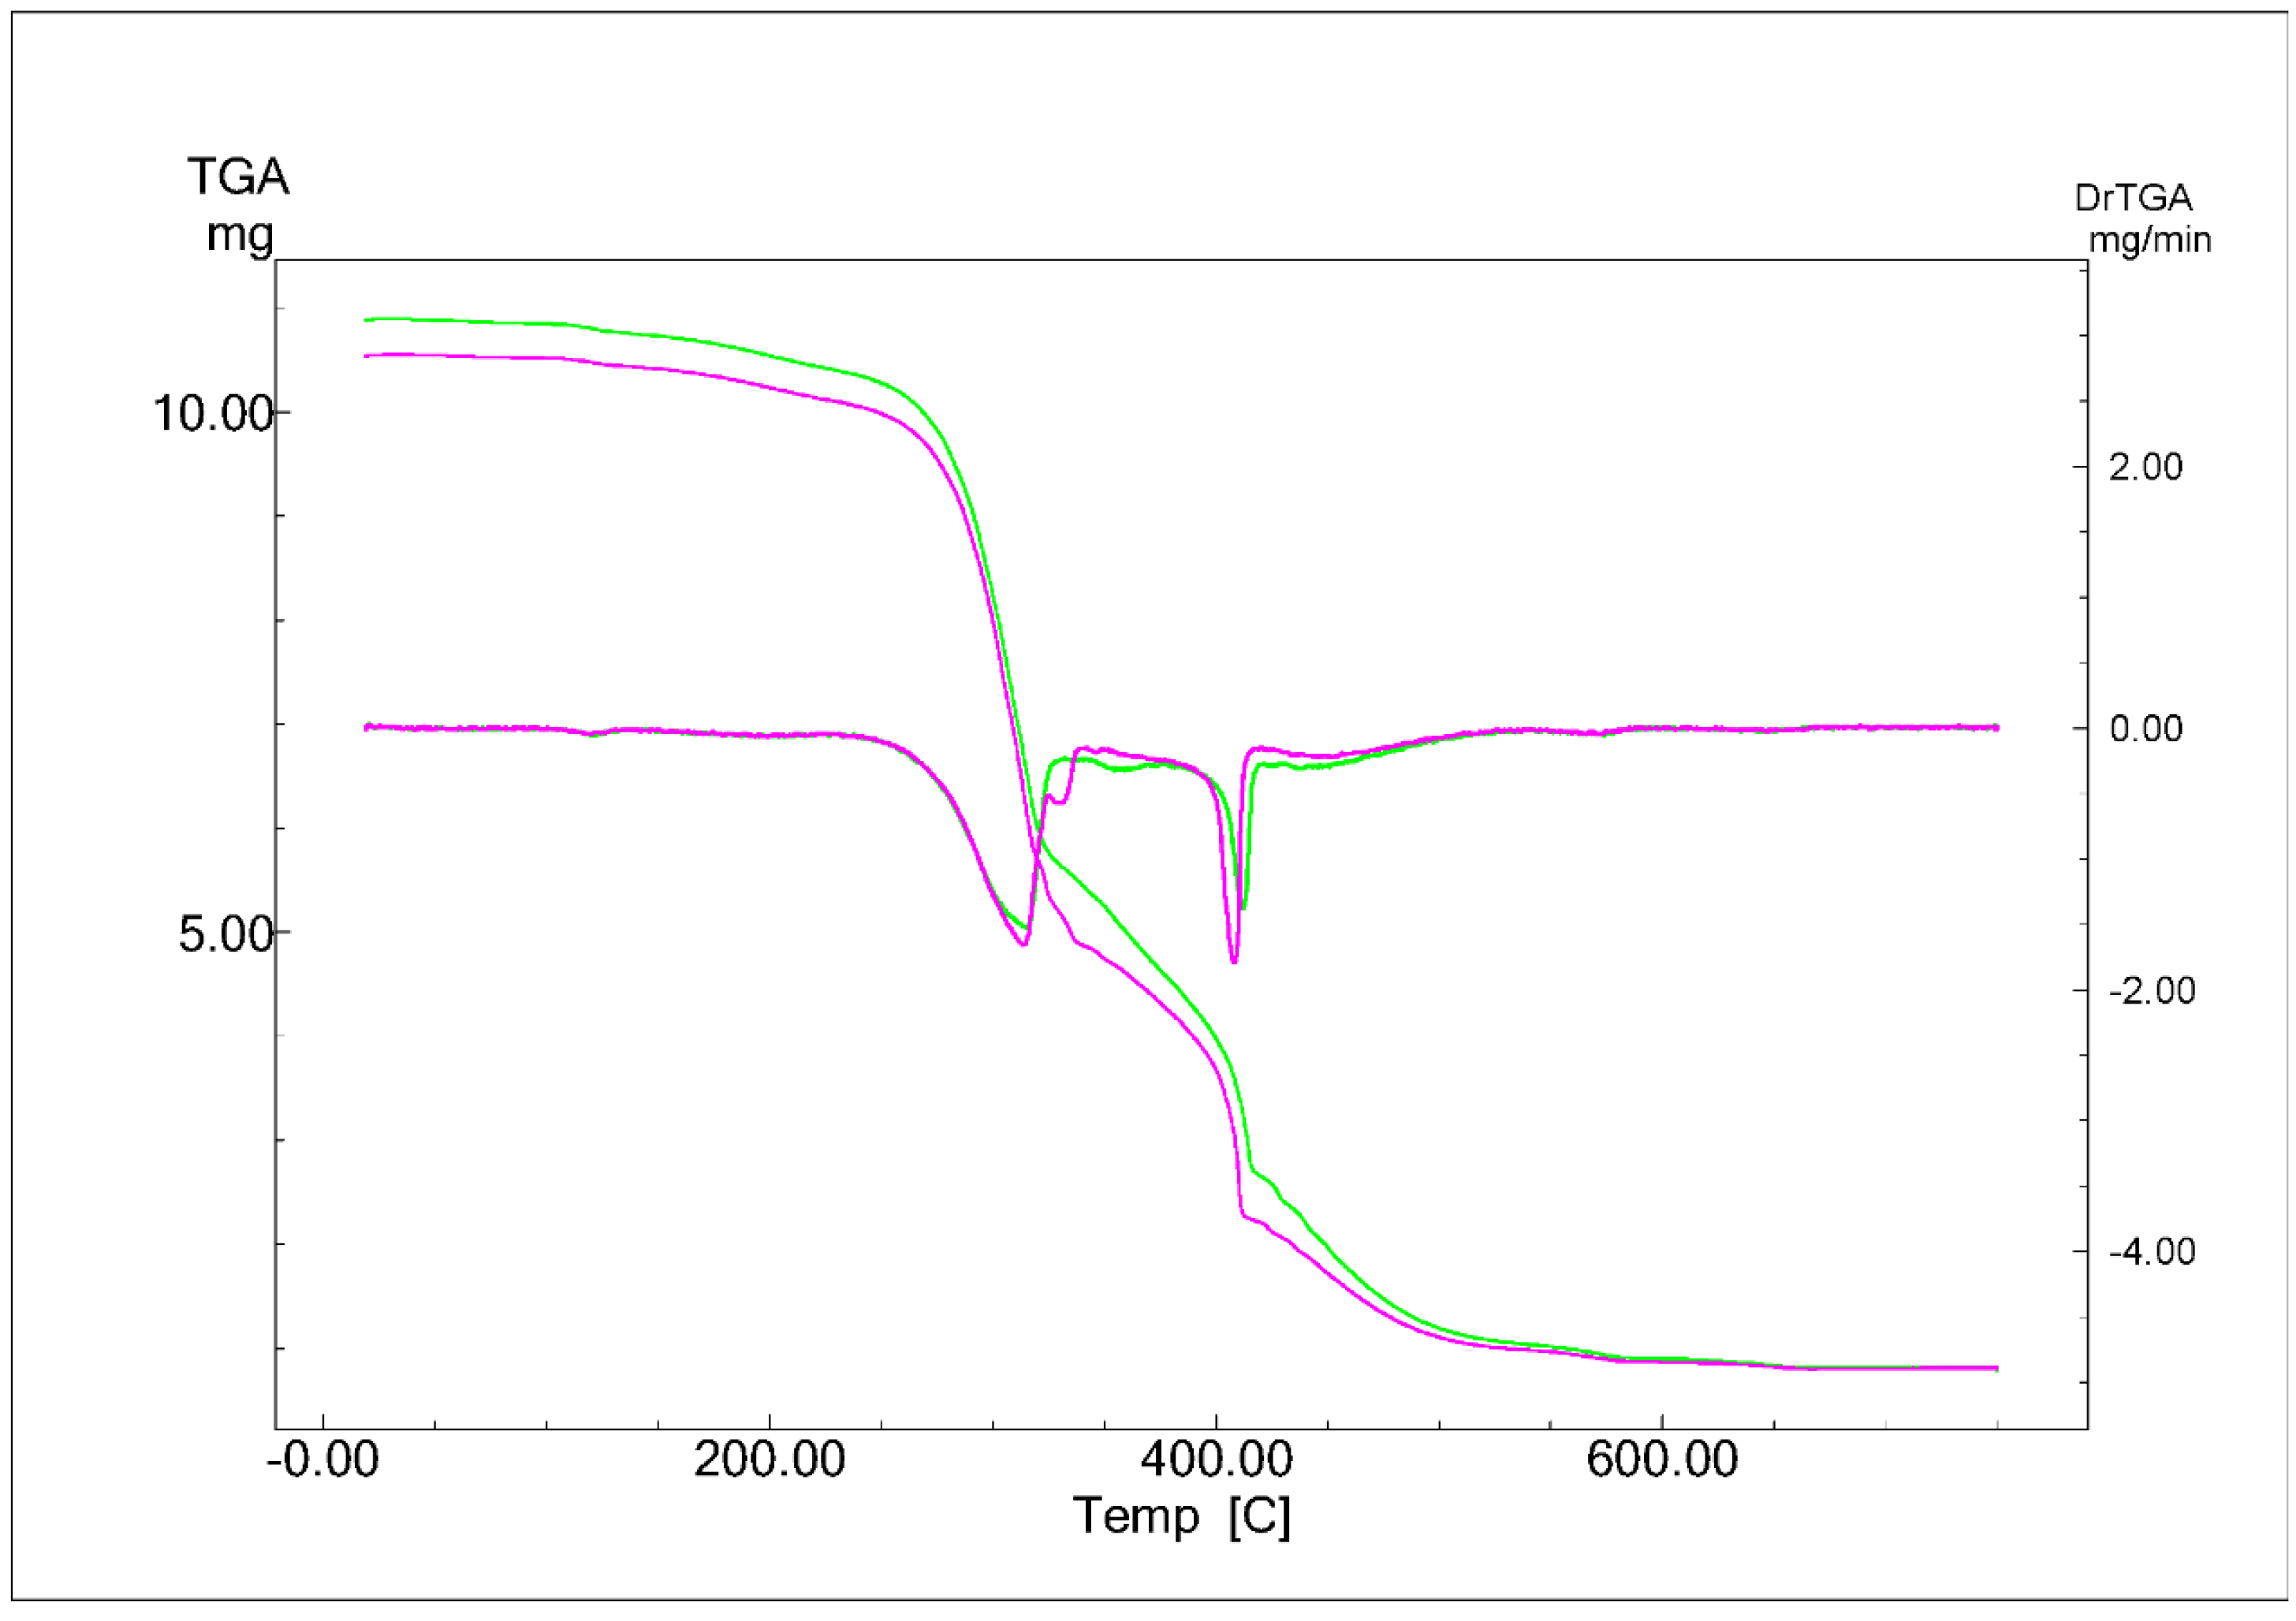
Although the focus of this study was not the hydrochar; thermogravimetric analysis (TGA) and BET surface area analysis were done to investigate potential fuel properties and hydrochar applications based on surface area, respectively. Hydrochar from the conditions of 280 °C and 10 min were used for these experiments. TGA burning profiles are used to compare the different rankings (i.e., lignite, bituminous etc.) of coal, as each has an idealized burning profile consisting of four elements found within the TGA chromatogram. In classifying coal category, the characterizing point is the “peak temperature (PT)” where weight loss is at the maximum, ranging from below 400 °C to above 700 °C [25]. The other components of the burning profile include the ignition temperature (IT), the fixed carbon ignition temperature (ITFC), and the burnout temperature (BT) [25]. Table 4 compares typical burning parameters of lignite, bituminous and anthracite coals with the HTC MSW hydrochar. The HTC MSW hydrochar temperatures were determined based off the derivative peaks in the TGA chromatogram (Figure 5), which was done in duplicate. Lignite coal’s burning profile typically has two peaks which is also seen in the burning profile of the HTC hydrochar signifying some resemblance to lignite grade coals.
There is much potential for hydrochar to be used as a soil amendment and even an aid in the AD process due to exposed pores during carbonization. The surface area of this hydrochar was on average 1.2 m2/g. There is a large range of hydrochar surface areas; however, literature reports that an increase in residence time does allow for modification of cellulose and hemicellulose which can positively affect surface area; 10 min was not enough time to effectively increase pore size and surface area [14]. The hydrochar that was tested had a HTC residence time of 10 min at 280 °C, which could be a reason for such a small average surface area. Paper, food, and plastic made up the components of the HTC MSW hydrochar. The BET analysis conditions of 95 °C were chosen because using higher temperatures expelled an oily substance from the hydrochar during the analysis. A reason for this is that the boiling point for plastic is around 105 °C, and during the BET analysis any plastic (biocrude) material within the hydrochar could have been modified.
3.5. Discussion
Material Balance
Figure 6 outlines the overall material balance of the two processes that were carried out to better understand the scope of the integrated HTC + AD process. Mass balances were calculated based on how much carbon entered the system and exited the system in the forms of solid, aqueous and gas phases. This figure simulates what would happen if 100 Kg C (230 Kg of the mixed MSW) was carbonized and the resulting aqueous phase used for AD, based on the experimental mass balance data for 280 °C and 10 min (Figure 2). The liters of biogas are calculated by using the highest experimental biogas yields of 222 mL biogas/g TOC. Biogas or the combination of CH4 and CO2 were quantified together for these batch AD experiments; therefore, for this simulation it was assumed that CH4 accounted for 60% and CO2 accounted for 40% of the biogas mixture in the calculation of Kg of C for biogas. Biogas composition depends on the substrate used but is reported to range from 50–70% CH4 and 30–40% CO2 [20].
Biogas typically has a thermal value of 22 MJ/m3 and methane with a thermal value of 36 MJ/m3. This process of using 100 Kg C could result in 218 MJ of energy production based of liters of biogas produced. When evaluating the mass balance, 5 Kg C exits the system as biogas. This now brings into question how to utilize the remaining 40 Kg (89%) of carbon, and why it was not digested.
Regarding HTC, there are limited studies investigating the aqueous phase; moreover, the aqueous phase of a mixed feedstock such as the model mixed MSW stream typically headed for the landfill. The closet study to work done in this paper investigates HTC of the organic fraction of MSW (OFMSW) coupled with AD [6,26]. The work done by Lucian et al. are great studies specifically for the organic fraction of municipal solid waste; however, this does not consider the fractions that still end up in the landfill (if not separated into organic fractions) and their fate. We have demonstrated that AD is feasible; however, improving digestion is critical in supporting the integrated HTC + AD process for treating MSW. Future testing should evaluate what routes would improve digestion including investigations on improving AD system conditions by lowering C/N ratios with nitrogen addition, aqueous phase pre-treatments, or co-digestion.
4. Conclusions
To date there have been a limited number of studies on HTC of mixed waste materials. The integrated approach (HTC and AD) showed organic carbon recovery of 58% in the form of hydrochar and biogas. On the commercial scale, HTC plants are considered biorefineries in which the hydrochar has been explored in more detail; however, taking full advantage of all exiting streams such as the HTC aqueous phase will maximize the use of these systems, and make the overall process more environmentally sustainable. To the best of our knowledge, there have been no other reports of investigating and understanding the biodegradability of a mixed MSW stream by varying residence time and temperature. This study is a proof of concept that AD of the HTC MSW aqueous phase is feasible and has potential to be improved upon. Future testing will focus on enhancing biogas yields from aqueous phase, and specific biogas composition. In order to recover, utilize, and maximize aqueous phase carbon, mass balance shows HTC MSW aqueous phase enhancement (e.g., pre-treatment, co-digestion) would be necessary for the integrated system.
Author Contributions
Conceptualization, K.J.A. and S.K.; Data curation, K.J.A.; Formal analysis, K.J.A.; Funding acquisition, B.S. and S.K.; Investigation, K.J.A.; Methodology, K.J.A. and B.S.; Resources, B.S. and S.K.; Supervision, B.S. and S.K.; Writing—original draft, K.J.A.; Writing—review & editing, K.J.A. All authors have read and agreed to the published version of the manuscript.
Funding
This research was funded by Fiberight, LLC. award number 500298-010.
Acknowledgments
The authors would like to acknowledge the ODU Biomass Research Laboratory (BRL), ODU Department of Civil and Environmental Engineering through which this project has been supported. The authors would also like to thank the ODU Chemistry Department; Oumar Sacko, and the Virginia Atlantic HRSD wastewater treatment plant (David Ewing) for their support in this project.
Conflicts of Interest
The authors declare no conflict of interest.
References
- U.S. Environmental Protection Agency (EPA). Advancing Sustainable Materials Management: 2017 Fact Sheet Assessing Trends in Material Generation, Recycling, Composting, Combustion with Energy Recovery and Landfilling in the United States; EPA: Washington, DC, USA, 2019.
- Berge, N.D.; Ro, K.; Mao, J.; Flora, J.R.V.; Chappell, M.A.; Bae, S. Hydrothermal Carbonization of Municipal Waste Streams. Environ. Sci. Technol. 2011, 45, 5696–5703. [Google Scholar] [CrossRef] [PubMed]
- Oliveira, I.; Blöhse, D.; Ramke, H.-G. Hydrothermal carbonization of agricultural residues. Bioresour. Technol. 2013, 142, 138–146. [Google Scholar] [CrossRef]
- Wirth, B.; Mumme, J. Anaerobic digestion of waste water from hydrothermal carbonization of corn silage. Appl. Bioenergy 2013, 1, 1–10. [Google Scholar] [CrossRef]
- Wirth, B.; Mumme, J.; Erlach, B. Anaerobic treatment of waste water derived from hydrothermal carbonization. In Proceedings of the 20th European Biomass Conference and Exhibition, Milan, Italy, 18–22 June 2012. [Google Scholar]
- Lucian, M.; Volpe, M.; Merzari, F.; Wüst, D.; Kruse, A.; Andreottola, G.; Fiori, L. Hydrothermal carbonization coupled with anaerobic digestion for the valorization of the organic fraction of municipal solid waste. Bioresour. Technol. 2020, 314, 123734. [Google Scholar] [CrossRef] [PubMed]
- Becker, R.; Dorgerloh, U.; Paulke, E.; Mumme, J.; Nehls, I. Hydrothermal carbonization of biomass: Major organic components of the aqueous phase. Chem. Eng. Technol. 2014, 37, 511–518. [Google Scholar] [CrossRef]
- DiStefano, T.D.; Belenky, L.G. Life-cycle analysis of energy and greenhouse gas emissions from anaerobic biodegradation of municipal solid waste. J. Environ. Eng. 2009, 135, 1097–1105. [Google Scholar] [CrossRef]
- Erdogan, E.; Atila, B.; Mumme, J.; Reza, M.T.; Toptas, A.; Elibol, M.; Yanik, J. Characterization of products from hydrothermal carbonization of orange pomace including anaerobic digestibility of process liquor. Bioresour. Technol. 2015, 196, 35–42. [Google Scholar] [CrossRef]
- Pardo, B.D.M.; Doyle, L.; Renz, M.; Salimbeni, A. Industrial Scale Hydrothermal Carbonization: New Applications for Wet Biomass Waste; ttz Bremerhaven: Bremerhaven, Germany, 2016. [Google Scholar]
- Marques, I.P. Anaerobic digestion treatment of olive mill wastewater for effluent re-use in irrigation. Desalination 2001, 137, 233–239. [Google Scholar] [CrossRef]
- Posmanik, R.; Labatut, R.A.; Kim, A.H.; Usack, J.G.; Tester, J.W.; Angenent, L. Coupling hydrothermal liquefaction and anaerobic digestion for energy valorization from model biomass feedstocks. Bioresour. Technol. 2017, 233, 134–143. [Google Scholar] [CrossRef]
- Zhao, K.; Li, Y.; Zhou, Y.; Guo, W.; Jiang, H.; Xu, Q. Characterization of hydrothermal carbonization products (hydrochars and spent liquor) and their biomethane production performance. Bioresour. Technol. 2018, 267, 9–16. [Google Scholar]
- Kambo, H.; Dutta, A. A comparative review of biochar and hydrochar in terms of production, physico-chemical properties and applications. Renew. Sustain. Energy Rev. 2015, 45, 359–378. [Google Scholar] [CrossRef]
- Channiwala, S.; Parikh, P. A unified correlation for estimating HHV of solid, liquid and gaseous fuels. Fuel 2002, 81, 1051–1063. [Google Scholar] [CrossRef]
- Funke, A.; Ziegler, F. Hydrothermal carbonization of biomass: A summary and discussion of chemical mechanisms for process engineering. Biofuels Bioprod. Biorefining 2010, 4, 160–177. [Google Scholar]
- Hoekman, S.K.; Broch, A.; Robbins, C. Hydrothermal Carbonization (HTC) of Lignocellulosic Biomass. Energy Fuels 2011, 25, 1802–1810. [Google Scholar] [CrossRef]
- Weiner, B.; Poerschmann, J.; Wedwitschka, H.; Koehler, R.; Kopinke, F.-D. Influence of process water reuse on the hydrothermal carbonization of paper. ACS Sustain. Chem. Eng. 2014, 2, 2165–2171. [Google Scholar] [CrossRef]
- Fedorak, P.M.; Hrudey, S.E. The effects of phenol and some alkyl phenolics on batch anaerobic methanogenesis. Water Res. 1984, 18, 361–367. [Google Scholar] [CrossRef]
- Jørgensen, P.J. Biogas-Green Energy; Faculty of Agricultural Sciences, Aarhus University: Aarhus, Denmark, 2009. [Google Scholar]
- Reza, M.T.; Andert, J.; Wirth, B.; Busch, D.; Pielert, J.; Lynam, J.G.; Mumme, J. Hydrothermal carbonization of biomass for energy and crop production. Appl. Bioenergy 2014, 1, 11–29. [Google Scholar] [CrossRef]
- Zhang, B.; Cai, W.-M.; He, P.-J. Influence of lactic acid on the two-phase anaerobic digestion of kitchen wastes. J. Environ. Sci. 2007, 19, 244–249. [Google Scholar]
- Chen, Y.; Cheng, J.J.; Creamer, K.S. Inhibition of anaerobic digestion process: A review. Bioresour. Technol. 2008, 99, 4044–4064. [Google Scholar] [CrossRef]
- Dioha, I.; Ikeme, C.H.; Nafi’u, T.; Soba, N.I.; Yusuf, M.B.S. Effect of carbon to nitrogen ratio on biogas production. Int. Res. J. Nat. Sci. 2013, 1, 1–10. [Google Scholar]
- Cumming, J.W.; McLaughlin, J. The thermogravimetric behaviour of coal. Thermochim. Acta 1982, 57, 253–272. [Google Scholar] [CrossRef]
- Lucian, M.; Volpe, M.; Gao, L.; Piro, G.; Goldfarb, J.L.; Fiori, L. Impact of hydrothermal carbonization conditions on the formation of hydrochars and secondary chars from the organic fraction of municipal solid waste. Fuel 2018, 233, 257–268. [Google Scholar] [CrossRef]
Figure 1.
Schematic diagram of the overall process flow.

Figure 2.
Distribution of carbon after HTC. Values are average of triplicate analysis. Error bars represent the standard deviation.
Figure 2.
Distribution of carbon after HTC. Values are average of triplicate analysis. Error bars represent the standard deviation.

Figure 3.
HTC MSW aqueous phase COD and TOC. Error bars represent the standard deviation.

Figure 4.
Cumulative biogas production for 280 °C and 10 min (0.1 g and 0.5 g TOC).

Figure 5.
TGA of HTC MSW hydrochar (condition 280 °C, 10 min) done in duplicate (pink and green lines). Peaks in derivative graph represent the burning profile of the hydrochar.
Figure 5.
TGA of HTC MSW hydrochar (condition 280 °C, 10 min) done in duplicate (pink and green lines). Peaks in derivative graph represent the burning profile of the hydrochar.

Figure 6.
Overall material balance of HTC + AD combined process.


Table 1.
Major compounds in HTC MSW aqueous phase.
| T (°C) | Time | Acetic Acid (g/L) | Lactic Acid (g/L) | Mannose (g/L) | Xylose (g/L) |
|---|---|---|---|---|---|
| 250 | 10 min | 0.3 | 8.7 | 2.0 | 0.9 |
| 250 | 1 h | 0.5 | 10.4 | 2.0 | 2.0 |
| 250 | 6 h | 0.5 | 10.1 | 1.9 | 1.6 |
| 280 | 10 min | 0.5 | 13.3 | 1.6 | 2.2 |
| 280 | 1 h | 0.6 | 13.1 | 1.8 | 2.6 |
| 280 | 6 h | 0.7 | 10.4 | 1.2 | 3.1 |
| 310 | 10 min | 0.6 | 13.7 | 2.1 | 3.4 |
| 310 | 1 h | 0.7 | 11.2 | 1.9 | 3.5 |
Table 2.
Biogas production of HTC MSW aqueous phase and comparisons from literature.
| HTC MSW Aqueous Phase | T (°C) | t | mL biogas/g COD | mL biogas/g TOC | Carbon Nitrogen Ratio (C/N) |
|---|---|---|---|---|---|
| Comparisons from literature | 250 | 10 min | 109.4 | 327.4 | 40 |
| 250 | 1 h | 15.0 | 48.0 | 61 | |
| 280 | 10 min | 70.0 | 222.0 | 63 | |
| 280 | 1 h | 35.5 | 103.3 | 68 | |
| 310 | 1 h | 24.0 | 84.9 | 57 | |
| Corn silage HTC aqueous phase [4] | 220 | 6 h | 600 mL CH4/g TOC | 23 | |
| Orange pomace HTC aqueous phase [9] | 260 | 2 h | 295.6 | -- | |
| Sewage sludge HTC aqueous phase [17] | 200 | 6 h | 180 mL CH4/g COD | -- | |
| Food waste HTC aqueous phase [13] | 260 | 4 h | 58 mL CH4/g COD | -- | |
| Organic fraction MSW HTC aqueous phase [6] | 180 | 1 h | 205 mL CH4/g COD |
Table 3.
Characteristics of initial feedstock and produced HTC MSW hydrochar.
| TS (%DW) | VS (%DW) | Ash (%DW) | C (wt.%) | N (wt.%) | H (wt.%) | O (wt.%) | HHV (MJ/Kg) | Solids Yield (wt.%) | ||
|---|---|---|---|---|---|---|---|---|---|---|
| initial feedstock | ||||||||||
| paper | 93.4 | 92.0 | 7.5 | 37.2 | 0.0 | 5.5 | 49.8 | 14.2 | - | |
| food | 90.5 | 93.3 | 6.1 | 42.7 | 6.5 | 4.0 | 40.7 | 15.2 | - | |
| plastic | 98.1 | 0.0 | 0.0 | 64.0 | 0.0 | 4.3 | 31.7 | 24.1 | - | |
| hydrochar | ||||||||||
| T (°C) | t | |||||||||
| 250 | 10 min | 93.5 | 94.4 | 4.8 | 47.7 | 0.5 | 5.7 | 41.4 | 19.0 | 56 |
| 250 | 1 h | 98.6 | 95.0 | 4.8 | 55.1 | 0.9 | 4.9 | 34.3 | 21.3 | 43 |
| 250 | 6 h | 98.7 | 91.7 | 8.2 | 62.4 | 1.3 | 4.6 | 23.6 | 24.6 | 41 |
| 280 | 10 min | 99.8 | 93.5 | 6.4 | 60.1 | 1.1 | 4.6 | 27.7 | 23.4 | 39 |
| 280 | 1 h | 97.4 | 92.5 | 10.5 | 61.5 | 1.3 | 5.0 | 21.7 | 24.9 | 40 |
| 280 | 6 h | 96.3 | 91.6 | 16.9 | 52.7 | 0.7 | 4.3 | 25.4 | 20.5 | 35 |
| 310 | 10 min | 97.9 | 91.3 | 16.1 | 54.5 | 1.1 | 4.6 | 23.8 | 21.6 | 41 |
| 310 | 1 h | 91.6 | 84.2 | 21.7 | 58.0 | 1.3 | 5.0 | 13.9 | 24.2 | 41 |
Table 4.
Comparison of burning parameters of common coal types with experimental HTC MSW hydrochar [25].
Table 4.
Comparison of burning parameters of common coal types with experimental HTC MSW hydrochar [25].
| Lignite | Bituminous 1 | Bituminous 2 | Anthracite | HTC MSW Hydrochar | |
|---|---|---|---|---|---|
| IT (°C) | 210 | 350 | 340 | 480 | 270 |
| Main PT (°C) | 500 | 555 | 555 | 665 | 412 |
| BT (°C) | 540 | 665 | 690 | 785 | 660 |
Publisher’s Note: MDPI stays neutral with regard to jurisdictional claims in published maps and institutional affiliations. |
© 2021 by the authors. Licensee MDPI, Basel, Switzerland. This article is an open access article distributed under the terms and conditions of the Creative Commons Attribution (CC BY) license (https://creativecommons.org/licenses/by/4.0/).
Share and Cite
MDPI and ACS Style
Adams, K.J.; Stuart, B.; Kumar, S. Investigation of Anaerobic Digestion of the Aqueous Phase from Hydrothermal Carbonization of Mixed Municipal Solid Waste. Biomass 2021, 1, 61-73. https://0-doi-org.brum.beds.ac.uk/10.3390/biomass1010005
AMA Style
Adams KJ, Stuart B, Kumar S. Investigation of Anaerobic Digestion of the Aqueous Phase from Hydrothermal Carbonization of Mixed Municipal Solid Waste. Biomass. 2021; 1(1):61-73. https://0-doi-org.brum.beds.ac.uk/10.3390/biomass1010005
Chicago/Turabian StyleAdams, Kameron J., Ben Stuart, and Sandeep Kumar. 2021. "Investigation of Anaerobic Digestion of the Aqueous Phase from Hydrothermal Carbonization of Mixed Municipal Solid Waste" Biomass 1, no. 1: 61-73. https://0-doi-org.brum.beds.ac.uk/10.3390/biomass1010005