The 10/5 Repeated Jumps Test: Are 10 Repetitions and Three Trials Necessary?


1
Human Performance Laboratory, Directorate of Psychology and Sport, University of Salford, Greater Manchester M6 6PU, UK
2
Department for Sport and Exercise Sciences, Musculoskeletal Science and Sports Medicine Research Centre, Manchester Metropolitan University, Manchester M15 6BH, UK
*
Author to whom correspondence should be addressed.
Biomechanics 2021, 1(1), 1-14; https://0-doi-org.brum.beds.ac.uk/10.3390/biomechanics1010001
Submission received: 11 November 2020
/
Revised: 23 November 2020
/
Accepted: 25 November 2020
/
Published: 8 December 2020
Abstract
:The purpose of this study was to identify whether ten repetitions and three trials were necessary to achieve stability in peak reactive strength index (RSI) during the 10/5 repeated jumps test (RJT). Twenty-five males, from multiple sports, performed three trials of the RJT on an in-ground force plate, with 90 seconds’ rest between trials. Intraclass correlation coefficients (ICC = 0.916–0.986) and coefficients of variation (CV ≤ 14.5%) were considered acceptable for all variables. Repeated-measures analysis of variance and Freidman’s tests revealed large and significant differences (p ≤ 0.006, η2 = 0.159–0.434, power ≥ 0.859) in ground contact time (GCT), jump height (JH), and subsequently RSI both between trials and repetitions. Pairwise comparisons revealed that repetitions 1–3 produced longer GCTs (p ≤ 0.05, d = 0.41–1.40), lower JHs (p ≤ 0.05, d = 0.31–0.56), and lower RSI values (p ≤ 0.05, d = 0.35–1.24). The shortest GCTs, greatest JHs and greater RSIs occurred between repetitions 7 and 10, with approximately 60% of peak RSIs occurring during these ranges. The sequential estimate technique revealed that seven repetitions were needed to attain stability in mean peak RSI. Non-significant (p = 0.554) and negligible differences (d ≤ 0.09) in the five best RSIs between trials were noted. One trial of the 10/5 RJT is sufficient to evaluate peak RSI in athletes and should reduce data collection time and fatigue.
1. Introduction
The 10/5 repeated jumps test (RJT) was first introduced by Harper, Hobbs and Moore [1] as an alternative method for evaluating reactive strength index (RSI) in athletes. This test requires the subject to execute 10 maximal vertical rebound jumps, whilst attempting to maintain a ground contact time (GCT) of <250 ms. Of the 10 repetitions recorded, the top five that display the greatest jump height, whilst minimising GCT below 250 ms, are used for subsequent analysis [1]. More commonly, RSI has been calculated for athlete monitoring purposes by the use of the drop jump (DJ) [2,3,4,5,6] and several types of rebound jumps, which typically vary between the 10/5 RJT [1,7], five max rebound test [8,9] and 60 s rebound test [10]. RSI measures an athlete’s stretch shortening cycle (SSC) ability and is a fundamental quality that underpins dynamic performance in 60 m sprinting [11], acceleration over 10 m [12] and change of direction tasks [13]. RSI is calculated by dividing jump height (JH) by GCT [14,15]. The SSC is comprised of an eccentric contraction immediately followed by a concentric contraction. It has been suggested that the above-mentioned tests should be performed with a GCT of less than 250 ms in order to assess so-called “fast” SSC ability [16]. Conversely, the assessment of “slow” SSC ability is routinely performed via depth jump or countermovement jump (CMJ) testing, as these involve more prolonged GCTs or time to take off values (>250 ms) [2].
Studies have explored the reliability of RSI when assessed via DJs [4,6], as well as using the DJ to determine optimal drop height (via peak RSI) [6,17]. Beattie and Flanagan [4] aimed to establish between-trial and inter-day reliability of RSI, derived from a 40 cm DJ (DJ-RSI) using an electronic contact mat. The authors concluded that DJ-RSI is a reliable measure both between trials (coefficient of variation [CV] = 5.27%, intraclass correlation coefficient [ICC] = 0.90) and across days (CV = 8.47%, ICC = 0.93) [4]. These findings corroborate with Markwick et al. [6], who reported acceptable reliability (CV < 8.0% and ICC > 0.80) for DJ-RSI attained across several drop heights (20, 30, 40 and 50 cm). However, it is important to note that reliability of the variables measured in a DJ-RSI test (including JH and GCT) could potentially be dependent on the equipment used for data collection, the subjects recruited and the environment in which testing has been conducted [4]. Thus, these factors require investigation in different populations and with different data collection procedures.
Surprisingly, there is limited research surrounding the 10/5 RJT since it was introduced as a new assessment to measure an athlete’s RSI [1]. The authors [1] reported a relatively low CV for the 10/5 RJT (9%) and also stated that the 10/5 RJT provides consistent results after just two trials. However, Harper et al. [1] do not explicitly state which variable this is for. Since then, research on the 10/5 RJT has investigated the reliability and usefulness of the assessment in both male [8] and female athletes [7] and has been used to evaluate reactive strength fatigue [10]. Comyns et al. [8] investigated the reliability and usefulness of RSI derived from the 10/5 RJT and five max-test (one CMJ, four repeated jumps). The authors found that both rebound tests were deemed reliable when measuring the fast SSC ability of male and female field-sport athletes. However, the authors questioned its usefulness for daily/weekly monitoring, as the typical error was higher than the smallest worthwhile change for their male, female and pooled subjects when using the OptoJump system as a measure of assessing their athletes [8]. Despite the 10/5 RJT being reported as reliable across numerous studies [1,8] it does not come without its limitations. Collecting 10 consecutive maximal jumps over three trials, could potentially prove to be quite time consuming for practitioners, who desire time-efficient methods for evaluating RSI. Additionally, performing 10 repetitions and three trials of repeated jumps may induce unnecessary fatigue and importantly, it could be argued that performing 30 repeated landings may predispose athletes to greater risk of sustaining ankle or knee injuries due to the increased exposure to loading. Thus, this raises the question as to whether 10 repetitions and three trials are necessary for evaluating athletes’ RSI values.
Based on the aforementioned limitations, the aim of this study was to identify whether 10 repetitions and three trials are necessary to achieve peak RSI in the 10/5 RJT protocol, and compare reliability measures between trials, while concurrently assessing the stability of the mean. Additionally, this study aimed to identify how many trials would be sufficient to ensure the test still produces reliable and comparable results. It was hypothesised that all metrics would demonstrate high and acceptable reliability. Due to the requirements of the 10/5 RJT, subjects may be exposed to a learning and/or coordination/potentiation effect. Therefore, it was hypothesised that greater RSI values would occur with the later repetitions, but similar values would be attained between trials.
2. Materials and Methods
2.1. Subjects
Twenty-five males (age [years] = 24.13 ± 5.44, height [m] = 1.80 ± 0.10 and mass [kg] = 82.34 ± 10.44—values reported as the mean ± standard deviation) from multiple sports were recruited and provided written informed consent to participate in this study. Subjects competed in both team and individual sports and regularly completed one competitive match and two skill sessions per week, and all possessed a minimum of 1 year’s resistance training experience. This study was approved by the institutional faculty ethics committee (ethics approval number: HST1718-357) and conformed to the Code of Ethics of the World Medical Association (Declaration of Helsinki).
2.2. Design
This study used a within-subjects repeated-measures, cross-sectional research design, whereby subjects performed three trials of the 10/5 RJT during one testing session.
2.3. Methodology
The testing occurred in a Human Performance Laboratory setting. Before the testing procedures began, all subjects refrained from physical activity for at least 24 h. Subjects completed a total of 30 jumps: three sets of 10/5 repeated jumps with 90 seconds’ rest between sets. Prior to the test, each subject completed a standardized warm up consisting of a 60 s light jog, 10 body weight squats, and 10 lunges followed by a self-selected range of dynamic stretches [18].
10/5 RJTs: An in-ground 90 × 60 cm Advanced Mechanical Technology, Inc. (AMTI) force plate (Watertown, MA, USA) was used to collect vertical ground reaction force (GRF) data and subsequently RSI and its constituent parts. Before the subjects stood onto the force plate, it was zeroed. Eleven jumps were completed in total, but the first was excluded because it was a CMJ that initiated the ‘bounce’ technique for the remaining 10 repeated jumps. The GRF data were collected for 15 s at a sampling rate of 1000 Hz. Qualisys Track Manager (Qualisys ltd, Gothenburg, Sweden) was used to collect the unfiltered vertical GRF data, where it was exported as text files and analysed using a bespoke Excel spreadsheet (Microsoft Corporation, Washington, CD, USA) to calculate RSI, JH and GCT. Each subject placed their hands on their hips to isolate the contribution from the lower limbs. Subjects were given the verbal instruction to ‘to jump as high as possible and minimize time in contact with the ground’. RSI was calculated across all 10 repetitions, excluding the first (i.e., the CMJ).
JH was estimated from flight time using the following formula, where 9.81 represents gravitational acceleration [19]:
(Flight time2 × 9.81)/8
Flight time (FT) was defined as the time between take off and landing [20]. The take-off and landing (touch-down) phases were identified by a 20 N vertical GRF threshold. Ground contact time was defined as the duration between landing and take off. As stated previously, RSI was calculated using the formula: JH/GCT.
2.4. Statistical Analysis
Statistical analyses were performed using SPSS software version 25 (SPSS, Chicago, IL, USA) and Microsoft Excel. Normality for all variables was inspected using a Shapiro–Wilks test. Within-session reliability was assessed using ICCs (two-way mixed effects, average measures, and absolute agreement) and CV. The CV was calculated as standard deviation/mean × 100 for each subject and then averaged across all subjects. ICCs were interpreted based on the following scale presented by Koo and Li [21]: poor (<0.50), moderate (0.50–0.75), good (0.75–0.90), and excellent (>0.90). The 95% confidence intervals were calculated for ICCs, and CV. Minimum acceptable reliability was determined with an ICC > 0.7 and CV < 15%.
The 10/5 RJT variables were compared across the 10 repetitions and between-trials comparison of mean five best RSIs using a repeated-measures analysis of variance (RMANOVA), with Bonferroni post hoc pairwise comparisons. Observed power and Partial eta squared effect sizes were calculated for all RMANOVAs, with the values of 0.010–0.059, 0.060–0.149, and ≥0.150 considered as small, medium, and large, respectively [22]. For non-parametric variables, a Friedman’s test was used; and in cases of significant differences, individual Wilcoxon sign-ranked tests were used.
Standardized differences were calculated using Cohen d effect sizes using the following formula: Cohen d = M − M2/σ pooled, where σ pooled = the square root of (σ12 + σ22/2) [23] and interpreted as trivial (≤0.19), small (0.20–0.59), moderate (0.60–1.19), large (1.20–1.99), very large (2.00–3.99), and extremely large (≥4.00) [24]. Statistical significance was defined as p < 0.05 for all tests. Additionally, the proportion of trials and subjects displaying peak RSI were calculated for each repetition to determine which repetition produces the greatest RSI values. Pearson’s correlations were calculated for RSI values between trials and evaluated as follows: trivial (0.00–0.09), small (0.10–0.29), moderate (0.30–0.49), large (0.50–0.69), very large (0.70–0.89), and nearly perfect (0.90–0.99) [24].
Finally, the sequential estimation technique (SET) was employed to determine the point of mean stability (i.e., minimum repetition size), as described and adopted by previous studies [25,26,27] and was modified in line with Gore et al. [26]. This technique involved using a cumulative mean (moving point mean—adding one repetition at a time) and a predefined bandwidth of the 1–10 trial standard error of measurement (SEM) (i.e., 10 trial mean) to establish “real” differences. The SEM was calculated using the formula: SD (pooled) * √(1 − ICC). Stability was determined when the cumulative mean fell within the bandwidth and remained there for all subsequent repetitions. The modified SET technique was used for investigating stability in RSI for trials 1, 2, and 3.
3. Results
The Shapiro–Wilks test of normality revealed that all variables were normally distributed (p > 0.05), excluding GCT for repetition 9 of trial 2 (p < 0.05), which was subsequently assessed non-parametrically. Descriptive statistics for all variables are presented in Table 1. ICCs and CVs were considered acceptable for all variables (Table 1).
RMANOVA revealed large and significant differences in GCT, JH, and RSI between trial 1 repetitions (Table 2). Significantly longer GCTs were observed for the following pairwise comparisons: repetition 1 compared to repetition 3 to 10 with moderate to large effect sizes; repetition 2 compared to repetition 4 and seven with moderate effect sizes; and repetition 3 compared to repetition 7 with a small effect size. Pairwise comparisons revealed significantly smaller JHs were observed for repetition 3 compared to repetitions 7 and 8, with a small effect size. Significantly lower RSIs were observed for the following pairwise comparisons: repetition 1 compared to repetitions 3 to 10 with small to moderate effect sizes; repetition 2 compared to repetitions 6 to 9 with small to moderate effect sizes; and repetition 3 compared to repetitions 7 and 8 with a small effect size.
Friedman’s test revealed significant differences in GCT between trial 2 repetitions (Table 2). RMANOVA revealed significant differences in JH and RSI between trial 2 repetitions (Table 2). Wilcoxon sign-ranked tests revealed that statistically and significantly longer GCTs were observed for repetition 1 compared to repetitions 2 to 10 with moderate to large effect sizes, while repetition 2 GCTs were statistically and significantly longer than repetitions 3 to 10 with small to moderate effect sizes. Significantly lower JHs were observed for the following pairwise comparisons: repetition 1 compared to repetitions 7 to 10 with small effect sizes; repetition 2 compared to repetitions 8 and 9 with small effect sizes; and repetition 3 compared to repetitions 8 to 10 with a small effect size. Significantly lower RSIs were observed for the following pairwise comparisons: repetition 1 compared to repetitions 3 to 10 with moderate to large effect sizes; repetition 2 compared to repetitions 4 to 10 with small to moderate effect sizes; repetition 3 compared to repetitions 8 to 10 with small to moderate effect sizes; and repetition 6 compared to repetition 9 with a small effect size.
The RMANOVA revealed large and significant differences in GCT, JH, and RSI between trial 3 repetitions (Table 2). Pairwise comparisons revealed significantly longer GCTs were observed for repetition 1 compared to repetitions 2 to 10 with moderate effect sizes, while significantly smaller JHs were observed for repetition 2 compared to repetitions 8 to 10 with small effect sizes. Significantly lower RSIs were observed for the following pairwise comparisons: repetition 1 compared to repetitions 3 to 10 with small to moderate effect sizes; repetition 2 compared to repetitions 7 to 10 with small effect sizes; and repetition 5 compared to repetitions 8 and 9 with a small effect size.
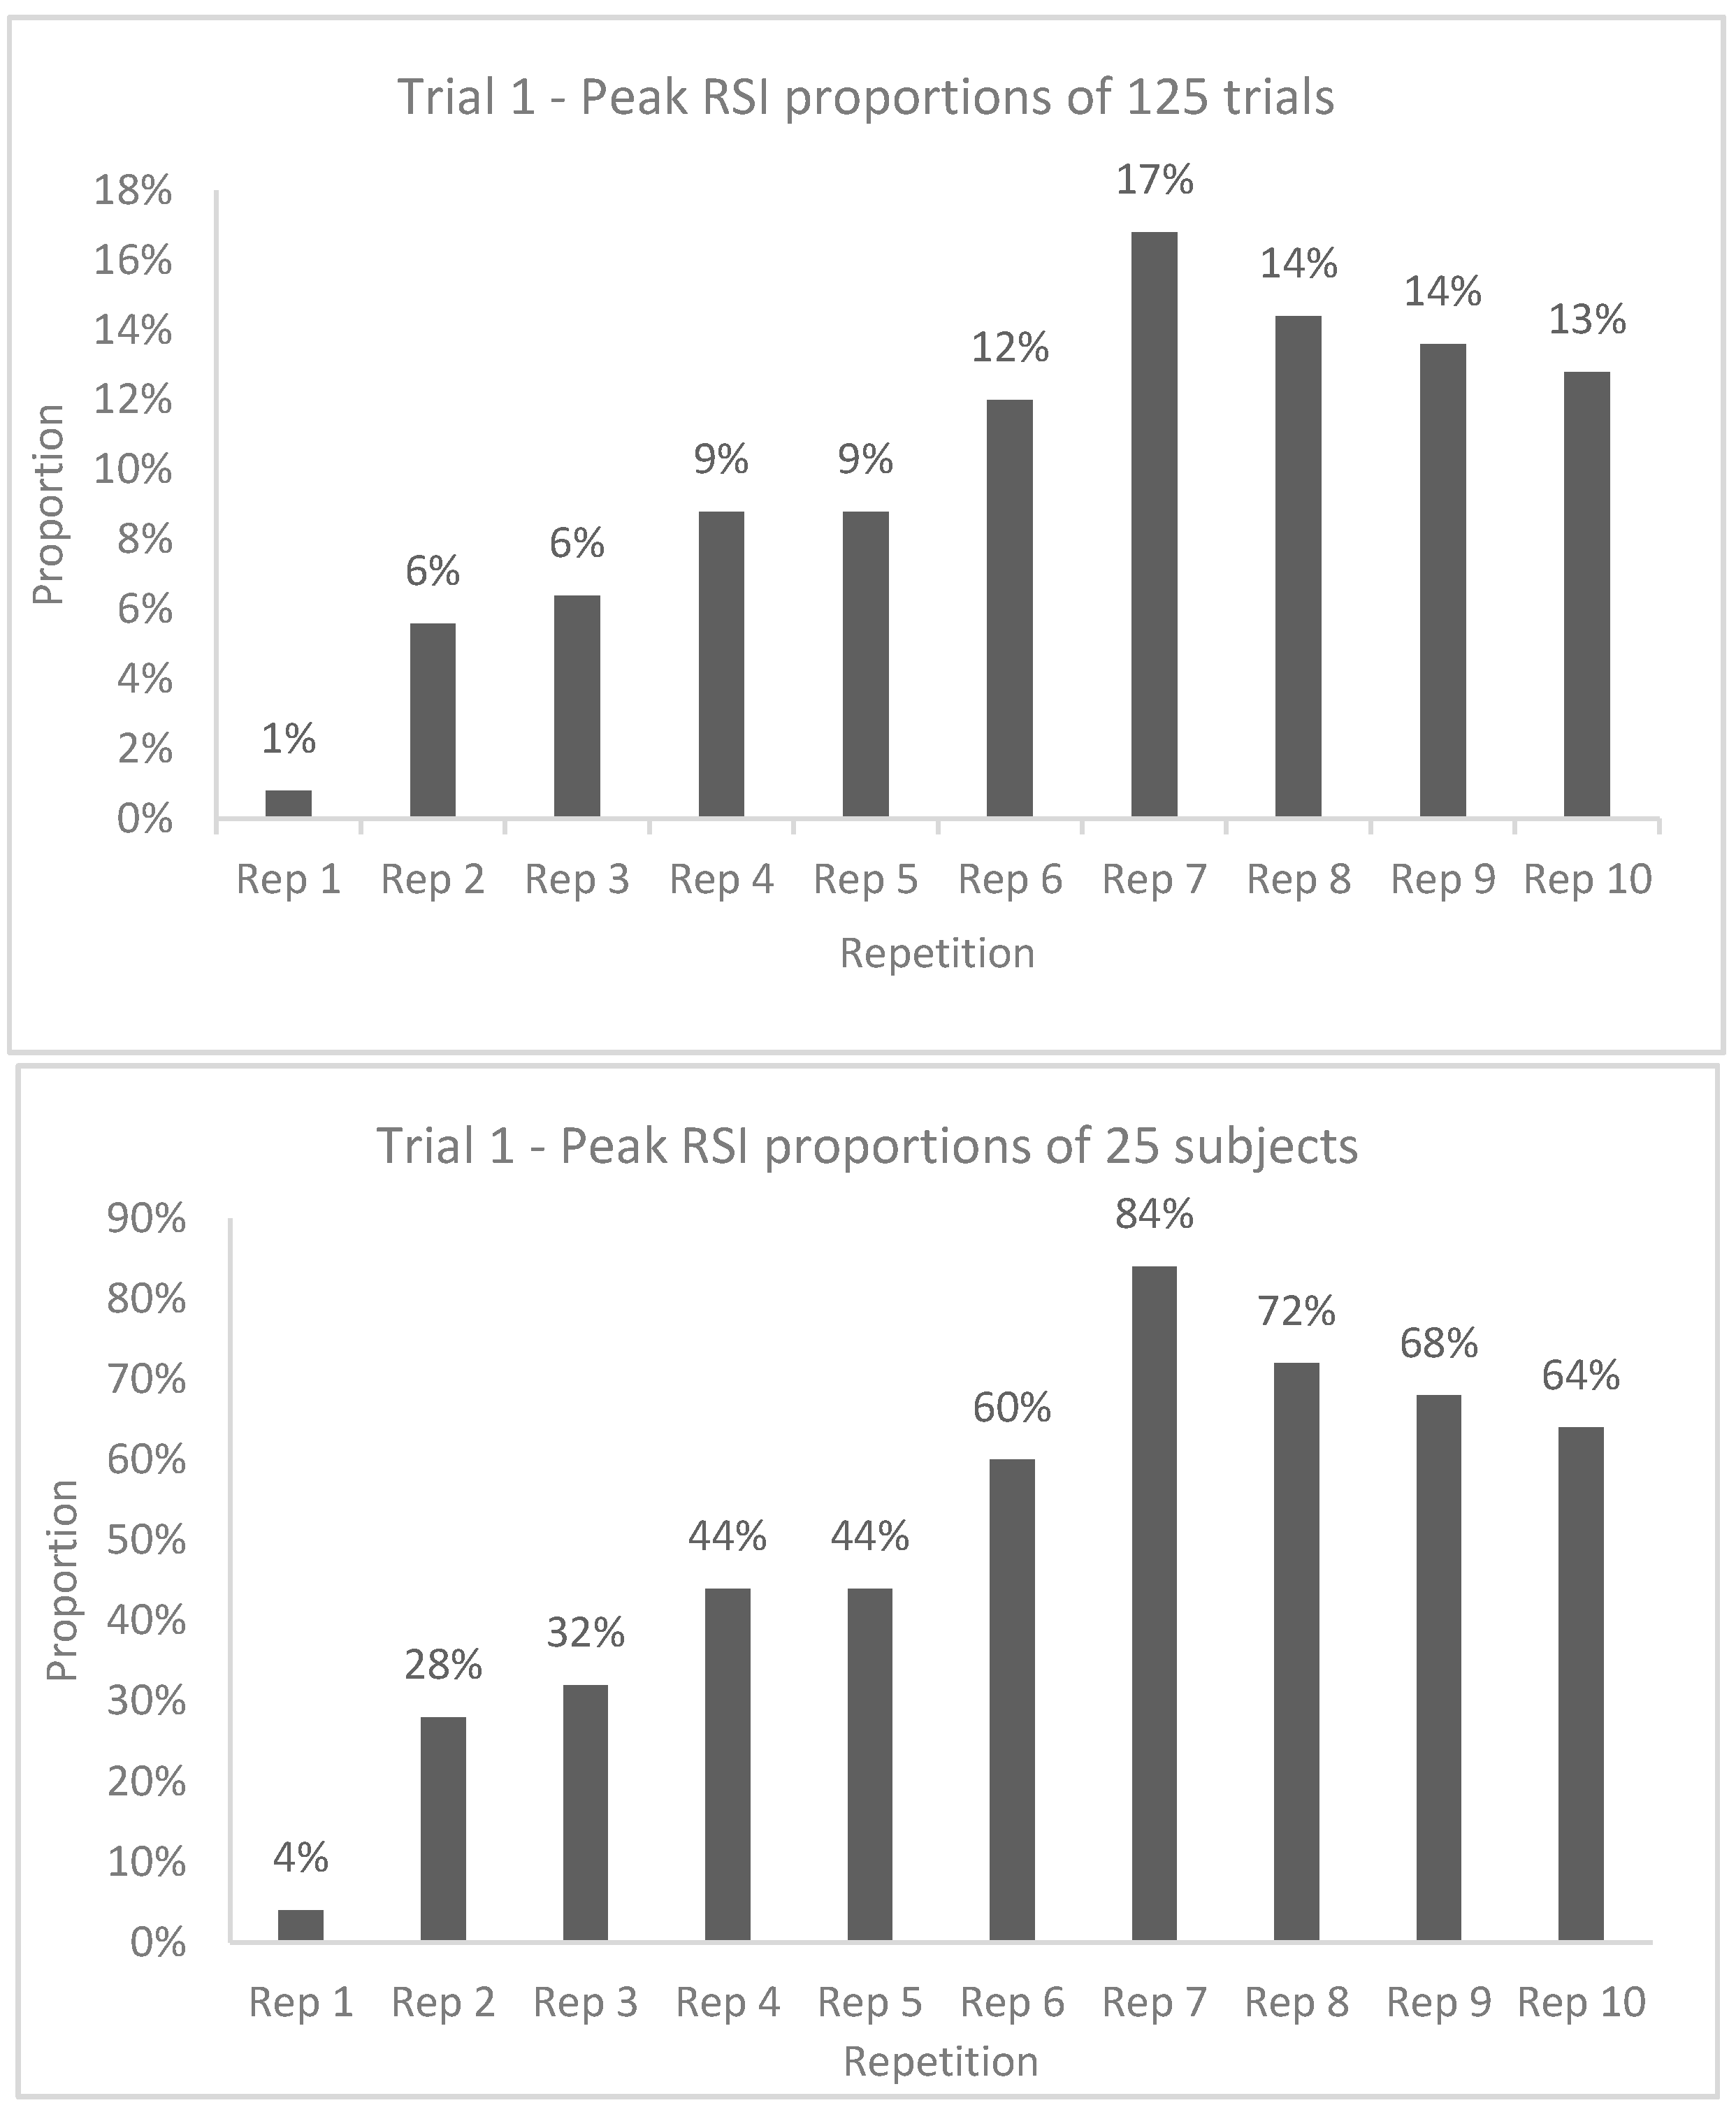
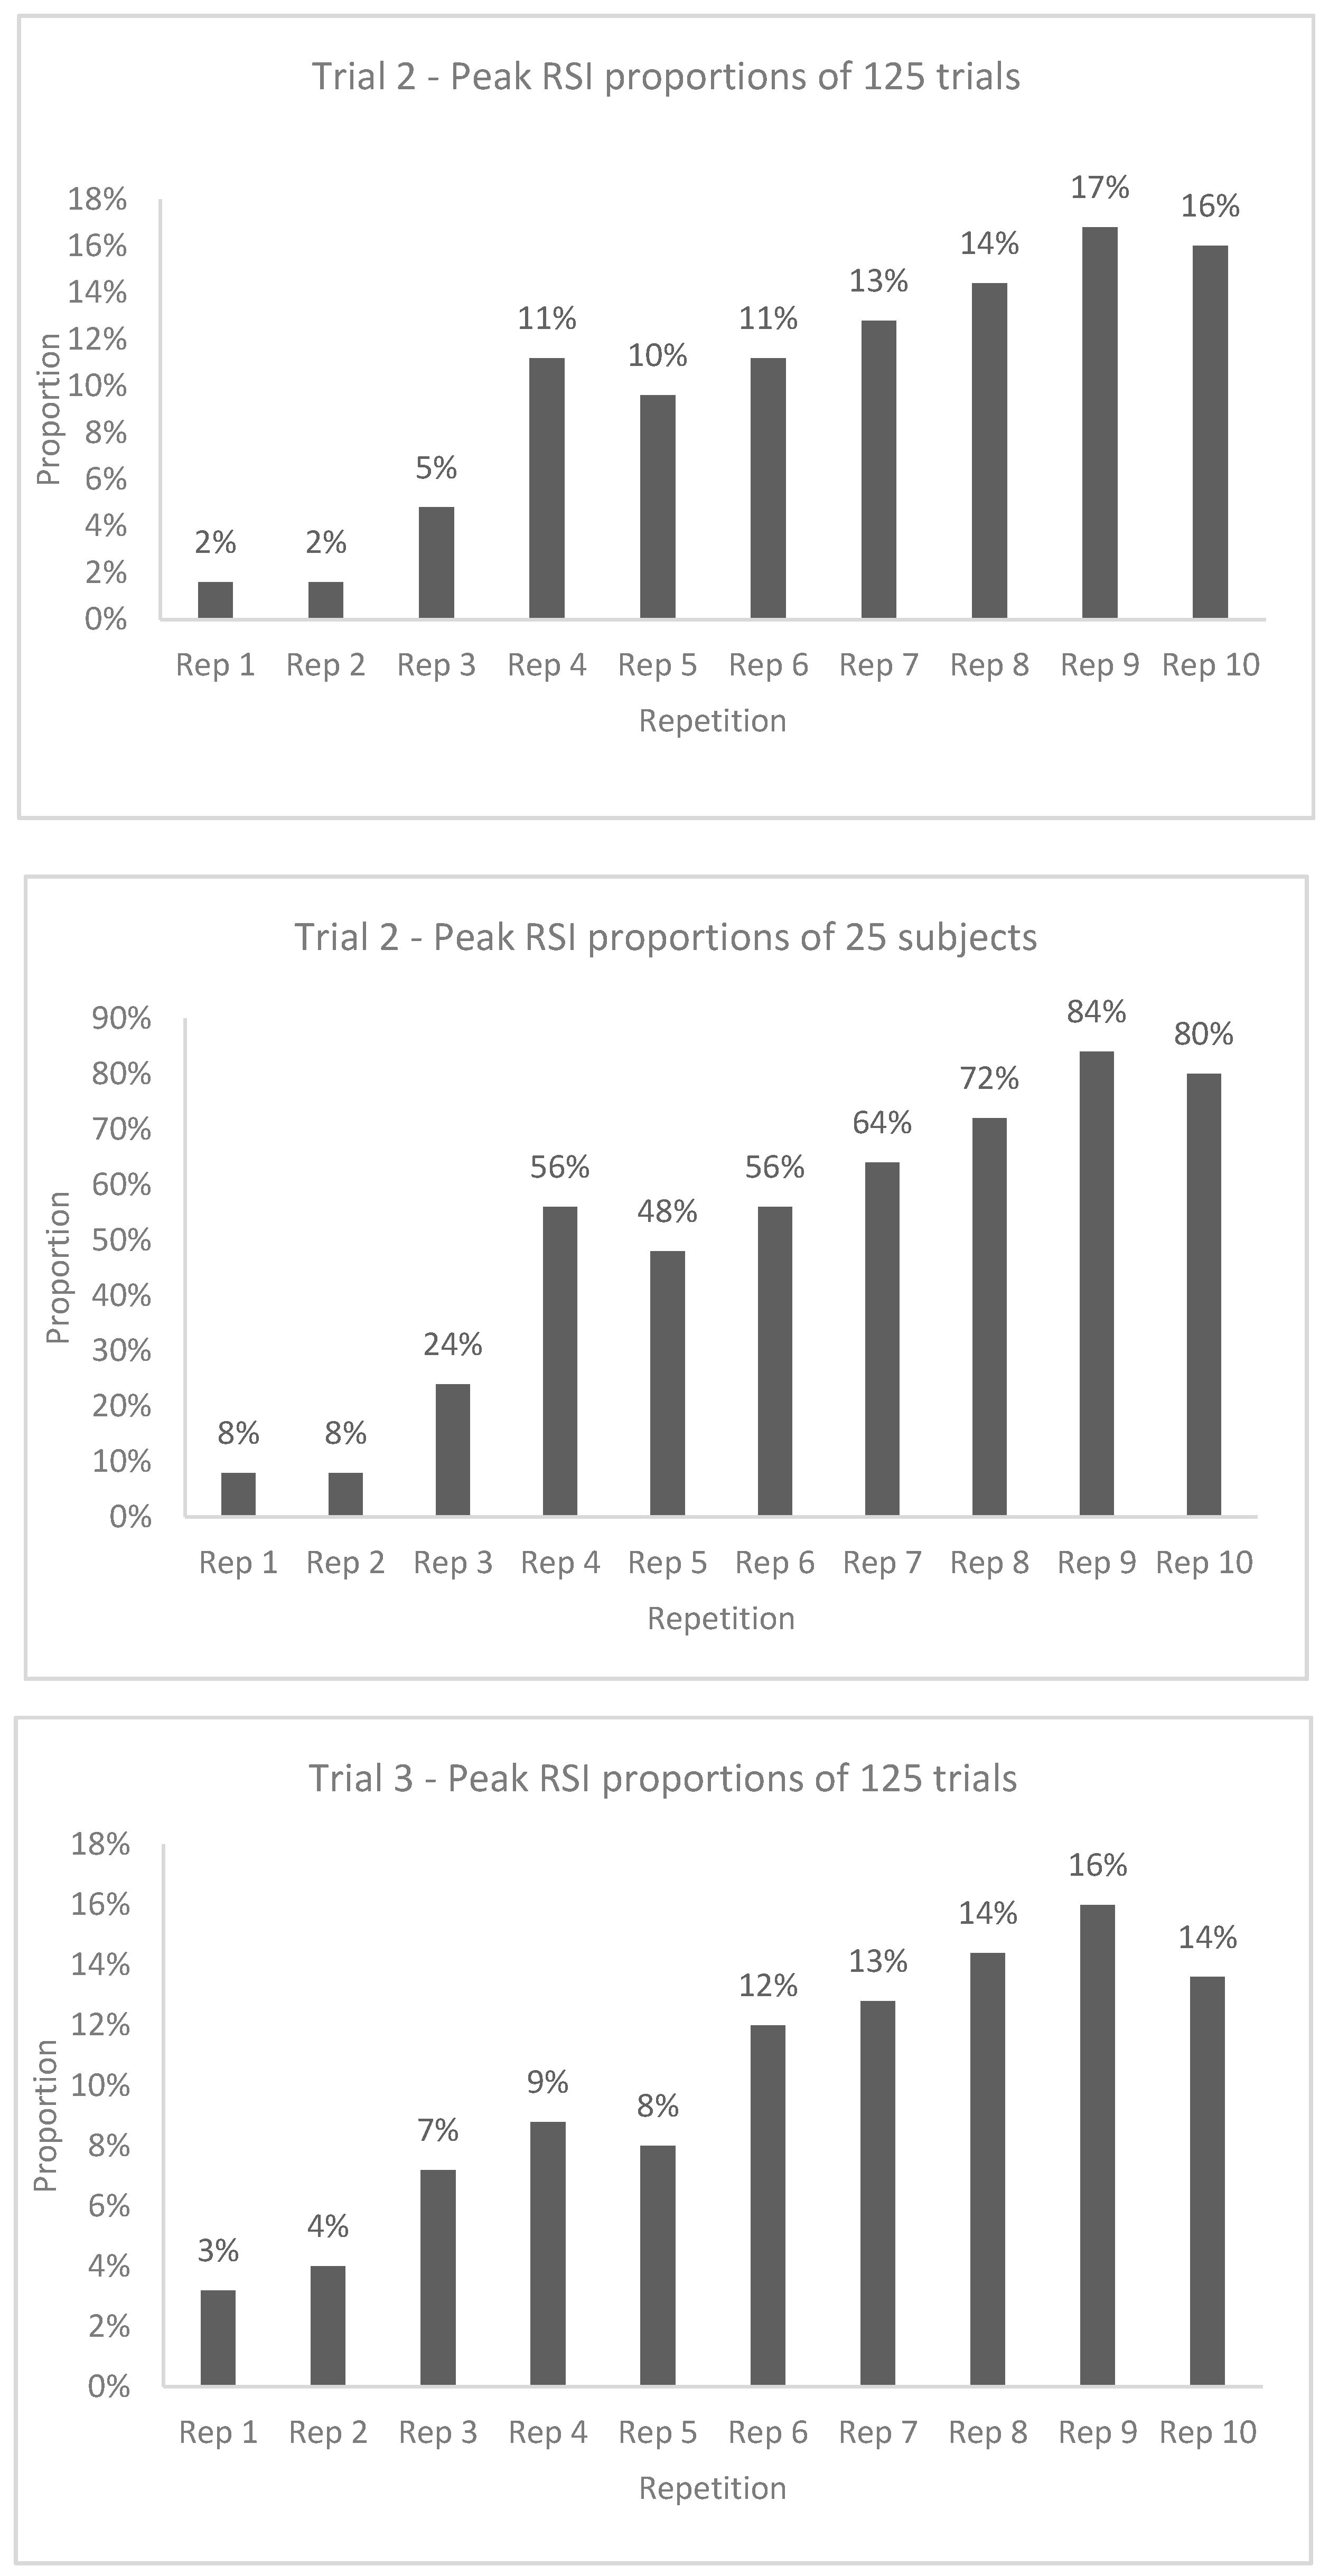
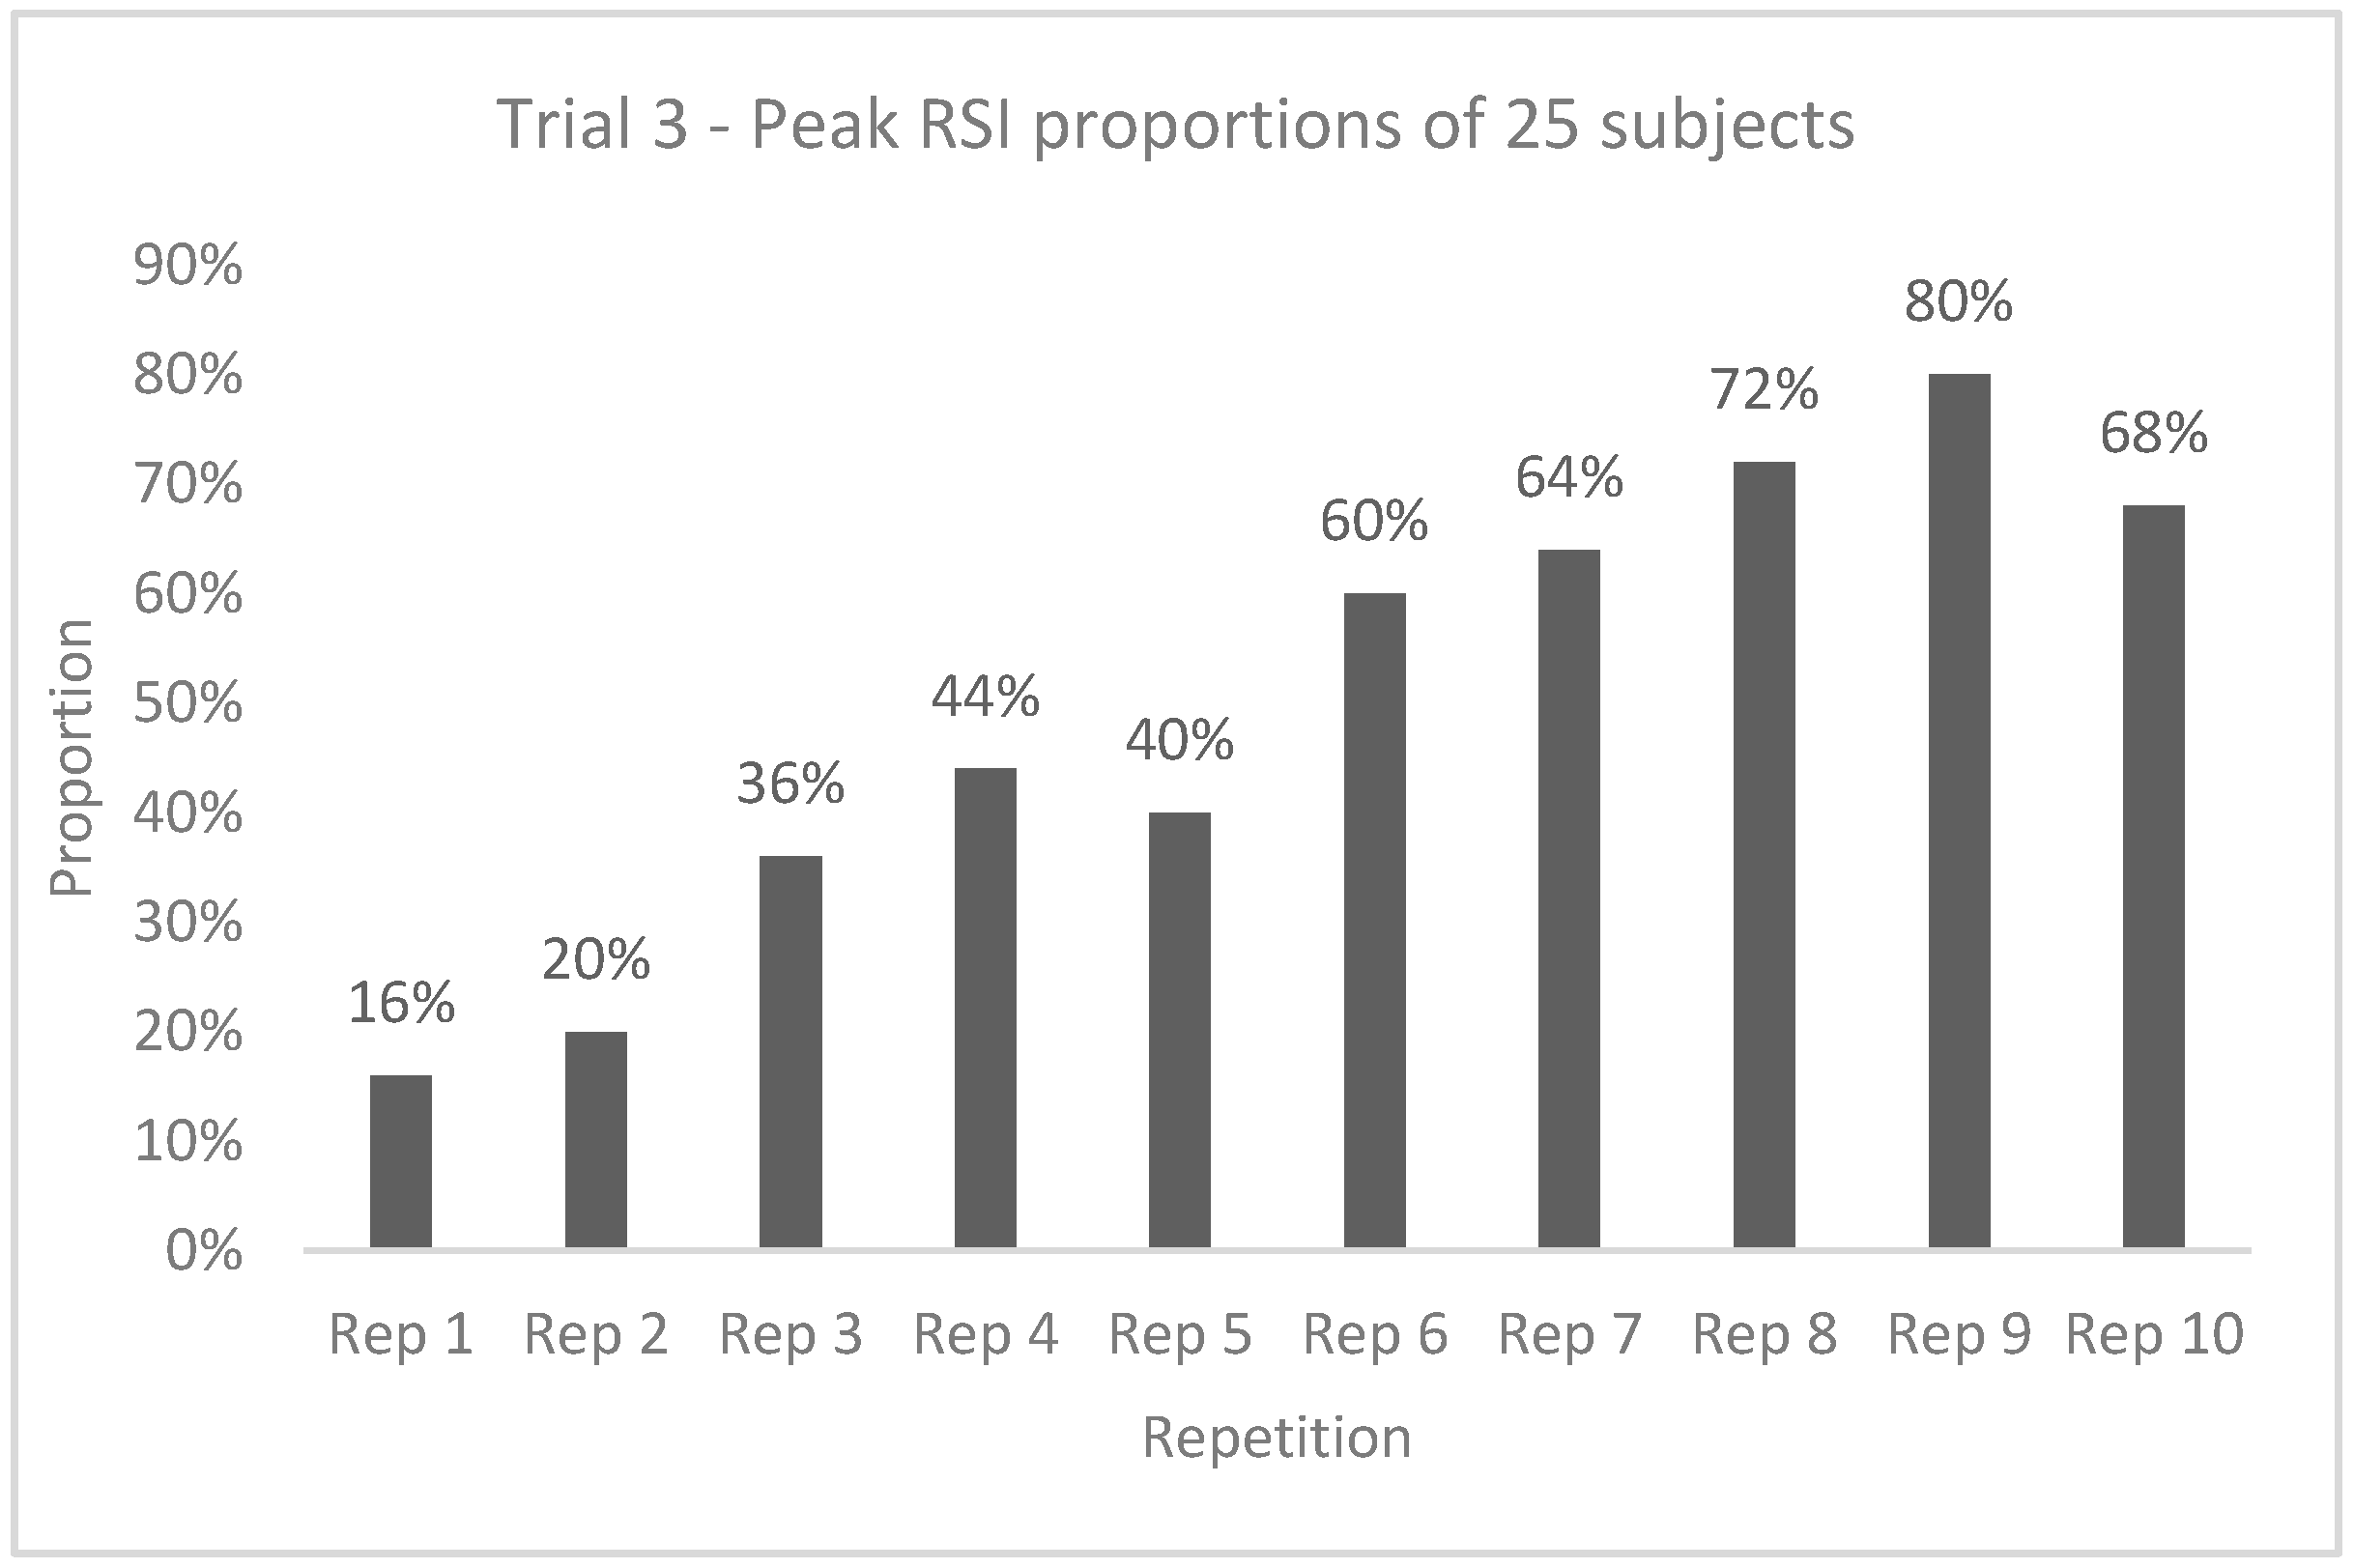
Figure 1 provides the repetition proportions containing peak RSI for all trials. In general, peak RSI occurs with later/higher repetitions, with ~60% of peak RSI occurring for all trials occurring during repetitions 7–10, and a minimum of 64% of subject’s proportion displaying peak RSIs during repetitions 7 to 10.
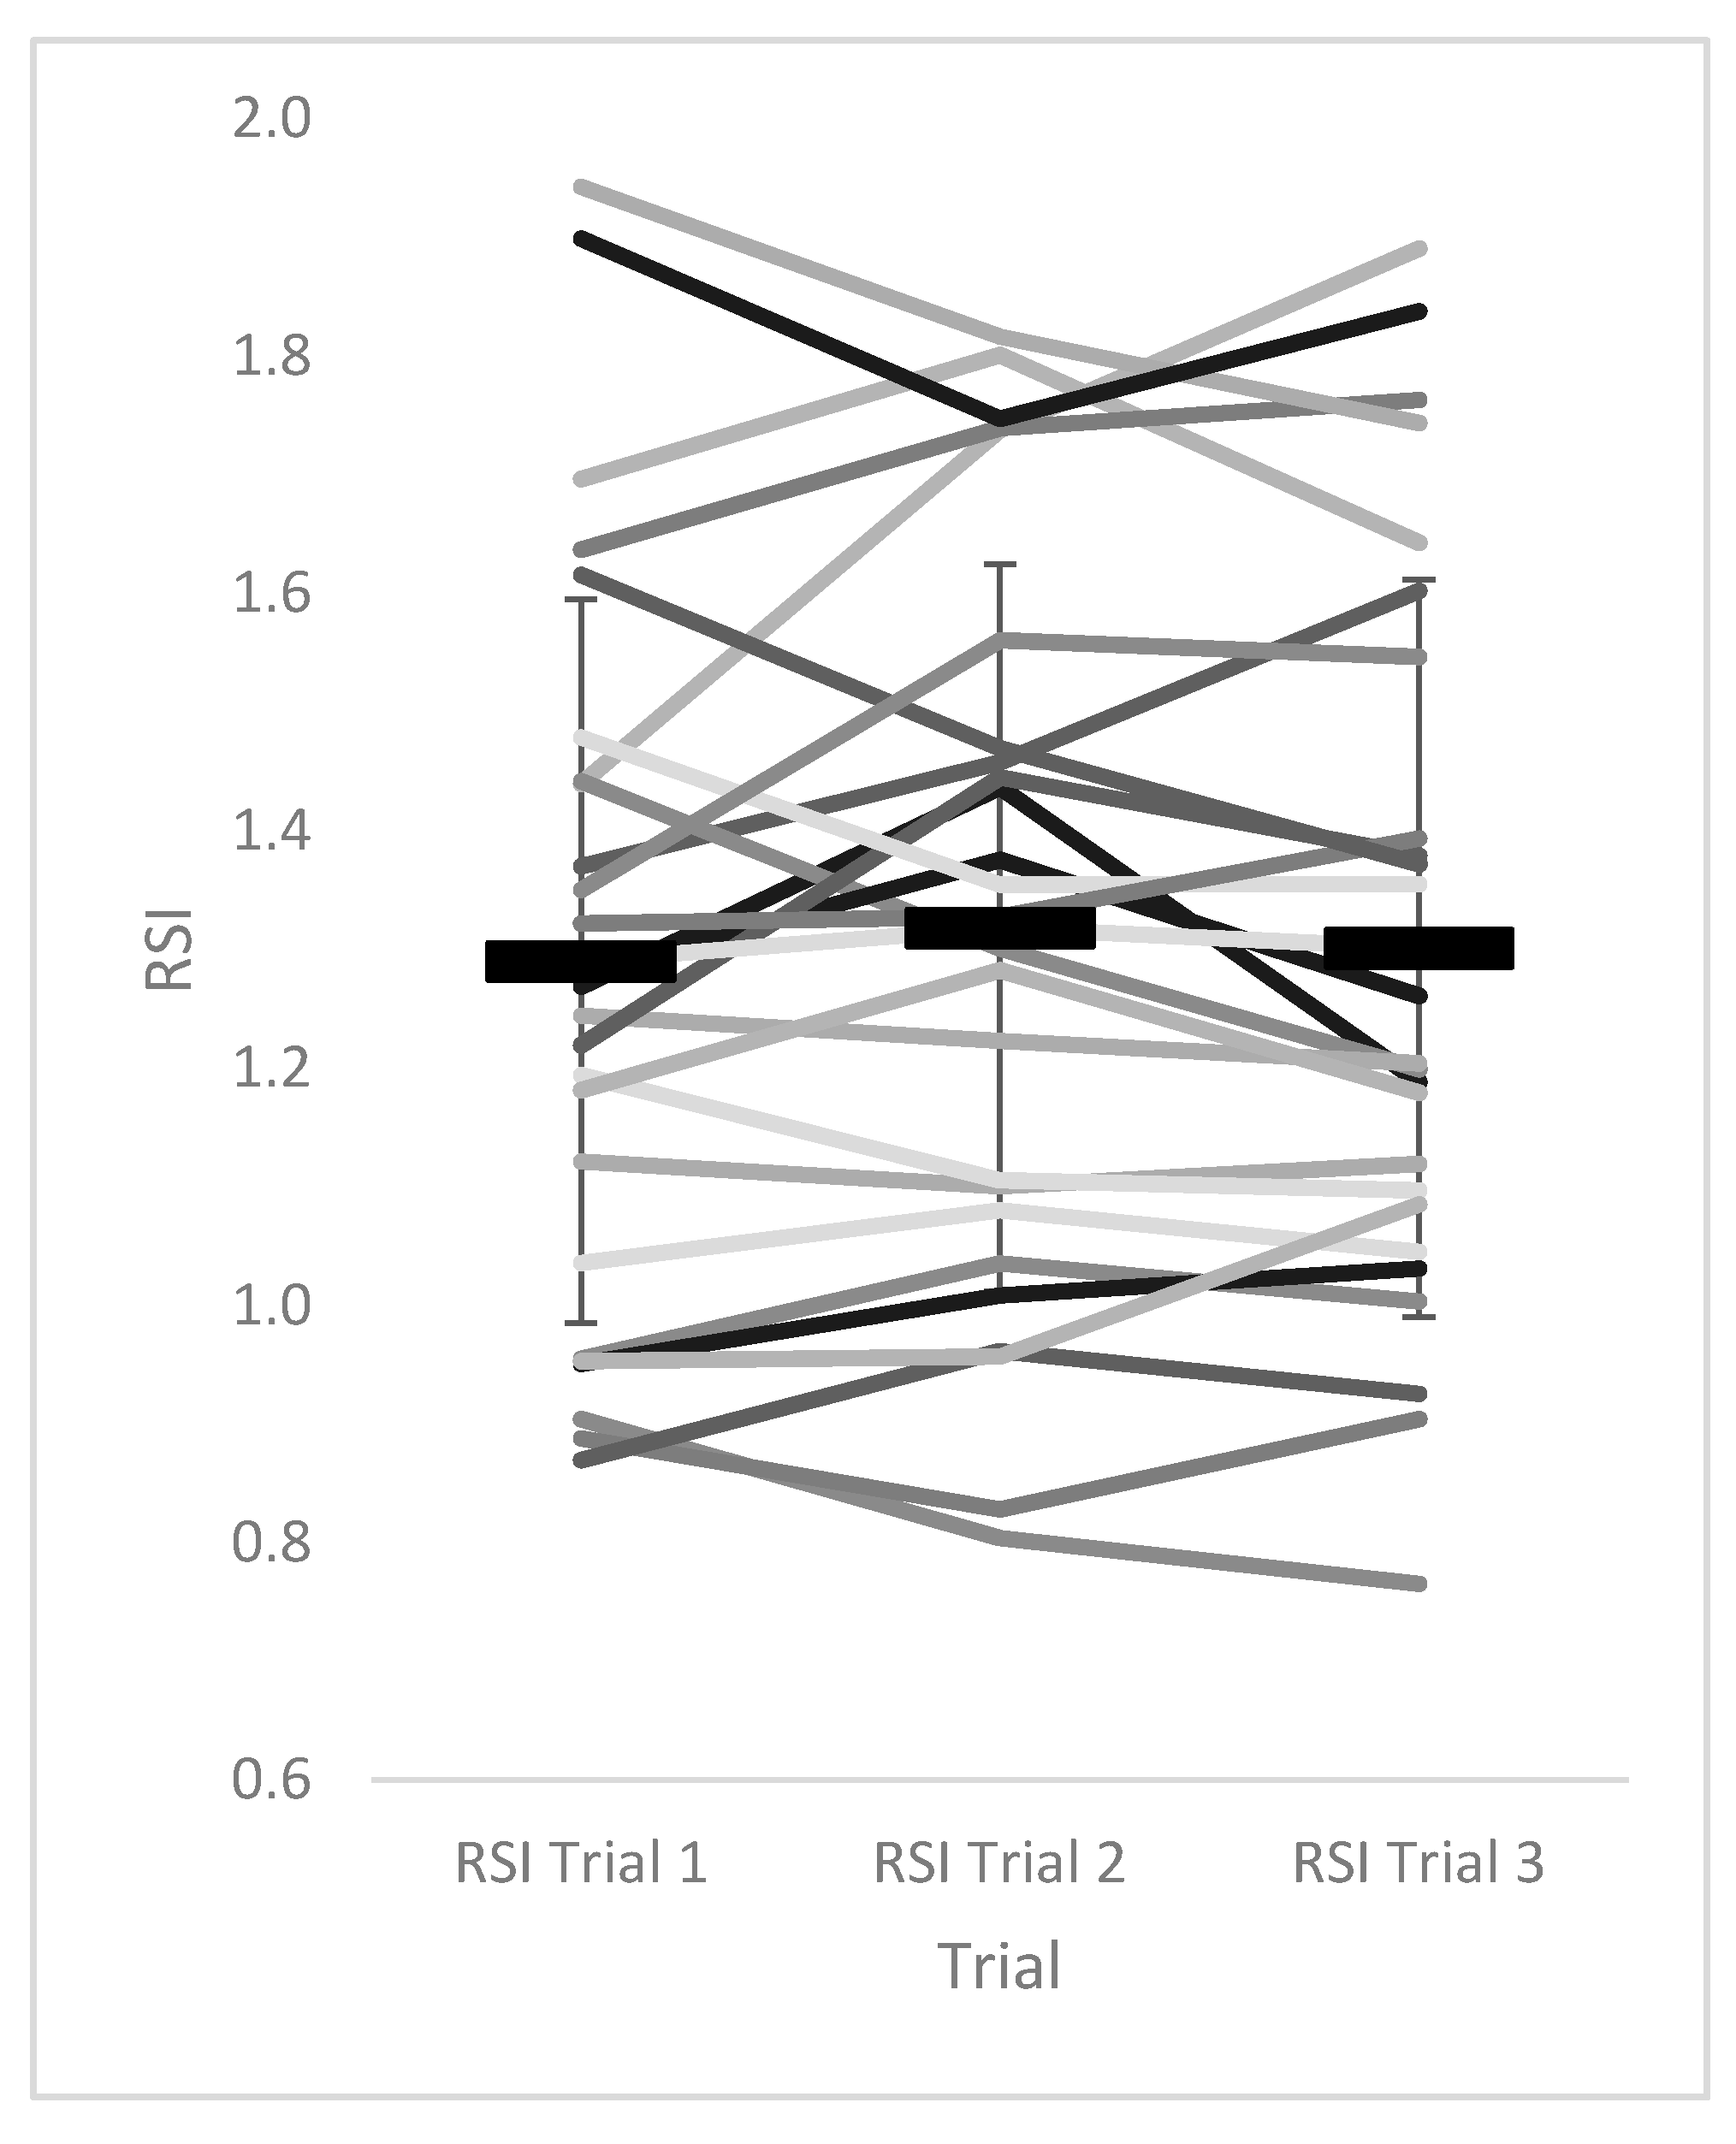
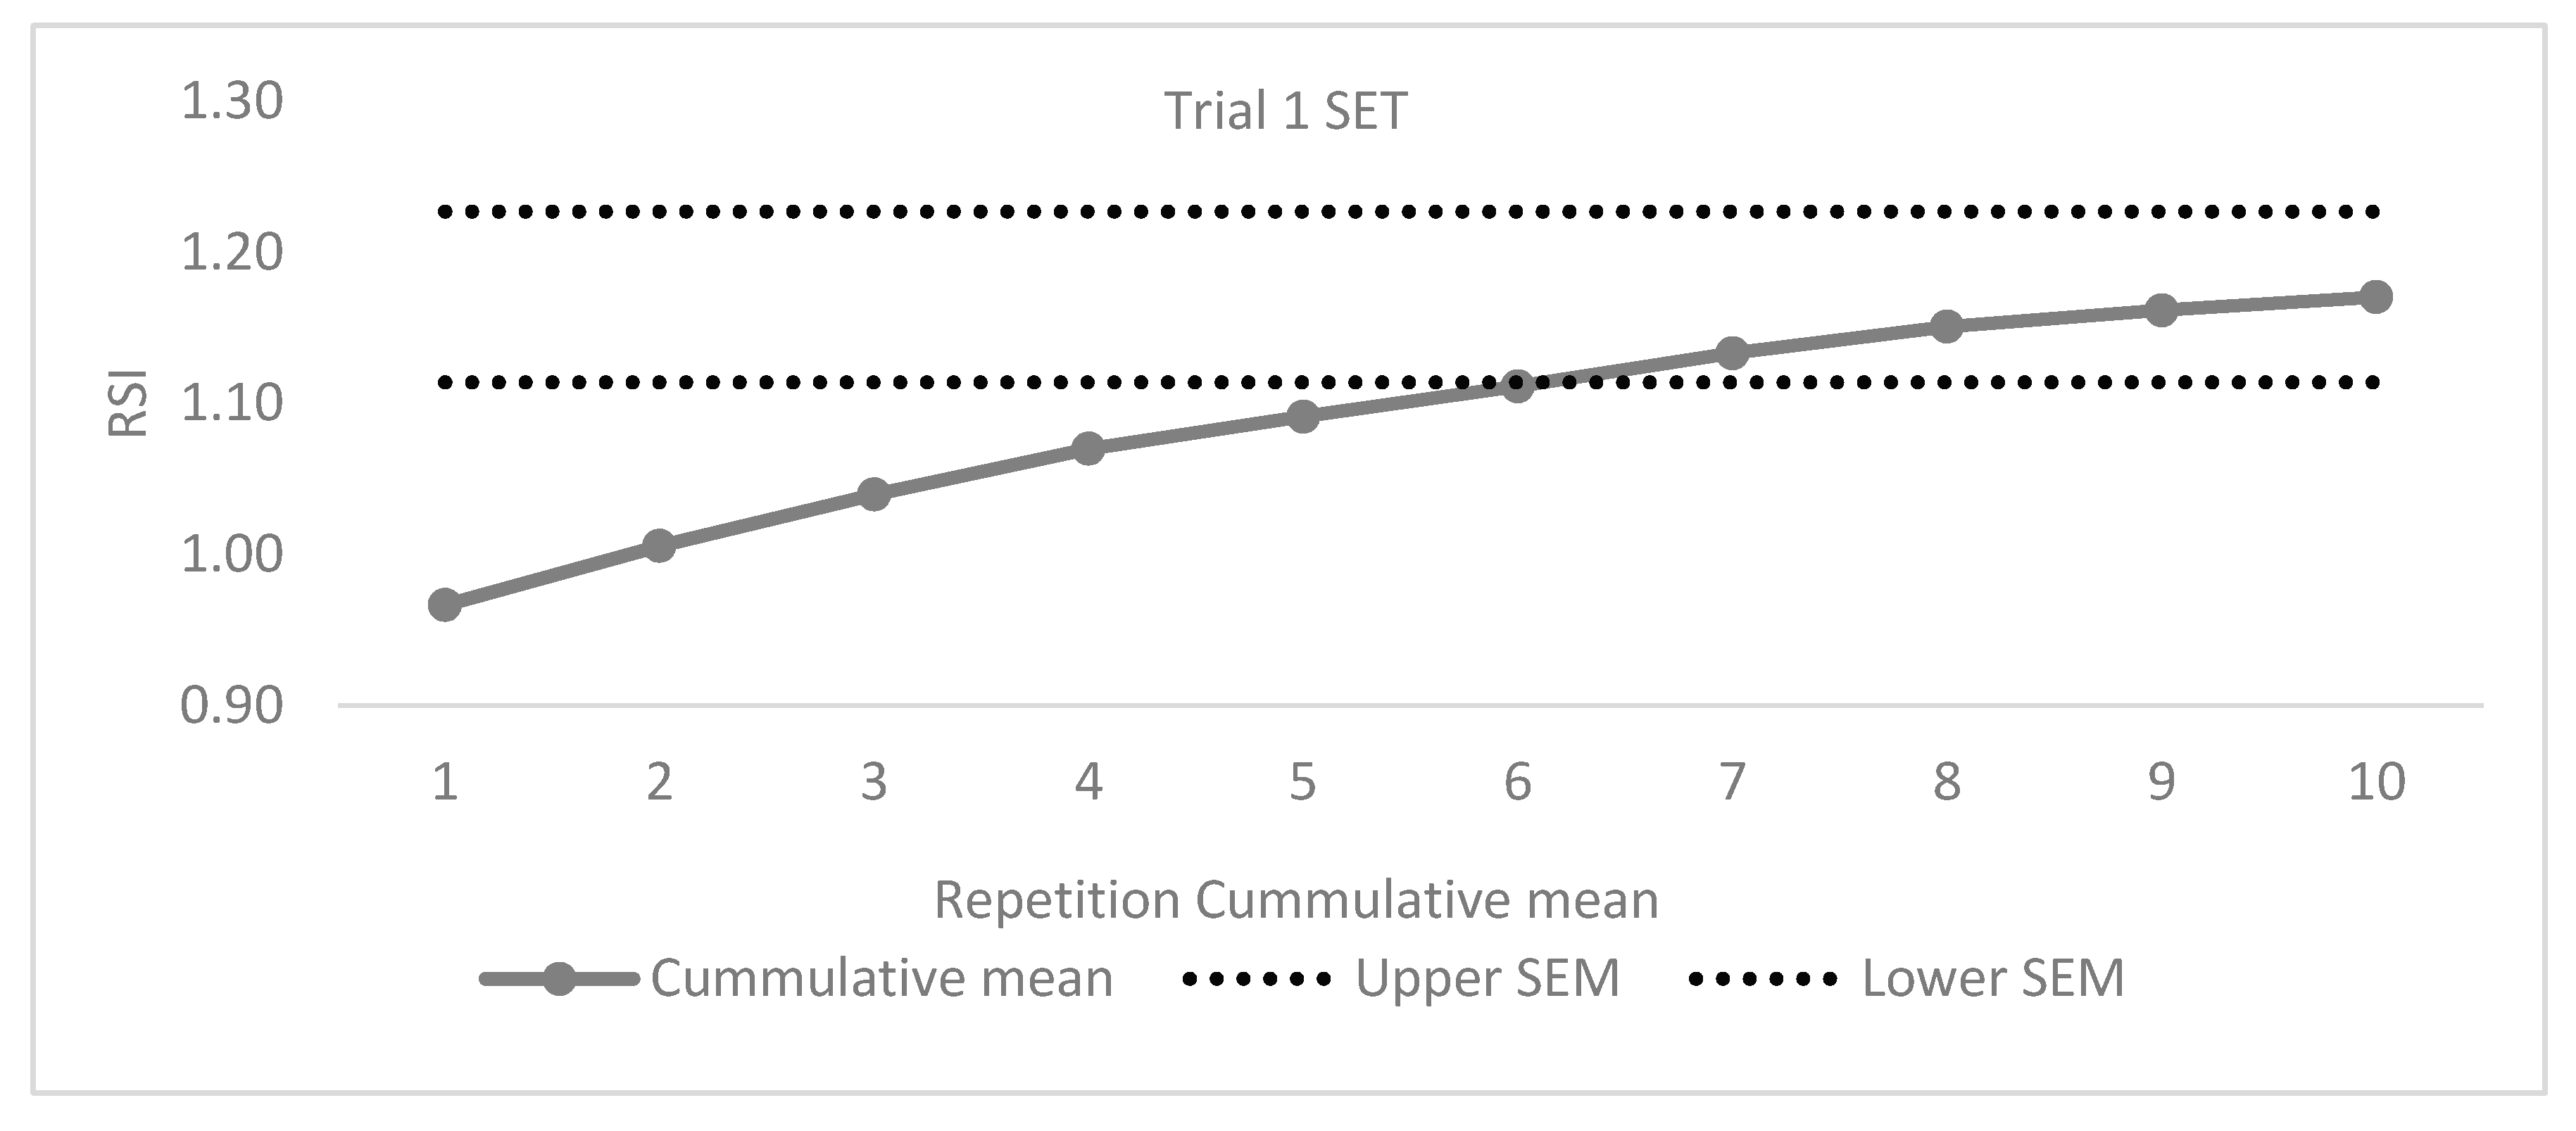
ICCs (ICC = 0.970, 95% CI = 0.941–0.986) and CV were considered acceptable for mean peak RSI between trials (Table 3). RMANOVA revealed no significant differences in RSI between trials (Figure 2), with pairwise comparisons indicating non-significant and trivial differences between trials, and very large to nearly perfect correlations between trials (Table 3). SET analysis revealed that seven repetitions were needed to attain stability in RSI for trial 1, 2, and 3 (Figure 3).
4. Discussion
The aims of this study were to identify whether 10 repetitions and three trials were necessary to achieve peak RSI in the 10/5 RJT protocol and compare reliability measures between trials. The primary findings from this study was that greater repetitions are needed, because the greatest JHs, shortest GCTs, and subsequently greatest RSIs occurred between repetitions 7 and 10 (Table 2, Figure 3), with the mean proportion of peak RSIs also occurring between repetitions 7 and 10. Furthermore, negligible (trivial) differences in mean five best RSI repetitions between trials were observed with strong correlations and similar reliability measures (Table 3, Figure 2). Therefore, based on these findings, it appears that one trial of the 10/5 RJT should be sufficient to evaluate RSI in athletes and attain reliable data. Additionally, these findings are supportive of the study hypothesis.
This is the only study to date that has investigated how many repetitions and trials are necessary to gather reliable RSI data when using the 10/5 RJT procedure. Previous research has identified the number of trials/cycles that are required to achieve stability or reliability in GRF variables during continuous jumping [25], lateral hopping [26], jump landing [27] and vertical jumping [28]. Racic et al. [25] aimed to determine the number of cycles needed to achieve stability of several jump parameters (i.e., peak force and duration). Twelve subjects (six male and six female) were instructed to jump to a metronome beat ranging from 1.4 to 2.8 Hz. The authors used both the ICC and the segmental averaging technique (SAT) (synonymous with SET) to compare how many trials were necessary to achieve stability in the variables. ICC analysis revealed that an average of 4 successive jumping cycles (the point from take off to landing) were necessary to achieve stability, and 11 were needed when using SAT. Despite the difference in results, several cycles were necessary to achieve stability of GRF variables during continuous countermovement jumping. Although this study investigated repeated jumping (similar to the present study) [25], it did not state the GCT for each jump, or a mean GCT across all jumps. Thus, it is unknown as to whether the subjects were working the so-called “fast” or “slow” SSC ability [16]. Conversely, in the present study, SET analysis revealed that seven repetitions were needed to attain stability in the mean for RSI (Figure 3). The authors indicated that different statistical methods provide completely different results, in regard to the number of trials needed to achieve stability [25]. These conclusions are in agreement with previous studies that have used the ICC and SAT to identify how many trials are necessary to achieve reliable data [25,26,27]. The SAT would appear to provide a conservative estimate of the number of trials to achieve stability [27]. Although, this method is limited by its use of an arbitrarily defined bandwidth of precision [25]. On the other hand, the ICC method is subject to potentially falsely identifying two trials as stable, should those trials be highly correlated.
As mentioned previously, the current study highlighted that 7–10 repetitions for evaluating reactive strength properties during the 10/5 RJT are needed due to the statistically significant and meaningful differences observed between the earlier and later repetitions for RSI and its components JH and GCT (Table 2, Figure 3). Additionally, Figure 2 illustrates that the largest proportions of peak RSIs occur during the latter repetitions, 7–10, while SET analysis indicated seven trials were needed to attain stability in mean RSI. These findings, hypothetically, may indicate that there could be a coordination or potentiation effect, whereby several repetitions are required to elicit favourable repeated jump mechanics, as indicted by the meaningfully longer GCTs and lower JHs observed during the earlier repetitions (Table 2). Arguably, it is unknown whether RSI values would have increased with extra repetitions (i.e., 5 or more). Conversely, although all subjects were instructed to perform all repeated jumps with maximal intent, it could be speculated that the subjects adopted a pacing strategy due to the requirement to perform 10 repetitions. In order to establish whether pacing strategies are adopted or whether extra repetitions would elicit greater RSI values, future research is required to compare the 10/5 RJT to a three, five, and 15 RJT.
Makaruk et al. [29] suggested that repeated jumps would result in a reduction in landing impact force as opposed to single, isolated jumps. This may suggest that individuals executing repeated jumps may be jumping strategically. Hence, the mean peak RSIs occurred during the latter stages of the 10/5 RJT protocol in the present study. Due to the repeated jumps being a measure of “fast” SSC ability [2], GCT would therefore be restricted to ≤250 ms [16]. This would have required the individuals to adopt a stiff landing with knee flexion less than 90° to ensure GCT was restricted [30]. This re-enforces the point that there could be strategic or learning effect during repeated jumps. This is further supported by Makaruk et al. [29] who identified that individuals who executed single jumps, in the study, did not prepare the muscles for a soft landing because, after achieving the target of the task (maximum JH), they did not focus on the control of impact absorption during landing. To further support this argument of a learning effect, Hatze [31] suggested that the exact replication of a particular movement (i.e., movement variability) is impossible due to constant variations in the skeletal system and external forces and torques acting upon the body. The major source of movement variability should be attributed to the bio-variance associated with movement [28]. This may help explain why 7–10 repetitions are necessary during the 10/5 RJT protocol.
Negligible and trivial differences in mean five best RSI between trials, with strong correlations and similar reliability measures were observed (Table 3, Figure 2). These results, overall, reveal that one trial of 10/5 is sufficient to establish accurate RSI evaluations in athletes and attain reliable data. In a practical setting, this will enable practitioners to save time in an already, highly pressurised performance environment due to not having to conduct any more than one set of repeated jumps and reducing the risk of unnecessary fatigue. Additionally, and importantly, it could be argued that only performing 10 repeated jump landings may predispose athletes to a lower risk of sustaining ankle or knee injuries due to performing fewer repeated jump landings. Furthermore, it has been suggested in previous work that the upper- and lower-bound SEM can be used to represent the minimal detectible difference or change in RSI derived from the DJ test [4]. In line with this suggestion, it may be that practitioners could calculate the SEM for their athletes’ 10/5 RJT RSI scores, as shown in Figure 3, to create a ‘bandwidth’ of performance that is influenced by bio-variance. This would help practitioners to establish their athletes’ ‘normal’ range (i.e., variability) of RSI scores for the 10/5 RJT. Subsequently, if a change in an athlete’s performance is above or below the SEM range (similar to what is shown in Figure 3), then this could indicate that a change in performance has occurred that is either positive (above the upper SEM) or negative (below the lower SEM).
It is important that the readers are aware of the limitations of the present study and, therefore, the requirement for future research, before applying the findings to their own practice. It is worth noting, for example, that the findings of the present study are limited to university level team-sport athletes, thus caution is advised generalising these findings to different athletic populations. Furthermore, in the present study, jump height was estimated from flight time using a specific formula, mentioned above [19]. Previous research by Louder et al. [32] highlighted threats to the internal validity associated with using the flight time method of estimating jump height, as opposed to using take-off velocity, when applied to the DJ. Whereas the DJ involves a single rebound jump repetition per trial, the multi-repetition nature of the 10/5 RJT makes it difficult to accurately numerically integrate the net force-time record to yield velocity. This is due to a concept known as ‘drift’, which can be a problem when performing force plate assessments of exercises that involve larger sampling durations and multiple impacts. As very few studies to date have conducted the 10/5 RJT using a force plate, further research is required to ascertain the most appropriate methods of processing the resultant force-time record to allow for additional variables to be generated from this test (and their efficacy explored).
5. Conclusions
Practitioners who wish to assess their athletes’ peak RSI scores via the 10/5 RJT may do so via a single trial. This approach would allow practitioners to accurately and reliably quantify their athletes’ peak RSI scores in a time-efficient manner and reduce their exposure to unnecessary additional plyometric exercise volume, which may be fatigue or injury inducing. The results of the present study indicate that greater repetitions are needed to achieve peak RSI. During the latter stages of the repeated jumps protocol, the shortest GCTs, greatest JHs and consequently greater RSIs occurred between repetitions 7 and 10. Furthermore, negligible differences in mean five best RSI repetitions with strong correlations and similar reliability measures were observed between trials (Table 3, Figure 2). As such, it appears that one trial of 10/5 RJT may be sufficient to attain a reliable measure of RSI.
Author Contributions
Conceptualisation, C.S., T.D. and J.J.M.; methodology, C.S., T.D. and J.J.M.; writing—original draft preparation, C.S.; writing—review and editing, C.S., T.D. and J.J.M. All authors have read and agreed to the published version of the manuscript.
Funding
This research received no external funding.
Institutional Review Board Statement
The study was conducted according to the guidelines of the Declaration of Helsinki, and approved by the Institutional Review Board (or Ethics Committee) of the University of Salford (protocol code: HST1718-357 and date of approval: 18/07/2018).
Informed Consent Statement
Informed consent was obtained from all subjects involved in the study.
Data Availability Statement
The data presented in this study are available on request from the corresponding author. The data are not publicly available due to ethical restrictions.
Conflicts of Interest
The authors declare no conflict of interest.
References
- Harper, D.; Hobbs, S.; Moore, J. The 10 to 5 repeated jump test. A new test for evaluating reactive strength. In Proceedings of the British Association of Sports and Exercises Sciences Student Conference, Chester, UK, 12–13 April 2011. [Google Scholar]
- Beattie, K.; Carson, B.P.; Lyons, M.; Kenny, I.C. The Relationship between Maximal Strength and Reactive Strength. Int. J. Sports Physiol. Perform. 2017, 12, 548–553. [Google Scholar] [CrossRef]
- Makaruk, H.; Winchester, J.B.; Czaplicki, A.; Sacewicz, T.; Zieliński, J.; Sadowski, J. Effects of Assisted and Traditional Drop Jumps on Jumping Performance. Int. J. Sports Sci. Coach. 2014, 9, 1217–1225. [Google Scholar] [CrossRef]
- Beattie, K.; Flanagan, E. Establishing the reliability & meaningful change of the drop-jump reactive strength index. J. Aust. Strength Cond. 2015, 23, 12–18. [Google Scholar]
- Makaruk, H.; Sacewicz, T. The Effect of Drop Height and Body Mass on Drop Jump Intensity. Biol. Sport 2011, 28, 63–67. [Google Scholar] [CrossRef] [Green Version]
- Markwick, W.J.; Bird, S.P.; Tufano, J.J.; Seitz, L.B.; Haff, G.G. The intraday reliability of the Reactive Strength Index calculated from a drop jump in professional men’s basketball. Int. J. Sports Physiol. Perform. 2015, 10, 482–488. [Google Scholar] [CrossRef]
- Comyns, T.M.; Flanagan, E.; Harper, D.; Fleming, S.; Fitzgerald, E. Interday reliability and usefulness of reactive strength index derived from the ten to five repeated jumps test. J. Sports Sci. 2017, 35, S80. [Google Scholar]
- Comyns, T.M.; Flanagan, E.P.; Fleming, S.; Fitzgerald, E.; Harper, D.J. Inter-Day Reliability and Usefulness of Reactive Strength Index Derived From Two Maximal Rebound Jump Tests. Int. J. Sports Physiol. Perform. 2019, 14, 1200–1204. [Google Scholar] [CrossRef]
- Lloyd, R.S.; Oliver, J.L.; Hughes, M.G.; Williams, C.A. Reliability and validity of field-based measures of leg stiffness and reactive strength index in youths. J. Sports Sci. 2009, 27, 1565–1573. [Google Scholar] [CrossRef]
- Browne, D.; Flanagan, E. Reactive Strength Endurance: Part 1 The response of reactive strength to fast stretch-shortening cycle fatigue. Sportperfsci 2018, 1, 1–3. [Google Scholar]
- Nagahara, R.; Naito, H.; Miyashiro, K.; Morin, J.B.; Zushi, K. Traditional and ankle-specific vertical jumps as strength-power indicators for maximal sprint acceleration. J. Sports Med. Phys. Fitness 2014, 54, 691–699. [Google Scholar]
- Lockie, R.G.; Murphy, A.J.; Knight, T.J.; Janse de Jonge, X.A. Factors That Differentiate Acceleration Ability in Field Sport Athletes. J. Strength Cond. Res. 2011, 25, 2704–2714. [Google Scholar] [CrossRef]
- Young, W.B.; James, R.; Montgomery, I. Is muscle power related to running speed with changes of direction? J. Sports Med. Phys. Fitness 2002, 42, 282–288. [Google Scholar]
- Nicol, C.; Avela, J.; Komi, P.V. The Stretch-Shortening Cycle A Model to Study Naturally Occurring Neuromuscular Fatigue. J. Biomech. 2000, 33, 1197–1206. [Google Scholar]
- Patterson, M.; Caulfield, B. A method for monitoring reactive strength index. Procedia Eng. 2010, 2, 3115–3120. [Google Scholar] [CrossRef]
- Schmidtbleicher, D. Training for Power Events. In Encyclopaedia of Sports Medicine, 3rd ed.; John Wiley & Sons: Oxford, UK, 1992. [Google Scholar]
- Ramirez-Campillo, R.; Alvarez, C.; García-Pinillos, F.; Sanchez-Sanchez, J.; Yanci, J.; Castillo, D.; Loturco, I.; Chaabene, H.; Moran, J.; Izquierdo, M. Optimal Reactive Strength Index: Is it an Accurate Variable to Optimize Plyometric Training Effects on Measures of Physical Fitness in Young Soccer Players? J. Strength Cond. Res. 2018, 1, 885–893. [Google Scholar] [CrossRef] [Green Version]
- Stratford, C.; Dos’Santos, T.; McMahon, J.J. A Comparison Between the Drop Jump and 10/5 Repeated Jumps Test to Measure the Reactive Strength Index. Prof. Strength Cond. 2020, 57, 23–28. [Google Scholar]
- Klavora, P. Vertical-jump tests: A critical review. Strength Cond. J. 2000, 22, 70–75. [Google Scholar] [CrossRef]
- Pérez-Castilla, A.; McMahon, J.J.; Comfort, P.; García-Ramos, A. Assessment of loaded squat jump height with a free-weight barbell and Smith machine. J. Strength Cond. Res. 2020, 34, 671–677. [Google Scholar] [CrossRef]
- Koo, T.K.; Li, M.Y. A Guideline of Selecting and Reporting Intraclass Correlation Coefficients for Reliability Research. J. Chiropr. Med. 2016, 15, 155–163. [Google Scholar] [CrossRef] [Green Version]
- Cohen, J. Statistical Analysis for the Behavioural Sciences; Lawrence Erlbaum: Hillsdale, NJ, USA, 1988. [Google Scholar]
- Cohen, J. Statistical Power Analysis for the Behavioural Sciences; Lawrence Erlbaum: Hillsdale, NJ, USA, 1977. [Google Scholar]
- Hopkins, W. A Scale of Magnitudes for Effect Statistics. Available online: http://www.sportsci.org/resource/stats/effectmag.html (accessed on 18 February 2020).
- Racic, V.; Pavic, A.; Brownjohn, J.M.W. Number of successive cycles necessary to achieve stability of selected ground reaction force variables during continuous jumping. J. Sport Sci. Med. 2009, 8, 639–647. [Google Scholar]
- Gore, S.J.; Marshall, B.M.; Franklyn-Miller, A.D.; Falvey, E.C.; Moran, K.A. The number of trials required to obtain a representative movement pattern during a hurdle hop exercise. J. Appl. Biomech. 2016, 32, 295–300. [Google Scholar] [CrossRef]
- James, C.R.; Herman, J.A.; Dufek, J.S.; Bates, B.T. Number of trials necessary to achieve performance stability of selected ground reaction force variables during landing. J. Sport Sci. Med. 2007, 6, 126–134. [Google Scholar]
- Rodano, R.; Squadrone, R. Stability of selected lower limb joint kinetic parameters during vertical jump. J. Appl. Biomech. 2002, 18, 83–89. [Google Scholar] [CrossRef]
- Makaruk, H.; Czaplicki, A.; Sacewicz, T.; Sadowski, J. The effects of single versus repeated plyometrics on landing biomechanics and jumping performance in men. Biol. Sport 2014, 31, 9–14. [Google Scholar] [CrossRef] [Green Version]
- De Vita, P.; Skelly, W.A. Effect of landing stiffness on joint kinetics and energetics in the lower extremity. Med. Sci. Sports Exerc. 1992, 24, 108–115. [Google Scholar]
- Hatze, H. Motion variability—Its definition, quantification, and origin. J. Mot. Behav. 1986, 18, 5–16. [Google Scholar] [CrossRef]
- Louder, T.; Thompson, B.J.; Banks, N.; Bressel, E. A mixed-methods approach to evaluating the internal validity of the reactive strength index. Sports 2019, 7, 157. [Google Scholar] [CrossRef] [Green Version]
Figure 1.
Repetition proportions comparing peak RSI between 125 trials and 25 subjects across all RJT trials.
Figure 1.
Repetition proportions comparing peak RSI between 125 trials and 25 subjects across all RJT trials.


Figure 2.
Individual RSI values between RJT trials (black rectangle denotes mean with SD error bars).
Figure 2.
Individual RSI values between RJT trials (black rectangle denotes mean with SD error bars).

Figure 3.
SET outlining stability in RSI cumulative mean in reference to 10 trial SEM bandwidth. SET: sequential estimation technique; SEM: standard error measurement; RSI: reactive strength index.
Figure 3.
SET outlining stability in RSI cumulative mean in reference to 10 trial SEM bandwidth. SET: sequential estimation technique; SEM: standard error measurement; RSI: reactive strength index.


Table 1.
Reliability measures for 10/5 RJT variables across all 10 repetitions.
| Trial 1 | Trial 2 | Trial 3 | ||||
|---|---|---|---|---|---|---|
| Variable | ICC (95% CI) | CV (95% CI) | ICC (95% CI) | CV (95% CI) | ICC (95% CI) | CV (95% CI) |
| GCT | 0.935 | 8.3 | 0.916 | 8.4 | 0.952 | 7.6 |
| (0.881–0.968) | (6.8–9.7) | (0.846–0.959) | (7.2–9.6) | (0.914–0.976) | (6.5–8.8) | |
| JH | 0.985 | 10.8 | 0.982 | 10.4 | 0.986 | 9.4 |
| (0.974–0.992) | (8.8–12.9) | (0.968–0.991) | (8.9–11.8) | (0.975–0.993) | (7.6–11.2) | |
| RSI | 0.970 | 14.5 | 0.959 | 14.1 | 0.974 | 12.5 |
| (0.943–0.985) | (12.4–16.5) | (0.922–0.981) | (12.5–15.7) | (0.952–0.987) | (10.2–17.8) | |
Key: GCT: ground contact time; JH: jump height; RSI: reactive strength index; ICC: intraclass correlation coefficient; CV: coefficient of variation; CI: confidence interval.
Table 2.
Comparison in GCT, JH, and RSI between RJT repetitions.
| 10/5 RJT Trial 1 | |||||||||||||||
| Variable | Rep 1 | Rep 2 | Rep 3 | Rep 4 | Rep 5 | Rep 6 | Rep 7 | Rep 8 | Rep 9 | Rep 10 | Mean | RMANOVA p | η2/Power | Pairwise Comparisons | |
| GCT (s) | Mean | 0.229 | 0.214 | 0.204 | 0.201 | 0.196 | 0.195 | 0.193 | 0.194 | 0.196 | 0.194 | 0.202 | <0.001 | 0.377 | 1 > 3–10 (d = 0.86–1.21) 2 > 4,7 (d = 0.67–0.68) 3 > 7 (d = 0.41) |
| SD | 0.036 | 0.029 | 0.030 | 0.029 | 0.023 | 0.026 | 0.020 | 0.024 | 0.024 | 0.023 | 0.023 | 1.000 | |||
| JH (cm) | Mean | 0.220 | 0.222 | 0.223 | 0.232 | 0.231 | 0.235 | 0.244 | 0.246 | 0.244 | 0.241 | 0.234 | 0.006 | 0.159 | 3 < 7,8 (d = 0.31–0.34) |
| SD | 0.078 | 0.074 | 0.069 | 0.070 | 0.061 | 0.063 | 0.062 | 0.067 | 0.067 | 0.063 | 0.064 | 0.859 | |||
| RSI | Mean | 0.967 | 1.045 | 1.108 | 1.161 | 1.177 | 1.212 | 1.264 | 1.274 | 1.248 | 1.249 | 1.170 | <0.001 | 0.380 | 1 < 3–10 (d = −0.43 to −0.93) 2 < 6–9 (d = −0.50 to −0.68) 3 < 7,8 (d = −0.48 to −0.49) |
| SD | 0.328 | 0.341 | 0.335 | 0.324 | 0.287 | 0.322 | 0.312 | 0.339 | 0.341 | 0.327 | 0.300 | 1.000 | |||
| 10/5 RJT Trial 2 | |||||||||||||||
| Variable | Rep 1 | Rep 2 | Rep 3 | Rep 4 | Rep 5 | Rep 6 | Rep 7 | Rep 8 | Rep 9 | Rep 10 | Mean | RMANOVA p | η2/Power | Pairwise Comparisons | |
| GCT (s) | Mean | 0.231 | 0.213 | 0.202 | 0.198 | 0.198 | 0.199 | 0.196 | 0.196 | 0.195 | 0.195 | 0.202 | <0.001 | 1 > 2–10 (d = 0.60–1.40) 2 > 3–10 (d = 0.46–0.73) | |
| SD | 0.031 | 0.029 | 0.020 | 0.021 | 0.024 | 0.022 | 0.023 | 0.023 | 0.019 | 0.024 | 0.020 | ||||
| JH (cm) | Mean | 0.221 | 0.223 | 0.226 | 0.238 | 0.235 | 0.239 | 0.246 | 0.251 | 0.255 | 0.252 | 0.239 | <0.001 | 0.251 | 1 < 7–10 (d = −0.41 to −0.56) 2 < 8,9 (d = −0.42 to −0.49) 3 < 8–10 (d = −0.40 to −0.48) |
| SD | 0.060 | 0.070 | 0.059 | 0.065 | 0.056 | 0.062 | 0.063 | 0.066 | 0.060 | 0.058 | 0.058 | 0.998 | |||
| RSI | Mean | 0.959 | 1.047 | 1.122 | 1.203 | 1.185 | 1.208 | 1.269 | 1.297 | 1.314 | 1.301 | 1.190 | <0.001 | 0.434 | 1 < 3–10 (d = −0.64 to −1.24) 2 < 4–10 (d = −0.50 to −0.85) 3 < 8–10 (d = −0.54 to −0.63) 6 < 9 (d = −0.34) |
| SD | 0.236 | 0.299 | 0.272 | 0.308 | 0.246 | 0.299 | 0.352 | 0.370 | 0.329 | 0.317 | 0.277 | 1.000 | |||
| 10/5 RJT Trial 3 | |||||||||||||||
| Variable | Rep 1 | Rep 2 | Rep 3 | Rep 4 | Rep 5 | Rep 6 | Rep 7 | Rep 8 | Rep 9 | Rep 10 | Mean | RMANOVA p | η2/Power | Pairwise Comparisons | |
| GCT (s) | Mean | 0.232 | 0.210 | 0.204 | 0.204 | 0.206 | 0.203 | 0.203 | 0.199 | 0.200 | 0.203 | 0.206 | <0.001 | 0.304 | 1 > 2–10 (d = 0.61–1.12) |
| SD | 0.033 | 0.039 | 0.026 | 0.027 | 0.027 | 0.029 | 0.028 | 0.025 | 0.024 | 0.025 | 0.025 | 1.000 | |||
| JH (cm) | Mean | 0.234 | 0.227 | 0.237 | 0.239 | 0.242 | 0.242 | 0.243 | 0.254 | 0.255 | 0.260 | 0.243 | <0.001 | 0.203 | 2 < 8–10 (d = −0.41 to −0.51) |
| SD | 0.063 | 0.069 | 0.069 | 0.068 | 0.064 | 0.062 | 0.061 | 0.065 | 0.060 | 0.063 | 0.061 | 0.990 | |||
| RSI | Mean | 1.014 | 1.100 | 1.164 | 1.181 | 1.179 | 1.211 | 1.218 | 1.292 | 1.283 | 1.293 | 1.193 | <0.001 | 0.336 | 1 < 3–10 (d = −0.52 to −0.96) 2 < 7–10 (d = −0.35 to −0.59) 5 < 8,9 (d = −0.34–0.36) |
| SD | 0.250 | 0.333 | 0.321 | 0.334 | 0.302 | 0.328 | 0.336 | 0.356 | 0.315 | 0.327 | 0.298 | 1.000 | |||
Key: RJT: repeated jump test; GCT: ground contact time; JH: jump height; RSI: reactive strength index; SD: standard deviation; RMANOVA: repeated-measures analysis of variance; s: seconds; cm: centimetres. Note italics denotes non-parametric (p < 0.05).
Table 3.
Reliability measures for peak five RSI 10/5 RJT.
| RSI Trial 1 | RSI Trial 2 | RSI Trial 3 | RMANOVA p | η2 (Power) | Pairwise Comparisons | ||
|---|---|---|---|---|---|---|---|
| Mean ± SD | 1.290 ± 0.305 | 1.318 ± 0.306 | 1.301 ± 0.311 | 0.554 | 0.024 (0.144) | Trial 1 vs. Trial 2 | p = 0.838, d = −0.09, r = 0.915, r2 = 0.84 |
| CV% (95% CI) | 5.7 (4.5–6.8) | 6.3 (5.1–7.5) | 6.2 (4.8–7.7) | Trial 1 vs. Trial 3 | p = 1.000, d = −0.04, r = 0.871, r2 = 0.76 | ||
| Trial 2 vs. Trial 3 | p = 1.000, d = 0.05, r = 0.952, r2 = 0.91 | ||||||
Key: RSI: reactive strength index; CV: coefficient of variation; CI: confidence interval; RMANOVA: repeated-measures analysis of variance.
Publisher’s Note: MDPI stays neutral with regard to jurisdictional claims in published maps and institutional affiliations. |
© 2020 by the authors. Licensee MDPI, Basel, Switzerland. This article is an open access article distributed under the terms and conditions of the Creative Commons Attribution (CC BY) license (http://creativecommons.org/licenses/by/4.0/).
Share and Cite
MDPI and ACS Style
Stratford, C.; Dos’Santos, T.; McMahon, J.J. The 10/5 Repeated Jumps Test: Are 10 Repetitions and Three Trials Necessary? Biomechanics 2021, 1, 1-14. https://0-doi-org.brum.beds.ac.uk/10.3390/biomechanics1010001
AMA Style
Stratford C, Dos’Santos T, McMahon JJ. The 10/5 Repeated Jumps Test: Are 10 Repetitions and Three Trials Necessary? Biomechanics. 2021; 1(1):1-14. https://0-doi-org.brum.beds.ac.uk/10.3390/biomechanics1010001
Chicago/Turabian StyleStratford, Callum, Thomas Dos’Santos, and John J. McMahon. 2021. "The 10/5 Repeated Jumps Test: Are 10 Repetitions and Three Trials Necessary?" Biomechanics 1, no. 1: 1-14. https://0-doi-org.brum.beds.ac.uk/10.3390/biomechanics1010001