
Analysis of the Relationships between Balance Ability and Walking in Terms of Muscle Activities and Lower Limb Kinematics and Kinetics


Abstract
:1. Introduction
2. Methods
2.1. Participants
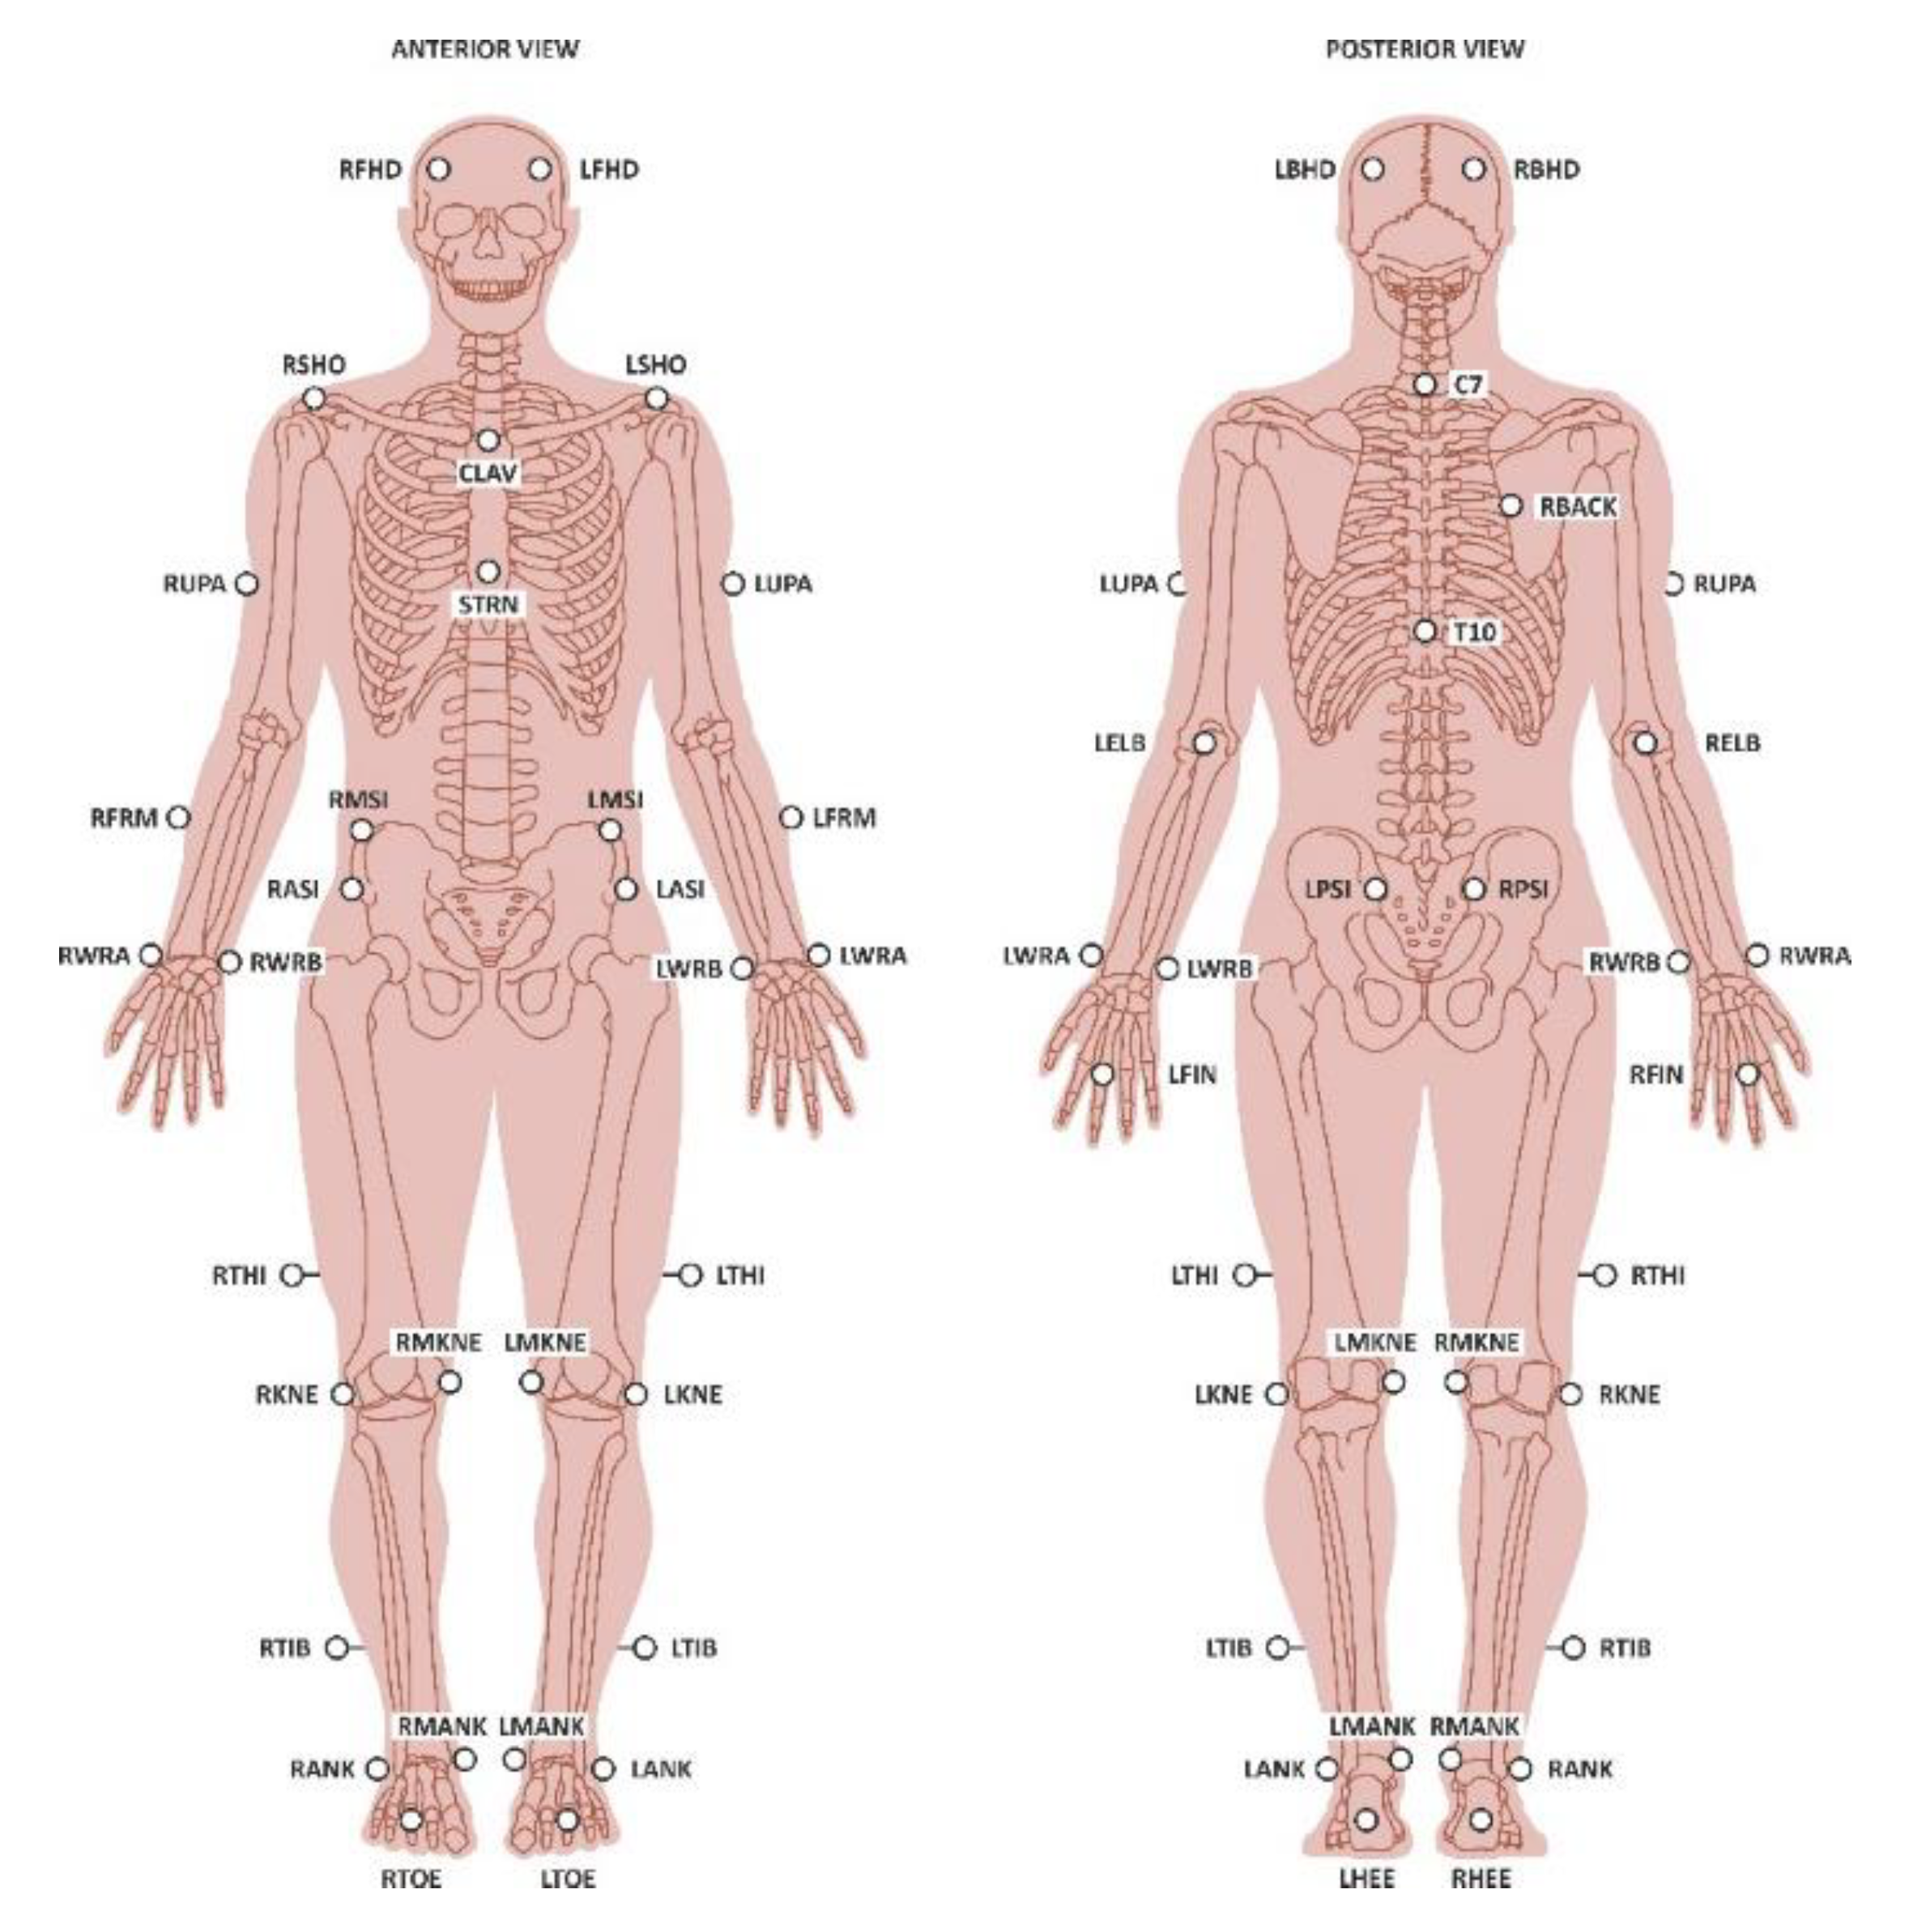
2.2. Measurements
2.3. Outcome Measures
2.4. Data Analysis
3. Results
3.1. Descriptive Results
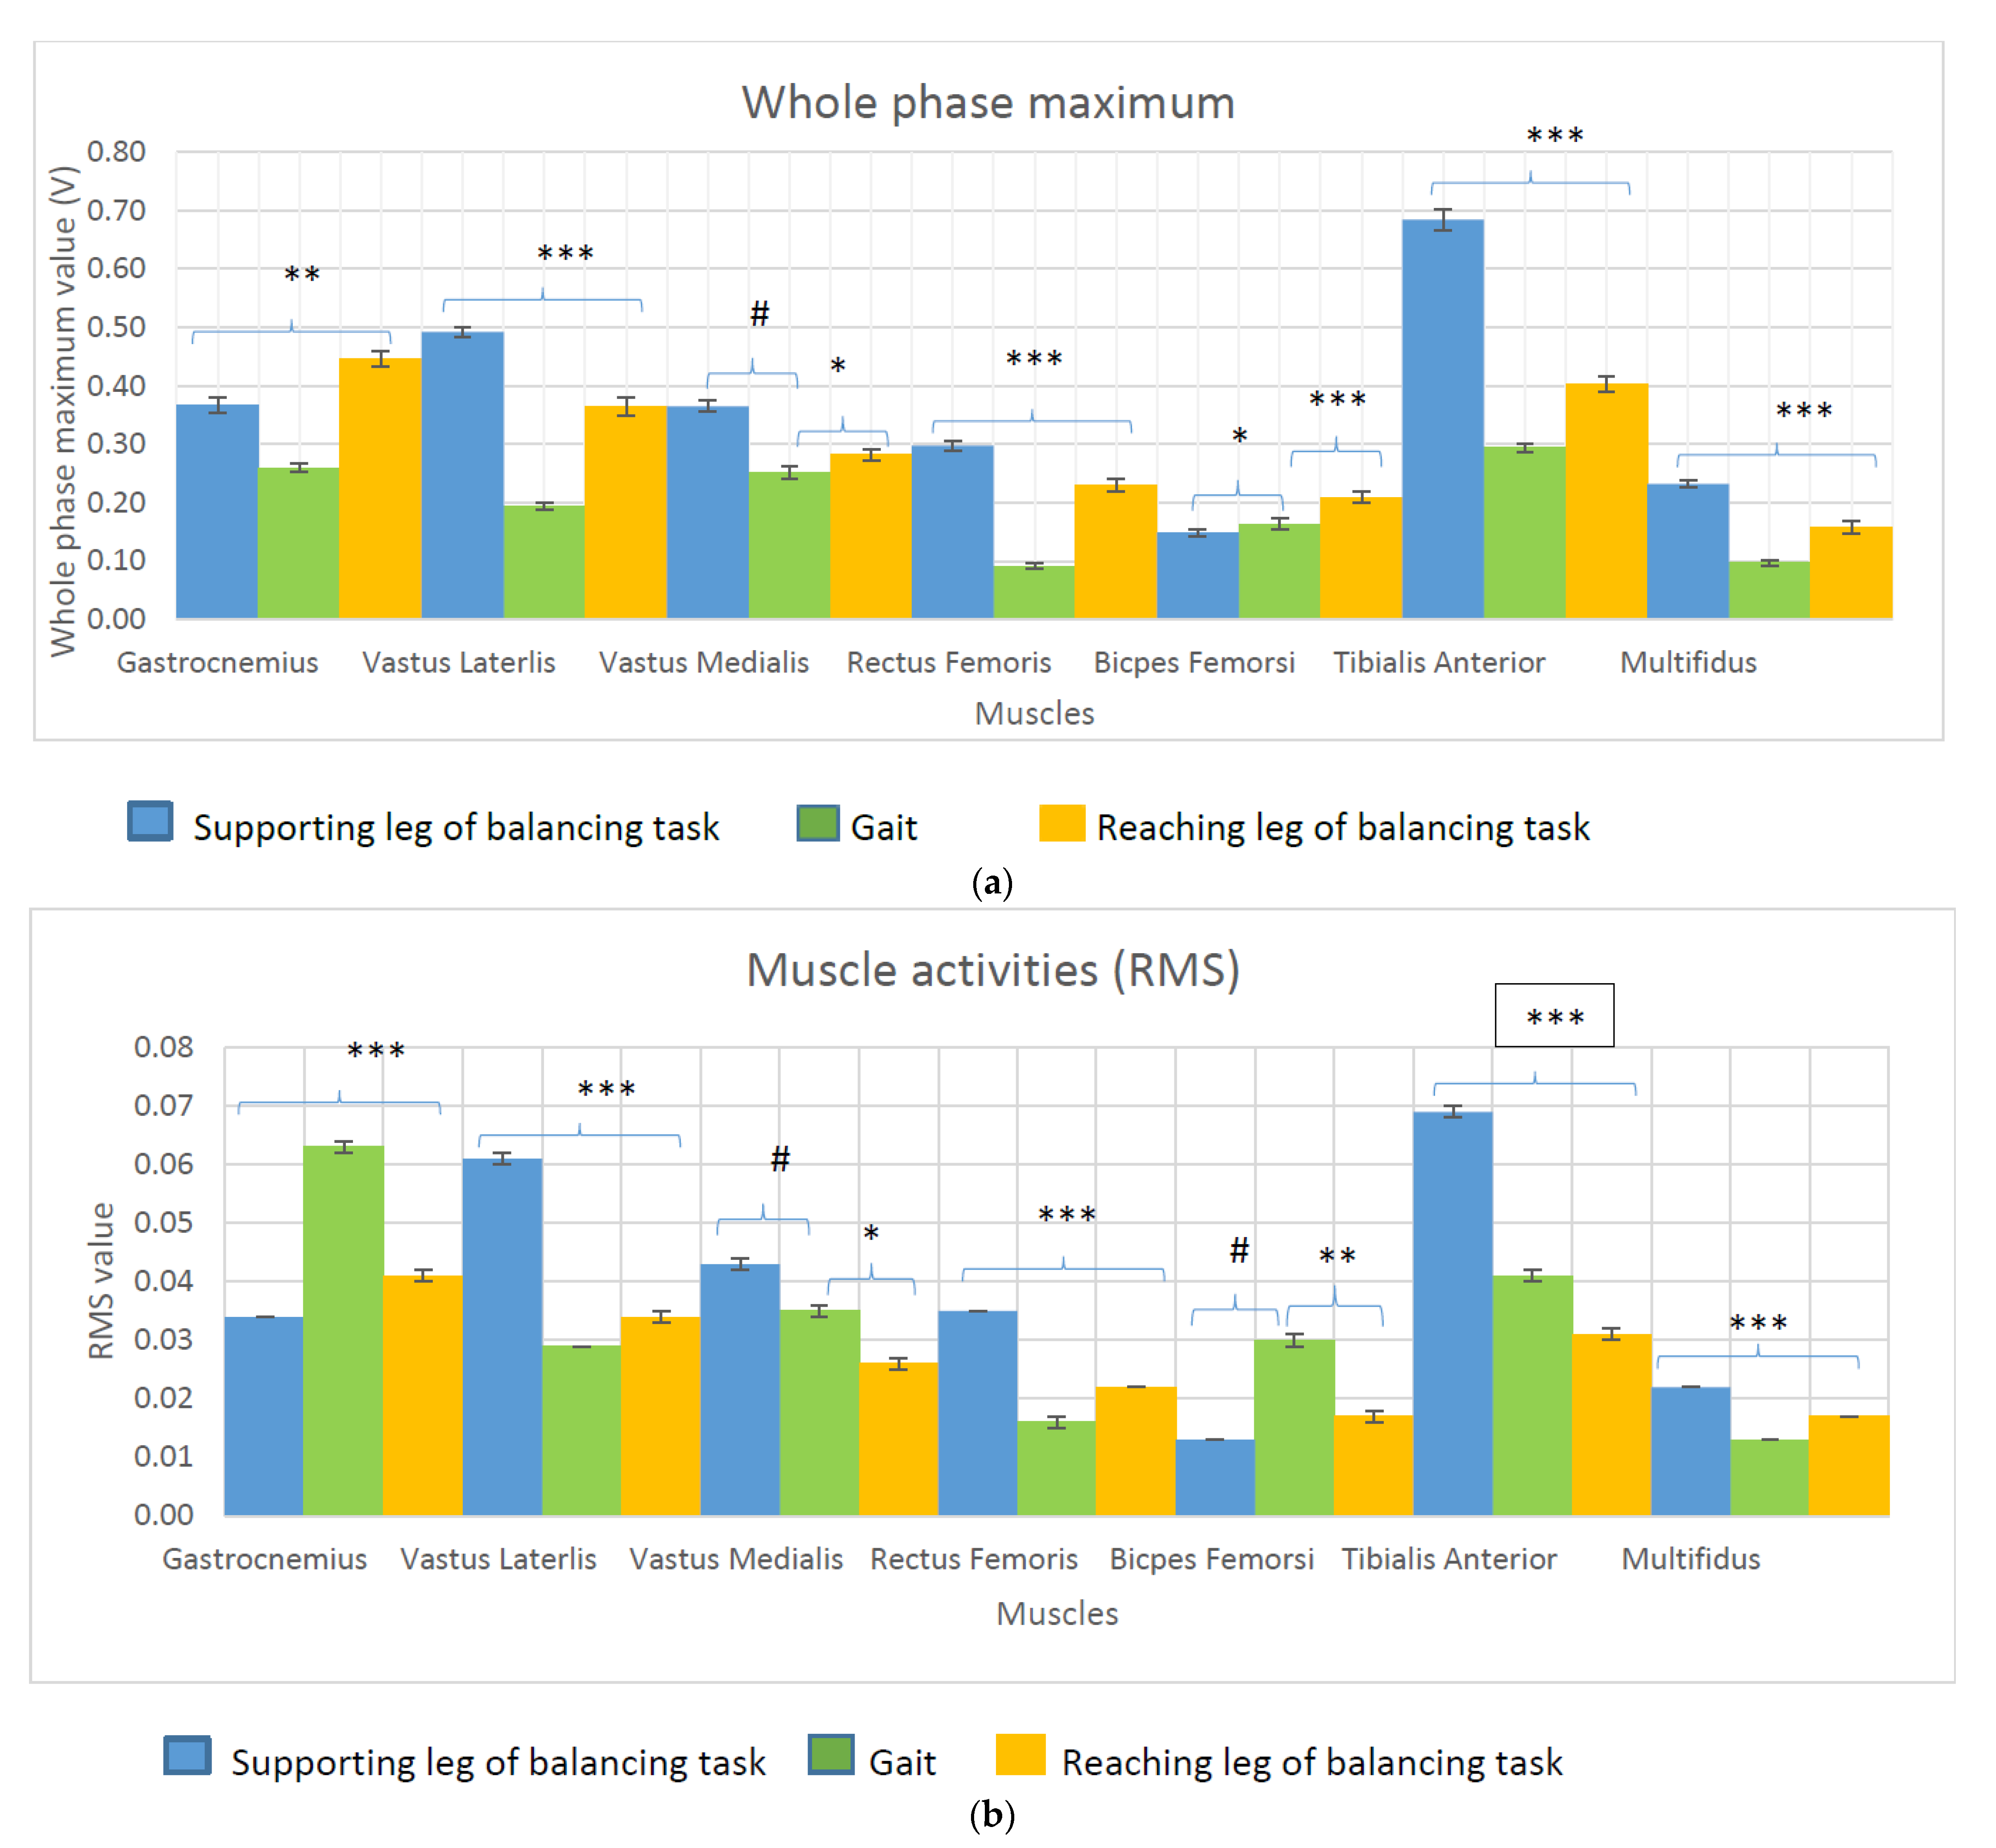
3.2. Comparison of the Muscle Activities during the Balance Test and Gait
3.3. Correlation between the Balance Test Muscle Activities and Gait Muscle Activities
3.4. Association between Balance Ability and Muscle Activity
3.5. Association between the Displacement of the Centre of Mass or the Total Reach Distance during the Balance Test and the Joint Kinematics and Kinetics during Gait
4. Discussion
4.1. Application
4.2. Limitations of the Study
4.3. In Future
5. Conclusions
Author Contributions
Funding
Institutional Review Board Statement
Informed Consent Statement
Data Availability Statement
Conflicts of Interest
References
- Mirelman, A.; Shema, S.; Maidan, I.; Hausdorff, J. Gait. Handb. Clin. Neurol. 2018, 159, 119–134. [Google Scholar]
- Sciencedirect, Gait. 2019. Available online: https://0-www-sciencedirect-com.brum.beds.ac.uk/topics/neuroscience/gait (accessed on 11 August 2019).
- Pirker, W.; Katzenschlager, R. Gait disorders in adults and the elderly. A clinical guide. Wien. Klin. Wochenschr. 2017, 129, 81–95. [Google Scholar] [CrossRef] [Green Version]
- Landry, S.C.; McKean, K.A.; Hubley-Kozey, C.L.; Stanish, W.D.; Deluzio, K.J. Knee biomechanics of moderate OA patients measured during gait at a self-selected and fast walking speed. J. Biomech. 2007, 40, 1754–1761. [Google Scholar] [CrossRef] [PubMed]
- Muro-de-la-Herran, A.; Garcia-Zapirain, B.; Mendez-Zorrilla, A. Gait analysis methods: An overview of wearable and non-wearable systems, highlighting clinical applications. Sensors 2014, 14, 3362–3394. [Google Scholar] [CrossRef] [Green Version]
- Vincent, K.R.; Vincent, H.K. Resistance exercise for knee osteoarthritis. PM R J. Inj. Funct. Rehabil. 2012, 4 (Suppl. S5), S45–S52. [Google Scholar] [CrossRef]
- Sled, E.A.; Khoja, L.; Deluzio, K.J.; Olney, S.J.; Culham, E.G. Effect of a home program of hip abductor exercises on knee joint loading, strength, function, and pain in people with knee osteoarthritis. a clinical trial. Phys. Ther. 2010, 90, 895–904. [Google Scholar] [CrossRef] [Green Version]
- Patel, J. Propriocpetion and Balance Training in Osteoarthrits of the Knee Joint; Longdom Publishing: Las Vegas, NV, USA, 2013. [Google Scholar]
- Viswananthan, A.; Sudarsky, L. Balance and gait problems in the elderly. Handb. Clin. Neurol. 2012, 103, 623–634. [Google Scholar]
- Pollock, A.; Durward, B.; Rowe, P.; Paul, J. What is balance? Clin. Rehabil. 2000, 14, 402–406. [Google Scholar] [CrossRef]
- Kim, H.-S.; Yun, D.H.; Yoo, S.D.; Kim, D.H.; Jeong, Y.S.; Yun, J.-S.; Hwang, D.G.; Jung, P.K.; Choi, S.H.C. Balance control and knee osteoarthritis severity. Ann. Rehabil. Med. 2011, 35, 701–709. [Google Scholar] [CrossRef] [Green Version]
- Earl, J.; Hertel, J. Lower-Extremity muscle activation during the star excursion balance tests. J. Sport Rehabil. 2001, 10, 93–104. [Google Scholar] [CrossRef] [Green Version]
- Gebel, A.; Luder, B.; Granacher, U. Effects of increasing balance task difficulty on postural sway and muscle activity in healthy adolescents. Front. Physiol. 2019, 10, 1135. [Google Scholar] [CrossRef]
- Gribble, P.A.; Hertel, J.; Plisky, P. Using the star excursion balance test to assess dynamic postural-control deficits and outcomes in lower extremity injury: A literature and systematic review. J. Athl. Train. 2012, 47, 339–357. [Google Scholar] [CrossRef] [Green Version]
- Kanko, L.; Birmingham, T.; Bryant, D.; Gillanders, K.; Lemmon, K.; Chan, R.; Postic, M.; Giffin, J.R. The star excursion balance test is a reliable and valid outcome measure for patients with knee osteoarthritis. Osteoarthr. Cartil. 2019, 27, 580–585. [Google Scholar] [CrossRef] [Green Version]
- Phillip, A.G.; Hertel, J. Considerations for normalising measures of the star excursion balance test. Meas. Phys. Educ. Exerc. Sci. 2003, 7, 89–100. [Google Scholar]
- Dicharry, J. Kinematics and kinetics of gait: From lab to clinic. Clin. Sports Med. 2010, 29, 347–364. [Google Scholar] [CrossRef]
- Chvatal, S.; Ting, L.H. Common Muscle synergies for balance and walking. Front. Comput. Neurosci. 2013, 48, 7. [Google Scholar] [CrossRef] [Green Version]
- Morrone, B.F.; Spaccarotella, K. Comparison of balance between genders of crossfit athletes. Grad. J. Sport Exerc. Phys. Educ. Res. 2018, 10, 1–11. [Google Scholar]
- Imoto, A.; Peccin, M.; Trevisani, V. Quadriceps strengthening exercises are effective in improving pain, function and quality of life in patients with osteoarthritis of the knee. Acta Ortop. Bras. 2012, 20, 174–179. [Google Scholar] [CrossRef] [Green Version]
- Bokaeian, H.R.; Bakhtiary, H.; Mirmohammadkhani, M.; Moghimi, J. Quadriceps strengthening exercises may not change pain and function in knee osteoarthritis. J. Bodyw. Mov. Ther. 2018, 22, 528–533. [Google Scholar] [CrossRef]
- Kean, C.O.; Behm, D.G.; Young, W.B. Fixed foot balance training increases rectus femoris activation during landing and jump height in recreationally active women. J. Sports Sci. Med. 2006, 5, 138–148. [Google Scholar]
- Robinson, R.; Gribble, P. Kinematic predictors of performance on the star excursion balance test. J. Sport Rehabil. 2008, 17, 347–357. [Google Scholar] [CrossRef] [PubMed]
- Filipa, A.; Byrnes, R.; Paterno, M.V.; Myer, G.D.; Hewett, T.E. Neuromuscular training improves performance on the star excursion balance test in young female athletes. J. Orthop. Sports Phys. Ther. 2010, 40, 551–558. [Google Scholar] [CrossRef] [PubMed] [Green Version]


| Descriptive Statistics | ||||
|---|---|---|---|---|
| Min | Max | Mean | Std. Dev | |
| Age (Years) | 21 | 59 | 32.8 | 9.1 |
| Height (m) | 1.53 | 1.86 | 1.67 | 0.09 |
| Weight (kg) | 43.2 | 88.0 | 66.06 | 12.70 |
| BMI (kg/m2) | 18.45 | 29.24 | 23.69 | 3.51 |
| Right leg length (cm) | 78.5 | 100 | 89.75 | 5.40 |
| Left leg length (cm) | 78 | 100 | 89.55 | 5.52 |
| Right knee width (cm) | 6.7 | 10.5 | 9.23 | 0.79 |
| Left knee width (cm) | 6.7 | 10.6 | 9.18 | 0.82 |
| Right ankle width(cm) | 5.6 | 7.7 | 6.76 | 0.51 |
| Left ankle width (cm) | 5.6 | 7.6 | 6.7 | 0.52 |
| Muscles Activities | Tasks | Balancing Task | ||||
|---|---|---|---|---|---|---|
| Supporting Leg | Reaching Leg | |||||
| R | P | R | P | |||
| Whole Phase maximum | Gastrocemius | Gait | 0.370 | p = 0.001 | 0.654 | p < 0.0001 |
| Vastus Lateralis | 0.649 | p < 0.0001 | 0.650 | p < 0.0001 | ||
| Vastus Medialis | 0.030 | p = 0.085 | 0.310 | p = 0.008 | ||
| Tibialis Anterior | 0.630 | p < 0.0001 | 0.69 | p < 0.0001 | ||
| Multifidus | 0.698 | p < 0.0001 | 0.748 | p < 0.0001 | ||
| Rectus Femoris | 0.509 | p < 0.0001 | 0.406 | p < 0.0001 | ||
| Biceps Femoris | 0.384 | p = 0.005 | 0.472 | p < 0.0001 | ||
| Rooted Mean Squared value | Gastrocemius | 0.438 | p < 0.0001 | 0.529 | p < 0.0001 | |
| Vastus Lateralis | 0.639 | p < 0.0001 | 0.522 | p < 0.0001 | ||
| Vastus Medialis | −0.097 | p = 0.419 | 0.248 | p = 0.0320 | ||
| Tibialis Anterior | 0.539 | p < 0.0001 | 0.679 | p < 0.0001 | ||
| Multifidus | 0.800 | p < 0.0001 | 0.828 | p < 0.0001 | ||
| Rectus Femoris | 0.453 | p < 0.0001 | 0.469 | p < 0.0001 | ||
| Biceps Femoris | 0.167 | p = 0.160 | 0.380 | p = 0.001 | ||
| Model | Unstandardized Coefficients | Standardized Coefficients | T | Sig. | ||
|---|---|---|---|---|---|---|
| B | Std. Error | Beta | ||||
| Dependent Variable: Centre of Mass displacement in Anterior Posterior Direction (m) | (Constant) | 0.359 | 0.072 | 5.019 | p < 0.0001 | |
| R = 0.917 | Gastro-Max-SL | 0.430 | 0.081 | 0.399 | 5.314 | p < 0.0001 |
| R Square = 0.842 | VL-Max-SL | 0.714 | 0.165 | 0.738 | 4.317 | p < 0.0001 |
| Adjusted R Square = 0.809 | VL-RMS-SL | −6.800 | 1.387 | −0.809 | −4.904 | p < 0.0001 |
| Std. Error of the Estimate = 0.107 | VM-RMS-SL | 4.507 | 0.965 | 0.407 | 4.673 | p < 0.0001 |
| p < 0.0001 | MF-RMS-SL | −13.075 | 1.781 | −0.879 | −7.339 | p < 0.0001 |
| RF-Max-SL | 0.371 | 0.166 | 0.221 | 2.244 | p = 0.031 | |
| BF-RMS-SL | −18.792 | 2.623 | −0.859 | −7.165 | p < 0.0001 | |
| Dependent Variable: Centre of Mass displacement in Medial lateral direction (m) | (Constant) | 0.392 | 0.066 | 5.930 | p < 0.0001 | |
| R = 0.912 | Gastro-Max-SL | 0.386 | 0.080 | 0.352 | 4.803 | p < 0.0001 |
| R Square = 0.832 | VL-Max-SL | 0.806 | 0.160 | 0.936 | 5.037 | p < 0.0001 |
| Adjusted R Square = 0.801 | VL-RMS-SL | −7.764 | 1.396 | −0.995 | −5.561 | p < 0.0001 |
| Std. Error of the Estimate = 0.108 | VM-RMS-SL | 4.335 | 0.962 | 0.402 | 4.507 | p < 0.0001 |
| p < 0.0001 | MF-RMS-SL | −12.733 | 1.707 | −0.868 | −7.460 | p < 0.0001 |
| RF-Max-SL | 0.384 | 0.164 | 0.234 | 2.335 | p = 0.025 | |
| BF-RMS-SL | −18.189 | 2.594 | −0.805 | −7.013 | p < 0.0001 | |
| Dependent Variable: Centre of Mass displacement in vertical direction (m) | (Constant) | 0.027 | 0.017 | 1.606 | p = 0.117 | |
| R = 0.889 | Gastro-Max-SL | 0.090 | 0.021 | 0.378 | 4.299 | p < 0.0001 |
| R Square = 0.791 | VL-Max-SL | 0.048 | 0.024 | 0.224 | 2.019 | p = 0.051 |
| Adjusted R Square = 0.748 | VM-RMS-SL | 1.524 | 0.225 | 0.622 | 6.783 | p < 0.0001 |
| Std. Error of the Estimate = 0.027 | TA-RMS-SL | −0.563 | 0.139 | −0.352 | −4.036 | p < 0.0001 |
| p < 0.0001 | RF-RMS-SL | 0.895 | 0.443 | 0.237 | 2.024 | p = 0.051 |
| BF-Max-SL | −0.509 | 0.139 | −1.203 | −3.668 | p = 0.001 | |
| BF-RMS-SL | 4.896 | 1.533 | 1.012 | 3.193 | p = 0.003 | |
| Dependent Variable: Total reach distance during balance test (m) | (Constant) | 524.790 | 33.969 | 15.449 | p < 0.001 | |
| R = 0.885 | Gastro-Max-SL | 120.191 | 40.799 | 0.217 | 2.946 | p = 0.005 |
| R Square = 0.783 | VL-Max-SL | 84.623 | 41.662 | 0.223 | 2.031 | p = 0.048 |
| Adjusted R Square = 0.747 | VM-RMS-SL | 3368.742 | 446.156 | 0.601 | 7.551 | p < 0.001 |
| Std. Error of the Estimate = 58.337 | TA-RMS-SL | 621.175 | 299.146 | 0.177 | 2.076 | p = 0.043 |
| p < 0.0001 | MF-RMS-SL | −5698.036 | 1067.823 | −0.784 | −5.336 | p < 0.0001 |
| RF-Max-SL | 402.848 | 100.852 | 0.646 | 3.994 | p < 0.0001 | |
| RF-RMS-SL | −3682.973 | 1351.236 | −0.479 | −2.726 | p = 0.009 | |
| BF-RMS-SL | −7591.049 | 1321.868 | −0.806 | −5.743 | p < 0.0001 | |
| Model | Unstandardized Coefficients | Standardized Coefficients | T | Sig. | ||
|---|---|---|---|---|---|---|
| B | Std. Error | Beta | ||||
| Dependent Variable: Total Reach Distance (m) | (Constant) | 56.605 | 114.857 | 0.493 | p = 0.625 | |
| R = 0.906 | HipAnglesYmin.Gait | −4.918 | 2.164 | −0.189 | −2.272 | p = 0.029 |
| R Square = 0.821 | HipForceYmin.Gait | 157.690 | 27.314 | 0.813 | 5.773 | p < 0.0001 |
| Adjusted R Square = 0.775 | AnkleAnglesXmin.Gait | −4.702 | 1.007 | −0.378 | −4.669 | p < 0.0001 |
| Std. Error of the Estimate = 49.690 | AnkleMomentXRoMGait | 0.292 | 0.062 | 0.375 | 4.699 | p < 0.0001 |
| p < 0.0001 | AnkleMomentYmin.Gait | 0.512 | 0.137 | 0.284 | 3.736 | p = 0.001 |
| AnkleAnglesZmin.Gait | −6.147 | 1.154 | −0.457 | −5.327 | p < 0.0001 | |
| KneeAnglesYmin.Gait | −6.562 | 1.777 | −0.286 | −3.693 | p = 0.001 | |
| HipMomentYRoM.Gait | 0.178 | 0.047 | 0.592 | 3.765 | p = 0.001 | |
| KneeMomentYRoM.Gait | −0.135 | 0.051 | −0.292 | −2.675 | p = 0.011 | |
| KneeMomentZRoM.Gait | 0.341 | 0.160 | 0.172 | 2.124 | p = 0.040 | |
| Dependent Variable: Balance Test CoM displacement in Anterior posterior direction (m) | (Constant) | 0.084 | 0.136 | 0.622 | p = 0.538 | |
| R = 0.606 | AnkleAnglesYmin.Gait | 0.036 | 0.013 | 0.396 | 2.896 | p = 0.007 |
| R Square = 0.368 | AnkleAnglesZRoM.Gait | 0.020 | 0.007 | 0.423 | 2.938 | p = 0.006 |
| Adjusted R Square = 0.312 | AnkleMomentYmin.Gait | 0.001 | 0.001 | 0.334 | 2.319 | p = 0.027 |
| Std. Error of the Estimate = 0.192 | ||||||
| p < 0.001 | ||||||
| Dependent Variable: Balance Test CoM displacement in medial lateral direction (m) | (Constant) | 0.232 | 0.103 | 2.253 | p = 0.030 | |
| R = 0.545 | AnkleAnglesXmin.Gait | −0.013 | 0.004 | −0.443 | −3.296 | p = 0.002 |
| R Square = 0.297 | AnkleForceYmin.Gait | 0.161 | 0.064 | 0.337 | 2.505 | p = 0.017 |
| Adjusted R Square = 0.261 | ||||||
| Std. Error of the Estimate = 0.197 | ||||||
| p < 0.001 | ||||||
| Dependent Variable: Balance Test CoM displacement in vertical direction (m) | (Constant) | −0.119 | 0.047 | −2.521 | p = 0.017 | |
| R = 0.891 | AnkleMomentXmax.Gait | 0.000 | 0.000 | 0.344 | 3.773 | p = 0.001 |
| R Square = 0.794 | KneeMomentZRoM.Gait | 0.000 | 0.000 | 0.496 | 5.956 | p < 0.0001 |
| Adjusted R Square = 0.762 | HipForceYmin.Gait | 0.065 | 0.011 | 0.919 | 5.732 | p < 0.0001 |
| Std. Error of the Estimate = 0.020 | KneePoweZmin.Gait | −0.022 | 0.004 | −0.586 | −5.446 | p < 0.0001 |
| p < 0.0001 | HipMomentYmax.Gait | 0.000 | 0.000 | 0.363 | 2.657 | p = 0.012 |
Publisher’s Note: MDPI stays neutral with regard to jurisdictional claims in published maps and institutional affiliations. |
© 2021 by the authors. Licensee MDPI, Basel, Switzerland. This article is an open access article distributed under the terms and conditions of the Creative Commons Attribution (CC BY) license (https://creativecommons.org/licenses/by/4.0/).
Share and Cite
Cinthuja, P.; Arnold, G.; Abboud, R.J.; Wang, W. Analysis of the Relationships between Balance Ability and Walking in Terms of Muscle Activities and Lower Limb Kinematics and Kinetics. Biomechanics 2021, 1, 190-201. https://0-doi-org.brum.beds.ac.uk/10.3390/biomechanics1020016
Cinthuja P, Arnold G, Abboud RJ, Wang W. Analysis of the Relationships between Balance Ability and Walking in Terms of Muscle Activities and Lower Limb Kinematics and Kinetics. Biomechanics. 2021; 1(2):190-201. https://0-doi-org.brum.beds.ac.uk/10.3390/biomechanics1020016
Chicago/Turabian StyleCinthuja, Pathmanathan, Graham Arnold, Rami J. Abboud, and Weijie Wang. 2021. "Analysis of the Relationships between Balance Ability and Walking in Terms of Muscle Activities and Lower Limb Kinematics and Kinetics" Biomechanics 1, no. 2: 190-201. https://0-doi-org.brum.beds.ac.uk/10.3390/biomechanics1020016