
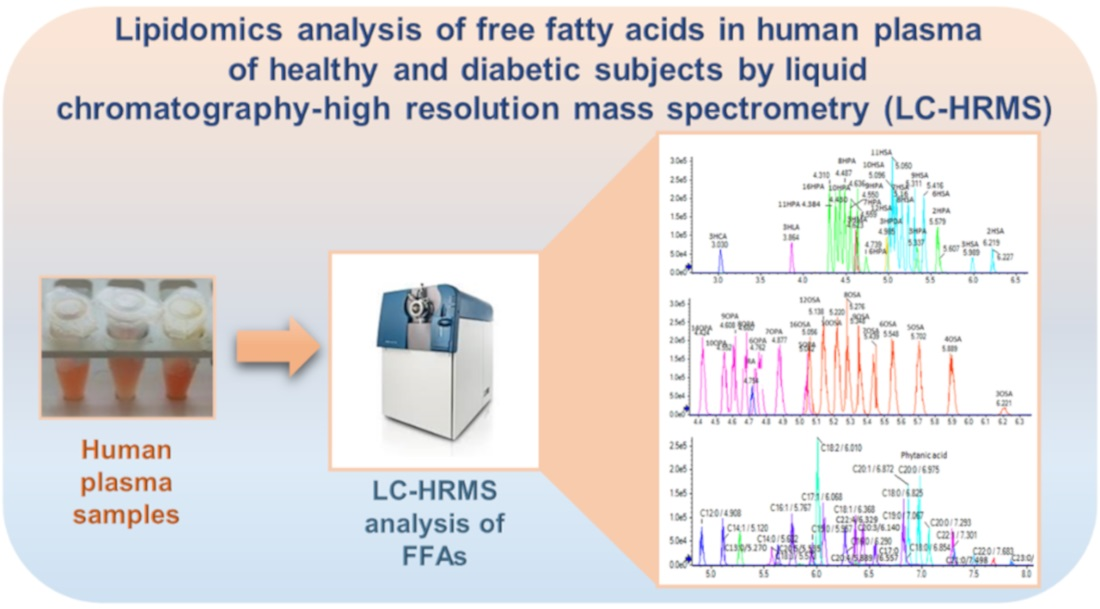
Lipidomics Analysis of Free Fatty Acids in Human Plasma of Healthy and Diabetic Subjects by Liquid Chromatography-High Resolution Mass Spectrometry (LC-HRMS)


 , and
, and
Abstract
:
1. Introduction
2. Materials and Methods
2.1. Reagents and Lipid Standards
2.2. Biological Samples
2.3. Stock and Working Solutions
2.4. Extraction of Lipids from Plasma Samples
2.5. LC-MS/MS Analysis
2.6. Data Processing and Quantification
2.7. Analytical Validation
2.7.1. Linearity and Sensitivity
2.7.2. Precision and Accuracy
3. Results
3.1. Accuracy and Precision Data
3.2. Analysis of Samples
4. Discussion
5. Conclusions
Supplementary Materials
Author Contributions
Funding
Institutional Review Board Statement
Informed Consent Statement
Data Availability Statement
Conflicts of Interest
References
- Calder, P.C.; Burdge, G.C. Fatty Acids in Bioactive Lipids; The Oily Press: Bridgewater, UK, 2004; pp. 1–36. [Google Scholar]
- Georgiadi, A.; Kersten, S. Mechanisms of Gene Regulation by Fatty Acids. Adv. Nutr. 2012, 3, 127–134. [Google Scholar] [CrossRef] [PubMed] [Green Version]
- Kimura, I.; Ichimura, A.; Ohue-Kitano, R.; Igarashi, M. Free Fatty Acid Receptors in Health and Disease. Physiol. Rev. 2020, 100, 171–210. [Google Scholar] [CrossRef] [PubMed]
- Li, Z.; Xu, X.; Huang, W.; Qian, H. Free Fatty Acid Receptor 1 (FFAR1) as an Emerging Therapeutic Target for Type 2 Diabetes Mellitus: Recent Progress and Prevailing Challenges. Med. Res. Rev. 2018, 38, 381–425. [Google Scholar] [CrossRef] [PubMed]
- Ulven, T.; Christiansen, E. Dietary fatty acids and their potential for controlling metabolic diseases through activation of FFA4/GPR120. Annu. Rev. Nutr. 2015, 35, 239–263. [Google Scholar] [CrossRef]
- Ghislain, J.; Poitout, V. Targeting lipid GPCRs to treat type 2 diabetes mellitus—Progress and challenges. Nat. Rev. Endocrinol. 2021, 17, 162–175. [Google Scholar] [CrossRef]
- Bolognini, D.; Dedeo, D.; Milligan, G. Metabolic and inflammatory functions of short-chain fatty acid receptors. Curr. Opin. Endocr. Metab. Res. 2021, 16, 1–9. [Google Scholar] [CrossRef]
- Wilding, J.P. The importance of free fatty acids in the development of Type 2 diabetes. Diabet. Med. 2007, 24, 934–945. [Google Scholar] [CrossRef]
- Boden, G. Obesity, insulin resistance and free fatty acids. Curr. Opin. Endocrinol. Diabetes Obes. 2011, 18, 139–143. [Google Scholar] [CrossRef] [Green Version]
- Sobczak, A.I.S.; Blindauer, C.A.; Stewart, A.J. Changes in plasma free fatty acids associated with type-2 diabetes. Nutrients 2019, 11, 2022. [Google Scholar] [CrossRef] [Green Version]
- Reaven, G.M.; Hollenbeck, C.; Jeng, C.Y.; Wu, M.S.; Chen, Y.D. Measurement of plasma glucose, free fatty acid, lactate, and insulin for 24 h in patients with NIDDM. Diabetes 1988, 37, 1020–1024. [Google Scholar] [CrossRef]
- Clore, J.N.; Allred, J.; White, D.; Li, J.; Stillman, J. The role of plasma fatty acid composition in endogenous glucose production in patients with type 2 diabetes mellitus. Metabolism 2002, 51, 1471–1477. [Google Scholar] [CrossRef] [PubMed]
- Yi, L.; He, J.; Liang, Y.; Yuan, D.; Gao, H.; Zhou, H. Simultaneously quantitative measurement of comprehensive profiles of esterified and non-esterified fatty acid in plasma of type 2 diabetic patients. Chem. Phys. Lipids 2007, 150, 204–216. [Google Scholar] [CrossRef] [PubMed]
- Liu, L.; Li, Y.; Guan, C.; Li, K.; Wang, C.; Feng, R.; Sun, C. Free fatty acid metabolic profile and biomarkers of isolated post-challenge diabetes and type 2 diabetes mellitus based on GC–MS and multivariate statistical analysis. J. Chromatogr. B 2010, 878, 2817–2825. [Google Scholar] [CrossRef]
- Grapov, D.; Adams, S.H.; Pedersen, T.L.; Garvey, W.T.; Newman, J.W. Type 2 Diabetes Associated Changes in the Plasma Non-Esterified Fatty Acids, Oxylipins and Endocannabinoids. PLoS ONE 2012, 7, e48852. [Google Scholar] [CrossRef] [Green Version]
- Lu, Y.; Wang, Y.; Ong, C.-N.; Subramaniam, T.; Choi, H.W.; Yuan, J.-M.; Koh, W.-P.; Pan, A. Metabolic signatures and risk of type 2 diabetes in a Chinese population: An untargeted metabolomics study using both LC-MS and GC-MS. Diabetologia 2016, 59, 2349–2359. [Google Scholar] [CrossRef] [PubMed] [Green Version]
- Ma, X.-L.; Meng, L.; Li, L.-L.; Ma, L.-N.; Mao, X.-M. Plasma Free Fatty Acids Metabolic Profile Among Uyghurs and Kazaks With or Without Type 2 Diabetes Based on GC-MS. Exp. Clin. Endocrinol. Diabetes 2018, 126, 604–611. [Google Scholar] [CrossRef] [PubMed]
- Kokotou, M.G.; Kokotos, A.C.; Gkikas, D.; Mountanea, O.G.; Mantzourani, C.; Almutairi, A.; Lei, X.; Ramanadham, S.; Politis, P.K.; Kokotos, G. Saturated Hydroxy Fatty Acids Exhibit a Cell Growth Inhibitory Activity and Suppress the Cytokine-Induced β-Cell Apoptosis. J. Med. Chem. 2020, 63, 12666–12681. [Google Scholar] [CrossRef]
- Batsika, C.S.; Mantzourani, C.; Gkikas, D.; Kokotou, M.G.; Mountanea, O.G.; Kokotos, C.G.; Politis, P.K.; Kokotos, G. Saturated Oxo Fatty Acids (SOFAs): A Previously Unrecognized Class of Endogenous Bioactive Lipids Exhibiting a Cell Growth Inhibitory Activity. J. Med. Chem. 2021, 64, 5654–5666. [Google Scholar] [CrossRef]
- Kokotou, M.G.; Mantzourani, C.; Bourboula, A.; Mountanea, O.G.; Kokotos, G. A Liquid Chromatography-High Resolution Mass Spectrometry (LC-HRMS) Method for the Determination of Free Hydroxy Fatty Acids in Cow and Goat Milk. Molecules 2020, 25, 3947. [Google Scholar] [CrossRef]
- Kokotou, M.G.; Batsika, C.S.; Mantzourani, C.; Kokotos, G. Free Saturated Oxo Fatty Acids (SOFAs) and Ricinoleic Acid in Milk Determined by a Liquid Chromatography-High-Resolution Mass Spectrometry (LC-HRMS) Method. Metabolites 2021, 11, 46. [Google Scholar] [CrossRef]
- Zhu, Q.-F.; An, N.; Feng, Y.-Q. In-Depth Annotation Strategy of Saturated Hydroxy Fatty Acids Based on Their Chromatographic Retention Behaviors and MS Fragmentation Patterns. Anal. Chem. 2020, 92, 14528–14535. [Google Scholar] [CrossRef] [PubMed]
- Christinat, N.; Morin-Rivron, D.; Masoodi, M. High-Throughput Quantitative Lipidomics Analysis of Nonesterified Fatty Acids in Plasma by LC-MS. In Serum/Plasma Proteomics; Humana Press: New York, NY, USA, 2017; Volume 1619, pp. 183–191. [Google Scholar] [CrossRef]
- Kokotou, M.G.; Mantzourani, C.; Kokotos, G. Development of a Liquid Chromatography–High Resolution Mass Spectrometry Method for the Determination of Free Fatty Acids in Milk. Molecules 2020, 25, 1548. [Google Scholar] [CrossRef] [PubMed] [Green Version]
- Sergeant, S.; Ruczinski, I.; Ivester, P.; Lee, T.C.; Morgan, T.M.; Nicklas, B.J.; Mathias, R.A.; Chilton, F.H. Impact of methods used to express levels of circulating fatty acids on the degree and direction of associations with blood lipids in humans. Br. J. Nutr. 2016, 115, 251–261. [Google Scholar] [CrossRef] [PubMed] [Green Version]
- Costa, C.G.; Dorland, L.; Holwerda, U.; De Almeida, I.T.; Poll-The, B.T.; Jakobs, C.; Duran, M. Simultaneous analysis of plasma free fatty acids and their 3-hydroxy analogs in fatty acid beta-oxidation disorders. Clin. Chem. 1998, 44, 463–471. [Google Scholar] [CrossRef] [PubMed]
- Chen, Z.; Wu, Y.; Shrestha, R.; Gao, Z.; Zhao, Y.; Miura, Y.; Tamakoshi, A.; Chiba, H.; Hui, S.-P. Determination of total, free and esterified short-chain fatty acid in human serum by liquid chromatography-mass spectrometry. Ann. Clin. Biochem. 2018, 56, 190–197. [Google Scholar] [CrossRef] [Green Version]
- Quehenberger, O.; Armando, A.M.; Brown, A.H.; Milne, S.B.; Myers, D.S.; Merrill, A.H.; Bandyopadhyay, S.; Jones, K.N.; Kelly, S.; Shaner, R.L.; et al. Lipidomics reveals a remarkable diversity of lipids in human plasma. J. Lipid Res. 2010, 51, 3299–3305. [Google Scholar] [CrossRef] [Green Version]
- Seo, C.; Yoon, J.; Rhee, Y.; Kim, J.J.; Nam, S.J.; Lee, W.; Lee, G.; Yee, S.T.; Paik, M.J. Simultaneous analysis of seven 2-hydroxy fatty acids as tert-butyldimethylsilyl derivatives in plasma by gas chromatography-mass spectrometry. Biomed. Chromatogr. 2015, 29, 156–160. [Google Scholar] [CrossRef]
- Yore, M.M.; Syed, I.; Moraes-Vieira, P.M.; Zhang, T.; Herman, M.A.; Homan, E.A.; Patel, R.T.; Lee, J.; Chen, S.; Peroni, O.D.; et al. Discovery of a Class of Endogenous Mammalian Lipids with Anti-Diabetic and Anti-inflammatory Effects. Cell 2014, 159, 318–332. [Google Scholar] [CrossRef] [Green Version]
- Hama, H. Fatty acid 2-Hydroxylation in mammalian sphingolipid biology. Biochim. Biophys. Acta (BBA) Mol. Cell Biol. Lipids 2010, 1801, 405–414. [Google Scholar] [CrossRef] [Green Version]
- Haghikia, A.; Jörg, S.; Duscha, A.; Berg, J.; Manzel, A.; Waschbisch, A.; Hammer, A.; Lee, D.-H.; May, C.; Wilck, N.; et al. Dietary Fatty Acids Directly Impact Central Nervous System Autoimmunity via the Small Intestine. Immunity 2016, 44, 951–953. [Google Scholar] [CrossRef] [Green Version]
- Saresella, M.; Marventano, I.; Barone, M.; La Rosa, F.; Piancone, F.; Mendozzi, L.; D’Arma, A.; Rossi, V.; Pugnetti, L.; Roda, G.; et al. Alterations in Circulating Fatty Acid Are Associated With Gut Microbiota Dysbiosis and Inflammation in Multiple Sclerosis. Front. Immunol. 2020, 11, 1390. [Google Scholar] [CrossRef] [PubMed]
- Omori, K.; Katakami, N.; Yamamoto, Y.; Ninomiya, H.; Takahara, M.; Matsuoka, T.-A.; Bamba, T.; Fukusaki, E.; Shimomura, I. Identification of Metabolites Associated with Onset of CAD in Diabetic Patients Using CE-MS Analysis: A Pilot Study. J. Atheroscler. Thromb. 2019, 26, 233–245. [Google Scholar] [CrossRef] [PubMed] [Green Version]
- Suhre, K.; Meisinger, C.; Döring, A.; Altmaier, E.; Belcredi, P.; Gieger, C.; Chang, D.; Milburn, M.V.; Gall, W.E.; Weinberger, K.M.; et al. Metabolic Footprint of Diabetes: A Multiplatform Metabolomics Study in an Epidemiological Setting. PLoS ONE 2010, 5, e13953. [Google Scholar] [CrossRef] [PubMed] [Green Version]
- Menni, C.; Fauman, E.; Erte, I.; Perry, J.R.; Kastenmüller, G.; Shin, S.Y.; Petersen, A.K.; Hyde, C.; Psatha, M.; Ward, K.J.; et al. Biomarkers for type 2 diabetes and impaired fasting glucose using a nontargeted metabolomics approach. Diabetes 2013, 62, 4270–4276. [Google Scholar] [CrossRef] [PubMed] [Green Version]
- Poudyal, H.; Brown, L. Should the pharmacological actions of dietary fatty acids in cardiometabolic disorders be classified based on biological or chemical function? Prog. Lipid Res. 2015, 59, 172–200. [Google Scholar] [CrossRef] [PubMed]


| Analyte | Control Plasma Sample (Number of Samples 28) | Literature (nmol/mL) | T2D Plasma Sample (Number of Samples 29) | T1D Plasma Sample (Number of Samples 14) | ||||||||||
|---|---|---|---|---|---|---|---|---|---|---|---|---|---|---|
| Minimum Value (nmol/mL) | Maximum Value (nmol/mL) | Mean Value ± SD (nmol/mL) | α | Minimum Value (nmol/mL) | Maximum Value (nmol/mL) | Mean Value ± SD (nmol/mL) | α | Minimum Value (nmol/mL) | Maximum Value (nmol/mL) | Mean Value ± SD (nmol/mL) | α | |||
| 3HCA | <LOQ a | 0.07 | 0.02 ± 0.01 b | *** | 0.15 [25] | <LOQ c | 0.29 | 0.03 ± 0.02 b | ** | <LOQ d | 0.04 | 0.01 ± 0.01 b | ** | |
| 3HLA | <LOQ a | 0.05 | 0.01 ± 0.01 b | ** | 0.07 [25] | <LOQ a | 0.10 | 0.02 ± 0.02 b | *** | <LOQ e | 0.03 | 0.01 ± 0.01 b | NS | |
| 3HMA, 3HPDA | <LOQ | - | <LOQ | - | <LOQ | - | ||||||||
| 16HPA | <LOQ f | 0.05 | 0.01 ± 0.01 b | ** | - | - | ||||||||
| 11HPA | <LOQ c | 0.04 | 0.01 ± 0.01 b | * | - | - | ||||||||
| 10HPA, 9HPA, 8HPA, 7HPA, 6HPA | <LOQ | - | - | - | ||||||||||
| 3HPA | <LOQ g | 0.04 | 0.02 ± 0.01 b | *** | 0.18 [25] | 0.02 | 0.09 | 0.03 ± 0.01 | *** | 0.02 | 0.04 | 0.02 ± 0.01 | *** | |
| 2HPA | <LOQ d | 0.38 | 0.19 ± 0.04 b | *** | 0.14 [26] | 0.10 | 0.49 | 0.25 ± 0.06 | *** | 0.11 | 0.31 | 0.21 ± 0.01 | *** | |
| 12HSA, 11HSA, 10HSA, 9HSA, 6HSA | <LOQ | - | <LOQ | - | <LOQ | - | ||||||||
| 7HSA | <LOQ f | 0.03 | 0.01 ± 0.01 b | ** | <LOQ a | 2.78 | 0.11 ± 0.50 b | NS | <LOQ g | 0.06 | 0.02 ± 0.01 b | ** | ||
| 8HSA | <LOQ c | 0.03 | 0.01 ± 0.01 b | NS | <LOQ | - | <LOQ | - | ||||||
| 3HSA | 0.02 | 0.08 | 0.04 ± 0.01 | *** | 0.02 [25] | 0.03 | 0.14 | 0.05 ± 0.02 | *** | 0.03 | 0.06 | 0.04 ± 0.01 | *** | |
| 2HSA | 0.03 | 0.24 | 0.09 ± 0.03 | *** | 0.14 [26] | 0.04 | 0.34 | 0.11 ± 0.03 | *** | 0.02 | 0.12 | 0.09 ± 0.03 | *** | |
| Analyte | Control Plasma Sample (Number of Samples 28) | T2D Plasma Sample (Number of Samples 29) | T1D Plasma Sample (Number of Samples 14) | |||||||||
|---|---|---|---|---|---|---|---|---|---|---|---|---|
| Minimum Value (nmol/mL) | Maximum Value (nmol/mL) | Mean Value ± SD (nmol/mL) | α | Minimum Value (nmol/mL) | Maximum Value (nmol/mL) | Mean Value ± SD (nmol/mL) | α | Minimum Value (nmol/mL) | Maximum Value (nmol/mL) | Mean Value ± SD (nmol/mL) | α | |
| 14OPA, 10OPA, 9OPA, 8OPA, 7OPA, 6OPA, 5OPA, 16OSA, 12OSA, 8OSA, 7OSA, 5OSA, 3OSA | <LOQ | - | <LOQ | - | <LOQ | - | ||||||
| 10OSA | - | <LOQ a | 0.02 | 0.01 ± 0.02 b | NS | <LOQ c | 0.02 | 0.01 ± 0.02 b | NS | |||
| 9OSA | - | <LOQ a | 0.02 | 0.01 ± 0.01 b | NS | <LOQ c | 0.03 | 0.01 ± 0.01 b | * | |||
| 6OSA | <LOQ d | 0.10 | 0.04 ± 0.02 b | *** | 0.03 | 0.22 | 0.06 ± 0.03 | *** | 0.02 | 0.11 | 0.05 ± 0.03 | *** |
| 4OSA | <LOQ | - | <LOQ a | 0.02 | 0.01 ± 0.01 b | ** | <LOQ | - | ||||
| Analyte | Control Plasma Sample (Number of Samples 28) | Literature (nmol/mL) | T2D Plasma Sample (Number of Samples 29) | T1D Plasma Sample (Number of Samples 14) | |||||||||
|---|---|---|---|---|---|---|---|---|---|---|---|---|---|
| Minimum Value (nmol/mL) | Maximum Value (nmol/mL) | Mean Value ± SD (nmol/mL) | α | Minimum Value (nmol/mL) | Maximum Value (nmol/mL) | Mean Value ± SD (nmol/mL) | α | Minimum Value (nmol/mL) | Maximum Value (nmol/mL) | Mean Value ± SD (nmol/mL) | α | ||
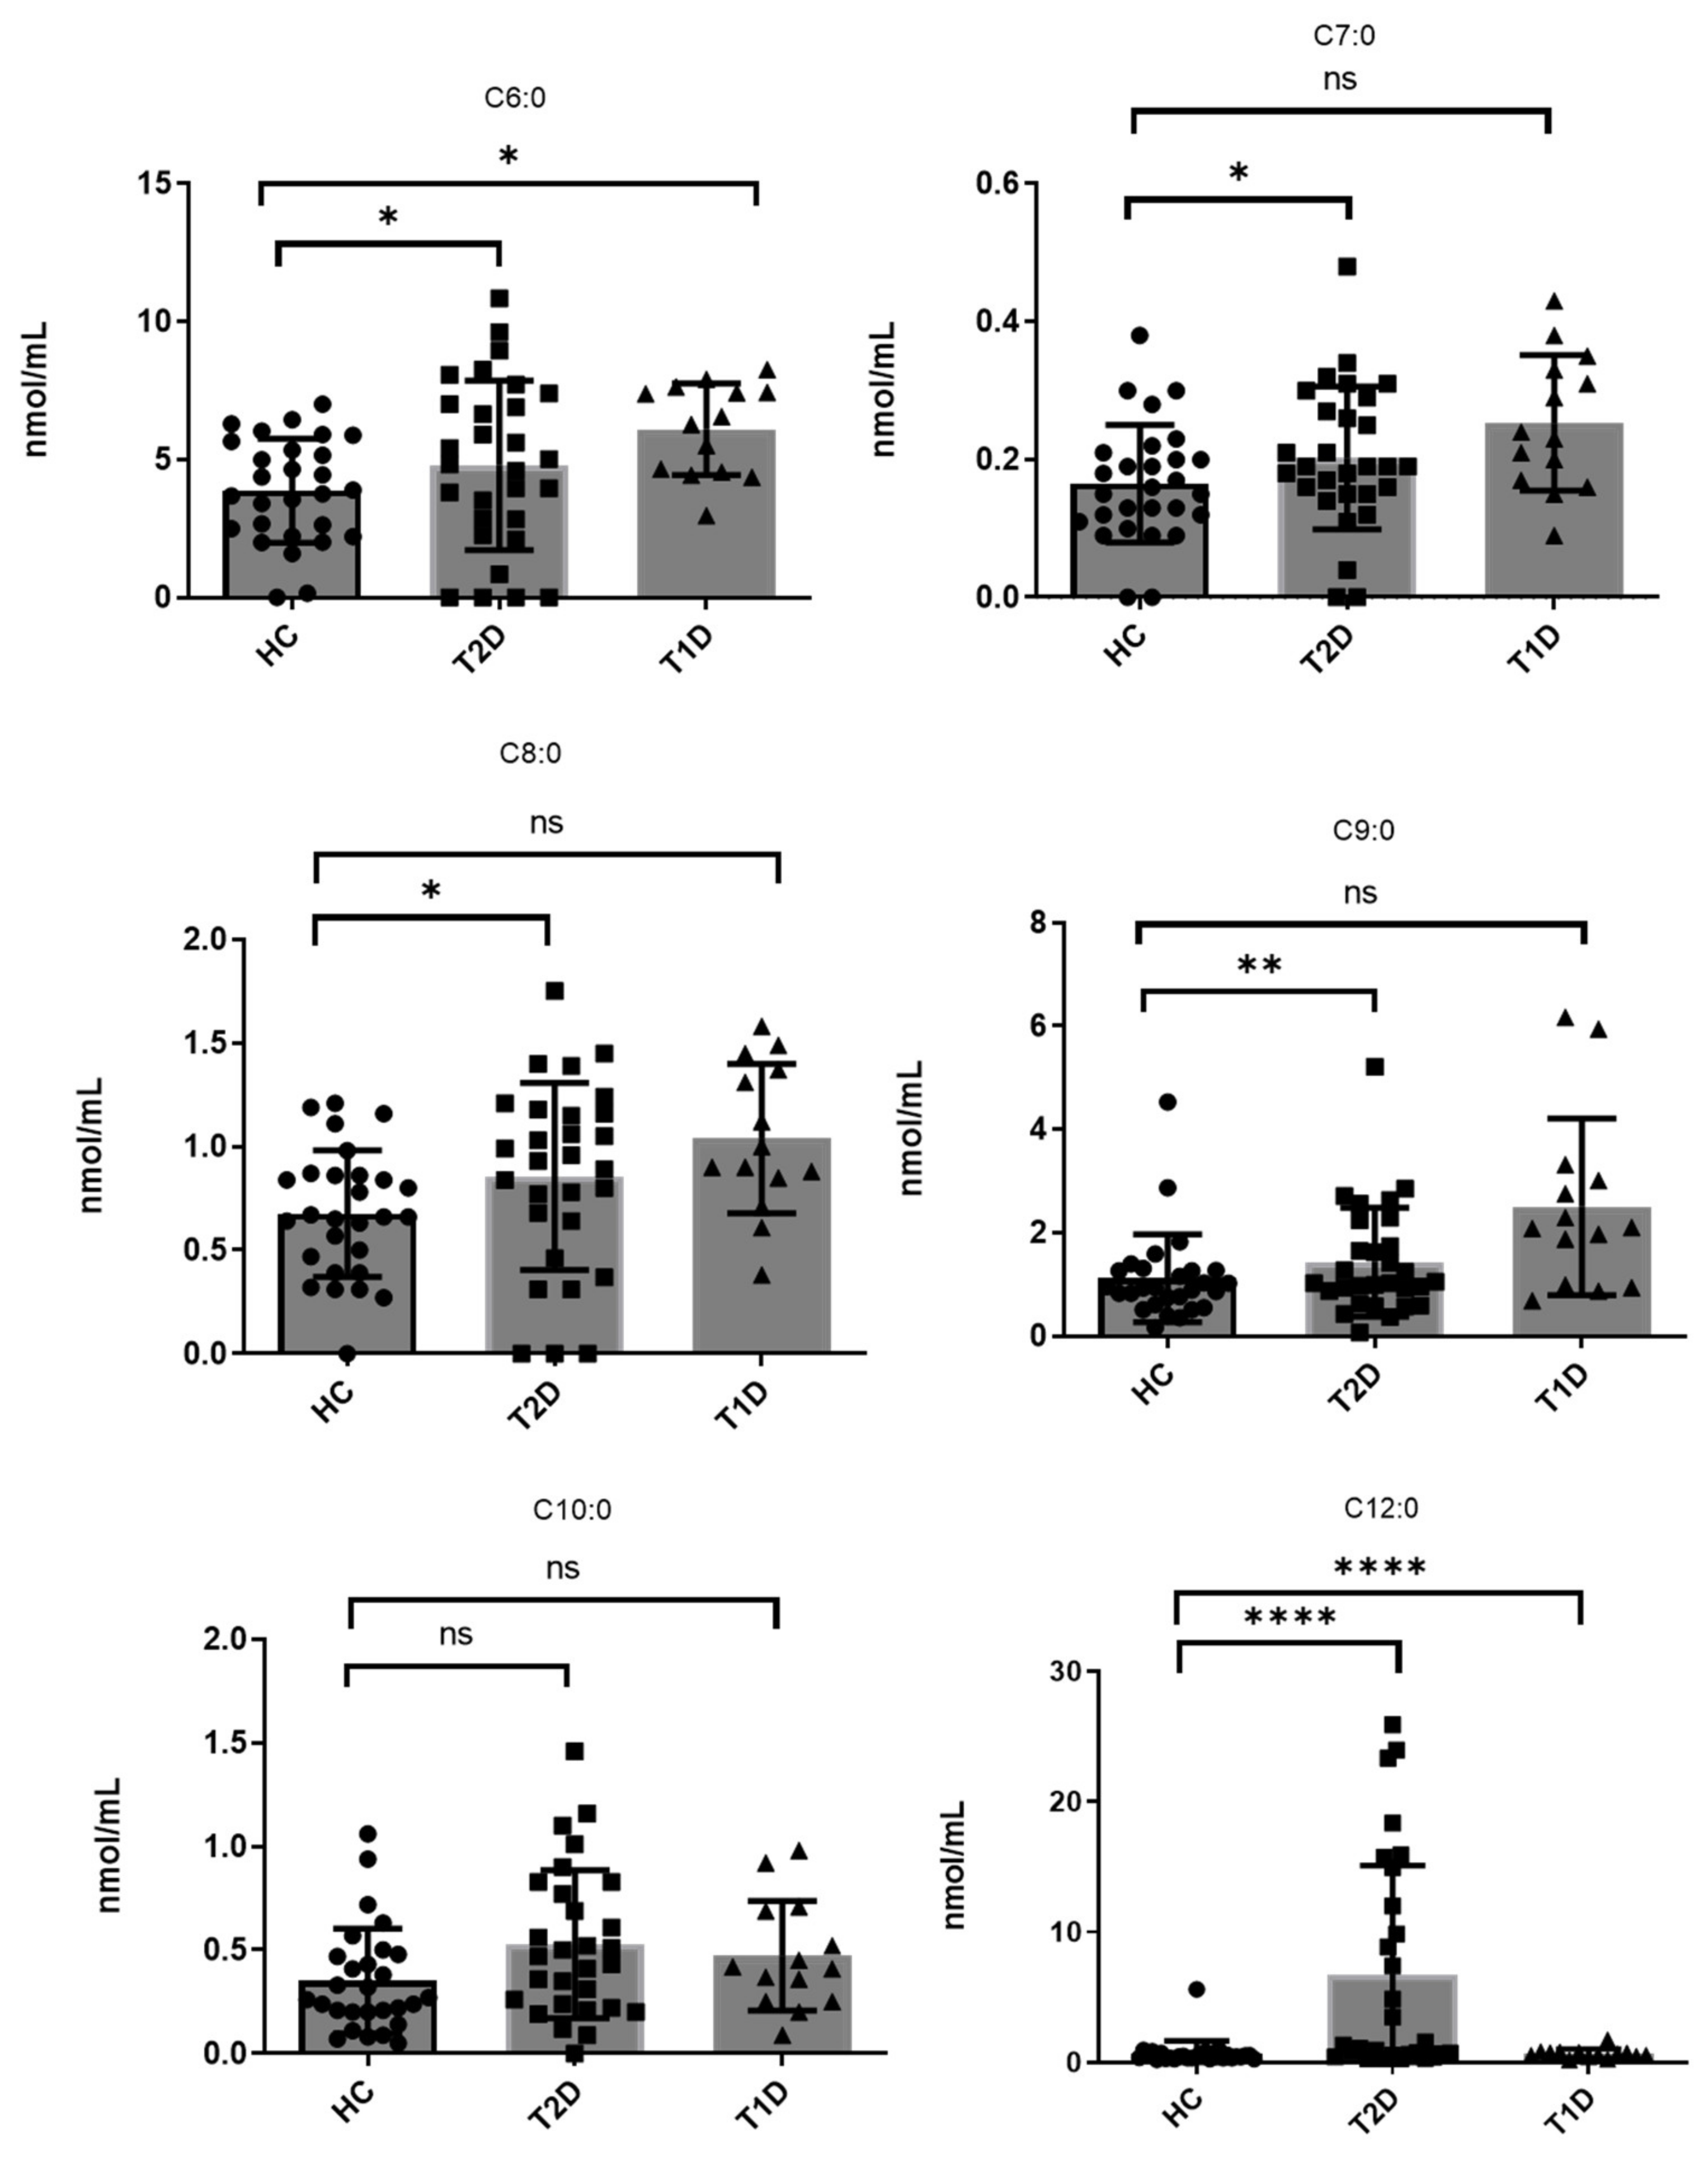
| C6:0 | 0.16 | 6.44 | 3.87 ± 1.89 | *** | 2.0 ± 2.5 [27] | <LOQ a | 9.62 | 4.79 ± 3.07 b | *** | 2.97 | 8.25 | 6.09 ± 1.67 | *** |
| C7:0 | <LOQ c | 0.38 | 0.16 ± 0.08 b | *** | <LOQ c | 0.48 | 0.20 ± 0.10 b | *** | 0.09 | 0.43 | 0.25 ± 0.09 | *** | |
| C8:0 | <LOQ c | 1.21 | 0.68 ± 0.30 b | *** | <LOQ c | 1.45 | 0.86 ± 0.45 b | *** | 0.61 | 1.58 | 1.04 ± 0.36 | *** | |
| C9:0 | 0.16 | 4.53 | 1.12 ± 0.85 | *** | 0.07 | 5.21 | 1.43 ± 0.03 | *** | 0.99 | 5.94 | 2.50 ± 1.71 | *** | |
| C10:0 | 0.05 | 1.06 | 0.35 ± 0.25 | *** | <LOQ c | 1.46 | 0.53 ± 0.36 b | *** | 0.20 | 0.98 | 0.47 ± 0.26 | *** | |
| C11:0 | <LOQ | - | <LOQ d | 0.09 | 0.02 ± 0.03 b | *** | <LOQ | - | |||||
| C12:0 | 0.25 | 5.61 | 0.68 ± 0.99 | *** | 0.719 ± 0.029 [28] 1.10 ± 0.55 [13] | 0.30 | 25.92 | 6.75 ± 8.35 | *** | 0.25 | 1.73 | 0.67 ± 0.36 | *** |
| C13:0 | 0.02 | 0.07 | 0.04 ± 0.01 | *** | 0.02 | 0.16 | 0.06 ± 0.03 | *** | 0.04 | 0.10 | 0.06 ± 0.02 | *** | |
| C14:0 | 0.74 | 29.97 | 12.63 ± 7.76 | *** | 13.2 ± 6.8 [12] 4.56 ± 2.06 [13] 2.93 [15] 6.06 ± 0.069 [28] | 1.97 | 32.58 | 13.72 ± 7.38 | *** | 4.76 | 22.60 | 15.19 ± 7.11 | *** |
| C14:1 | <LOQ c | 2.55 | 0.59 ± 0.70 b | *** | <LOQ c | 3.12 | 0.57 ± 0.73 b | *** | 0.07 | 2.99 | 0.75 ± 0.89 | *** | |
| C15:0 | 0.12 | 0.40 | 0.30 ± 0.13 | *** | 0.653 ± 0.004 [28] 0.93 ± 0.26 [13] | 0.12 | 1.44 | 0.42 ± 0.24 | *** | 0.07 | 2.99 | 0.75 ± 0.89 | *** |
| C16:0 | 16.34 | 108.20 | 66.44 ± 15.23 | *** | 163.9 ± 53.2 [12] 135.5 ± 25.14 [13] 92.7 [15] 63.8 ± 0.4 [28] | 29.61 | 121.48 | 72.80 ± 14.93 | *** | 52.72 | 111.92 | 78.74 ± 17.25 | *** |
| C16:1 | 0.12 | 22.26 | 10.08 ± 7.49 | *** | 26.1 ± 11.3 [12] 7.70 ± 4.17 [13] 14.7 ± 0.169 [28] | 0.45 | 24.16 | 8.40 ± 6.78 | *** | 2.88 | 22.47 | 10.83 ± 6.40 | *** |
| C17:0 | 0.33 | 10.32 | 2.94 ± 2.66 | *** | 3.2 ± 1.2 [12] 1.20 ± 0.003 [28] | 0.15 | 11.58 | 3.29 ± 2.98 | *** | 0.68 | 6.09 | 2.86 ± 1.62 | *** |
| C17:1 | 0.01 | 2.28 | 0.79 ± 0.81 | *** | 1.03 ± 0.057 [28] | 0.01 | 3.79 | 0.85 ± 0.98 | *** | 0.10 | 2.41 | 0.86 ± 0.74 | *** |
| C18:0 | 5.38 | 26.09 | 18.92 ± 4.94 | *** | 50.7 ± 21.1 [12] 46.33 ± 9.82 [13] 38.7 [12] 22.1 ± 0.035 [28] | 8.40 | 34.11 | 16.29 ± 8.48 | *** | 10.35 | 35.89 | 22.68 ± 7.60 | *** |
| C18:1 | 6.49 | 69.45 | 38.91 ± 19.56 | *** | 160.6 ± 46.7 [12] 117.20 ± 31.77 [13] 45.1 [12] 80.3 ± 9.33 [28] | 8.11 | 79.98 | 40.94 ± 20.04 | *** | 22.00 | 67.21 | 46.15 ± 12.36 | *** |
| C18:2 | 3.28 | 288.79 | 136.29 ± 84.23 | *** | 73.4 ± 18.4 [12] 131.68 ± 32.03 [13] 54.8 [15] 15.2 ± 0.437 [28] | 1.44 | 324.44 | 109.50 ± 85.10 | *** | 29.99 | 333.60 | 142.44 ± 79.52 | *** |
| C18:3 | 0.01 | 2.90 | 1.16 ± 0.45 | *** | 3.9 ± 1.6 [12] 5.01 ± 1.82 [13] 1.11 ± 0.005 [28] | 0.04 | 3.02 | 1.35 ± 0.71 | *** | 0.16 | 4.23 | 1.49 ± 0.65 | *** |
| Ricinoleic acid | <LOQ e | 0.15 | 0.03 ± 0.02 b | ** | <LOQ e | 0.27 | 0.04 ± 0.02 b | ** | <LOQd | 0.08 | 0.02 ± 0.03 b | ** | RA |
| C19:0 | 0.01 | 0.09 | 0.03 ± 0.02 | *** | 0.05 [15] | <LOQ e | 0.10 | 0.02 ± 0.02 b | *** | 0.01 | 0.07 | 0.04 ± 0.01 | *** |
| C20:0 | 0.10 | 0.38 | 0.21 ± 0.07 | *** | 0.238 ± 0.002 [28] 1.73 ± 0.78 [13] 0.12 [15] | 0.06 | 0.37 | 0.22 ± 0.09 | *** | 0.10 | 0.25 | 0.19 ± 0.06 | *** |
| C20:1 | 0.01 | 2.84 | 0.80 ± 0.72 | *** | 0.01 | 4.05 | 0.92 ± 0.90 | *** | 0.12 | 1.63 | 0.70 ± 0.62 | *** | |
| C20:3 | <LOQ | - | 0.542 ± 0.005 [28] | <LOQ | - | <LOQ | - | ||||||
| C20:4 | 0.02 | 2.77 | 1.18 ± 0.31 | *** | 5.7 ± 3.5 [12] 23.14 ± 7.90 [13] 2.94 ± 0.058 [28] | 0.20 | 2.79 | 1.21 ± 0.40 | *** | 0.60 | 2.29 | 1.11 ± 0.35 | *** |
| C20:5 | 0.02 | 6.90 | 0.67 ± 0.66 | *** | 0.4 ± 0.4 [12] 1.57 ± 0.75 [13] 0.435 ± 0.010 [28] | 0.11 | 7.31 | 1.01 ± 1.36 | *** | 0.21 | 2.09 | 0.74 ± 0.46 | *** |
| Phytanic acid | <LOQ c | 0.08 | 0.03 ± 0.02 b | *** | <LOQ c | 0.17 | 0.05 ±0.05 b | *** | 0.01 | 0.10 | 0.05 ± 0.03 | *** | |
| C21:0 | <LOQ | - | <LOQ | - | <LOQ | - | |||||||
| C22:0 | <LOQ | - | 0.160 ± 0.007 [28] | <LOQ | - | <LOQ | - | ||||||
| C22:1 | 0.01 | 0.11 | 0.04 ± 0.03 | *** | 0.028 ± 0.002 [28] | 0.02 | 0.18 | 0.05 ± 0.03 | *** | 0.01 | 0.10 | 0.04 ± 0.02 | *** |
| C22:4 | 0.02 | 6.90 | 2.15 ± 1.89 | *** | 1.34 ± 0.64 [13] 0.364 ± 0.005 [28] | 0.01 | 8.83 | 2.17 ± 2.38 | *** | 0.40 | 3.39 | 1.41 ± 0.89 | *** |
| C22:5 | <LOQ a | 0.10 | 1.80 ± 1.64 b | *** | 0.1 ± 0.2 [12] 1.82 ± 1.24 [13] 0.400 ± 0.005 [28] | <LOQ d | 6.01 | 0.91 ± 1.46 b | *** | <LOQ a | 2.35 | 0.94 ± 0.87 b | *** |
| C22:6 | <LOQ | - | 0.990 ± 0.009 [28] 0.6 ± 0.7 [12] 7.81 ± 2.94 [13] | <LOQ | <LOQ | ||||||||
| C23:0 | <LOQ | - | 0.033 ± 0.004 [28] | <LOQ | - | <LOQ | - | ||||||
| C24:1 | 0.02 | 1.11 | 0.40 ± 0.29 | *** | 0.01 | 2.45 | 0.38 ± 0.42 | *** | 0.08 | 0.67 | 0.31 ± 0.19 | *** | |
Publisher’s Note: MDPI stays neutral with regard to jurisdictional claims in published maps and institutional affiliations. |
© 2022 by the authors. Licensee MDPI, Basel, Switzerland. This article is an open access article distributed under the terms and conditions of the Creative Commons Attribution (CC BY) license (https://creativecommons.org/licenses/by/4.0/).
Share and Cite
Kokotou, M.G.; Mantzourani, C.; Batsika, C.S.; Mountanea, O.G.; Eleftheriadou, I.; Kosta, O.; Tentolouris, N.; Kokotos, G. Lipidomics Analysis of Free Fatty Acids in Human Plasma of Healthy and Diabetic Subjects by Liquid Chromatography-High Resolution Mass Spectrometry (LC-HRMS). Biomedicines 2022, 10, 1189. https://0-doi-org.brum.beds.ac.uk/10.3390/biomedicines10051189
Kokotou MG, Mantzourani C, Batsika CS, Mountanea OG, Eleftheriadou I, Kosta O, Tentolouris N, Kokotos G. Lipidomics Analysis of Free Fatty Acids in Human Plasma of Healthy and Diabetic Subjects by Liquid Chromatography-High Resolution Mass Spectrometry (LC-HRMS). Biomedicines. 2022; 10(5):1189. https://0-doi-org.brum.beds.ac.uk/10.3390/biomedicines10051189
Chicago/Turabian StyleKokotou, Maroula G., Christiana Mantzourani, Charikleia S. Batsika, Olga G. Mountanea, Ioanna Eleftheriadou, Ourania Kosta, Nikolaos Tentolouris, and George Kokotos. 2022. "Lipidomics Analysis of Free Fatty Acids in Human Plasma of Healthy and Diabetic Subjects by Liquid Chromatography-High Resolution Mass Spectrometry (LC-HRMS)" Biomedicines 10, no. 5: 1189. https://0-doi-org.brum.beds.ac.uk/10.3390/biomedicines10051189