Article

Serum miRNA Profiling for Early PDAC Diagnosis and Prognosis: A Retrospective Study

1
Department of Medicine-DIMED, University of Padova, 35128 Padova, Italy
2
Department of Biology, University of Padova, 35131 Padova, Italy
3
Department of Surgical, Oncological and Gastroenterological Sciences-DiSCOG, University of Padova, 35128 Padova, Italy
*
Authors to whom correspondence should be addressed.
These Authors contributed equally to this work.
Submission received: 26 April 2021 / Revised: 29 June 2021 / Accepted: 15 July 2021 / Published: 20 July 2021
(This article belongs to the Special Issue MicroRNA in Solid Tumor and Hematological Diseases)

Abstract

:
Background: Tumor stage predicts pancreatic cancer (PDAC) prognosis, but prolonged and short survivals have been described in patients with early-stage tumors. Circulating microRNA (miRNA) are an emerging class of suitable biomarkers for PDAC prognosis. Our aim was to identify whether serum miRNA signatures predict survival of early-stage PDAC. Methods: Serum RNA from archival 15 stage I-III PDAC patients and 4 controls was used for miRNAs expression profile (Agilent microarrays). PDAC patients with comparable age, gender, diabetes, jaundice and surgery were classified according to survival: less than 14 months (7/15 pts, group A) and more than 22 months (8/15 pts, group B). Bioinformatic data analysis was performed by two-class Significance Analysis of Microarray (SAM) algorithm. Binary logistic regression analyses considering PDAC diagnosis and outcome as dependent variables, and ROC analyses were also performed. Results: 2549 human miRNAs were screened out. At SAM, 76 differentially expressed miRNAs were found among controls and PDAC (FDR = 0.4%), the large majority (50/76, 66%) of them being downregulated in PDAC with respect to controls. Six miRNAs were independently correlated with early PDAC, and among these, hsa-miR-6821-5p was associated with the best ROC curve area in distinguishing controls from early PDAC. Among the 71 miRNAs differentially expressed between groups A and B, the most significant were hsa-miR-3135b expressed in group A only, hsa-miR-6126 and hsa-miR-486-5p expressed in group B only. Eight miRNAs were correlated with the presence of lymph-node metastases; among these, hsa-miR-4669 is of potential interest. hsa-miR-4516, increased in PDAC and found as an independent predictor of survival, has among its putative targets a series of gens involved in key pathways of cancer progression and dissemination, such as Wnt and p53 signalling pathways. Conclusions: A series of serum miRNAs was identified as potentially useful for the early diagnosis of PDAC, and for establishing a prognosis.

1. Introduction

The incidence of pancreatic ductal adenocarcinoma (PDAC) is increasing worldwide, this disease being among the first 15 leading forms of cancer in men and women, with its highest incidence rates in Europe, Northern America, and Australia/New Zealand [1,2].
Despite advances made in the last few decades in understanding PDAC biology and developing new targeted therapies [3,4,5,6], PDAC patients continue to have a dismal prognosis, with a 5-year survival rate of less than 20% [7,8]. Tumor stage is the main prognostic determinant, early-stage tumors being associated with a longer survival than that of locally advanced or metastatic tumors [9]. However, rapidly evolving tumors with metastatic spread are relatively frequent, even when PDAC is diagnosed at an early stage. Differences in tumor biology probably underlie the different clinical evolution of tumors that, at diagnosis, appear similar in their anatomic extension (i.e., the same TNM characteristics).
PDAC might harbor several mutations of the cell genome, and a vast heterogeneity among tumors has been described [10,11]. Despite this complexity, some clustered recurrent mutations have allowed the classification of PDAC into four main types associated with different prognoses [12], but also the classification of neoplastic cysts with implications for the clinical decision, thus allowing patients to be spared unnecessary surgery [13]. On a ground of high genetic heterogeneity across tumors, mutations of some few genes are strongly correlated with PDAC, namely those of the KRAS oncogene and of TP53, CDKN2A and SMAD4 tumor suppressor genes [14]. Among these genetic alterations, the most significantly associated with prognosis is SMAD4 loss, found in about 60% of PDAC cases [15,16].
Although the above gene mutations alone or combined might determine the oncogenic and metastatic phenotype, molecules involved in regulating gene expression, namely microRNA (miRNAs), long non-coding RNA and circular RNA, have been the focus of attention in the last few decades due to their potential role in understanding tumor biology, and also in making the diagnosis, establishing the prognosis and providing tailored therapy [17,18,19,20]. miRNAs are small (20–25 nucleotide sequences) non-coding single-stranded RNAs that, by binding complementary mRNA sequences, might repress mRNA translation or enhance mRNA degradation, thus contributing to the regulation of a wide range of cellular activities. Any single mRNA molecule might be regulated by several miRNAs, and any miRNA might regulate several different mRNA molecules [21]. The expression of the key PDAC-associated oncogene KRAS, as well as that of genes encoding proteins entering in the core signaling pathways of PDAC, such as JAK/STAT, Wnt/β-catenin or TGF-β, evidences a number of regulating miRNAs with expression levels that are considered targetable by mimic or inhibitor compounds as new potential therapeutic strategies [14,18,22,23]. Moreover, miRNAs represent a great challenge for diagnosis, since they might be released by the tumor into biological fluids, such as plasma/serum or ascitic fluid [24,25], and because they are stable, thus limiting the impact of pre-analytical variability on the results. In the PDAC setting, several studies in the literature have evaluated different miRNAs panels as diagnostic and/or prognostic tools by analyzing tissue expression [26,27], serum levels [24], blood levels [28] and ascitic fluid levels [25]. New biomarkers of PDAC should aid early diagnosis and, as prognostic indices in early-stage cases, should be helpful in distinguishing between patients with long or short life expectancies, thus allowing a more tailored therapeutic approach [7,29].
The aim of the present retrospective study was, using microarray analysis of 2.549 miRNAs, to identify in sera those miRNAs able to diagnose early PDAC and to predict long or short survival after curative surgery.

2. Materials and Methods

2.1. Patients and Samples

The exploratory cohort comprised archival sera of 15 PDAC patients selected from a large retrospective series for microarray analysis. To ascertain the effects of survival on results, the initial selection criteria were: available data on survival allowing classification into two groups with short (<one year) and long (>two years) survival, tumor stage, tumor site, treatment, metabolic and biochemical characteristics being common to the two groups. On these bases the following criteria were established: (1) early-stage tumor; (2) tumor of the pancreas head; (3) R0 surgical treatment; (4) presence of diabetes mellitus or reduced glucose tolerance; (5) absence of jaundice, considering bilirubin as a potential interfering compound. Since only six cases met these criteria, we extended criteria to allow the potential presence of jaundice and tumor stage III besides stages I and II.
In addition, archival sera of four subjects with mild gastritis but without any present or previous evidence of cancer (2 males, 2 females, age range 62–74 years), were used as controls.
Another independent validation cohort of patients was selected from our archive. This included a reference group of 8 patients with mild gastritis without any present or previous evidence of cancer (7 males, 1 female, age range 42–79 years) and a series of 24 PDAC patients (6 males, 18 females, age range 48–83 years). PDAC stage was: IA = 4 patients; IIB = 11 patients; III = 8 patients; IV = 1 patient.
All sera were stored in aliquots at −80 °C and never subjected to thaw–freeze cycles before the analyses.

2.2. RNA Extraction

Total RNA, including miRNAs, was extracted from the archival sera (600 μL) using the miRNeasy Serum/Plasma Advanced Kit (Qiagen, Hilden, Germany) according to the manufacturer’s instructions. miRNAs were quantified by Qubit microRNA assay kit (Thermo Fisher Scientific, Waltham, MA, USA). The RNA amount ranged from 3.5 to 18.9 ng/μL.
RNA integrity, and the content of miRNAs (%) in each sample were assessed by capillary electrophoresis with the Small RNA LabChip using the Agilent Bioanalyzer 2100 (Agilent Technologies, Santa Clara, CA, USA). Only samples with a quantity of ≥4000 pg were used for microarray analysis.

2.3. MicroRNA Expression Profiling

miRNAs expression profiles were obtained using “Agilent SurePrintG3 Human miRNA v.21 (8x60K)” microarray (Agilent Technologies, Santa Clara, CA, USA), which allows the detection of 2549 known human (miRBase Release 21.0) and 76 viral miRNAs (GEO Platform N. GPL24741).
Every slide contains eight individual microarrays, with 60,000 features each, including 2164 controls, used to estimate fluorescence background and background variance. Each miRNA was targeted by 16 to 20 array-probes of different sizes. Total RNA (4000 pg) was labelled with pCp Cy3, according to the Agilent’s protocol, and unincorporated dyes were removed with MicroBioSpin6 columns (BioRad, Hercules, CA, USA) [30]. Probes were hybridized at 55 °C for 22 h using the Agilent’s hybridization oven, which is suitable for bubble-mixing and microarray hybridization processes. Slides, washed by Agilent Gene expression wash buffers 1 and 2, were examined using an Agilent microarray scanner (model G2565CA) at 100% and 5% sensitivity settings. Agilent Feature Extraction software version 12.0.0.7 was used for image analysis of miRNA expression arrays. Raw miRNA data are available in the U.S. National Centre for Biotechnology Information Gene Expression Omnibus (GEO, http://0-www-ncbi-nlm-nih-gov.brum.beds.ac.uk/geo (accessed on 16 March 2021)) database with the Accession N. GSE168996.

2.4. Statistical and Functional Analysis of miRNA Expression Data

Inter-array normalization of miRNA expression levels was performed with cyclic Lowess for miRNA [31], the average of replicates being used. Feature Extraction software (Agilent Technologies, Santa Clara, CA, USA) was employed to obtain spot quality measures for evaluating the quality and the reliability of the hybridization. In particular, the flag “glsFound” (set to 1 if the spot had an intensity value significantly different from that of the local background, 0 otherwise) was used to filter out unreliable probes: a flag equal to 0 was noted as “not available” (NA). In order to make a robust and unbiased statistical analysis, probes with a high proportion of NA values were removed from the dataset. NA (47%) was used as a threshold in the filtering process, a total of 142 available human miRNAs being obtained. Cluster analysis with the average linkage method and Pearson correlation and profile similarity searches were performed with the Multi Experiment Viewer 4.9.1 (tMev) of the TM4 Microarray Software Suite [32]. All heat maps were obtained by morpheus software1 (https://software.broadinstitute.org/morpheus (accessed on 24 June 2021), Broad Institute, Cambridge, MA, USA).
Differentially expressed miRNAs were identified with two-class Significance Analysis of Microarray (SAM) algorithm [33] with default settings. SAM, which uses a permutation-based multiple testing algorithm, associates a variable false discovery rate (FDR) with the significant genes. FDR, which refers to the percentage of error that can occur in the identification of the statistically significant differentially expressed miRNAs in multiple comparisons, can be manually adjusted.
miRTarBase [34], a current and curated collection of miRNA-target interactions with experimental support, was used to predict target genes of differentially expressed miRNAs between PCDAC patients and controls. Biological pathway analysis of putative target genes was performed using DAVID v. 6.8 [35], which combines web tools such as gene functional classification, functional annotation chart or clustering and functional annotation table.

2.5. Reverse Transcription and Quantitative PCR (qRT-PCR) of miRNAs

Before starting the miRNA extraction procedure, 1 μL of Qiagen RNA Spike-In mix (UniSp2, UniSp4, and UniSp5) was added to 200 μL of serum (starting volume) to control the sample-to-sample variation in the RNA isolation procedure. Subsequently, total RNA, including miRNAs, was extracted using the miRNeasy Serum/Plasma Advanced Kit (Qiagen) according to the manufacturer’s instructions. cDNA was synthesized using the miRCURY LNA RT Kit (Qiagen, Hilden, Germany) starting from 75 ng of total RNA in 10 μL with the addition of 1 μL of UniSp6 as exogenous miRNA spiked-in control. PCR was performed in a 10 μL volume containing 5 μL 2x miRCURY SYBR GREEN Master Mix (Qiagen, Hilden, Germany), 1 μL cDNA, and 1 μL of one of the following miRCURY LNA PCR primer sets (Qiagen): hsa-miR-4516 (ID YP02112882), hsa-miR-6089 (ID YP02109969), and UniSp4 (ID YP00203953). The qPCR reactions were performed in an ABI7500 Real-Time PCR System (Applied Biosystems, Foster City, CA, USA). The qPCR cycling conditions were 95 °C for 2 min and 40 cycles (95 °C for 10 s and 56 °C for 1 min). Three replicates of each sample and control were amplified for each real-time PCR reaction. The relative expression levels between samples were calculated using the comparative delta Ct (threshold cycle number) method (2−ΔΔCt), implemented in the 7500 Real Time PCR System software.

2.6. Statistical Analysis of Data

The non-parametric Kruskal–Wallis test, receiver operating characteristic curves (ROC) and binary logistic regression analyses were performed by Stata 13.1 (StataCorp, 4905 Lakeway Drive, TX, USA).

3. Results

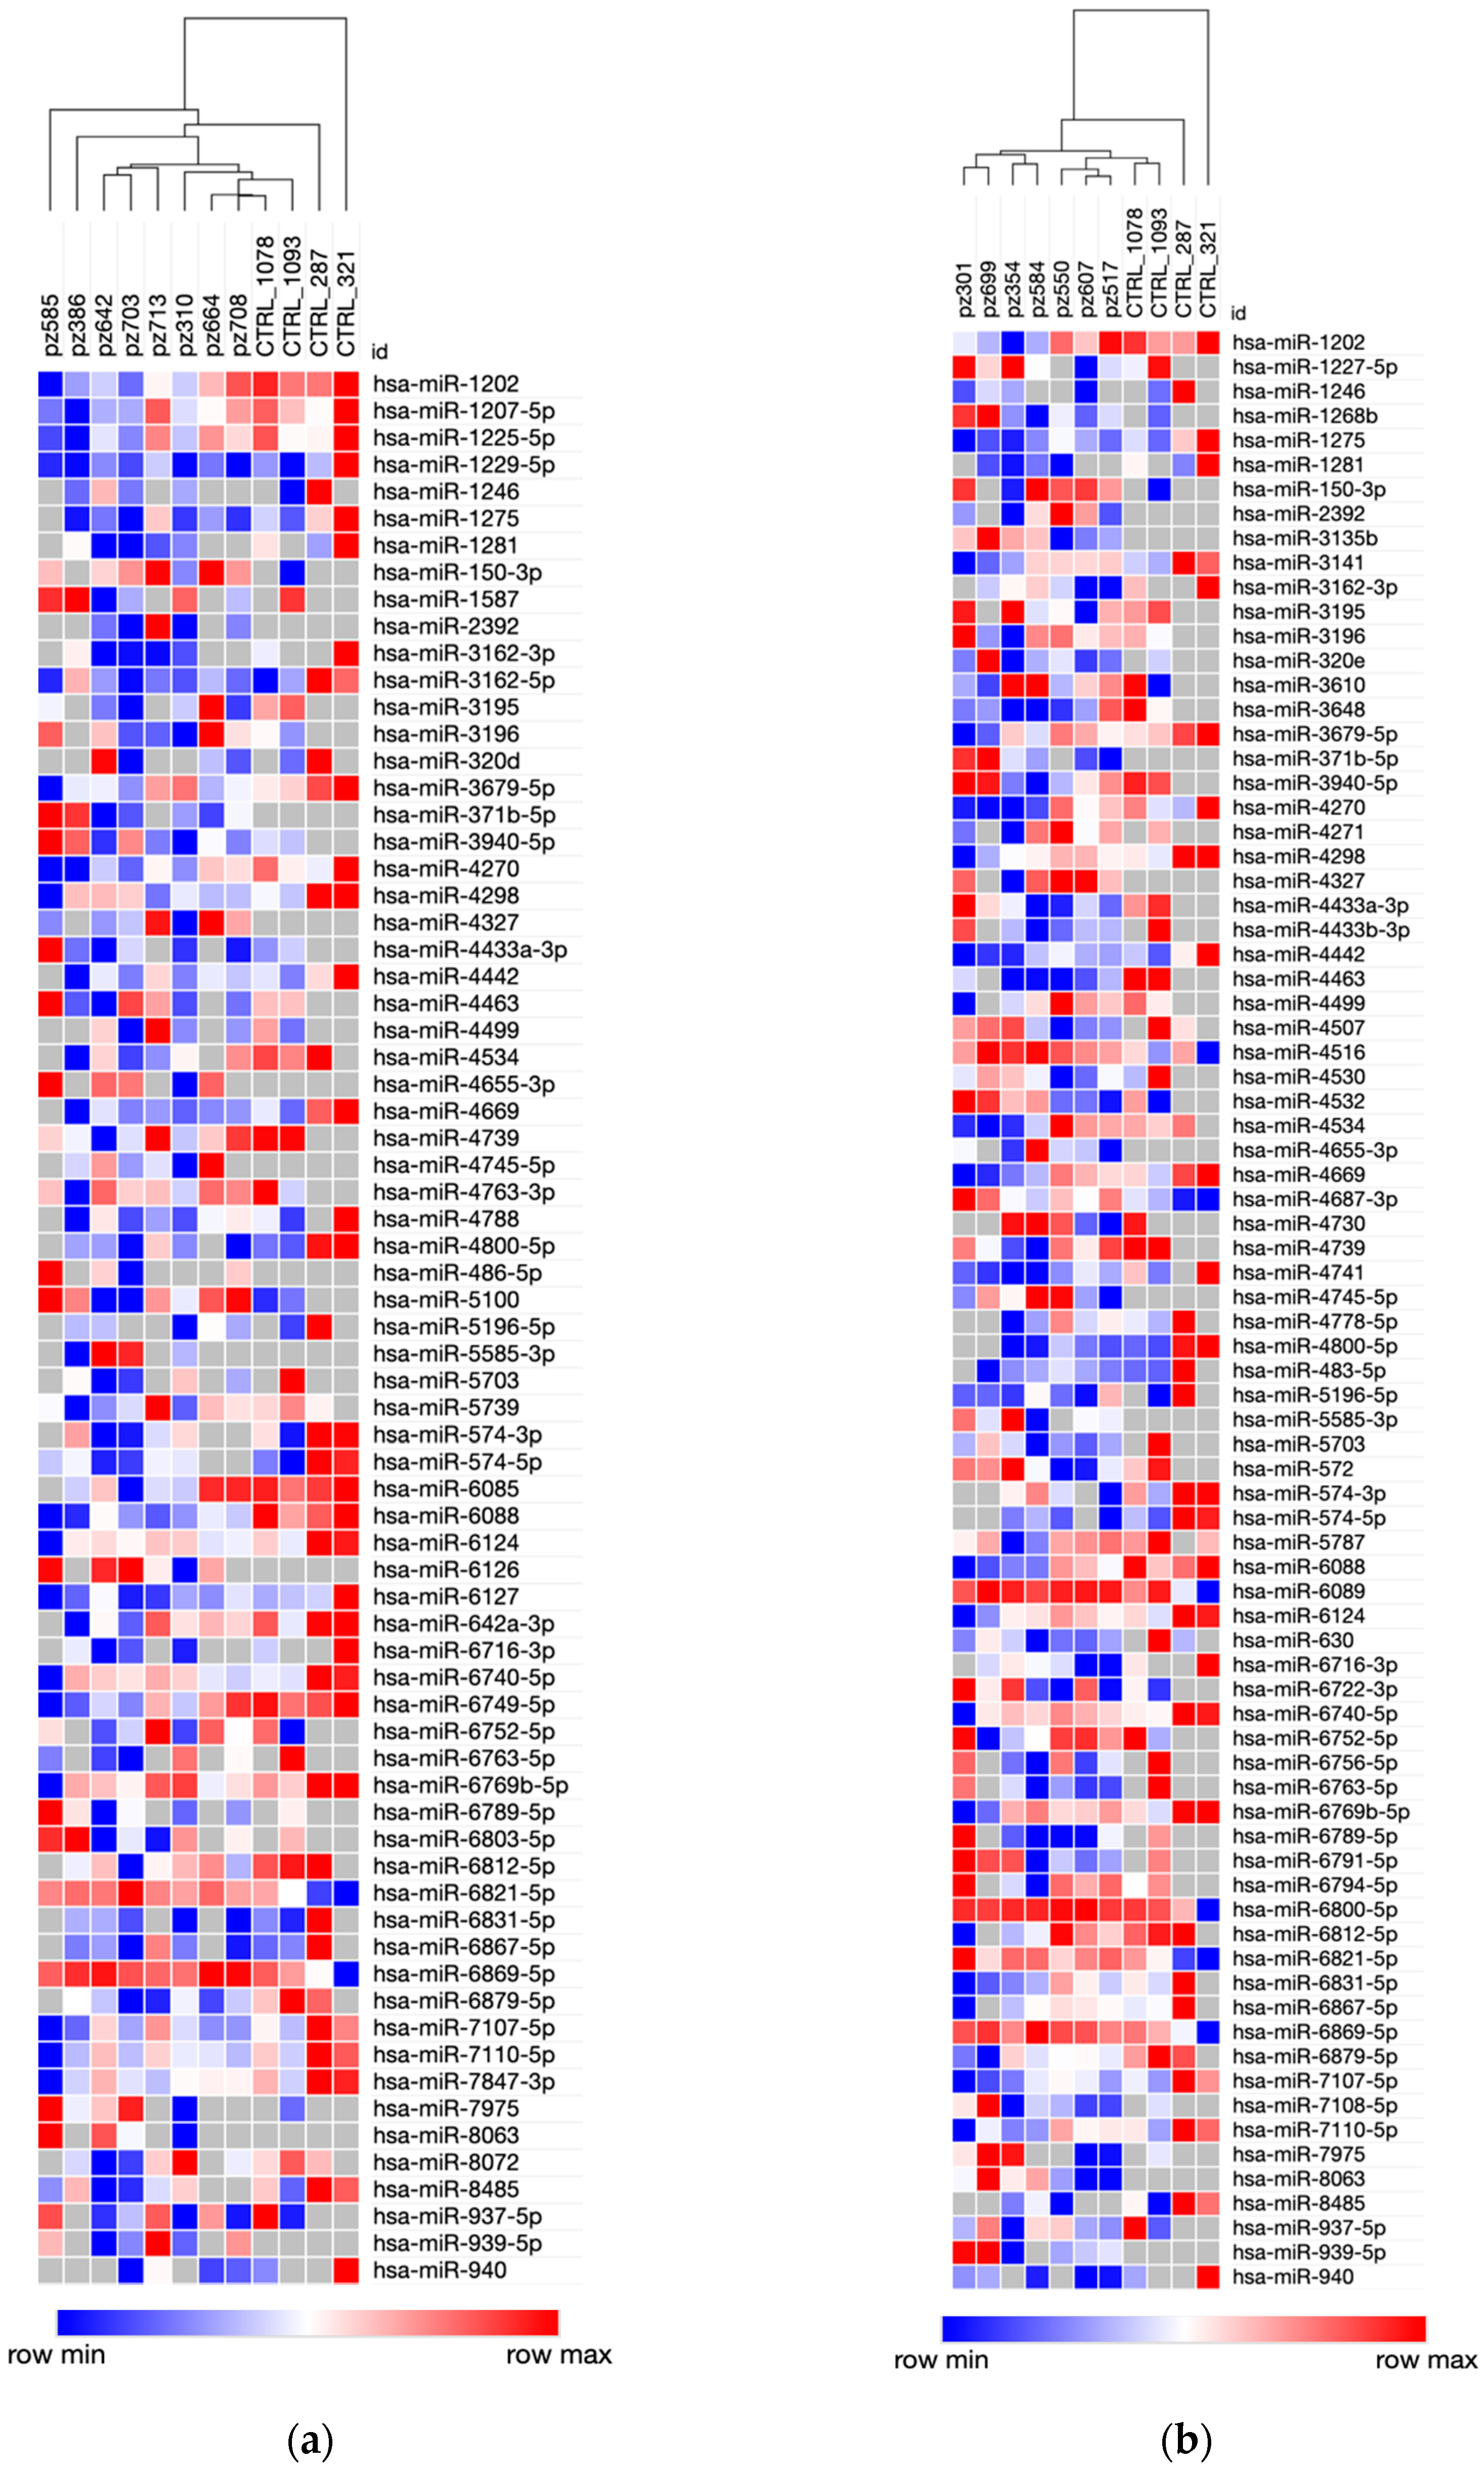
3.1. Serum miRNA Expression Signatures for Early PDAC Diagnosis

Table 1 shows the clinical and biochemical characteristics of the 15 PDAC patients of the exploratory cohort, seven being short-term (<14 months), and eight long-term (>22 months) survivors. All 15 patients had a confirmed histological diagnosis of PDAC with grading, and all underwent radical surgery (R0) and had diabetes mellitus or reduced glucose tolerance diagnosed within 5 months (concurrent) or more than 5 months prior to PDAC diagnosis.
We analysed the expression of serum miRNAs in the 15 PDAC patients and in four controls using a 2549-miR microarrays platform. At SAM two-class analysis, 76 differentially expressed miRNAs were found among controls and PDAC, with an FDR of 0.4%. Interestingly, the large majority (50/76 samples, 66%) of differentially expressed miRNAs were downregulated in the sera of PDAC patients with respect to controls (Supplementary Table S1). A total of 7 (hsa-miR-6126, hsa-miR-2392, hsa-miR-4327, hsa-miR-939-5p, hsa-miR-4655-3p, hsa-miR-371b-5p, hsa-miR-3135b) out of the 76 miRNAs were undetectable in controls, but were expressed, albeit at low levels, only in PDAC patients’ sera.
Microarray data of any patient and control were then used for further analyses. We performed binary logistic regression analysis considering PDAC diagnosis as a dependent variable, and any of the 76 differentially expressed miRNAs between controls and PDAC (Supplementary Table S1), with age and gender, as predictor variables. Six out of the seventy-six miRNAs were significantly correlated with PDAC diagnosis, independently from age and gender: hsa-miR-60892 = 8.58, p = 0.050), hsa-miR-44662 = 9.19, p= 0.047), hsa-miR-6821-5p2 = 12.05, p = 0.048), hsa-miR-46692 = 7.62, p = 0.050), hsa-miR-12022 = 6.42, p = 0.048), hsa-miR-574-3p2 = 9.03, p = 0.049). The same binary logistic regression analysis performed with CA 19-9, age, and gender as predictors, was not significant (χ2 = 5.81, p = 0.232).
To further evaluate whether miRNAs outperform with respect to CA 19-9 in the early detection of PDAC, we compared receiver operating characteristic (ROC) curves of the 76 above reported miRNAs with the ROC curve of CA 19-9 considering the two groups of controls and PDAC. Those miRNAs showing an area under the ROC curve higher than that of CA 19-9 (0.8083 ± 0.0984, 95%CI: 0.61551–1.00000) are reported in Table 2.

3.2. miRNA Expression Profiles and PDAC Survival Rates

The circulating miRNAs expression profiles of controls were compared with those from patients with long (eight samples) and with short (seven samples) survival in order to identify miRNA expression signatures associated with different prognoses.
An unsupervised hierarchical clustering analysis, by using the list of differentially expressed genes between PDAC patients and controls, enabled the clear separation of controls and PDAC patients with long (Figure 1a) and short (Figure 1b) survival, respectively.
A total of 71 and 80 differentially expressed miRNAs between long-term and short-term survivors with respect to the same controls were identified by SAM two-class analysis with an FDR < 3%. We observed an overall downregulation of miRNAs both in long-term (47/71, 66% differentially expressed miRNAs) and short-term (56/80, 70% differentially expressed miRNAs) survivors with respect to controls (Supplementary Tables S2 and S3). Among the above-mentioned miRNAs expressed in sera of PDAC patients, but not in those of controls, hsa-miR-3135b was detected only in patients with a short survival, whereas hsa-miR-6126 and hsa-miR-486-5p were specifically observed in long-term survivors.
A SAM two-class analysis to compare short-term and long-term PDAC survivors to identify prognosis-specific signatures of circulating miRNAs, enabled the identification of 71 differentially expressed miRNAs with an extremely high FDR (62%), thus indicating that circulating miRNA expression profiles do not allow the correct stratification of PDAC patients according to their different prognoses. However, although almost all differentially expressed miRNAs (69/71, 97%) did not attain statistical significance, they were downregulated in PDAC patients with a poor prognosis with respect to those with a longer survival (Supplementary Table S4).
We performed binary logistic regression analysis considering survival of PDAC patients (long or short) as dependent variable, and miRNAs, age, and gender as predictor variables. In the analyses entered the 76 miRNAs differentially expressed between controls and PDAC (Supplementary Table S1), and the series of 71 miRNAs differentially expressed between PDAC patients with long and short survival (Supplementary Table S4). None of the evaluated miRNA reached the statistical significance.
To further ascertain whether serum miRNAs could predict a PDAC disease that is more likely with an adverse outcome, we evaluated the presence, if any, of an association between miRNAs and lymph node metastases, which was not found for CA 19-9 (χ2 = 4.282, p = 0.1175). All 76 differentially expressed miRNAs between PDAC and controls were analyzed by Kruskal–Wallis rank test comparing controls with PDAC patients with or without lymph-node metastases. This resulted in 11 significant miRNAs, reported in Table 3.
Multiple comparison reached a significant difference for eight miRNAs, which expression levels are depicted in Figure 2.

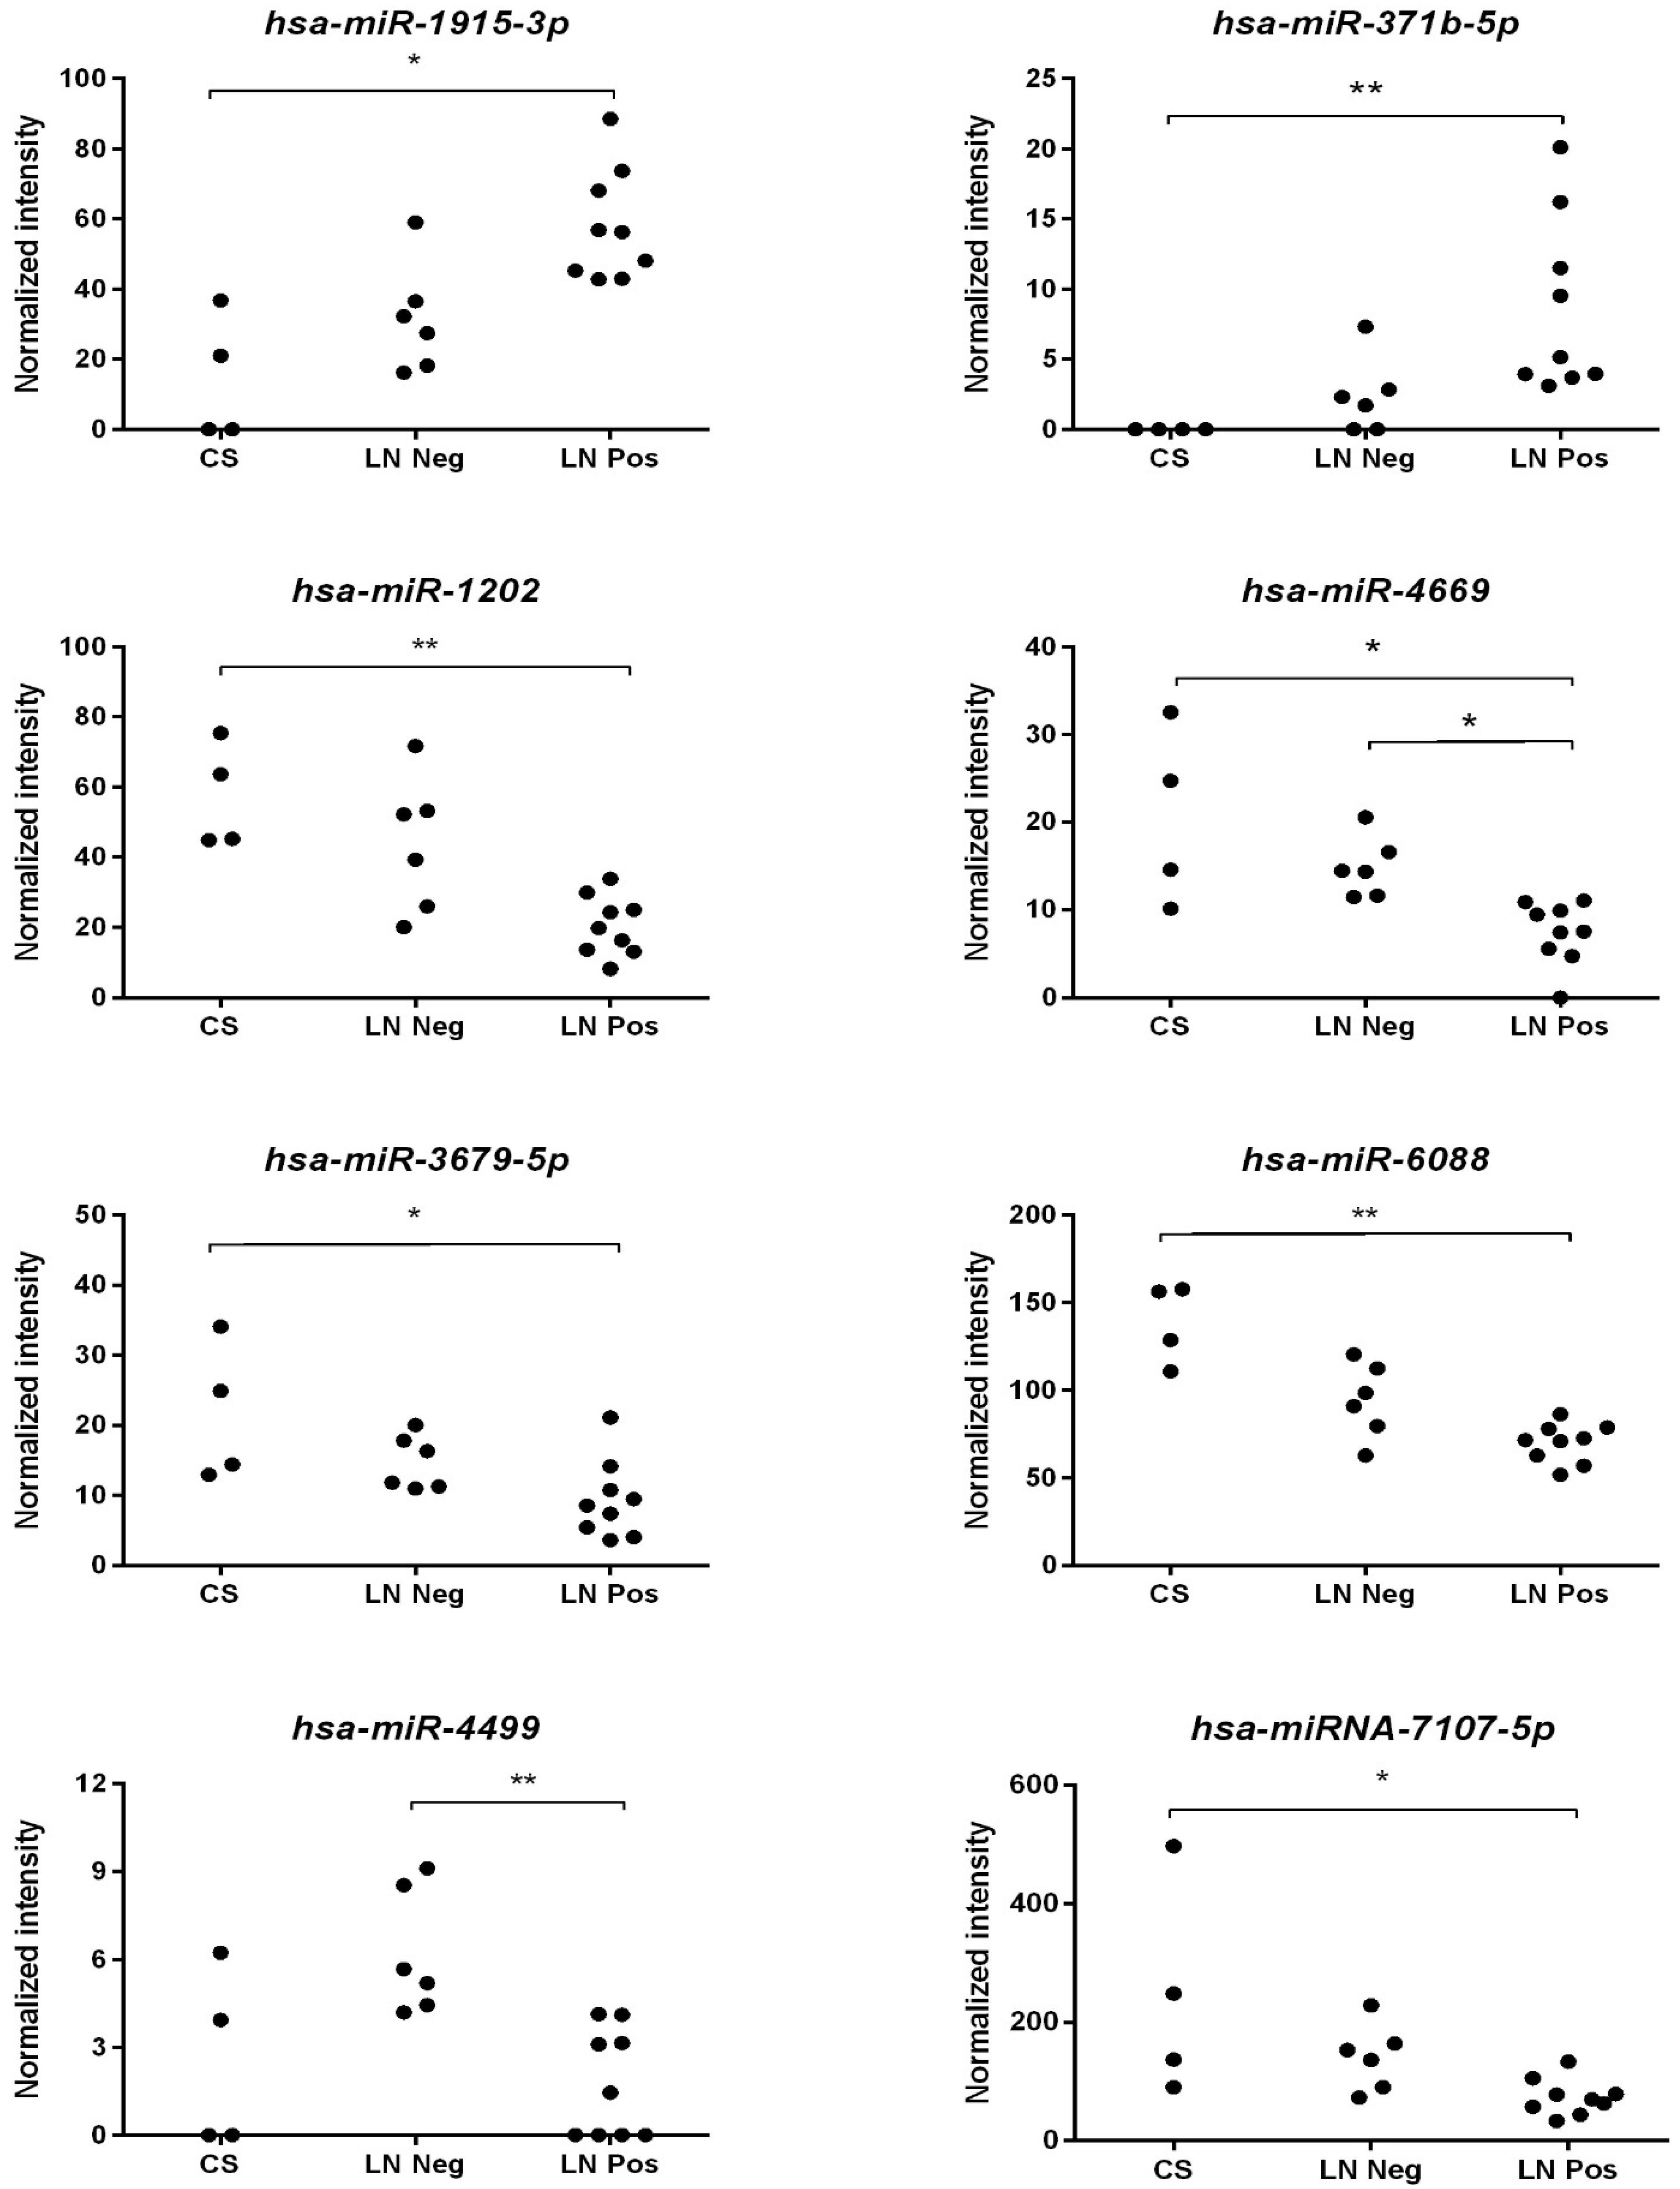
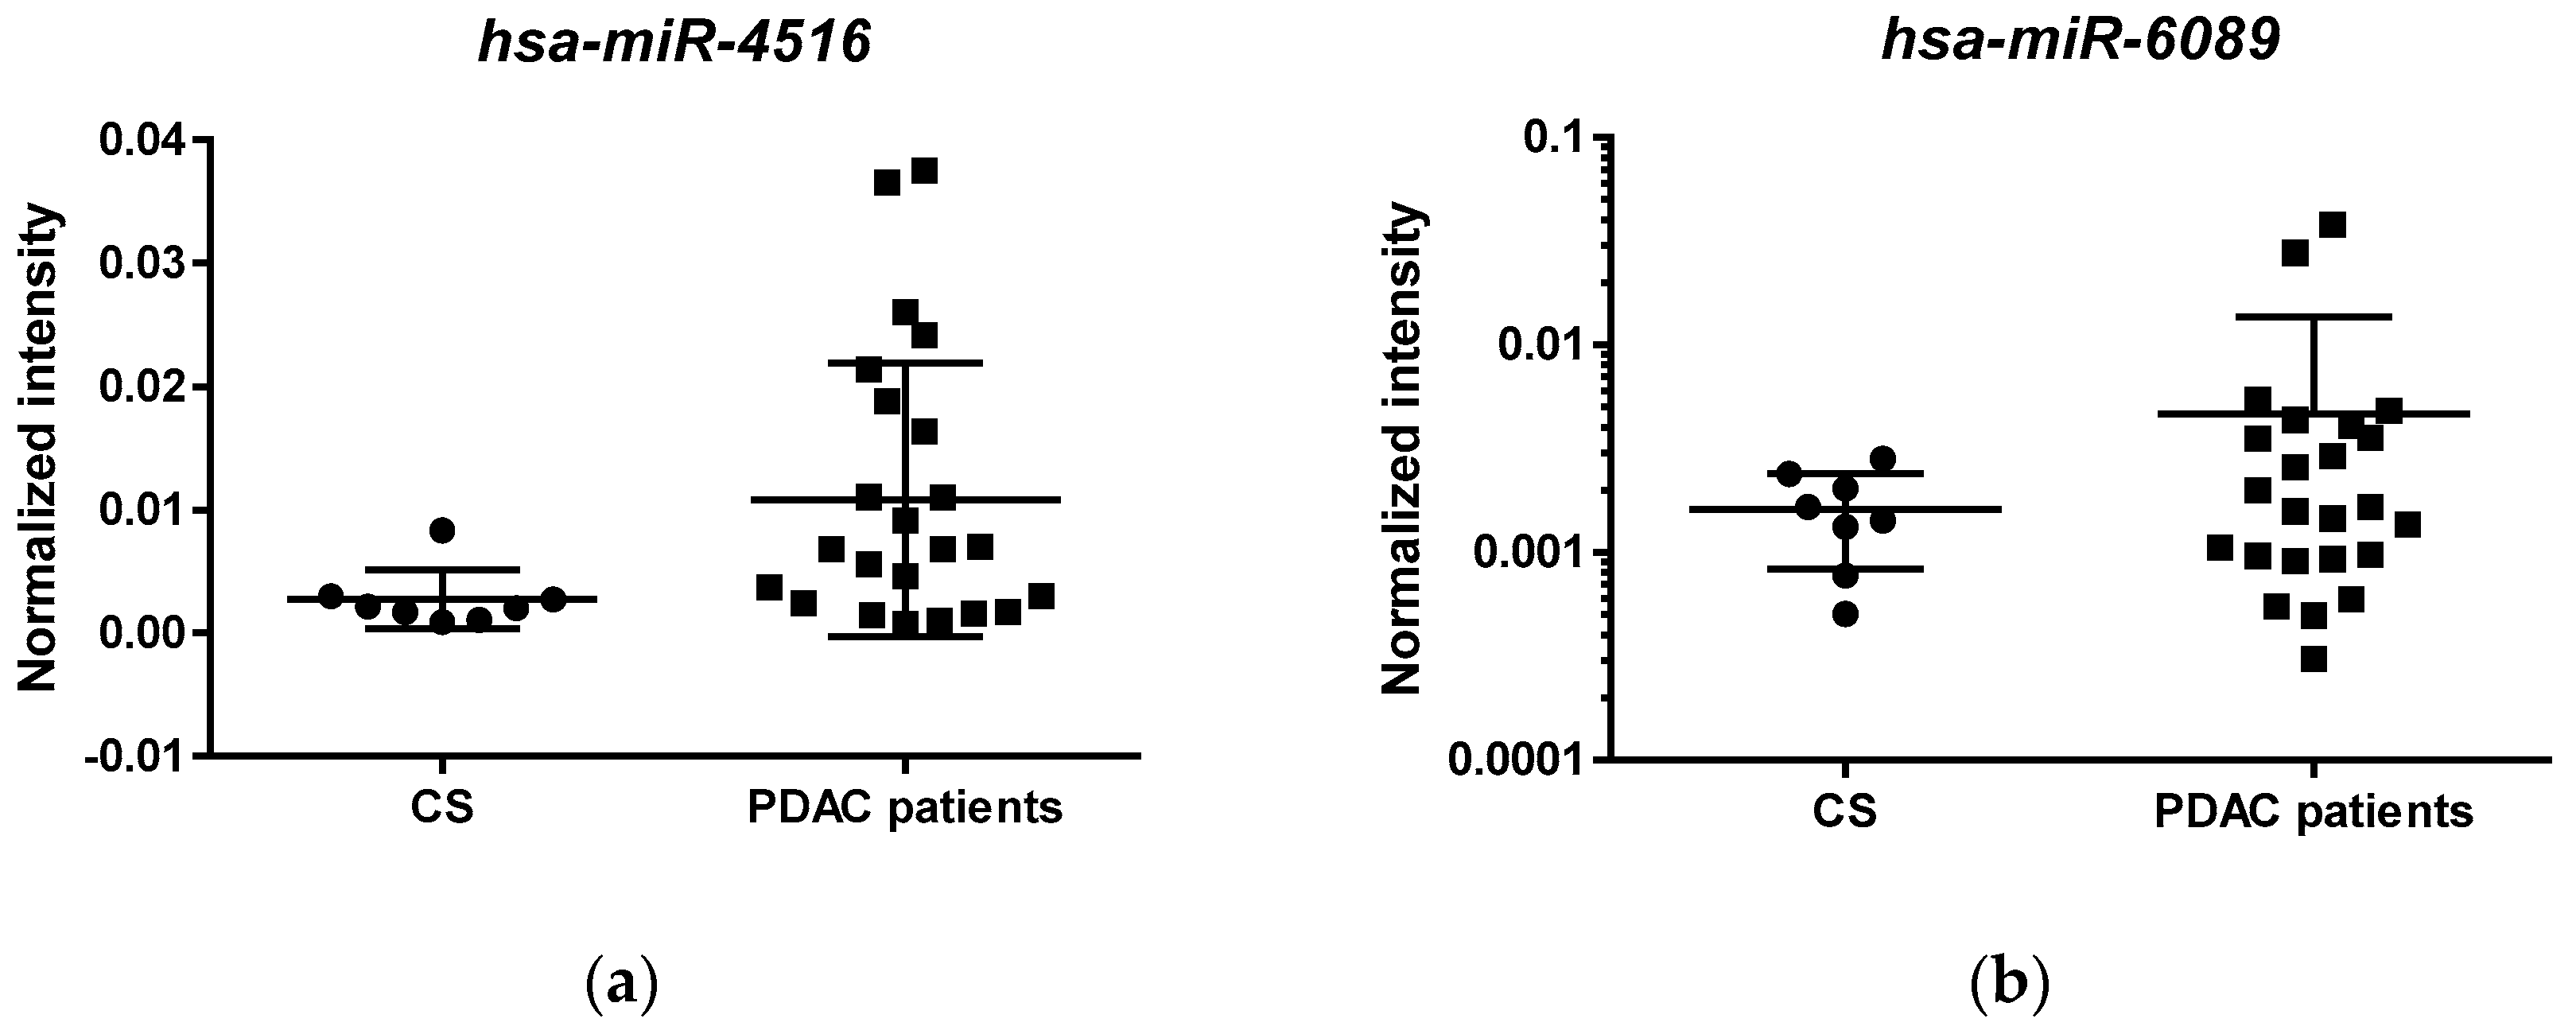
3.3. Validation of Selected miRNAs in an Independent Cohort of PDAC Patients Using qRT-PCR

To validate the microarray expression data with an independent technique, we performed a qRT-PCR of two miRNAs (hsa-miR-4516 and hsa-miR-6089) upregulated in PDAC with respect to controls, in a novel validation cohort of 24 PDAC patients and 8 controls. Figure 3 shows the individual results of these two miRNAs, which was significantly different between PDAC and controls for hsa-miR-4516 (Kruskal–Wallis rank test: p = 0.0330), not for hsa-miR-6089 (p = 0.4862), although values tended to be higher in PDAC than in controls.
We then ascertained whether these two miRNAs were correlated with survival, which ranged from 3 months to 10 years, with a median of 23 months. Cox regression analysis (Table 4) was performed, including the two evaluated miRNAs, age and gender, tumor stage, CA 19-9 and hemoglobin as predictors. Survival was significantly correlated with tumor stage, but also with hsa-miR-4516 and hemoglobin, not with CA 19-9.

3.4. Identification and Functional Analysis of Putative miRNAs Targets

miRTarBase (http://miRTarBase.mbc.nctu.edu.tw (accessed on 16 June 2021)) was used to predict putative targets of the 76 differentially expressed miRNAs between controls and PDAC patients (long and short survival). A list of 11.129 miRNA-target interactions (Table S5) were identified for a total of 5.183 putative target genes. In fact, a single miRNA has hundreds of putative targets because it has pleiotropic effects on different target genes based on the biological condition being explored. KEGG pathway analysis of putative targets was performed by using the DAVID web tool to identify the main biological pathways in which are involved the differentially expressed miRNAs among PDAC patients and controls. Among the 53 most enriched KEGG pathways (EASE < 0.05, Table S6), it is interesting to note that we found a large majority of putative targets involved in biological processes associated with cancer. The “Pancreatic cancer” pathway (Table 5) was one of the most enriched and this confirms the involvement of differentially expressed serum miRNAs in PDAC pathogenesis and/or progression. We also observed a statistically significant enrichment of target genes in biological processes that are considered highly important for cancer progression and dissemination, such as the “Wnt signalling pathway” (Table S7), the “p53 signalling pathway” (Table S8) and the “TGF-beta signalling pathway” (Table S9).

4. Discussion

PDAC is the only cancer type with a survival rate that has not improved in the last 40 years [8]. Since most patients are diagnosed when they have metastases, they can only be considered candidates for palliative treatment. Radical surgery for patients with locally confined tumors might not provide long-term survival, the median survival interval following diagnosis ranging from eight to ten months and early tumor relapse occurring in most patients [29]. Several factors affect the survival rates, such as cancer type, tumor stage at diagnosis, treatment modality, age, sex, overall health, lifestyle and differences in healthcare systems [36,37].
Although survival duration is mainly related to tumor stage, both long-term and short-term survivals have been described in patients diagnosed with early-stage tumors [29,36,37]. Recent studies have reported the prognostic utility of circulating miRNAs profiling in several malignancies due to their altered expression during tumorigenesis and their stability in body fluids [17,18]. In sera, miRNAs could be either entrapped in exosomes or they could circulate bound to proteins, such as Ago2 [38]. Although circulating exosomes are important vehicles of tumor-derived miRNAs and a potential source for biomarker identification, the overall RNA yield that could be obtained after exosomes isolation is generally lower than that from pooled sera, thus compromising test sensitivity [39]. For this reason, we choose to analyse whole sera.
In the present retrospective study, we performed whole miRNAs microarray analysis in the sera of cancer-free controls and of selected early-stage PDAC patients with different survival rates (<14 months or >22 months after curative surgery) in order to establish whether miRNAs measurement can enable early disease diagnosis and predict survival in a minimally invasive way. Unsupervised cluster analysis allowed a distinction between PDAC patients and controls. A number of 76 miRNAs were identified as differently expressed between PDAC patients (short and long-term survivors) with respect to controls, and the large majority of them were downregulated in PDAC patients with respect to controls, in line with findings reported in the current literature. In fact, the overall downregulation of miRNAs, emerging as a common hallmark of cancer, contributes to the malignant phenotype and a poor prognosis [40]. Our results not only corroborate this assumption, but also indicate that this is an early and detectable finding, since our patients’ series comprised only early-stage PDAC. Furthermore, seven circulating miRNAs (hsa-miR-6126, hsa-miR-2392, hsa-miR-4327, hsa-miR-939-5p, hsa-miR-4655-3p, hsa-miR-371b-5p, hsa-miR-3135b), expressed in low levels, were found only in the sera of PADC patients and not in controls, thus suggesting their potential role as an emerging class of suitable biomarkers for this cancer type.
Further studies are required to investigate the effect of these selected miRNAs, which were until now poorly evaluated in the PDAC setting, although some of them have been studied in other cancer types. Our findings are in agreement with those of Mazza et al., who demonstrated that hsa-miR-6126 was one of the most significantly increased miRNAs in the plasma of PDAC patients [41], and the same hsa-miR-6126 has been found in the tumor tissues of five patients with stage II colon cancer but not in cancer-free tissues [42]. hsa-miR-939-5p, of potential interest for its role in invasive cancer, is reportedly upregulated in lung adenocarcinomas [43], hepatocellular carcinomas [44,45], ovarian cancer tissue [46] and in the promotion of blood vessel invasion in breast cancer [47]. The recent study by Shen et al. [48] shed some light on the role of this hsa-miR-939-5p in PDAC biology and prognosis. By studying human pancreatic cancer tissues and cell lines, the authors demonstrated that high expression levels of this miRNA are associated with a poor prognosis in patients, while promoting in vitro tumor cell migration and invasion by targeting the Rho GTPase, activating protein 4.
Another series of six miRNAs was found to be significantly and independently correlated with early PDAC, namely hsa-miR-6089, hsa-miR-4466, hsa-miR-6821-5p, hsa-miR-4669, hsa-miR-1202 and hsa-miR-574-3p. Among these, hsa-miR-6821-5p was associated with the best ROC curve area in distinguishing controls from early PDAC, supporting its potential role in early diagnosis. This result fits well with findings of Keller et al. [49], who demonstrated that hsa-miR-6821-5p is one of the most deregulated miRNAs in serum for decades prior lung, breast, or colon cancer diagnosis. The same study emphasized hsa-miR-4687-3p and hsa-miR-574-3p as potential pre-diagnostic markers and, in agreement, we identified these miRNAs among those most significant in distinguishing early PDAC from controls. All the above-described miRNAs outperformed with respect to the established PDAC biomarker CA 19-9, which levels did not significantly differ between controls and patients. This finding is not surprising, considering its low sensitivity for early tumor diagnosis [50].
When miRNA expression data of PDAC patients were analysed in order to identify a miRNA transcriptional signature characterizing early-stage PDAC patients with different prognoses, unsupervised cluster analysis did not enable a distinction between short-term and long-term survivors, but SAM two-class analysis (high FDR: 62.5%) allowed the identification of 71 differentially expressed miRNAs. The majority of survival-related differentially expressed miRNAs were downregulated in short-term survival with respect to long-term survival patients, thus confirming the association between cancer progression and miRNA downregulation, as reported above [40].
We first focused our attention on the three miRNAs that were expressed exclusively in the sera of PDAC patients with long-term (hsa-miR-486-5p and hsa-miR-6126) or short-term (hsa-miR-3135b) survival, but not in controls.
The finding of hsa-miR-486-5p expression exclusively in long-term survival patients supports the hypothesis that tumor progression determines a progressive decline for this miRNA expression, as occurs in colorectal cancer [51]. While no data in the literature report an association between hsa-miR-3135b and cancer progression and/or survival, hsa-miR-6126 has been recently identified by Mazza et al. in PDAC plasma with levels increasing with metastases, but not correlated with survival [41]. The differences between our results and the results of Mazza et al. [41] might depend on the different characteristics of the patients studied: our series was mainly represented by stage I-II, while the series of Mazza et al. by stage III-IV PDAC cases.
To obtain further insights into the association between serum miRNAs and outcome, we verified whether miRNAs were correlated with the presence or absence of lymph-node metastases, known to be associated with worse outcome [52]. Eight miRNAs were identified among the most significant (Figure 2). Few data are present in the literature on these miRNAs, but hsa-miR-1202, which decreased in the presence of lymph-node metastases, was described to similarly decline with the progression of cervical cancer in tissue samples [53] and it was shown to exert an anti-tumor effect in vitro on HCC cells lines [54]. The hsa-miRNA-4669, which also declines in the presence of lymph-node metastases, was also described to diminish in sera of colorectal cancer patients [55].
One upregulated miRNA, namely hsa-miR-4516, was confirmed by qRT-PCR in an independent PDAC patients’ validation cohort to have increased expression levels in PDAC with respect to controls. This miRNA was also an independent predictor of survival, which was correlated as expected with tumor stage, but also with hemoglobin levels, not with CA 19-9. Furthermore, the putative targets of this miRNA were statistically significantly enriched in the target’s prediction analysis performed with miRTarBase, and they are involved in key pathways of cancer progression and dissemination such as the “Wnt signalling pathway” (CCND2, RAC3, TP53, WNT8B, FBXW11, SOX17, TBL1XR1) and the “p53 signalling pathway” (CDKN1A, SFN, TP53, RPRM).
Overall, our results support the importance of exploring the use of liquid biopsies in PDAC patients, managing the clinical utility of circulating miRNAs as novel diagnostic and prognostic biomarkers for this disease.
The main limitation of our study is related to the few numbers of the studied patients in both the exploratory and validation cohorts. This limitation derives from the choice to study early tumors with short or particularly long survival that imposed strict selection criteria (cases of early-stage cancer, without jaundice, with diabetes or reduced glucose tolerance, and with survival data including long-term survival). Considering that at diagnosis, PDAC patients with stage I–II are less than 20% [56], this left few cases within a large retrospective cohort meeting the requirements. On the other hand, our findings were not biased by tumor stage and allowed to consider the identified circulating miRNAs as early biomarkers.

5. Conclusions

In conclusion, the findings made in the present study suggest that new circulating miRNAs are a potentially useful biomarker for making an early diagnosis of PDAC and for establishing the prognosis. These miRNAs include hsa-miR-3135b, hsa-miR-6126, hsa-miR-486-5p, hsa-miR-6821-5p, hsa-miR-4669 and hsa-miR-4516 that, after future and independent validation, could be measured in the sera of PDAC patients, thus enabling improved management and prolonging survival.

Supplementary Materials

The following are available online at https://0-www-mdpi-com.brum.beds.ac.uk/article/10.3390/biomedicines9070845/s1. Table S1: Differentially expressed miRNAs between PDAC patients and controls. Table S2: Differentially expressed miRNAs between long survival PDAC patients and controls. Table S3: Differentially expressed miRNAs between short survival PDAC patients and controls. Table S4: Differentially expressed miRNAs between short and long survival PDAC patients. Table S5: miRNA’s putative targets prediction by miRTarBase. Table S6: KEGG pathways. Table S7: Wnt signalling pathway. Table S8: p53 signalling pathway. Table S9. TGF-beta signalling pathway.

Author Contributions

Conceptualization, A.A., D.B. and C.D.P.; methodology, A.A., C.M. and B.P.; software, C.D.P.; validation, D.B. and C.D.P.; formal analysis, C.D.P.; investigation, A.A., C.M., C.S. and B.P.; resources, D.B.; data curation, A.A., D.B. and C.D.P.; writing—original draft preparation, A.A. and D.B.; writing—review and editing, C.M. and C.D.P.; visualization, C.S.; supervision, M.P.; project administration, D.B. and C.D.P.; funding acquisition, M.P. All authors have read and agreed to the published version of the manuscript.

Funding

This work was supported by the European Commission under the 7th Framework Programme [grant agreement no. 306031]. Under the auspices of the WIRSUNG ONLUS Association, Padova, Italy.

Institutional Review Board Statement

The study was conducted according to the guidelines of the Declaration of Helsinki and approved by the Ethics Committee of the University-Hospital of Padova (protocol code 2872P, date of approval: 20 February 2013).

Informed Consent Statement

Informed consent was obtained from all subjects involved in the study.

Data Availability Statement

Raw miRNA data are available in the U.S. National Centre for Biotechnology Information Gene Expression Omnibus (GEO, http://0-www-ncbi-nlm-nih-gov.brum.beds.ac.uk/geo (accessed on 16 March 2021)) database with the Accession N. GSE168996.

Acknowledgments

We would like to thank Paolo Martini (Dept. Molecular and Translational Medicine, University of Brescia, 25123 Brescia, Italy) and Gabriele Sales (Dept. Biology, University of Padova, 35131 Padova, Italy) for help regarding bioinformatics programming, statistical analysis, and miRNA target predictions.

Conflicts of Interest

The authors declare no conflict of interest. The funders had no role in the design of the study; in the collection, analyses, or interpretation of data; in the writing of the manuscript, or in the decision to publish the results.

References

  1. Sung, H.; Ferlay, J.; Siegel, R.L.; Laversanne, M.; Soerjomataram, I.; Jemal, A.; Bray, F. Global cancer statistics 2020: GLOBOCAN estimates of incidence and mortality worldwide for 36 cancers in 185 countries. CA Cancer J. Clin. 2021, 71, 209–249. [Google Scholar] [CrossRef] [PubMed]
  2. Siegel, R.L.; Miller, K.D.; Fuchs, H.E.; Jemal, A. Cancer Statistics, 2021. CA Cancer J. Clin. 2021, 71, 7–33. [Google Scholar] [CrossRef] [PubMed]
  3. Bardeesy, N.; Depinho, R.A. Pancreatic cancer biology and genetics. Nat. Rev. Cancer 2002, 2, 897–909. [Google Scholar] [CrossRef] [PubMed]
  4. Ryan, D.P.; Hong, T.S.; Bardeesy, N. Pancreatic adenocarcinoma. N. Engl. J. Med. 2014, 371, 1039–1049. [Google Scholar] [CrossRef]
  5. Hezel, A.F.; Kimmelman, A.C.; Stanger, B.Z.; Bardeesy, N.; Depinho, R.A. Genetics and biology of pancreatic ductal adenocarcinoma. Genes Dev. 2006, 20, 1218–1249. [Google Scholar] [CrossRef] [PubMed]
  6. Al-Share, B.; Hammad, N.; Diab, M. Pancreatic adenocarcinoma: Molecular drivers and the role of targeted therapy. Cancer Metastasis Rev. 2021, 40, 355–371. [Google Scholar] [CrossRef] [PubMed]
  7. Gheorghe, G.; Bungau, S.; Ilie, M.; Behl, T.; Vesa, C.M.; Brisc, C.; Bacalbasa, N.; Turi, V.; Costache, R.S.; Diaconu, C.C. Early diagnosis of pancreatic cancer: The key for survival. Diagnostics 2020, 10, 869. [Google Scholar] [CrossRef] [PubMed]
  8. DeSantis, C.E.; Lin, C.C.; Mariotto, A.B.; Siegel, R.L.; Stein, K.D.; Kramer, J.L.; Alteri, R.; Robbins, A.S.; Jemal, A. Cancer treatment and survivorship statistics, 2014. CA Cancer J. Clin. 2014, 64, 252–271. [Google Scholar] [CrossRef] [PubMed]
  9. Cong, L.; Liu, Q.; Zhang, R.; Cui, M.; Zhang, X.; Gao, X.; Guo, J.; Dai, M.; Zhang, T.; Liao, Q.; et al. Tumor size classification of the 8th edition of TNM staging system is superior to that of the 7th edition in predicting the survival outcome of pancreatic cancer patients after radical resection and adjuvant chemotherapy. Sci. Rep. 2018, 8, 10383–10389. [Google Scholar] [CrossRef] [PubMed]
  10. Waddell, N.; Pajic, M.; Patch, A.-M.; Chang, D.K.; Kassahn, K.S.; Bailey, P.; Johns, A.L.; Miller, D.; Nones, K.; Quek, K.; et al. Whole genomes redefine the mutational landscape of pancreatic cancer. Nature 2015, 518, 495–501. [Google Scholar] [CrossRef] [PubMed]
  11. Witkiewicz, A.K.; McMillan, E.A.; Balaji, U.; Baek, G.; Lin, W.-C.; Mansour, J.; Mollaee, M.; Wagner, K.-U.; Koduru, P.; Yopp, A.; et al. Whole-exome sequencing of pancreatic cancer defines genetic diversity and therapeutic targets. Nat. Commun. 2015, 6, 6744. [Google Scholar] [CrossRef]
  12. Bailey, P.; Chang, D.K.; Nones, K.; Johns, A.L.; Patch, A.-M.; Gingras, M.-C.; Miller, D.K.; Christ, A.N.; Bruxner, T.J.C.; Quinn, M.C.; et al. Genomic analyses identify molecular subtypes of pancreatic cancer. Nature 2016, 531, 47–52. [Google Scholar] [CrossRef] [PubMed]
  13. Springer, S.; Wang, Y.; Molin, M.D.; Masica, D.L.; Jiao, Y.; Kinde, I.; Blackford, A.; Raman, S.P.; Wolfgang, C.L.; Tomita, T.; et al. A combination of molecular markers and clinical features improve the classification of pancreatic cysts. Gastroenterology 2015, 149, 1501–1510. [Google Scholar] [CrossRef]
  14. Knudsen, E.S.; O’Reilly, E.M.; Brody, J.R.; Witkiewicz, A.K. Genetic diversity of pancreatic ductal adenocarcinoma and opportunities for precision medicine. Gastroenterology 2016, 150, 48–63. [Google Scholar] [CrossRef] [PubMed]
  15. Oshima, M.; Okano, K.; Muraki, S.; Haba, R.; Maeba, T.; Suzuki, Y.; Yachida, S. Immunohistochemically detected expression of 3 major genes (CDKN2A/p16, TP53, and SMAD4/DPC4) strongly predicts survival in patients with resectable pancreatic cancer. Ann. Surg. 2013, 258, 336–346. [Google Scholar] [CrossRef] [PubMed]
  16. Iacobuzio-Donahue, C.A.; Fu, B.; Yachida, S.; Luo, M.; Abe, H.; Henderson, C.M.; Vilardell, F.; Wang, Z.; Keller, J.W.; Banerjee, P.; et al. DPC4 gene status of the primary carcinoma correlates with patterns of failure in patients with pancreatic cancer. J. Clin. Oncol. 2009, 27, 1806–1813. [Google Scholar] [CrossRef]
  17. Berindan-Neagoe, I.; Monroig, P.D.C.; Pasculli, B.; Calin, G.A. MicroRNAome genome: A treasure for cancer diagnosis and therapy. CA Cancer J. Clin. 2014, 64, 311–336. [Google Scholar] [CrossRef]
  18. Sarwar, A.; Wang, B.; Su, Q.; Zhang, Y. MiRNAs directly targeting the key intermediates of biological pathways in pancreatic cancer. Biochem. Pharmacol. 2020, 70, 114357. [Google Scholar]
  19. Rong, Z.; Xu, J.; Shi, S.; Tan, Z.; Meng, Q.; Hua, J.; Liu, J.; Zhang, B.; Wang, W.; Yu, X.; et al. Circular RNA in pancreatic cancer: A novel avenue for the roles of diagnosis and treatment. Theranostics 2021, 11, 2755–2769. [Google Scholar] [CrossRef]
  20. Pandya, G.; Kirtonia, A.; Sethi, G.; Pandey, A.K.; Garg, M. The implication of long non-coding RNAs in the diagnosis, pathogenesis and drug resistance of pancreatic ductal adenocarcinoma and their possible therapeutic potential. Biochim. Biophys. Acta Rev. Cancer 2020, 1874, 188423. [Google Scholar] [CrossRef]
  21. Terrinoni, A.; Calabrese, C.; Basso, D.; Aita, A.; Caporali, S.; Plebani, M.; Bernardini, S. The circulating miRNAs as diagnostic and prognostic markers. Clin. Chem. Lab. Med. 2019, 57, 932–953. [Google Scholar] [CrossRef]
  22. Hao, J.; Zhang, S.; Zhou, Y.; Hu, X.; Shao, C. MicroRNA 483-3p suppresses the expression of DPC4/Smad4 in pancreatic cancer. FEBS Lett. 2011, 585, 207–213. [Google Scholar] [CrossRef]
  23. Blahna, M.T.; Hata, A. Regulation of miRNA biogenesis as an integrated component of growth factor signaling. Curr. Opin. Cell Biol. 2013, 25, 233–240. [Google Scholar] [CrossRef]
  24. Yang, W.; Ju, H.-Y.; Tian, X.-F. Hsa-miR-4730 as a new and potential diagnostic and prognostic indicators for pancreatic cancer. Eur. Rev. Med. Pharmacol. Sci. 2020, 24, 8801–8811. [Google Scholar]
  25. Hata, T.; Mizuma, M.; Masuda, K.; Chiba, K.; Ishida, M.; Ohtsuka, H.; Nakagawa, K.; Morikawa, T.; Kamei, T.; Unno, M. MicroRNA-593-3p expression in peritoneal lavage fluid as a prognostic marker for pancreatic cancer patients undergoing staging laparoscopy. Ann. Surg. Oncol. 2021, 70, 7–11. [Google Scholar]
  26. Wolfe, A.R.; Wald, P.; Webb, A.; Sebastian, N.; Walston, S.; Robb, R.; Chen, W.; Vedaie, M.; Dillhoff, M.; Frankel, W.L.; et al. A microRNA-based signature predicts local-regional failure and overall survival after pancreatic cancer resection. Oncotarget 2020, 11, 913–923. [Google Scholar] [CrossRef] [PubMed]
  27. Wu, X.; Huang, J.; Yang, Z.; Zhu, Y.; Zhang, Y.; Wang, J.; Yao, W. MicroRNA-221-3p is related to survival and promotes tumour progression in pancreatic cancer: A comprehensive study on functions and clinicopathological value. Cancer Cell Int. 2020, 20, 443. [Google Scholar] [CrossRef] [PubMed]
  28. Schultz, N.A.; Dehlendorff, C.; Jensen, B.V.; Bjerregaard, J.K.; Nielsen, K.R.; Bojesen, S.E.; Calatayud, D.; Nielsen, S.E.; Yilmaz, M.; Holländer, N.H.; et al. MicroRNA biomarkers in whole blood for detection of pancreatic cancer. JAMA 2014, 311, 392–404. [Google Scholar] [CrossRef] [PubMed]
  29. Ma, J.; Jemal, A. The rise and fall of cancer mortality in the USA: Why does pancreatic cancer not follow the trend? Future Oncol. 2013, 9, 917–919. [Google Scholar] [CrossRef] [PubMed]
  30. Wang, H.; Ach, R.A.; Curry, B. Direct and sensitive miRNA profiling from low-input total RNA. RNA 2007, 13, 151–159. [Google Scholar] [CrossRef]
  31. Risso, D.; Massa, M.S.; Chiogna, M.; Romualdi, C. A modified LOESS normalization applied to microRNA arrays: A comparative evaluation. Bioinformatics 2009, 25, 2685–2691. [Google Scholar] [CrossRef]
  32. Saeed, A.I.; Bhagabati, N.K.; Braisted, J.C.; Liang, W.; Sharov, V.; Howe, E.A.; Li, J.; Thiagarajan, M.; White, J.A.; Quackenbush, J. TM4 microarray software suite. Methods Enzymol. 2006, 411, 134–193. [Google Scholar]
  33. Tibshirani, R.; Hastie, T.; Narasimhan, B.; Chu, G. Diagnosis of multiple cancer types by shrunken centroids of gene expression. Proc. Natl. Acad. Sci. USA 2002, 99, 6567–6572. [Google Scholar] [CrossRef]
  34. Hsu, S.D.; Lin, F.M.; Wu, W.Y.; Liang, C.; Huang, W.C.; Chan, W.L.; Tsai, W.T.; Chen, G.Z.; Lee, C.J.; Chiu, C.M.; et al. miRTarBase: A database curates experimentally validated microRNA-target interactions. Nucleic Acids Res. 2011, 39, D163–D169. [Google Scholar] [CrossRef]
  35. Sherman, B.T.; Lempicki, R.A. Systematic and integrative analysis of large gene lists using DAVID bioinformatics resources. Nat. Protoc. 2009, 4, 44–57. [Google Scholar]
  36. Vega, E.A.; Kutlu, O.C.; Salehi, O.; James, D.; Alarcon, S.V.; Herrick, B.; Krishnan, S.; Kozyreva, O.; Conrad, C. Preoperative chemotherapy for pancreatic cancer improves survival and R0 rate even in early stage I. J. Gastrointest. Surg. 2020, 24, 2409–2415. [Google Scholar] [CrossRef]
  37. Shapiro, M.; Chen, Q.; Huang, Q.; Boosalis, V.A.; Yoon, C.H.; Saund, M.S.; Whang, E.E.; Gold, J.S. Associations of socioeconomic variables with resection, stage, and survival in patients with early-stage pancreatic cancer. JAMA Surg. 2016, 151, 338–345. [Google Scholar] [CrossRef] [PubMed]
  38. Turchinovich, A.; Weiz, L.; Langheinz, A.; Burwinkel, B. Characterization of extracellular circulating microRNA. Nucleic Acids Res. 2011, 39, 7223–7233. [Google Scholar] [CrossRef]
  39. Endzeliņš, E.; Berger, A.; Melne, V.; Bajo-Santos, C.; Soboļevska, K.; Ābols, A.; Rodriguez, M.; Šantare, D.; Rudņickiha, A.; Lietuvietis, V.; et al. Detection of circulating miRNAs: Comparative analysis of extracellular vesicle-incorporated miRNAs and cell-free miRNAs in whole plasma of prostate cancer patients. BMC Cancer 2017, 17, 730. [Google Scholar] [CrossRef] [PubMed]
  40. Williams, M.; Cheng, Y.Y.; Blenkiron, C.; Reid, G. Exploring mechanisms of microRNA downregulation in cancer. Microrna 2017, 6, 2–16. [Google Scholar] [CrossRef] [PubMed]
  41. Mazza, T.; Gioffreda, D.; Fontana, A.; Biagini, T.; Carella, M.; Palumbo, O.; Maiello, E.; Bazzocchi, F.; Andriulli, A.; Tavano, F. Clinical significance of circulating miR-1273g-3p and miR-122-5p in pancreatic cancer. Front. Oncol. 2020, 10, 44. [Google Scholar] [CrossRef] [PubMed]
  42. Gungormez, C.; Gumushan Aktas, H.; Dilsiz, N.; Borazan, E. Novel miRNAs as potential biomarkers in stage II colon cancer: Microarray analysis. Mol. Biol. Rep. 2019, 46, 4175–4183. [Google Scholar] [CrossRef] [PubMed]
  43. Rani, S.; Gately, K.; Crown, J.; O’Byrne, K.; O’Driscoll, L. Global analysis of serum microRNAs as potential biomarkers for lung adenocarcinoma. Cancer Biol. Ther. 2013, 14, 1104–1112. [Google Scholar] [CrossRef] [PubMed]
  44. Fornari, F.; Ferracin, M.; Trerè, D.; Milazzo, M.; Marinelli, S.; Galassi, M.; Venerandi, L.; Pollutri, D.; Patrizi, C.; Borghi, A.; et al. Circulating microRNAs, miR-939, miR-595, miR-519d and miR-494, identify cirrhotic patients with HCC. PLoS ONE 2015, 10, e0141448. [Google Scholar] [CrossRef]
  45. Chen, F.; Ni, X.; Chen, L.; Wang, X.; Xu, J. miR-939-3p promotes epithelial-mesenchymal transition and may be used as a prognostic marker in hepatocellular carcinoma. Oncol. Lett. 2020, 19, 2727–2732. [Google Scholar] [CrossRef] [PubMed]
  46. Ying, X.; Li-ya, Q.; Feng, Z.; Yin, W.; Ji-hong, L. MiR-939 promotes the proliferation of human ovarian cancer cells by repressing APC2 expression. Biomed Pharm. 2015, 71, 64–69. [Google Scholar] [CrossRef]
  47. Di Modica, M.; Regondi, V.; Sandri, M.; Iorio, M.V.; Zanetti, A.; Tagliabue, E.; Casalini, P.; Triulzi, T. Breast cancer-secreted miR-939 downregulates VE-cadherin and destroys the barrier function of endothelial monolayers. Cancer Lett. 2017, 384, 94–100. [Google Scholar] [CrossRef]
  48. Shen, Y.; Chen, G.; Gao, H.; Li, Y.; Zhuang, L.; Meng, Z.; Liu, L. miR-939-5p contributes to the migration and invasion of pancreatic cancer by targeting ARHGAP4. OncoTargets Ther. 2020, 13, 389–399. [Google Scholar] [CrossRef]
  49. Keller, A.; Fehlmann, T.; Backes, C.; Kern, F.; Gislefoss, R.; Langseth, H.; Rounge, T.B.; Ludwig, N.; Meese, E. Competitive learning suggests circulating miRNA profiles for cancers decades prior to diagnosis. RNA Biol. 2020, 17, 1416–1426. [Google Scholar] [CrossRef]
  50. Luo, G.; Jin, K.; Deng, S.; Cheng, H.; Fan, Z.; Gong, Y.; Qian, Y.; Huang, Q.; Ni, Q.; Liu, C.; et al. Roles of CA19-9 in pancreatic cancer: Biomarker, predictor and promoter. Biochim. Biophys. Acta Rev. Cancer 2020, 1875, 188409. [Google Scholar] [CrossRef]
  51. Pisano, A.; Griñan-Lison, C.; Farace, C.; Fiorito, G.; Fenu, G.; Jiménez, G.; Scognamillo, F.; Peña-Martin, J.; Naccarati, A.; Pröll, J.; et al. The inhibitory role of miR-486-5p on CSC phenotype has diagnostic and prognostic potential in colorectal cancer. Cancers 2020, 12, 3432. [Google Scholar] [CrossRef] [PubMed]
  52. Pederzoli, P.; Bassi, C.; Falconi, M.; Pedrazzoli, S. Does the extent of lymphatic resection affect the outcome in pancreatic cancer? Digestion 1997, 58, 536–541. [Google Scholar] [CrossRef] [PubMed]
  53. Yang, X.; Yan, Z.; Yang, H.; Ni, H.; Zhang, L.; Wang, Y. Clinical value of combined detection of miR-1202 and miR-195 in early diagnosis of cervical cancer. Oncol. Lett. 2019, 17, 3387–3391. [Google Scholar] [CrossRef] [PubMed]
  54. Du, B.; Zhang, P.; Tan, Z.; Xu, J. MiR-1202 suppresses hepatocellular carcinoma cells migration and invasion by targeting cyclin dependent kinase 14. Biomed Pharm. 2017, 96, 1246–1252. [Google Scholar] [CrossRef]
  55. Wang, Y.N.; Chen, Z.H.; Chen, W.C. Novel circulating microRNAs expression profile in colon cancer: A pilot study. Eur. J. Med. Res. 2017, 22, 51. [Google Scholar] [CrossRef] [PubMed]
  56. Hidalgo, M.; Cascinu, S.; Kleeff, J.; Labianca, R.; Löhr, J.M.; Neoptolemos, J.; Real, F.X.; Van Laethem, J.L.; Heinemann, V. Addressing the challenges of pancreatic cancer: Future directions for improving outcomes. Pancreatology 2015, 15, 8–18. [Google Scholar] [CrossRef] [PubMed]
Figure 1. Cluster analysis of differentially expressed miRNAs between PDAC patients and controls. Heat maps representing differentially expressed miRNAs of two different comparisons: long survival patients (a) and short survival (b) patients with respect to controls. Both dendrograms show the capability of circulating miRNA signatures to clearly separate PDAC patients with respect to controls. A color-coded scale for the normalized expression values is used: red and blue represent high and low expression levels. A complete list of differentially expressed genes identified by SAM two-class algorithm is provided in the Supplementary Materials (Tables S2 and S3).
Biomedicines 09 00845 g001
Figure 2. Expression levels of miRNAs significantly predicting adverse outcome. Normalized intensity values of miRNAs expression levels among controls (CS), PDAC patients with (LN pos) and without (LN neg) lymph node metastases have been compared. *: p < 0.05; **: p < 0.005.
Biomedicines 09 00845 g002
Figure 3. Relative quantification of hsa-miR-4516 (a) and hsa-miR-6089 (b) serum levels in an independent cohort of PDAC patients. The relative serum expression levels of hsa-miR-4516 and hsa-miR-6089 measured in 8 controls (CS) and in 24 PDAC patients are shown.
Biomedicines 09 00845 g003
Table 1. Clinical and biochemical characteristics of PDAC patients included in the study.
Patient Nr.AgeGenderGTNMStageSurvival (months)DiabetesCA 19-9kU/LTotal Bilirubin μmol/LP-Glucose mmol/LSurvival
71357M2200IB113DM (C)131105.0L
70870M1300IIA86DM (P)1810.4L
38659M2310IIB75RGT (C)20926.1L
66479F2310IIB56RGT (C)na394.7L
64279M2300IIA45RGT (C)92397.4L
310 78F2310IIB29DM (P)69691358.8L
70372F2310IIB25DM (P)5309128.9L
58563M2310IIB23DM (P)435138.2L
58458F3310IIB13RGT (C)106815.2S
35463M2410III11DM (C)519945.9S
30165M3310IIB11RGT (C)48657.1S
69967F2310IIB9DM (C)30226.4S
51761F3400III8DM (C)21296.2S
60768M3300IIA6RGT (C)2975.3S
55084F2300IIA2DM (P)105398.1S
Diabetes: DM = Diabetes Mellitus; RGT = Reduced Glucose Tolerance; C = concurrent diabetes diagnosis (≤5 months); P = previous diabetes diagnosis (>5 months); Survival: L = Long (>22 months); S = Short (<14 months).
Table 2. Serum miRNAs and early PDAC diagnosis. miRNAs showing an area under the ROC curve (AUC) higher than that of CA 19-9 in distinguishing controls from PDAC are reported. SE: standard error; 95% CI: 95% confidence interval; Increase/Decrease: miRNA levels increased or decreased in PDAC with respect to controls. Bold face: miRNAs significantly correlated with PDAC diagnosis at binary logistic regression analysis.
ROCAsymptotic NormalIncrease/Decrease
ObsAUCSE95% Conf. Interval
hsa-miR-7110-5p190.81670.13600.550141.00000Decrease
hsa-miR-3135-b190.83330.06300.709870.95680Increase
hsa-miR-4669190.83330.13460.569591.00000Decrease
hsa-miR-7107-5p190.83330.12250.593291.00000Decrease
hsa-miR-574-3p190.83330.12250.593291.00000Decrease
hsa-miR-1275190.83330.11880.600491.00000Decrease
hsa-miR-4466190.85000.13510.585291.00000Increase
hsa-miR-3679-5p190.85000.10550.643161.00000Decrease
hsa-miR-2392190.86670.05910.750850.98249Increase
hsa-miR-4655-3p190.86670.05910.750850.98249Increase
hsa-miR-6089190.86670.11960.632301.00000Increase
hsa-miR-5100190.86670.09700.676461.00000Increase
hsa-miR-6749-5p190.86670.08580.698581.00000Decrease
hsa-miR-4687-3p190.88330.09220.702581.00000Increase
hsa-miR-1915-3p190.88330.09220.702581.00000Increase
hsa-miR-6125190.88330.10430.678961.00000Increase
hsa-miR-1202190.88330.08120.724261.00000Decrease
hsa-miR-8485190.88330.10430.678961.00000Decrease
hsa-miR-6126190.90000.05350.795241.00000Increase
hsa-miR-939-5p190.90000.05350.795241.00000Increase
hsa-miR-6800-5p190.90000.07960.743991.00000Increase
hsa-miR-4516190.91670.06840.782551.00000Increase
hsa-miR-6869-5p190.91670.08910.742061.00000Increase
hsa-miR-6850-5p190.91670.07460.770411.00000Increase
hsa-miR-4327190.93330.04540.844301.00000Increase
hsa-miR-371b-5p190.93330.04540.844301.00000Increase
hsa-miR-6821-5p190.96670.04030.887611.00000Increase
Table 3. The Table reports results of Kruskal–Wallis rank test considering lymph node metastases as variable defining groups and any individual miRNA as predictor variable.
χ2p
hsa-miR-120210.8610.0044
hsa-miR-3679-5p8.0610.0178
hsa-miR-608811.7820.0028
hsa-miR-6791-5p6.0270.0491
hsa-miR-1915-3p10.8610.0044
hsa-miR-371b-5p11.9820.0025
hsa-miR-466912.4300.0020
hsa-miR-44999.6820.0079
hsa-miR-44428.2190.0164
hsa-miR-7107-5p9.4820.0087
hsa-miR-4800-5p6.6850.0353
Table 4. Cox regression analysis in the validation cohort. Dependent variable: PDAC patients’ survival.
PredictorsHRSEzp95% CI
Sex11.211615.257471.780.0760.7785689161.4499
Age1.0886520.05467041.690.0910.98660481.201255
hsa-miR-45161.59 × 10−467.36 × 10−45−2.280.0236.58 × 10−863.85 × 10−07
hsa-miR-60892.91 × 10341.24 × 10361.860.0630.01299176.53 × 1070
CA 19-91.0001010.00005551.810.0700.99999191.000209
Hemoglobin0.95158610.0202986−2.330.0200.91262180.9922141
Stage20.6421122.014922.840.0052.552365166.9418
Table 5. List of miRNA-target interactions enriched in the “Pancreatic cancer” pathway. Bold face: the interactions between miR-4516 (validated in qRT-PCR) and its target genes.
Entrez IDSymbolGene NamemiRNALog2 (PDAC Patients/Control)Experimental Evidence
208AKT2AKT serine/threonine kinase 2hsa-miR-28610.60Luciferase reporter assay; Western blot
9459ARHGEF6Rac/Cdc42 guanine nucleotide exchange factor 6hsa-miR-6127−1.90PAR-CLIP
598BCL2L1BCL2 like 1hsa-miR-6127−1.90PAR-CLIP
598BCL2L1BCL2 like 1hsa-miR-7110-5p−1.11PAR-CLIP
598BCL2L1BCL2 like 1hsa-miR-4739−0.98PAR-CLIP
598BCL2L1BCL2 like 1hsa-miR-5787−0.74PAR-CLIP
598BCL2L1BCL2 like 1hsa-miR-6879-5p−0.66PAR-CLIP
598BCL2L1BCL2 like 1hsa-miR-6756-5p−0.30PAR-CLIP
598BCL2L1BCL2 like 1hsa-miR-6752-5p0.02PAR-CLIP
598BCL2L1BCL2 like 1hsa-miR-6791-5p0.09PAR-CLIP
598BCL2L1BCL2 like 1hsa-miR-371b-5pnullPAR-CLIP
598BCL2L2BCL2 like 1hsa-miR-630−1.34Immunoblot;Luciferase reporter assay;qRT-PCR
595CCND1cyclin D1hsa-miR-574-5p−2.63PAR-CLIP
595CCND1cyclin D1hsa-miR-3648−1.98PAR-CLIP
595CCND1cyclin D1hsa-miR-5196-5p−1.69PAR-CLIP
595CCND1cyclin D1hsa-miR-7107-5p−1.27PAR-CLIP
595CCND1cyclin D1hsa-miR-6867-5p−0.84PAR-CLIP
595CCND1cyclin D1hsa-miR-3940-5p0.01qRT-PCR;Western blot
595CCND1cyclin D1hsa-miR-28610.60Luciferase reporter assay;Western blot
595CCND1cyclin D1hsa-miR-2392nullPAR-CLIP
1019CDK4cyclin dependent kinase 4hsa-miR-3135bnullHITS-CLIP
1021CDK6cyclin dependent kinase 6hsa-miR-6716-3p−2.51PAR-CLIP
1021CDK6cyclin dependent kinase 6hsa-miR-8485−1.81HITS-CLIP
1021CDK6cyclin dependent kinase 6hsa-miR-7847-3p−0.82PAR-CLIP
1021CDK6cyclin dependent kinase 6hsa-miR-4534−0.48PAR-CLIP
1021CDK6cyclin dependent kinase 6hsa-miR-5739−0.14PAR-CLIP
1021CDK6cyclin dependent kinase 6hsa-miR-371b-5pnullPAR-CLIP
1869E2F1E2F transcription factor 1hsa-miR-940−3.46PAR-CLIP
1869E2F1E2F transcription factor 1hsa-miR-6763-5p−1.09PAR-CLIP
1869E2F1E2F transcription factor 1hsa-miR-939-5pnullPAR-CLIP
1870E2F2E2F transcription factor 2hsa-miR-4669−0.88HITS-CLIP
1870E2F2E2F transcription factor 2hsa-miR-4433b-3p−0.40PAR-CLIP
1871E2F3E2F transcription factor 3hsa-miR-6124−0.94PAR-CLIP
1871E2F3E2F transcription factor 3hsa-miR-6867-5p−0.84PAR-CLIP
1871E2F3E2F transcription factor 3hsa-miR-4778-5p−0.33PAR-CLIP
1871E2F3E2F transcription factor 3hsa-miR-4271−0.19PAR-CLIP
1950EGFepidermal growth factorhsa-miR-940−3.46PAR-CLIP
1950EGFepidermal growth factorhsa-miR-4433a-3p−0.17PAR-CLIP
1956EGFRepidermal growth factor receptorhsa-miR-574-3p−1.57Luciferase reporter assay;Microarray;qRT-PCR;Western blot
1956EGFRepidermal growth factor receptorhsa-miR-28610.60Luciferase reporter assay;Western blot
2064ERBB2erb-b2 receptor tyrosine kinase 2hsa-miR-4270−0.97HITS-CLIP
8517IKBKGinhibitor of kappa light polypeptide gene enhancer in B-cells, kinase gammahsa-miR-6127−1.90PAR-CLIP
8517IKBKGinhibitor of kappa light polypeptide gene enhancer in B-cells, kinase gammahsa-miR-8485−1.81HITS-CLIP
8517IKBKGinhibitor of kappa light polypeptide gene enhancer in B-cells, kinase gammahsa-miR-4739−0.98HITS-CLIP
3845KRASKRAS proto-oncogene, GTPasehsa-miR-671-5p−0.30PAR-CLIP
5594MAPK1mitogen-activated protein kinase 1hsa-miR-6763-5p−1.09PAR-CLIP
5594MAPK1mitogen-activated protein kinase 1hsa-miR-6831-5p−0.91PAR-CLIP
5594MAPK1mitogen-activated protein kinase 1hsa-miR-6088−0.80PAR-CLIP
5594MAPK1mitogen-activated protein kinase 1hsa-miR-4271−0.19PAR-CLIP
5594MAPK1mitogen-activated protein kinase 1hsa-miR-4433a-3p−0.17PAR-CLIP
5594MAPK1mitogen-activated protein kinase 1hsa-miR-6869-5p1.18PAR-CLIP
5594MAPK1mitogen-activated protein kinase 1hsa-miR-3135bnullHITS-CLIP
5602MAPK10mitogen-activated protein kinase 10hsa-miR-574-5p−2.63HITS-CLIP
5602MAPK10mitogen-activated protein kinase 10hsa-miR-6867-5p−0.84HITS-CLIP
5599MAPK8mitogen-activated protein kinase 8hsa-miR-371b-5pnullPAR-CLIP
5293PIK3CDphosphatidylinositol-4,5-bisphosphate 3-kinase catalytic subunit deltahsa-miR-4433a-3p−0.17PAR-CLIP
5294PIK3CGphosphatidylinositol-4,5-bisphosphate 3-kinase catalytic subunit gammahsa-miR-8485−1.81PAR-CLIP
5295PIK3R1phosphoinositide-3-kinase regulatory subunit 1hsa-miR-8485−1.81PAR-CLIP
5295PIK3R1phosphoinositide-3-kinase regulatory subunit 1hsa-miR-1202−0.94PAR-CLIP
5296PIK3R2phosphoinositide-3-kinase regulatory subunit 2hsa-miR-3135bnullPAR-CLIP
5879RAC1ras-related C3 botulinum toxin substrate 1hsa-miR-574-3p−1.57Luciferase reporter assay;Microarray;qRT-PCR;Western blot
5879RAC1ras-related C3 botulinum toxin substrate 1hsa-miR-6763-5p−1.09PAR-CLIP
5879RAC1ras-related C3 botulinum toxin substrate 1hsa-miR-6124−0.94PAR-CLIP
5879RAC1ras-related C3 botulinum toxin substrate 1hsa-miR-939-5pnullPAR-CLIP
5881RAC3ras-related C3 botulinum toxin substrate 3hsa-miR-5703−1.70PAR-CLIP
5881RAC3ras-related C3 botulinum toxin substrate 3hsa-miR-45161.51PAR-CLIP
5888RAD51RAD51 recombinasehsa-miR-940−3.46PAR-CLIP
5888RAD51RAD51 recombinasehsa-miR-7847-3p−0.82PAR-CLIP
5888RAD51RAD51 recombinasehsa-miR-1915-3p0.72HITS-CLIP
5888RAD51RAD51 recombinasehsa-miR-79751.09HITS-CLIP
5888RAD51RAD51 recombinasehsa-miR-371b-5pnullHITS-CLIP
5894RAF1Raf-1 proto-oncogene, serine/threonine kinasehsa-miR-4534−0.48PAR-CLIP
5894RAF1Raf-1 proto-oncogene, serine/threonine kinasehsa-miR-6789-5p−0.27PAR-CLIP
5970RELARELA proto-oncogene, NF-kB subunithsa-miR-3162-3p−2.72PAR-CLIP
5970RELARELA proto-oncogene, NF-kB subunithsa-miR-4534−0.48PAR-CLIP
4087SMAD2SMAD family member 2hsa-miR-8485−1.81HITS-CLIP
4087SMAD2SMAD family member 2hsa-miR-937-5p−0.38HITS-CLIP
4089SMAD4SMAD family member 4hsa-miR-574-5p−2.63HITS-CLIP
4089SMAD4SMAD family member 4hsa-miR-574-3p−1.57Luciferase reporter assay;qRT-PCR;Western blot
4089SMAD4SMAD family member 4hsa-miR-6867-5p−0.84HITS-CLIP
4089SMAD4SMAD family member 4hsa-miR-371b-5pnullPAR-CLIP
6774STAT3signal transducer and activator of transcription 3hsa-miR-4270−0.97PAR-CLIP
6774STAT3signal transducer and activator of transcription 3hsa-miR-45161.51Luciferase reporter assay;Microarray;qRT-PCR;Western blot
7040TGFB1transforming growth factor beta 1hsa-miR-574-3p−1.57Luciferase reporter assay;qRT-PCR;Western blot
7046TGFBR1transforming growth factor beta receptor 1hsa-miR-6831-5p−0.91HITS-CLIP
7048TGFBR2transforming growth factor beta receptor 2hsa-miR-940−3.46PAR-CLIP
7048TGFBR2transforming growth factor beta receptor 2hsa-miR-574-5p−2.63HITS-CLIP
7048TGFBR2transforming growth factor beta receptor 2hsa-miR-630−1.34Microarray
7048TGFBR2transforming growth factor beta receptor 2hsa-miR-6867-5p−0.84HITS-CLIP
7157TP53tumor protein p53hsa-miR-6127−1.90PAR-CLIP
7157TP53tumor protein p53hsa-miR-5703−1.70PAR-CLIP
7157TP53tumor protein p53hsa-miR-7110-5p−1.11PAR-CLIP
7157TP53tumor protein p53hsa-miR-937-5p−0.38PAR-CLIP
7157TP53tumor protein p53hsa-miR-6756-5p−0.30PAR-CLIP
7157TP53tumor protein p53hsa-miR-4271−0.19PAR-CLIP
7157TP53tumor protein p53hsa-miR-6752-5p0.02PAR-CLIP
7157TP53tumor protein p53hsa-miR-45161.51PAR-CLIP
7422VEGFAvascular endothelial growth factor Ahsa-miR-8485−1.81PAR-CLIP;HITS-CLIP
7422VEGFAvascular endothelial growth factor Ahsa-miR-6769b-5p−0.70PAR-CLIP
7422VEGFAvascular endothelial growth factor Ahsa-miR-6756-5p−0.30PAR-CLIP
Publisher’s Note: MDPI stays neutral with regard to jurisdictional claims in published maps and institutional affiliations.

