
An LDA–SVM Machine Learning Model for Breast Cancer Classification †
by
 , , and
Onyinyechi Jessica Egwom
1,* ,
,
Mohammed Hassan
2,*,
Jesse Jeremiah Tanimu
2,* ,
,
Mohammed Hamada
3 and
Oko Michael Ogar
1 1
Department of Computer Science, Federal University, Wukari 670101, Nigeria
2
Department of Software Engineering, Bayero University, Kano 700241, Nigeria
3
Software Engineering Lab, University of Aizu, Aizu 965-8580, Japan
*
Authors to whom correspondence should be addressed.
†
This paper is an extended version of our work titled “The role of Linear Discriminant Analysis for Accurate Breast Cancer prediction” published by Egwom Onyinyech Jessica, Mohamed Hamada, Saratu Ilu Yusuf and Mohammed Hassan in 2021 IEEE 14th international Symposium on Embedded Multicore/Many-Core-Systems-on-chip (MCSoC), Singapore, 20–23 December 2021, pp. 340–344, doi:10.1109/MCSoC51149.2021.00057.
BioMedInformatics 2022, 2(3), 345-358; https://0-doi-org.brum.beds.ac.uk/10.3390/biomedinformatics2030022
Submission received: 30 May 2022
/
Revised: 18 June 2022
/
Accepted: 22 June 2022
/
Published: 26 June 2022
Abstract
:Breast cancer is a prevalent disease that affects mostly women, and early diagnosis will expedite the treatment of this ailment. Recently, machine learning (ML) techniques have been employed in biomedical and informatics to help fight breast cancer. Extracting information from data to support the clinical diagnosis of breast cancer is a tedious and time-consuming task. The use of machine learning and feature extraction techniques has significantly changed the whole process of a breast cancer diagnosis. This research work proposed a machine learning model for the classification of breast cancer. To achieve this, a support vector machine (SVM) was employed for the classification, and linear discriminant analysis (LDA) was employed for feature extraction. We measured our model’s feature extraction performance in principal component analysis (PCA) and random forest for classification. A comparative analysis of the proposed model was performed to show the effectiveness of the feature extraction, and we computed missing values based on the classifier’s accuracy, precision, and recall. The original Wisconsin Breast Cancer dataset (WBCD) and Wisconsin Prognostic Breast Cancer dataset (WPBC) were used. We evaluated performance in two phases: In phase 1, rows containing missing values were computed using the mean, and in phase 2, rows containing missing values were computed using the median. LDA–SVM when median was used to compute missing values has better results, with accuracy of 99.2%, recall of 98.0% and precision of 98.0% on the WBCD dataset and an accuracy of 79.5%, recall of 76.0% and precision of 59.0% on the WPBC dataset. The SVM classifier had a better performance in handling classification problems when LDA was applied and the median was used as a method for computing missing values.
1. Introduction
According to the World Health Organization (WHO) [1], cancer is a large group of diseases that occurs in any part or tissue of the body when abnormal cells grows uncontrollably beyond their usual boundaries, invading adjoining parts of the body and destroying body tissues.
The WHO reports that cancer, such as breast, cervical, ovarian, lung and prostate cancer, has accounted for over 10 million deaths in 2022. Breast cancer is the most prevalent cancer at 2.26 million cases and is the leading cause of premature mortality among women globally, with 685,000 deaths [2]. Breast cancer (BC) is one of the most prevailing cancers among women worldwide, with fewer cases in men [3].
Breast cancer is a medical abnormality in which the cells lining the breast ducts form clumps with malignant characteristics. It is the most common cancer in women, found mostly in middle- and-low-income countries of sub-Saharan Africa, most especially Nigeria [4,5].
The primary concern of breast cancer treatment begins with accurate predictions of the cancer presence and classifying the cancer type to determine how to treat the cancer [6]. However, predicting breast cancer type is among the classic problems in health-related research [3]. The accurate classification of breast cancer would translate to its early detection, diagnosis, treatment, and, where possible, full eradication. Furthermore, the accurate classification of benign tumors can prevent patients from undergoing unnecessary treatments [7].
Over the last few decades, several organizations have acquired vast repositories of data collected from diverse sources in distinct formats [8,9]. These collected data could be used in different application domains such as medicine, agriculture and weather forecasting [10]. These increasingly large amounts of data surpass the ability of the traditional methods used in analyzing, searching for patterns and information hidden in them for decision making [11,12]. Data obtained from medical data repositories could be analyzed using machine learning algorithms such as classification, clustering, and regression algorithms. Machine learning algorithms and their usefulness in knowledge detection from medical data repositories have been valuable tools for the success of disease prediction [13,14]. A good number of research works have reported the use of machine learning algorithms for breast cancer predictions [15]. Machine learning algorithms have been prevalent in the development of predictive models to support effective decision-making for breast cancer predictions [16].
Machine learning algorithms as tools have been used to create predictive models for BC to support physicians’ decisions with acceptable accuracy [17]. However, these models show some limitations, such as the use of appropriate methods to fit the model depending on the dataset without considering feature extraction techniques [18]; proper feature extraction techniques effectively reduce dimensionality for the better prediction of the disease [19]. There is also an increasing concern regarding the methods of handling missing values in the dataset [20]. Hence, we developed an improved machine learning model to give accurate breast cancer predictions and increase survivability rates in women.
This study demonstrates the importance of computing missing values for enhancing prediction accuracy. The empirical findings of the study showed the relevance of using medians and means for computing missing values in the datasets. This study reports the advantage of using feature extraction in the prediction of breast cancer.
This study aims to shine new light on the effectiveness of feature extraction by integrating linear discriminant analysis (LDA) and support vector machine (SVM) for breast cancer prediction to improve classification performance in terms of accuracy precision and recall.
This paper has been divided into five parts organized as follows: Section 1 gives an overview of the research. Section 2 presents related work on breast cancer classification. Section 3 is concerned with the materials and methods used for this research, Section 4 presents the findings of the research and finally, Section 5 gives the conclusion, a brief summary with critiques of the findings.
2. Related Works
Prediction is one of the most important and essential tasks in machine learning [21]. Extensive research has been conducted using machine learning algorithms on different medical datasets, especially in BC prediction. Most ML techniques used showed good prediction accuracy.
In 2015, [19] used SVM, an artificial neural network, a naïve Bayes classifier and Adaboost for breast cancer prediction using machine learning techniques, where principal component analysis was used for feature space reduction.
In 2020, [22] used an artificial neural network (ANN) and SVM for the prognosis of breast cancer recurrence as well as patient’s death within 32 months of undergoing surgery. SVM had the best performance, with an accuracy of 96.86%
Khourdifi [23] applied four machine learning techniques, namely SVM, RF, Naïve Bayes, and K-NN, on the Wisconsin breast cancer dataset from the UCI machine learning repository. The authors used Waikato Environment for Knowledge Analysis (Weka) software for the simulation of the algorithm. In their results, SVM had the best overall performance in terms of effectiveness and efficiency.
Chaurasia et al. [24] used naïve Bayes, RBF network, and J48 for the prediction of benign and malignant breast cancer in the Wisconsin breast cancer database (WBCD) to improve the accuracy of the BC prediction model; the results showed that naïve Bayes was the best predictor. Kumar [25] used naïve Bayes, logistic regression, and decision tree for the performance analysis of data mining algorithms for breast cancer cell detection.
Rajbharath and Sankari [7] used a hybrid of random forest (RF) and logistic regression (LR) algorithms for building a breast cancer survivability prediction model. RF was used to perform a preliminary screening of the variables for ranking. The new data set was extracted from the initial WDBC dataset and input into the logistic regression procedure, which is responsible for building interpretable models for predicting breast cancer survivability.
In 2016, Asri et al. [26] performed a comparison between different machine learning algorithms, support vector machine (SVM), decision tree (C4.5), naïve Bayes (NB) and k nearest neighbors (k-NN), in the Wisconsin Breast Cancer (original) datasets for breast cancer risk prediction and diagnosis. The experimental SVM gave the highest accuracy with low error rate.
Ricciardi et al. [27] used a combination of linear discriminant analysis (LDA) and principal component analysis (PCA) for the classification of coronary artery disease with principal component analysis used to create new features and linear discriminant analysis for the classification, which improved the diagnosis of patients.
Kumar et al. [3] predicted malignant and benign breast cancer using 12 algorithms: Ada Boost M1, decision table, J-Rip, J48, Lazy IBK, Lazy K-star, logistic regression, multiclass classifier, multilayer perceptron, naïve Bayes, random forest and random tree. The primary data were drawn from the Wisconsin breast cancer database, and Lazy K and the random tree had the highest accuracy.
Furthermore, Gupta and Gupta [28] performed a comparative analysis of four widely used machine learning techniques, namely, multilayer perceptron (MLP), decision tree (C4.5), support vector machine (SVM), and K-nearest neighbor (KNN) performed on the Wisconsin Breast Cancer dataset to predict the breast cancer recurrence. The main objective of their work was to obtain the best classifier of the four in terms of accuracy, precision and recall In their work, they concluded that MLP performed better than the other techniques, including when 10-fold cross-validation.
Zheng et al. [29] studied K-means and support vector machine (K-SVM) algorithms based on 10-fold cross-validation, and the proposed methodology improved the accuracy of breast cancer prediction to 97.38% when tested on the Wisconsin Diagnostic Breast Cancer (WDBC). The authors proposed a new combination of machine learning algorithms, specifically using K-means for the separate recognition of the hidden patterns in the malignant and benign tumors and then SVM to generate the new classifier within the 10-fold cross-validation. Their new approach obtained an accuracy of 97.38%, which was higher than the scores for the other six algorithms.
In another study, Sivakami and Saraswathi [20] worked on breast cancer prediction using a DT–SVM hybrid model of decision tree and support vector machine. The decision tree was used for feature selection, and the proposed methodology improved the accuracy of breast cancer prediction to 91%. In another recent study on breast cancer, Wu and Hicks [30] investigated four ML algorithms: support vector machine, K-nearest neighbor, naïve Bayes and decision trees to classify triple-negative breast cancer and non-triple-negative breast cancer for patients using gene expression data. SVM gave better classifications than the other three algorithms.
With respect to all the works mentioned above, this research work combines the behavior of machine learning algorithms (support vector machine) and feature extraction techniques (linear discriminant analysis) for application with the Wisconsin Breast Cancer datasets for help with prediction and decision-making. The goal is to achieve the best accuracy with the lowest error rate in analyzing the data. To do so, the efficiency and effectiveness of the algorithm are compared in terms of these criteria, which are accuracy, precision, and recall.
3. Materials and Methods
This section describes the stages involved in developing the model.
3.1. Dataset Description
To evaluate the proposed model, experimental data were obtained from the Breast Cancer Wisconsin subdirectory of the University of California Irvine Machine Learning repository, available at [31]; specifically, the datasets used were the original Wisconsin Breast Cancer dataset (WBCD) and Wisconsin Prognosis Breast Cancer (WPBC). WBCD comprises 699 samples, 683 of which are complete data; 16 samples are missing the Bare nuclei attribute for 16 different instances. Meanwhile, WPBC comprises 197 samples, 193 were complete; 4 were missing values for the lymph node attribute. The WBCD and WPBC data were obtained via fine needle aspirates of affected tissue with virtually assessed nuclear features from patients’ breasts [17]. WBCD contains 699 instances and 2 classes (malignant and benign); of these, 458 were classified as benign, and 241 were malignant. The values for the 9 integer-valued attributes ranged from 1 to 10 where 10 was the most abnormal. As reflected in Table 1, attribute ratings of 2 or 4 indicated benign or malignant lesion, respectively. Of the 197 WPBC samples from the 2 classes (nonrecurrence and recurrence), there were 150 cases of nonrecurrence and 47 recurrences, as well as 33 outcome attributes and 32 real-valued input attributes. The outcome attributes are represented by N or R, nonrecurrence or recurrence, as presented in Table 2.
The mean, standard error, and “worst” or largest (the mean of the three largest values) of these features (2–11) were computed for each image, resulting in 30 features.
3.2. Data Pre-Processing
The data for this study were preprocessed to manage the 16 missing values for the bare nuclei attribute of the WBCD dataset and the 4 missing lymph node attribute values in the WPBC dataset. Researchers have used a number of methods to impute missing values in datasets that occur due to the incorrect collection of data values. Some of the methods include deletion, mean, imputer method, mode and median [18,32,33]. Deletion causes a great loss of information when missing values are concentrated in a single feature [34]. In the preprocessing stage, we also employed linear discriminant analysis and principal component analysis to reduce the dimensionality in the datasets.
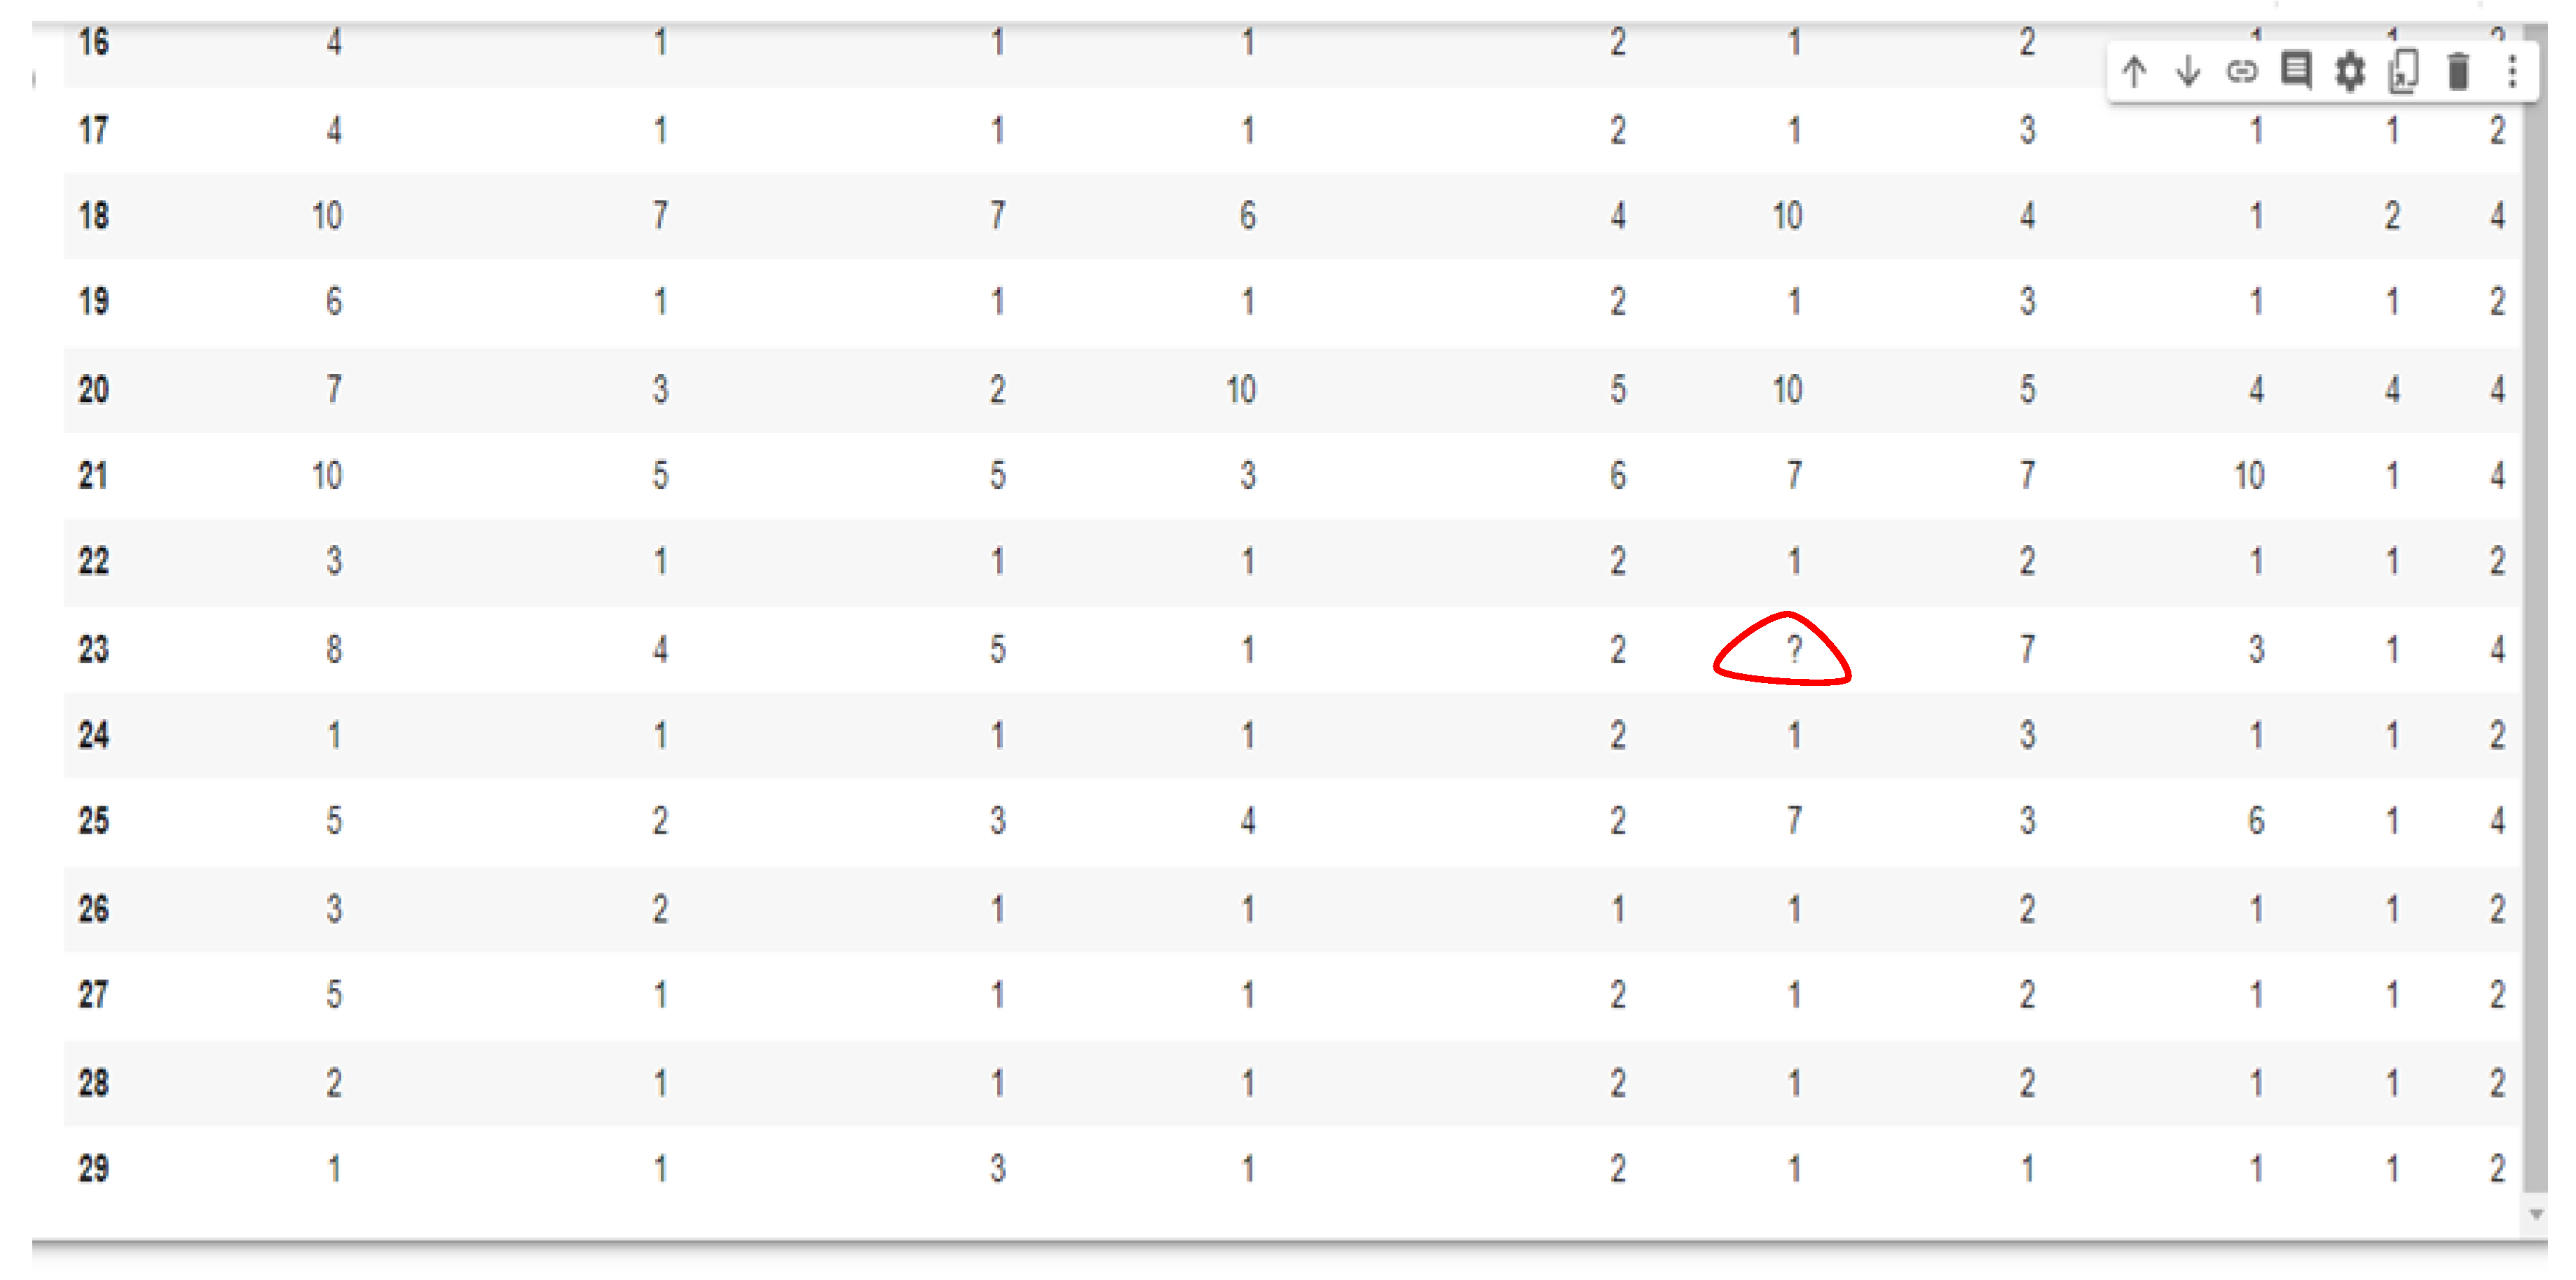
To handle this problem, we calculated the medians and means of the nonmissing values and separately used this calculation to fill the 16 and 4 missing values from each dataset. The 16 missing values from the WBCD dataset belonged to the bare nuclei attribute, and the 4 missing WPBC values were for the lymph node; these were all computed using the median and mean to compare their effectiveness in handling missing values. The mean and median were calculated using Equations (1) and (2), respectively. Figure 1 shows the missing values in the dataset.
where,
- xi = ith variable
- i = ith value of variable X
- n = number of variables in the dataset.
- X = Order list of values in dataset
- n = Number of values in dataset.
Figure 1.
Dataset showing the missing values.

3.3. Principal Component Analysis
Principal component analysis (PCA) is a commonly used dimensionality-reduction technique. PCA takes as input the original dataset and tries to find a combination of the input features that can best summarize the original data distribution to reduce its original dimensions [35]. PCA can do this by maximizing the variances and minimizing the reconstruction error by looking at pair-wised distances.
3.4. Linear Discriminant Analysis (LDA)
Linear discriminant analysis was the main feature extraction technique employed in this research work to compare with principal component analysis. Linear discriminant analysis (LDA) is a common technique for reducing dimensionality in the preprocessing for machine learning classification applications [36]. LDA was developed to transform features into a lower dimensional space by minimizing the ratio of the between-class variance to the within-class variance, thereby guaranteeing maximum class separability. The major aim of LDA is to project a space (N-dimensional data) onto a smaller subspace K (K ≤ n − 1) while maintaining the class discriminant. The linear discriminant analysis was calculated using Equations (3)–(8).
The mean of each class was calculated using Equation (3):
The total mean of all data was calculated with Equation (4):
The between-class matrix was calculated using Equation (5):
The within-class matrix was computed using Equation (6):
where fij is the ith sample of the jth class.
From Equations (5) and (6), matrix D, the LDA transformation matrix, is calculated:
D = SW−1SB
The eigenvalues (ʎ) and eigenvectors of (V) were calculated using D. The eigenvectors were sorted according to their corresponding eigenvalues, and the eigenvectors were used as the lower dimensional space (VK). All original data from dataset F were projected onto the lower dimensional space VK using Equation (8):
where SB is the between-class variance, Sw is the within-class variance, C = the total number of distinct classes, D = the transformation matrix, F = the input values, N = the total number of samples of all classes, C = class, µ= total mean, and Vk = the lower dimensional space.
A= FVK, fi 𝟄 hj
3.5. Classification
Support vector machine (SVM) is a linear model for classification and regression problems [15]. It is widely applied in the field of medical predictions. An SVM classifier performs binary classification, i.e., it separates a set of training vectors by mapping the two different classes (x1, y1), (x2, y2), …, (xm, ym), where xi 𝟄 Rd denotes vectors in a d-dimensional feature space and yi 𝟄 {−1, +1} is a class label. For this study, we studied the radial basis function (RBF) support vector machine model for the classification of breast cancer datasets. The mathematical notion of support vector machine is to separate the training vectors for the two different classes. Equations (9) and (10) used the general form for support vector machine classifier. SVM was used as a classifier based on 5-fold cross-validation:
where
- x = the training vectors;
- y = the label associated with the training vectors;
- ∞ = the parameter vectors of the classifier hyper-plane;
- k = a kernel function for measuring the distance between the training vector xi and xj;
- L = a penalty parameter for controlling the number of misclassifications.
3.6. Random Forest
The random forest (RF)is a combined classifier formed by combining k basic decision trees from the original dataset as follows:
D = {(x1,y1), (x2,y2), … (xn,yn)}
RF is a bagging algorithm that aims at regularizing the point where the model quality is high and its variance and basic problems are not compromised. To avoid the problem of overfitting RF, it is customary to build thousands of trees [18].
3.7. Performance Metrics
The accurate diagnosis of patients suffering from a particular disease is vital in health care. To evaluate our model performance, we considered three evaluation metrics: accuracy, recall and precision. The performance of the model was evaluated using a confusion matrix. A confusion matrix is a table that represents the ability of the model to classify labels correctly.
The confusion matrix describes the performance parameters for the classifier where TP, TN, FP, and FN represent true positive, true negative, false positive, and false negative, respectively:
- True negative: The observation is correctly classified as negative.
- False negative: The observation is incorrectly classified as negative.
- True positive: A positive class is correctly classified by the model.
- False positive: A negative observation is incorrectly classified.
Next was calculating the accuracy, precision and recall for the model using the formulae:
- v.
- Accuracy: The total number of correctly classified patterns divided by the total numbers of patterns as shown in Equation (11):
- vi.
- Precision: The ability of the classifier to correctly identify the positive class is calculated with Equation (12):
- vii.
- Recall: The number of times the classifier predicted a negative class out of all the times the class is negative (noncancerous), calculated with Equation (13):
- viii.
- Receiver operating characteristics curve (ROC): The ROC is a technique used for visualizing a model’s performance. It is a comprehensive index reflecting the continuous variables of sensitivity and specificity. The curve is used to define the relationship between sensitivity and specificity.
- ix.
- Area under the curve (AUC): The area under the ROC curve, abbreviated as AUC, is commonly used to evaluate a model’s performance. AUC measures the entire two-dimensional area under the ROC curve. The larger the AUC, the better the performance of the model.
3.8. Computational Framework
The proposed model was implemented using Jupyter Notebook, a Python programming environment, which has a machine learning library called Sci-Kit Learn. Sci-Kit Learn has built-in supports for all extant machine learning algorithms used for classification and a good number of packages for data preprocessing techniques and machine learning performance measures.
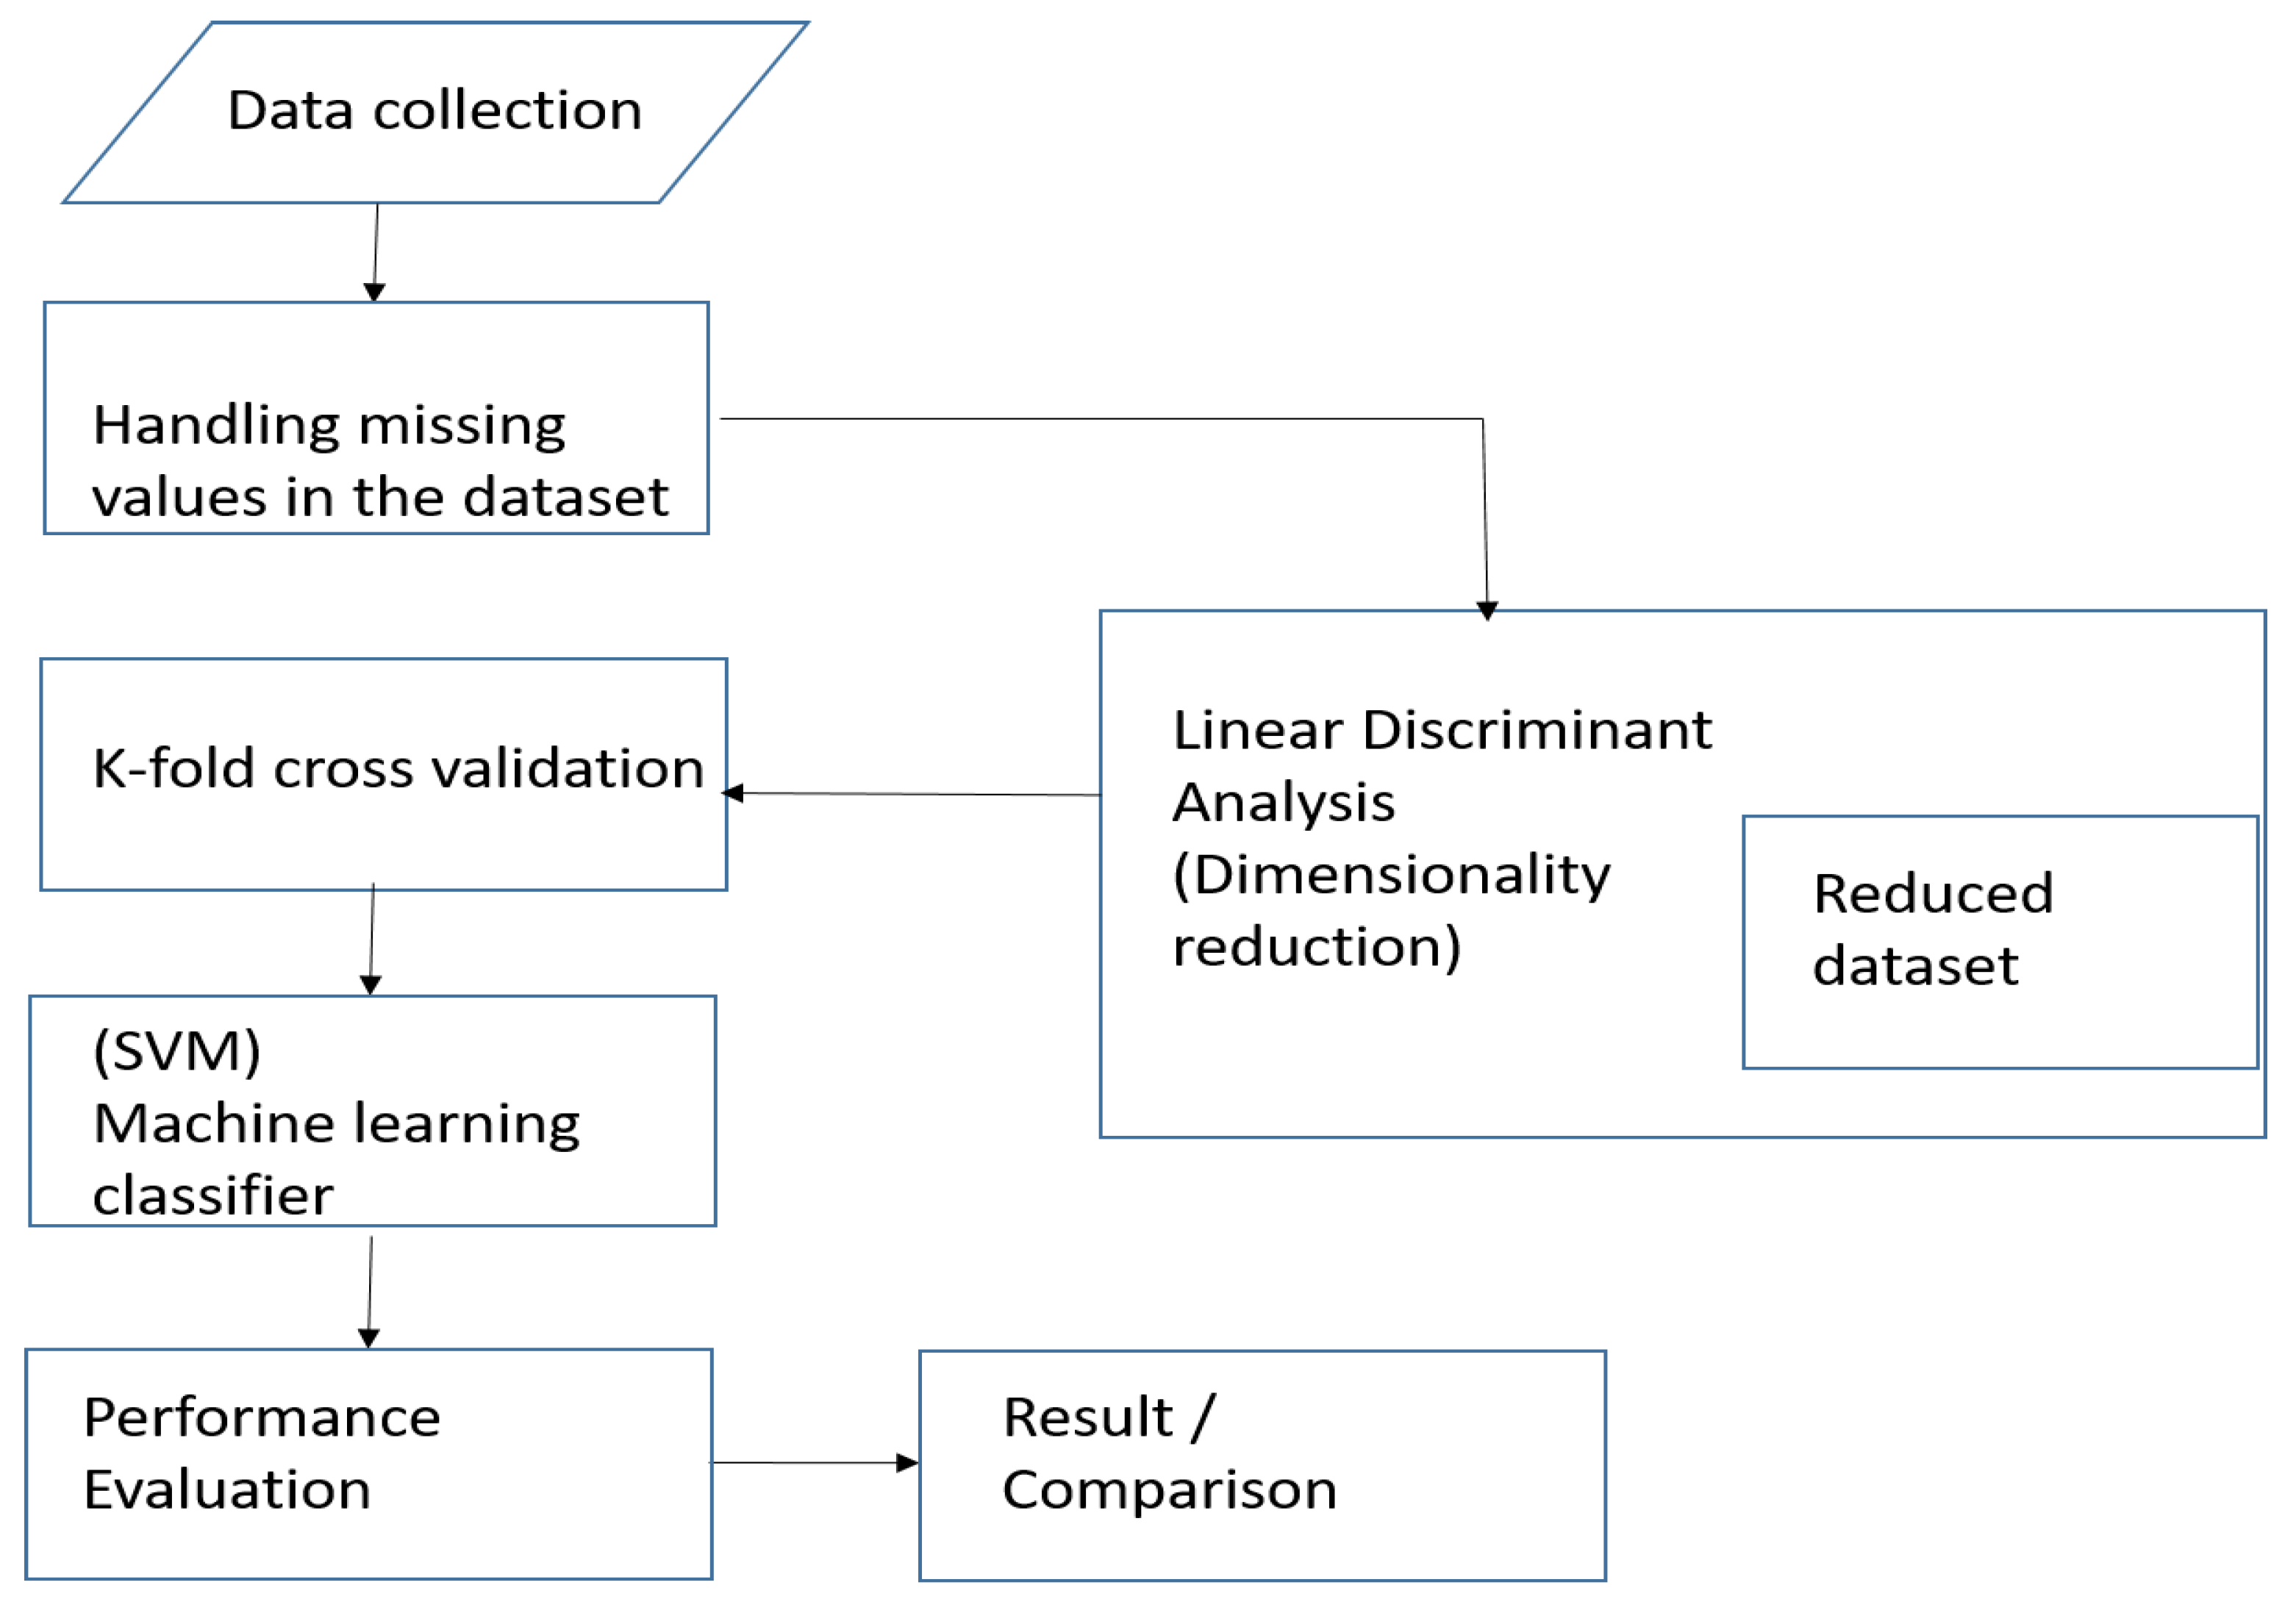
The program was run on an Intel Core i5 central processing unit (CPU) with a processing speed of 2.30 GHz. The system has a random-access memory (RAM) of 4 gigabytes. Figure 2 shows the basic architectural framework of the proposed model.
4. Results and Discussion
This section presents the results obtained from using feature reduction and the classifier on the datasets. Several research works have been carried out using different methods to improve prediction performance for medical classification [21,37].
A confusion matrix was used to provide classification accuracy for the proposed model based on 5-fold cross-validation. In each cross-validation process, a different one-fifth of the data was selected for validation in such a way that all the data used for training and validation were validated [38]. The 5-fold cross-validation was applied because it gave the best result when testing for the number of k-folds to be used for the research.
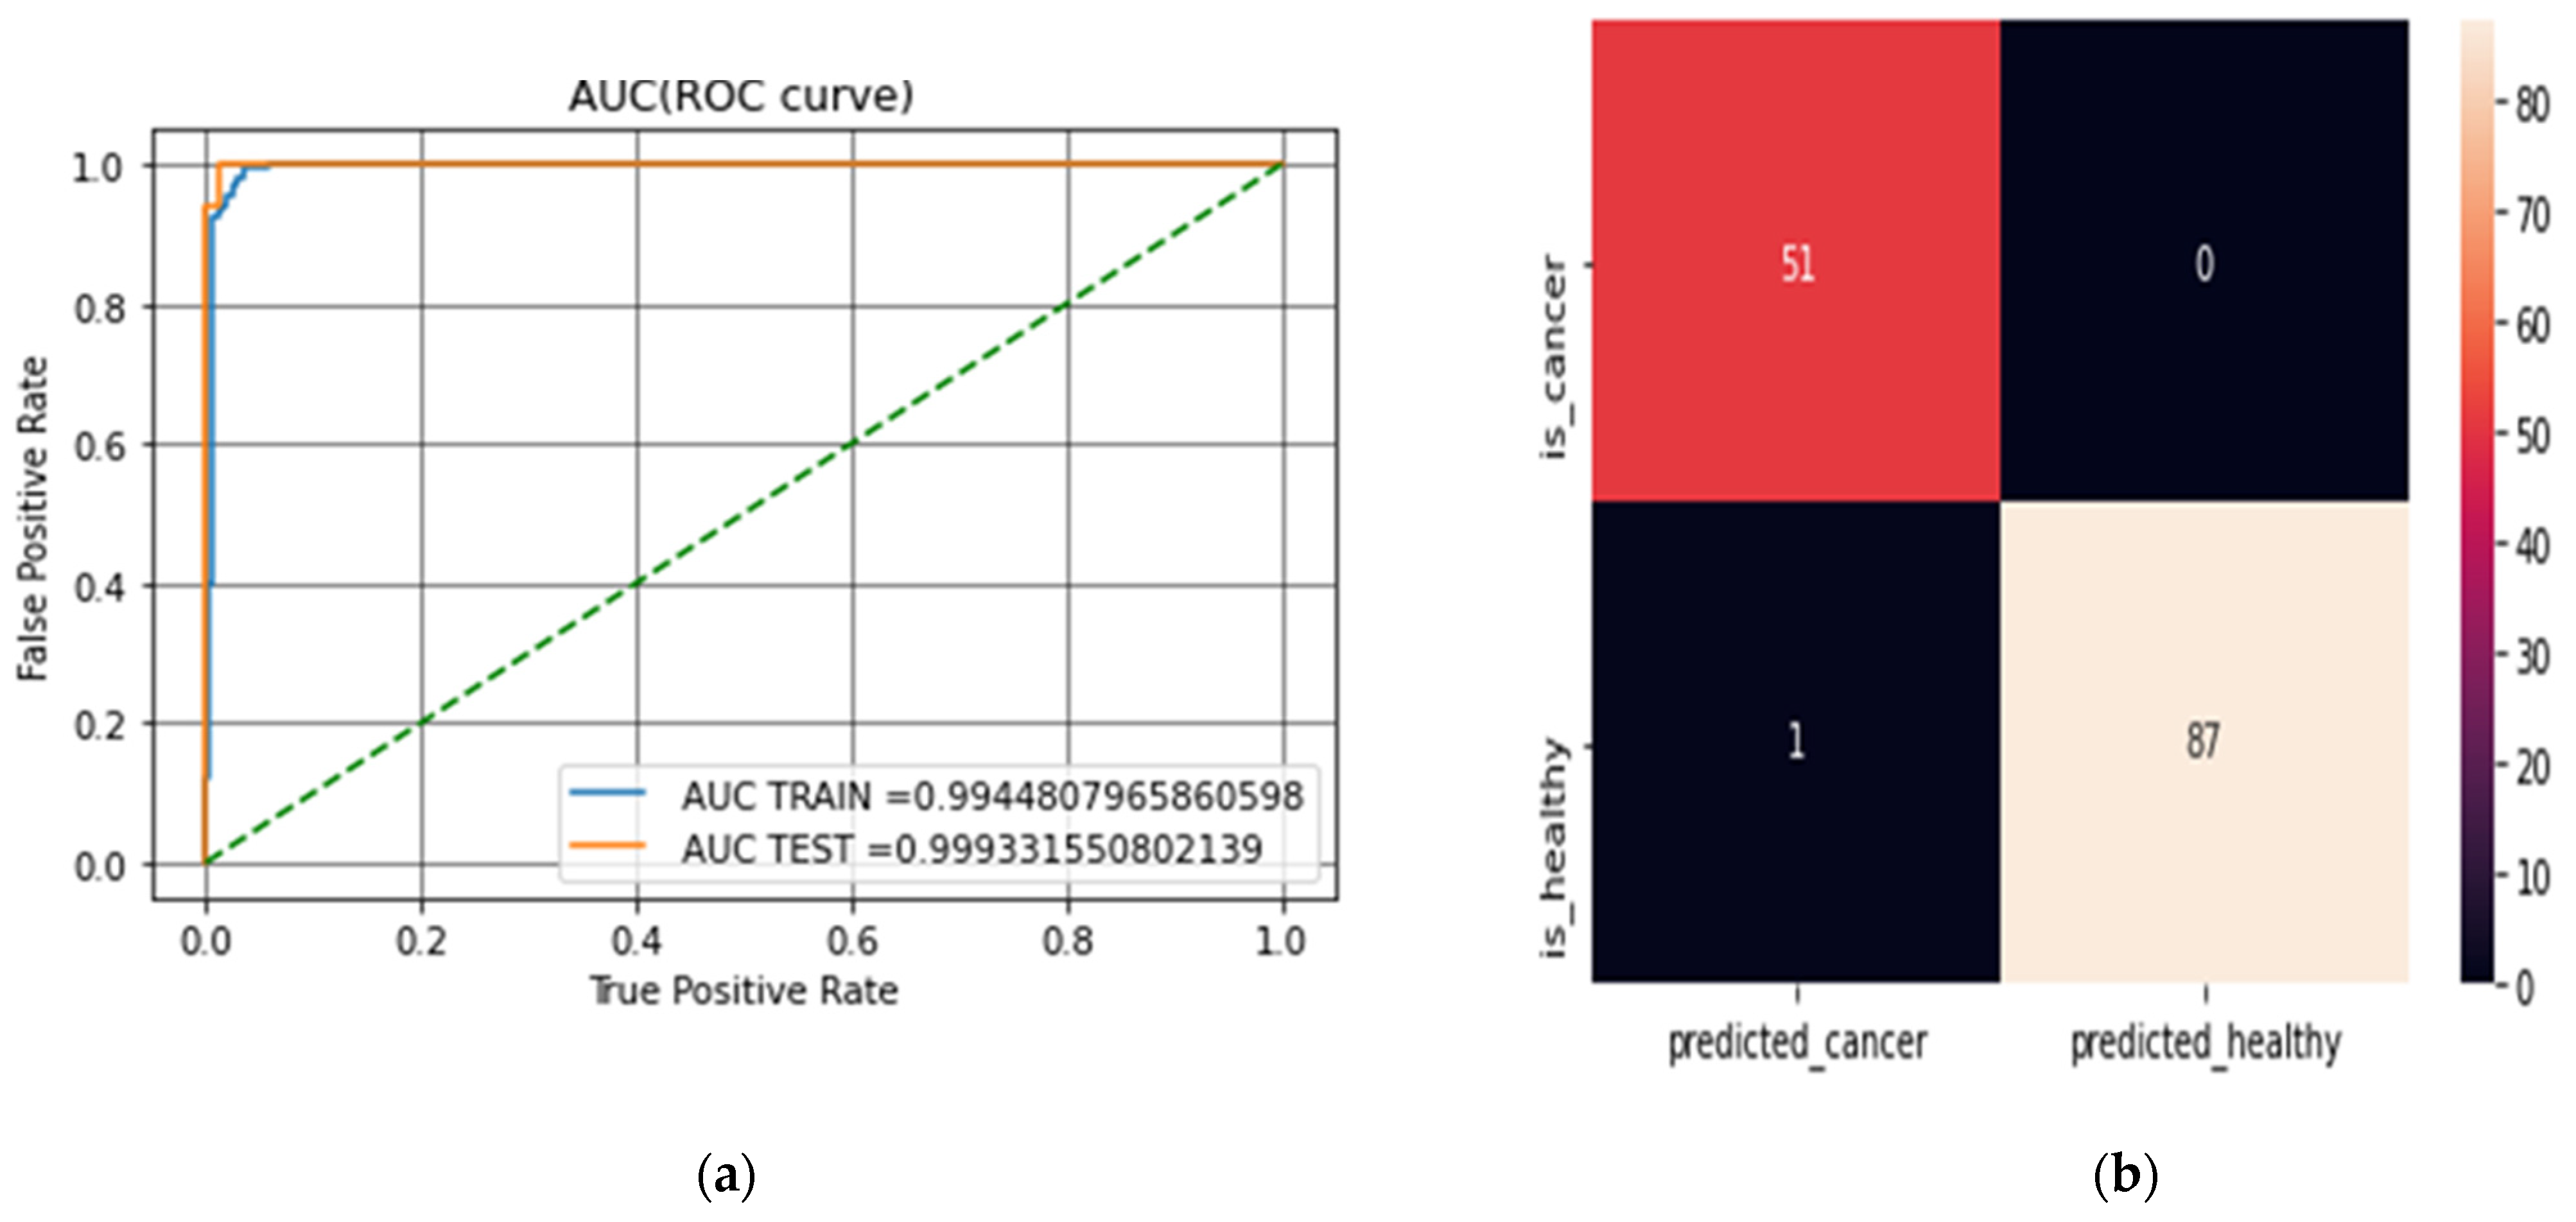
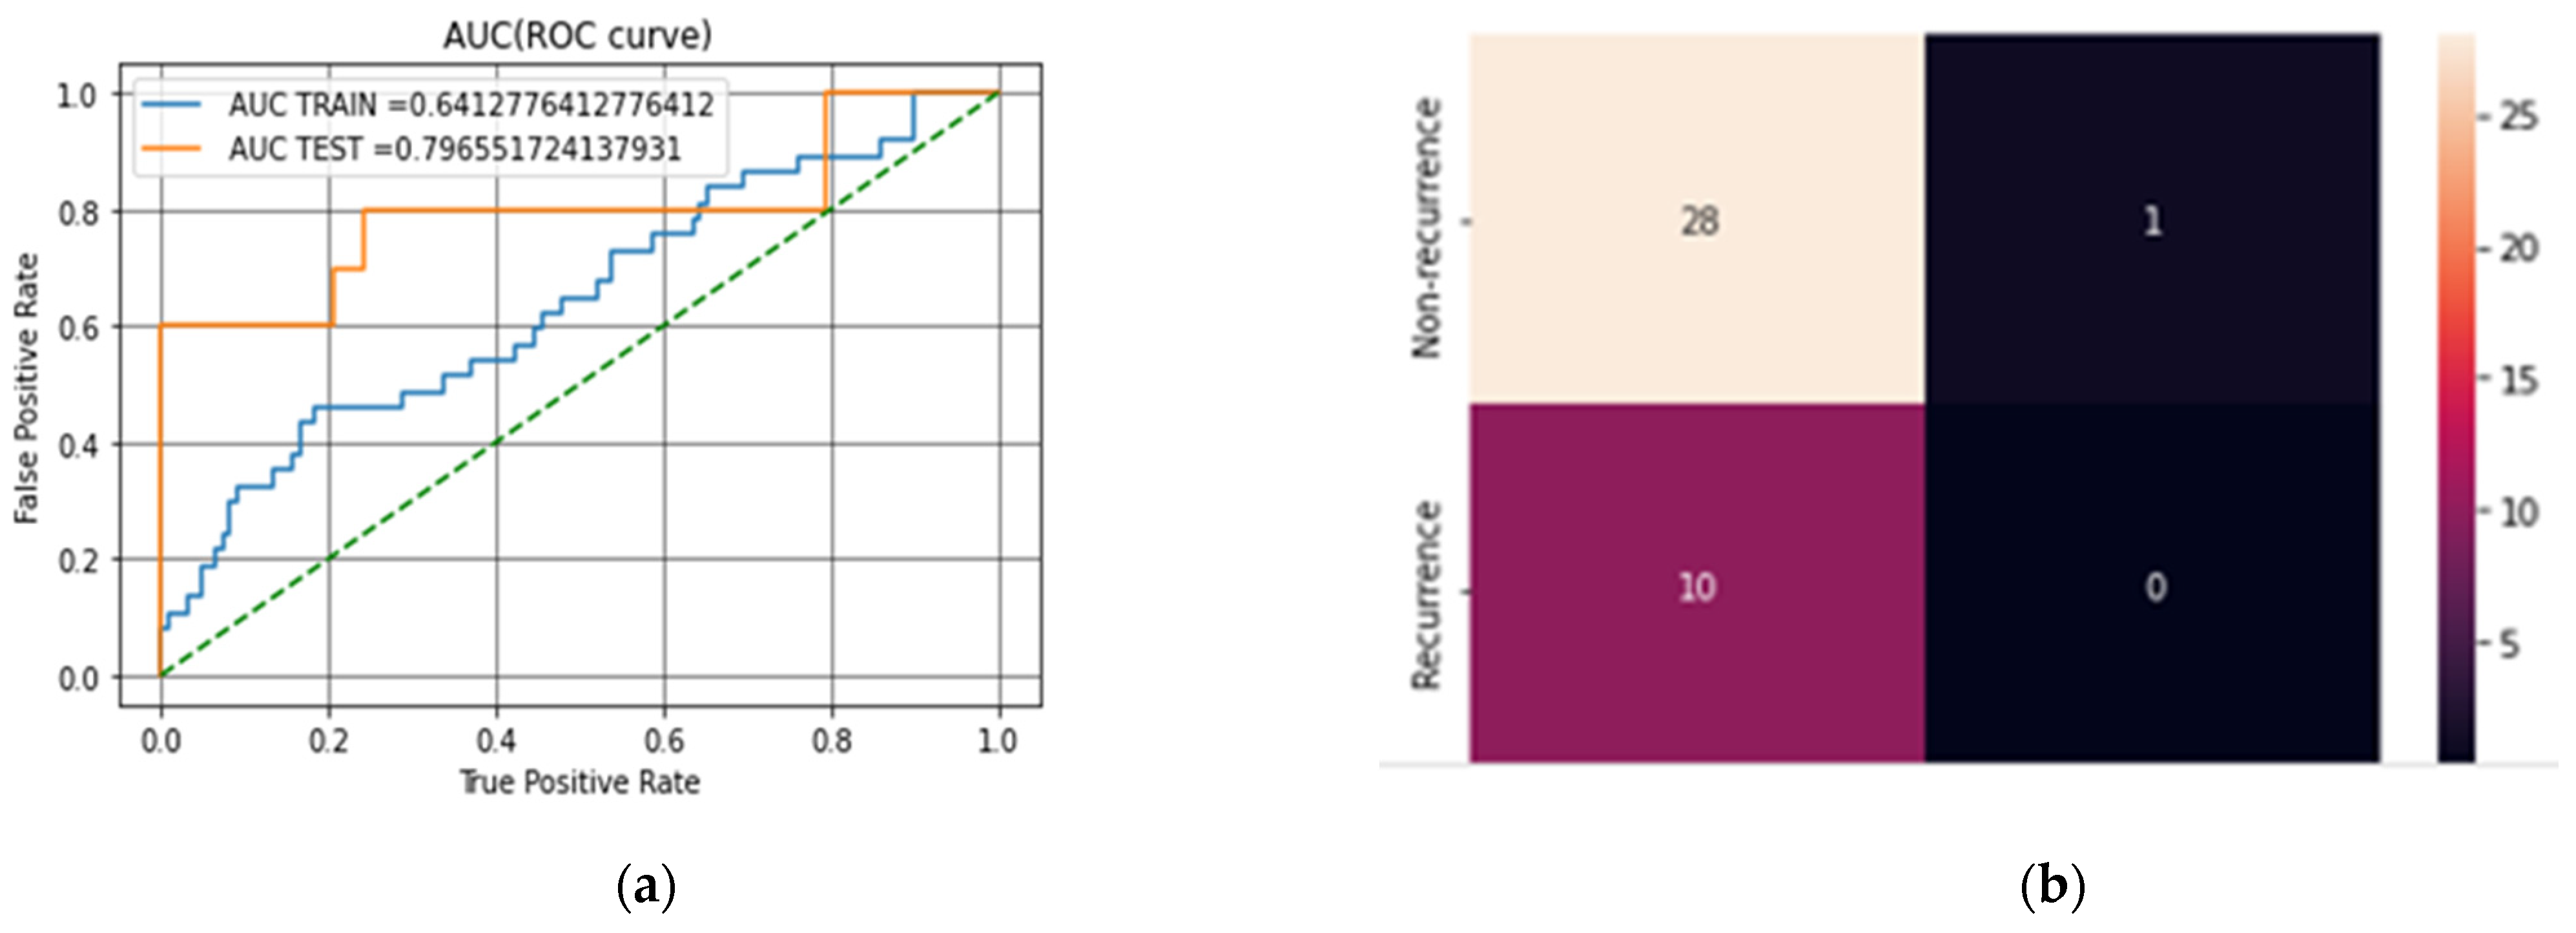
The first classification task was to examine the impact of not applying feature reduction techniques in predicting breast cancer cases. This experiment was conducted without feature extraction on the datasets. Table 3 provides the breakdown of the first experimental results based on the metrics used in evaluating the model. It shows the SVM results without applying feature reduction while using mean and median to compute missing values. Table 4 and Table 5 show the results of applying RF, LDA and PCA to the datasets using mean and median to computing the missing values. Figure 3a,b show the confusion matrix and AUC (ROC curve) for LDA–SVM in the WBCD while Figure 4a,b show the confusion matrix and AUC (ROC curve) for LDA–SVM in the WPBC.
Table 6 shows the performance comparisons of the prediction models on the datasets. Where missing values were imputed using median and mean, the SVM model had an accuracy of 97.1% for mean and 97.8% for median. The PCA–SVM model had an accuracy of 97.8% for mean and 98.5% for median. Notably, the performance for LDA–SVM after imputing the missing values increased to 99.2% for median and 98.5% for mean, an increase of 0.7% from the PCA–SVM model on the WBCD dataset. In our result analysis, the LDA–SVM model also recorded a higher accuracy on the WPBC dataset, 79.5%, when RF was used as a classification technique. LDA as a feature extraction technique outperformed PCA, performing better for breast cancer classification when combined with the median as a method for handling missing values.
Compared with previous results outlined in Table 7, LDA–SVM as a prediction model gave a better performance in terms of accuracy. The aim of the proposed model was achieved when compared with other models in the literature in terms of its high accuracy in predicting breast cancer.
5. Conclusions
The purpose of applying feature extraction techniques is to improve the performance of machine learning algorithms. This research focuses on designing a novel model (LDA–SVM) for breast cancer prediction using linear discriminant analysis for feature extraction and support vector machine classifier on the WDBC (original) and WPBC datasets. The proposed model creates a new dataset based on the extracted features and increased the performance compared with [18]. The result of this work indicates the importance of exploring feature extraction techniques on datasets and also of computing missing values for enhancing prediction accuracy. Additionally, the empirical findings of the study showed the relevance of using medians for computing the missing values in a dataset for breast cancer prediction when compared with [18].
In other words, the importance of using LDA for feature extraction is clearly supported by the current findings. However, this research has raised many questions in need of further investigation:
- What other feature extraction techniques (such as independent component analysis) can further improve the prediction accuracy of the model?
- What could be the performance level of the current model when experimented with other breast cancer datasets (such as the Surveillance, Epidemiology, and End Result (SEER) dataset)?
Further work is needed to establish whether answering these questions could give more significant results.
Author Contributions
Conceptualization, O.J.E. and M.H. (Mohammed Hassan); methodology, O.J.E.; software, O.J.E.; validation, M.H. (Mohamed Hamada), J.J.T. and O.M.O.; formal analysis, J.J.T.; investigation, M.H. (Mohamed Hamada); resources, M.H. (Mohamed Hamada); data curation, O.J.E.; writing—original draft preparation, O.J.E.; writing—review and editing, M.H. (Mohamed Hassan), M.H. (Mohammed Hassan) and J.J.T.; visualization, J.J.T.; supervision, M.H. (Mohamed Hassan); project administration, J.J.T.; funding acquisition, M.H. (Mohamed Hamada). All authors have read and agreed to the published version of the manuscript.
Funding
The research received no extanal funding.
Data Availability Statement
The dataset used in this research is publicly available at the UCI machine learning repository on https://archive.ics.uci.edu/dataset/breast+cancer (assessed on 10 May 2022).
Conflicts of Interest
The authors declare no conflict of interest.
References
- WHO. 2022 Cancer. Available online: https:www.who.int/news-rooms/factsheet/details/cancer (accessed on 2 May 2022).
- Labrèche, F.; Goldberg, M.S.; Hashim, D.; Weiderpass, E. Breast cancer. In Occupational Cancers; Springer: Berlin/Heidelberg, Germany, 2020; pp. 417–438. [Google Scholar] [CrossRef]
- Kumar, V.; Misha, B.K.; Mazzara, M.; Thanh, D.N.; Verma, A. Prediction of malignant and benign breast cancer: A data mining approach in healthcare applications. In Advances in Data Science and Management; Springer: Berlin/Heidelberg, Germany, 2019; pp. 435–442. [Google Scholar]
- Meera, C.; Nalini, D. Breast cancer prediction system using data mining methods. Int. J. Pure Appl. Math. 2018, 119, 10901–10911. [Google Scholar]
- Rathi, M.; Pareek, V. Hybrid approach to predict breast cancer using machine learning techniques. Int. J. Comput. Sci. Eng. 2016, 5, 125–136. [Google Scholar]
- Way, G.P.; Sanchez-Vega, F.; La, K.; Armenia, J.; Chatila, W.K.; Luna, A.; Greene, C.S. Machine Learning Detects Pan-cancer Ras Pathway Activation in The Cancer Genome Atlas. Cell Rep. 2018, 23, 172–180.e3. [Google Scholar] [CrossRef] [PubMed] [Green Version]
- Rajbharath, R.; Sankari, I.; Scholar, P. Predicting breast cancer using random forest and logistic regression. Int. J. Eng. Sci. Comput. 2017, 7, 10708–10813. [Google Scholar]
- Luque, C.; Luna, J.M.; Luque, M.; Ventura, S. An advance review on text mining in medicine. Wiley Interdiscip. Rev. Data Min. Knowl. Discov. 2019, 9, 1302. [Google Scholar] [CrossRef]
- Hassan, M.; Hamada, M. Genetic algorithm for improving prediction accuracy of multi-criteria recommender systems. Int. J. Comput. Intell. Syst. 2018, 11, 146–162. [Google Scholar] [CrossRef] [Green Version]
- Hassan, M.; Hamada, M. Enhancing Learning Objects Recommendation Using Multi-Criteria Recommender Systems. In Proceedings of the 2016 IEEE International Conference on Teaching, Assessment, and Learning for Engineering [TALE], Bangkok, Thailand, 7–9 December 2016; pp. 62–64. [Google Scholar]
- Tanimu, J.J.; Hamada, M.; Hassan, M.; Yusuf, S.I. A contemporary machine learning method for accurate prediction of cervical cancer. In Proceedings of the 3rd ETLT 2021. ACM International Conference on Information and Communication Technology, Aizu, Japan, 27–30 January 2021; p. 04004. [Google Scholar]
- Abba, A.H.; Hassan, M. Design and Implementation of a CSV Validation System. In Proceedings of the 3rd international Conference on Applications in information Technology, Wakamatsu, Japan, 1–3 November 2018; pp. 111–116. [Google Scholar]
- Osianwo, F.Y.; Akinsola, J.E.T.; Awodele, O.; Hinimikaiye, J.O.; Olakanmi, O.; Akiniobi, J. Supervised machine learning algorithm: Classification and comparisiom. Int. J. Comput. Trends Technol. 2017, 3, 128–138. [Google Scholar] [CrossRef]
- Hassan, M.; Hamada, M. A computational model for improving the accuracy of multi-criteria recommender systems. In Proceedings of the 2017 IEEE 11th International Symposium of Embedded Multicore/Many-core Systems-on-chip (MCSoc), Seoul, Korea, 18–20 September 2017; pp. 114–119. [Google Scholar]
- Huang, M.W.; Chen, C.W.; Lin, W.C.; Ke, S.W.; Tsai, C.F. Svm and Svm ensembles in breast cancer prediction. PLoS ONE 2017, 12, e0161501. [Google Scholar] [CrossRef]
- Bazazeh, D.; Shubair, R. Comparative study of machine learning algorithms for breast cancer detection and diagnosis. In Proceedings of the 2017 International Conference on Electronic Devices, Systems, and Applications, Kuching, Malaysia, 7–8 August 2017; pp. 2–5. [Google Scholar] [CrossRef]
- Agarap, A.F.M. On Breast cancer detection: An application of machine learning algorithms on the Wisconsin diagnostic dataset. In Proceedings of the 2nd International Conference on Machine Learning and Soft Computing, Phu Quoc Island, Vietnam, 2–4 February 2018; pp. 5–9. [Google Scholar] [CrossRef] [Green Version]
- Elgedawy, M. Prediction of breast cancer using random forest, support vector machines and naïve Bayes. Int. J. Eng. Comput. Sci. 2017, 6, 19884–199889. [Google Scholar] [CrossRef]
- Wang, H.; Yoon, S.W. Breast Cancer Prediction Using Data Mining Method. In Proceedings of the IIE Annual Conference Proceedings, Institute of Industrial and System Engineers (IISE), New Orleans, LA, USA, 30 May–2 June 2015; p. 818. [Google Scholar]
- Sivakami, K.; Saraswathi, N. Mining big data: Breast cancer prediction using DT-SVM hybrid model. Int. J. Sci. Eng. Appl. Sci. 2015, 1, 418–429. [Google Scholar]
- Jessica, E.O.; Hamada, M.; Yusuf, S.I.; Hassan, M. The Role of Linear Discriminant Analysis for Accurate Prediction of Breast Cancer. In Proceedings of the 2021 IEEE 14th International Symposium of Embedded Multicore/Many-core Systems-on-chip (MCSoc), Singapore, 20–23 December 2021; pp. 340–344. [Google Scholar] [CrossRef]
- Boeri, C.; Chiappa, C.; Galli, F.; de Berardinis, V.; Bardelli, L.; Carcano, G.; Rovera, F. Machine learning techniques in breast cancer prognosis prediction: A primary evaluation. Cancer Med. 2020, 9, 3234–3243. [Google Scholar] [CrossRef] [PubMed]
- Khourdifi, Y. Applying Best Machine Learning Algorithms for Breast Cancer Prediction and Classification. In Proceedings of the 2018 International Conference on Electronics, Control, Optimization and Computer Science (ICECOCS), Kenitra, Morocco, 5–6 December 2018; pp. 1–5. [Google Scholar]
- Chaurasia, V.; Pal, S.; Tiwari, B.B. Prediction of benign and malignant breast cancer using data mining techniques. J. Algorithms Comput. Technol. 2018, 12, 119–126. [Google Scholar] [CrossRef] [Green Version]
- Kumar Mandal, S. Performance Analysis Of Data Mining Algorithms For Breast Cancer Cell Detection Using Naïve Bayes, Logistic Regression and Decision Tree. Int. J. Eng. Comput. Sci. 2017, 6, 2319–7242. [Google Scholar] [CrossRef]
- Asri, H.; Mousannnif, H.; al Moatassime, H.; Noel, T. Using machine learning algorithms for breast cancer risk prediction and diagnosis. Procedia Comput. Sci. 2016, 83, 1064–1069. [Google Scholar] [CrossRef] [Green Version]
- Ricciardi, C.; Valente, S.A.; Edmund, K.; Cantoni, V.; Green, R.; Fiorillo, A.; Picone, I.; Santini, S.; Cesarelli, M. Linear discriminant analysis and principal component analysis to predict coronary artery disease. Health Inform. J. 2020, 26, 2181–2192. [Google Scholar] [CrossRef] [Green Version]
- Gupta, S.; Gupta, M.K. A Comparative Study of Breast Cancer Diagnosis Using Supervised Machine Learning Techniques. In Proceedings of the 2nd International Conference on Computing Methodologies and Communication (ICCMC 2018), Erode, India, 15–16 February 2018; IEEE: Piscataway, NJ, USA, 2018; pp. 997–1002. [Google Scholar] [CrossRef]
- Zheng, B.; Yoon, S.W.; Lam, S.S. Breast cancer diagnosis based on feature extraction using a hybrid of k-mean and support vector machine algorithms. Experts Syst. Appl. 2014, 41, 1476–1482. [Google Scholar] [CrossRef]
- Wu, J.; Hicks, C. Breast Cancer Type Classification Using Machine Learning. J. Pers. Med. 2021, 11, 61. [Google Scholar] [CrossRef]
- Lichman, M.; Bache, K. Uci Machine Learning Repository, 2013. UCI Machine Learning Repositry [Online]. 2013. Available online: https://archive.ics.uci.edu/ (accessed on 10 May 2022).
- Senapti, R.; Shaw, K.; Mishra, S.; Mishra, D. A novel approach for missing value imputation and classification of microarray dataset. Procedia Eng. 2012, 38, 1067–1071. [Google Scholar] [CrossRef] [Green Version]
- Tanimu, J.J.; Hamada, M.; Hassan, M.; Kakudi, H.; Abiodun, J.O. A machine learning method for classification of cervical cancer. Electronics 2022, 11, 463. [Google Scholar] [CrossRef]
- Garciarena, U.; Santana, R. An extensive analysis of the interaction between missing data types imputation methods and supervised classifiers. Expert Syst. Appl. 2017, 89, 52–65. [Google Scholar] [CrossRef]
- Jollife, I.T.; Cadima, J. Principal component analysis: A review and recent developments. Philos. Trans. R. Soc. A Math. Phys. Eng. Sci. 2016, 374, 2065. [Google Scholar] [CrossRef] [PubMed]
- Tharwat, T.; Gaber, A.; Ibrahim, A.; Hassanien, E. Linear discriminant analysis: A detailed tutorial. AI Commun. 2017, 30, 169–190. [Google Scholar] [CrossRef] [Green Version]
- Hamada, M.; Tanimu, J.J.; Hassan, M.; Kakudi, H.A.; Robert, P. Evaluation of recursive feature elimination and Lasso regulirization-based optimized feature selection approach for cervical cancer prediction. In Proceedings of the 2021 IEEE 14th International Symposium of Embedded Multicore/Many-core Systems-on-chip (MCSoc), Singapore, 20–23 December 2021; pp. 333–339. [Google Scholar] [CrossRef]
- Vabalas, A.; Gowen, E.; Poliakoff, E.; Casson, A.J. Machine learning algorithms validation with a limited sample size. PLoS ONE 2019, 14, e0224365. [Google Scholar] [CrossRef] [PubMed]
Figure 2.
The architecture of the model.

Figure 3.
(a) The AUC (ROC curve) for LDA–SVM on the WBCD. (b) The confusion matrix for LDA–SVM on the WBCD.
Figure 3.
(a) The AUC (ROC curve) for LDA–SVM on the WBCD. (b) The confusion matrix for LDA–SVM on the WBCD.

Figure 4.
(a) The AUC (ROC curve) for LDA–SVM on the WPBC dataset. (b) The confusion matrix for LDA–SVM on the WPBC dataset.
Figure 4.
(a) The AUC (ROC curve) for LDA–SVM on the WPBC dataset. (b) The confusion matrix for LDA–SVM on the WPBC dataset.


Table 1.
Attributes taken from the WDBC dataset.
| S/N | Attribute | Domain |
|---|---|---|
| 1 | Clump thickness | 1–10 |
| 2 | Uniformity of cell size | 1–10 |
| 3 | Uniformity of cell shape | 1–10 |
| 4 | Marginal Adhesion | 1–10 |
| 5 | Single Epithelial cell | 1–10 |
| 6 | Bare Nuclei | 1–10 |
| 7 | Bland Chromatin | 1–10 |
| 8 | Normal Nucleoli | 1–10 |
| 9 | Mitoses | 1–10 |
| 10 | Class | 2 for benign 4 for malignant |
Table 2.
Attribute taken from the WPBC dataset.
| S/N | Attributes |
|---|---|
| 1 | Outcome (N = non-recurrence R = recurrence) |
| 2 | Radius |
| 3 | Texture |
| 4 | Perimeter |
| 5 | Area |
| 6 | Smoothness |
| 7 | Compactness |
| 8 | Concavity |
| 9 | Concave point |
| 10 | Symmetry |
| 11 | Factual dimension |
| 12 | Tumor size |
| 13 | Lymph node |
Table 3.
SVM performance with means and medians.
| SVM Performance | ||
|---|---|---|
| Mean | Median | |
| Accuracy | 97.1% | 97.8% |
| Recall | 97.0% | 98.0% |
| Precision | 97.0% | 97.0% |
Table 4.
The means and medians using LDA–SVM, RF–LDA, RF–PCA and PCA–SVM on the WBCD dataset.
| WBCD Dataset | ||||||
|---|---|---|---|---|---|---|
| Mean method | Median method | |||||
| Classifier | Accuracy | Precision | Recall | Accuracy | Precision | Recall |
| PCA-SVM | 97.8% | 98.0% | 98.0% | 98.5% | 98.0% | 99.0% |
| LDA–SVM | 98.5% | 98.0% | 98.0% | 99.2% | 98.0% | 99.0% |
| RF-LDA | 94.9% | 93.0% | 96.0% | 96.4% | 96.0% | 97.0% |
| RF-PCA | 97.5% | 97.0% | 97.0% | 98.5% | 97.0% | 97.0% |
Table 5.
The means and medians using LDA–SVM, RF–LDA, RF–PCA and PCA–SVM on the WPBD dataset.
| WBCD Dataset | ||||||
|---|---|---|---|---|---|---|
| Mean method | Median method | |||||
| Classifier | Accuracy | Precision | Recall | Accuracy | Precision | Recall |
| SVM | 71.7% | 52.0% | 71.0% | 73.4% | 59.0% | 61.0% |
| LDA–SVM | 76.5% | 59.0% | 76.0% | 79.5% | 63.00% | 78.0% |
| PCA–SVM | 74.5% | 59.0% | 76.0 | 75.2% | 61.0% | 74.0% |
| RF–LDA | 71.7% | 66.0% | 72.0% | 76.9% | 73.0% | 77.0% |
| RF–PCA | 73.8% | 54.0% | 71.0% | 74.5% | 59.0% | 73.0% |
Table 6.
The results using the model and methods on the WBCD and WPBC datasets.
| WPBC Datasets | WBCD Dataset | |||||||||||
|---|---|---|---|---|---|---|---|---|---|---|---|---|
| Mean Method | Median Method | Mean Method | Median Method | |||||||||
| Classifier | Accuracy | precision | Recall | Accuracy | Precision | Recall | Accuracy | Precision | Recall | Accuracy | Precision | Recall |
| SVM | 71.7% | 52.0.0% | 71.0% | 73.4% | 59.0% | 72.0% | 97.1.4% | 97.0% | 97.0% | 97.8% | 98.0% | 97.0% |
| PCASVM | 74.5% | 54.0% | 74.0% | 75.2% | 61.0% | 74.0% | 97.8.2% | 98.0% | 98.0% | 98.5% | 98.0% | 98.0% |
| LDASVM | 76.5% | 59.0% | 76.0% | 79.5% | 63.0% | 78.0% | 98.5% | 98.0% | 98.0% | 99.2% | 98.0% | 99.0% |
Publisher’s Note: MDPI stays neutral with regard to jurisdictional claims in published maps and institutional affiliations. |
© 2022 by the authors. Licensee MDPI, Basel, Switzerland. This article is an open access article distributed under the terms and conditions of the Creative Commons Attribution (CC BY) license (https://creativecommons.org/licenses/by/4.0/).
Share and Cite
MDPI and ACS Style
Egwom, O.J.; Hassan, M.; Tanimu, J.J.; Hamada, M.; Ogar, O.M. An LDA–SVM Machine Learning Model for Breast Cancer Classification. BioMedInformatics 2022, 2, 345-358. https://0-doi-org.brum.beds.ac.uk/10.3390/biomedinformatics2030022
AMA Style
Egwom OJ, Hassan M, Tanimu JJ, Hamada M, Ogar OM. An LDA–SVM Machine Learning Model for Breast Cancer Classification. BioMedInformatics. 2022; 2(3):345-358. https://0-doi-org.brum.beds.ac.uk/10.3390/biomedinformatics2030022
Chicago/Turabian StyleEgwom, Onyinyechi Jessica, Mohammed Hassan, Jesse Jeremiah Tanimu, Mohammed Hamada, and Oko Michael Ogar. 2022. "An LDA–SVM Machine Learning Model for Breast Cancer Classification" BioMedInformatics 2, no. 3: 345-358. https://0-doi-org.brum.beds.ac.uk/10.3390/biomedinformatics2030022