Bioinspired Honeycomb Core Design: An Experimental Study of the Role of Corner Radius, Coping and Interface

 ,
,
Abstract
:
1. Introduction
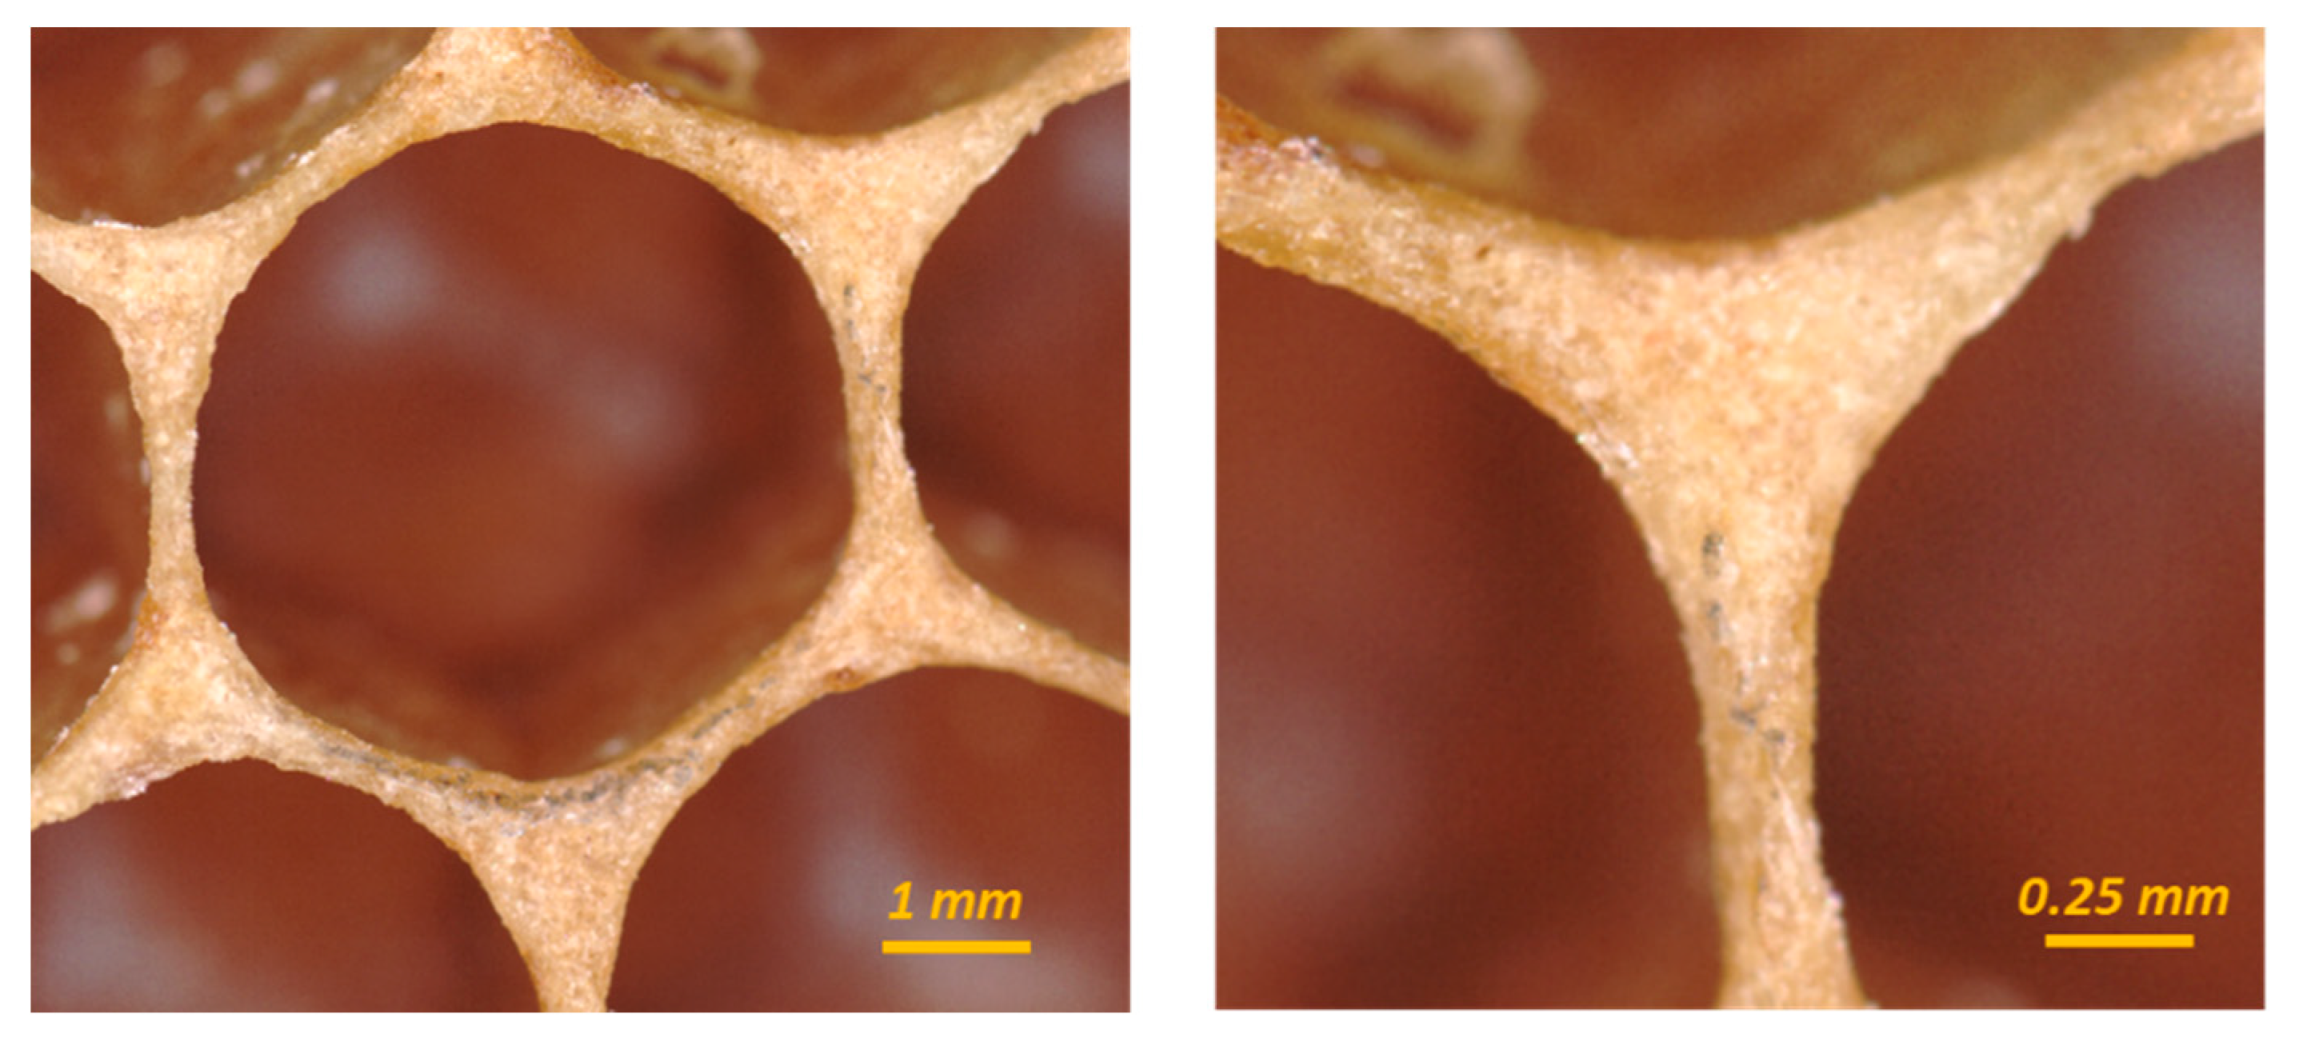
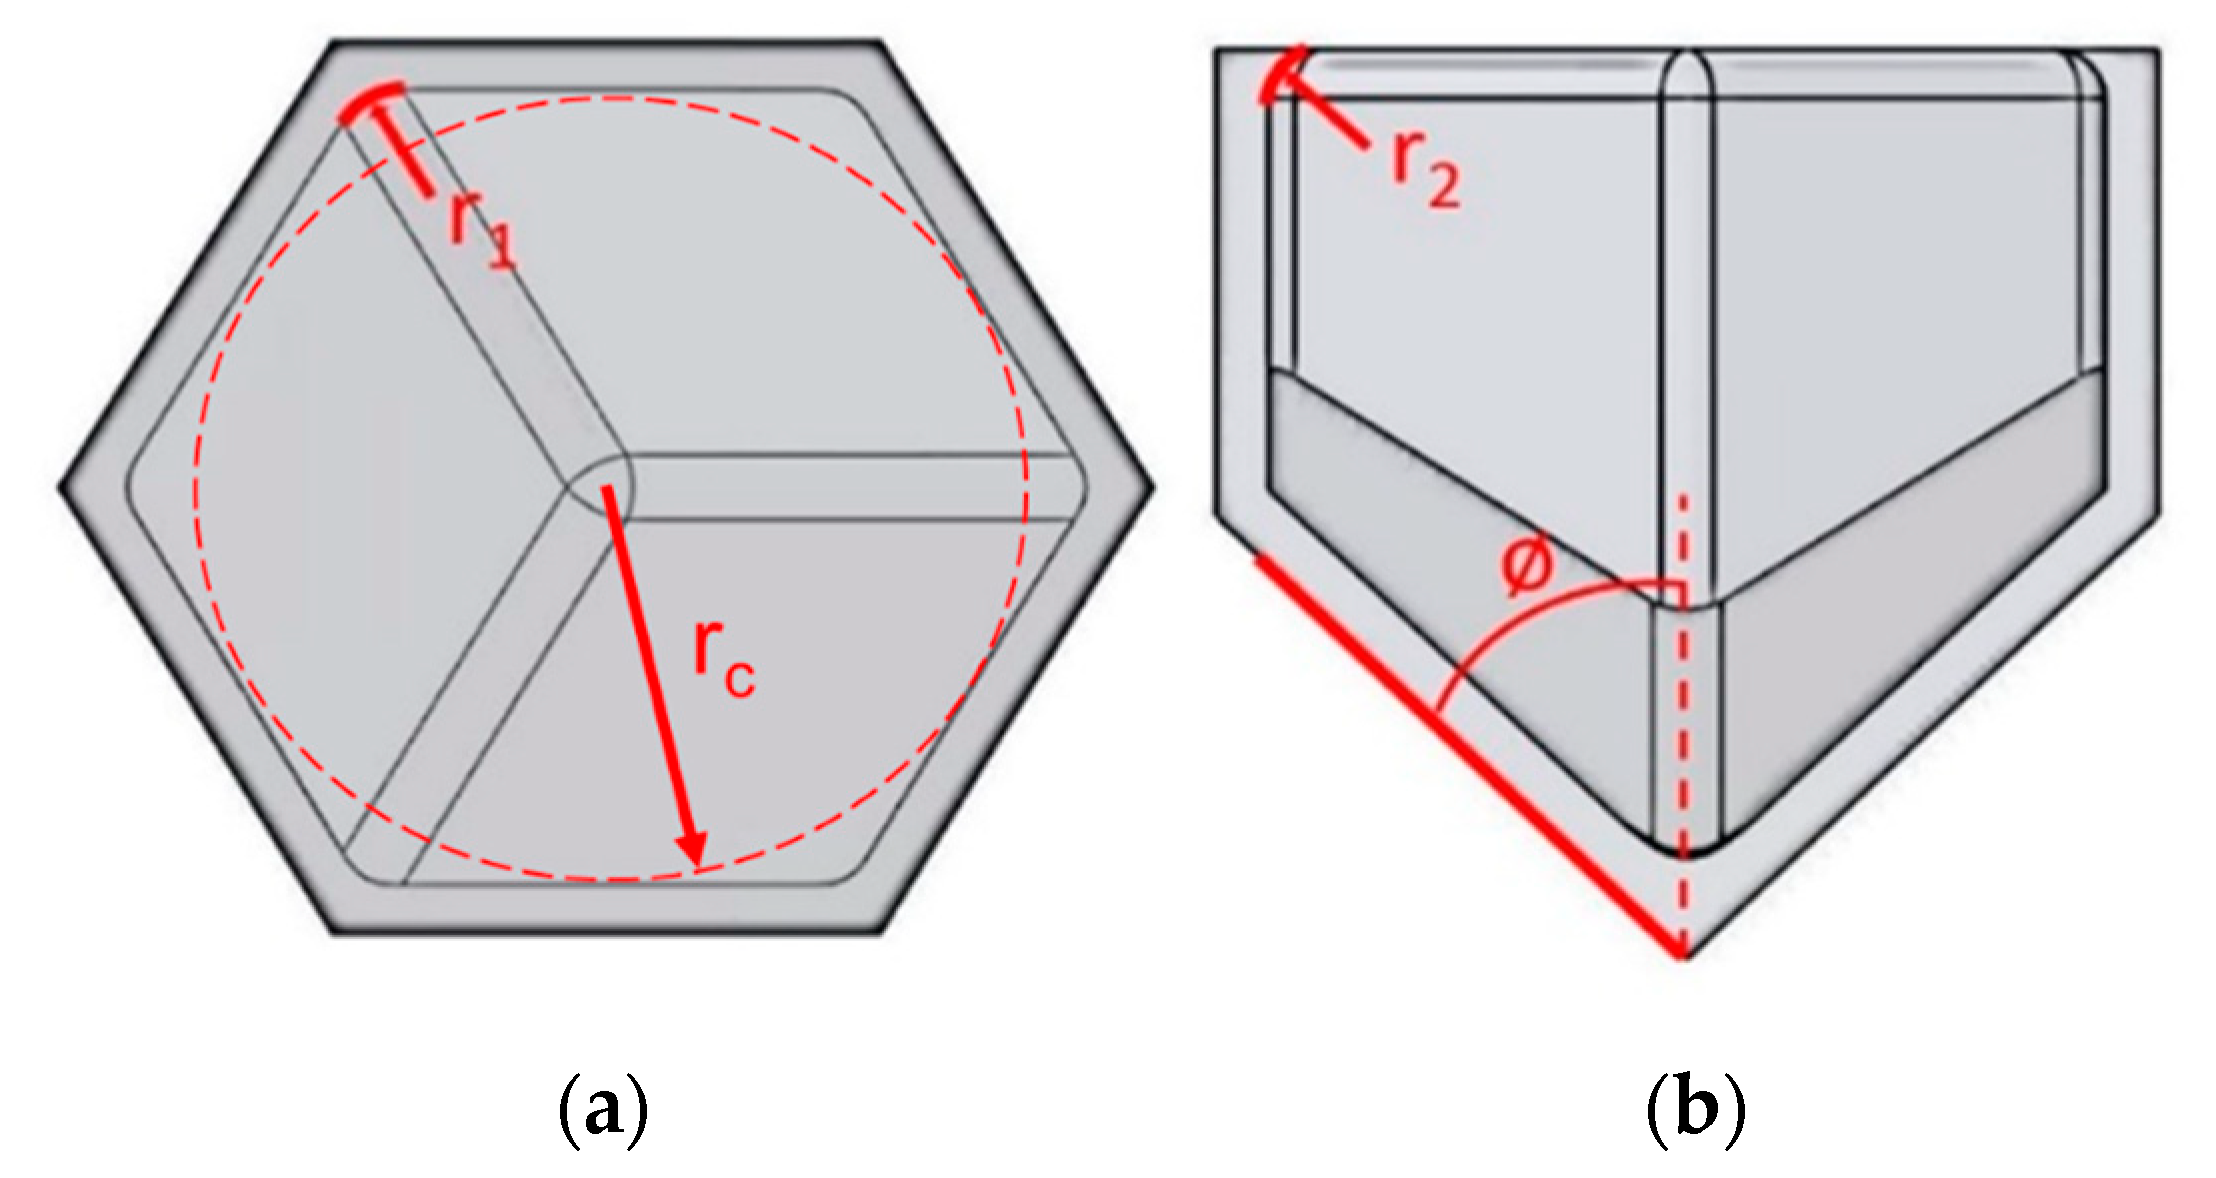
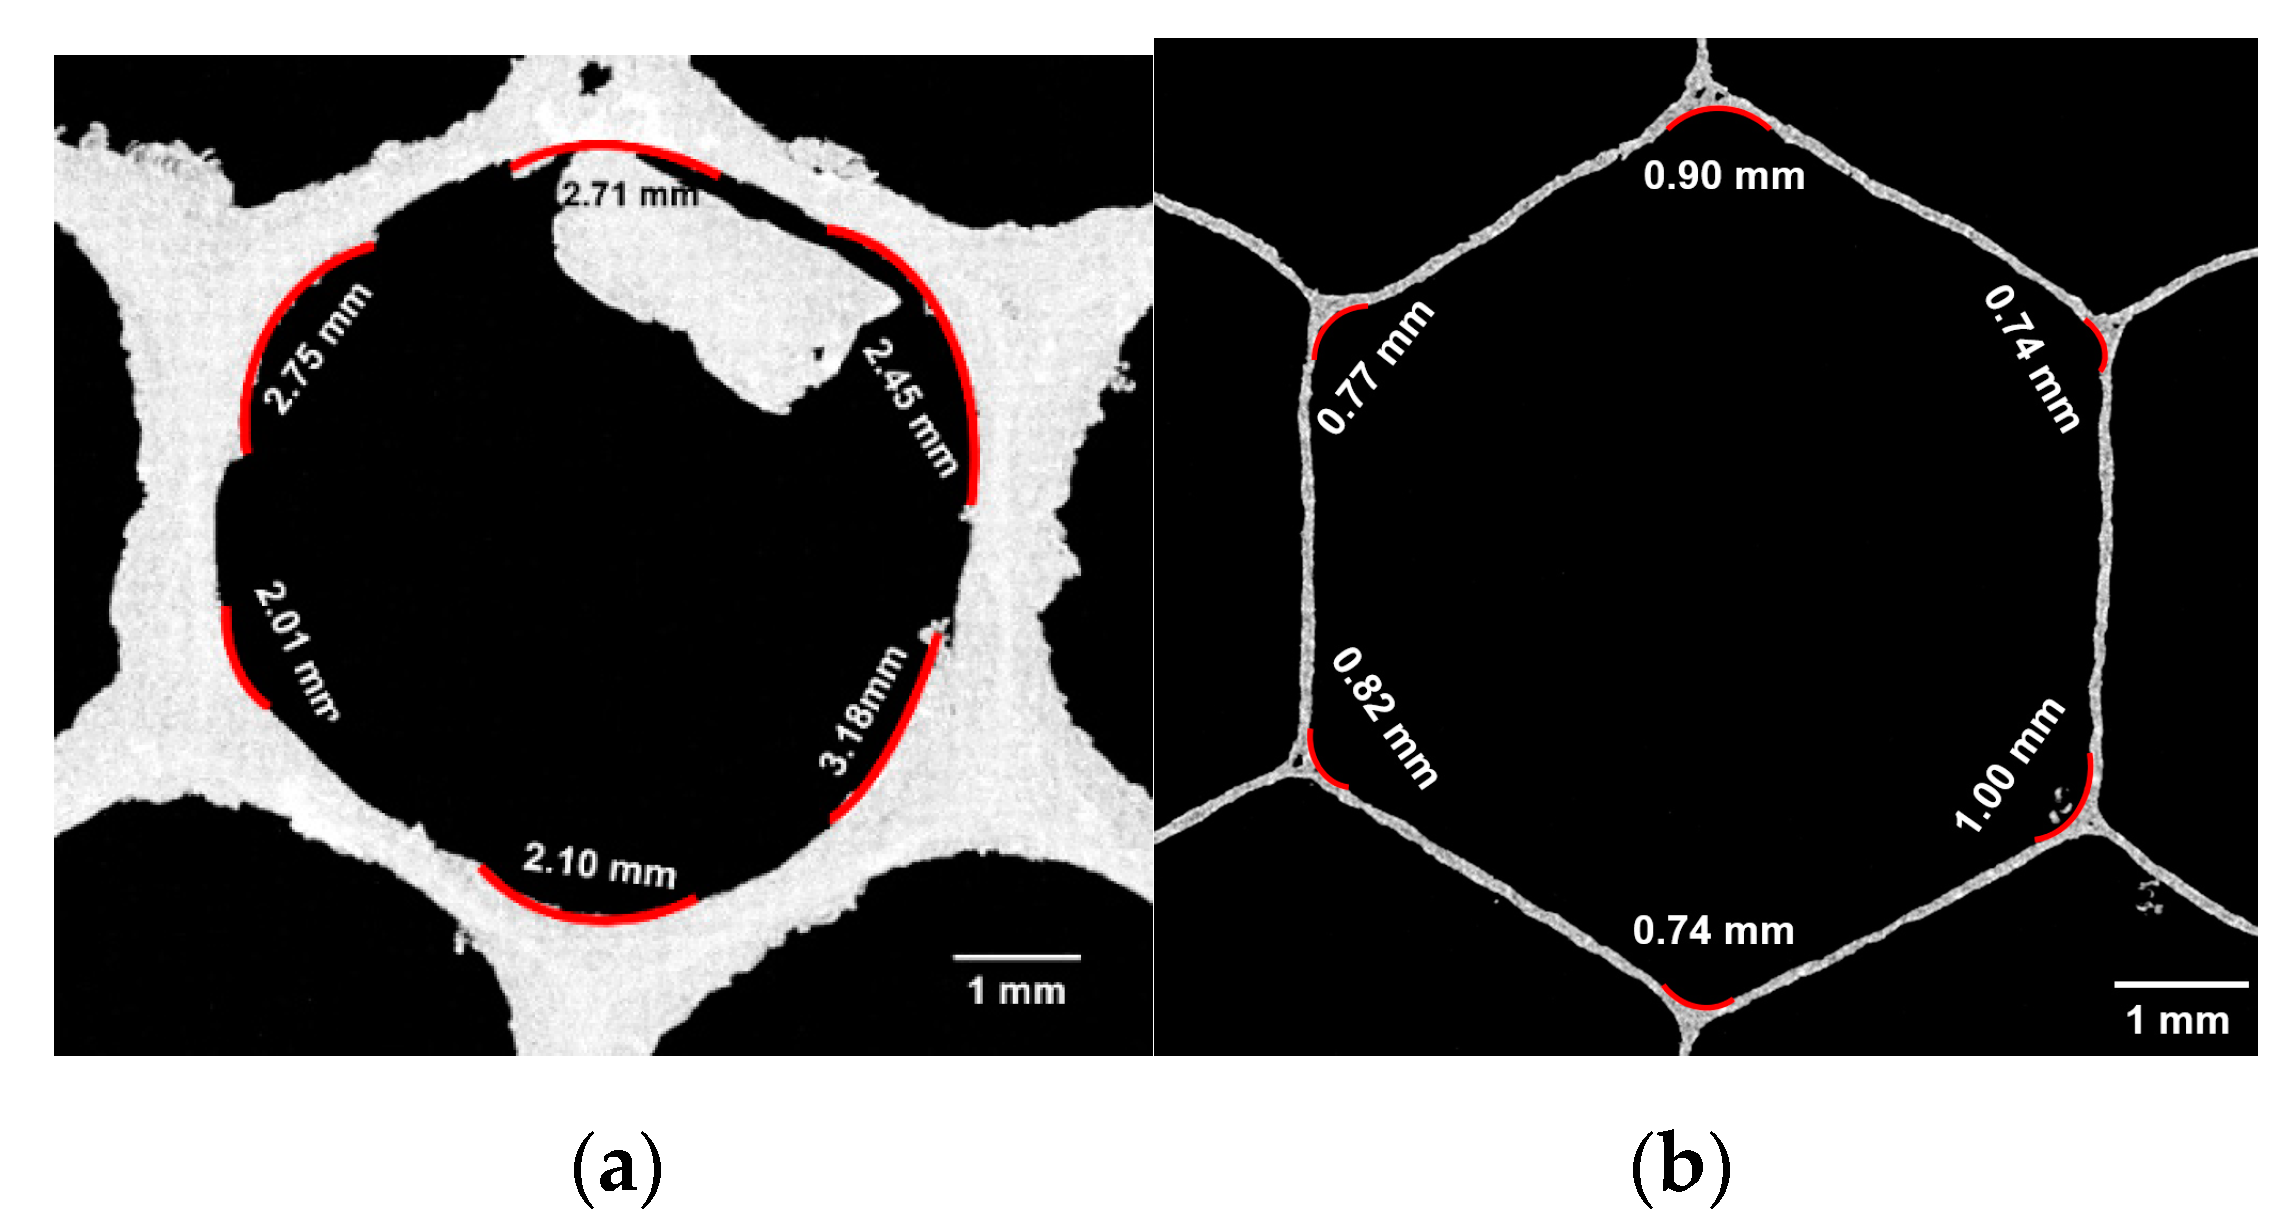
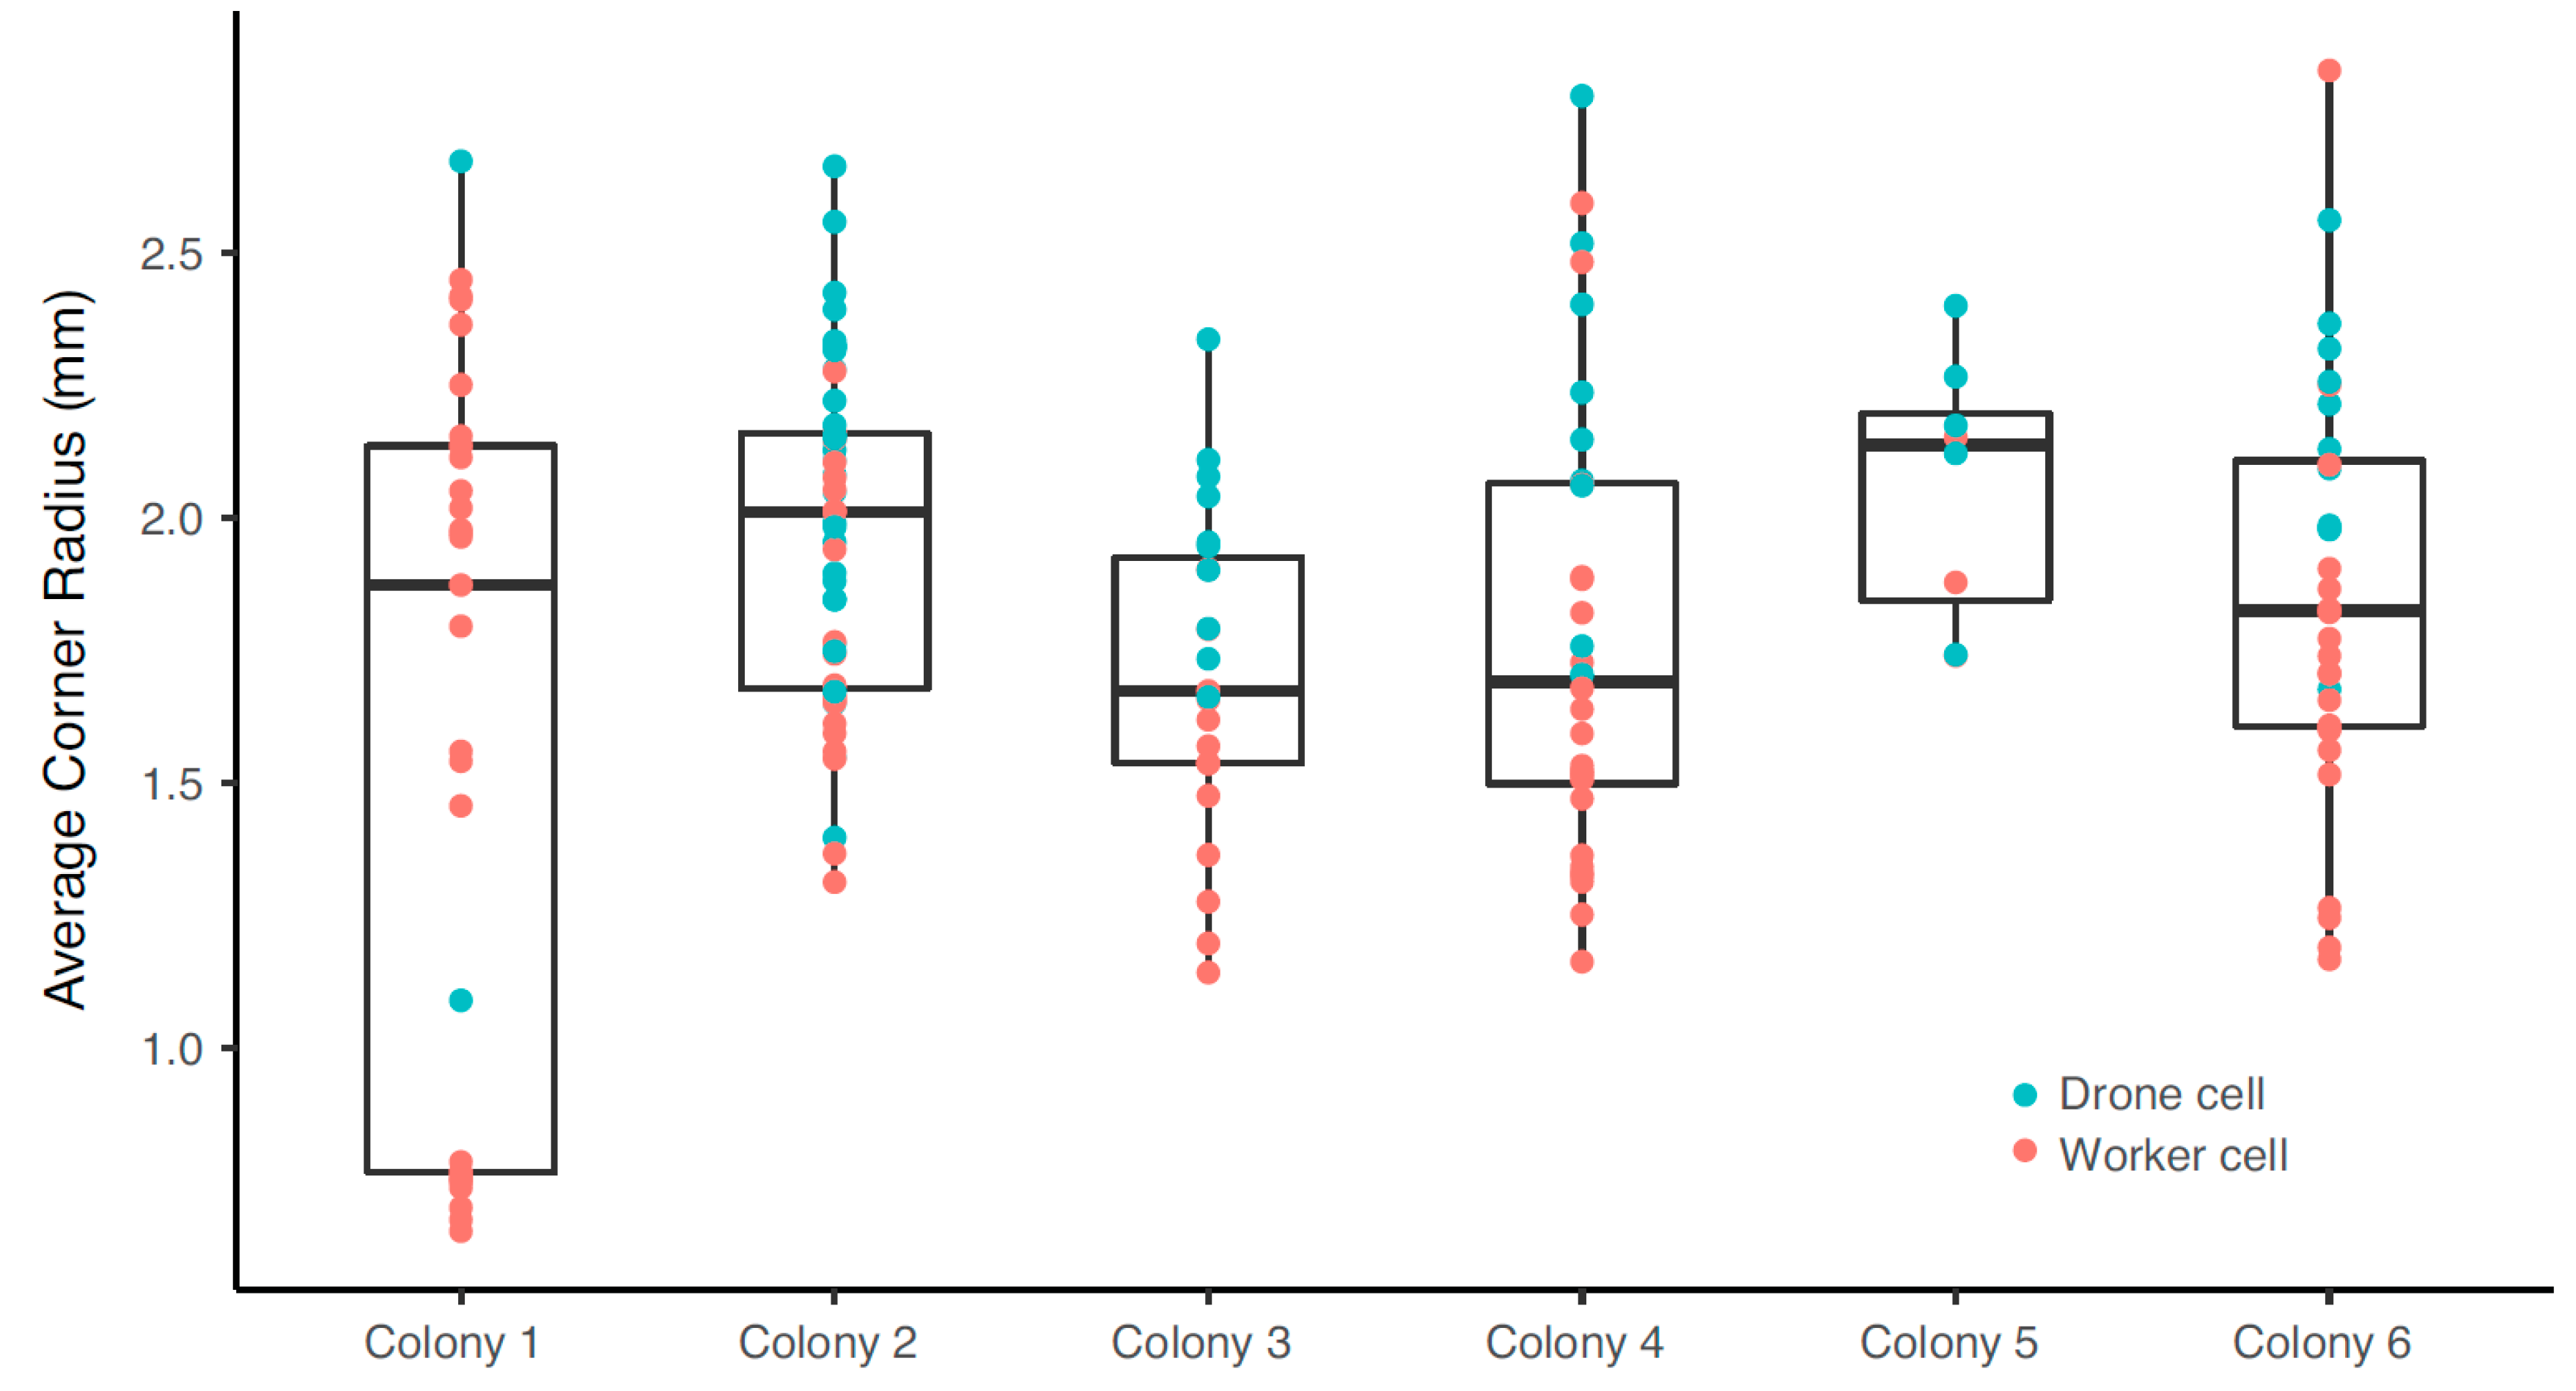
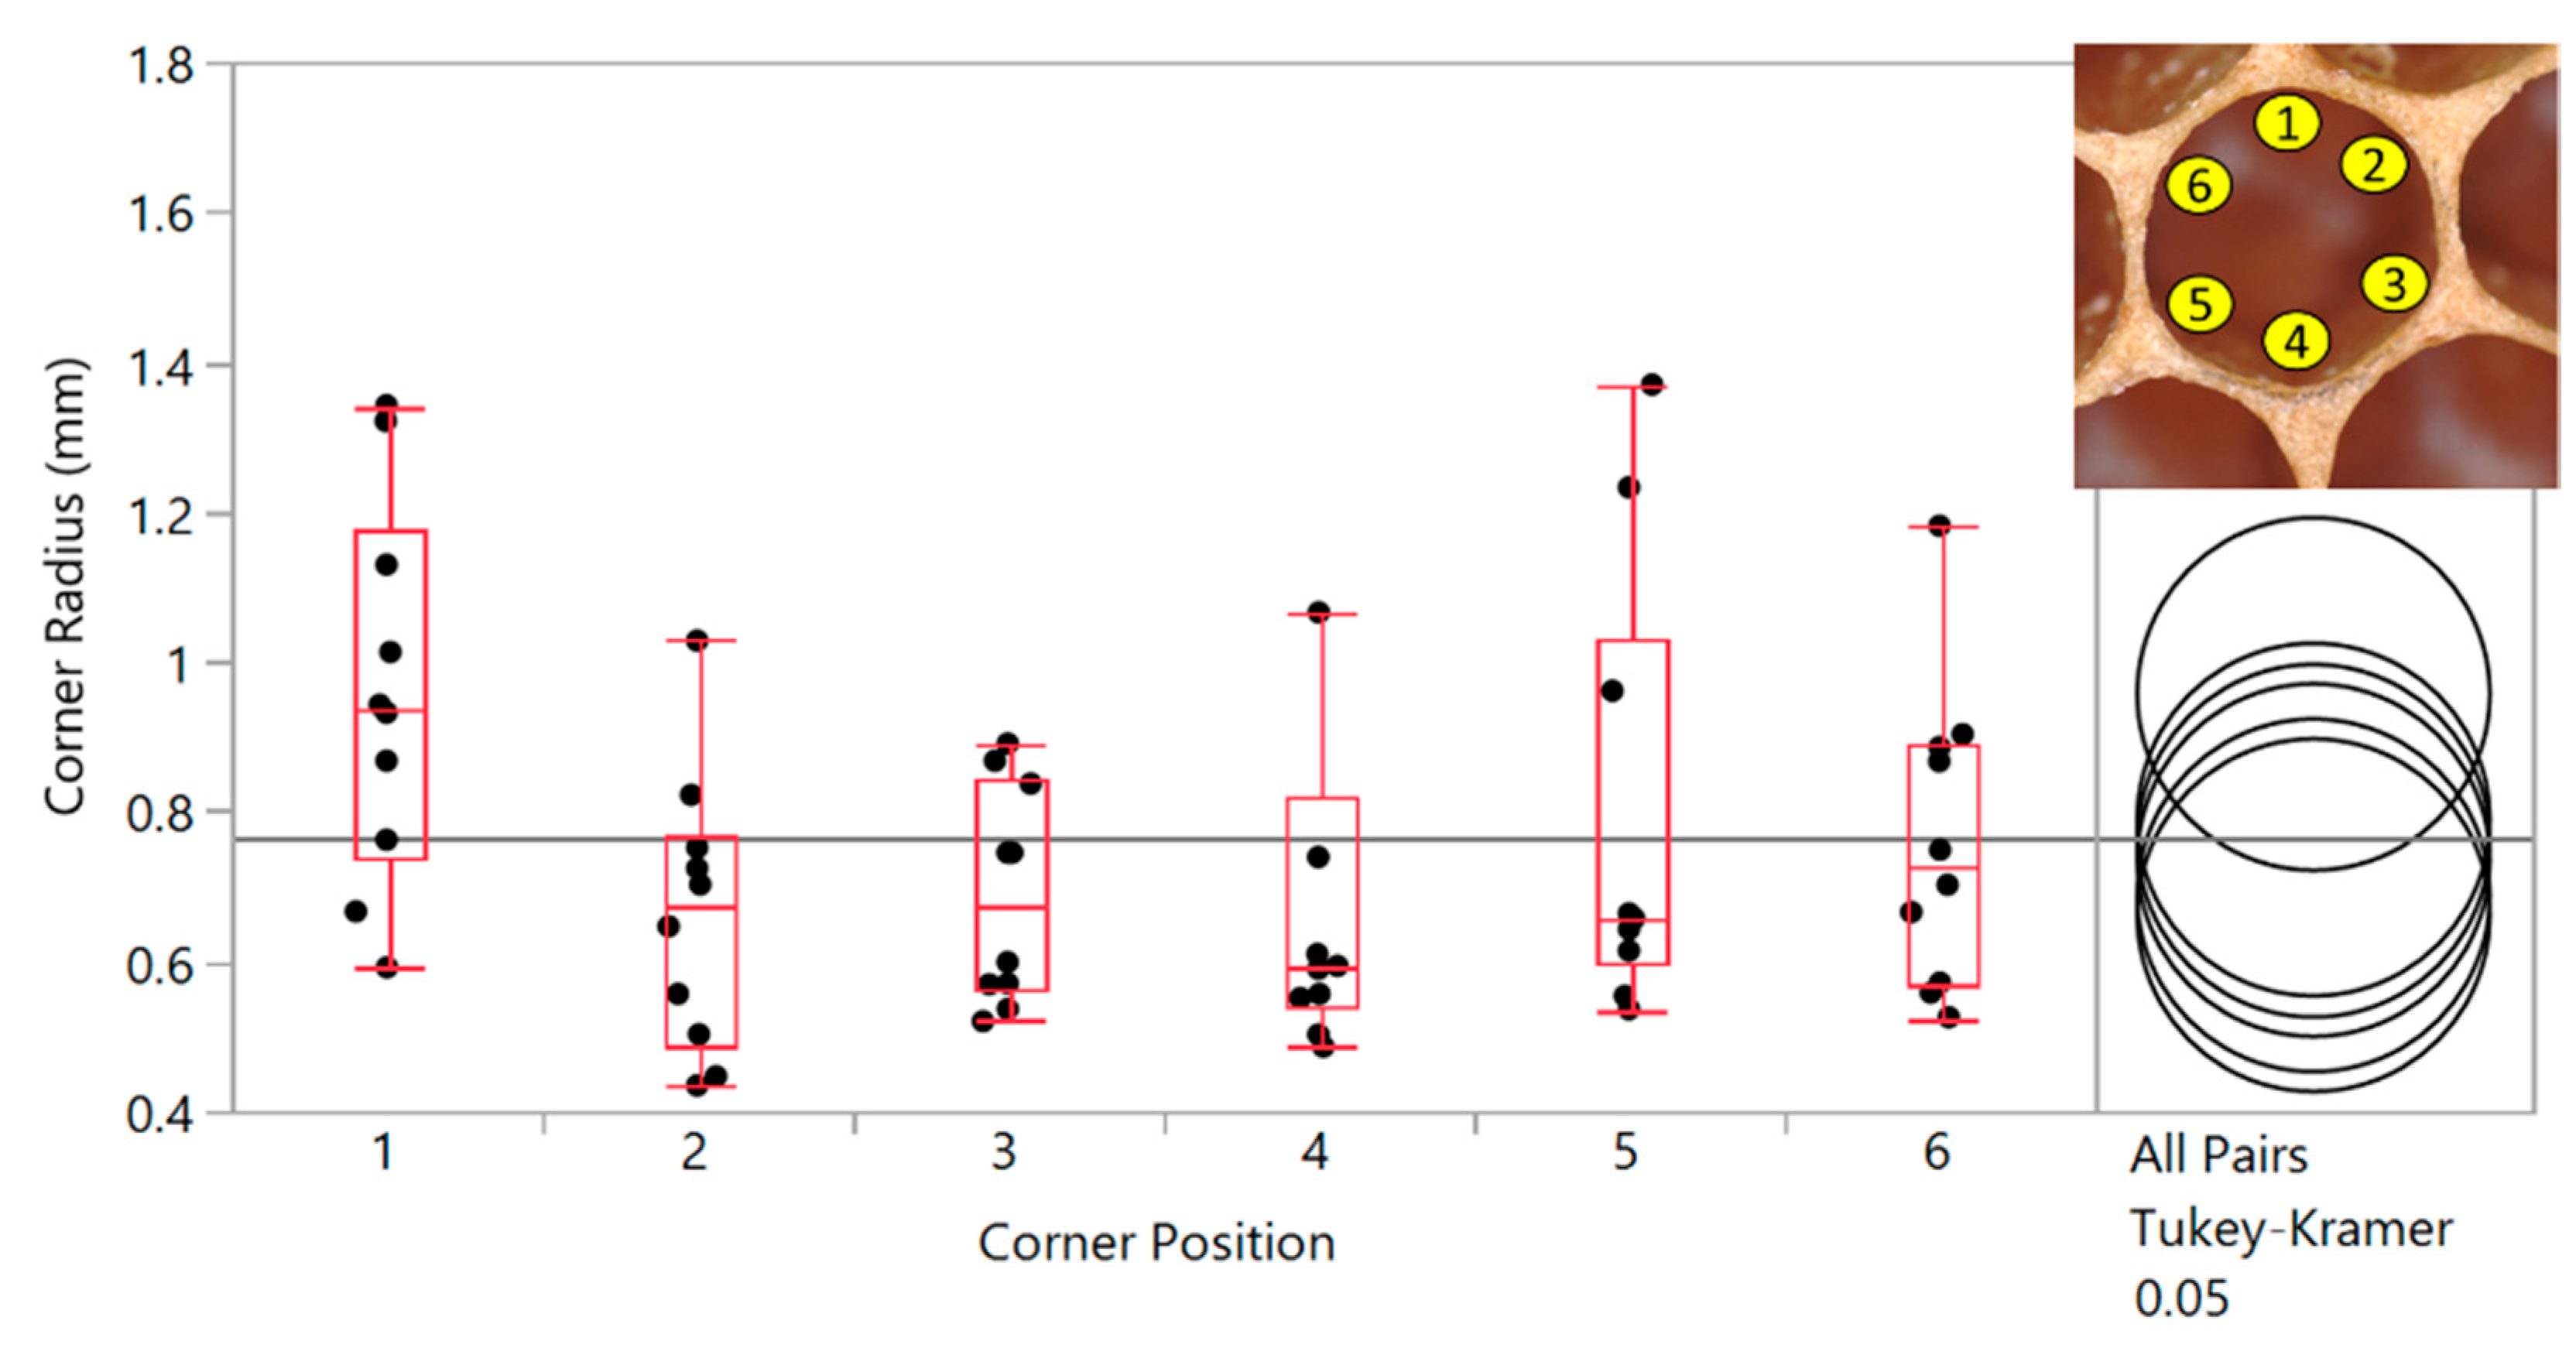
1.1. Corner Radius
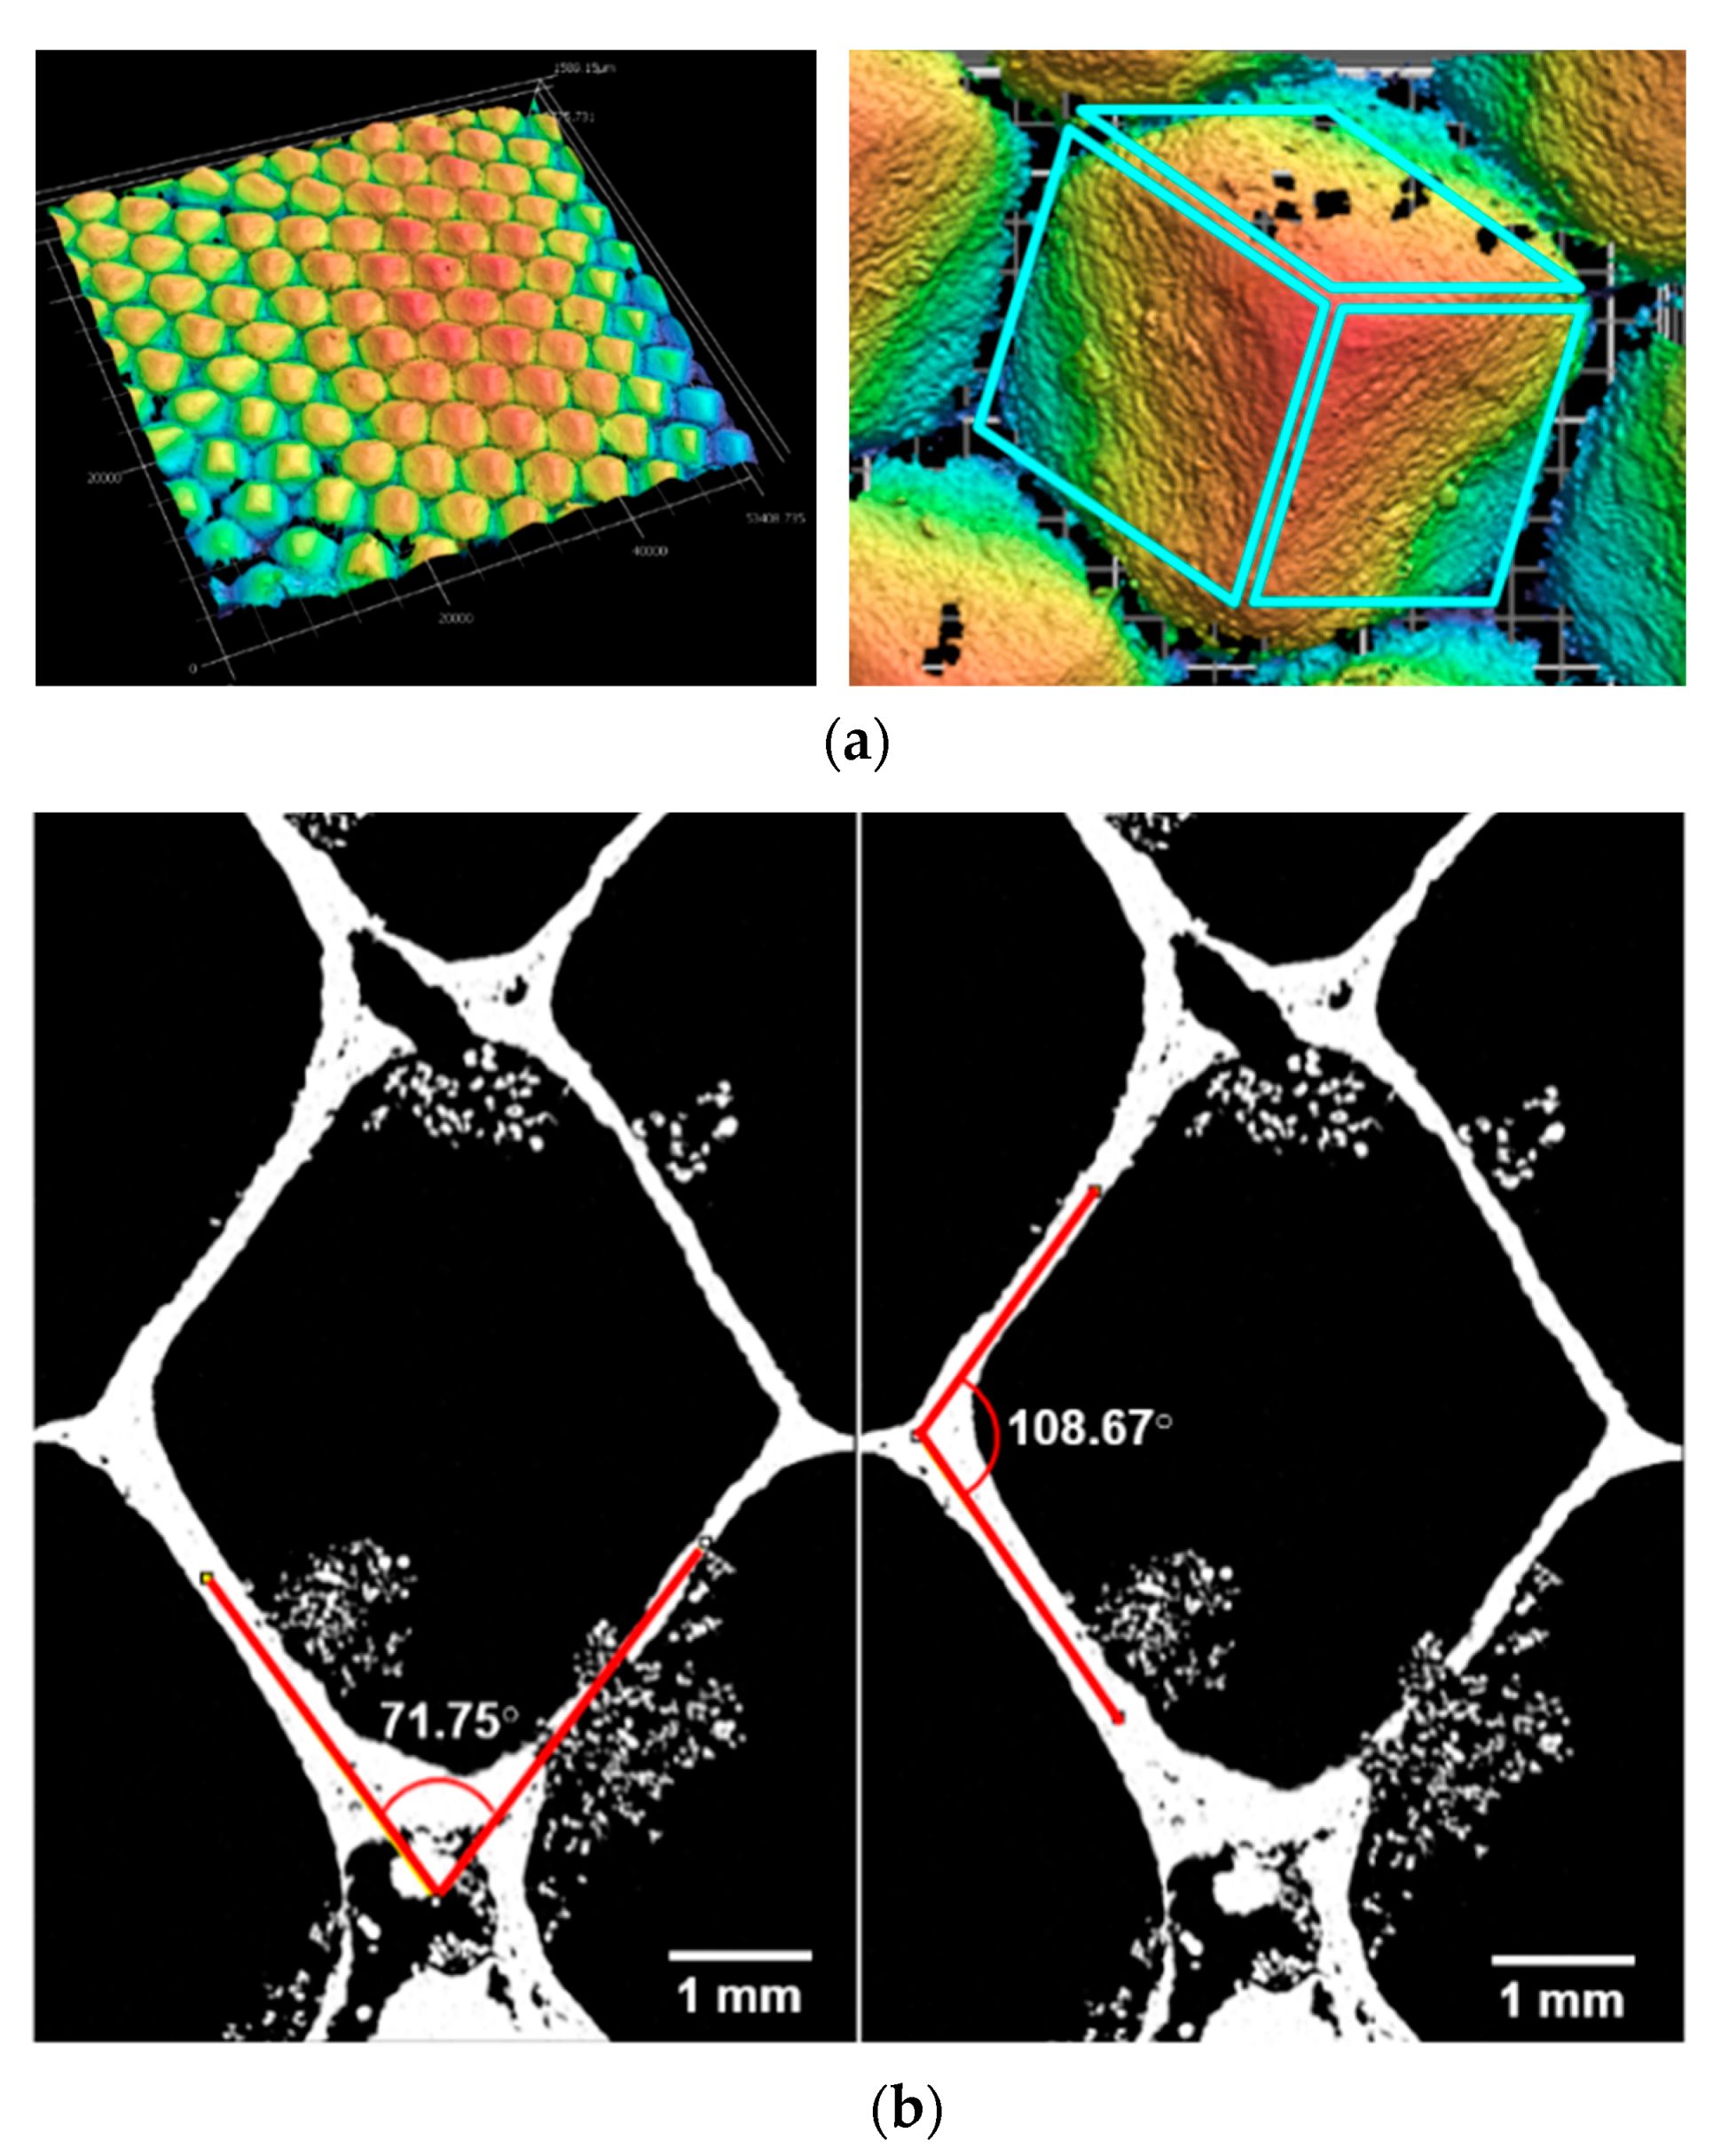
1.2. Coping
1.3. Interface
2. Materials and Methods
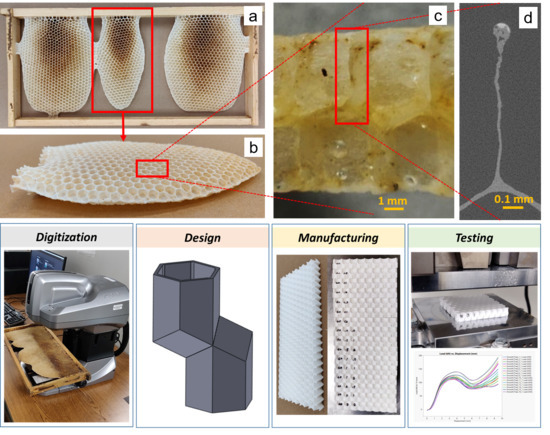
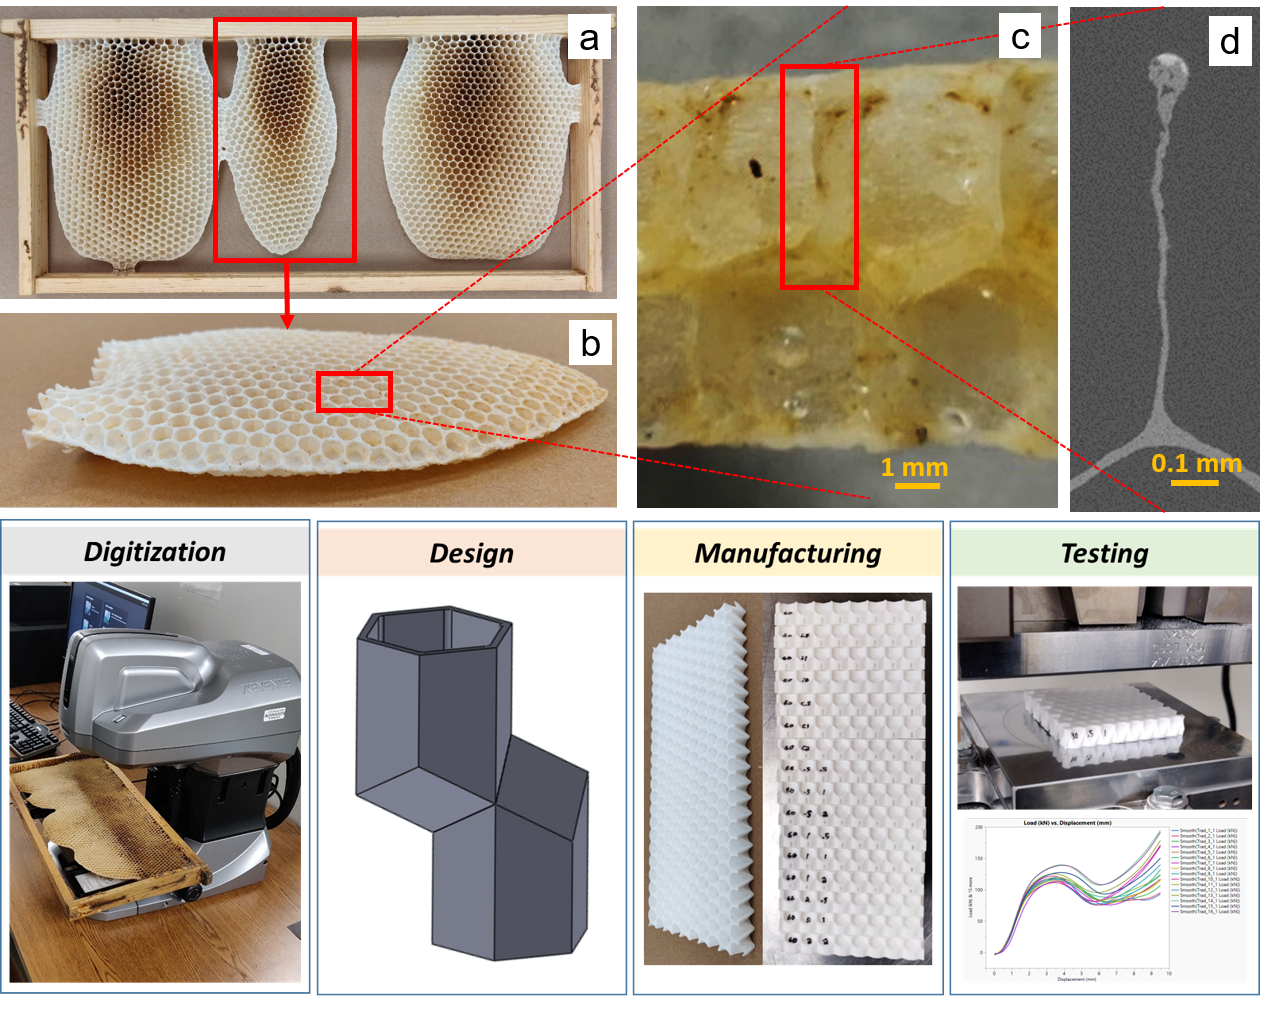
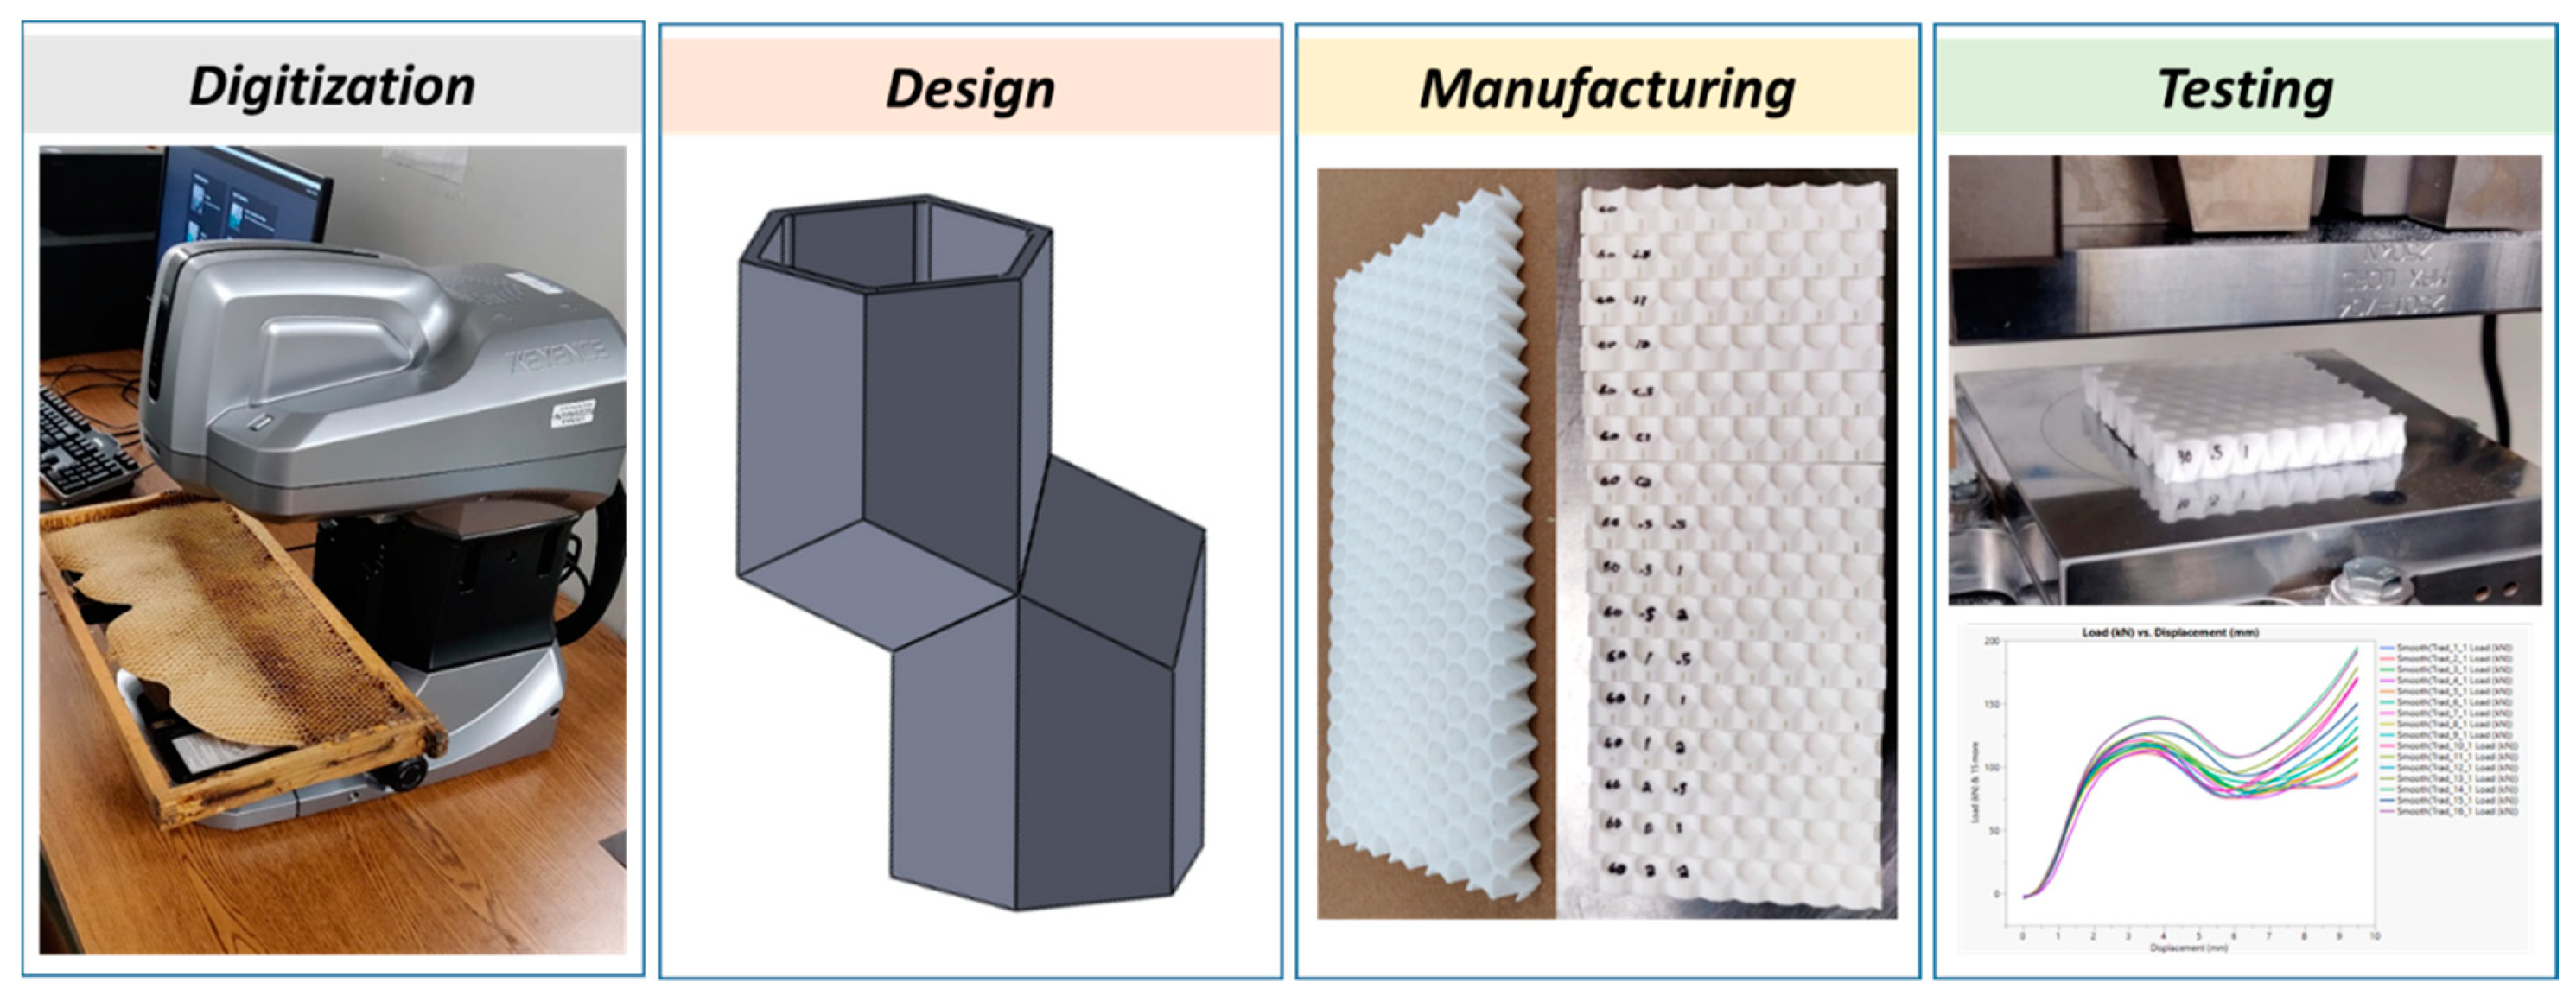
2.1. Overall Approach
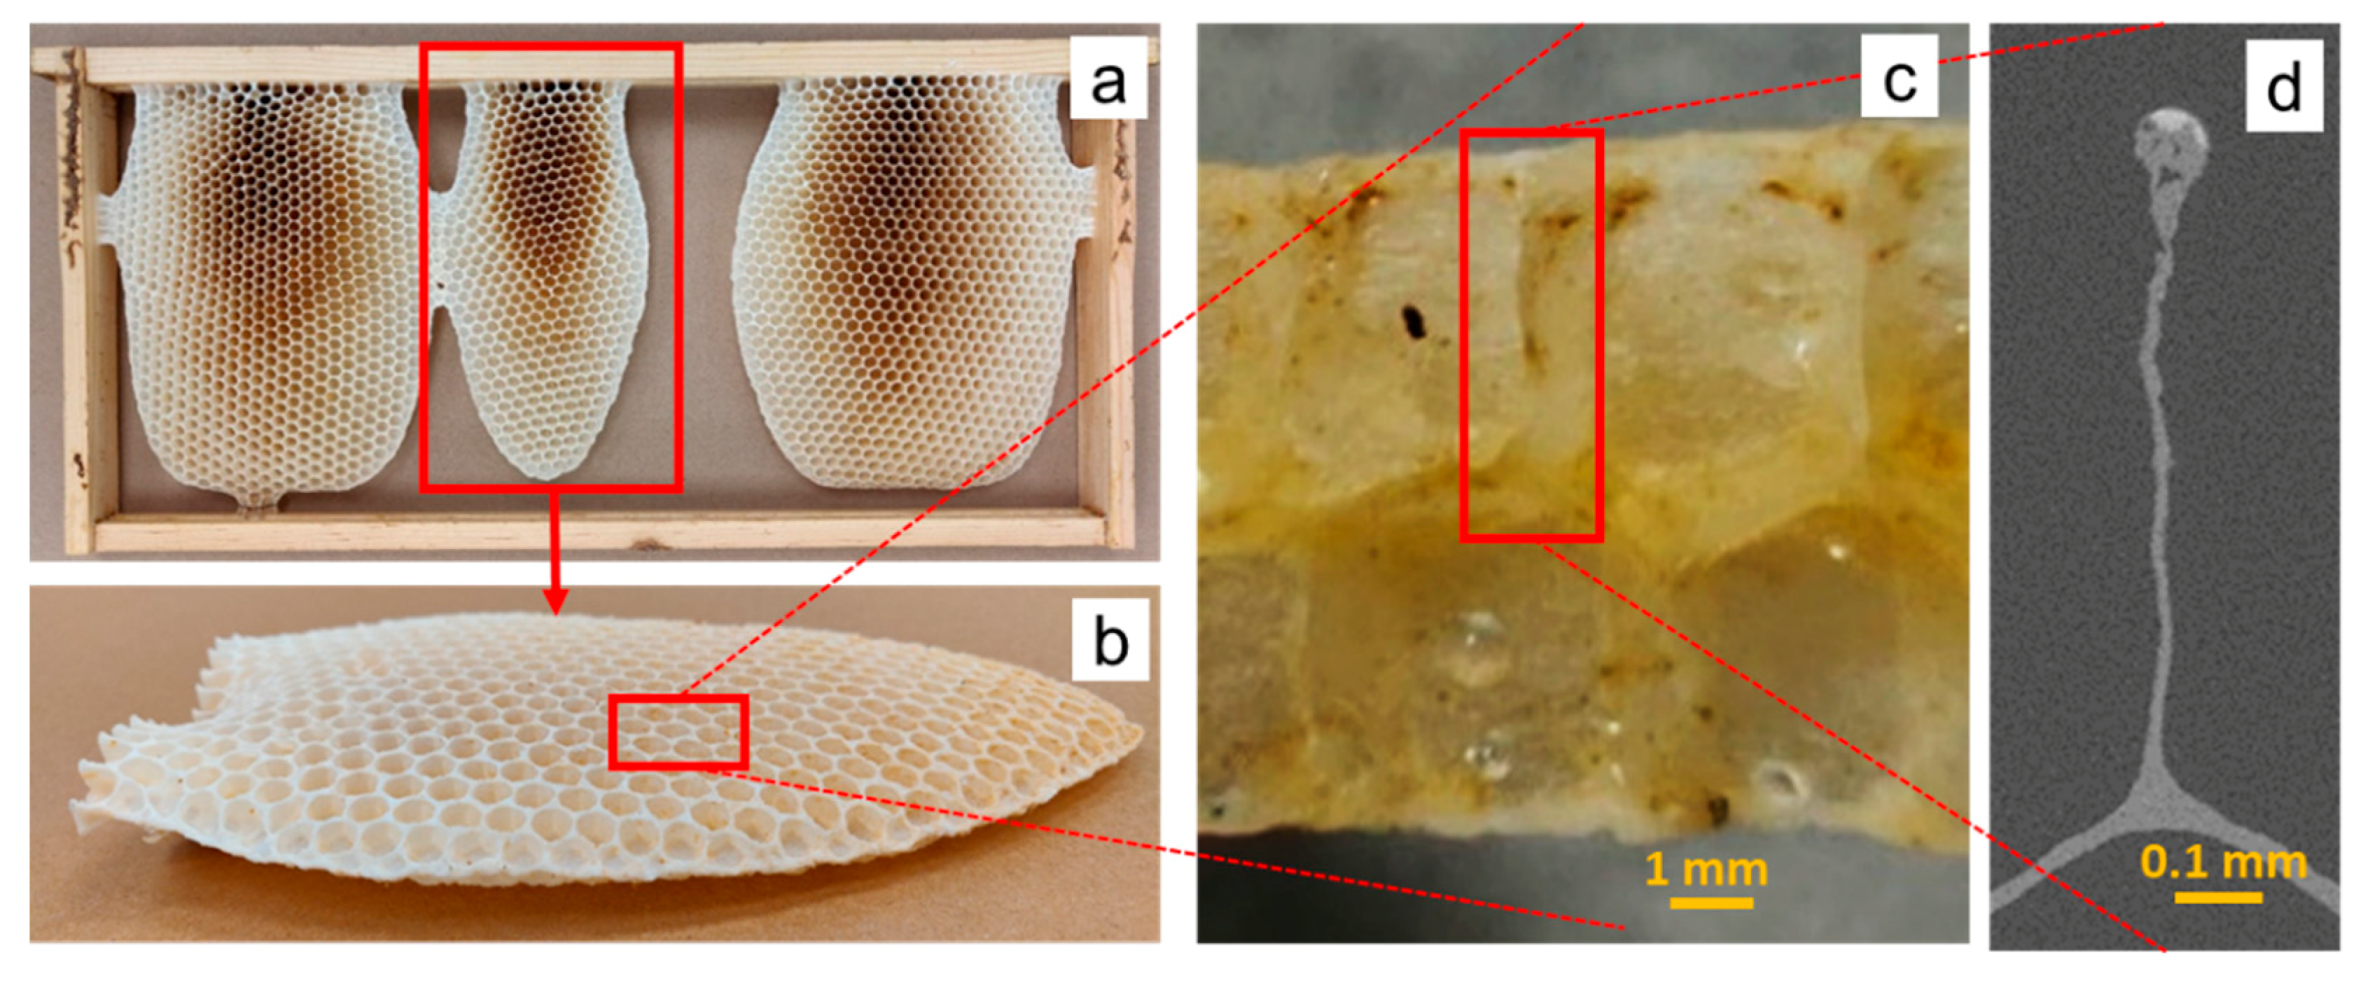
2.2. Digitization
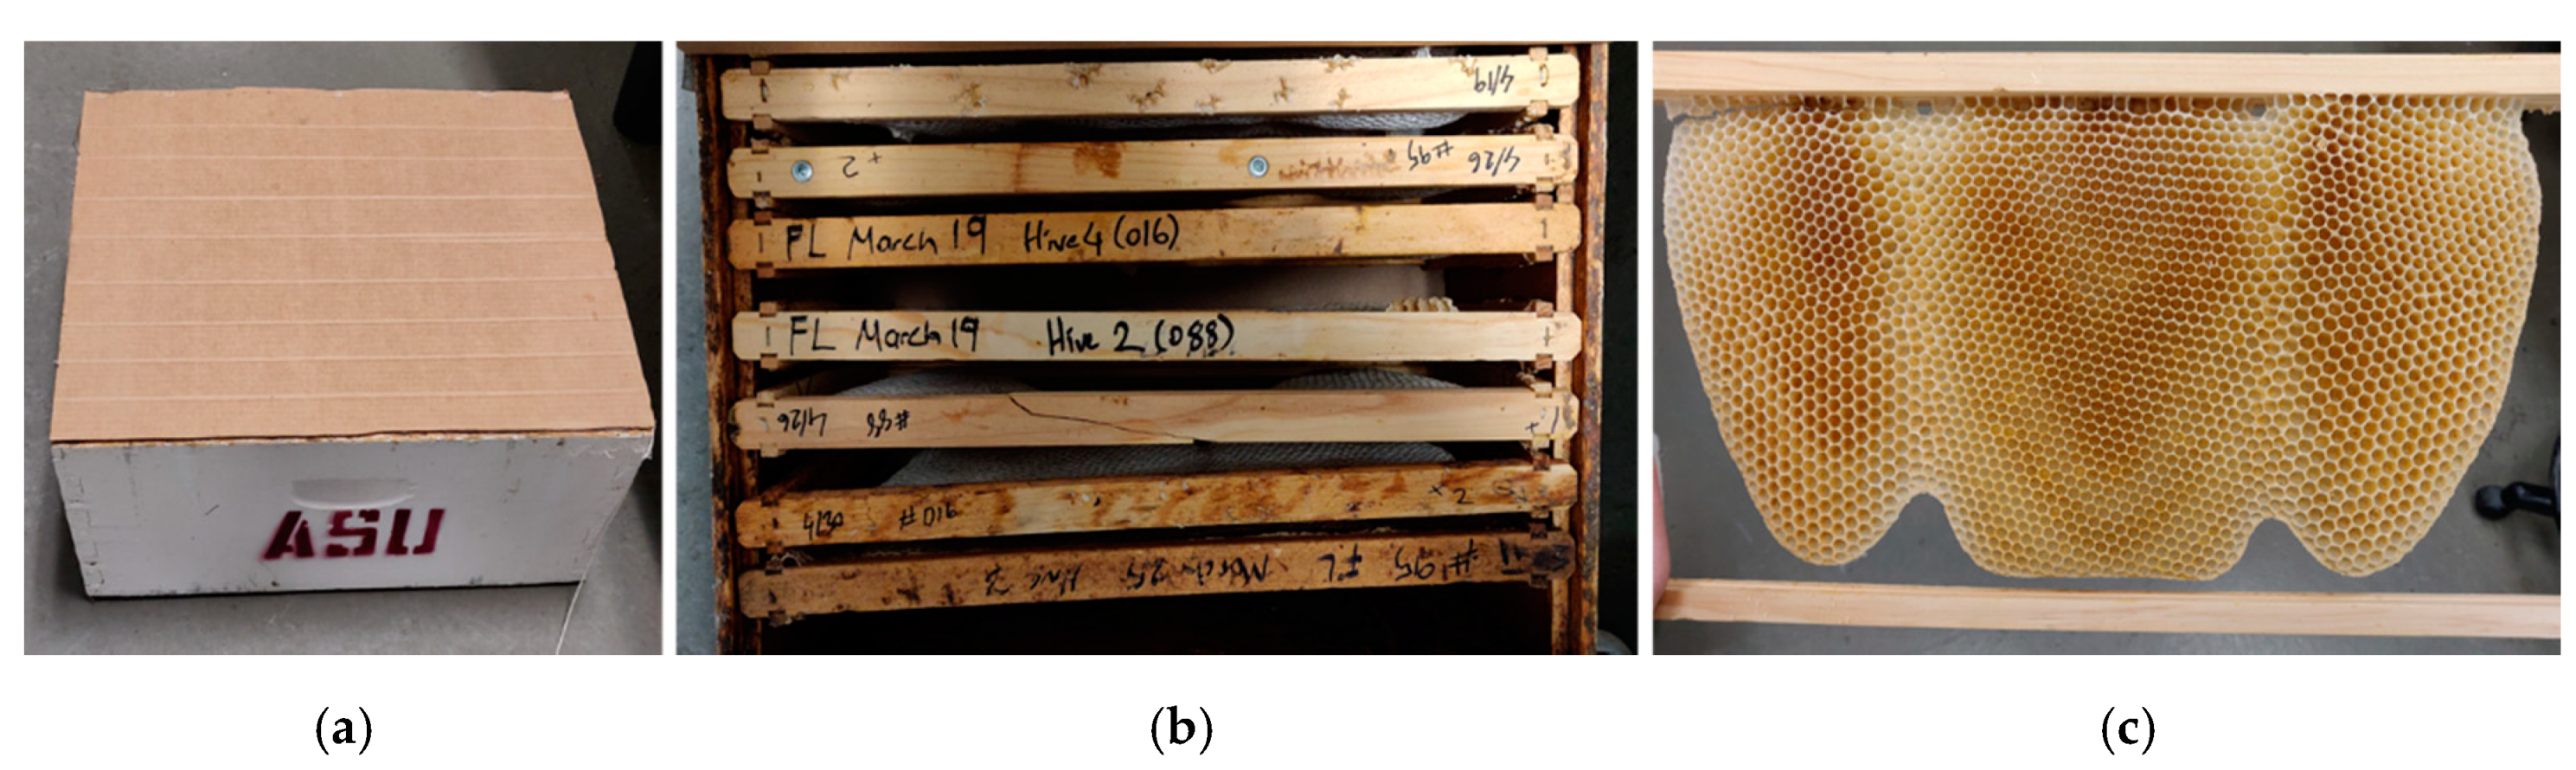
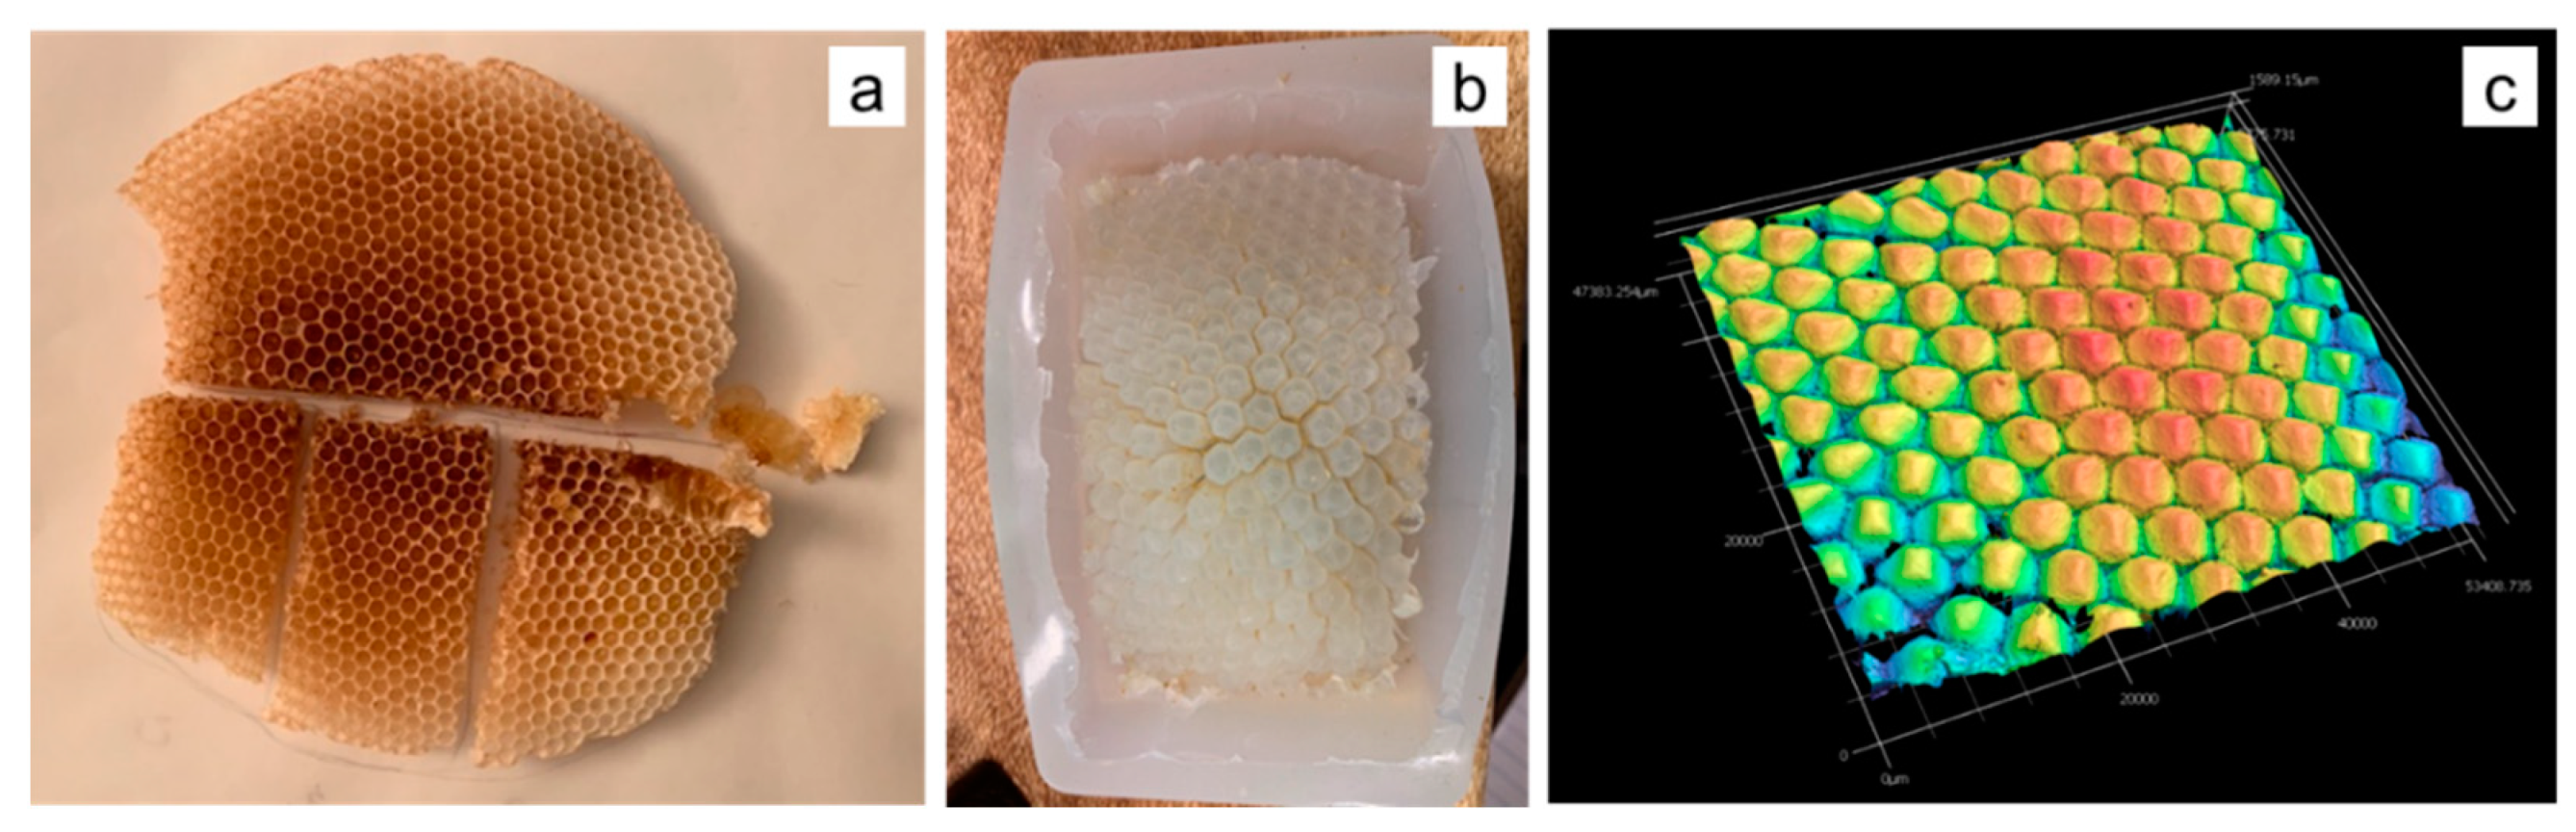
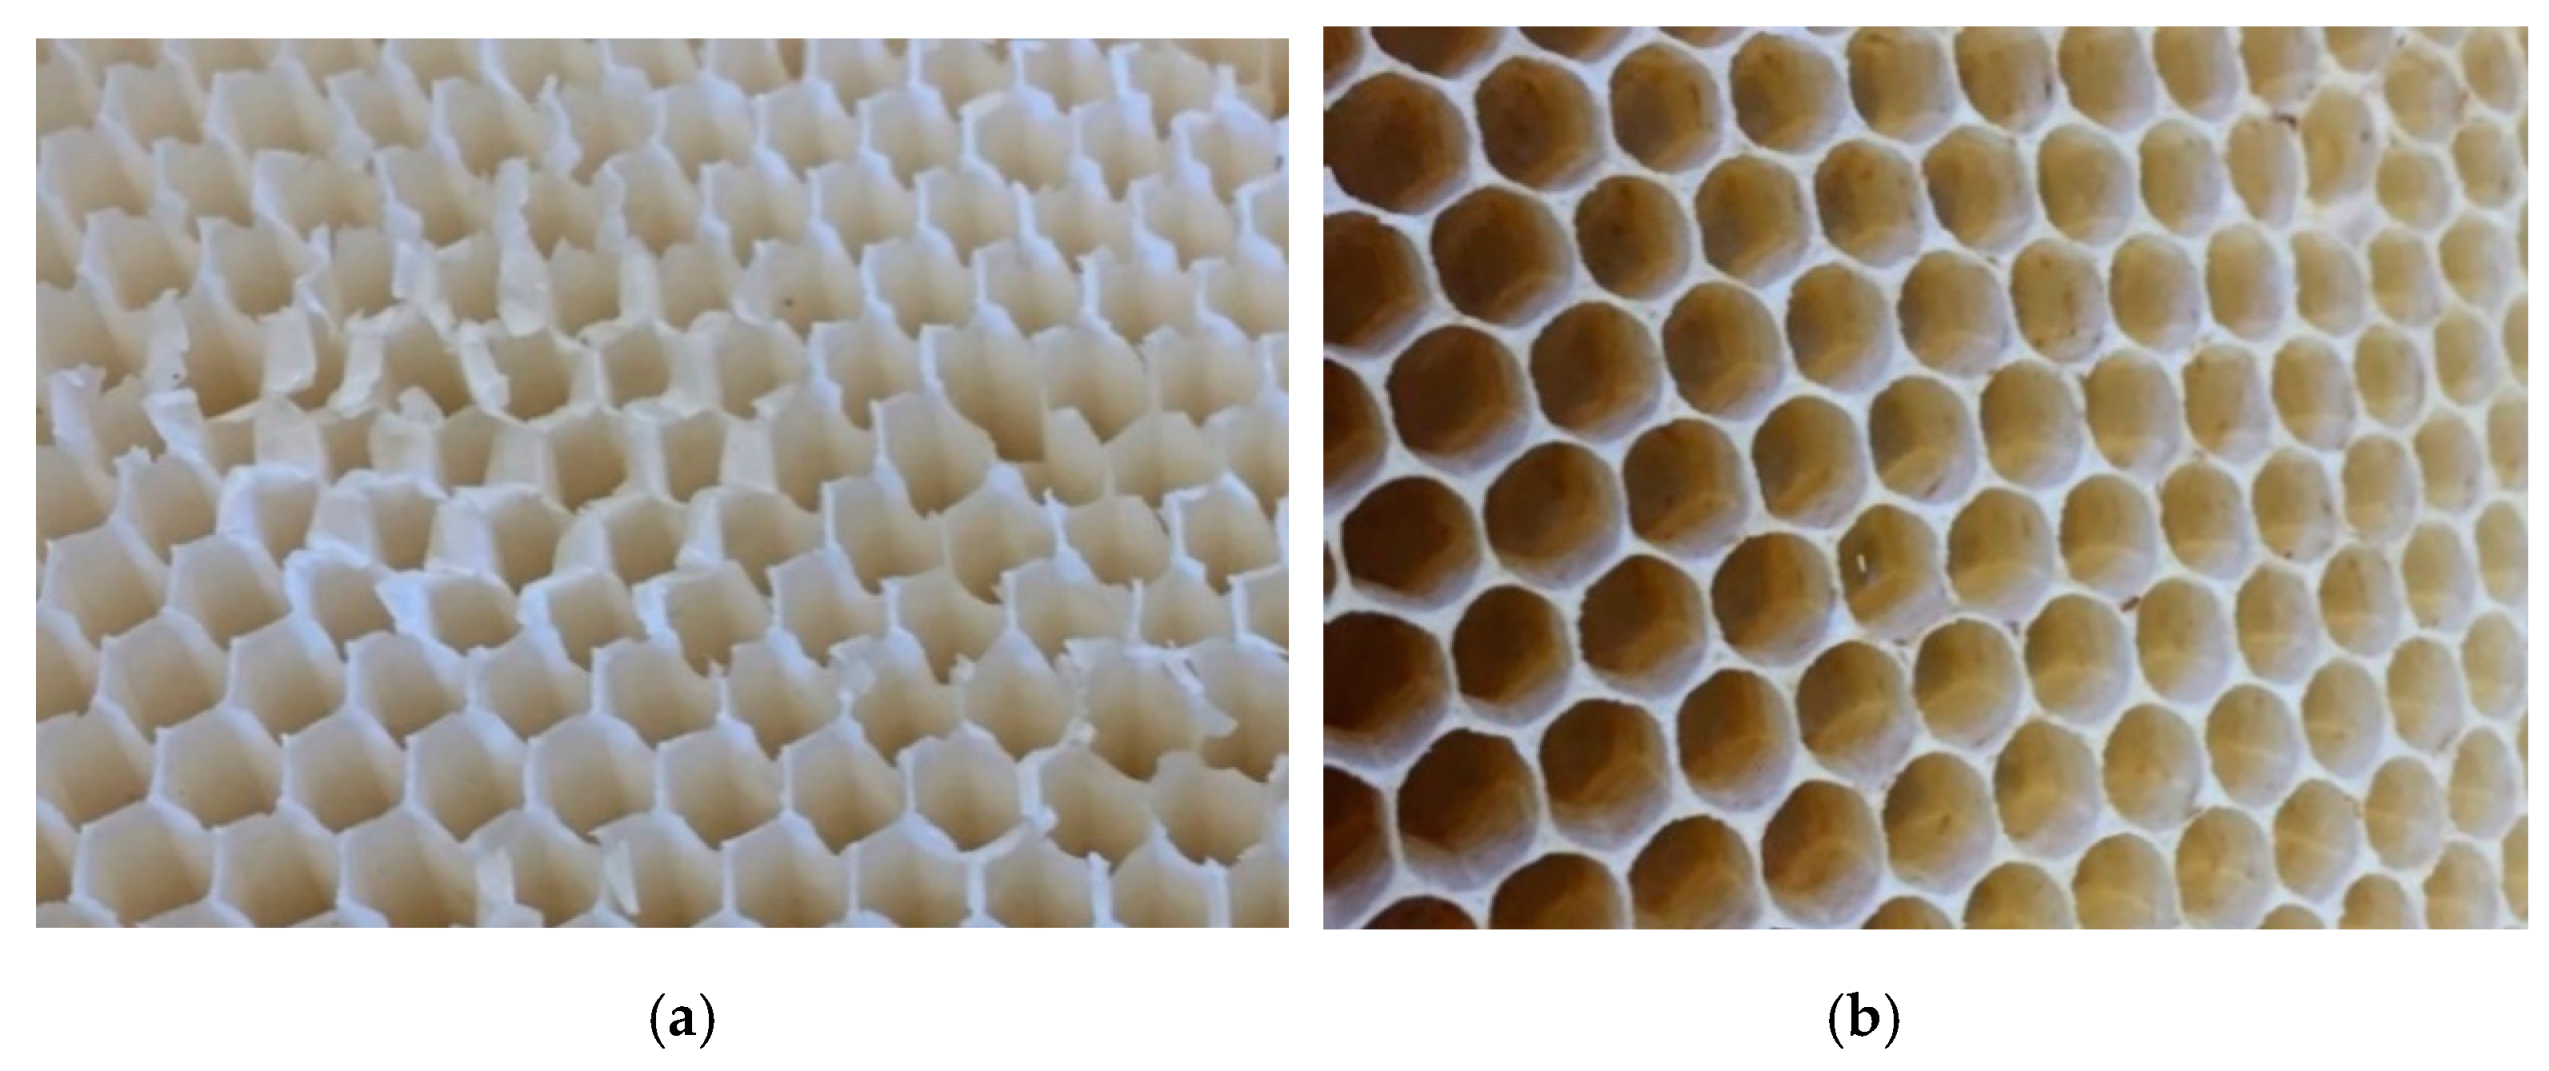
2.2.1. Honeybee Comb Specimens
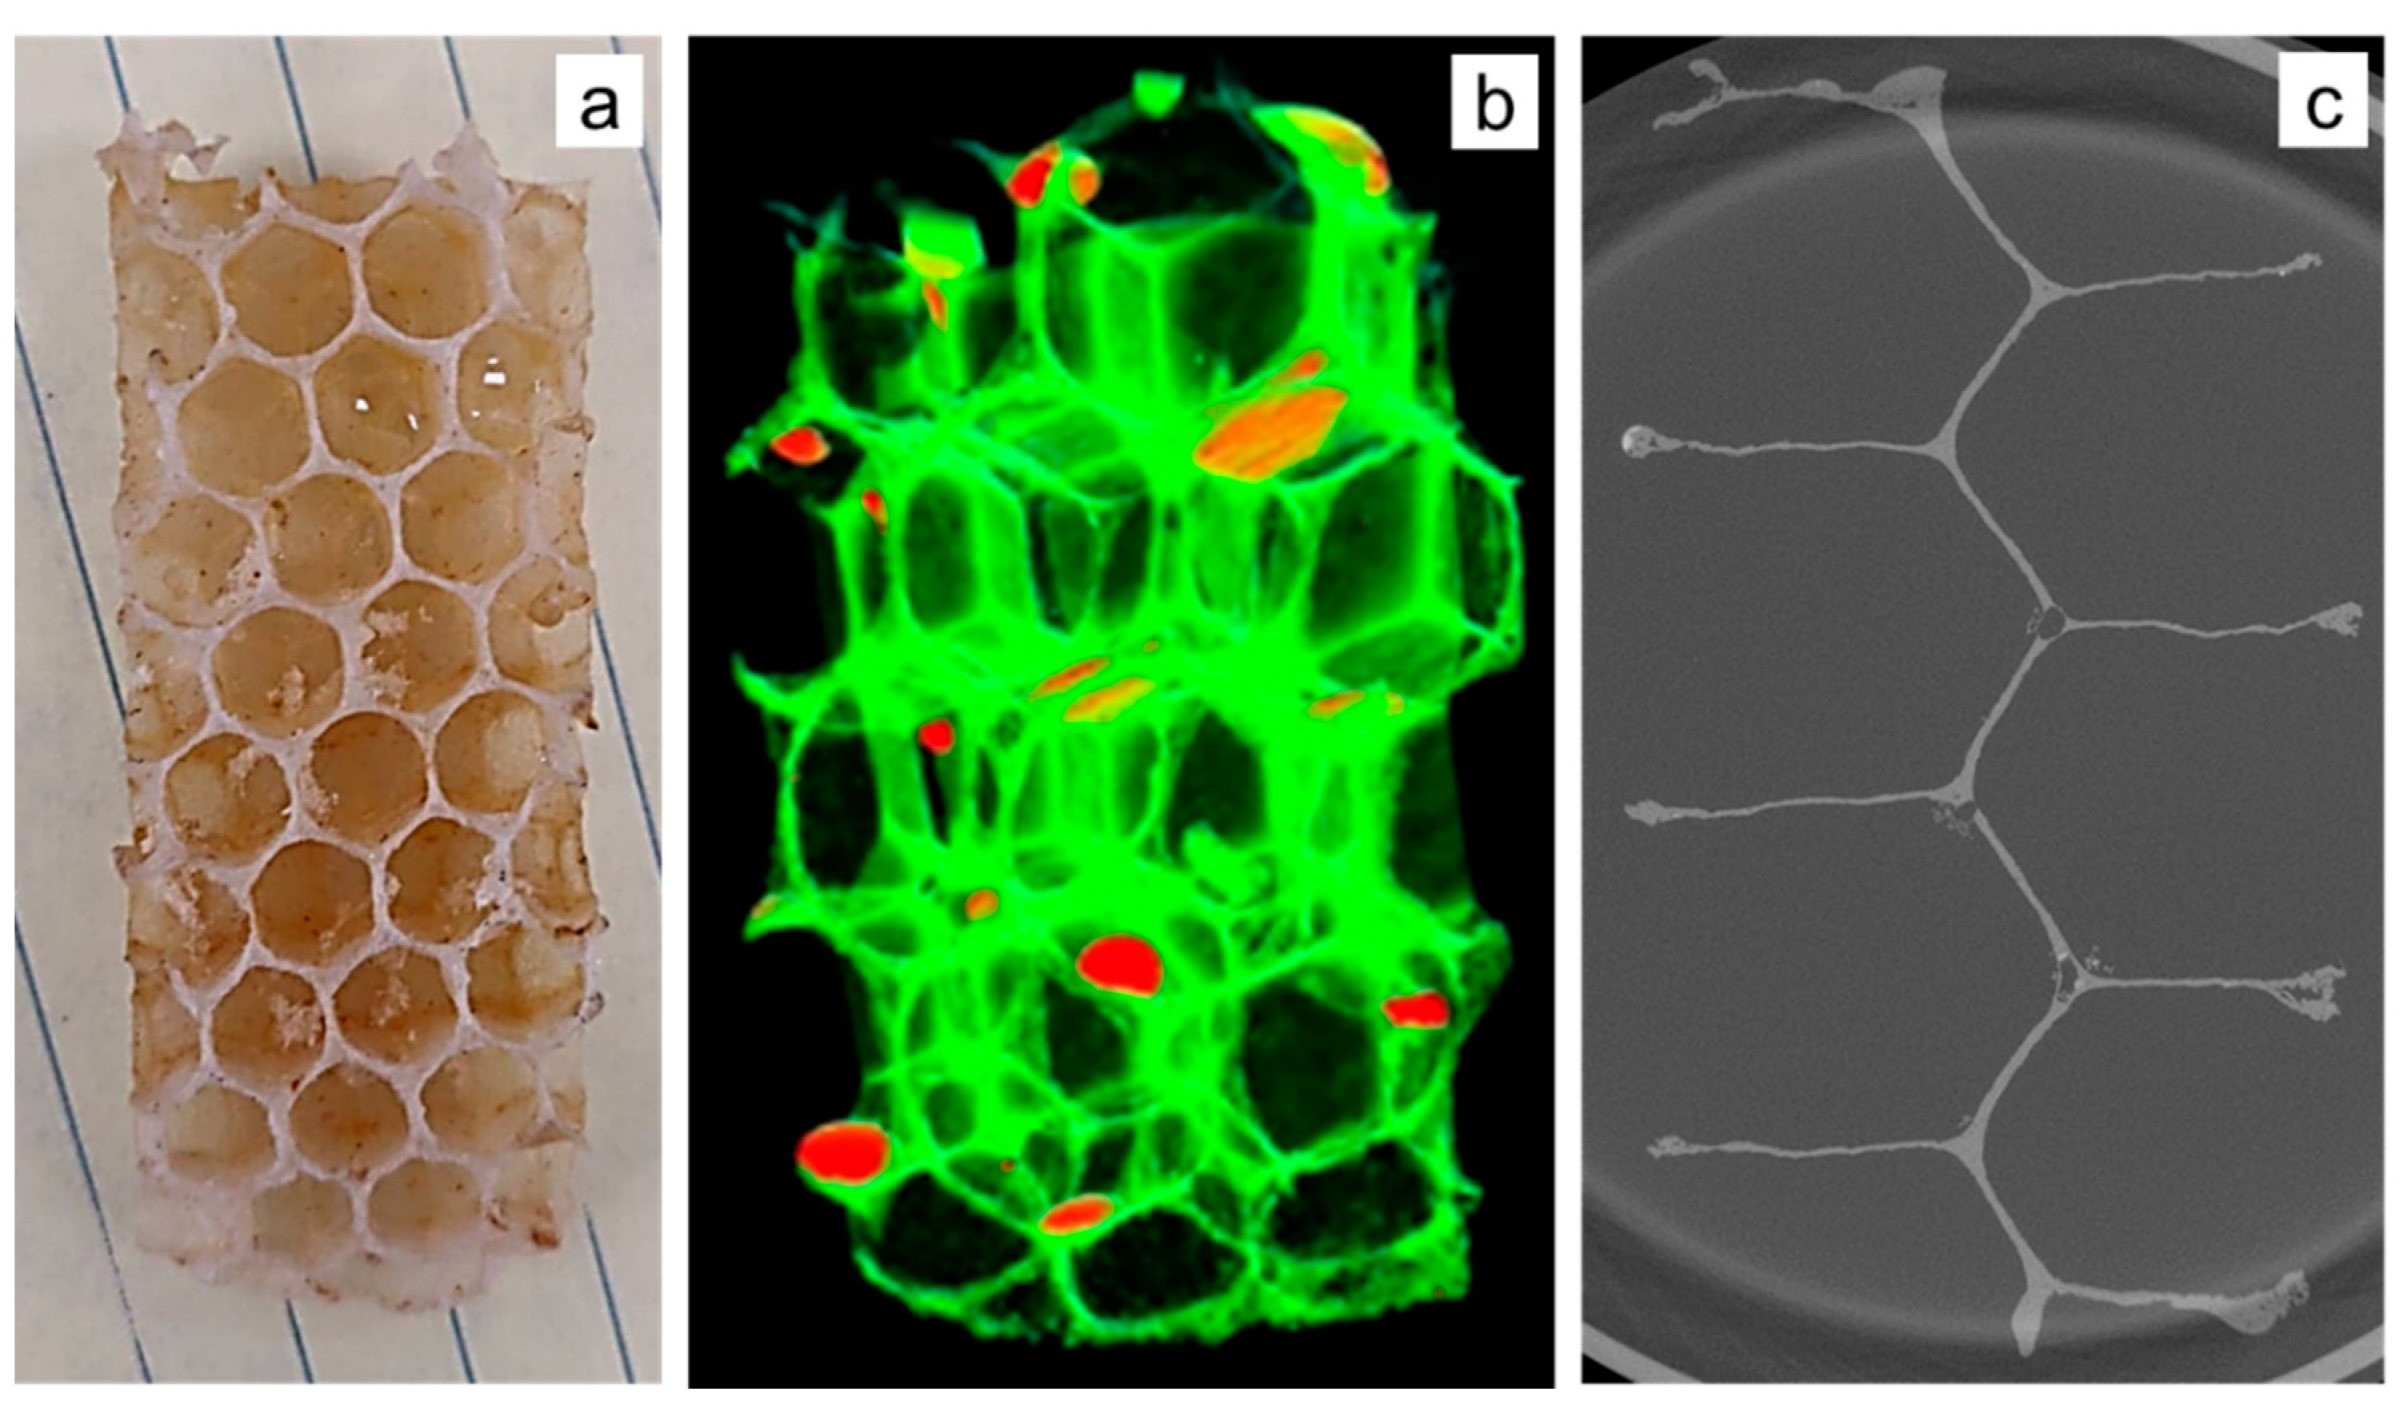
2.2.2. Structured White Light Microscopy
2.2.3. X-ray Tomography
2.2.4. Silicone Molding
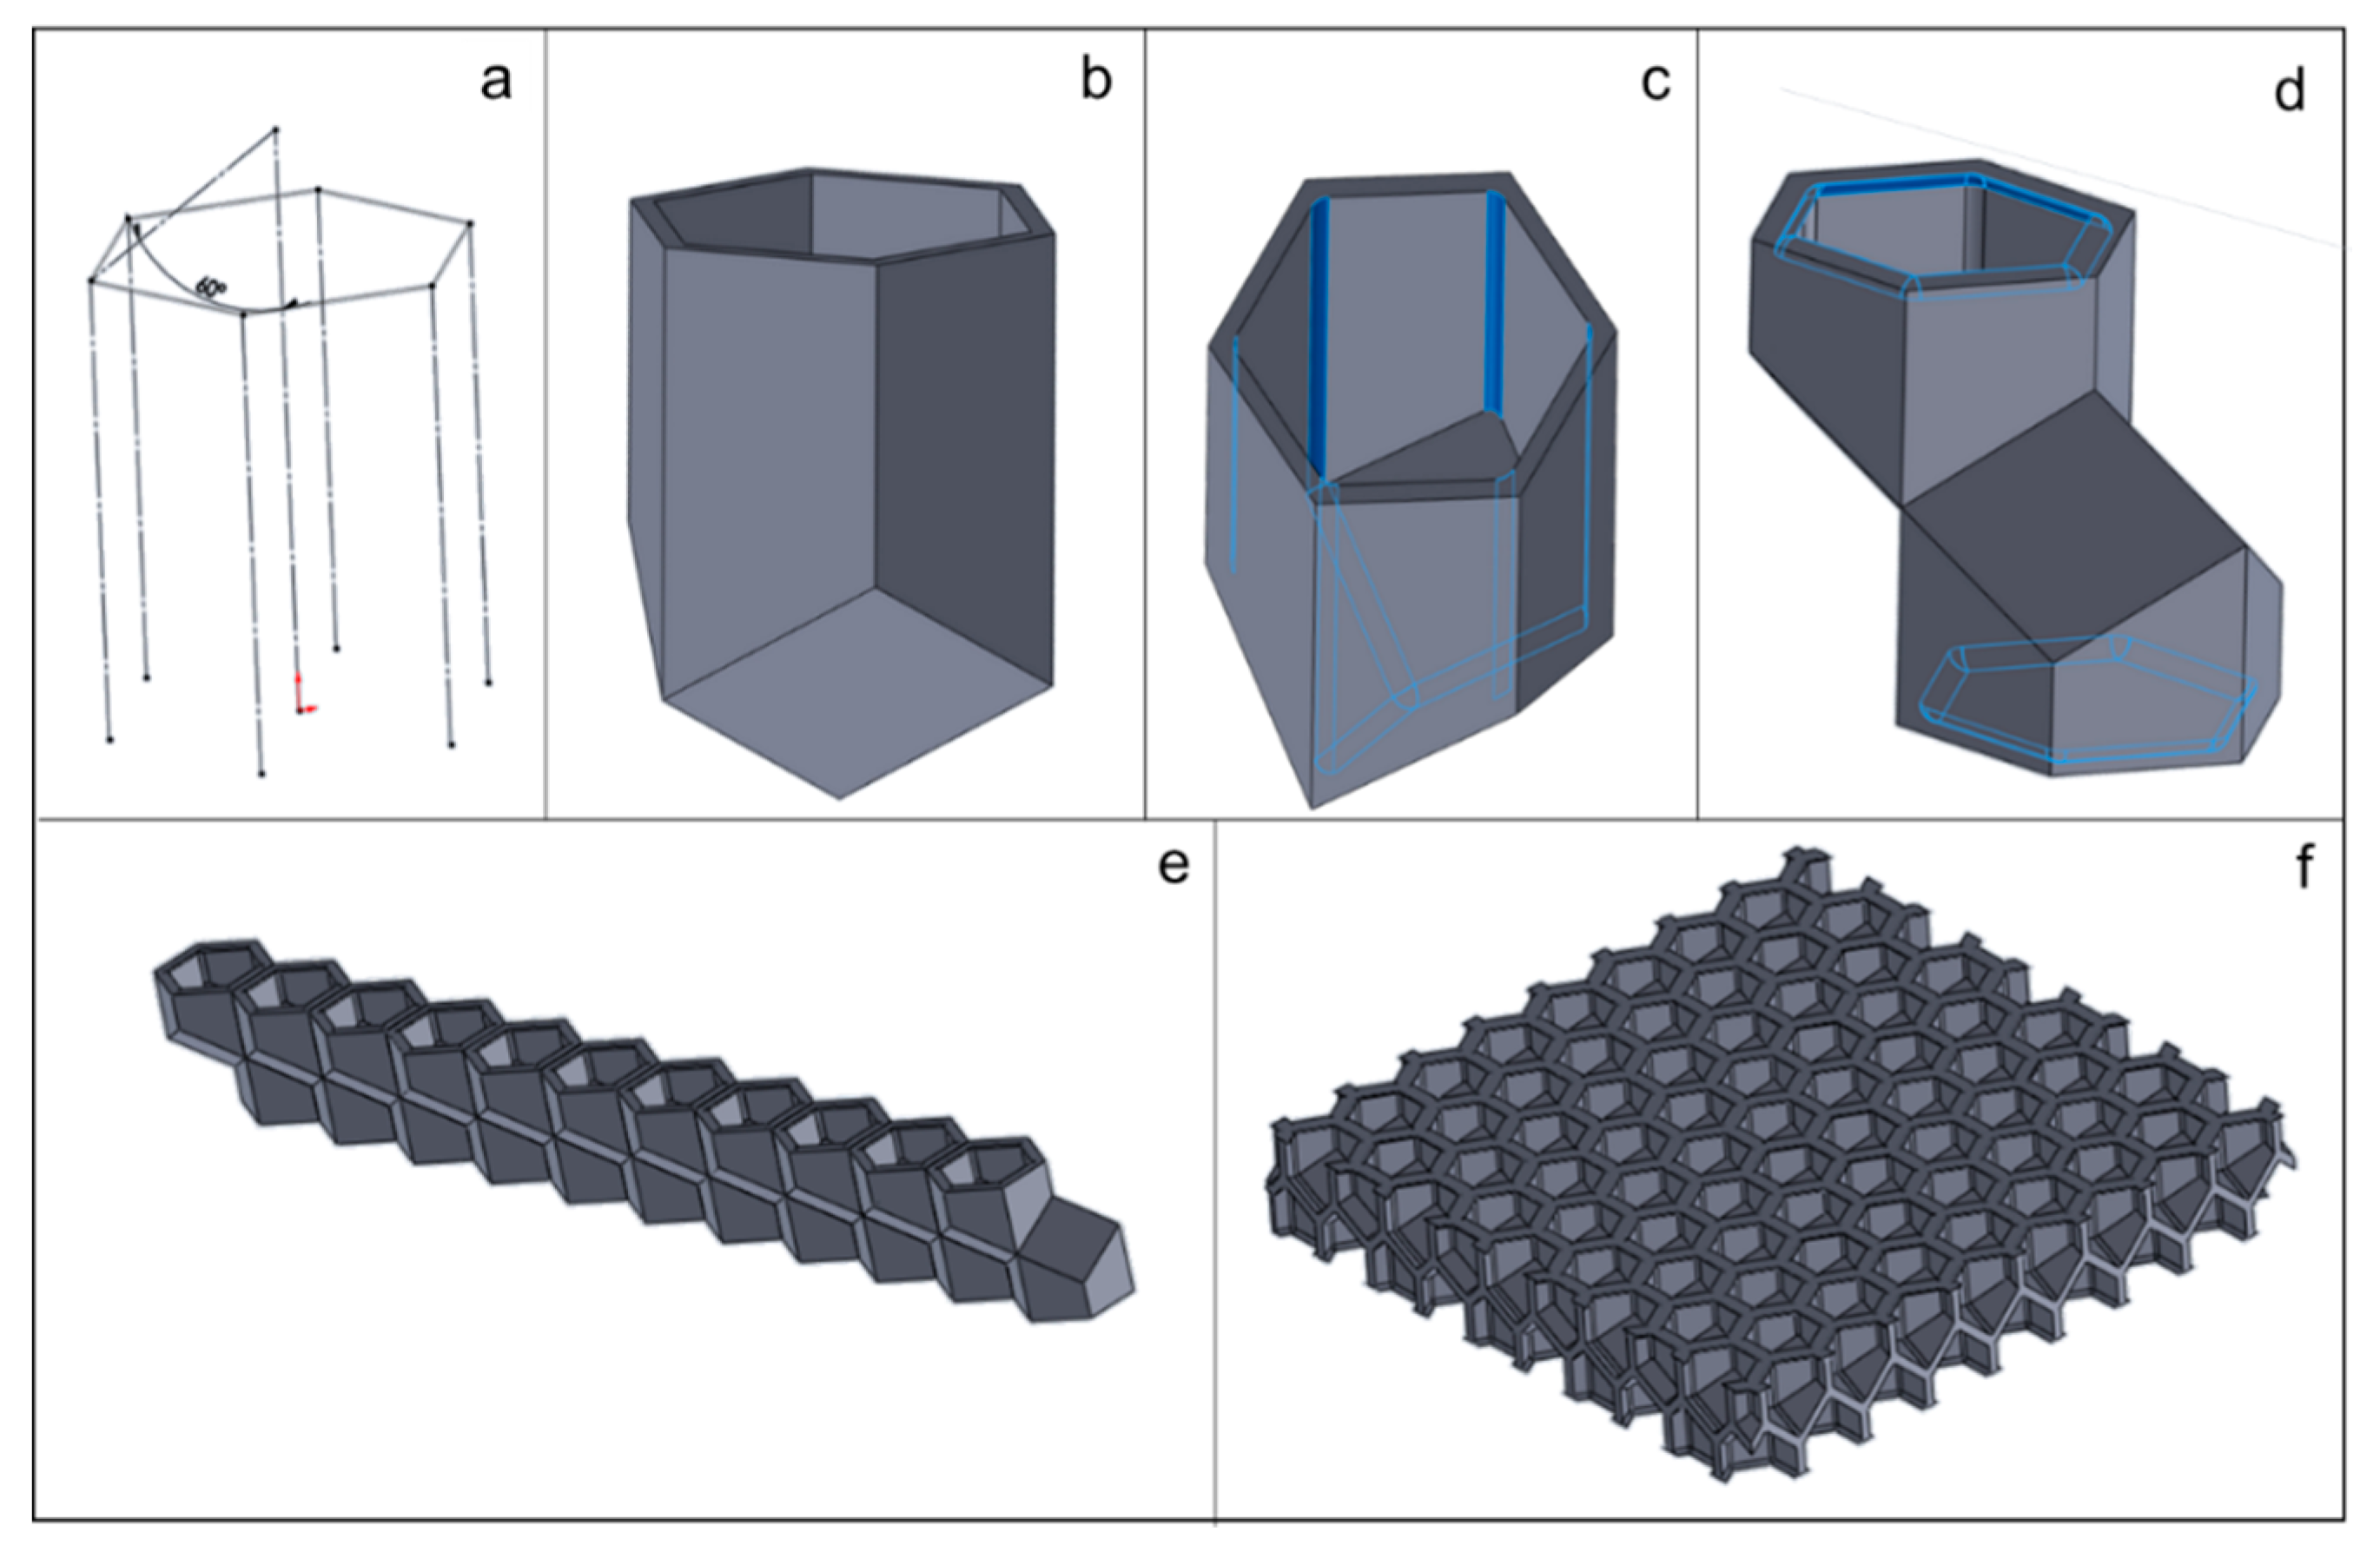
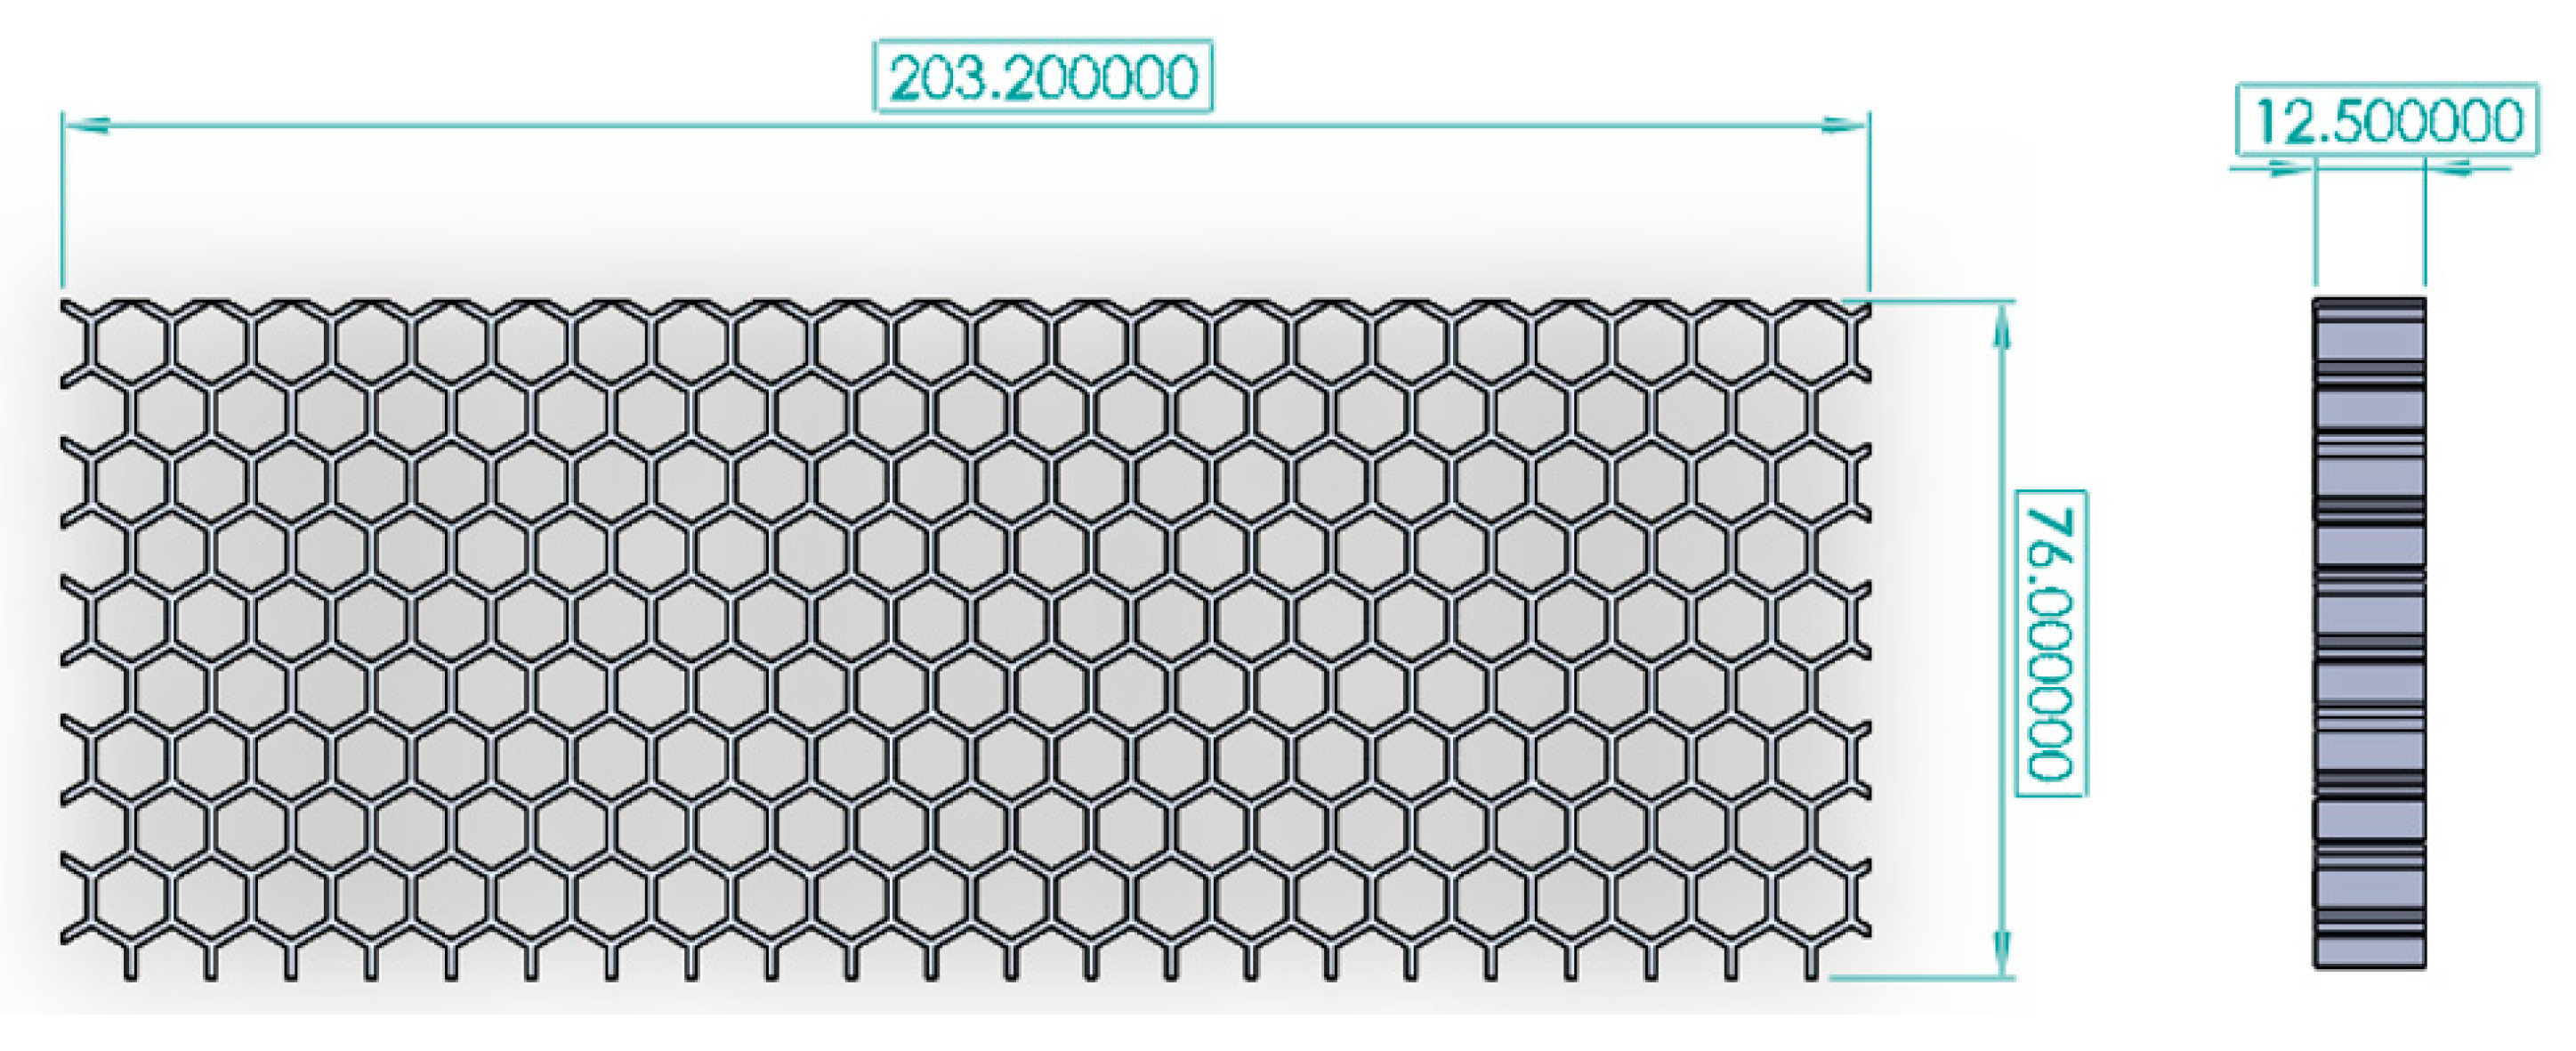
2.3. Honeycomb Panel Design
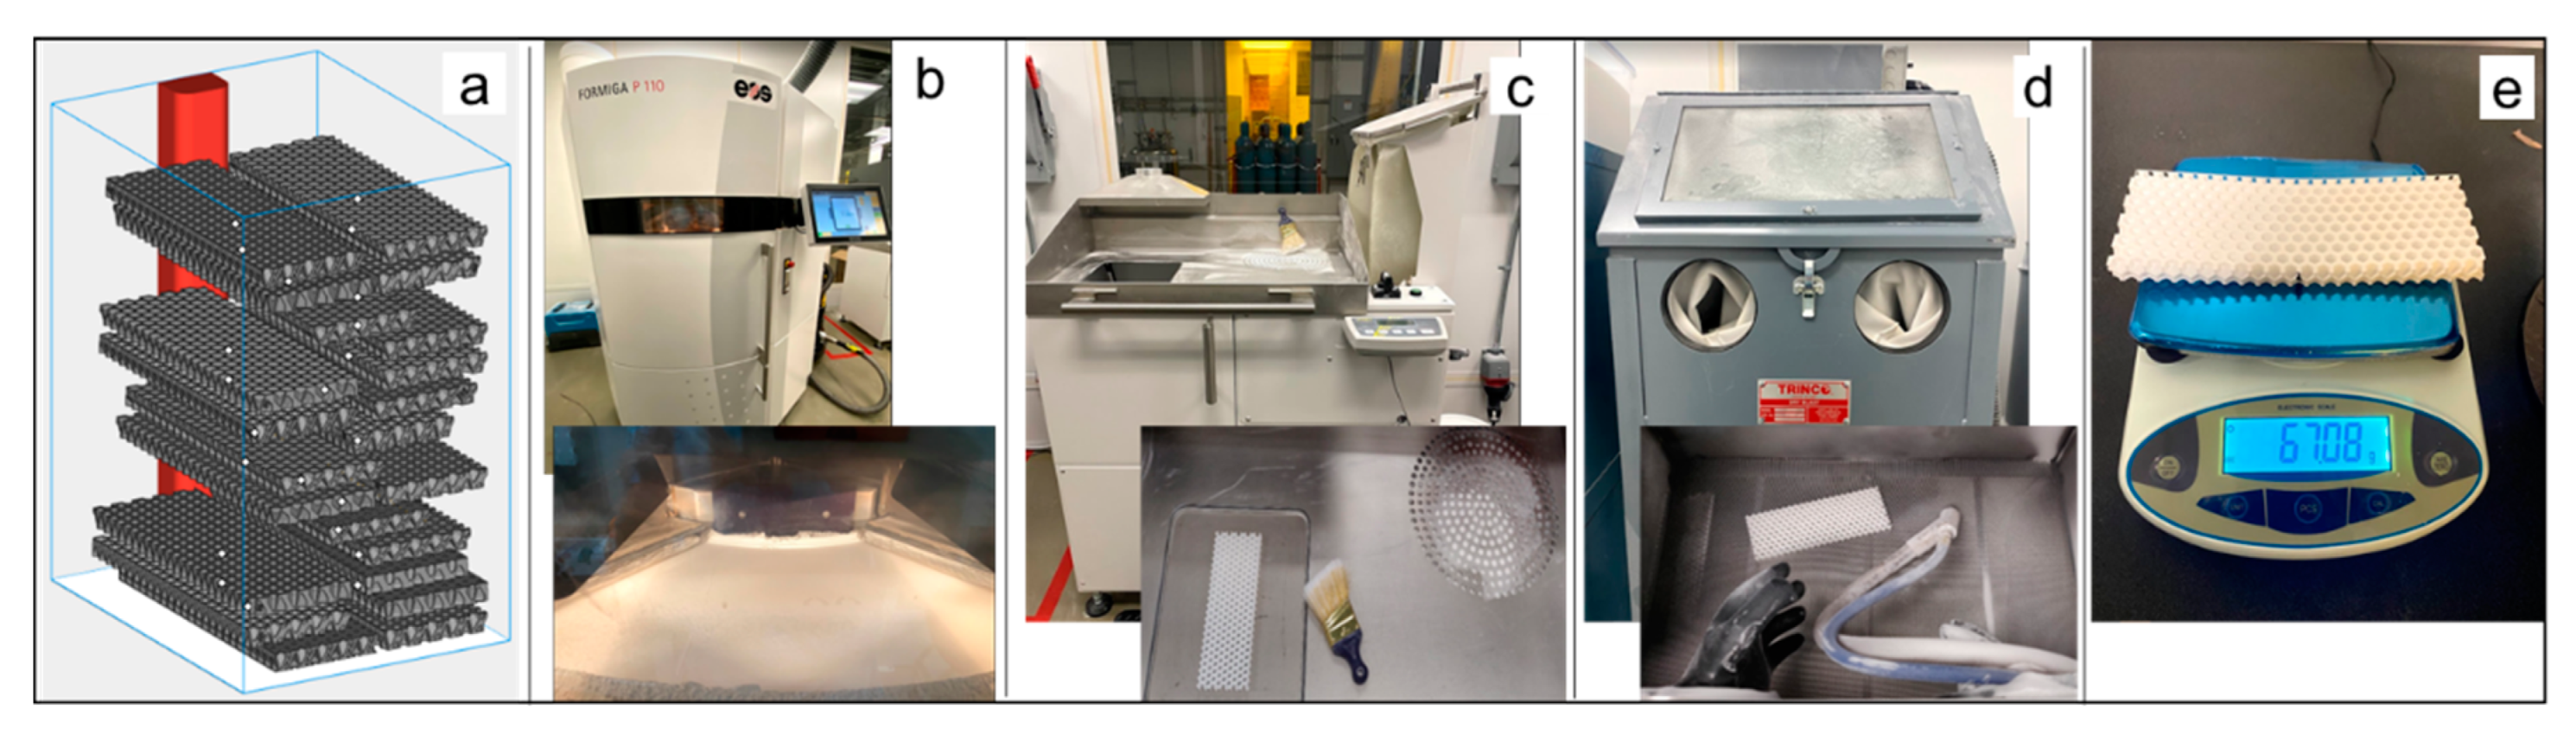
2.4. Additive Manufacturing
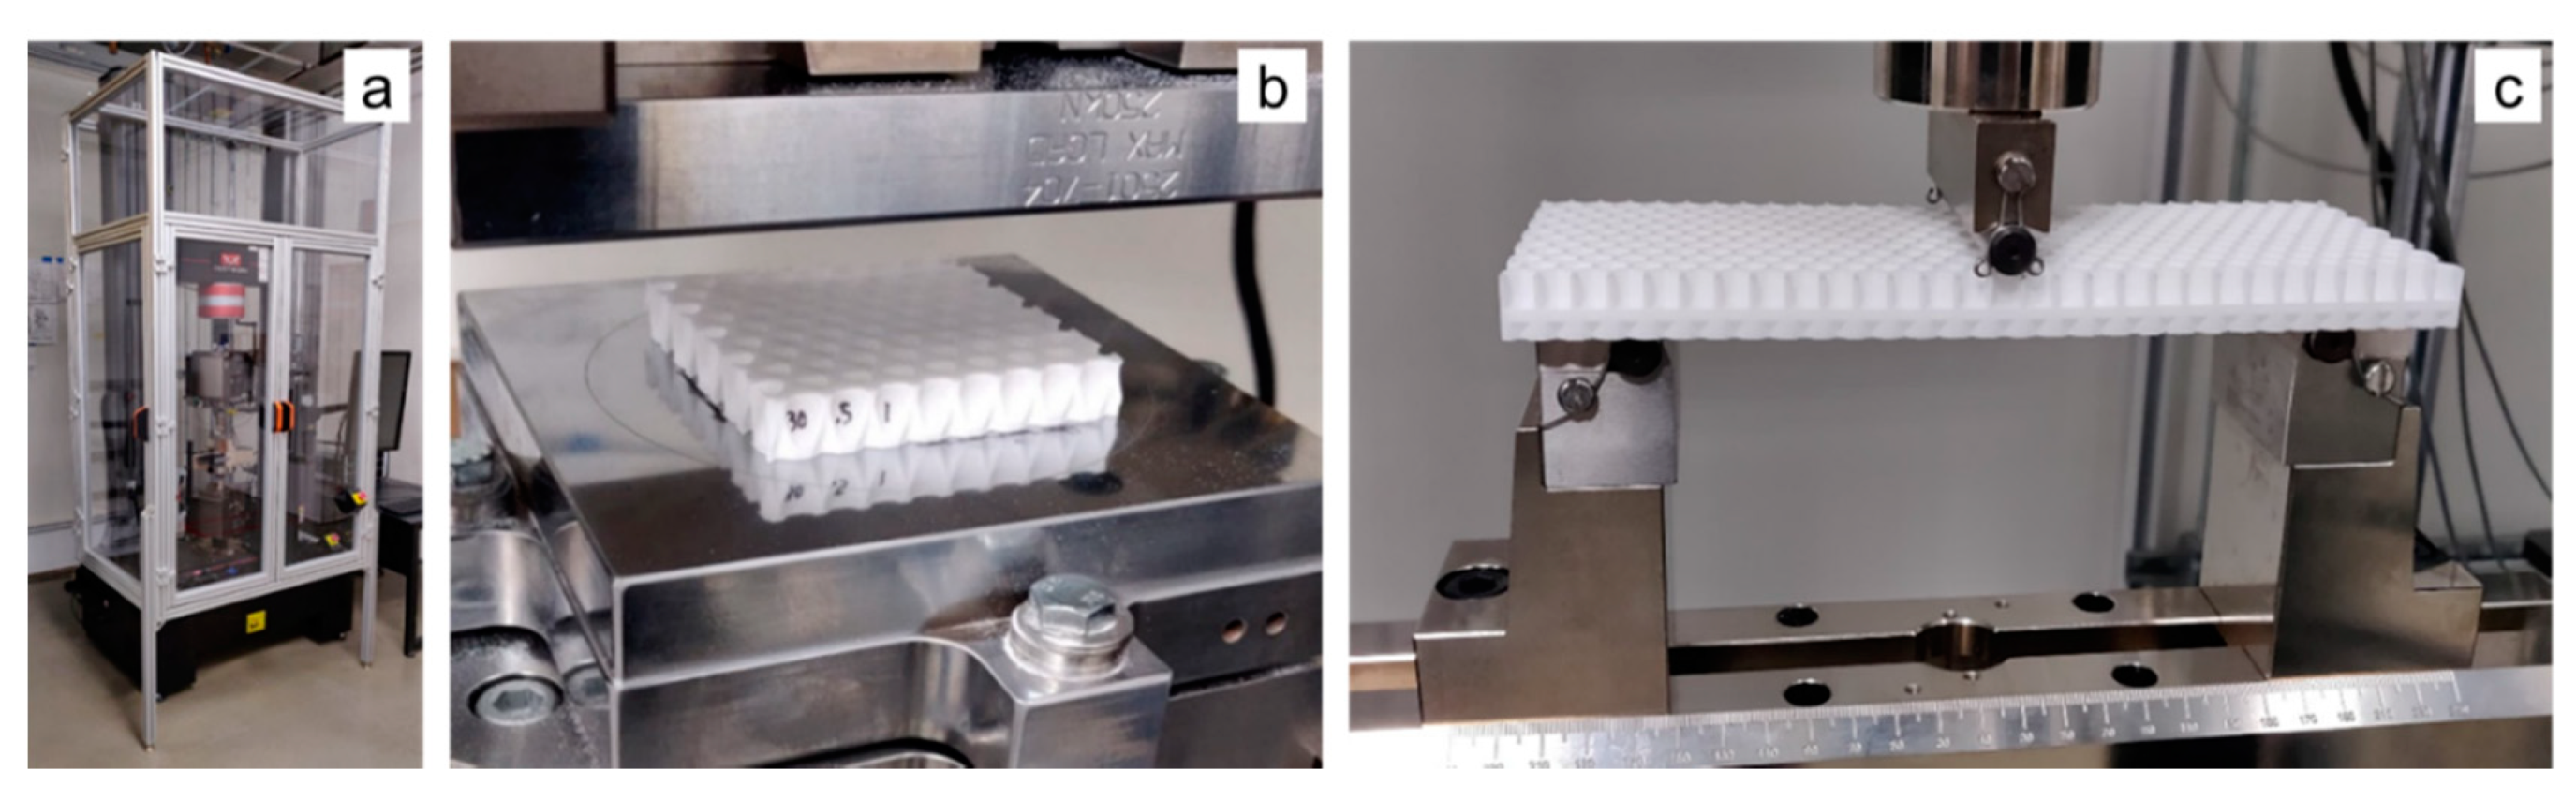
2.5. Mechanical Testing
2.5.1. Out-of-Plane Compression
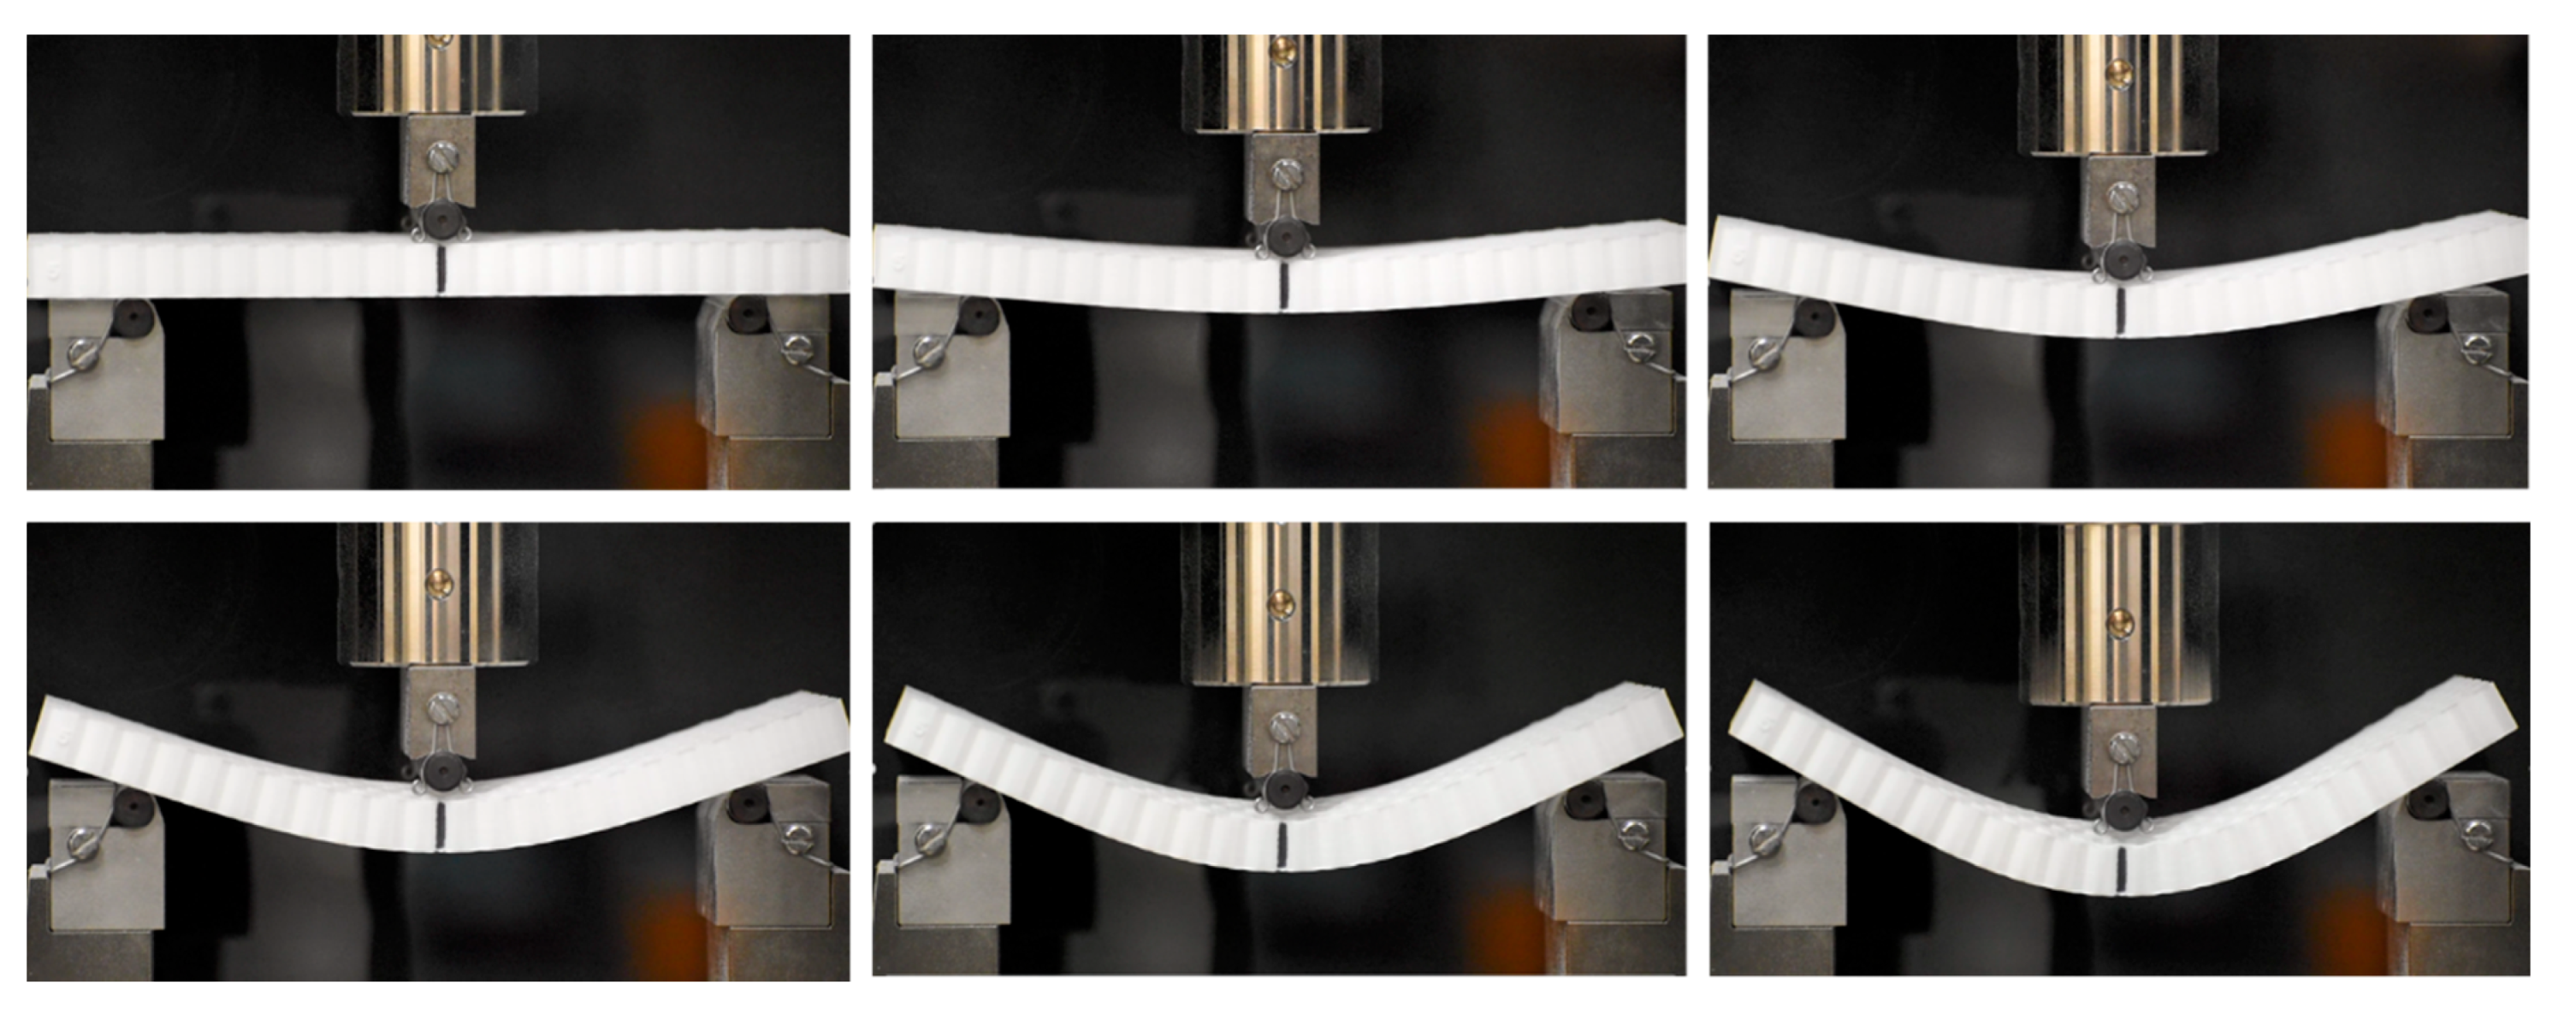
2.5.2. Three-Point Bending
3. Results
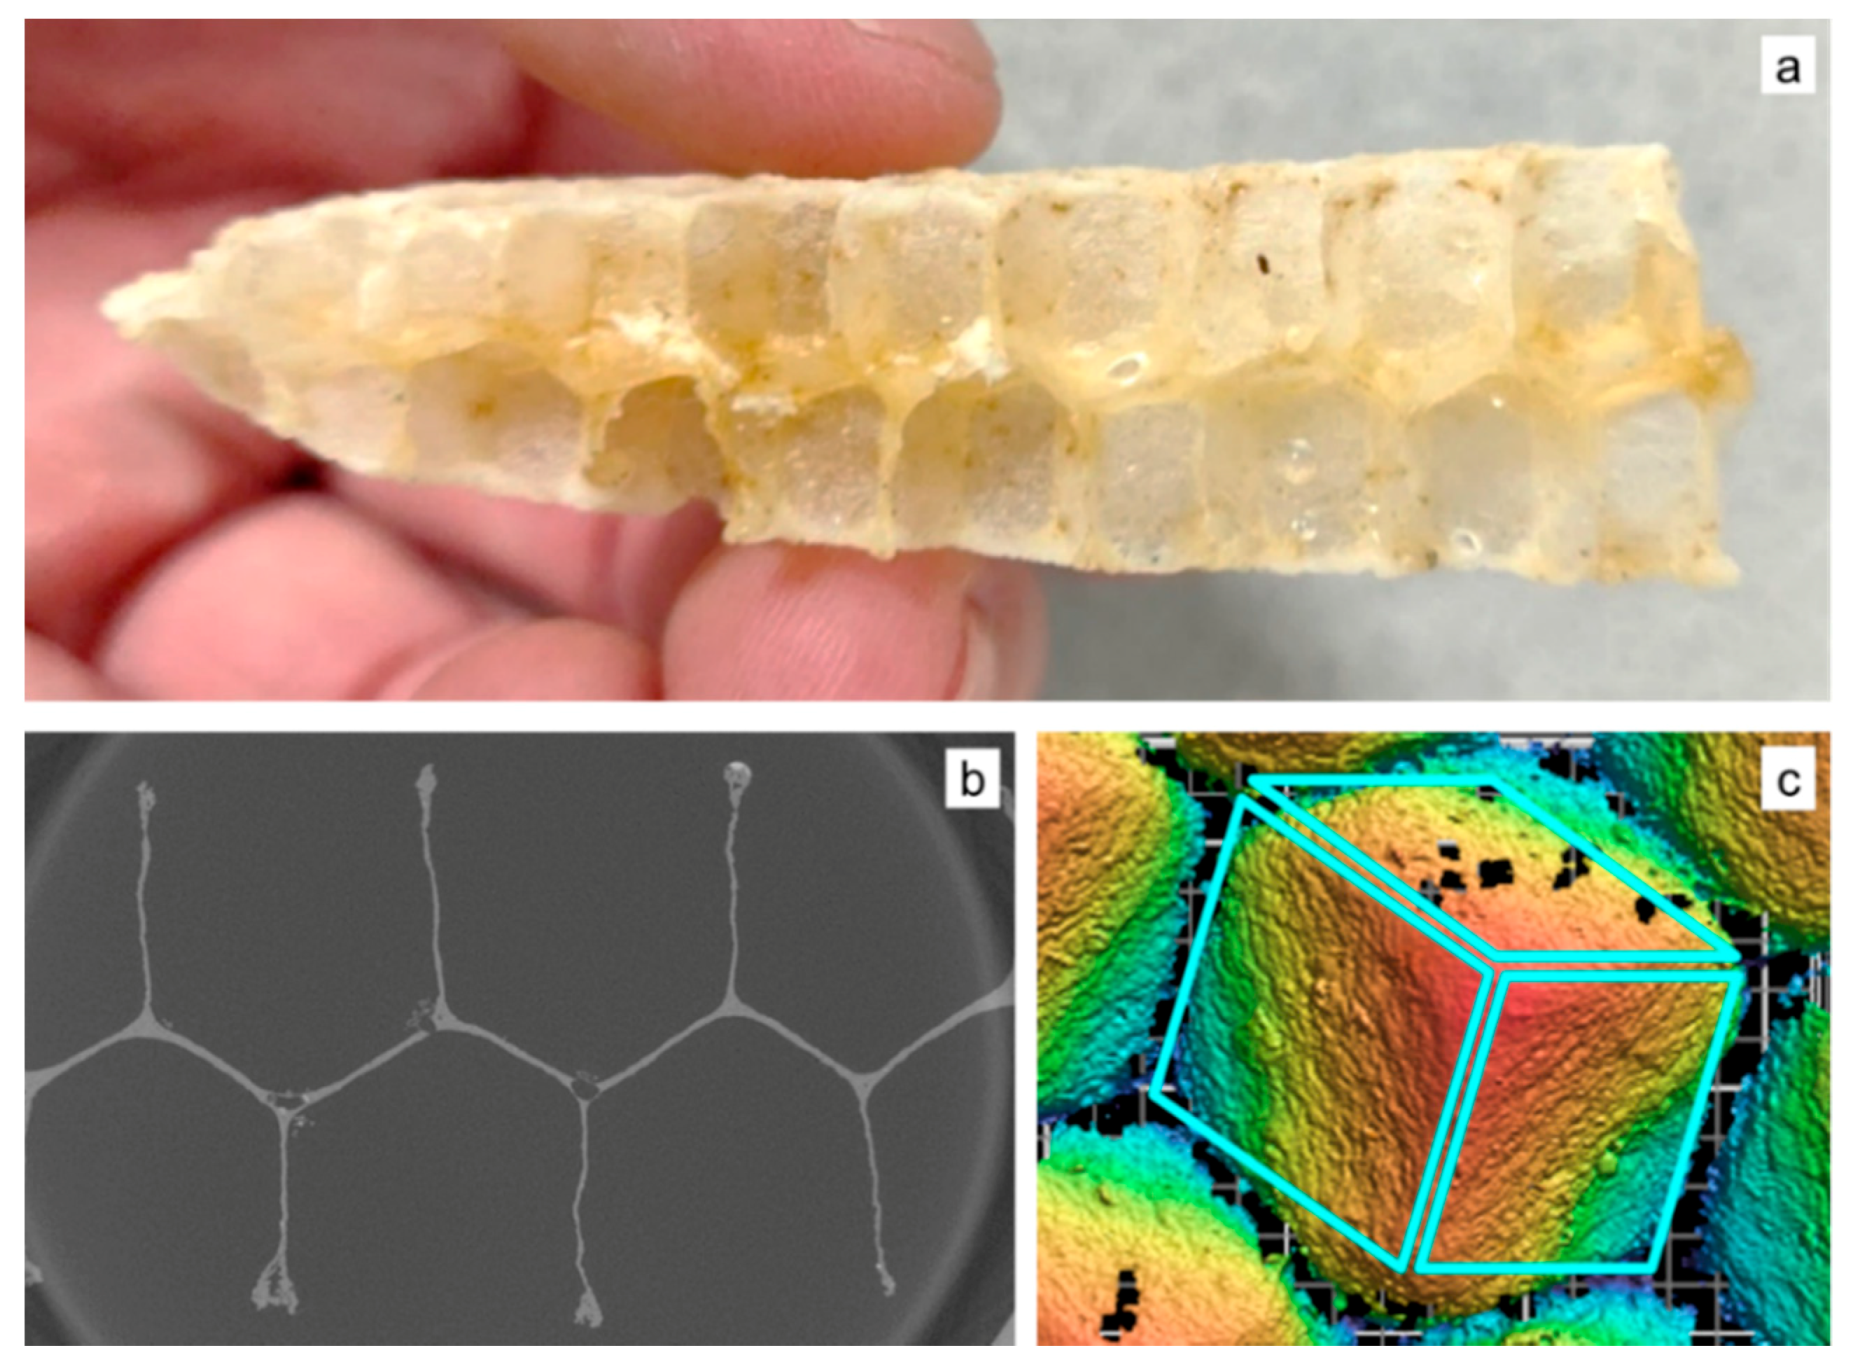
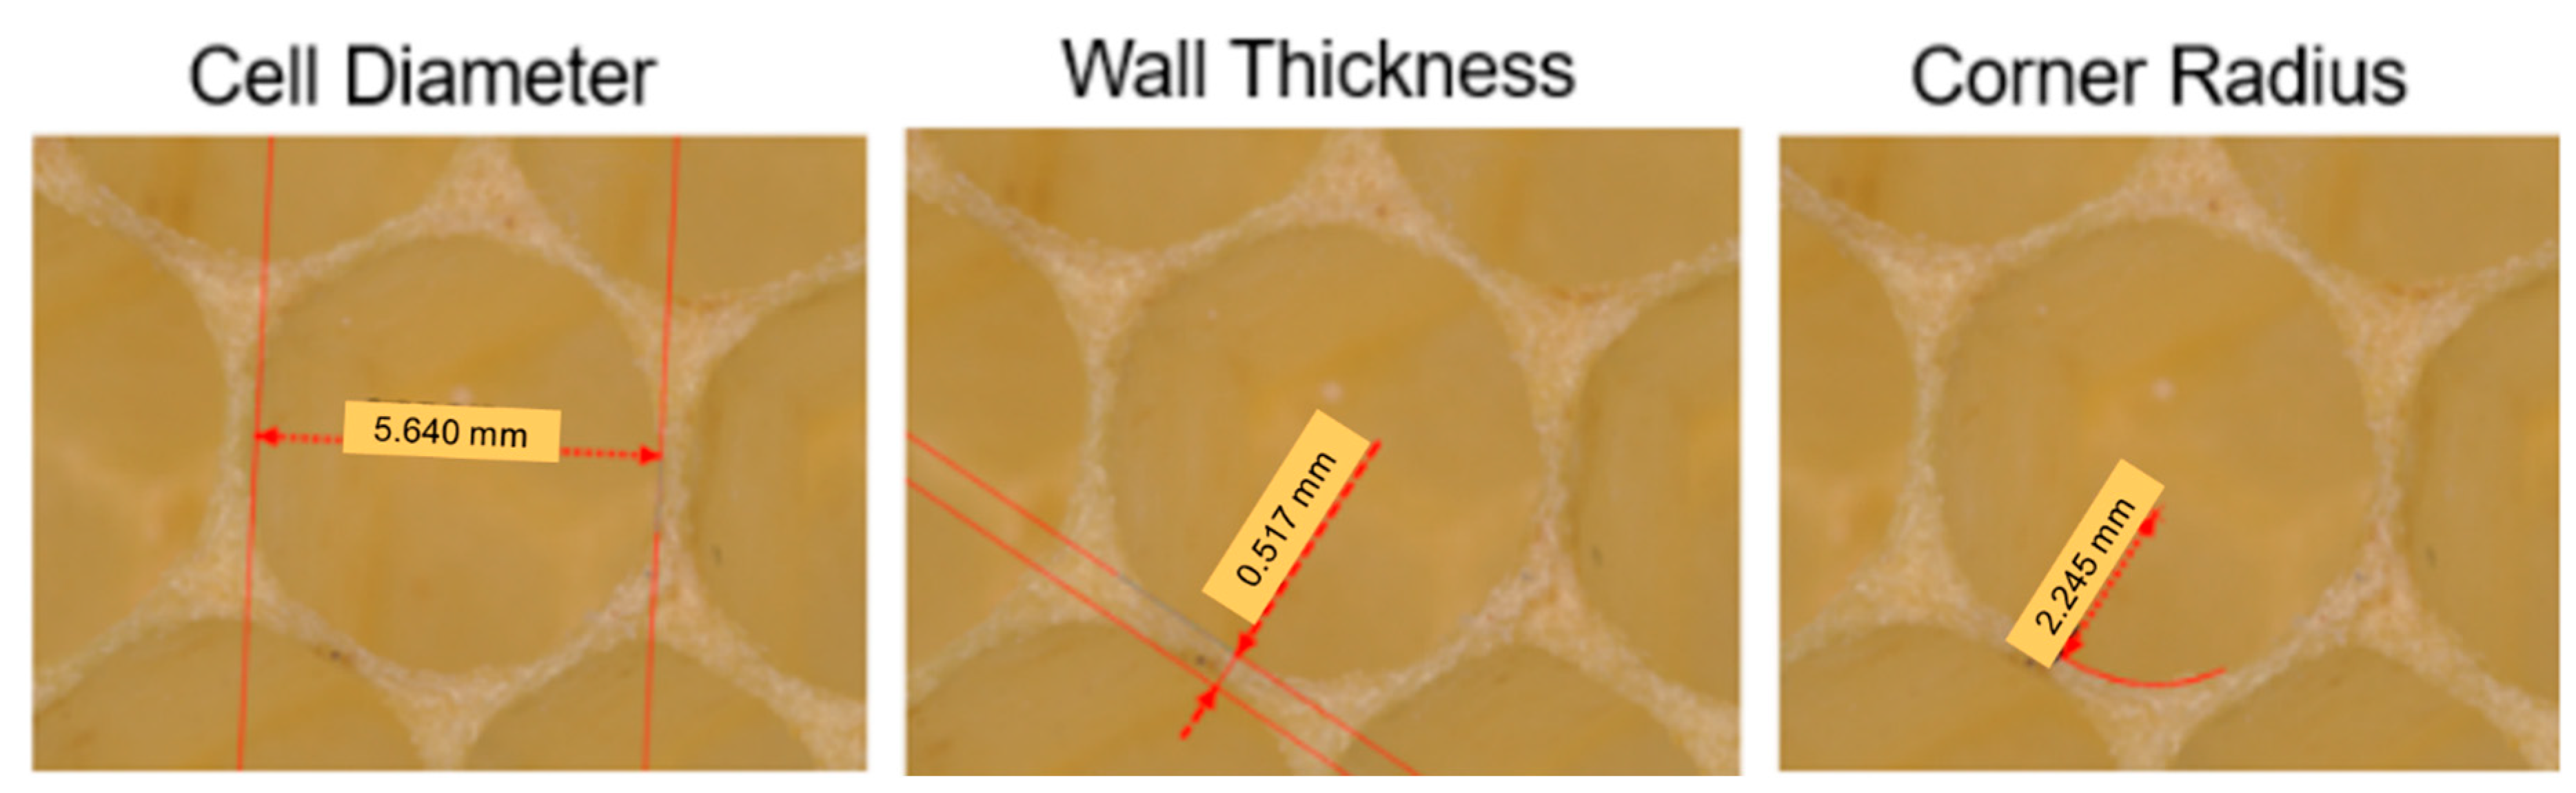
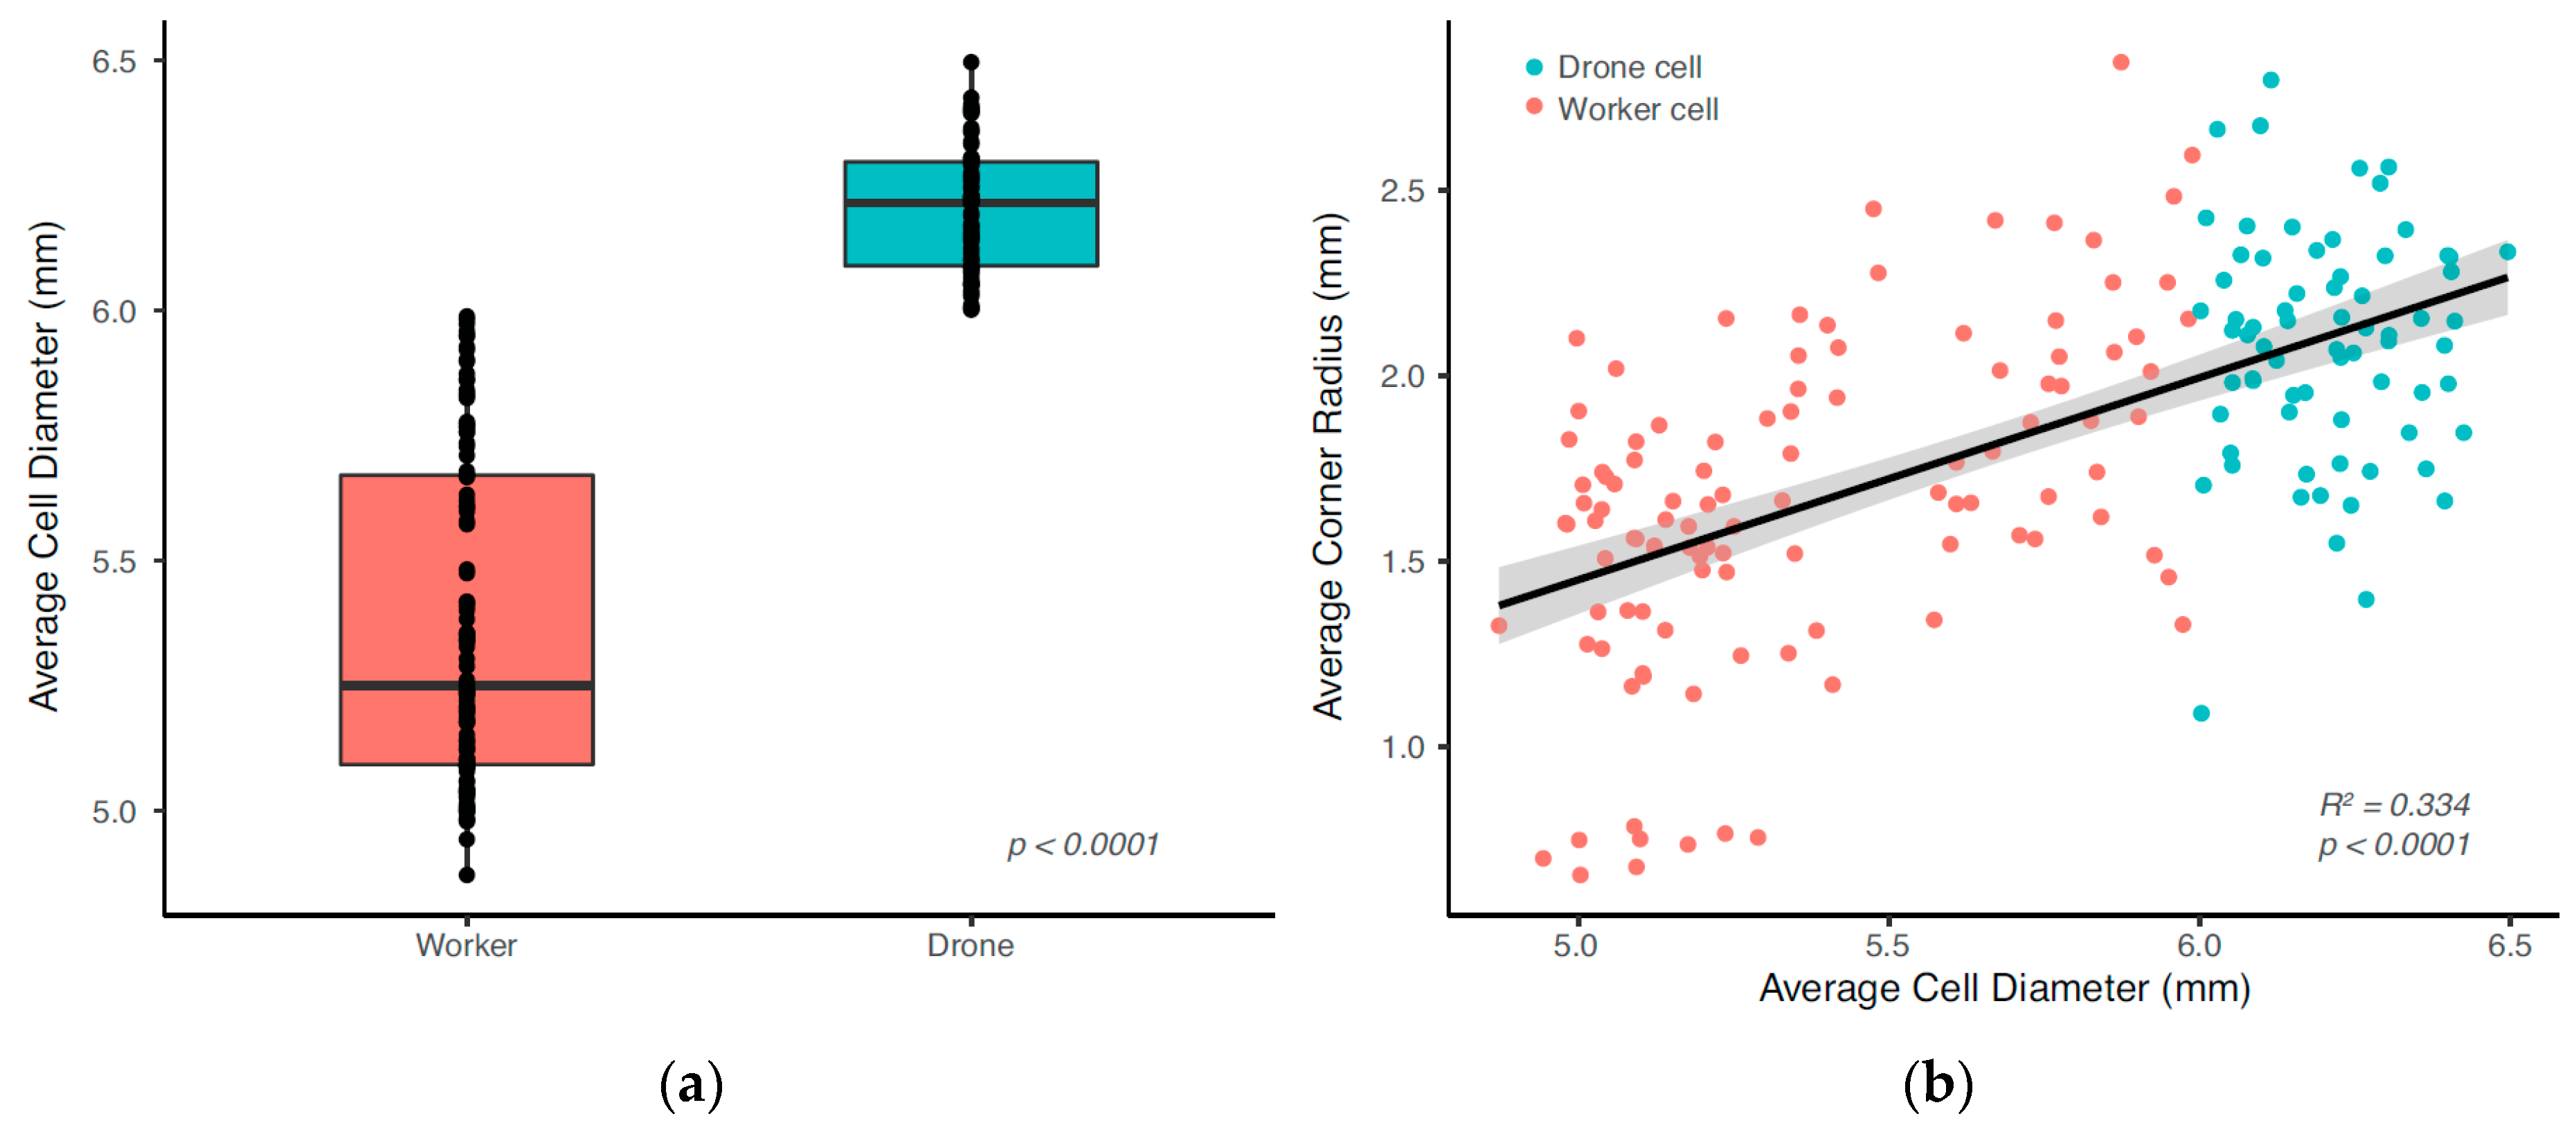
3.1. Honeybee Comb Features
3.1.1. Corner Radius
3.1.2. Coping
3.1.3. Interface
3.2. Mechanical Testing
3.2.1. Out-of-Plane Compression
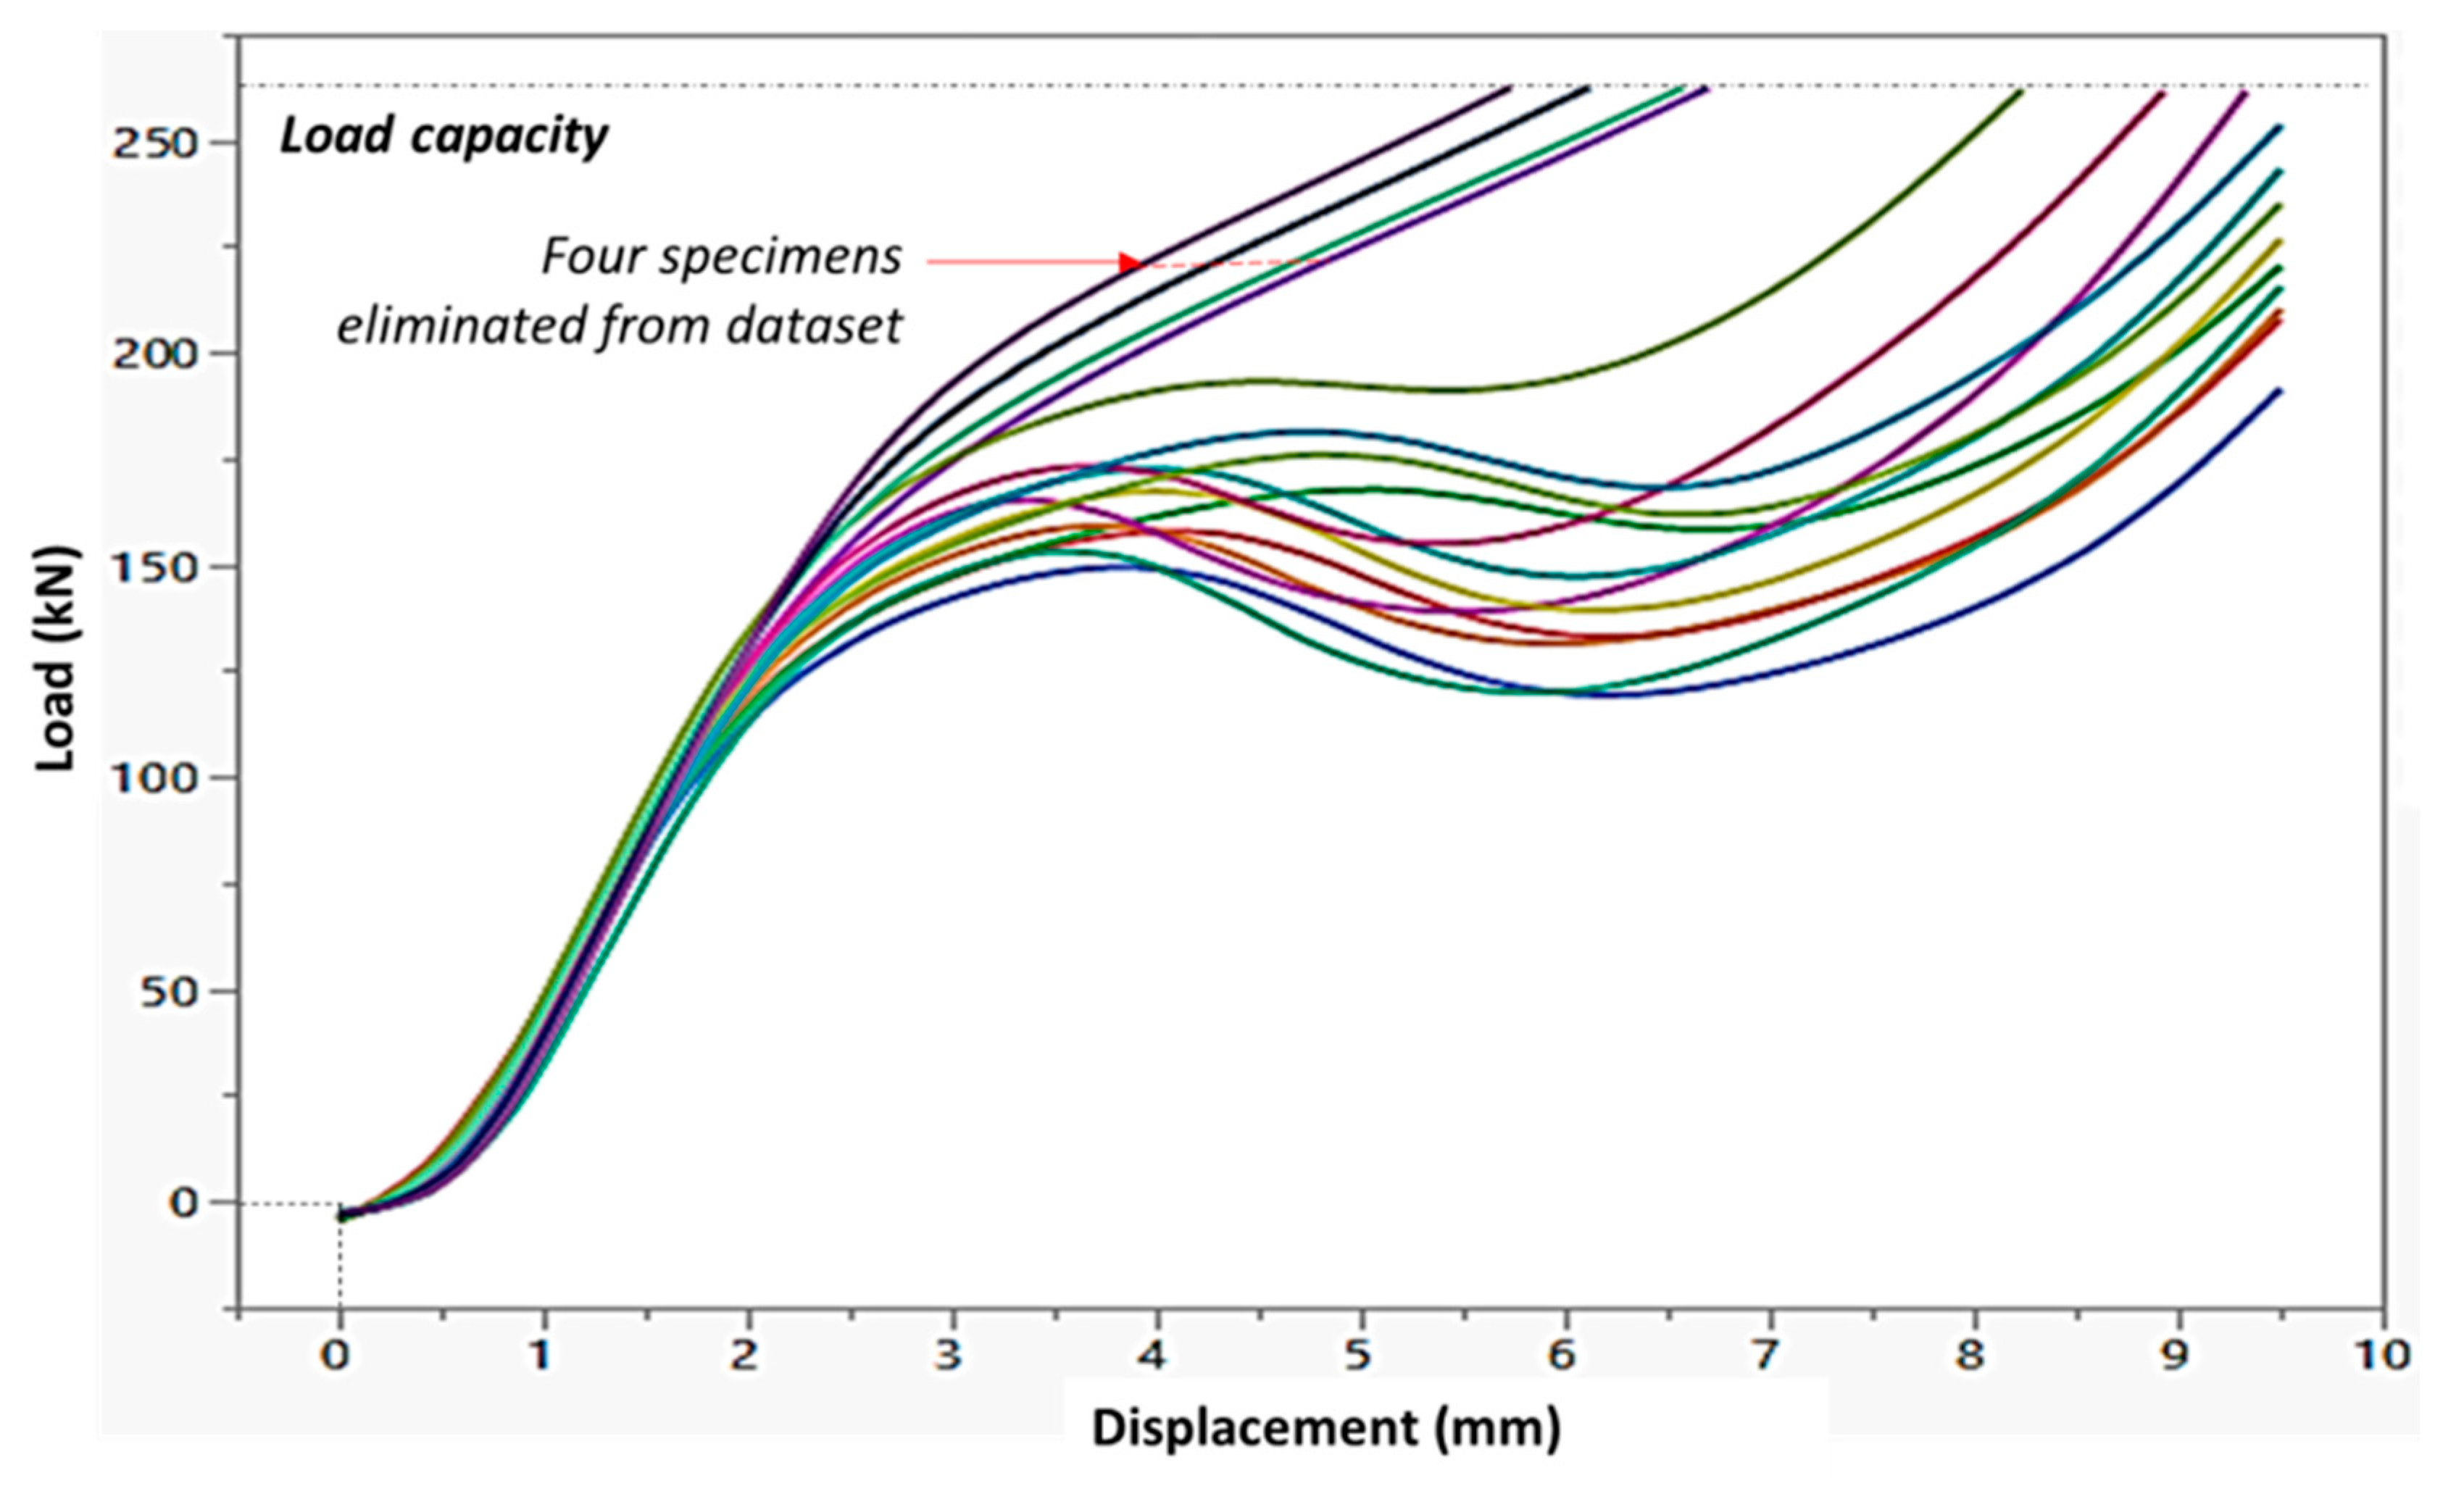
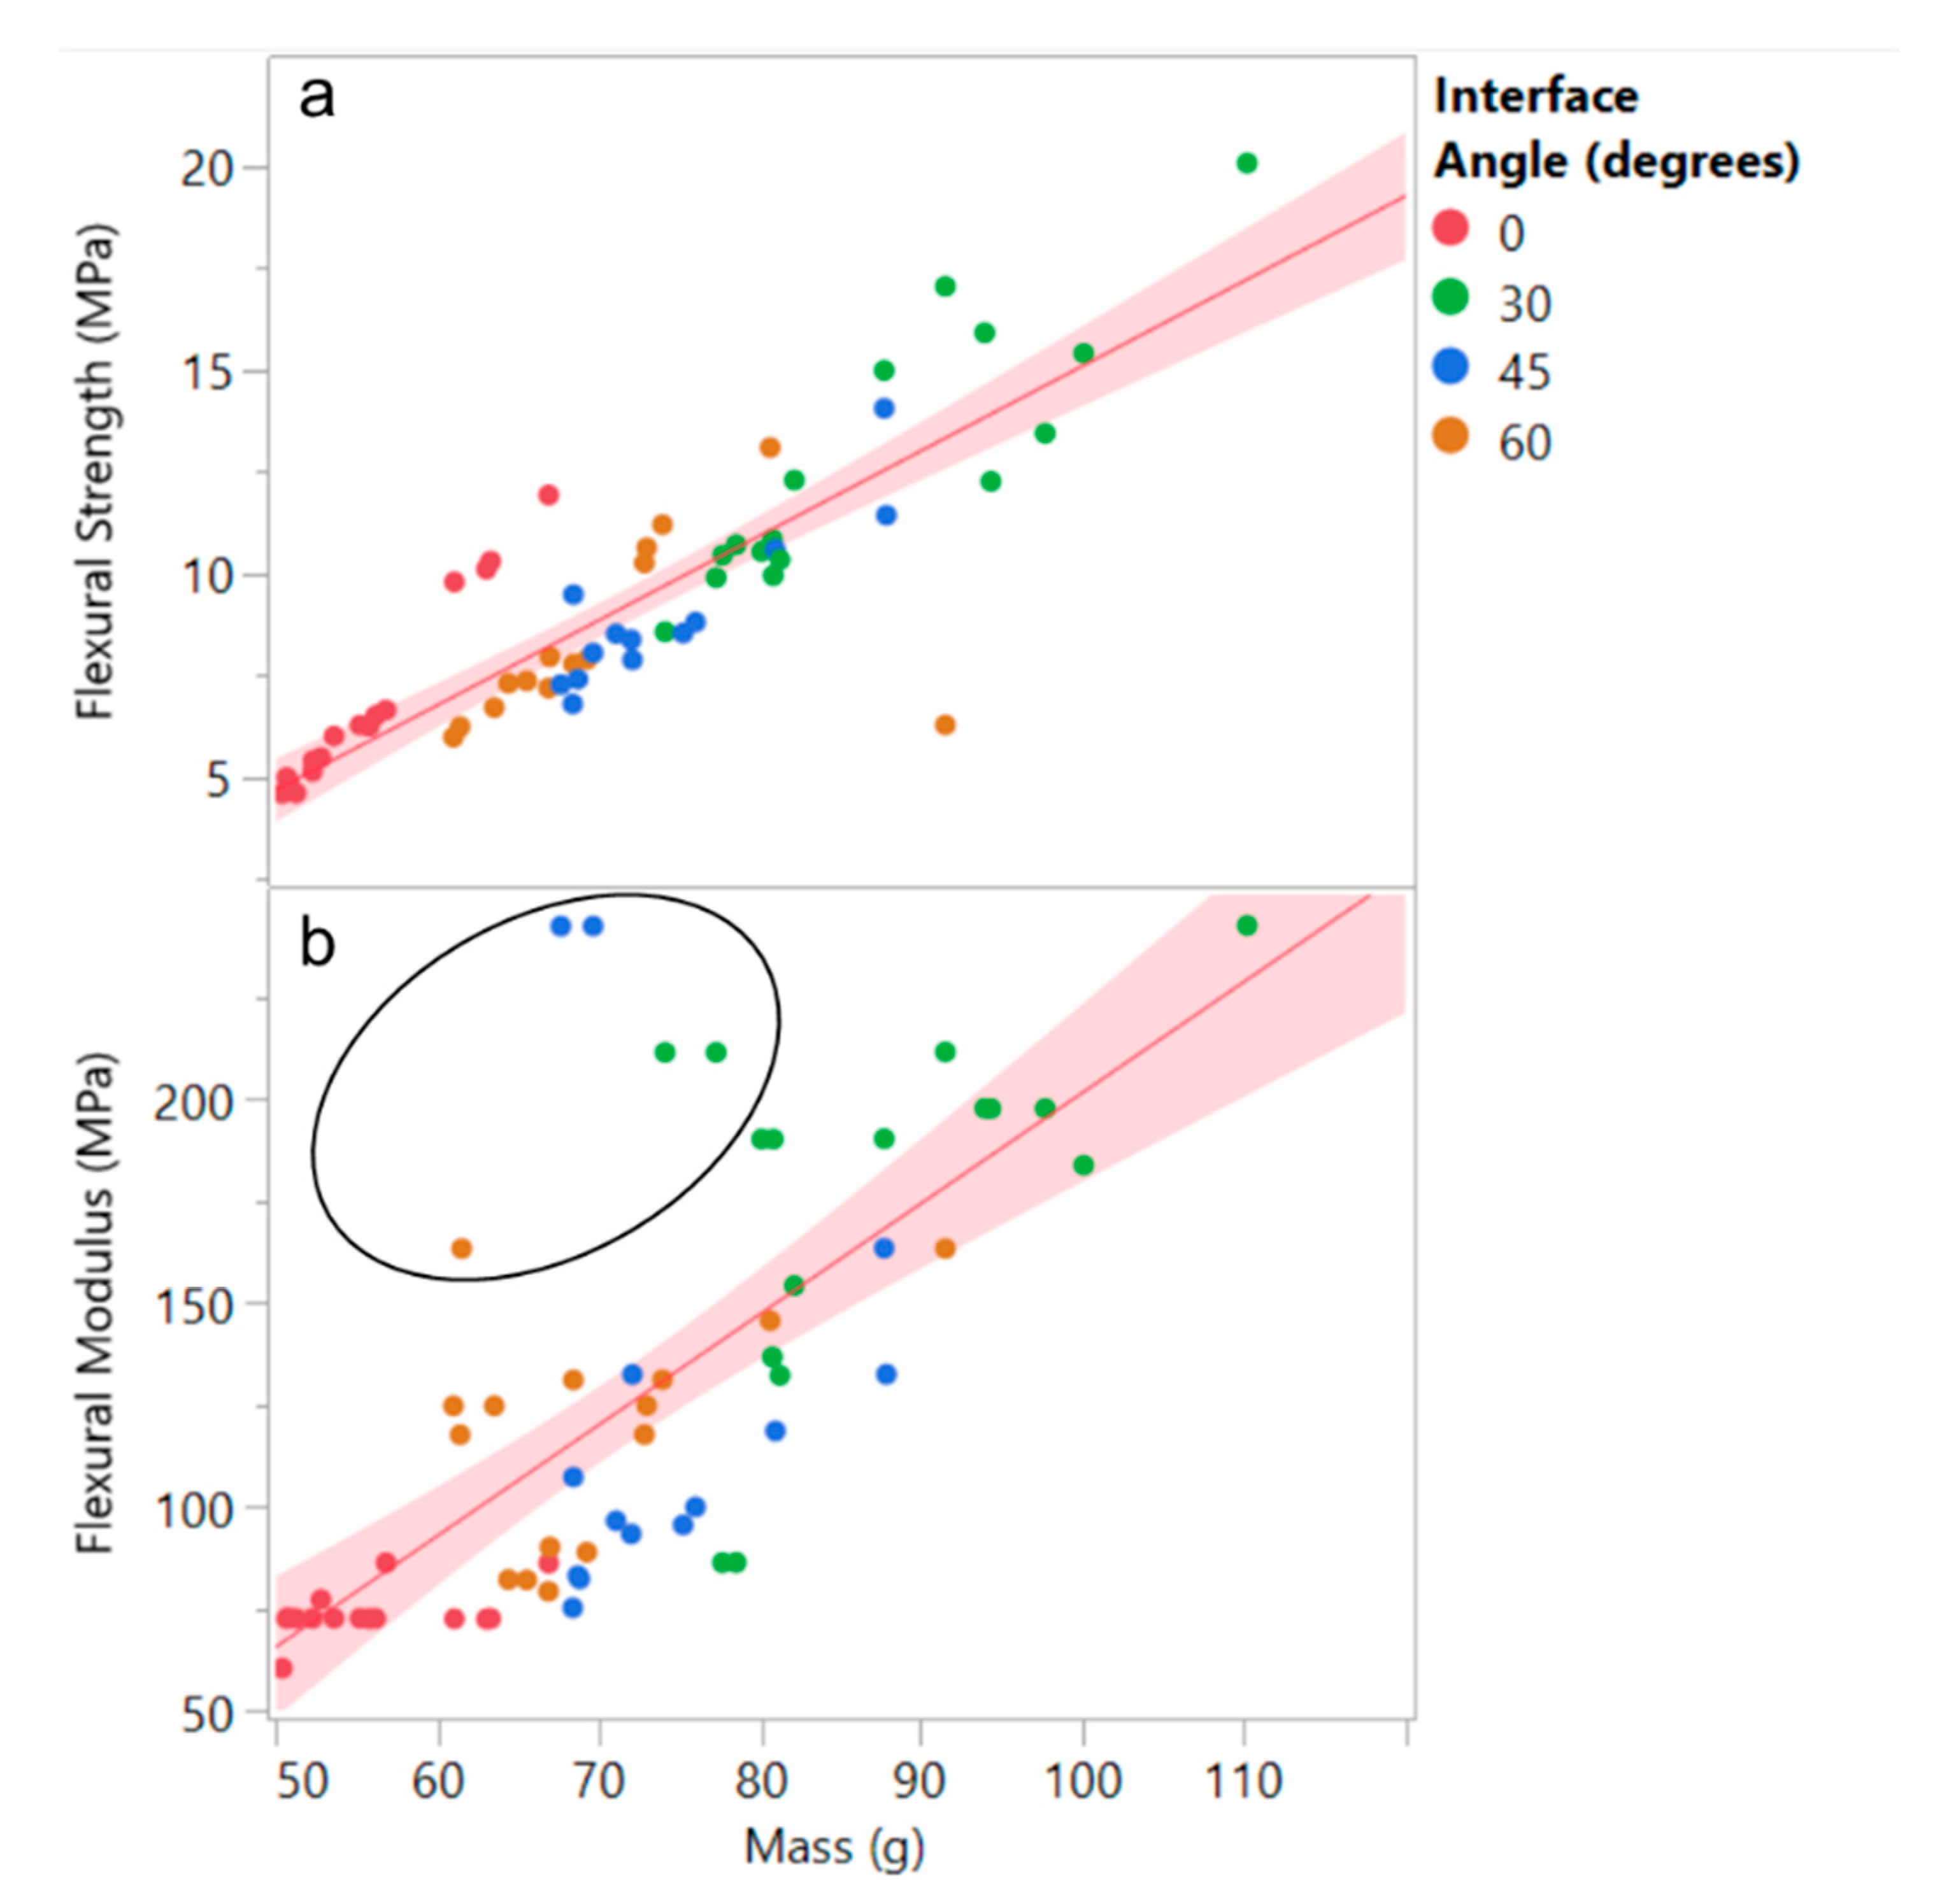
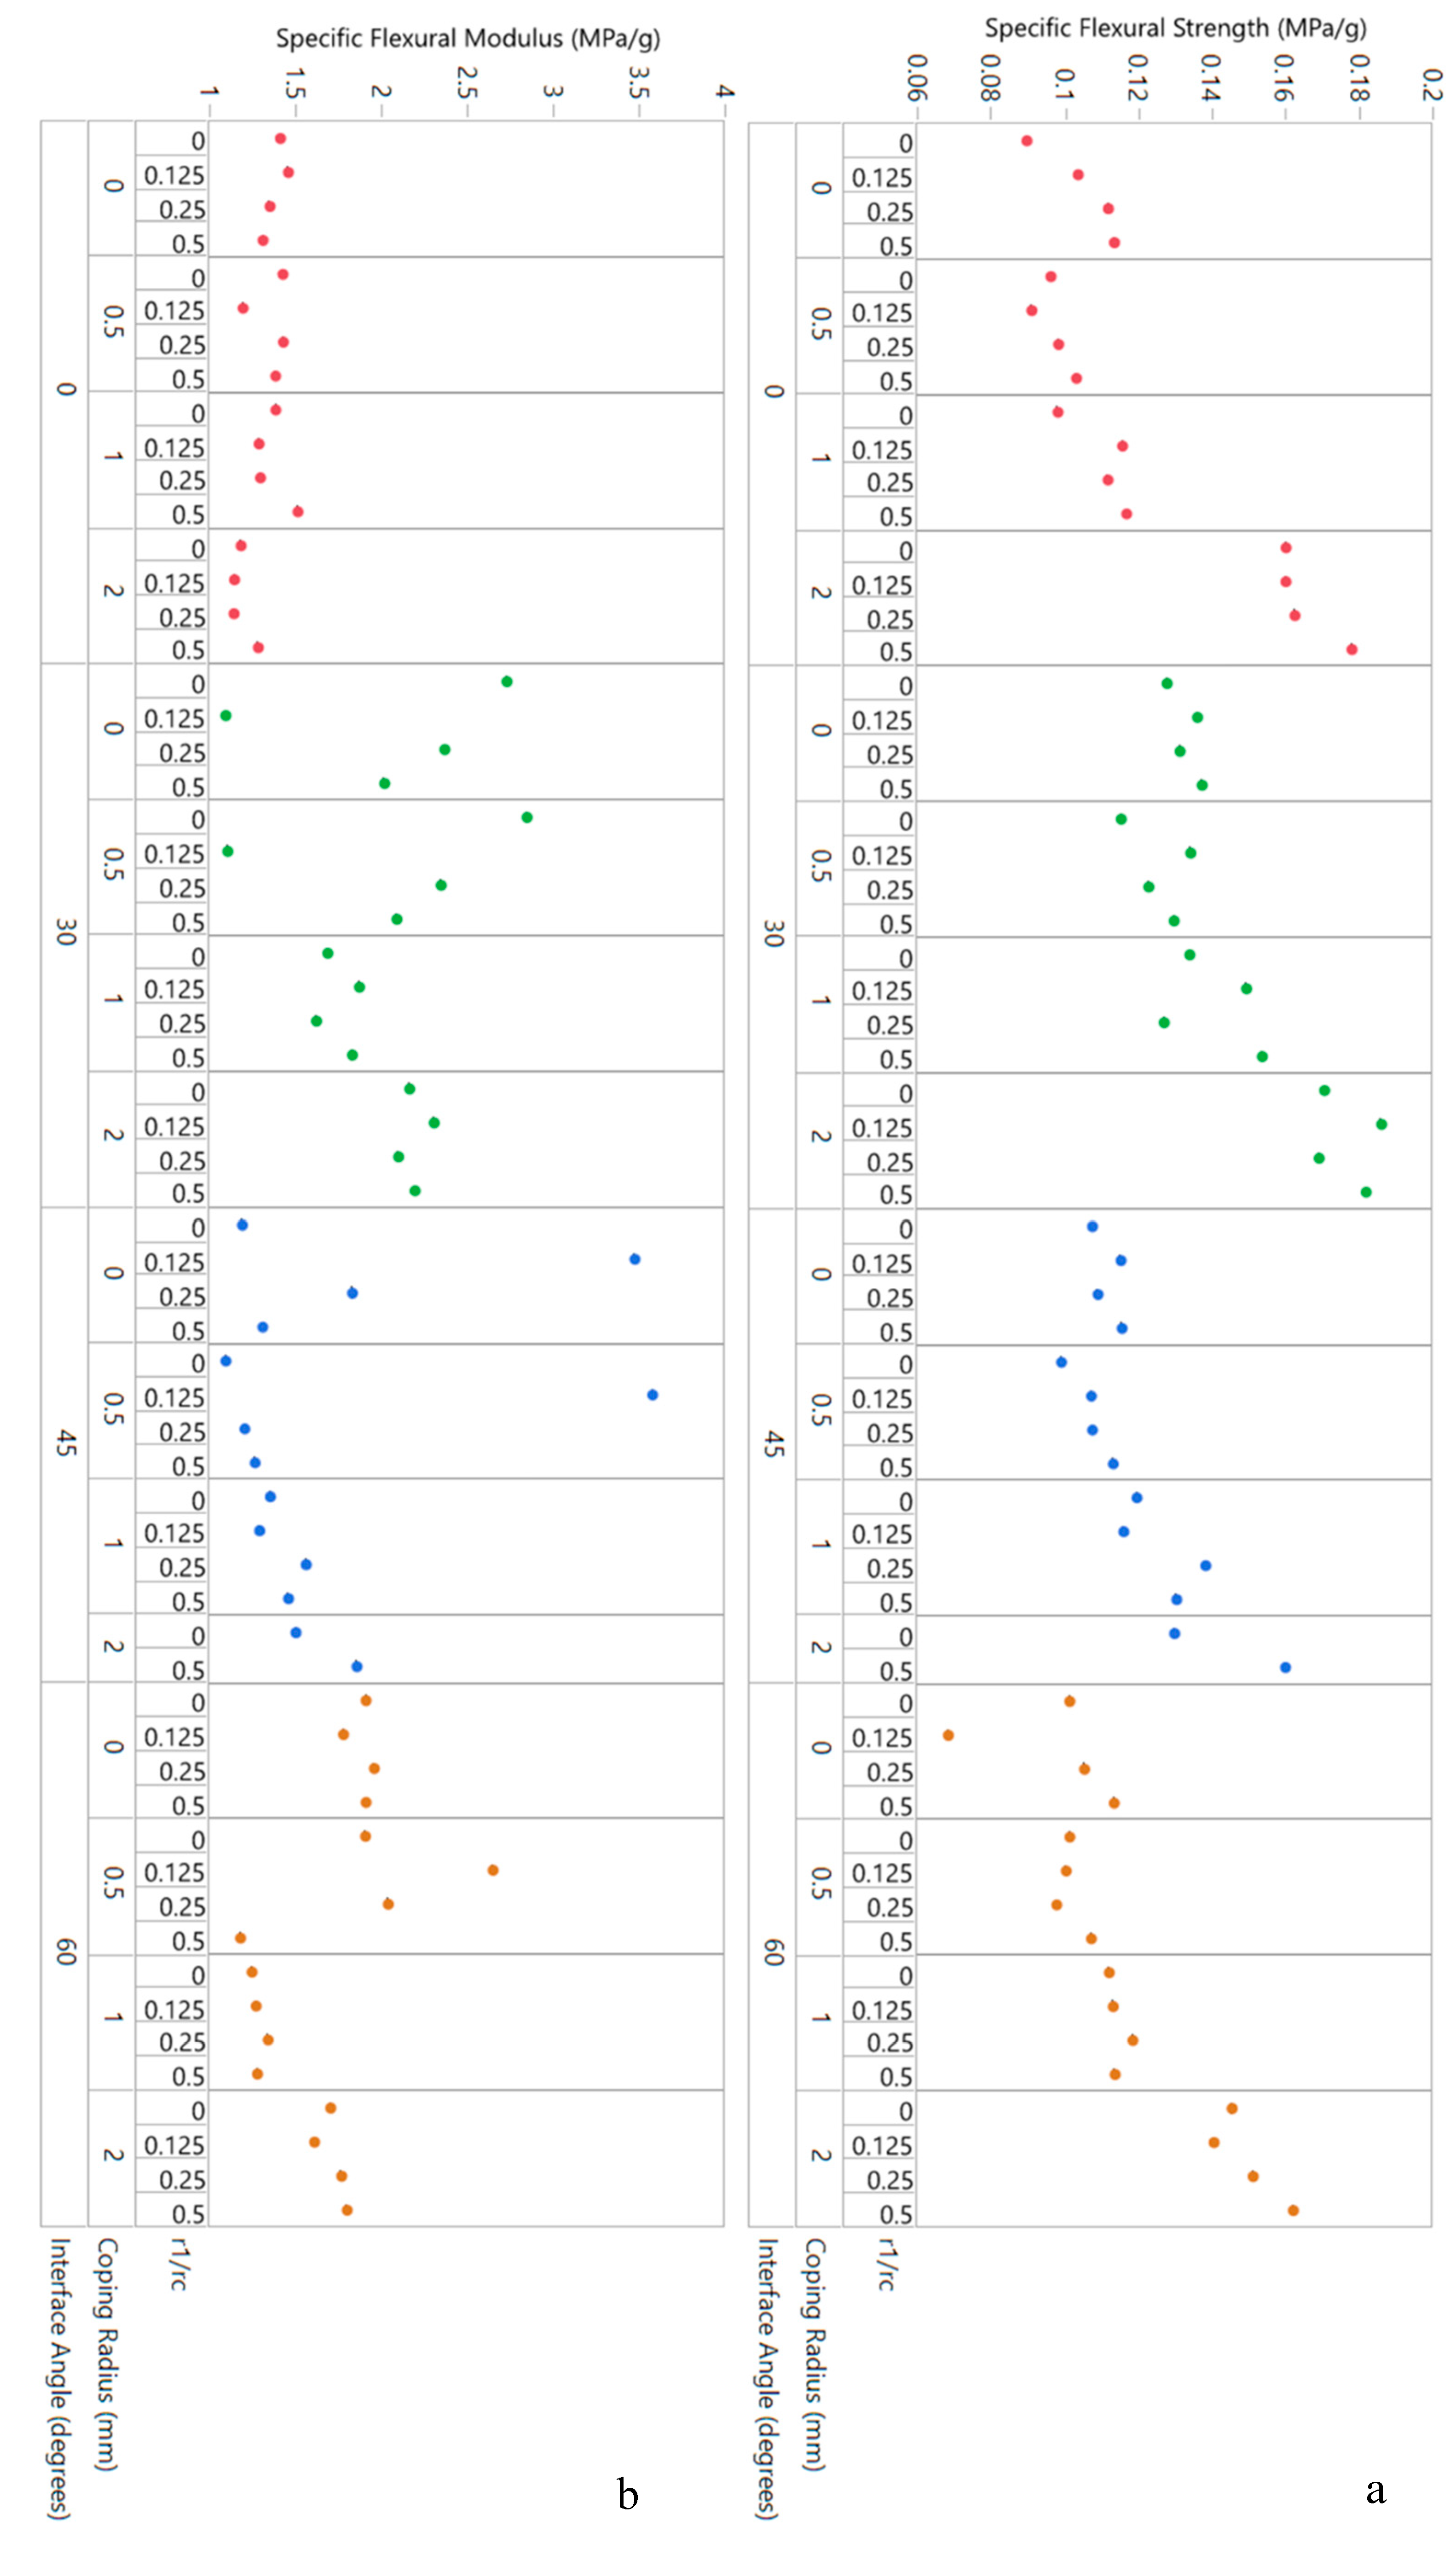
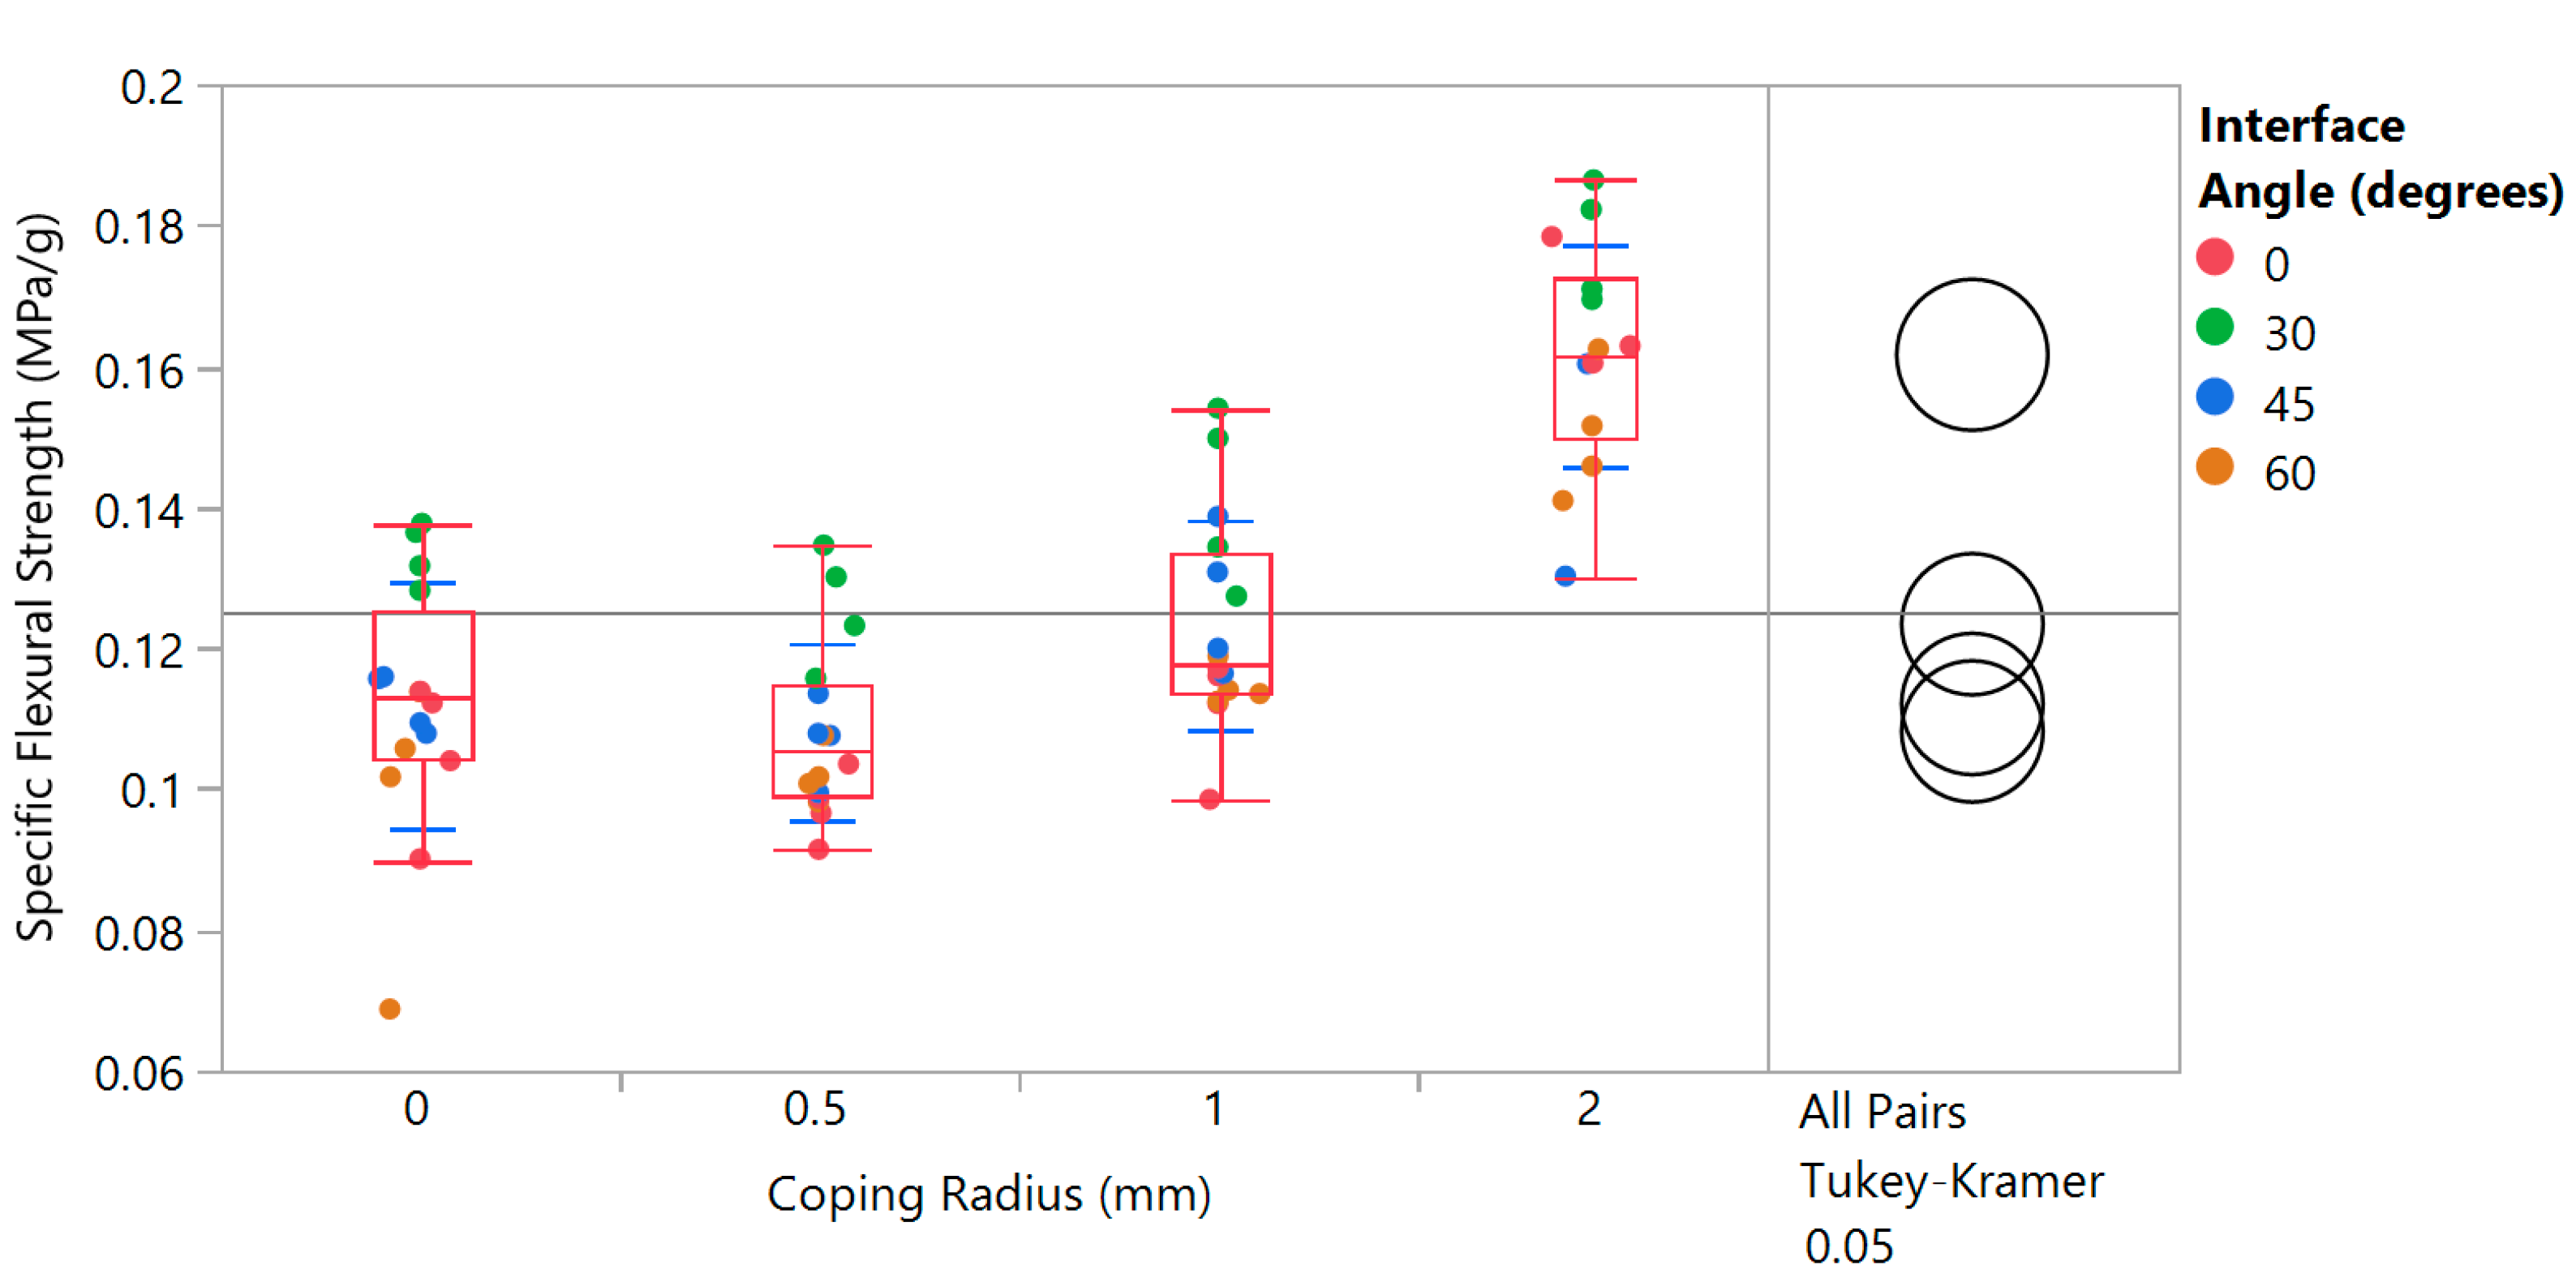
3.2.2. Three-Point Bending
4. Discussion
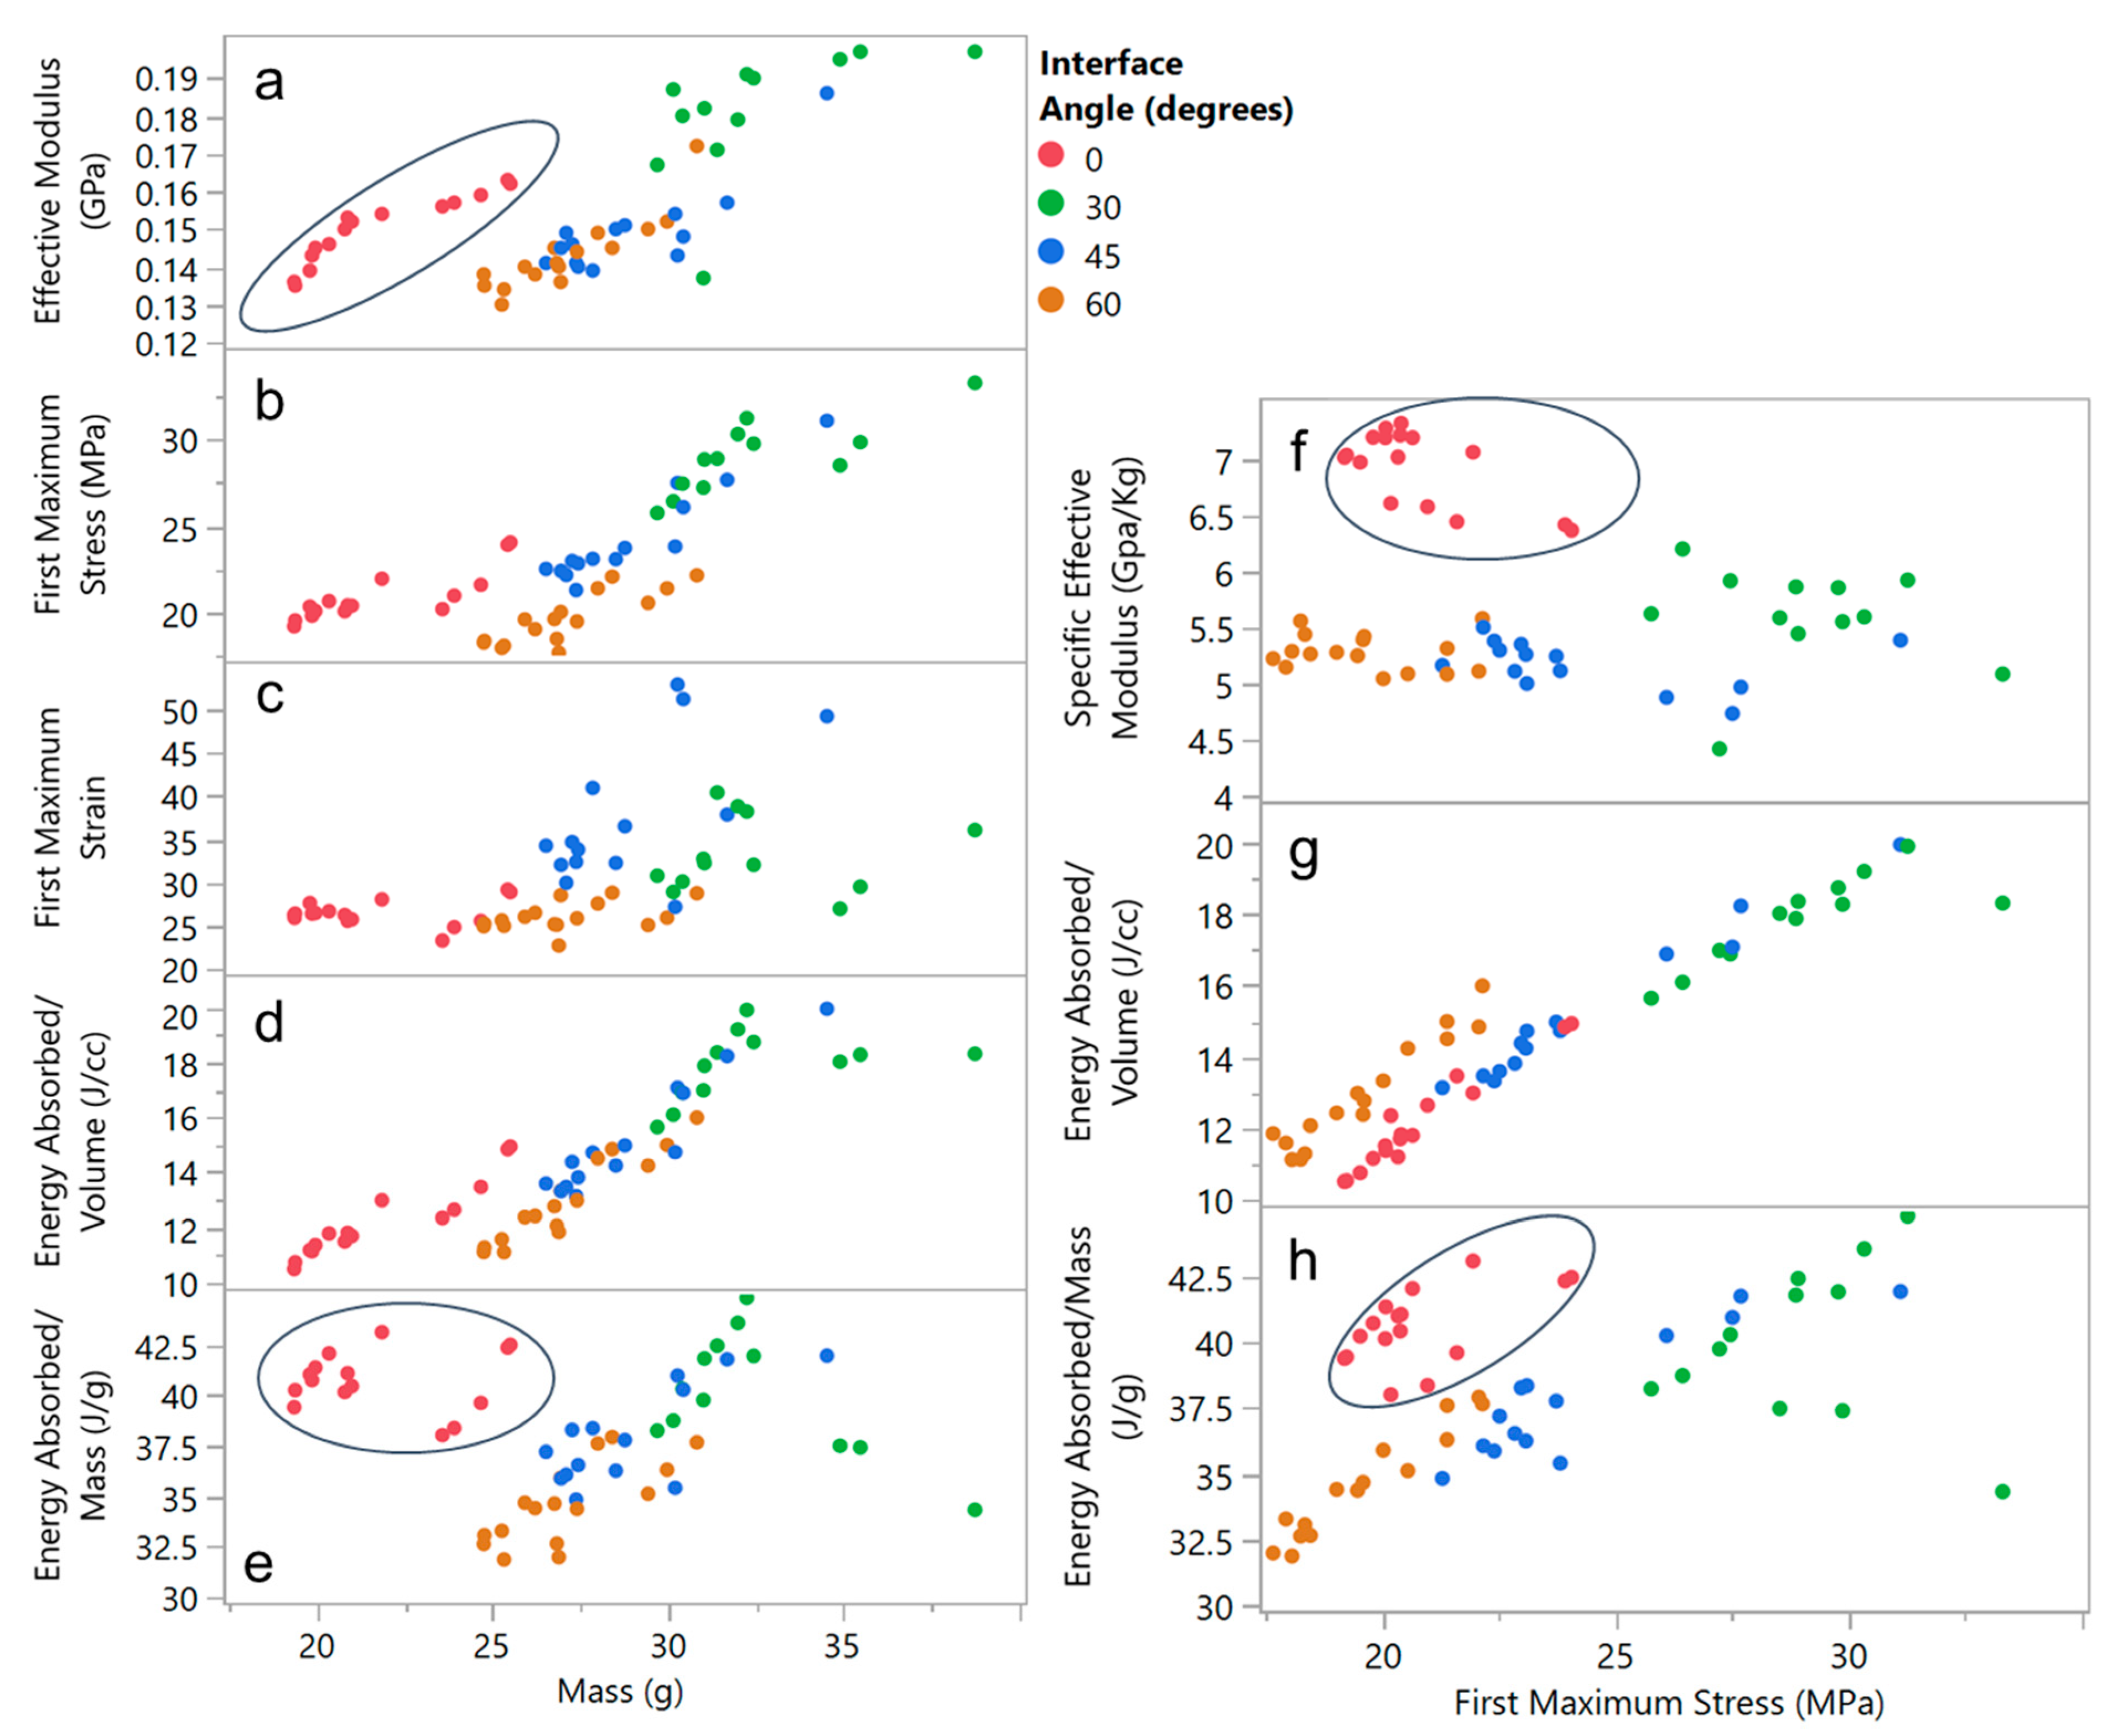
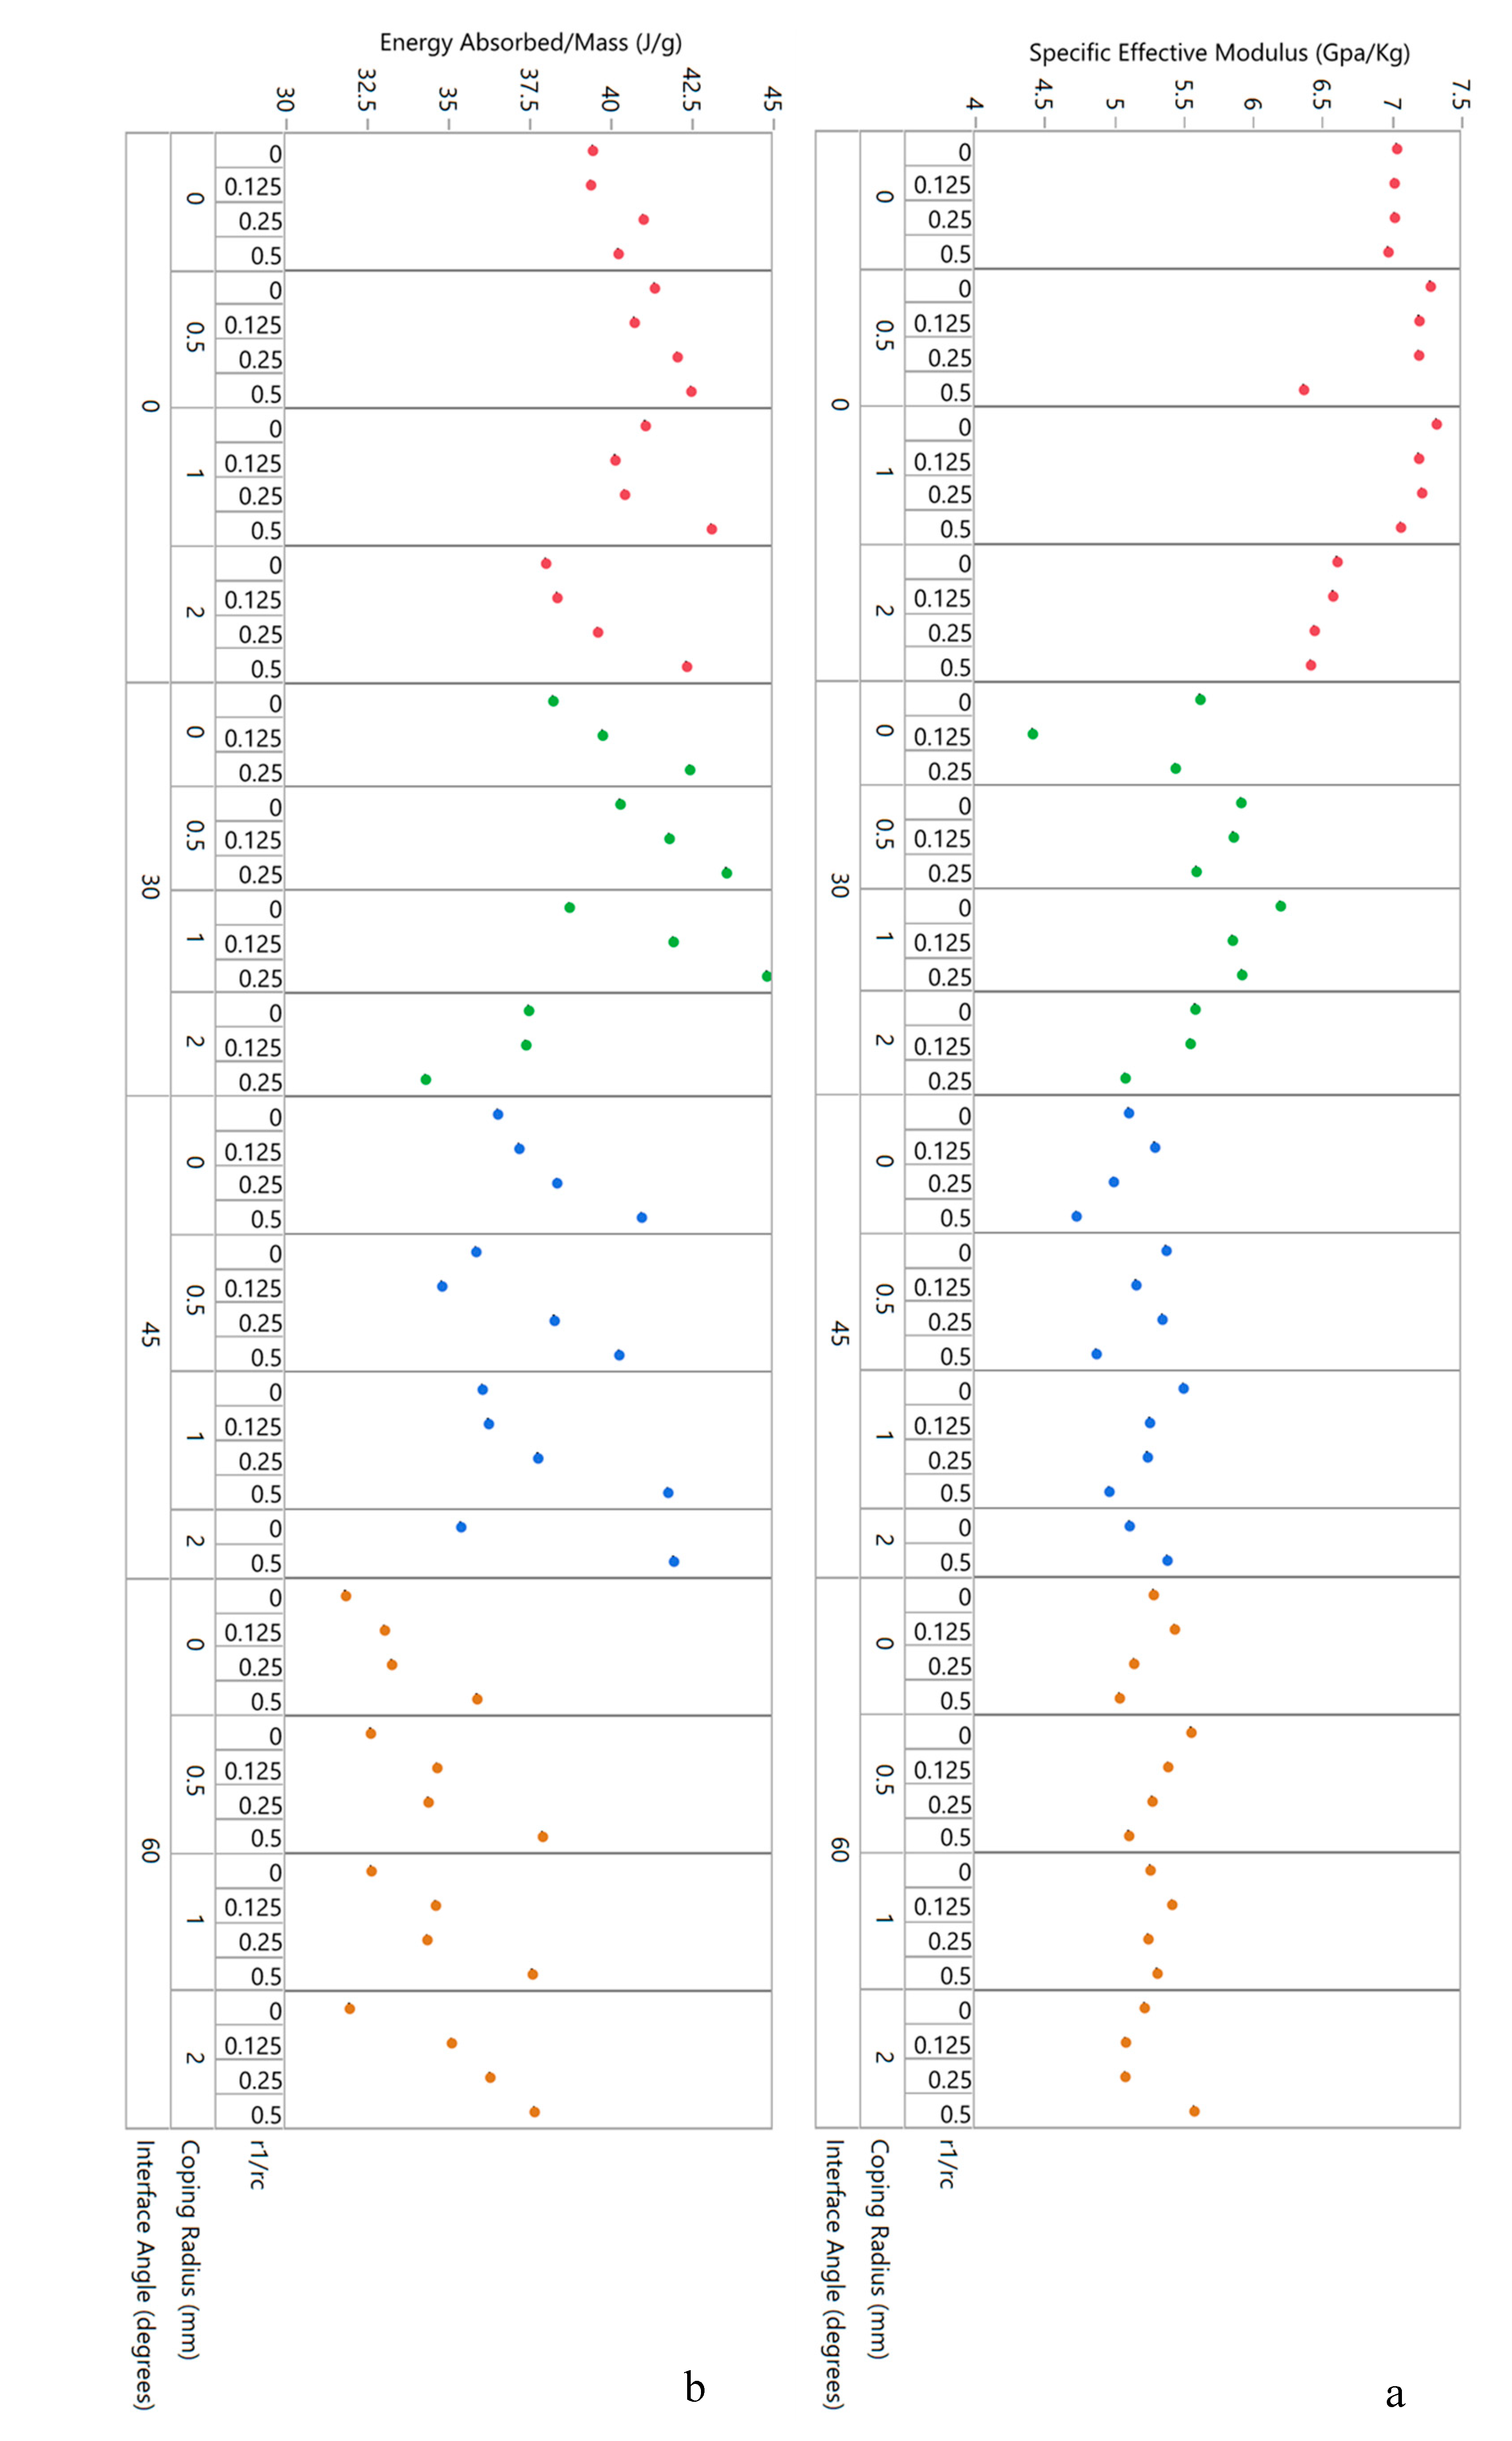
4.1. Material Allocation
- The addition of an interface increases specific flexural modulus (i.e., stiffness under bending) but has little benefit in out-of-plane compression.
- The coping radius strongly influences specific flexural strength—this is perhaps the most remarkable and significant result from the experimental data.
- The corner radius has no significant effect in bending and, actually, is slightly detrimental for out-of-plane compression testing.
4.2. Structure–Function Relationships
Supplementary Materials
Author Contributions
Funding
Acknowledgments
Conflicts of Interest
References
- Ball, P. Shapes, Nature’s Patterns; Oxford University Press: Oxford, UK, 2009. [Google Scholar]
- Hales, T.C. The honeycomb conjecture. Discret. Comput. Geom. 2001, 25, 1–22. [Google Scholar] [CrossRef] [Green Version]
- Zhang, Q.; Yang, X.; Li, P.; Huang, G.; Feng, S.; Shen, C.; Han, B.; Zhang, X.; Jin, F.; Xu, F.; et al. Bioinspired engineering of honeycomb structure—Using nature to inspire human innovation. Prog. Mater. Sci. 2015, 74, 332–400. [Google Scholar] [CrossRef]
- Malek, S.; Gibson, L. Effective elastic properties of periodic hexagonal honeycombs. Mech. Mater. 2015, 91, 226–240. [Google Scholar] [CrossRef]
- Gibson, L.; Ashby, M. Cellular Solids: Structure and Properties, 2nd ed.; Cambridge University Press: Cambridge, UK, 1999. [Google Scholar]
- Chuang, C.; Huang, J. Elastic moduli and plastic collapse strength of hexagonal honeycombs with plateau borders. Int. J. Mech. Sci. 2002, 44, 1827–1844. [Google Scholar] [CrossRef]
- Lipperman, F.; Ryvkin, M.; Fuchs, M.B. Fracture toughness of two-dimensional cellular material with periodic microstructure. Int. J. Fract. 2007, 146, 279–290. [Google Scholar] [CrossRef]
- Sun, Y.; Li, Q.M. Dynamic compressive behaviour of cellular materials: A review of phenomenon, mechanism and modelling. Int. J. Impact Eng. 2018, 112, 74–115. [Google Scholar] [CrossRef] [Green Version]
- Le, T.; Bhate, D.; Parsey, J.M.; Hsu, K.H. Determination of a Shape and Size Independent Material Modulus for Honeycomb Structures in Additive Manufacturing. Solid Free. Fabr. Symp. 2017, 2148–2169. [Google Scholar]
- Lam, Q.; Patil, D.; Le, T.; Eppley, T.; Salti, Z.; Goss, D.; Grishin, A.; Bhate, D. An examination of the low strain rate sensitivity of additively manufactured polymer, composite and metallic honeycomb structures. Materials 2019, 12, 3455. [Google Scholar] [CrossRef] [Green Version]
- Bhate, D. Four Questions in Cellular Material Design. Materials 2019, 12, 1060. [Google Scholar] [CrossRef] [Green Version]
- Karihaloo, B.L.; Zhang, K.; Wang, J. Honeybee combs: How the circular cells transform into rounded hexagons. J. R. Soc. Interface 2013, 10, 20130299. [Google Scholar] [CrossRef] [PubMed]
- Zhang, K.; Duan, H.; Karihaloo, B.L.; Wang, J. Hierarchical, multilayered cell walls reinforced by recycled silk cocoons enhance the structural integrity of honeybee combs. Proc. Natl. Acad. Sci. USA 2010, 107, 9502–9506. [Google Scholar] [CrossRef] [Green Version]
- Hepburn, H.R.; Kurstjens, S.P. The combs of honeybees as composite materials. Apidologie 1988, 19, 25–36. [Google Scholar] [CrossRef] [Green Version]
- Hepburn, H.R.; Muerrle, T.; Radloff, S.E. The cell bases of honeybee combs. Apidologie 2007, 38, 268–271. [Google Scholar] [CrossRef] [Green Version]
- Rasband, W.S.; Image, J. 1997. Available online: https://imagej.nih.gov/ij/ (accessed on 31 August 2020).
- Systemes, D. Solidworks. 2019. Available online: https://www.solidworks.com/ (accessed on 31 August 2020).
- AMS STD 401. Sandwich Construction and Core Materials; General Test Methods; SAE International: Warrendale, PA, USA, 1999. [Google Scholar]
- Gibson, I.; Rosen, D.; Stucker, B. Additive Manufacturing Technologies, 2nd ed.; Springer: Berlin/Heidelberg, Germany, 2015. [Google Scholar]
- ASTM D790-17. Flexural Properties of Unreinforced and Reinforced Plastics and Electrical Insulating Materials. ASTM Stand. 2017, 12. [CrossRef]
- Bates, D.; Maechler, M. The lme4 Package, R Packag. Version 0.999375-22. 2007. Available online: http://cran.r-project.org (accessed on 14 September 2020).
- R Core Team. R: A Language and Environment for Statistical Computing. 2018. Available online: https://www.r-project.org/ (accessed on 14 September 2020).
- Von Frisch, K. Animal Architecture (English and German Edition), 1st ed.; Harcourt: New York, NY, USA, 1974. [Google Scholar]
- Lee, P.C.; Winston, M.L. The effect of swarm size and date of issue on comb construction in newly founded colonies of honeybees (Apis mellifera L.). Can. J. Zool. 1985, 63, 524–527. [Google Scholar] [CrossRef]
- Thompson, D.W. On Growth and Form, 1st ed.; Cambridge University Press: Cambridge, UK, 1917. [Google Scholar]
- Schaedler, T.A.; Ro, C.J.; Sorensen, A.E.; Eckel, Z.; Yang, S.S.; Carter, W.B.; Jacobsen, A.J. Designing metallic microlattices for energy absorber applications. Adv. Eng. Mater. 2014, 16, 276–283. [Google Scholar] [CrossRef]
- Liu, Y.; Schaedler, T.A.; Jacobsen, A.J.; Chen, X. Quasi-static energy absorption of hollow microlattice structures. Compos. Part B Eng. 2014, 67, 39–49. [Google Scholar] [CrossRef]
- Zuhri, M.Y.M.; Guan, Z.W.; Cantwell, W.J. The mechanical properties of natural fibre based honeycomb core materials. Compos. Part B. 2014, 58, 1–9. [Google Scholar] [CrossRef]
- Ha, N.S.; Lu, G.; Xiang, X. Energy absorption of a bio-inspired honeycomb sandwich panel. J. Mater. Sci. 2019, 54, 6286–6300. [Google Scholar] [CrossRef]
- Ivañez, I.; Fernandez-Cañadas, L.M.; Sanchez-Saez, S. Compressive deformation and energy-absorption capability of aluminium honeycomb core. Compos. Struct. 2017, 174, 123–133. [Google Scholar] [CrossRef]
- Hepburn, H.R.; Pirk, C.W.W.; Duangphakdee, O. Honeybee Nests; Springer: Berlin, Germany, 2014. [Google Scholar]
- Plessis, A.D.; Broeckhoven, C.; Yadroitsava, I.; Yadroitsev, I.; Hands, C.H.; Kunju, R.; Bhate, D. Beautiful and Functional: A Review of Biomimetic Design in Additive Manufacturing. Addit. Manuf. 2019, 27, 408–427. [Google Scholar] [CrossRef]
- Zhu, H.X. Journal of the Mechanics and Physics of Solids Size-dependent elastic properties of micro- and nano-honeycombs. J. Mech. Phys. Solids 2010, 58, 696–709. [Google Scholar] [CrossRef]
- Tekoğlu, C.; Gibson, L.J.; Pardoen, T.; Onck, P.R. Size effects in foams: Experiments and modeling. Prog. Mater. Sci. 2011, 56, 109–138. [Google Scholar] [CrossRef]


| Parameter | Baseline | Low | Middle | High |
|---|---|---|---|---|
| Corner/cell radius 1 (r1/rc) | 0 | 0.125 | 0.250 | 0.500 |
| Coping radius (mm) | 0 | 0.5 | 1 | 2 |
| Interface angle (deg.) | 0 (no interface) | 30 | 45 | 60 |
Publisher’s Note: MDPI stays neutral with regard to jurisdictional claims in published maps and institutional affiliations. |
© 2020 by the authors. Licensee MDPI, Basel, Switzerland. This article is an open access article distributed under the terms and conditions of the Creative Commons Attribution (CC BY) license (http://creativecommons.org/licenses/by/4.0/).
Share and Cite
Goss, D.; Mistry, Y.; Niverty, S.; Noe, C.; Santhanam, B.; Ozturk, C.; Penick, C.A.; Lee, C.; Chawla, N.; Grishin, A.; et al. Bioinspired Honeycomb Core Design: An Experimental Study of the Role of Corner Radius, Coping and Interface. Biomimetics 2020, 5, 59. https://0-doi-org.brum.beds.ac.uk/10.3390/biomimetics5040059
Goss D, Mistry Y, Niverty S, Noe C, Santhanam B, Ozturk C, Penick CA, Lee C, Chawla N, Grishin A, et al. Bioinspired Honeycomb Core Design: An Experimental Study of the Role of Corner Radius, Coping and Interface. Biomimetics. 2020; 5(4):59. https://0-doi-org.brum.beds.ac.uk/10.3390/biomimetics5040059
Chicago/Turabian StyleGoss, Derek, Yash Mistry, Sridhar Niverty, Cameron Noe, Bharath Santhanam, Cahit Ozturk, Clint A. Penick, Christine Lee, Nikhilesh Chawla, Alex Grishin, and et al. 2020. "Bioinspired Honeycomb Core Design: An Experimental Study of the Role of Corner Radius, Coping and Interface" Biomimetics 5, no. 4: 59. https://0-doi-org.brum.beds.ac.uk/10.3390/biomimetics5040059