
Binding Constants of Clinical Drugs and Other Organic Ligands with Human and Mammalian Serum Albumins


Chemical Institute, Kazan Federal University, Kremlevskaya 18, 420008 Kazan, Russia
*
Author to whom correspondence should be addressed.
Biophysica 2021, 1(3), 344-358; https://0-doi-org.brum.beds.ac.uk/10.3390/biophysica1030026
Submission received: 11 August 2021
/
Revised: 27 August 2021
/
Accepted: 3 September 2021
/
Published: 8 September 2021
Abstract
:A dataset containing the experimental values of the equilibrium binding constants of clinical drugs, and some other organic ligands with human and mammalian (predominantly bovine) serum albumins, is assembled. The affinity of drugs to albumin governs their pharmacokinetic properties, related to permeability through physiological barriers and distribution within the organism. The dataset contains 1755 records gathered from 346 original literature sources describing the albumin affinity of 324 different substances. The data were extracted from both articles and existing protein-binding databases applied strict data selection rules in order to exclude the values influenced by the third-party compounds. The dataset provides the details on the experimental conditions of the measurements, such as temperature; protein and ligand concentrations; buffer pH, composition and concentration; and the method and model used for the binding constant calculations. Analysis of the data reveals discrepancies between the values from different studies, as well as the significant influence of the measurement method. Averaging the values from multiple independent measurements from the dataset may help to determine the reliable values of the binding constants. The dataset can be used as the reference dataset for the development of predictive models to calculate binding constants, and as the choice for the experimental setup in the future albumin-binding studies.
1. Introduction
Serum albumin is the major transport protein in human and mammalian blood distributing various molecules within the organism. Albumin can bind substances with different molecular size, shape and functional groups—from small organic molecules to other proteins [1]. The processes of binding of various drugs, drug candidates, and bioactive compounds with albumin have been studied very extensively. There are rapidly establishing equilibria between the dissolved albumin and ligand molecules and their complex or complexes, which can be characterized using the thermodynamic association (Ka) or dissociation (Kd) constants. Many key drug properties, such as the physiological barriers, permeability, distribution between organs and tissues, efficacy, and clearance are influenced by the magnitudes of these constants [2,3,4].
The experimental measurements of the albumin-binding constants have been the focus of research since 1940s [5]. A number of different measurement techniques have been used for this purpose [6]. However, obtaining accurate values of the binding constants is still a complicated task. The results of the measurements are heavily dependent on the measurement method, conditions, and data-processing algorithm. A difference of 1–2 orders of magnitude between the values reported in different studies is not uncommon. These problems are linked with both the complicated mechanism of protein–ligand interactions and the limitations of instrumental methods. Some of the possible issues are discussed in more detail below.
There are still no attempts to compile and critically analyze the available albumin-binding constants even for some particular groups of chemical compounds, despite the fact that the amount of accumulated data for human and bovine serum albumins is huge in comparison with other proteins. We assembled a dataset of experimental values of the binding constants of drugs and some other organic ligands used in medicinal chemistry studies with mammalian serum albumins. The data come from two types of sources: scientific articles manually processed by us (1237 records) and established databases containing ligand–protein affinities for many different proteins, ChemBL [7] (454 records) and BindingDB [8] (64 records). Our own literature survey primarily focused on the approved clinical drugs for which a significant number of independent studies of albumin-binding affinity were conducted. This may help to understand the effect of the measurement techniques and conditions on the obtained results, exclude obviously erroneous data, and choose the recommended values for the development of theoretical predictive models.
2. Materials and Methods
2.1. Definition of the Binding Constants
The simplest and most commonly used model of albumin-ligand binding is 1:1 binding. The binding equilibrium can be characterized either with an association constant Ka or dissociation constant Kd:
where [PL], [P], [L] are equilibrium concentrations of the protein–ligand complex, free protein, and free ligand respectively. The molarity-based standard state is usually used, which means that all the concentrations are expressed in M. In biological and medicinal chemistry articles, the dissociation constants sometimes have an nM dimension, which makes their numerical values larger than 1 in the majority of cases.
In fact, albumin has several binding sites [9] and is able to bind to more than one molecule from many compounds. Despite all the binding sites being different and some of them close to each other in terms of space, they are often described using a multiple independent binding site model. In this model, the protein is assumed to have a number of binding sites characterized with site-specific binding constants. For each site, these constants do not change when any number of ligand molecules bind to the other sites. Some of these sites can be identical. If ni is the number of the i-th type of sites having the association constant Ki, then the average number r of the ligand molecules bound by a single protein molecule is given by:
In experimental studies, one or two types of binding sites are usually assumed, since fitting the obtained data with an equation containing three or more unknown constants will produce unreliable values. For a single type of site with the association constant K, the data can be analyzed using the Scatchard equation [10]:
or the Klotz equation [11]:
These equations allow for the determination of the values of n and K using linear regression from the values of r calculated from the experimental data at known ligand concentrations. Generally, this provides the non-integer values of n, which are given, as in many other works. However, if the independent sites model is valid for the studied case, n should be close to the integer values.
2.2. Dataset Structure and Criteria of Data Selection
The literature was searched for the experimental binding constants of 85 different clinical drugs with mammalian albumins. For each experiment with a particular ligand-albumin system from literature, the following details were provided if possible: albumin source organism, ligand chemical name, canonical SMILES, InChIKey, the binding constant value (either Ka or Kd) in molarity-based scale, temperature, albumin and ligand concentrations, buffer pH, composition and concentration, experimental method, model used for the binding constant calculation, and the DOI or link to the source paper. For the results obtained using independent binding sites model, the average number of binding sites n was also provided. If two different types of binding sites were suggested, the second site-specific binding constant Ka2 or Kd2 and the number of the second-type sites n2 into separate columns were given. The values of the third and subsequent binding constants are unreliable and were ignored. For some systems, the enthalpies of binding were determined either from the temperature dependence of the binding constant or by using direct calorimetric measurements. Their values were also given in the respective column.
Some data sources could have been missed during the manual literature search. Thus, the albumin-binding data available in the online ChemBL and BindingDB databases were added. However, these databases did not provide all the details that were included in our table, and many of the experiments reported there did not meet some of our criteria described below. Hence, each data source cited by ChemBL and BindingDB was independently analyzed in order to accept or reject the data and provide additional experimental details. The online databases were not limited to clinical drugs and contain the binding data for drug candidates, biologically active substances, or any other organic ligands studied in the literature. They were not excluded from our consideration if they met our criteria since they could be valuable for the further expansion of our dataset.
The criteria of data selection were based on the idea of collecting only the binding data between albumin and ligand in solution in the absence of any other proteins or ligands.
- 1.
- All in vivo studies of plasma binding or any experiments with serum from living organisms containing a mixture of proteins were excluded;
- 2.
- The experiments in the presence of any organic or inorganic substances (e.g., non-alkali metal ions), other than buffer/medium components, were rejected. In particular, the experiments involving albumin-binding site markers were excluded. It should be understood that commonly used Sudlow I/II site markers, such as ibuprofen, ketoprofen, or indomethacin, were in fact capable of binding with several different sites of albumin molecules as evidenced by X-ray studies [12]. Thus, the possibility of the selective displacement of other compounds with these markers was questionable;
- 3.
- The data for the binding of albumin with peptides and macromolecules, as well as with noncovalently bound supramolecular associates, were not included;
- 4.
- The binding constants determined from HPLC experiments using columns with chemically bonded protein-stationary phases, as well as measurements using albumin immobilized on beads, were excluded. In such experiments, ligands interacted with albumin in a different phase which may have had different binding properties (affected by the properties of the support material and bonding density) than a dissolved albumin molecule;
- 5.
- The results with an indirect relationship or no relationship (e.g., hypothetical or correlation-based) with the protein–ligand binding constant in solution were excluded. An example was the measuring of the inhibition of glycation [13] or albumin enzymatic activity by the ligands;
- 6.
- The binding/dissociation constant values were not calculated from the experimental data if the authors of the original research did not provide them in an explicit way.
3. Results and Discussion
3.1. Experimental Methods
For a detailed description of the experimental methods used to study protein–ligand binding, as well as some of their specific shortcomings and limitations, readers are referred to a comprehensive review in [14]. General issues of the experimental studies of albumin binding are related to the existence of a number of binding sites and the validity of a 1:1 binding assumption only in a narrow range of ligand/albumin ratios, as well as the significant dimerization of albumin even at micromolar concentrations; the influence of impurities (e.g., fatty acids [15]) which can compete for the binding centers of albumin; the pH and ionic strength dependence of the binding affinity; and the low stability of albumin solutions in ambient conditions. All of these factors cause large variations in the obtained values from different studies, which can be seen in our dataset.
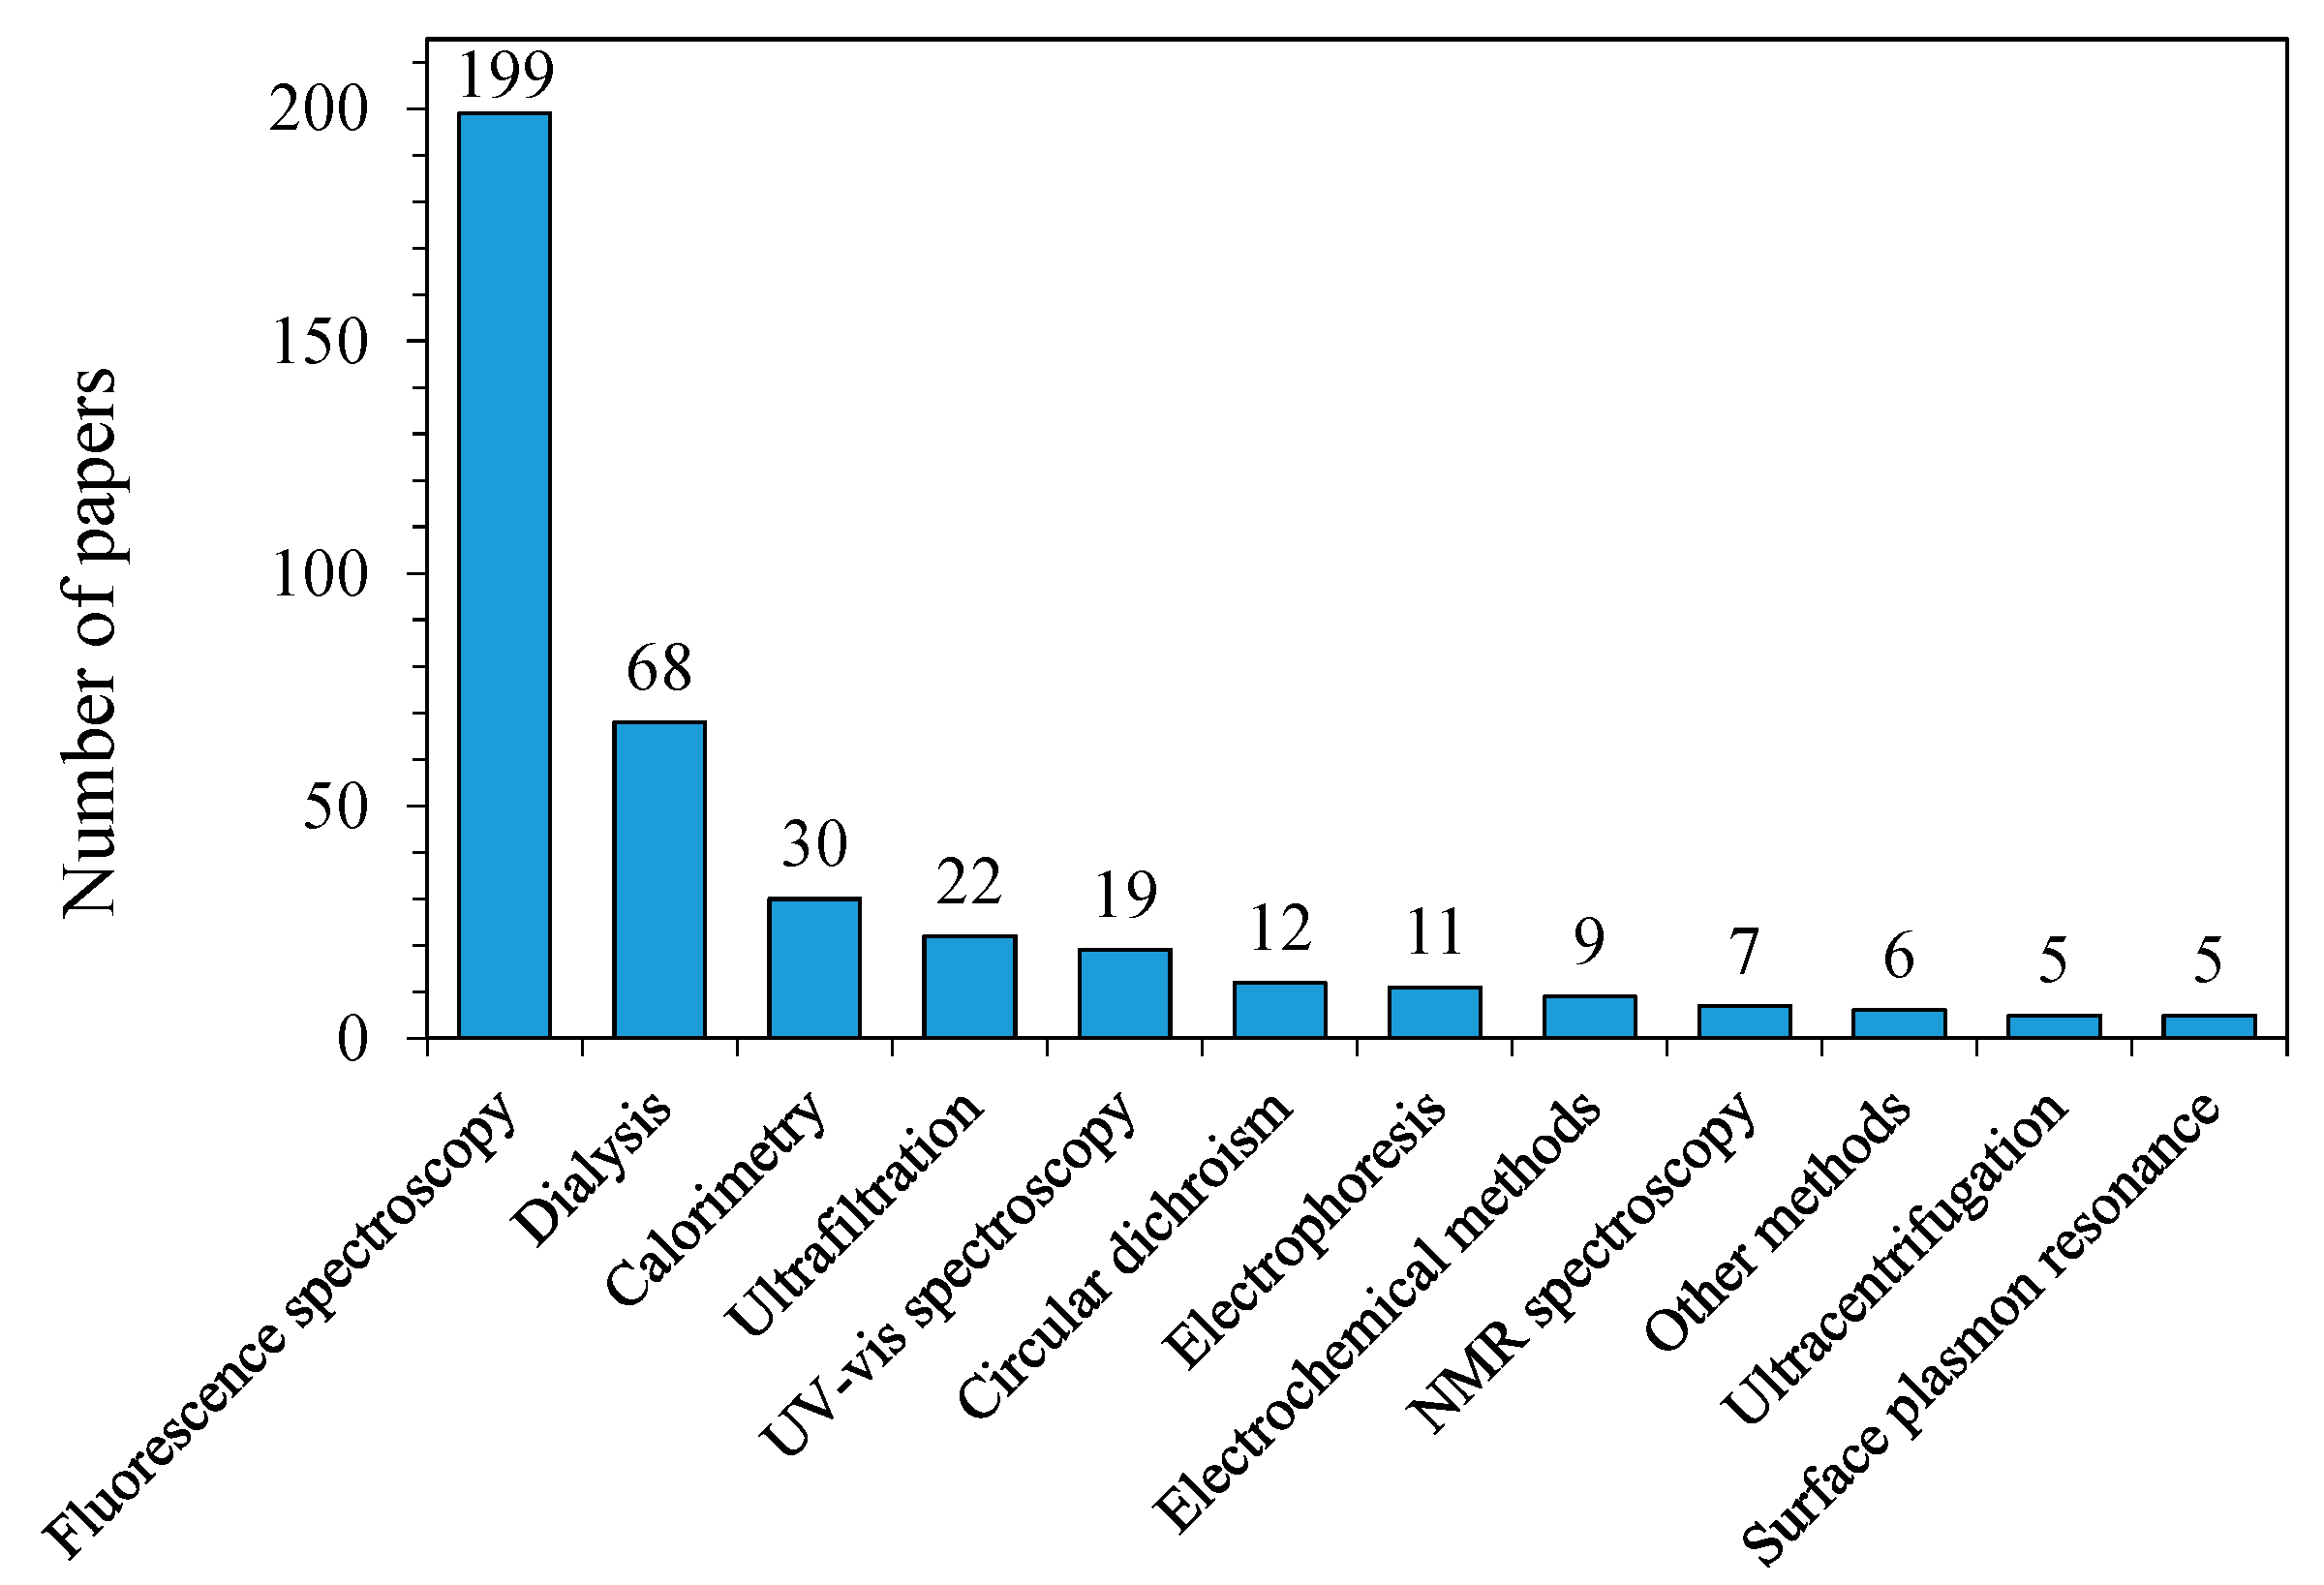
Figure 1 shows the number of studies covered by the dataset in which each experimental technique was used. Fluorescence spectroscopy and particularly the measurement of ligand-induced albumin fluorescence quenching is by far the most popular method to determine the binding constants. However, there are numerous pitfalls of this method [16], making some of the reported results unreliable. In addition to the binding model-related problems, the possible sources of errors are the incomplete fluorescence quenching due to residual fluorescence of the complex, the static quenching influence, the inner-filter effect, and the incorrect calculation of the unbound ligand concentration. A common sign of the problems which can be found in many papers is a heavy dependence of the results on the excitation wavelength or on the model (e.g., Stern–Volmer, double logarithmic plot, or Scatchard) used to calculate the binding constants. It is generally not advised to use the double logarithmic or double reciprocal (modified Stern–Volmer) plots due to the large errors produced by them [16]. The use of experimental data analysis software such as STAR [17] or HYPERQUAD [18] programs may help to avoid some of the issues related to the binding models.
UV-Vis and circular dichroism spectroscopy methods are similar to fluorescence in many aspects, but the changes in the spectra due to the binding process are often very small. Thus, they cannot be recommended as general tools for the binding constant measurements.
One should also be careful with NMR spectroscopy-based studies that were conducted in solutions containing up to 1 millimolar concentrations of protein and a huge (100-fold or more, high ligand solubility is a prerequisite) excess of ligand, which results in very low association constants and a high number of ligands bound to each protein molecule. As a result, the obtained values could be different from the results of other methods.
Dialysis and ultrafiltration techniques have been very popular in the past, but nowadays their use has declined. These methods suffer from a number of unwanted effects [19], such as osmotic volume shifts across the dialysis membrane, nonspecific binding to the membrane, the uneven distribution of ionic species across the membrane sides (known as the Donnan effect), and the general production of noisy binding curves.
Isothermal titration calorimetry is presently the method of choice due to its high sensitivity, robustness and ability to determine all the thermodynamic parameters (Gibbs free energy, enthalpy and entropy) of binding in a single experiment. The existence of multiple binding centers with different affinities still complicates the analysis of calorimetric data, and various methods have been developed and integrated into the software programs in order to analyze the multisite binding curves [20,21,22].
Another modern technique, surface plasmon resonance, is also extremely sensitive. Unlike other methods, it allows for the measurement of the rate constants of the association and dissociation of a protein–ligand complex. The ratio of these constants is equal to the binding constant. A noteworthy drawback is the necessity to immobilize the protein or ligand on a sensor chip. In addition, the interpretation of multisite interaction data can be even more complicated than in other methods.
3.2. Albumin Source Organisms
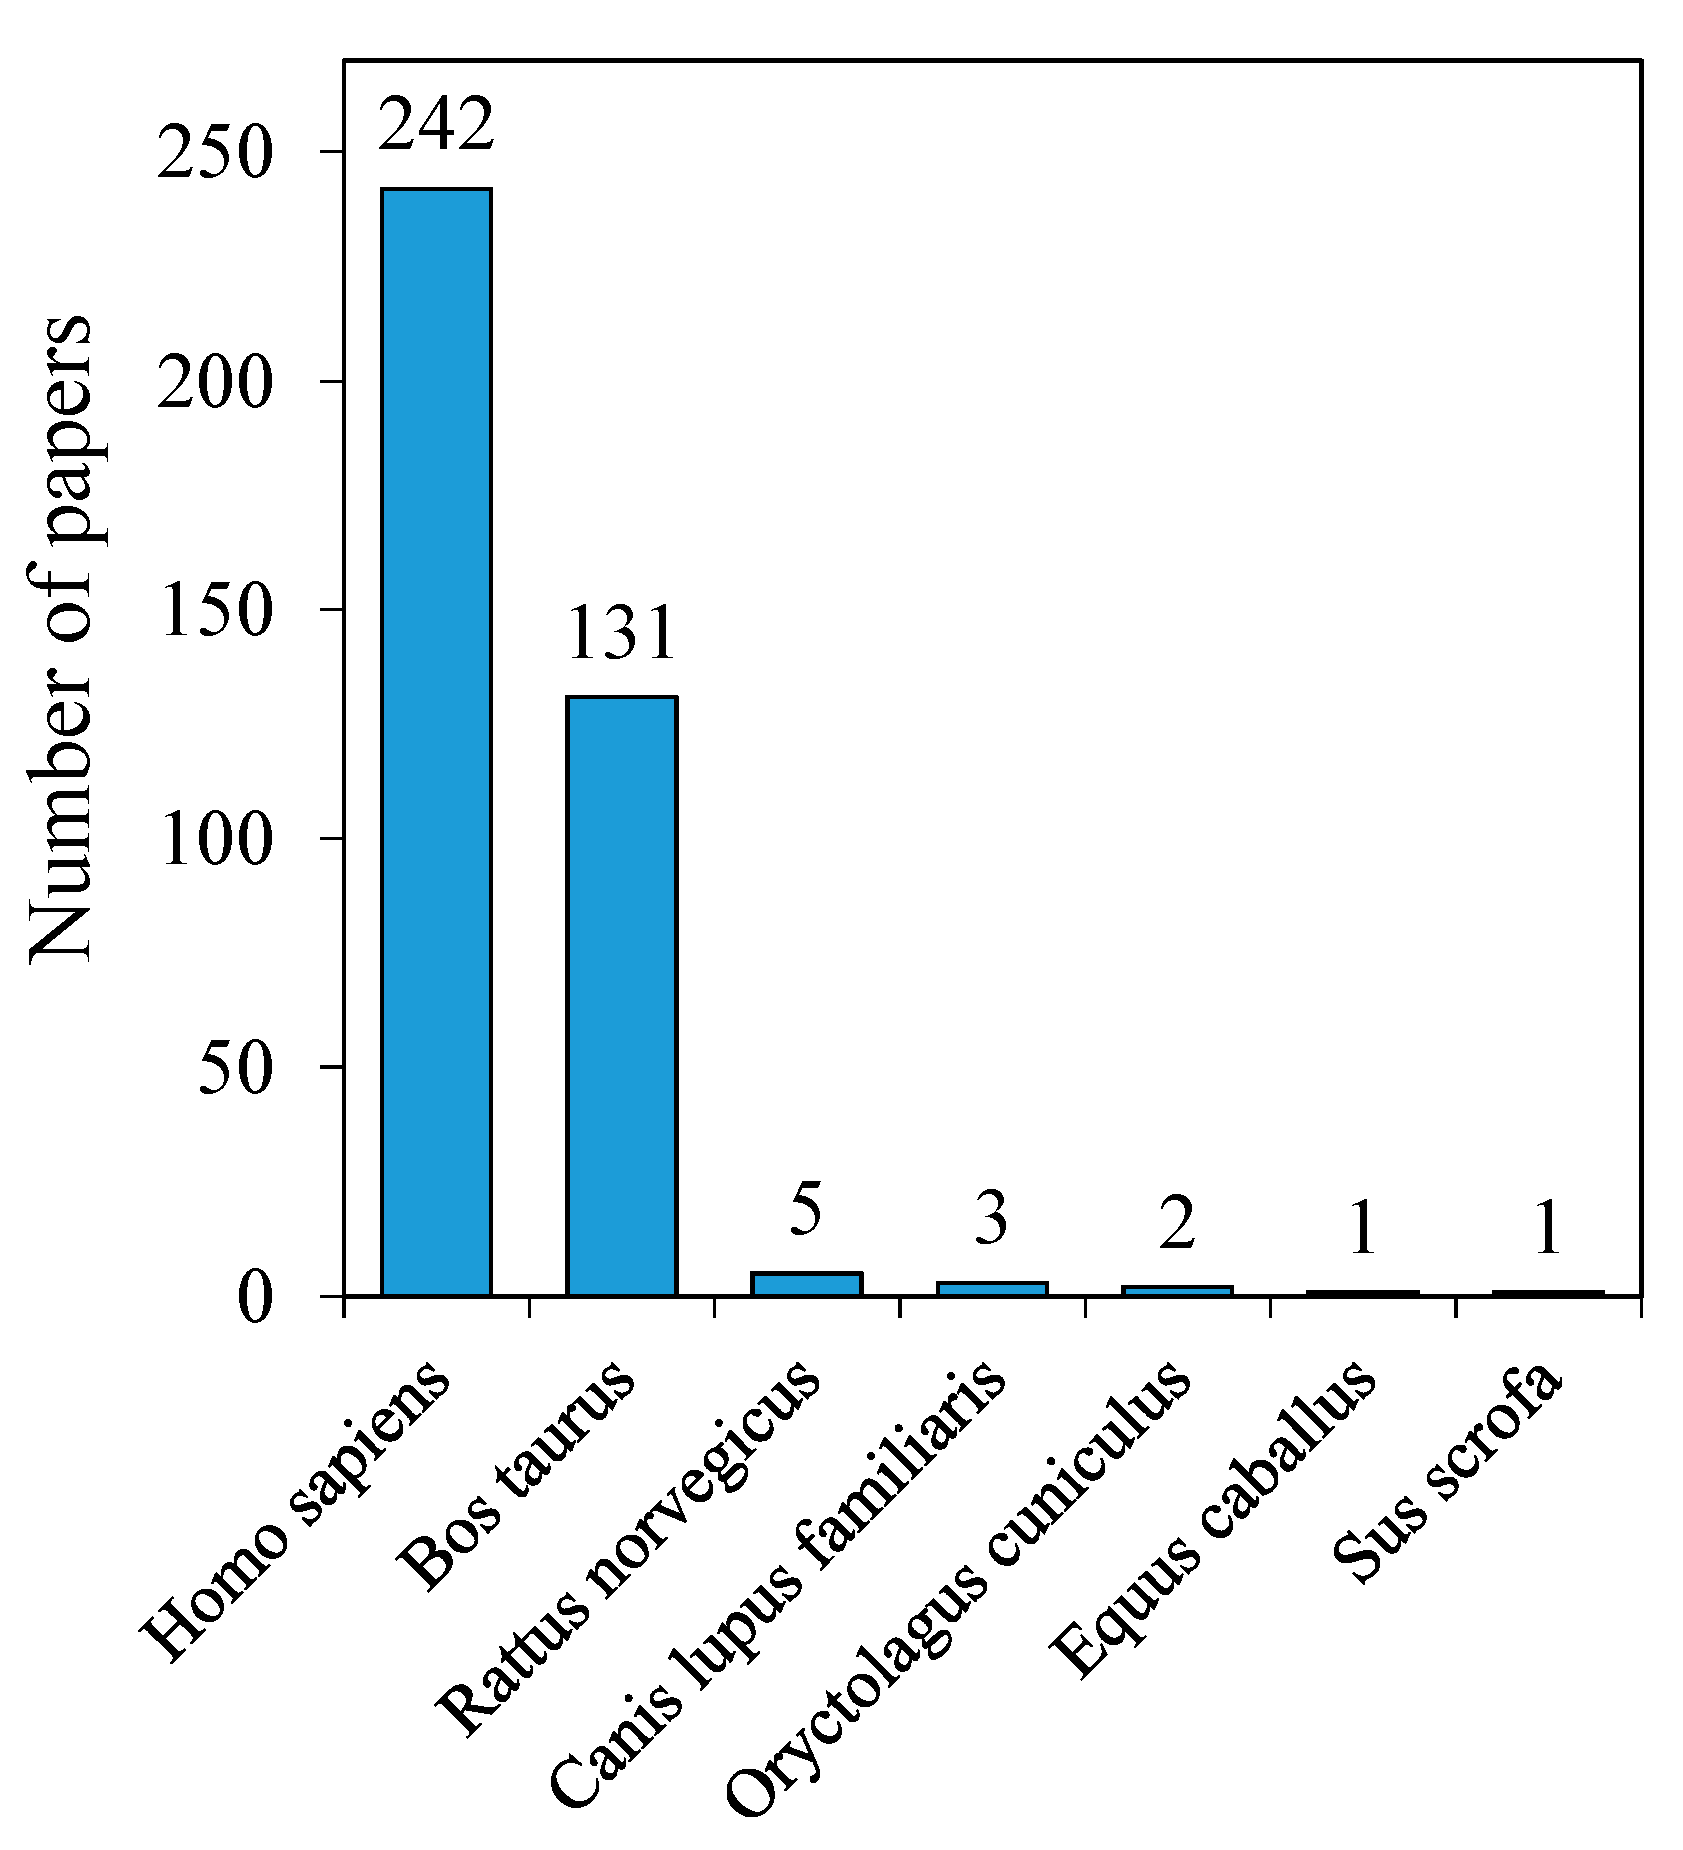
Most of the data reported in the literature were obtained for human (63% of papers) and bovine (34% of papers) serum albumins, which are readily available from commercial sources. Other mammalian albumins were only used in a few studies (Figure 2).
The studies of species-dependent plasma binding indicated a positive correlation of the binding affinities for many clinical drugs in humans, dogs, rats, or mice [23,24]. Slightly stronger binding to human plasma was observed: the mean difference between the logarithms of the plasma binding constants in humans and other mammals ranged from 0.07 (rats) to 0.18 (dogs) [23], despite some particular compounds showing a much weaker binding to human albumins. There was also a report of the comparable binding degrees of antibiotics to bovine and human plasma [25]. Several works cited in the present dataset [26,27,28,29,30,31,32,33] provided the binding constants of the same compounds to bovine and human albumins, measured at the same conditions. Binding to bovine albumins seems to be a little stronger with the average difference between lgKa values about 0.2. Again, some compounds demonstrated a significantly higher affinity to human than to bovine albumin [34].
3.3. Albumin Concentration
Albumin concentration can dramatically affect the values of the binding constants since albumin forms dimers (and possibly higher aggregates in concentrated solutions) which have different binding properties. At 10 mg∙mL−1 (150 μM, or −lgC = 3.82), 298 K temperature, pH 7.4, and an ionic strength 0.1 M with about 25% of bovine serum, albumin molecules were reported to form dimers [35]. As can be seen in Figure 3, most of the studies avoid this problem by using much lower albumin concentrations, and this is strongly recommended.
3.4. Buffer Composition and pH Value
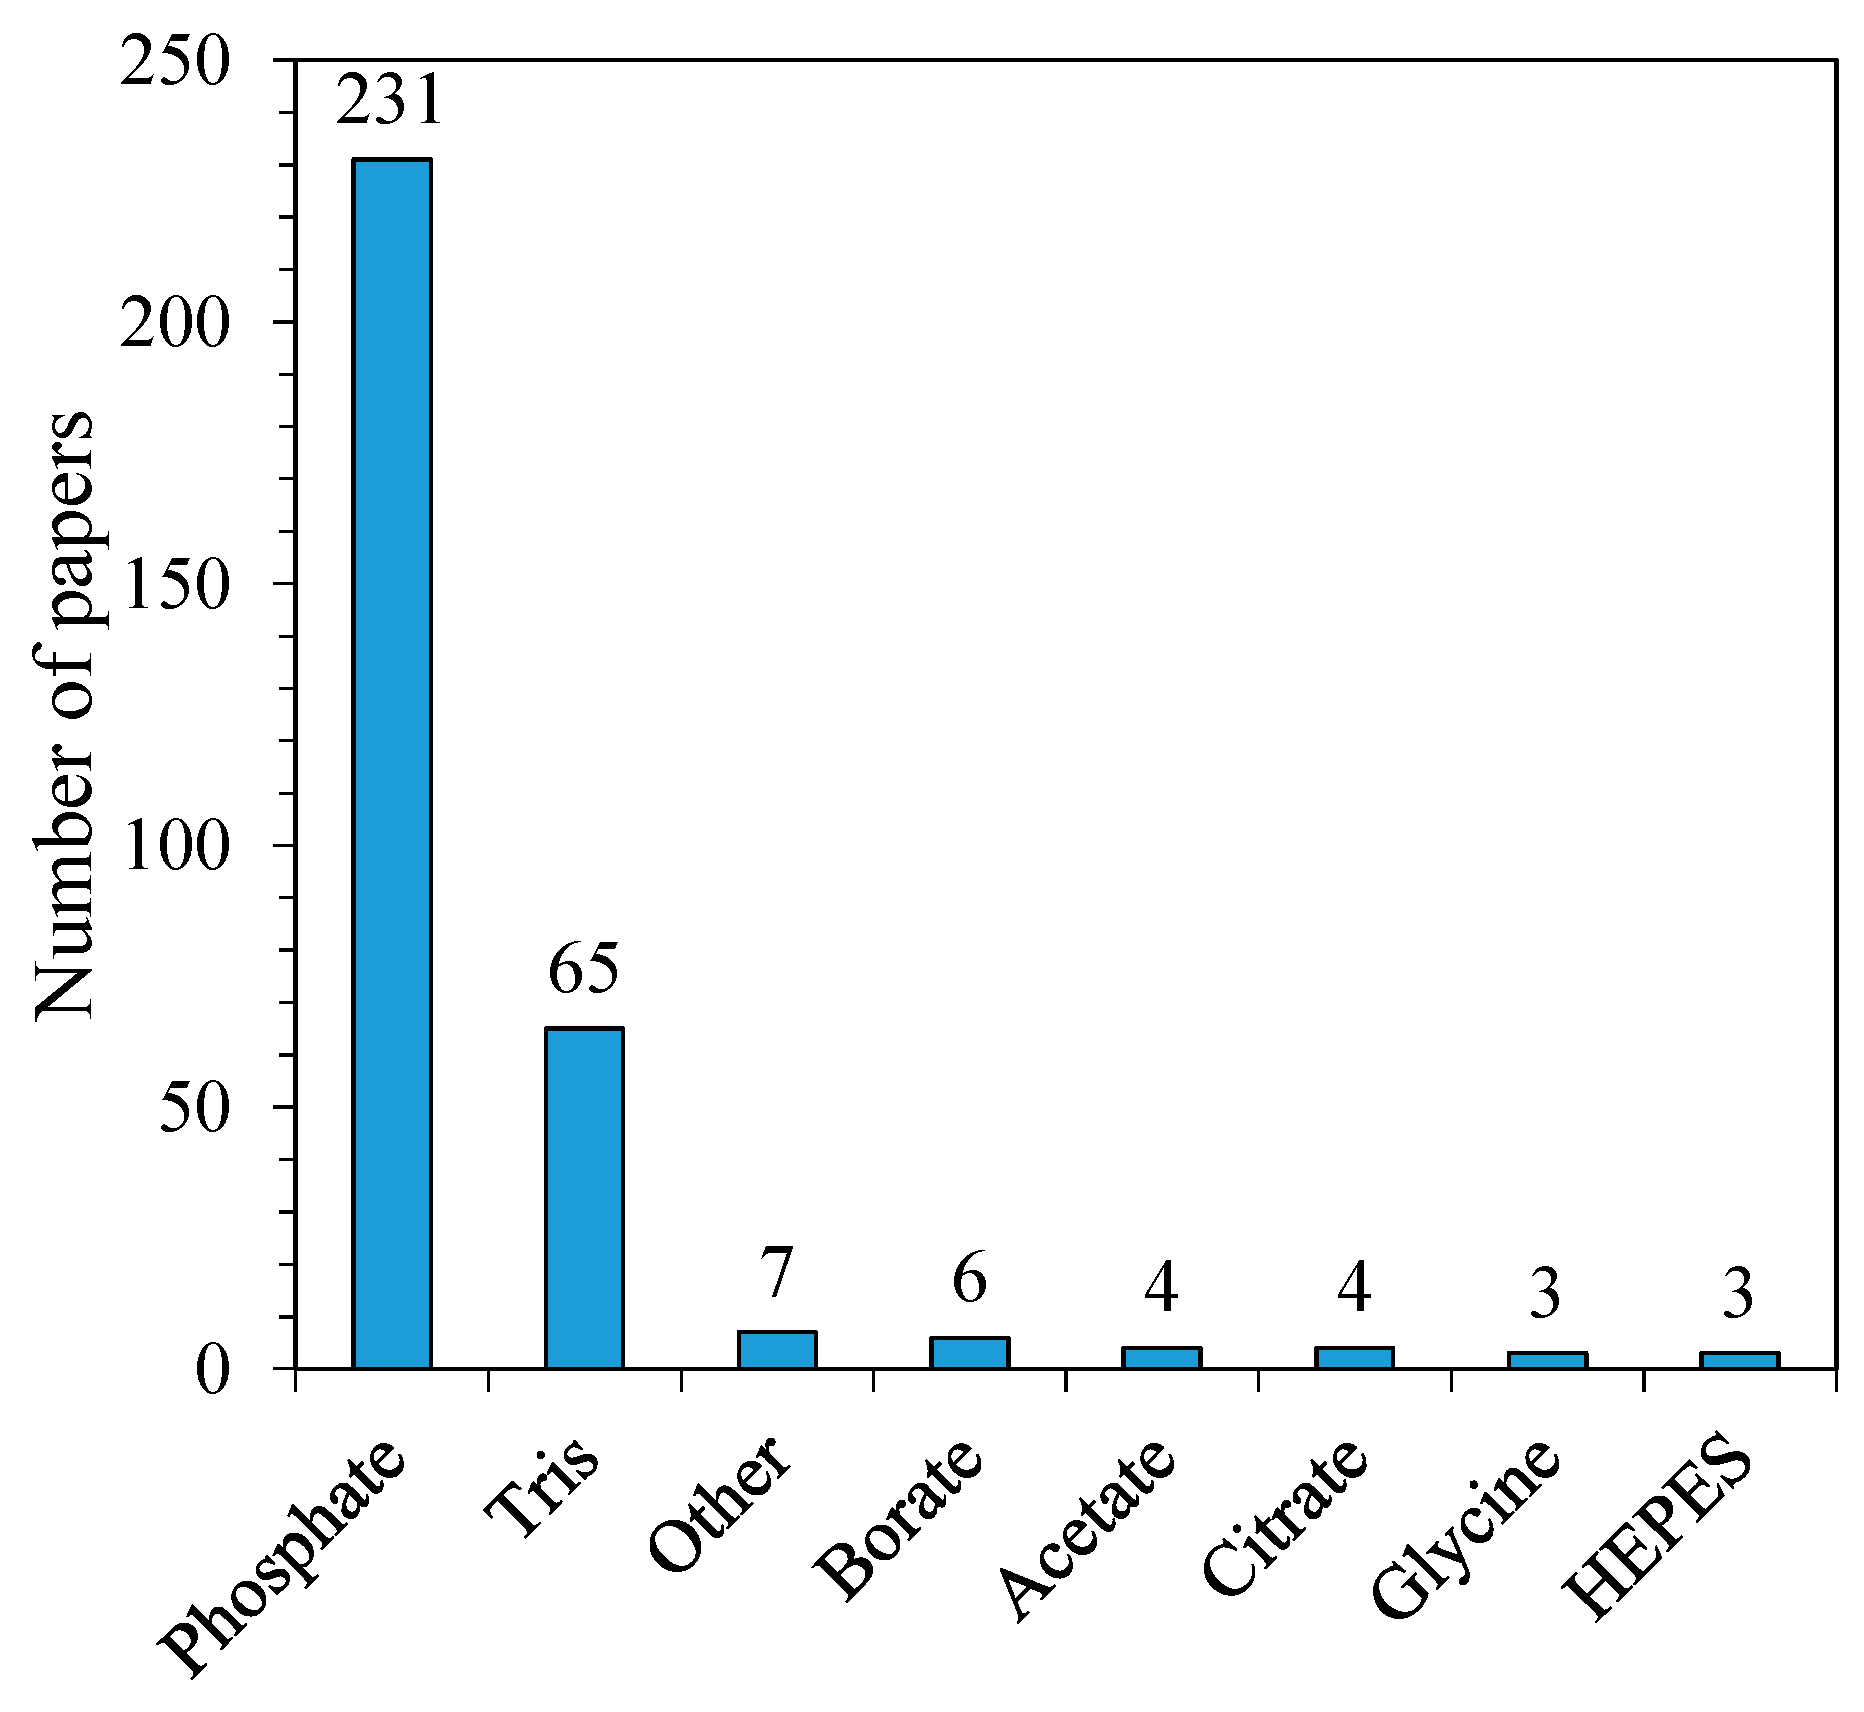
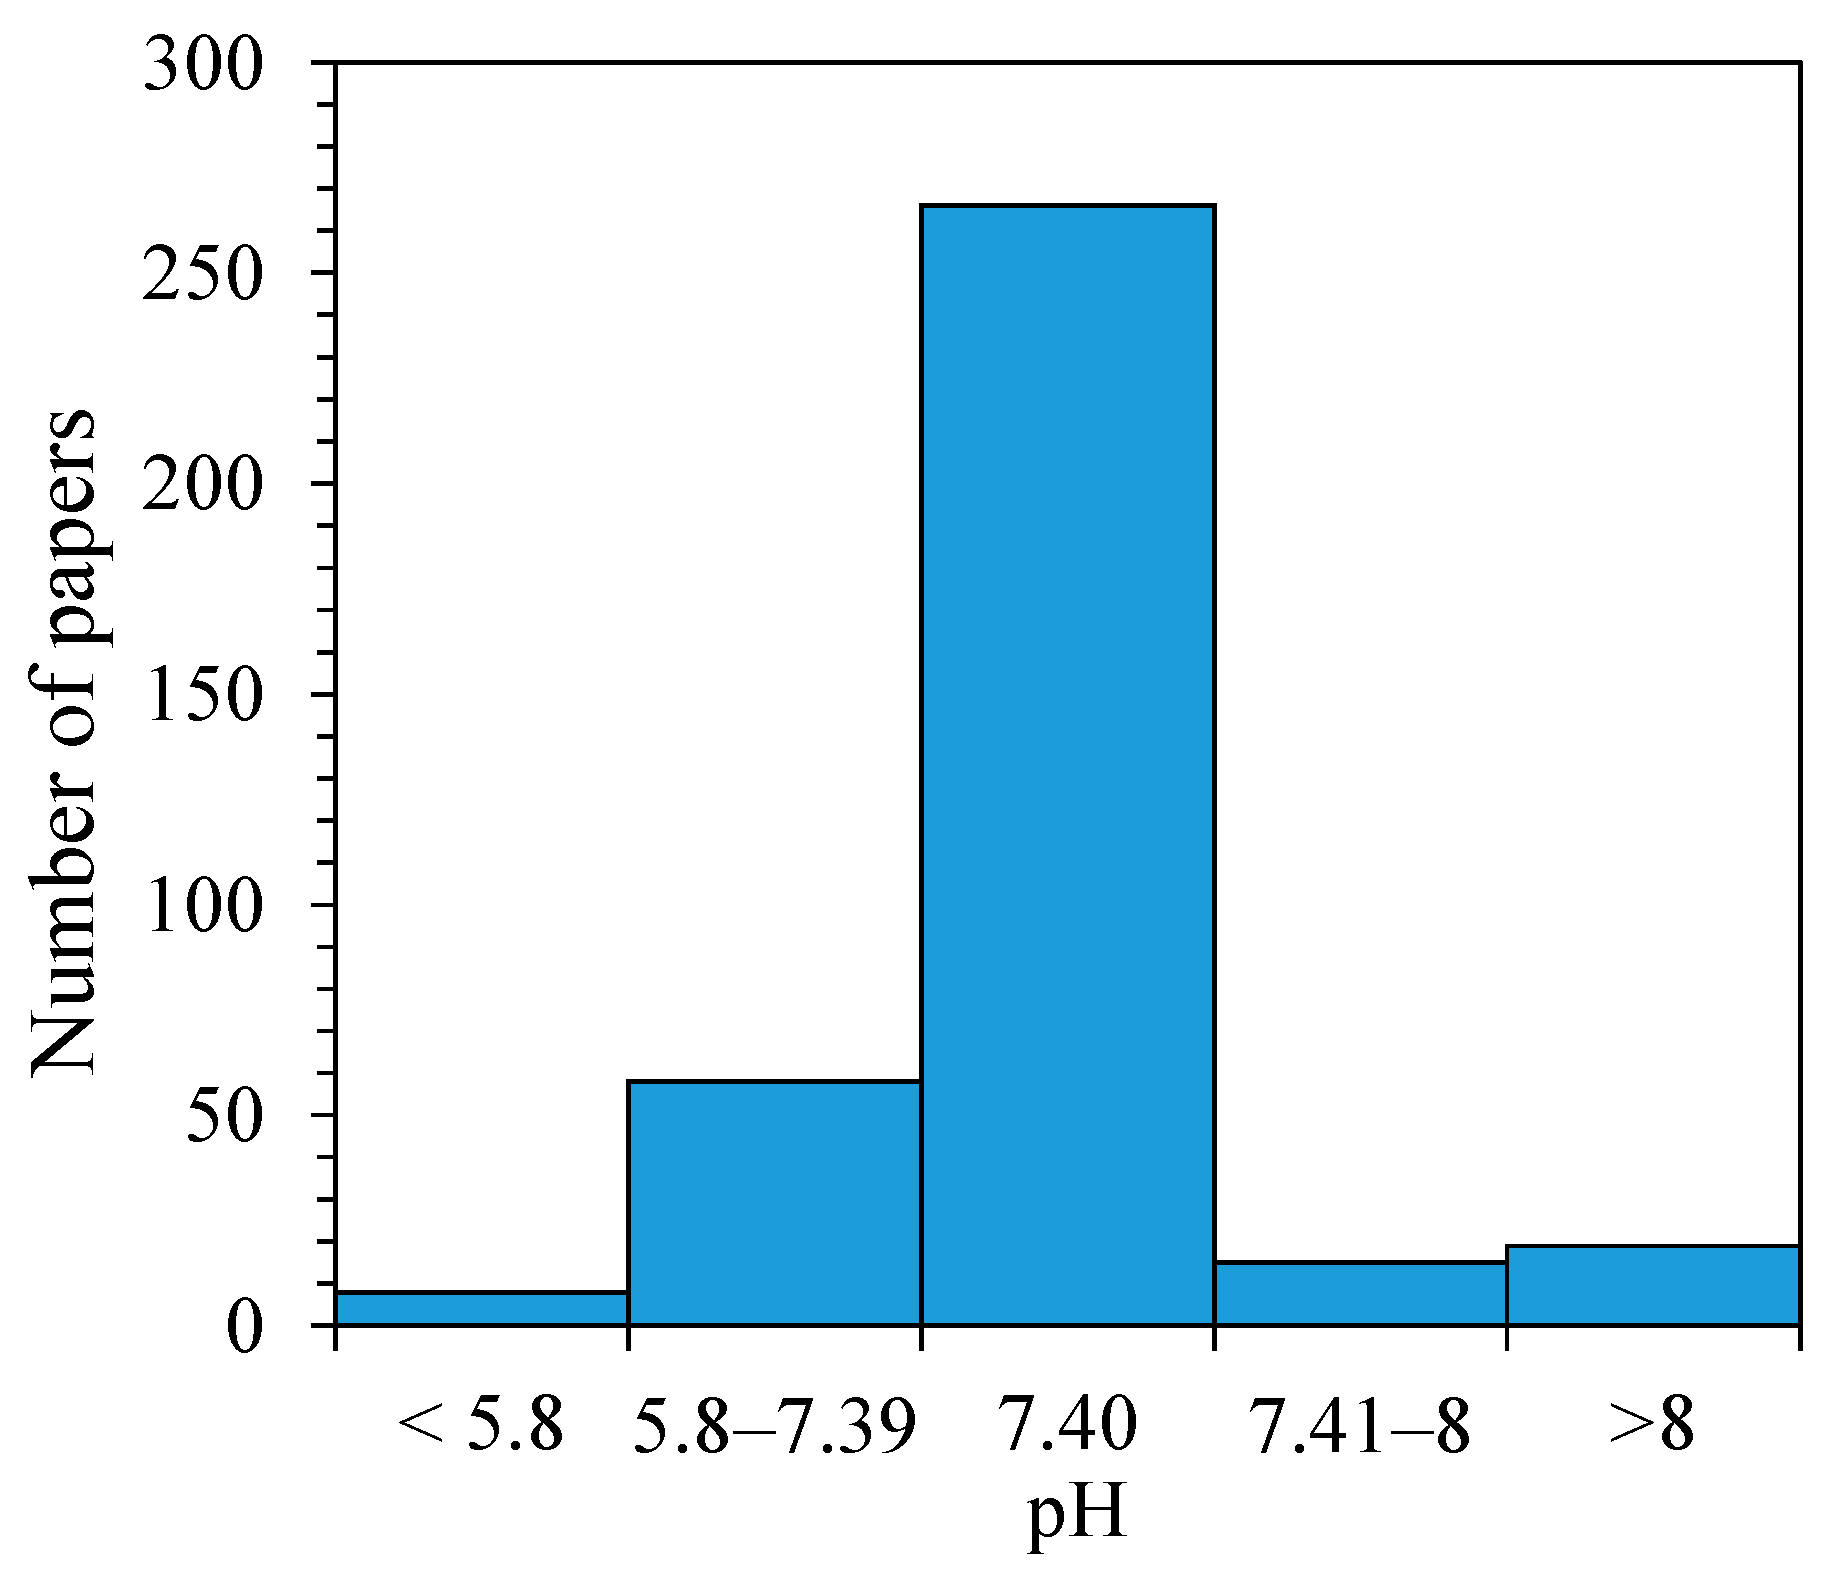
The vast majority of works were performed using phosphate or Tris buffers (Figure 4) with the pH exactly corresponding to that of human blood (7.40, Figure 5). The most common concentrations for the buffer pair components were 50 to 100 mM. Other pH values in the 5.8 to 8 range were usually maintained using phosphate or Tris with different compositions. It is feared that organic buffers may interact with the binding sites of albumin, so the use of phosphate buffer is recommended. To make the buffer isotonic to blood, 100 or 150 mM NaCl is often added. In order to mimic the extracellular physiological conditions more precisely, phosphate-buffered saline (PBS) containing 10 mM Na2HPO4, 1.8 mM KH2PO4, 137 mM NaCl, and 2.7 mM KCl is used.
A few experiments involving a low pH were conducted using acetate or glycine–HCl buffer while, for high pH values, carbonate and borate buffers were used. The pH value can influence both protein and ligand ionization states and undoubtedly affects the binding constant value in a ligand-dependent manner. Moreover, albumins undergo conformational changes at a pH of <4.3, producing so-called F and E forms and at a pH of >8 turned into the B form [36]. However, studies at such pH values are very scarce.
3.5. Temperature
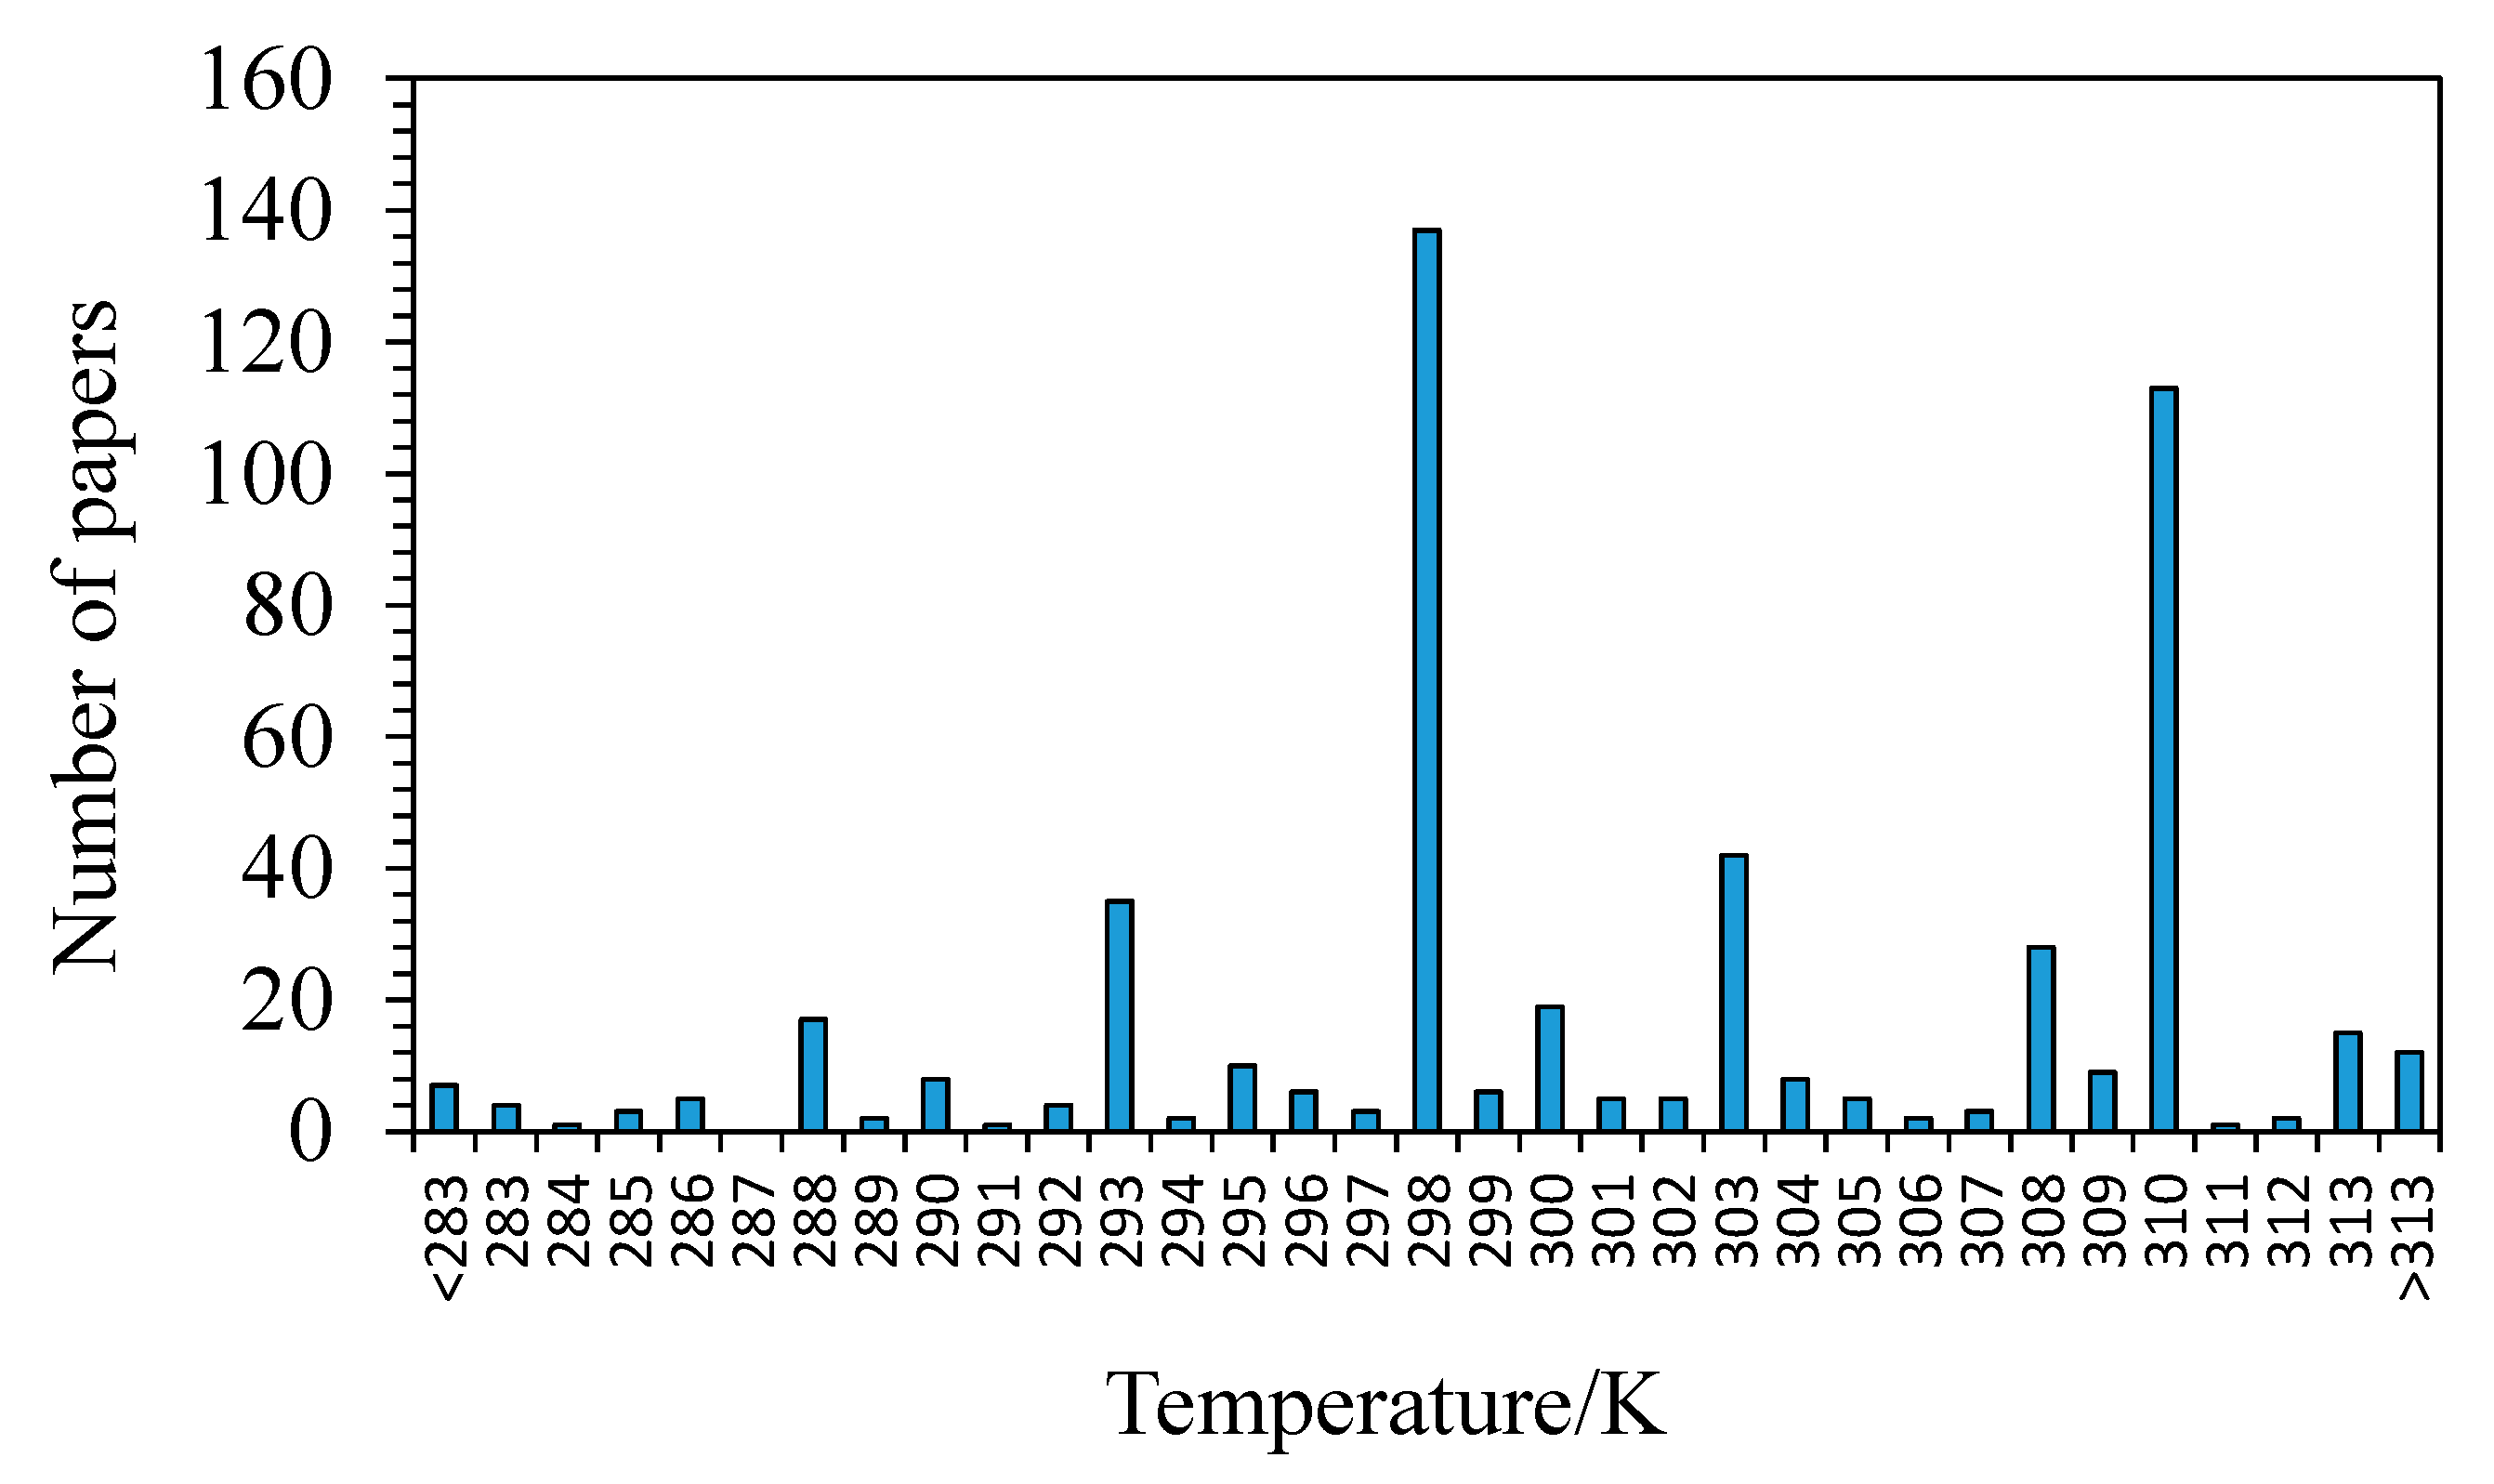
The largest number of measurements were completed at the standard temperature, 298 K, and the human body temperature, 310 K (Figure 6). It is quite common to measure the binding constants at several temperatures, usually with 5 K intervals. These values can be used to estimate the binding enthalpy using an equation:
but the accuracy is extremely poor. The enthalpies measured using direct calorimetric method should always be preferable.
With the typical enthalpy of the albumin binding of a small drug molecule equal to −20 kJ·mol−1, the temperature change from 298 to 310 K leads to a 0.14 lgKa units decrease in the binding constant, which is small in comparison with the discrepancies between different independent studies (see Section 3.6).
3.6. Averaging Values over Multiple Independent Studies
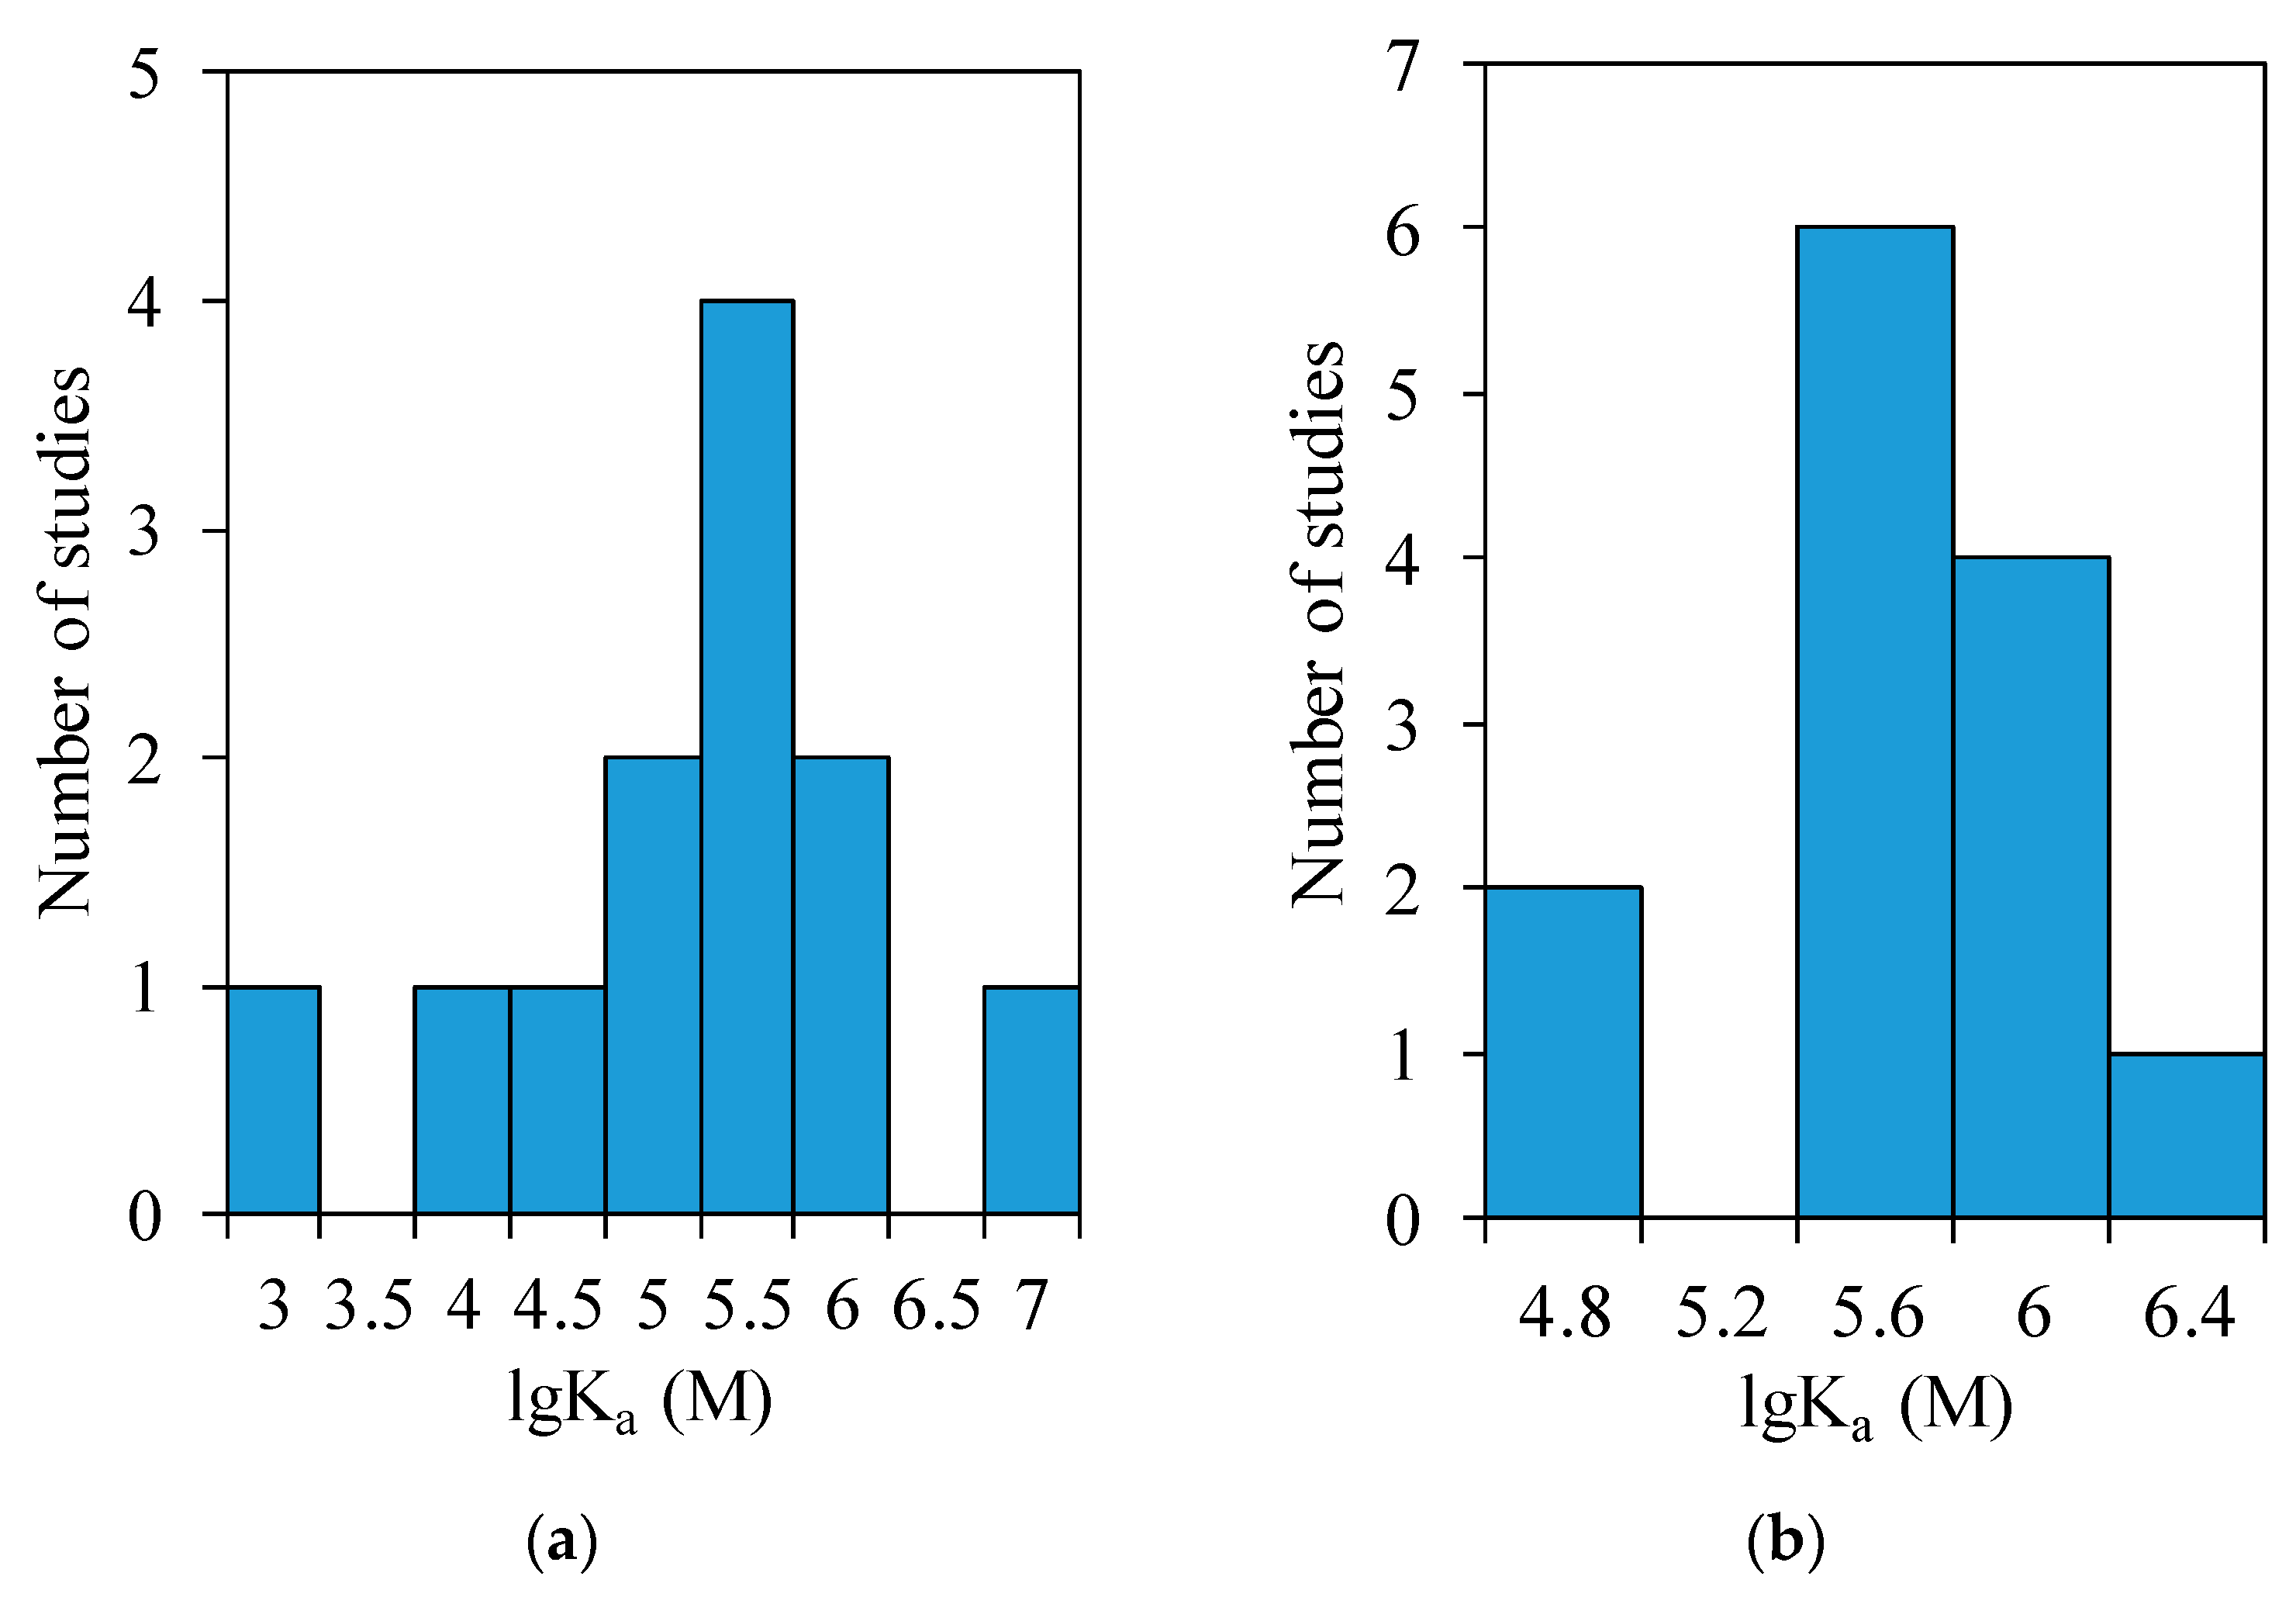
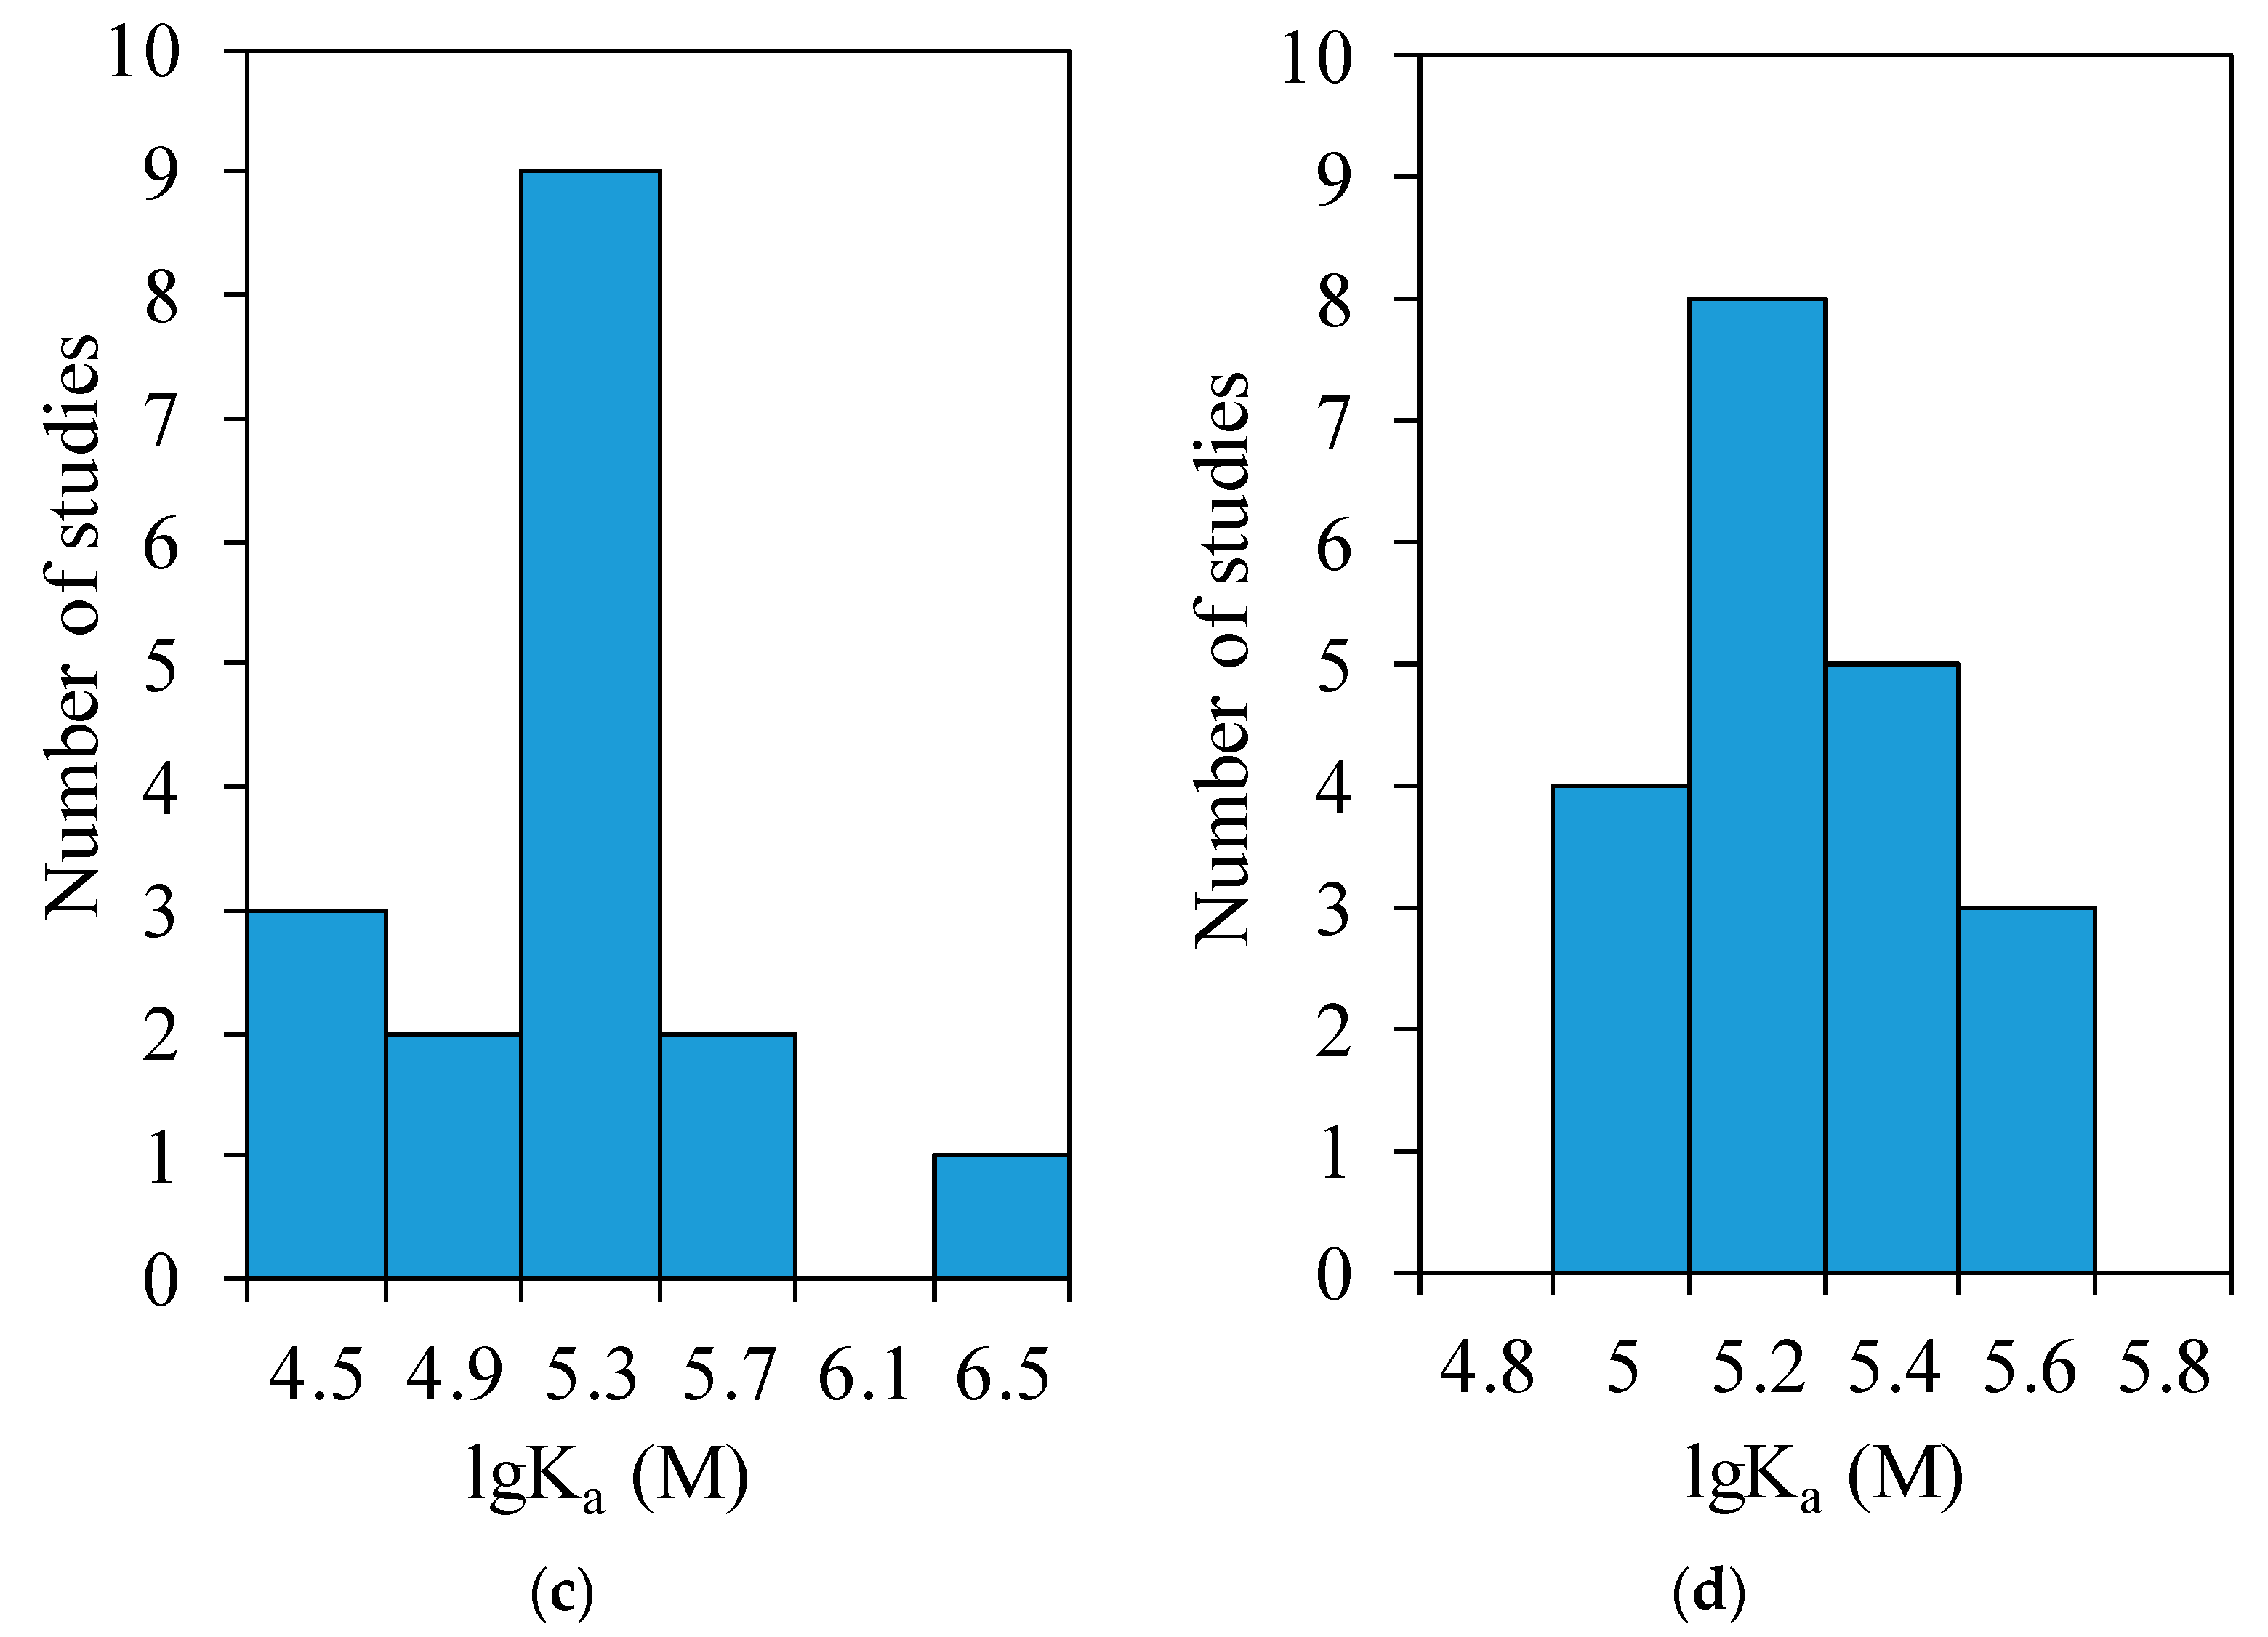
There are systems for which a sufficient number of binding constant values were obtained by independent authors. The gathered data for four commonly studied ligands: indomethacine, phenylbutazone, quercetin, and warfarin, were examined. Only one value from each independent study of binding with human serum albumin was taken and the binned histograms of the logarithms of association constants were plotted. The results plotted in Figure 7 show the existence of well-manifested maxima of distributions. The statistical analysis was performed to obtain the average values of lgKa, their standard deviations σ, and 95% confidence intervals ∆. The following results were obtained: lgKa = 5.31, σ = 1.02, ∆ = 0.65 for indomethacine (number of independent values n = 12); lgKa = 5.46, σ = 0.56, ∆ = 0.29 for phenylbutazone (n = 18); lgKa = 5.25, σ = 0.51, ∆ = 0.26 for quercetin (n = 17); and lgKa = 5.27, σ = 0.20, ∆ = 0.09 for warfarin (n = 20).
3.7. Factors Determining Data Variability
In order to estimate the possible influence of the quantities describing the experimental setup (temperature, pH, and albumin concentration) on the resulting binding constants values, the following statistical analysis was performed. For each ligand and albumin type, the logarithms of all the reported values of the binding constants were averaged. The deviation of each measured value from the median value for the given system was calculated excluding the values that were measured only once. Theoretically, one could expect a linear dependence of on since:
The linear correlations of with the logarithm of albumin concentration and pH were also likely correlations, at least for some systems. However, for the 1512 considered experiments, the r2 values were 0.0022, 0.0023 and 0.0059 for regressions between and ln(Calbumin), pH, and , respectively. The absence of correlations meant that the influence of the considered factors is much lower than that of the other factors. Moreover, the variation of pH and temperature in the experimental studies is rather small.
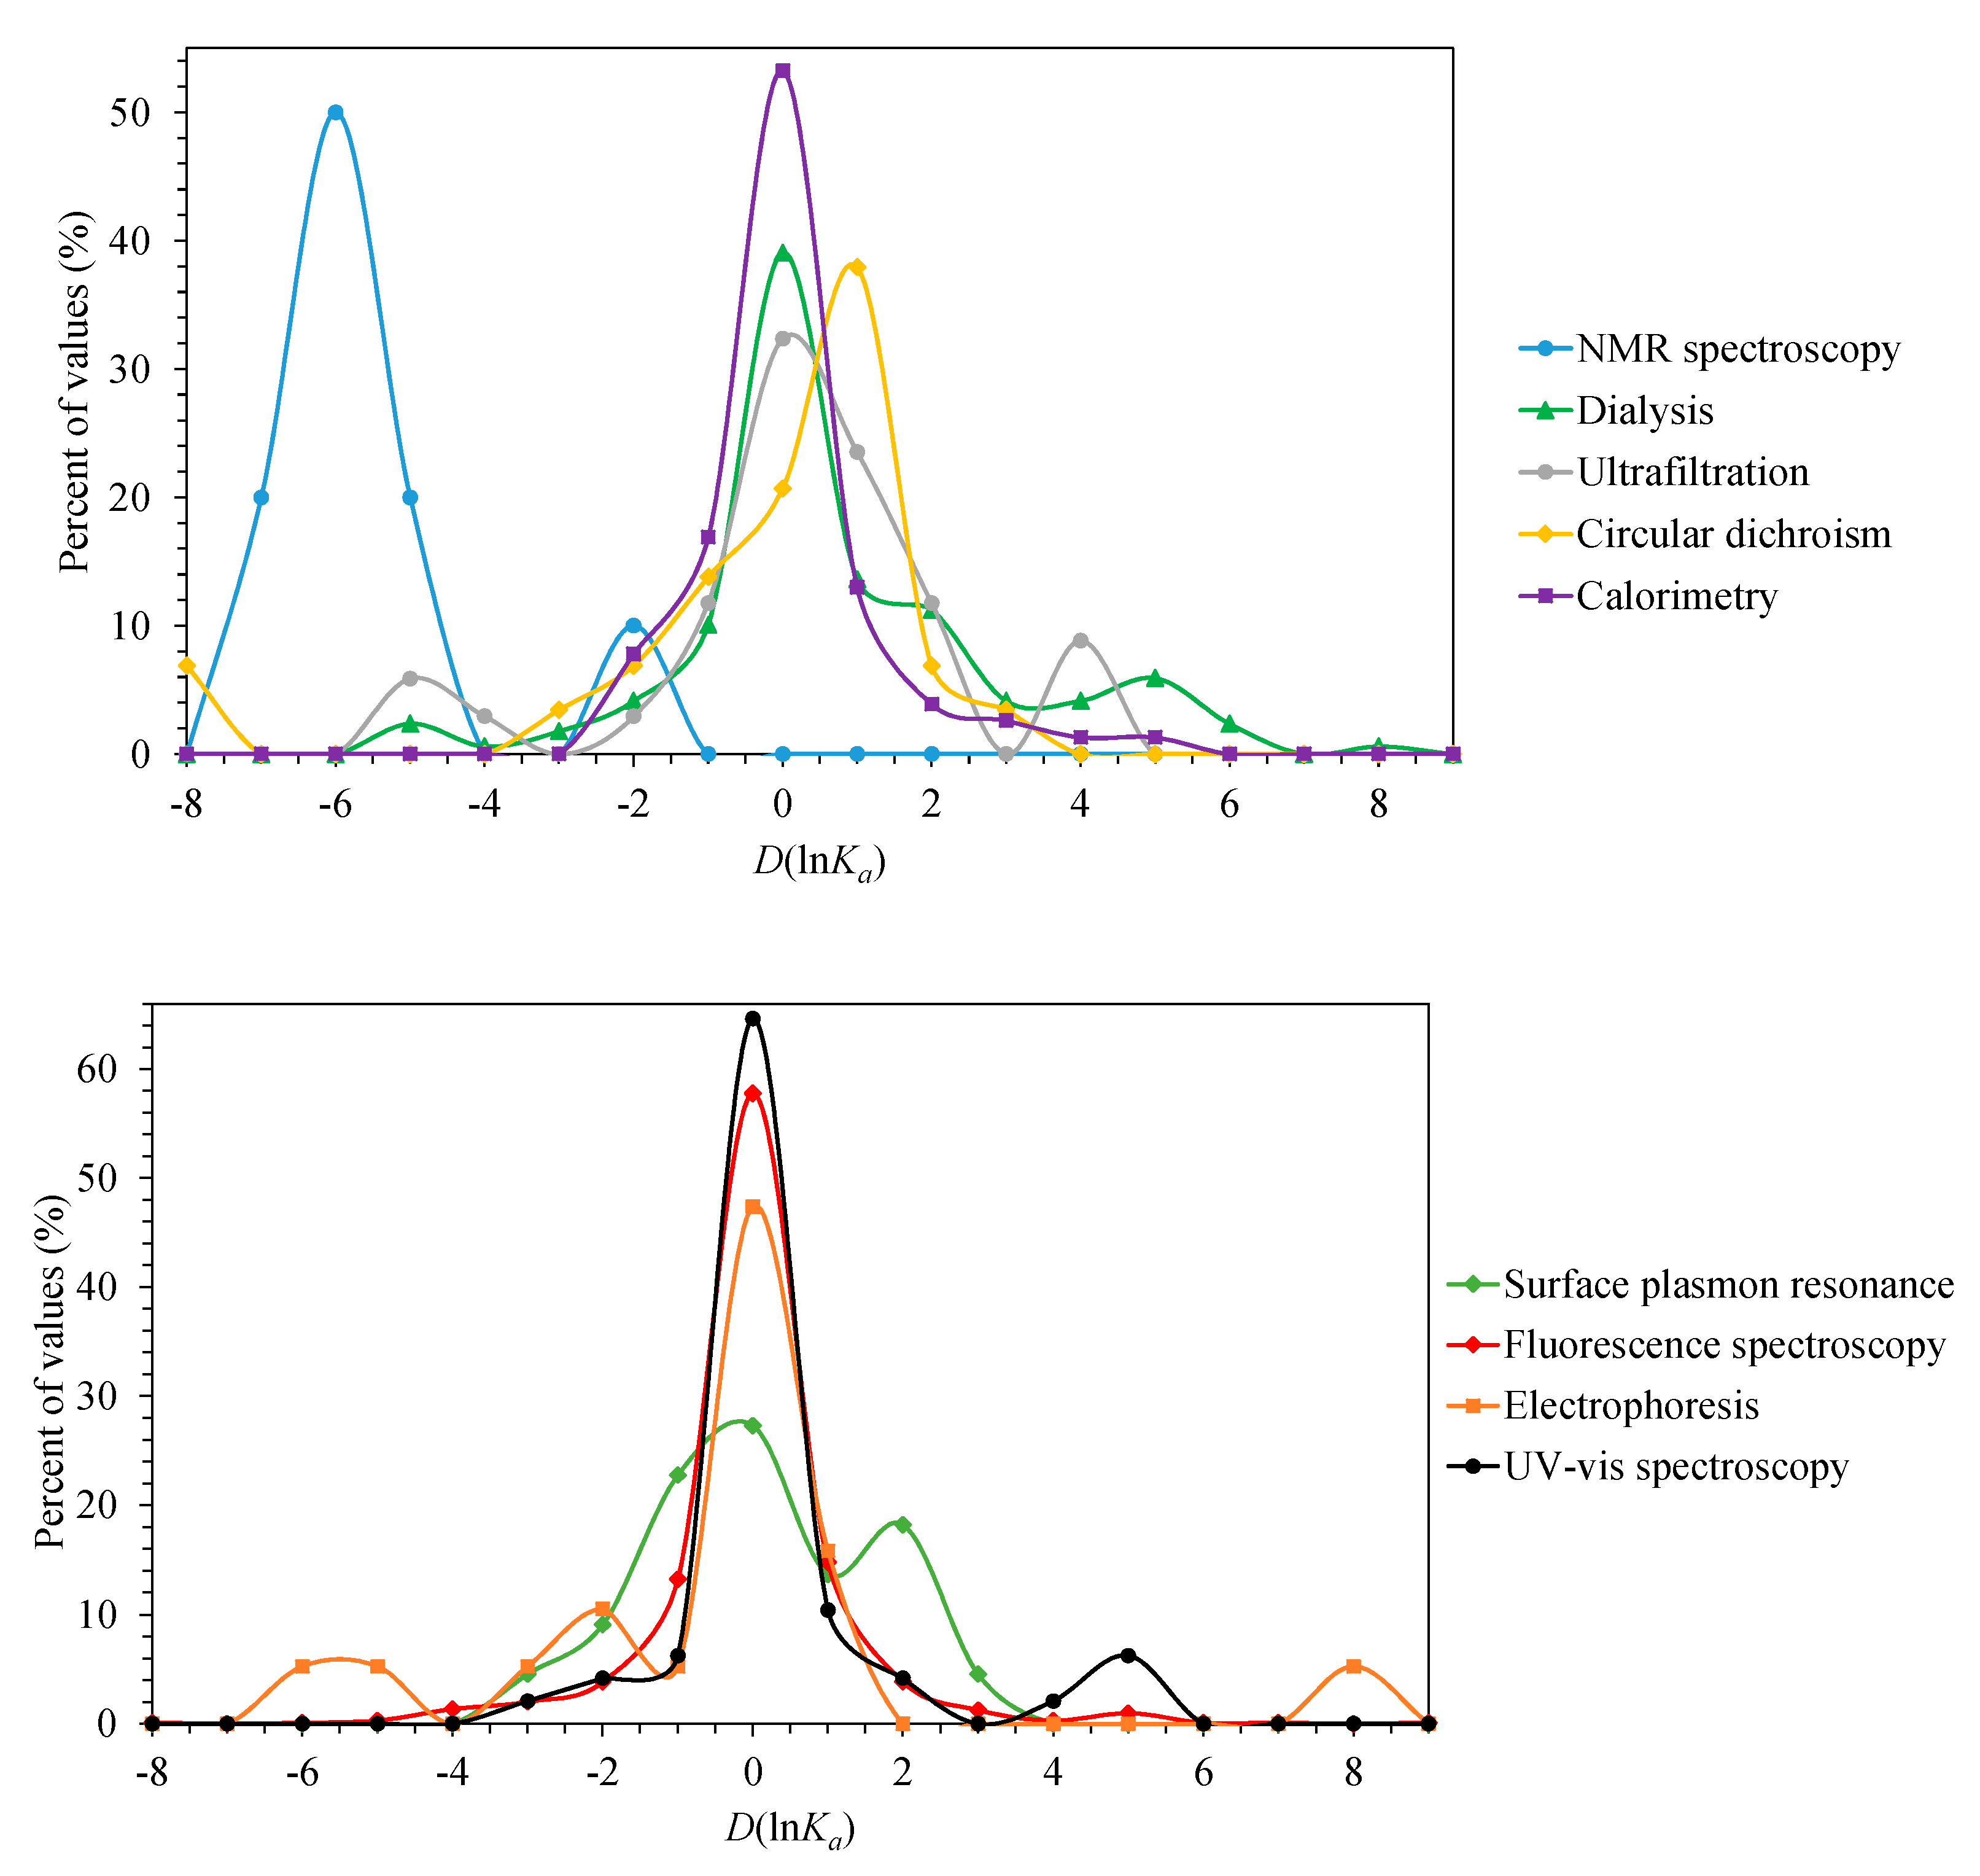
The method bias was assessed by the following procedure. For each of the common measurement techniques, the distribution of the reported experimental values by their deviation from the median value for the same substance , was considered (Figure 8). The bin width was 1 unit, for example, “1” in Figure 8 includes values from 0.5 to 1.5. For most of the methods, the distribution maximum is at zero and only a small fraction of the experiments resulted in a deviation of more than 1 units. A notable exception is the NMR method, with a maximum at −6, which means that the binding constants are 400 times lower than the median values. This is likely caused by extremely large concentrations of protein and ligand used in the NMR experiments, as mentioned above. Circular dichroism studies lead to higher constants than other methods (maximum at 1). The distribution of values obtained using the ultrafiltration method is also significantly distorted to the side of stronger binding.
The data variability is also caused by many methodological details including those falling beyond consideration in the original reports, as well as systematic and random errors. Our dataset contains numerous examples where the change in the excitation wavelength or the data analysis model in fluorescence studies causes dramatic variations in the binding constant values, which is an obvious problem of the method.
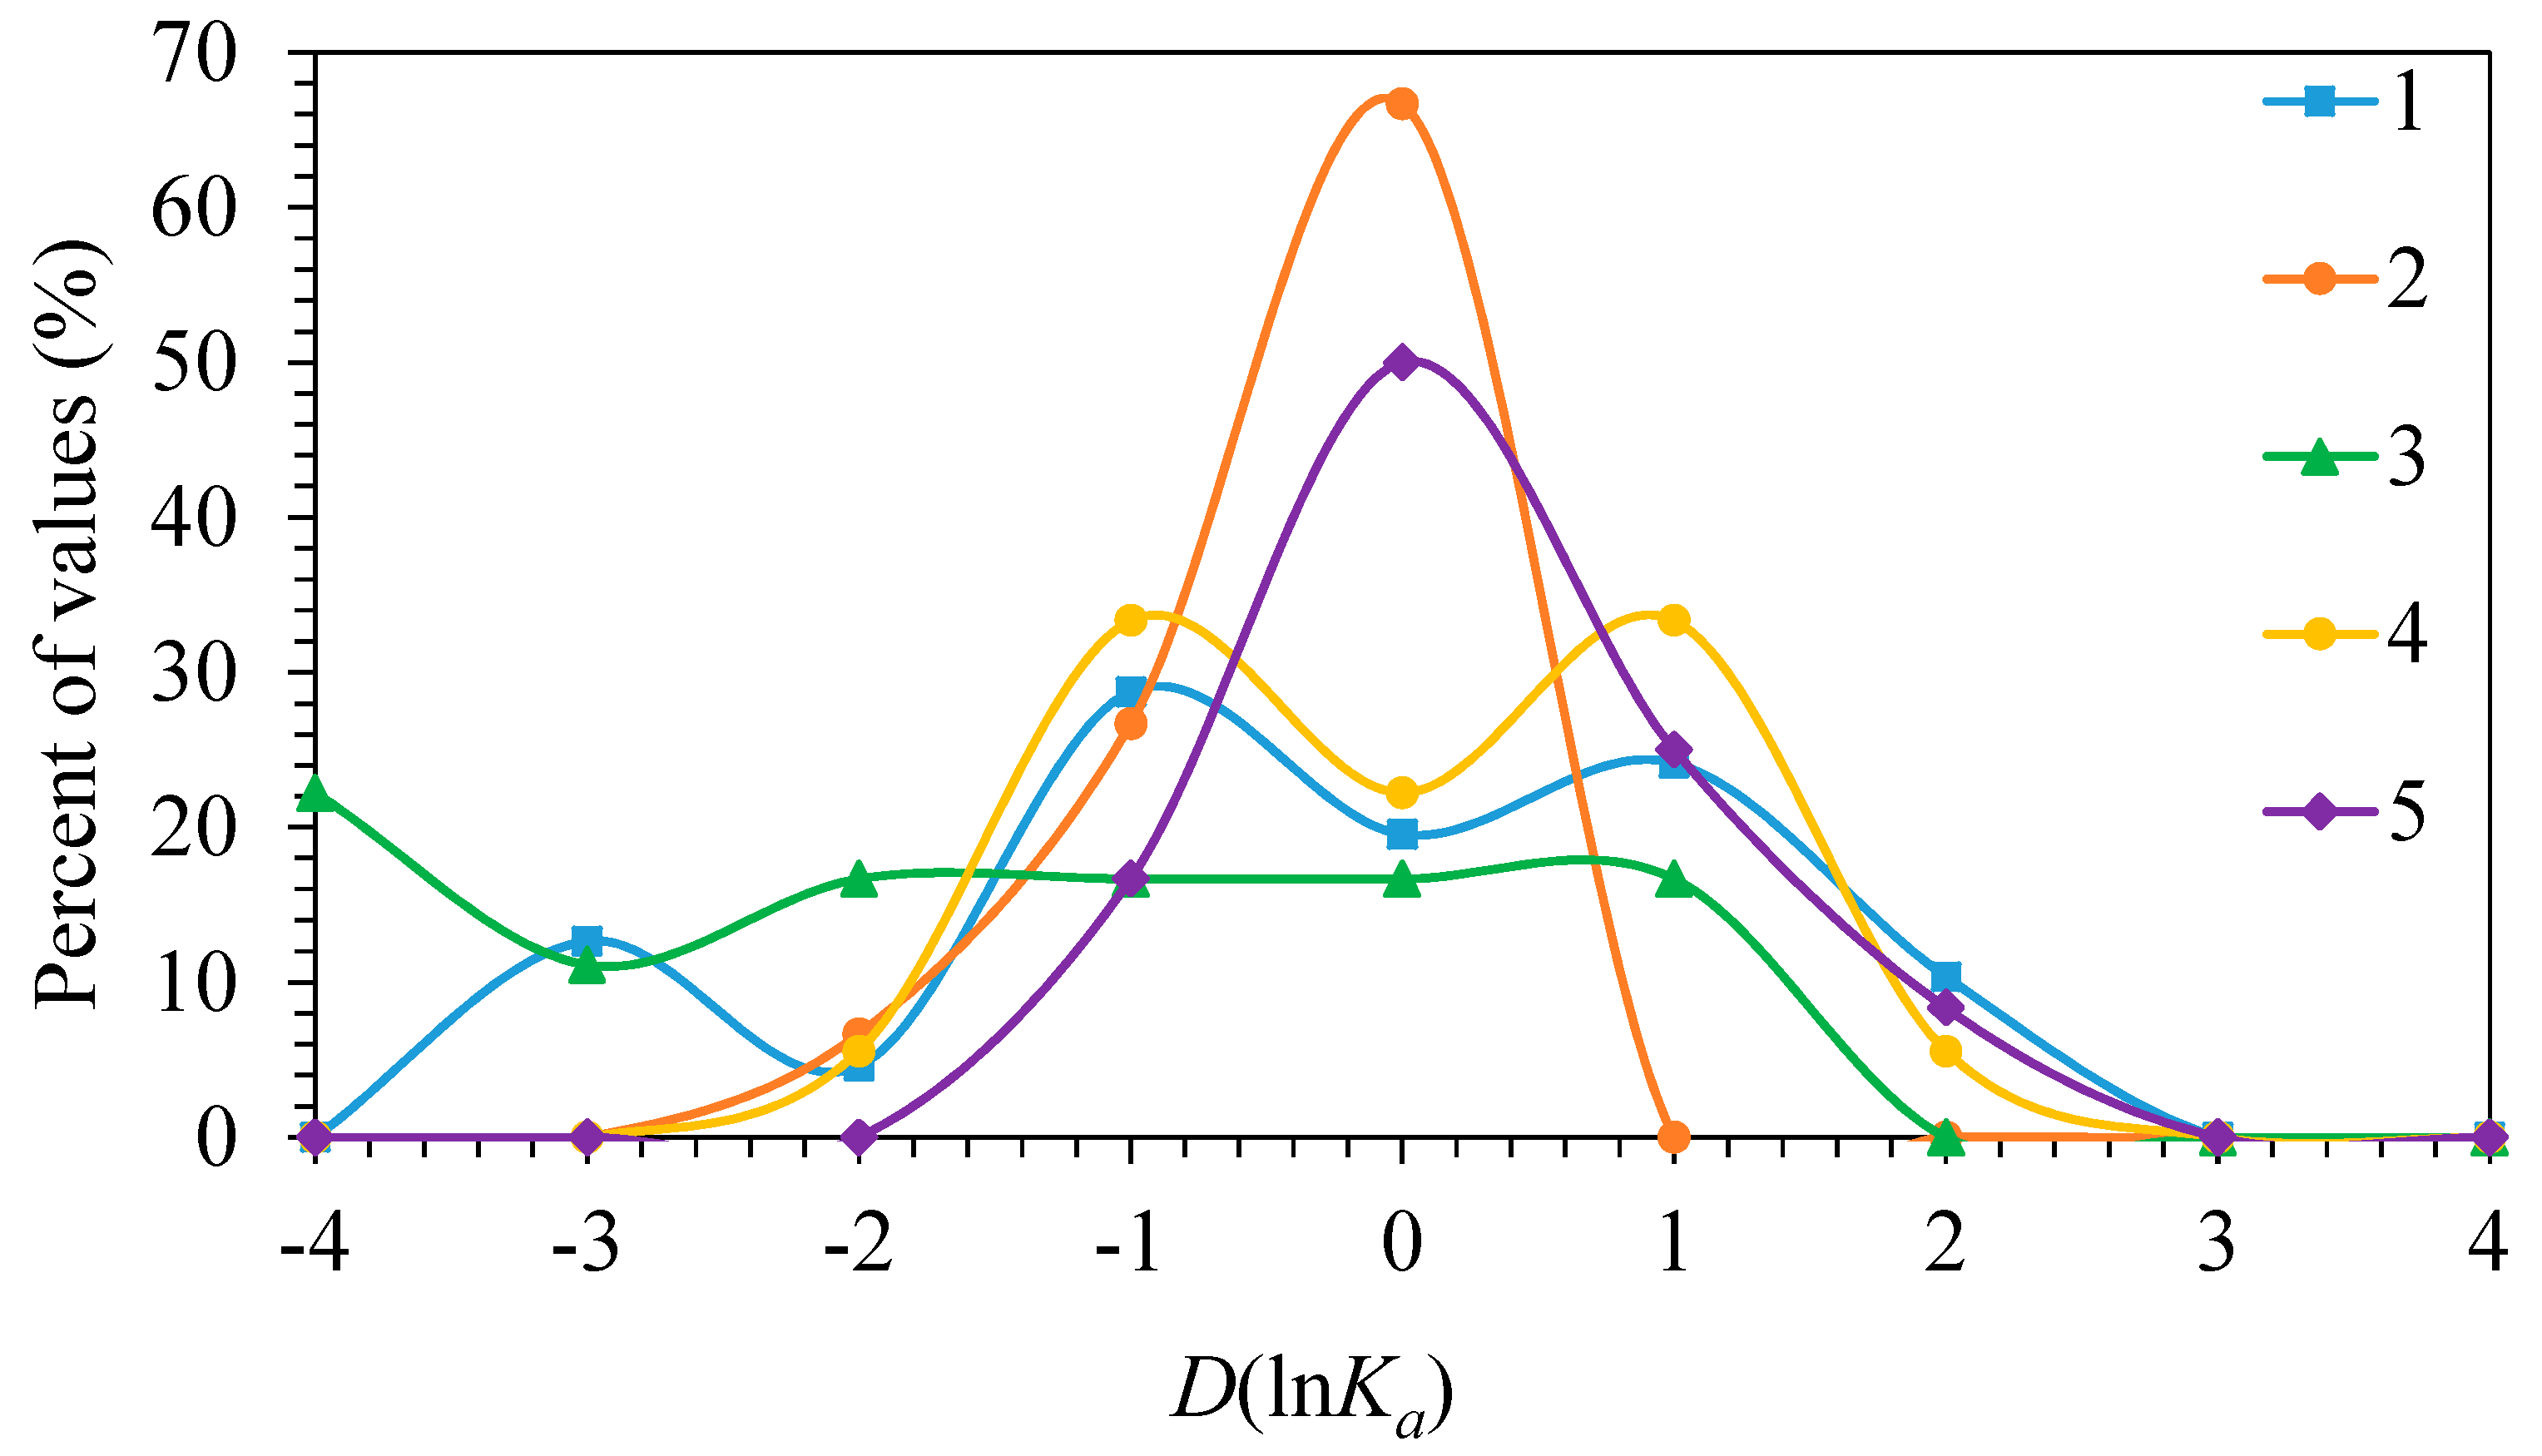
It is also possible to show the influence of the laboratory bias which results from the differences in experimental techniques, equipment, models, and other factors from one lab to another. Five literature sources [26,71,84,85,86] were chosen from the dataset that reported the binding constant values for several different ligands (they are hidden under the numbers 1 to 5). The distributions of the lnKa values binned by , and their magnitude for each of the sources, are shown in Figure 9. Different studies show different distributions of the deviation from the median value. The values from Study 2 were more likely to be lower than the median, Study 5 was higher than the median, while Study 3 showed a large variation of values.
4. Conclusions
The values of albumin-ligand binding constants govern the fraction of protein-bound drugs in blood and influence their pharmacokinetic properties, biological activity, and toxicity. The binding data are also necessary to predict the behavior of artificial systems using albumin as a drug carrier [87,88], and for the further development of computational methods of drug discovery and design.
A dataset containing the literature data on the albumin-binding constants for a selection of drugs and some other ligands, was assembled. A critical analysis showed that there is a diversity in the measurement methods, conditions, and models used in the considered studies. The obtained values for the same system show a significant method-dependence and variations from one study to another. Many albumin-binding studies suffer from numerous methodological problems and limitations, and the same is true for binding constants with many other proteins. Nevertheless, the accumulation of the data from independent measurements helps to determine the reliable recommended values of the constants, as it was done for many other physical quantities. The further development of the dataset, as well as novel experimental studies of the affinity of drugs and other ligands to albumins, are highly suggested.
Supplementary Materials
The following are available online at https://0-www-mdpi-com.brum.beds.ac.uk/article/10.3390/biophysica1030026/s1, Table S1: the albumin-binding constants dataset in MS Excel format.
Author Contributions
I.S.: conceptualization, methodology, software, formal analysis, writing—original draft; A.N.: investigation, data curation, visualization; D.K.: investigation. All authors have read and agreed to the published version of the manuscript.
Funding
This work was supported by the Russian Science Foundation under the grant 19-73-00209.
Data Availability Statement
The data presented in this study are available online at http://0-doi-org.brum.beds.ac.uk/10.5281/zenodo.4723447 (accessed on 11 August 2021).
Conflicts of Interest
The authors declare no competing interests.
References
- Fasano, M.; Curry, S.; Terreno, E.; Galliano, M.; Fanali, G.; Narciso, P.; Notari, S.; Ascenzi, P. The extraordinary ligand binding properties of human serum albumin. IUBMB Life 2005, 57, 787–796. [Google Scholar] [CrossRef]
- Churchwell, M.D.; Pasko, D.A.; Smoyer, W.E.; Mueller, B.A. Enhanced clearance of highly protein-bound drugs by albumin-supplemented dialysate during modeled continuous hemodialysis. Nephrol. Dial. Transplant. 2008, 24, 231–238. [Google Scholar] [CrossRef] [Green Version]
- Shargel, L.; Wu-Pong, S.; Yu, A.B.C. Applied Biopharmaceutics & Pharmacokinetics, 5th ed.; Appleton & Lange Reviews/McGraw-Hill, Medical Pub. Division: New York, NY, USA, 2005; ISBN 978-0-07-137550-4. [Google Scholar]
- Wanat, K. Biological barriers, and the influence of protein binding on the passage of drugs across them. Mol. Biol. Rep. 2020, 47, 3221–3231. [Google Scholar] [CrossRef] [Green Version]
- Goldstein, A. The interactions of drugs and plasma proteins. J. Pharmacol. Exp. Ther. 1949, 95, 102–165. [Google Scholar] [PubMed]
- Thordarson, P. Binding Constants and Their Measurement. In Supramolecular Chemistry; Gale, P.A., Steed, J.W., Eds.; John Wiley & Sons, Ltd.: Chichester, UK, 2012; ISBN 978-0-470-74640-0. [Google Scholar]
- Gaulton, A.; Hersey, A.; Nowotka, M.; Bento, P.A.; Chambers, J.; Mendez, D.; Mutowo, P.; Atkinson, F.; Bellis, L.; Uhalte, E.C.; et al. The ChEMBL database in 2017. Nucleic Acids Res. 2017, 45, D945–D954. [Google Scholar] [CrossRef]
- Gilson, M.K.; Liu, T.; Baitaluk, M.; Nicola, G.; Hwang, L.; Chong, J. Binding DB in 2015: A public database for medicinal chemistry, computational chemistry and systems pharmacology. Nucleic Acids Res. 2016, 44, D1045–D1053. [Google Scholar] [CrossRef] [PubMed]
- Ghuman, J.; Zunszain, P.A.; Petitpas, I.; Bhattacharya, A.A.; Otagiri, M.; Curry, S. Structural Basis of the Drug-binding Specificity of Human Serum Albumin. J. Mol. Biol. 2005, 353, 38–52. [Google Scholar] [CrossRef]
- Scatchard, G. The Attractions of Proteins for Small Molecules and Ions. Ann. N. Y. Acad. Sci. 1949, 51, 660–672. [Google Scholar] [CrossRef]
- Klotz, I.M. Ligand-Receptor Complexes: Origin and Development of the Concept. J. Biol. Chem. 2004, 279, 1–12. [Google Scholar] [CrossRef] [PubMed] [Green Version]
- Czub, M.P.; Handing, K.B.; Venkataramany, B.S.; Cooper, D.R.; Shabalin, I.G.; Minor, W. Albumin-Based Transport of Nonsteroidal Anti-Inflammatory Drugs in Mammalian Blood Plasma. J. Med. Chem. 2020, 63, 6847–6862. [Google Scholar] [CrossRef]
- Anguizola, J.; Matsuda, R.; Barnaby, O.S.; Hoy, K.S.; Wa, C.; De Bolt, E.; Koke, M.; Hage, D.S. Review: Glycation of human serum albumin. Clin. Chim. Acta 2013, 425, 64–76. [Google Scholar] [CrossRef] [PubMed] [Green Version]
- Vuignier, K.; Schappler, J.; Veuthey, J.-L.; Carrupt, P.-A.; Martel, S. Drug–protein binding: A critical review of analytical tools. Anal. Bioanal. Chem. 2010, 398, 53–66. [Google Scholar] [CrossRef]
- Spector, A.A. Fatty acid binding to plasma albumin. J. Lipid Res. 1975, 16, 165–179. [Google Scholar] [CrossRef]
- Van de Weert, M.; Stella, L. Fluorescence quenching and ligand binding: A critical discussion of a popular methodology. J. Mol. Struct. 2011, 998, 144–150. [Google Scholar] [CrossRef]
- Beltran, J.L.; Codony, R.; Prat, M.D. Evaluation of stability constants from multi-wavelength absorbance data: Program STAR. Anal. Chim. Acta 1993, 276, 441–454. [Google Scholar] [CrossRef]
- Gans, P.; Sabatini, A.; Vacca, A. Investigation of equilibria in solution. Determination of equilibrium constants with the hyperquad suite of programs. Talanta 1996, 43, 1739–1753. [Google Scholar] [CrossRef]
- Barton, P.; Austin, R.; Fessey, R. In Vitro Models for Plasma Binding and Tissue Storage. In Comprehensive Medicinal Chemistry II; Elsevier: Amsterdam, The Netherlands, 2007; pp. 321–340. ISBN 978-0-08-045044-5. [Google Scholar]
- Freire, E.; Schön, A.; Velazquez-Campoy, A. Chapter 5 Isothermal Titration Calorimetry. In Methods in Enzymology; Elsevier: Amsterdam, The Netherlands, 2009; Volume 455, pp. 127–155. ISBN 978-0-12-374596-5. [Google Scholar]
- Houtman, J.C.D.; Brown, P.H.; Bowden, B.; Yamaguchi, H.; Appella, E.; Samelson, L.E.; Schuck, P. Studying multisite binary and ternary protein interactions by global analysis of isothermal titration calorimetry data in sedphat: Application to adaptor protein complexes in cell signaling. Protein Sci. 2007, 16, 30–42. [Google Scholar] [CrossRef]
- Brautigam, C.A. Fitting two- and three-site binding models to isothermal titration calorimetric data. Methods 2015, 76, 124–136. [Google Scholar] [CrossRef] [Green Version]
- Colclough, N.; Ruston, L.; Wood, J.M.; Macfaul, P.A. Species differences in drug plasma protein binding. MedChemComm 2014, 5, 963–967. [Google Scholar] [CrossRef]
- Gleeson, M.P. Plasma Protein Binding Affinity and Its Relationship to Molecular Structure: An In-silico Analysis. J. Med. Chem. 2007, 50, 101–112. [Google Scholar] [CrossRef]
- Ziv, G.; Sulman, F.G. Binding of Antibiotics to Bovine and Ovine Serum. Antimicrob. Agents Chemother. 1972, 2, 206–213. [Google Scholar] [CrossRef] [Green Version]
- Bou-Abdallah, F.; Sprague, S.E.; Smith, B.M.; Giffune, T.R. Binding thermodynamics of Diclofenac and Naproxen with human and bovine serum albumins: A calorimetric and spectroscopic study. J. Chem. Thermodyn. 2016, 103, 299–309. [Google Scholar] [CrossRef] [Green Version]
- Maciążek-Jurczyk, M.; Sułkowska, A.; Bojko, B.; Równicka-Zubik, J.; Sułkowski, W.W. A spectroscopic study of phenylbutazone and aspirin bound to serum albumin in rheumatoid diseases. Spectrochim. Acta Part A Mol. Biomol. Spectrosc. 2011, 82, 181–190. [Google Scholar] [CrossRef]
- Maciążek-Jurczyk, M. Phenylbutazone and ketoprofen binding to serum albumin. Fluorescence study. Pharmacol. Rep. 2014, 66, 727–731. [Google Scholar] [CrossRef]
- Goto, S.; Yoshitomi, H.; Miyamoto, A.; Inoue, K.; Nakano, M. Binding of several loop diuretics to serum albumin and human serum from patients with renal failure and liver disease. J. Pharmacobio-Dyn. 1980, 3, 667–676. [Google Scholar] [CrossRef] [Green Version]
- Oyekan, A.O.; Thomas, W.O.A. The energetics of the interaction of piroxicam with plasma albumin. J. Pharm. Pharmacol. 2011, 36, 831–834. [Google Scholar] [CrossRef] [PubMed]
- Silva, D.; Cortez, C.; Louro, S. Chlorpromazine interactions to sera albumins: A study by the quenching of fluorescence. Spectrochim. Acta Part A Mol. Biomol. Spectrosc. 2004, 60, 1215–1223. [Google Scholar] [CrossRef]
- Seedher, N.; Bhatia, S. Mechanism of interaction of the non-steroidal antiinflammatory drugs meloxicam and nimesulide with serum albumin. J. Pharm. Biomed. Anal. 2005, 39, 257–262. [Google Scholar] [CrossRef] [PubMed]
- Fountoulaki, S.; Perdih, F.; Turel, I.; Kessissoglou, D.P.; Psomas, G. Non-steroidal anti-inflammatory drug diflunisal interacting with Cu(II). Structure and biological features. J. Inorg. Biochem. 2011, 105, 1645–1655. [Google Scholar] [CrossRef] [PubMed]
- Poór, M.; Li, Y.; Matisz, G.; Kiss, L.; Kunsági-Máté, S.; Kőszegi, T. Quantitation of species differences in albumin–ligand interactions for bovine, human and rat serum albumins using fluorescence spectroscopy: A test case with some Sudlow’s site I ligands. J. Lumin. 2014, 145, 767–773. [Google Scholar] [CrossRef]
- Molodenskiy, D.; Shirshin, E.; Tikhonova, T.; Gruzinov, A.; Peters, G.; Spinozzi, F. Thermally induced conformational changes and protein–protein interactions of bovine serum albumin in aqueous solution under different pH and ionic strengths as revealed by SAXS measurements. Phys. Chem. Chem. Phys. 2017, 19, 17143–17155. [Google Scholar] [CrossRef] [Green Version]
- Shang, L.; Wang, Y.; Jiang, J.; Dong, S. pH-Dependent Protein Conformational Changes in Albumin:Gold Nanoparticle Bioconjugates: A Spectroscopic Study. Langmuir 2007, 23, 2714–2721. [Google Scholar] [CrossRef] [PubMed]
- Honoré, B.; Brodersen, R. Albumin binding of anti-inflammatory drugs. Utility of a site-oriented versus a stoichiometric analysis. Mol. Pharmacol. 1984, 25, 137–150. [Google Scholar] [PubMed]
- Rimac, H.; Tandarić, T.; Vianello, R.; Bojić, M. Indomethacin Increases Quercetin Affinity for Human Serum Albumin: A Combined Experimental and Computational Study and Its Broader Implications. Int. J. Mol. Sci. 2020, 21, 5740. [Google Scholar] [CrossRef] [PubMed]
- Trivedi, V.D.; Vorum, H.; Honoré, B.; Qasim, M.A. Molecular Basis of Indomethacin-Human Serum Albumin Interaction. J. Pharm. Pharmacol. 2010, 51, 591–600. [Google Scholar] [CrossRef] [PubMed]
- Honoré, B.; Brodersen, R.; Robertson, A. Interaction of Indomethacin with Adult Human Albumin and Neonatal Serum. Dev. Pharmacol. Ther. 1983, 6, 347–355. [Google Scholar] [CrossRef] [PubMed]
- Mason, R.W.; McQueen, E.G. Protein Binding of Indomethacin: Binding of Indomethacin to Human Plasma Albumin and its Displacement from Binding by Ibuprofen, Phenylbutazone and Salicylate, In Vitro. Pharmacology 1974, 12, 12–19. [Google Scholar] [CrossRef]
- Bech, E.M.; Martos-Maldonado, M.C.; Wismann, P.; Sørensen, K.K.; Van Witteloostuijn, S.B.; Thygesen, M.B.; Vrang, N.; Jelsing, J.; Pedersen, S.L.; Jensen, K.J. Peptide Half-Life Extension: Divalent, Small-Molecule Albumin Interactions Direct the Systemic Properties of Glucagon-Like Peptide 1 (GLP-1) Analogues. J. Med. Chem. 2017, 60, 7434–7446. [Google Scholar] [CrossRef]
- Bogdan, M.; Pirnau, A.; Floare, C.; Bugeac, C. Binding interaction of indomethacin with human serum albumin. J. Pharm. Biomed. Anal. 2008, 47, 981–984. [Google Scholar] [CrossRef] [PubMed]
- Zini, R.; Athis, P.; Barre, J.P.; Tillement, J. Binding of indomethacin to human serum albumin. Its non displacement by various agents, influence of free fatty acids and the unexpected effect of indomethacin on warfarin binding. Biochem. Pharmacol. 1979, 28, 2661–2665. [Google Scholar] [CrossRef]
- Zhang, J.; Sun, H.-H.; Zhang, Y.-Z.; Yang, L.-Y.; Dai, J.; Liu, Y. Interaction of Human Serum Albumin with Indomethacin: Spectroscopic and Molecular Modeling Studies. J. Solut. Chem. 2012, 41, 422–435. [Google Scholar] [CrossRef]
- Hvidberg, E.; Lausen, H.H.; Jansen, J.A. Indomethacin: Plasma concentrations and protein binding in man. Eur. J. Clin. Pharmacol. 1972, 4, 119–124. [Google Scholar] [CrossRef]
- Mohammadnia, F.; Fatemi, M.H.; Taghizadeh, S.M. Study on the interaction of anti-inflammatory drugs with human serum albumin using molecular docking, quantitative structure–activity relationship, and fluorescence spectroscopy. Luminescence 2020, 35, 266–273. [Google Scholar] [CrossRef]
- Quijano, R.; Kongyingyoes, B.; Thithapandha, A. Phenylbutazone Plasma Binding: Effects of Salicylic Acid, Indomethacin, and Dicloxacillin. Exp. Biol. Med. 1979, 162, 442–444. [Google Scholar] [CrossRef]
- Murakami, K.; Fujisaki, Y.; Sano, T. A Stopped-Flow Kinetic Study on the Binding of Phenylbutazone to Human Serum Albumin Using Absorption and Circular Dichroism Techniques. Bull. Chem. Soc. Jpn. 1987, 60, 3385–3390. [Google Scholar] [CrossRef] [Green Version]
- Chignell, C.F.; Starkweather, D.K. Species Differences in the Binding of Phenylbutazone to Plasma Albumin. Pharmacology 1971, 5, 235–244. [Google Scholar] [CrossRef]
- Russeva, V.; Mihailova, D. Binding of Phenylbutazone to Human Serum Albumin. Arzneimittelforschung 2011, 49, 255–258. [Google Scholar] [CrossRef]
- Sułkowska, A.; Maciążek-Jurczyk, M.; Bojko, B.; Równicka, J.; Zubik-Skupień, I.; Temba, E.; Pentak, D.; Sułkowski, W. Competitive binding of phenylbutazone and colchicine to serum albumin in multidrug therapy: A spectroscopic study. J. Mol. Struct. 2008, 881, 97–106. [Google Scholar] [CrossRef]
- Aki, H.; Yamamoto, M. Thermodynamic Characterization of Drug Binding to Human Serum Albumin by Isothermal Titration Microcalorimetry. J. Pharm. Sci. 1994, 83, 1712–1716. [Google Scholar] [CrossRef] [PubMed]
- Elbary, A.A.; Vallner, J.J.; Whitworth, C.W. Effect of Albumin Conformation on the Binding of Phenylbutazone and Oxyphenbutazone to Human Serum Albumin. J. Pharm. Sci. 1982, 71, 241–244. [Google Scholar] [CrossRef]
- Veronich, K.; White, G.; Kapoor, A. Effects of Phenylbutazone, Tolbutamide, and Clofibric Acid on Binding of Racemic Warfarin and Its Enantiomers to Human Serum Albumin. J. Pharm. Sci. 1979, 68, 1515–1518. [Google Scholar] [CrossRef]
- Day, Y.S.N.; Myszka, D.G. Characterizing a Drug’s Primary Binding Site on Albumin. J. Pharm. Sci. 2003, 92, 333–343. [Google Scholar] [CrossRef]
- Dai, J.; Zou, T.; Wang, L.; Zhang, Y.; Liu, Y. Investigation of the interaction between quercetin and human serum albumin by multiple spectra, electrochemical impedance spectra and molecular modeling: Interaction between Quercetin and Human Serum Albumin. Luminescence 2014, 29, 1154–1161. [Google Scholar] [CrossRef] [PubMed]
- Kameníková, M.; Furtmüller, P.G.; Klacsová, M.; Lopez-Guzman, A.; Toca-Herrera, J.L.; Vitkovská, A.; Devínsky, F.; Mučaji, P.; Nagy, M. Influence of quercetin on the interaction of gliclazide with human serum albumin–spectroscopic and docking approaches. Luminescence 2017, 32, 1203–1211. [Google Scholar] [CrossRef]
- Mishra, B.; Barik, A.; Priyadarsini, K.I.; Mohan, H. Fluorescence spectroscopic studies on binding of a flavonoid antioxidant quercetin to serum albumins. J. Chem. Sci. 2005, 117, 641–647. [Google Scholar] [CrossRef]
- Dufour, C.; Dangles, O. Flavonoid–serum albumin complexation: Determination of binding constants and binding sites by fluorescence spectroscopy. Biochim. Biophys. Acta (BBA) Gen. Subj. 2005, 1721, 164–173. [Google Scholar] [CrossRef]
- Mohseni-Shahri, F.S.; Housaindokht, M.R.; Bozorgmehr, M.R.; Moosavi-Movahedi, A.A. The influence of the flavonoid quercetin on the interaction of propranolol with human serum albumin: Experimental and theoretical approaches. J. Lumin. 2014, 154, 229–240. [Google Scholar] [CrossRef]
- Poór, M.; Boda, G.; Kunsági-Máté, S.; Needs, P.W.; Kroon, P.A.; Lemli, B. Fluorescence spectroscopic evaluation of the interactions of quercetin, isorhamnetin, and quercetin-3′-sulfate with different albumins. J. Lumin. 2018, 194, 156–163. [Google Scholar] [CrossRef]
- Wani, T.A.; Bakheit, A.H.; Zargar, S.; Alanazi, Z.S.; Al-Majed, A.A. Influence of antioxidant flavonoids quercetin and rutin on the in-vitro binding of neratinib to human serum albumin. Spectrochim. Acta Part A Mol. Biomol. Spectrosc. 2020, 246, 118977. [Google Scholar] [CrossRef]
- Sengupta, B.; Sengupta, P.K. The interaction of quercetin with human serum albumin: A fluorescence spectroscopic study. Biochem. Biophys. Res. Commun. 2002, 299, 400–403. [Google Scholar] [CrossRef]
- Das, P.; Chaudhari, S.K.; Das, A.; Kundu, S.; Saha, C. Interaction of flavonols with human serum albumin: A biophysical study showing structure–activity relationship and enhancement when coated on silver nanoparticles. J. Biomol. Struct. Dyn. 2019, 37, 1414–1426. [Google Scholar] [CrossRef] [PubMed]
- Boulton, D.W.; Walle, U.K.; Walle, T. Extensive Binding of the Bioflavonoid Quercetin to Human Plasma Proteins. J. Pharm. Pharmacol. 2011, 50, 243–249. [Google Scholar] [CrossRef] [PubMed]
- Rolinski, O.J.; Martin, A.; Birch, D.J.S. Human serum albumin and quercetin interactions monitored by time-resolved fluorescence: Evidence for enhanced discrete rotamer conformations. J. Biomed. Opt. 2007, 12, 034013. [Google Scholar] [CrossRef] [PubMed]
- Wybranowski, T.; Kruszewski, S. Optical Spectroscopy Study of the Interaction between Quercetin and Human Serum Albumin. Acta Phys. Pol. A 2014, 125, A-57–A-60. [Google Scholar] [CrossRef]
- Rimac, H.; Dufour, C.; Debeljak, Ž.; Zorc, B.; Bojić, M. Warfarin and Flavonoids Do Not Share the Same Binding Region in Binding to the IIA Subdomain of Human Serum Albumin. Molecules 2017, 22, 1153. [Google Scholar] [CrossRef]
- Vaneková, Z.; Hubčík, L.; Toca-Herrera, J.L.; Furtműller, P.G.; Mučaji, P.; Nagy, M. Analysis of Binding Interactions of Ramipril and Quercetin on Human Serum Albumin: A Novel Method in Affinity Evaluation. Molecules 2020, 25, 547. [Google Scholar] [CrossRef] [Green Version]
- Lázaro, E.; Lowe, P.J.; Briand, X.; Faller, B. New Approach To Measure Protein Binding Based on a Parallel Artificial Membrane Assay and Human Serum Albumin. J. Med. Chem. 2008, 51, 2009–2017. [Google Scholar] [CrossRef]
- Amézqueta, S.; Bolioli, A.B.M.; Beltran, J.L.; Ràfols, C. Evaluation of the interactions between human serum albumin (HSA) and warfarin or diflunisal by using molecular fluorescence using two approaches. ADMET DMPK 2018, 6, 47–54. [Google Scholar] [CrossRef] [Green Version]
- Garg, M.; Tamboli, E.T.; Singh, M.; Chester, K.; Abdin, M.Z.; Chandna, R.; Ahmad, S. RAPD Based Assessment of Genetic Diversity of Adhatoda vasica Leaves from Different Sub- Continents of India. Indian J. Pharm. Educ. Res. 2015, 49, 231–239. [Google Scholar] [CrossRef] [Green Version]
- Olsen, H.; Andersen, A.; Nordbø, A.; Kongsgaard, U.E.; Børmer, O.P. Pharmaceutical-grade albumin: Impaired drug-binding capacity In Vitro. BMC Clin. Pharmacol. 2004, 4, 4. [Google Scholar] [CrossRef] [Green Version]
- O’Reilly, R.A. Interaction of the anticoagulant drug warfarin and its metabolites with human plasma albumin. J. Clin. Investig. 1969, 48, 193–202. [Google Scholar] [CrossRef] [Green Version]
- Robertson, A.; Karp, W. Albumin Binding of Bumetanide. Dev. Pharmacol. Ther. 1986, 9, 241–248. [Google Scholar] [CrossRef] [PubMed]
- Li, Q.; Yang, W.-Y.; Qu, L.-L.; Qi, H.-Y.; Huang, Y.; Zhang, Z. Interaction of Warfarin with Human Serum Albumin and Effect of Ferulic Acid on the Binding. J. Spectrosc. 2014, 2014, 834501. [Google Scholar] [CrossRef]
- Kragh-Hansen, U. Relations between high-affinity binding sites of markers for binding regions on human serum albumin. Biochem. J. 1985, 225, 629–638. [Google Scholar] [CrossRef] [PubMed] [Green Version]
- Giannetti, A.M.; Wong, H.; Dijkgraaf, G.J.P.; Dueber, E.C.; Ortwine, D.F.; Bravo, B.J.; Gould, S.E.; Plise, E.G.; Lum, B.L.; Malhi, V.; et al. Identification, Characterization, and Implications of Species-Dependent Plasma Protein Binding for the Oral Hedgehog Pathway Inhibitor Vismodegib (GDC-0449). J. Med. Chem. 2011, 54, 2592–2601. [Google Scholar] [CrossRef]
- Buttar, D.; Colclough, N.; Gerhardt, S.; MacFaul, P.A.; Phillips, S.D.; Plowright, A.; Whittamore, P.; Tam, K.; Maskos, K.; Steinbacher, S.; et al. A combined spectroscopic and crystallographic approach to probing drug–human serum albumin interactions. Bioorg. Med. Chem. 2010, 18, 7486–7496. [Google Scholar] [CrossRef] [PubMed]
- McElnay, J.C.; D’Arcy, P.F. An In Vitro model of drug/drug interaction at albumin binding sites. J. Pharmacol. Methods 1979, 2, 315–321. [Google Scholar] [CrossRef]
- Ha, C.-E.; Petersen, C.E.; Park, D.S.; Harohalli, K.; Bhagavan, N.V. Investigations of the effects of ethanol on warfarin binding to human serum albumin. J. Biomed. Sci. 2000, 7, 114–121. [Google Scholar] [CrossRef] [PubMed]
- Vorum, H.; Jørgensen, H.R.I.; Brodersen, R. Variation in the binding affinity of warfarin and phenprocoumon to human serum albumin in relation to surgery. Eur. J. Clin. Pharmacol. 1993, 44, 157–162. [Google Scholar] [CrossRef]
- Hulshoff, A.; Perrin, J.H. Quantitative correlations between albumin binding constants and chromatographic RM values of phenothiazine derivatives. J. Med. Chem. 1977, 20, 430–439. [Google Scholar] [CrossRef]
- Amézqueta, S.; Beltrán, J.L.; Bolioli, A.M.; Campos-Vicens, L.; Luque, F.J.; Ràfols, C. Evaluation of the Interactions between Human Serum Albumin (HSA) and Non-Steroidal Anti-Inflammatory (NSAIDs) Drugs by Multiwavelength Molecular Fluorescence, Structural and Computational Analysis. Pharmaceuticals 2021, 14, 214. [Google Scholar] [CrossRef]
- Ploch-Jankowska, A.; Pentak, D. A Comprehensive Spectroscopic Analysis of the Ibuprofen Binding with Human Serum Albumin, Part, I. Pharmaceuticals 2020, 13, 205. [Google Scholar] [CrossRef] [PubMed]
- Kratz, F. Albumin as a drug carrier: Design of prodrugs, drug conjugates and nanoparticles. J. Control. Release 2008, 132, 171–183. [Google Scholar] [CrossRef] [PubMed]
- Larsen, M.T.; Kuhlmann, M.; Hvam, M.L.; Howard, K.A. Albumin-based drug delivery: Harnessing nature to cure disease. Mol. Cell. Ther. 2016, 4, 3. [Google Scholar] [CrossRef] [PubMed] [Green Version]
Figure 1.
Experimental techniques used for the measurement of albumin-binding constants by number of the original papers cited in the dataset in which these techniques were applied.
Figure 1.
Experimental techniques used for the measurement of albumin-binding constants by number of the original papers cited in the dataset in which these techniques were applied.

Figure 2.
Source organisms of albumin by the number of the original papers cited in the dataset.

Figure 3.
Number of papers in the dataset using different maximum albumin concentrations.

Figure 4.
Buffer solutions used to study albumin–ligand binding by a number of the original papers cited in the dataset.
Figure 4.
Buffer solutions used to study albumin–ligand binding by a number of the original papers cited in the dataset.

Figure 5.
Buffer pH values used to study albumin–ligand binding in the papers from the dataset.

Figure 6.
Temperatures used to study albumin–ligand binding in the papers from the dataset.

Figure 7.
Distribution of the number of studies of binding with human serum albumin by the value of the obtained molarity-based association constant for (a) indomethacine [37,38,39,40,41,42,43,44,45,46,47], (b) phenylbutazone [27,28,37,48,49,50,51,52,53,54,55,56], (c) quercetin [38,57,58,59,60,61,62,63,64,65,66,67,68,69,70], (d) warfarin [53,56,71,72,73,74,75,76,77,78,79,80,81,82,83].


Figure 8.
Distributions of the number of values of the binding constants binned by their deviation from the median binding constant for the given ligand and albumin type. A separate distribution is plotted for each common experimental method of the binding constant measurement.
Figure 8.
Distributions of the number of values of the binding constants binned by their deviation from the median binding constant for the given ligand and albumin type. A separate distribution is plotted for each common experimental method of the binding constant measurement.

Figure 9.
Distributions of the number of values of the binding constants binned by their deviation from the median binding constant for the given ligand and albumin type. A separate distribution is plotted for each of the five different literature sources (1–5).
Figure 9.
Distributions of the number of values of the binding constants binned by their deviation from the median binding constant for the given ligand and albumin type. A separate distribution is plotted for each of the five different literature sources (1–5).

Publisher’s Note: MDPI stays neutral with regard to jurisdictional claims in published maps and institutional affiliations. |
© 2021 by the authors. Licensee MDPI, Basel, Switzerland. This article is an open access article distributed under the terms and conditions of the Creative Commons Attribution (CC BY) license (https://creativecommons.org/licenses/by/4.0/).
Share and Cite
MDPI and ACS Style
Sedov, I.; Nikiforova, A.; Khaibrakhmanova, D. Binding Constants of Clinical Drugs and Other Organic Ligands with Human and Mammalian Serum Albumins. Biophysica 2021, 1, 344-358. https://0-doi-org.brum.beds.ac.uk/10.3390/biophysica1030026
AMA Style
Sedov I, Nikiforova A, Khaibrakhmanova D. Binding Constants of Clinical Drugs and Other Organic Ligands with Human and Mammalian Serum Albumins. Biophysica. 2021; 1(3):344-358. https://0-doi-org.brum.beds.ac.uk/10.3390/biophysica1030026
Chicago/Turabian StyleSedov, Igor, Alena Nikiforova, and Diliara Khaibrakhmanova. 2021. "Binding Constants of Clinical Drugs and Other Organic Ligands with Human and Mammalian Serum Albumins" Biophysica 1, no. 3: 344-358. https://0-doi-org.brum.beds.ac.uk/10.3390/biophysica1030026