Review

Recent Trends in Exhaled Breath Diagnosis Using an Artificial Olfactory System

1
BIO-IT Foundry Technology Institute, Pusan National University, Busan 46241, Korea
2
School of Nano Convergence Technology, Hallym University, Chuncheon 24252, Korea
3
Daan Korea Corporation, Seoul 06252, Korea
4
Department of Cogno-Mechatronics Engineering, Pusan National University, Busan 46241, Korea
5
Department of Nanoenergy Engineering, Pusan National University, Busan 46241, Korea
*
Authors to whom correspondence should be addressed.
These authors contributed equally to this work.
Submission received: 5 August 2021 / Revised: 6 September 2021 / Accepted: 10 September 2021 / Published: 14 September 2021
(This article belongs to the Special Issue Nano/Micro Biosensors for Biomedical Applications)

Abstract

:
Artificial olfactory systems are needed in various fields that require real-time monitoring, such as healthcare. This review introduces cases of detection of specific volatile organic compounds (VOCs) in a patient’s exhaled breath and discusses trends in disease diagnosis technology development using artificial olfactory technology that analyzes exhaled human breath. We briefly introduce algorithms that classify patterns of odors (VOC profiles) and describe artificial olfactory systems based on nanosensors. On the basis of recently published research results, we describe the development trend of artificial olfactory systems based on the pattern-recognition gas sensor array technology and the prospects of application of this technology to disease diagnostic devices. Medical technologies that enable early monitoring of health conditions and early diagnosis of diseases are crucial in modern healthcare. By regularly monitoring health status, diseases can be prevented or treated at an early stage, thus increasing the human survival rate and reducing the overall treatment costs. This review introduces several promising technical fields with the aim of developing technologies that can monitor health conditions and diagnose diseases early by analyzing exhaled human breath in real time.

1. Introduction

The olfactory sense is the oldest human sense. Therefore, humans tend to analyze the environment by sniffing [1]. Various studies have been conducted to mimic the sensory cognitive mechanism, and research on sensor systems focusing on olfactory cognitive models has attracted significant attention [2]. Sniffing is a complicated process as there are over 400 species of olfactory receptor gene, and signals through various receptors are comprehensively determined in the brain to provide information about smell and human cognition [3]. The concept of an “artificial nose” is based on a technology that grasps information about odors and uses them as data. In other words, it is an electronic system technology that analyzes the state and composition of a substance through smell. Figure 1 shows the concept of an artificial nose system inspired by the olfactory perception pathway. A biomimetic gas detection platform can be designed by constructing a nanosensor array based on the olfactory receptor tissue and by combining a data processing technology through pattern analysis of signal data.
Persaud et al. proposed the concept of using different types of sensors as arrays and applying unique signal patterns to specific odors to enhance the selectivity, reliability, and accuracy of gas detection systems [4]. The developed system was called an electronic nose (e-nose). All corresponding technologies associated to this system are called e-noses. The principle of the e-nose is similar to that of the human olfactory mechanism. That is, the odor recognition is based on the reaction of the smell factor and olfactory receptors. The e-nose reacts with odor substances using sensor unit devices instead of olfactory receptor cells as receptors, and analyzes patterns using a computer instead of the brain [5].
In the 21st century, the e-nose technology has evolved significantly along with the development of NT/IT technologies. Low-cost, high-performance sensor devices have been developed on the basis of various nanobiosensor technologies, and the data processing analysis technologies have been improved owing to the advent of artificial intelligence (AI)-integrated technologies. The evolution of AI and big data processing technologies has subsequently led to the development of high-level e-nose technologies that utilize a large number of sensor arrays [6]. The current artificial-nose technology can sniff a smell that cannot be smelled by humans using a sensor unit with a sensitivity of parts-per-billion level [7]. Recently, this technology has been used in various fields such as chemistry, medical care, food quality management, and military industry [8,9,10,11]. In the case of conventional gas sensors, the information on the gas concentration level is acquired by quantitatively analyzing specific chemicals. The e-nose sensors do not require such an extensive process and have been increasingly used because of their simple structure that recognizes patterns for only specific odors through a database.
This paper introduces several research cases that analyze the smell of breath exhaled by humans using an artificial olfactory system; in many cases, an e-nose is used. When a person is diagnosed with a certain disease, various volatile organic compounds (VOCs) are produced in vivo owing to metabolic disorders or free radicals [12,13,14]. Such VOCs serve as unique biometric data depending on the specificity, stage, and condition of the disease. In other words, as the conditions under which VOCs occur depend on the particular disease and its various stages, they are classified as “fingerprints” of the disease conditions. Therefore, the analysis of the exhaled gas can provide information on the physiological and health status of an individual. This information can be used for the early diagnosis of many diseases during the induction stage [15]. In this study, we describe the overall concept of disease diagnosis using human respiratory gas, which has gained significant attention in recent years. Furthermore, we describe the trend of human respiratory gas analysis technologies used for diagnosing such diseases and analyze future scenarios of human respiratory gas disease analysis.

2. Exhaled Breath Diagnosis

In conventional approaches, diseases were distinguished on the basis of the breath of patients. Recent reports indicate that dogs that are trained to detect various drugs and explosives by smell can also distinguish cancer patients from healthy people. The olfactory analysis method is a natural approach that is characterized by many possibilities. The current drunk-driving control technologies are based on the blood alcohol concentration measurement, and human breath gas analysis methods are being actively researched. A majority of this research is directed toward the analysis of respiratory diseases such as lung cancer and asthma [16,17]. Once the relationship between a disease and breath gas components is identified, the disease diagnosis based on the exhaled breath analysis is expected to emerge as a future disease diagnostic method [18].
In general, the diagnostic methods using expensive analytical equipment by collecting samples of patients’ blood, tissues, etc. require a time-consuming sample collection process and a skilled operator owing to complex protocols. In addition, such methods can only be performed in a limited number of places such as hospitals. In contrast, disease diagnosis using the analysis of breathing gas can be easily performed by operators and users, and the identification process of the analysis results can be verified in real time. Disease diagnosis by analyzing breath gas is considered to be an innovative non-invasive diagnostic method. Breath gas diagnosis has potential advantages over other diagnostic methods such as blood sampling, urine sampling, biopsy, endoscopy, and imaging. First, it is a completely non-invasive approach that allows the development of a user-friendly, simple, and intuitive diagnostic platform [19]. Second, the sample collection in this method is advantageous because it has superior processing when compared to serum or urine sampling [20]. Finally, it is the most convenient method as it does not pose the problem of bio-hazardous specimens within the current regulations.
Breath gas diagnosis is based on the physiological phenomenon of gas exchange occurring in the alveoli. Human blood contains chemicals that reflect physiological phenomena and metabolic conditions in the human body. Low-molecular organic compounds are contained in the human exhaled breath through the lungs during the respiratory process and are released out of the body [21]. The health conditions of the human body are reflected by various VOCs contained in breathing gases that undergo various biological reactions [22]. Blake et al. [23] reported that various metabolic diseases and pathological conditions could be observed in relation to the concentration increase of the aforementioned VOCs in the exhaled breath gas. These are associated with the respiratory diseases, such as cardiovascular disease (CVD), diabetes, asthma, bacterial infertility and inflammatory disease, cancer, COPD, and Alzheimer’s disease, as well as with other diseases, according to the results of a recent breath analysis. In addition, a number of studies have been conducted on the applicability of diagnostic technologies using these VOC gases.
Table 1 summarizes the biomarker VOCs for each disease that can be used for its diagnosis and the currently used corresponding diagnostic methods. Although it cannot be used as a replacement for the conventional diagnostic method, it has the potential to serve as a portable diagnostic device capable of periodic self-diagnosis, which solves the problems of location and equipment. Through an accurate and efficient analysis of specific biomarker VOCs present in the breath, we demonstrate the possibility of developing a new selective self-diagnosis platform.

2.1. Diabetes

Diabetes is an abnormal carbohydrate metabolic disease that is characterized by hyperglycemic symptoms [39]. It is classified as either type 2 or type 1 depending on the problems with insulin secretion or various degrees of peripheral nerve resistance to insulin action [40,41]. Currently, the most widely applied diabetes diagnostic methods include the fasting plasma glucose, oral glucose tolerance, and glycated hemoglobin [42]. Diabetes is a condition of abnormal blood sugar in patients, and the complications that follow place a considerable burden on clinical and public health. Accordingly, an effective intervention that detects the glucose abnormalities early and prevents progression from prediabetes to diabetes is of utmost importance. Diabetes should be thoroughly managed by the patient through a self-diagnosis. The primary self-diagnosis method is based on glucose level measurement using existing blood collection methods [43]. Although the low-cost diagnostic technology is currently in use, users’ reluctance to collect blood remains to be addressed. If low-cost and efficient non-invasive diagnostic methods are developed in the near future, it is expected to be an innovation in the health care market related to diabetes.
Galassetti et al. [23] presented a correlation between ethanol and acetone in exhaled breath, which is related to serum glucose levels. In the case of patients suffering from diabetic ketoacidosis, a study showed that the acetone concentration in the exhaled gas increases to hundreds of ppmv [44]. When the blood sugar levels remain high over long periods of time, the fatty and amino acids are burned to produce energy. The ketone body produced in the body is a 3-carbon ketone body derived from the oxidation of non-esterified fatty acids, and is found in the state of hydroxyacetone (1-hydroxyacetone) and 1,2-propanediol (PPD) through acetoacetate decarboxylase [45]. The ketone bodies are stored in the blood and thus, lower the pH level. Therefore, glucose cannot be used as an energy source for untreated diabetic patients. As a result, the ketone bodies are produced as by-products and energy sources when fat is broken down instead of glucose. High levels of ketones are produced as a result of low insulin levels in diabetic ketoacidosis [46]. Therefore, the exhaled acetone can be detected in patients with diabetic ketoacidosis and a high-fat diet [25]. These research results can be used for developing a diabetes diagnosis technology for acetone level monitoring in exhaled gas. The introduction of a simple and low-cost measurement technology could enable its use in a wide range of selective testing methods and reduce patient discomfort or pain during blood collection.

2.2. Various VOCs Derived from Inflammatory Diseases

In addition to diabetes, a few other diseases are expected to be diagnosed through the analysis of VOCs in exhaled breath gas. In vivo immune responses that are caused by bacterial infections or inflammatory reactions produce various types of VOC in the body. The pathological problems can interfere with normal metabolism, and abnormal chemical reactions can cause the detection of some VOCs in the exhaled gas [44]. By detecting volatile chemicals such as ammonia, nitrogen oxides, and hydrogen sulfide, the cause of pathological reactions can be analyzed and implemented in the diagnostic technology [47]. Mathew et al. [46] reviewed various types of VOC caused by metabolic processes in the body and metabolic disorders caused by various pathological reactions, and suggested the possibility of the implementation of a breath diagnosis technology. The level of ammonia (NH3) in breath gas can be used as an important biomarker. In the human body, ammonia is produced during protein metabolism and is regulated through the urea circuit owing to its toxicity [48]. In the case of liver and kidney problems, ammonia levels increase [49]. In addition, bacteria such as H. pylori, which cause peptic ulcers from the oral cavity to the duodenum, excrete ammonia gas and hydrogen sulfide through metabolic processes [50]. Nitrogen monoxide and nitrogen oxide are important signaling substances produced in the human body. Within the respiratory system, NO regulates the tension of blood vessels and bronchi (promotes the expansion of blood vessels and airways), promotes the coordinated beating of ciliated epithelial cells, and acts as an important neurotransmitter of non-adrenergic, non-cholinergic neurons running in the bronchi. Diseases related to inflammation can be mainly analyzed through the concentration of NO in the breath [51,52,53,54,55,56,57,58]. Currently, a technology that can measure NO in the respiratory tract using laser analysis sensors is being developed and used as a reference for diagnosing inflammatory diseases [59].
Isoprene is a unit molecule that forms cholesterol and is involved in cholesterol metabolism. Its concentration can be used as a sensitive and non-invasive metric for analyzing various metabolic effects in the human body [60]. Among the cholesterol metabolic diseases, CVDs and hypertension are categorized as representative diseases with a very high risk, and the patient needs constant management through periodic and voluntary diagnosis [61,62]. The currently used self-diagnosis method is the patient family history analysis and periodic monitoring of the blood pressure level [63,64]. Research on the classification of exhaled breath components of patients based on various levels of VOC other than hydrocarbons in the breath is being actively conducted [35]. The following information is from a review by Mathew et. al. [46] for journal diagnostics in 2015. In the case of hydrocarbons such as ethane and pentane, it is caused by oxidation of lipid components in cells [65]. This component is found when a problem occurs in the metabolism of lipid components, and is advantageously released through breath gas owing to its low solubility. It is mainly associated with respiratory obstructive diseases caused by inflammation, such as asthma, COPD, obstructive sleep apnea, and ARDS [66,67,68,69,70]. The hydrocarbon molecules are biomarkers of oxidative stress, and pentane and ethane concentrations increase owing to physical and mental stress [71,72,73]. It shows a significant difference in concentration in sepsis or SIRS patients [70] and can be used in the diagnosis of inflammatory bowel disease, sleep apnea, cancer, and ischemic heart disease [74,75,76,77].
Asthma [78] and COPD [79], which are obstructive respiratory diseases, should be detected early and prevented from worsening through rapid response. According to the currently widely known medical manual, patients with active asthma need periodic checkups every one to six months, depending on the severity of asthma. Asthma symptoms are diagnosed through equipment that detects lung function, such as spirometry, in hospitals [80]. In addition, lung capacity indicators are periodically managed at home using a personal peak flow meter (which approximately costs $20) [81]. On the basis of pathological research results on the levels of various VOC biomarker substances, such as NO, in the patient’s exhaled strain and hydrocarbons, research on inflammatory asthma patients breathing diagnosis using breath gas analysis is actively underway [82,83,84].

2.3. Cancer

Conventionally, cancer diagnostics include genetic, epigenetic, proteomic, and glycomic biomarker screening, as well as some non-invasively collected biofluids [85,86,87,88,89]. In the case of cancer, early detection may increase the chance of complete recovery [90]. If a self-diagnosis technology enabling easy breathing gas analysis is developed, health and medical expenses for cancer treatment can be reduced, and average life expectancy can be increased. A malignant tumor, commonly known as cancer, is a disease wherein cell mutations are caused by several risk factors to identify the cause, which leads to abnormal cell growth and metastasis. It is reported that approximately 100 types of cancer affect the human body.
Because the reactions of cancer cells in the body are complex, various types of VOCs can be used as exhaled breath biomarkers. The first study on cancer diagnosis was conducted for lung cancer, which is a malignant tumor of the lung tissue through direct gas exchange. O’Neil et al. [91] conducted a study to select candidate groups of biomarker VOCs through GC/MS by collecting breath samples from eight lung cancer patients. It was found that among the 386 component gases that were detected with this technology, 45 components were at >75% occurrence level and 28 components were at >90% occurrence level. The research results were significant because they could distinguish between normal samples and patient respiration gas using a classification process via a computer program. Since then, many research results related to the analysis of biomarker VOCs that are common in lung cancer patients have been published [92,93].
Phillips et al. published a study on biomarker VOCs produced by the intracellular oxidative stress caused by breast cancer [94]. Oxidative stress is the process of oxidizing biologically important molecular substances, including DNA and proteins, when an increased amount of reactive oxygen species (ROS) is leaked into the cytoplasm in mitochondria [95]. This causes the decomposition of fatty acids and the peroxidation of lipids by abundant oxygen radicals [96,97]. Breast cancer patients and control patients were classified using SPSS treatment, and higher negative value (NPV) and lower positive value (PPP) were derived, respectively, as compared with the results of the screening mammograms. Kumar et al. published a selected ion flow tube mass spectrometry (SIFT-MS) analysis of exhaled breath for VOC profiling of esophagogastric cancer [98]. In approximately 17 VOC species, the concentrations of hexanoic acid, phenol, methyl phenol, and ethyl phenol differed statistically from those in the positive control group.
Until recently, studies on exhaled breath gas analysis for various cancer disease models and classified patient and control groups have been published steadily. If the integrated analysis sensor array technology that can classify breathing gas samples according to the composition of VOCs is used, a new concept diagnosis technology can be developed for various disease models described above. Furthermore, if breath diagnosis technology is deployed as a low-cost artificial-nose platform consisting of simple chemical sensor units, it will be possible to design self-diagnostic devices that can be used by individuals in real time at home. This technology could be an excellent innovation in health and medical industry.

3. Nanosensor Array E-Nose for Exhaled Breath Diagnosis

The sensor array technology has recently been widely applied in disease diagnosis for exhaled breath gas analysis because it is efficient for analyzing multiple VOCs, including human breath gases [99]. Because exhaled breath gas samples have different compositions of the compounds, their individual analysis using conventional devices, such as existing analytical instrument GC-MS, is limited. The sample component profile can be patterned and recognized using the nanosensor array technology. The artificial nose, which can analyze the components of real-time breathing based on a simple system, is a novel technology that can be used for disease self-diagnosis in healthcare. In terms of the practical application and commercialization of e-nose sensors, low cost, ease of use, and miniaturization are key factors. To meet these requirements, sensor technologies are being developed based on the mechanisms derived from the unique characteristics of various materials [100]. In this section, we discuss electrochemical sensors (metal oxide (MO) nanomaterial-based e-nose sensors) and colorimetric sensors (metal-containing dye sensor arrays and functional phage sensor arrays).
Table 2 summarizes representative nanosensor technologies that can be used for diagnosis based on recent gas detection methods. We aim to introduce an electrochemical sensor method and a technology to detect a small amount of gas mixture using a color sensor. To detect various VOCs present in exhaled breath, artificial olfactory models have been developed using a variety of nanosensor technologies that distinguish specific gas molecules. These technologies are expected to be applicable to disease diagnosis in the future.

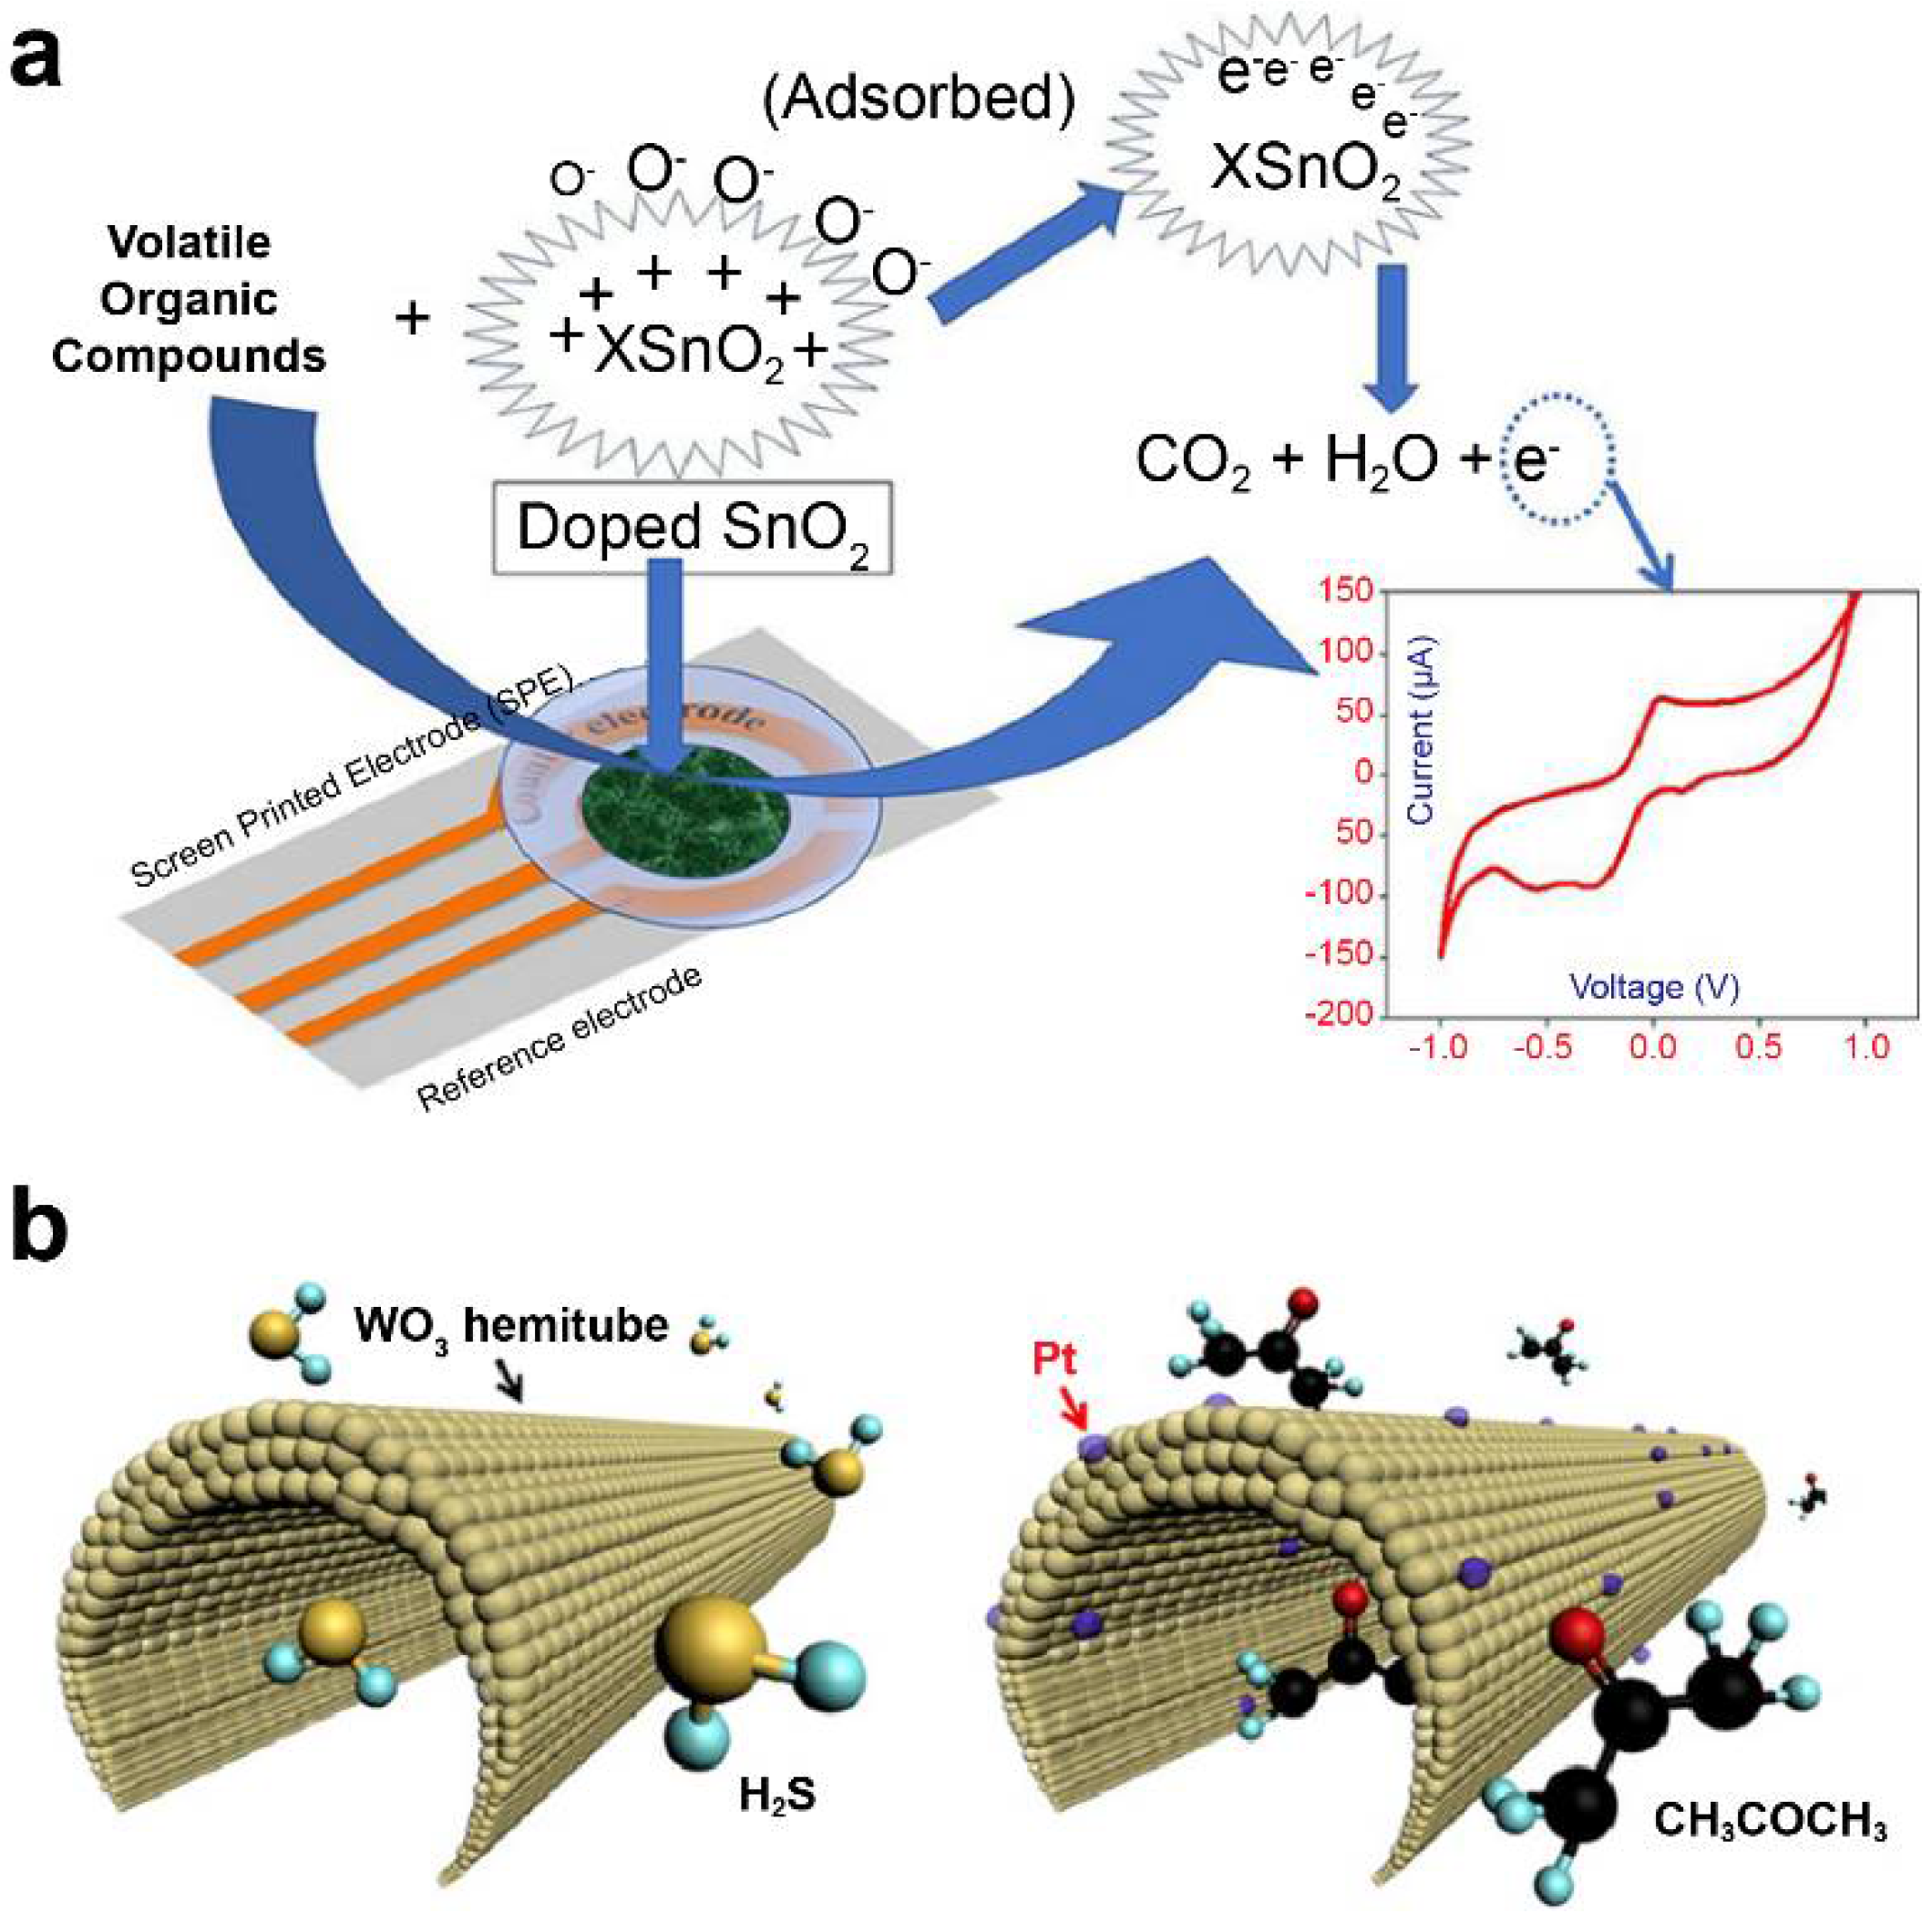
3.1. Metal Oxide-Based Electrochemical Sensor Array for Disease Diagnosis

Metal oxide (MO) nanoparticles are promising candidates for sensor element design owing to their remarkable physicochemical properties, adjustable surface properties, and good stability [110]. These nanoparticles have a high density of trapped charged oxygen species (O2−, O, and O2−), creating a surface charged layer in the sensor element. When the reacting gaseous molecules adsorb oxygen ions on an MO surface, they alter the surface-trapped charge density [111,112]. The number of oxidation states used for gas sensing at the parts-per-billion level can be controlled by the nanoparticle size, shape, and composition. Many transition metal elements such as Fe, Co, Ni, Mn, Al, and Cu have been used as dopants for improving the electrical and optical characteristics of MOs and for enhancing their sensitivity to gases [113].
Khatoon et al. [101] doped Co and Ni with tin oxide (SnO2) using a sol–gel method and investigated it as a sensor material for e-nose development. (Figure 2a) They applied an MO-based screen-printed electrode as the working electrode to determine the levels of 1-propanol and isopropyl alcohol in cyclic voltammetry. Furthermore, Ni-SnO2 and Co-SnO2 were found selective to 1-propanol and isopropyl alcohol, respectively, among other investigated VOCs (acetone, toluene, formaldehyde, 2-butanol, and ethyl acetate). Liu et al. [114,115] developed various CeO2-based gas sensors attached with different MMnO3 (M: Sr, Ca, La, and Sm) sensing electrodes and conducted a comparative study for detecting acetone gas. CeO2-MMnO3 compounds were prepared using a simple sol–gel method.
Nanostructured materials with various morphologies, including nanorods, nanowires, nanosheets, and nanofibers, have been developed for e-nose applications because their large surface area-to-volume greatly facilitates the conversion of gas response into electric signals. Srinivasan et al. [104] developed an acetone sensor using nanostructured Co3O4 thin films for the detection of diabetic ketoacidosis (DKA). The presence of acetone at a trace level (1.8 ppm) in human exhaled breath signifies the presence of DKA from a diagnostic perspective.
The acetone level of the exhaled breath air of type-2 diabetes mellitus patients exceeded 1.71 ppm, whereas that of type-1 diabetes patients was 2.19 ppm. It is known that the concentration of acetone is directly proportional to metabolic disorders in humans. The Occupational Safety and Health Administration states that the allowable human exposure level of acetone is 1000 ppm in industries. Different nanostructured cobalt oxide sensing elements were synthesized using a spray pyrolysis method at different deposition temperatures (473 to 773 K) [117]. It was found that the nanostructured material was more sensitive to acetone when analyzing different solvents such as acetone, EtOH, NH3, xylene, toluene, and acetaldehyde. The sensor fabricated at 773 K exhibited a response of 235 toward acetone (50 ppm) at room temperature.
Furthermore, the sensor showed a limit of detection of 1 ppm, which is lower than the minimum threshold level of DKA. Ren et al. synthesized four different Fe-doped TiO2 thin films on Ti plates using the microarc oxidation technique to measure the level of ethanol gas [118]. The Fe-doped TiO2 thin films fabricated by introducing 0.5 mM K4(FeCN)6·3H2O into 0.5 M Na3PO4 showed a better sensitivity to ethanol gas with a response of 7.9. This value was significantly larger than the responses of other samples (less than 5.2, at 275 °C) prepared with different formulations of K4(FeCN)6·3H2O and Na3PO4. Li et al. synthesized pristine SnO2 and Er-SnO2 nanobelts using the thermal evaporation method. When analyzing 100 ppm of various gases including formaldehyde, ethanediol, ethanol, and acetone at temperature ranging from 150 °C to 260 °C, it was found that the Er-SnO2 nanobelt was more sensitive to formaldehyde gas than other gases. The experimental results revealed that the gas response of a single Er-SnO2 nanobelt device was 9, with response and recovery times of 17 s and 25 s, respectively [119].
Wang et al. [120] also prepared SnO2 and SnO2/NiO electrospun nanofibers, which were subsequently subjected to thermocompression and calcination processes. A fabricated SnO2/NiO sensor was more sensitive to ethanol vapor than to other gases such as H2S, CO, NH3, and acetone. A SnO2/NiO nanofiber exhibited a higher Ra/Rg value (27.5) than a pristine SnO2 nanofiber (2.4) on sensing 100 ppm of ethanol and showed average response and recovery times of 2.9 s and 4.7 s, respectively. Li et al. [121] synthesized porous Nb2O5-TiO2 n–n junction nanofibers with different Nb molar ratios by electrospinning.
Choi et al. used detection sensors to demonstrate promising clinical applications for diagnostic purposes through correlation analysis between exhalation components and specific diseases [116]. They utilized 1D fibers with uniformly applied platinum nanoparticle catalysts on a porous tin oxide (SnO2) sensor material surrounded by layers of thin shells (Figure 2b). When acetone gas was adsorbed on the surface of the material under study, it was applied to a sensor for detecting acetone concentration at approximately 120 ppb, which resulted in a change in the electrical resistance value. The developed nanofiber sensor increased the resistance of the material by up to six times at a concentration of acetone of 1000 ppb, allowing the diagnosis of diabetes. According to another study, wherein trained dogs diagnosed lung cancer, on average, toluene was detected approximately at an 80% accuracy [122]. This sensor was found to detect toluene with an accuracy of approximately 70%. Active research is being conducted on using multisensor arrays for various-disease diagnosis, such as lung cancer and diabetes. An increased number of research studies related to the detection of VOCs based on electrochemical sensors via the change in the resistance of MOs are being published.

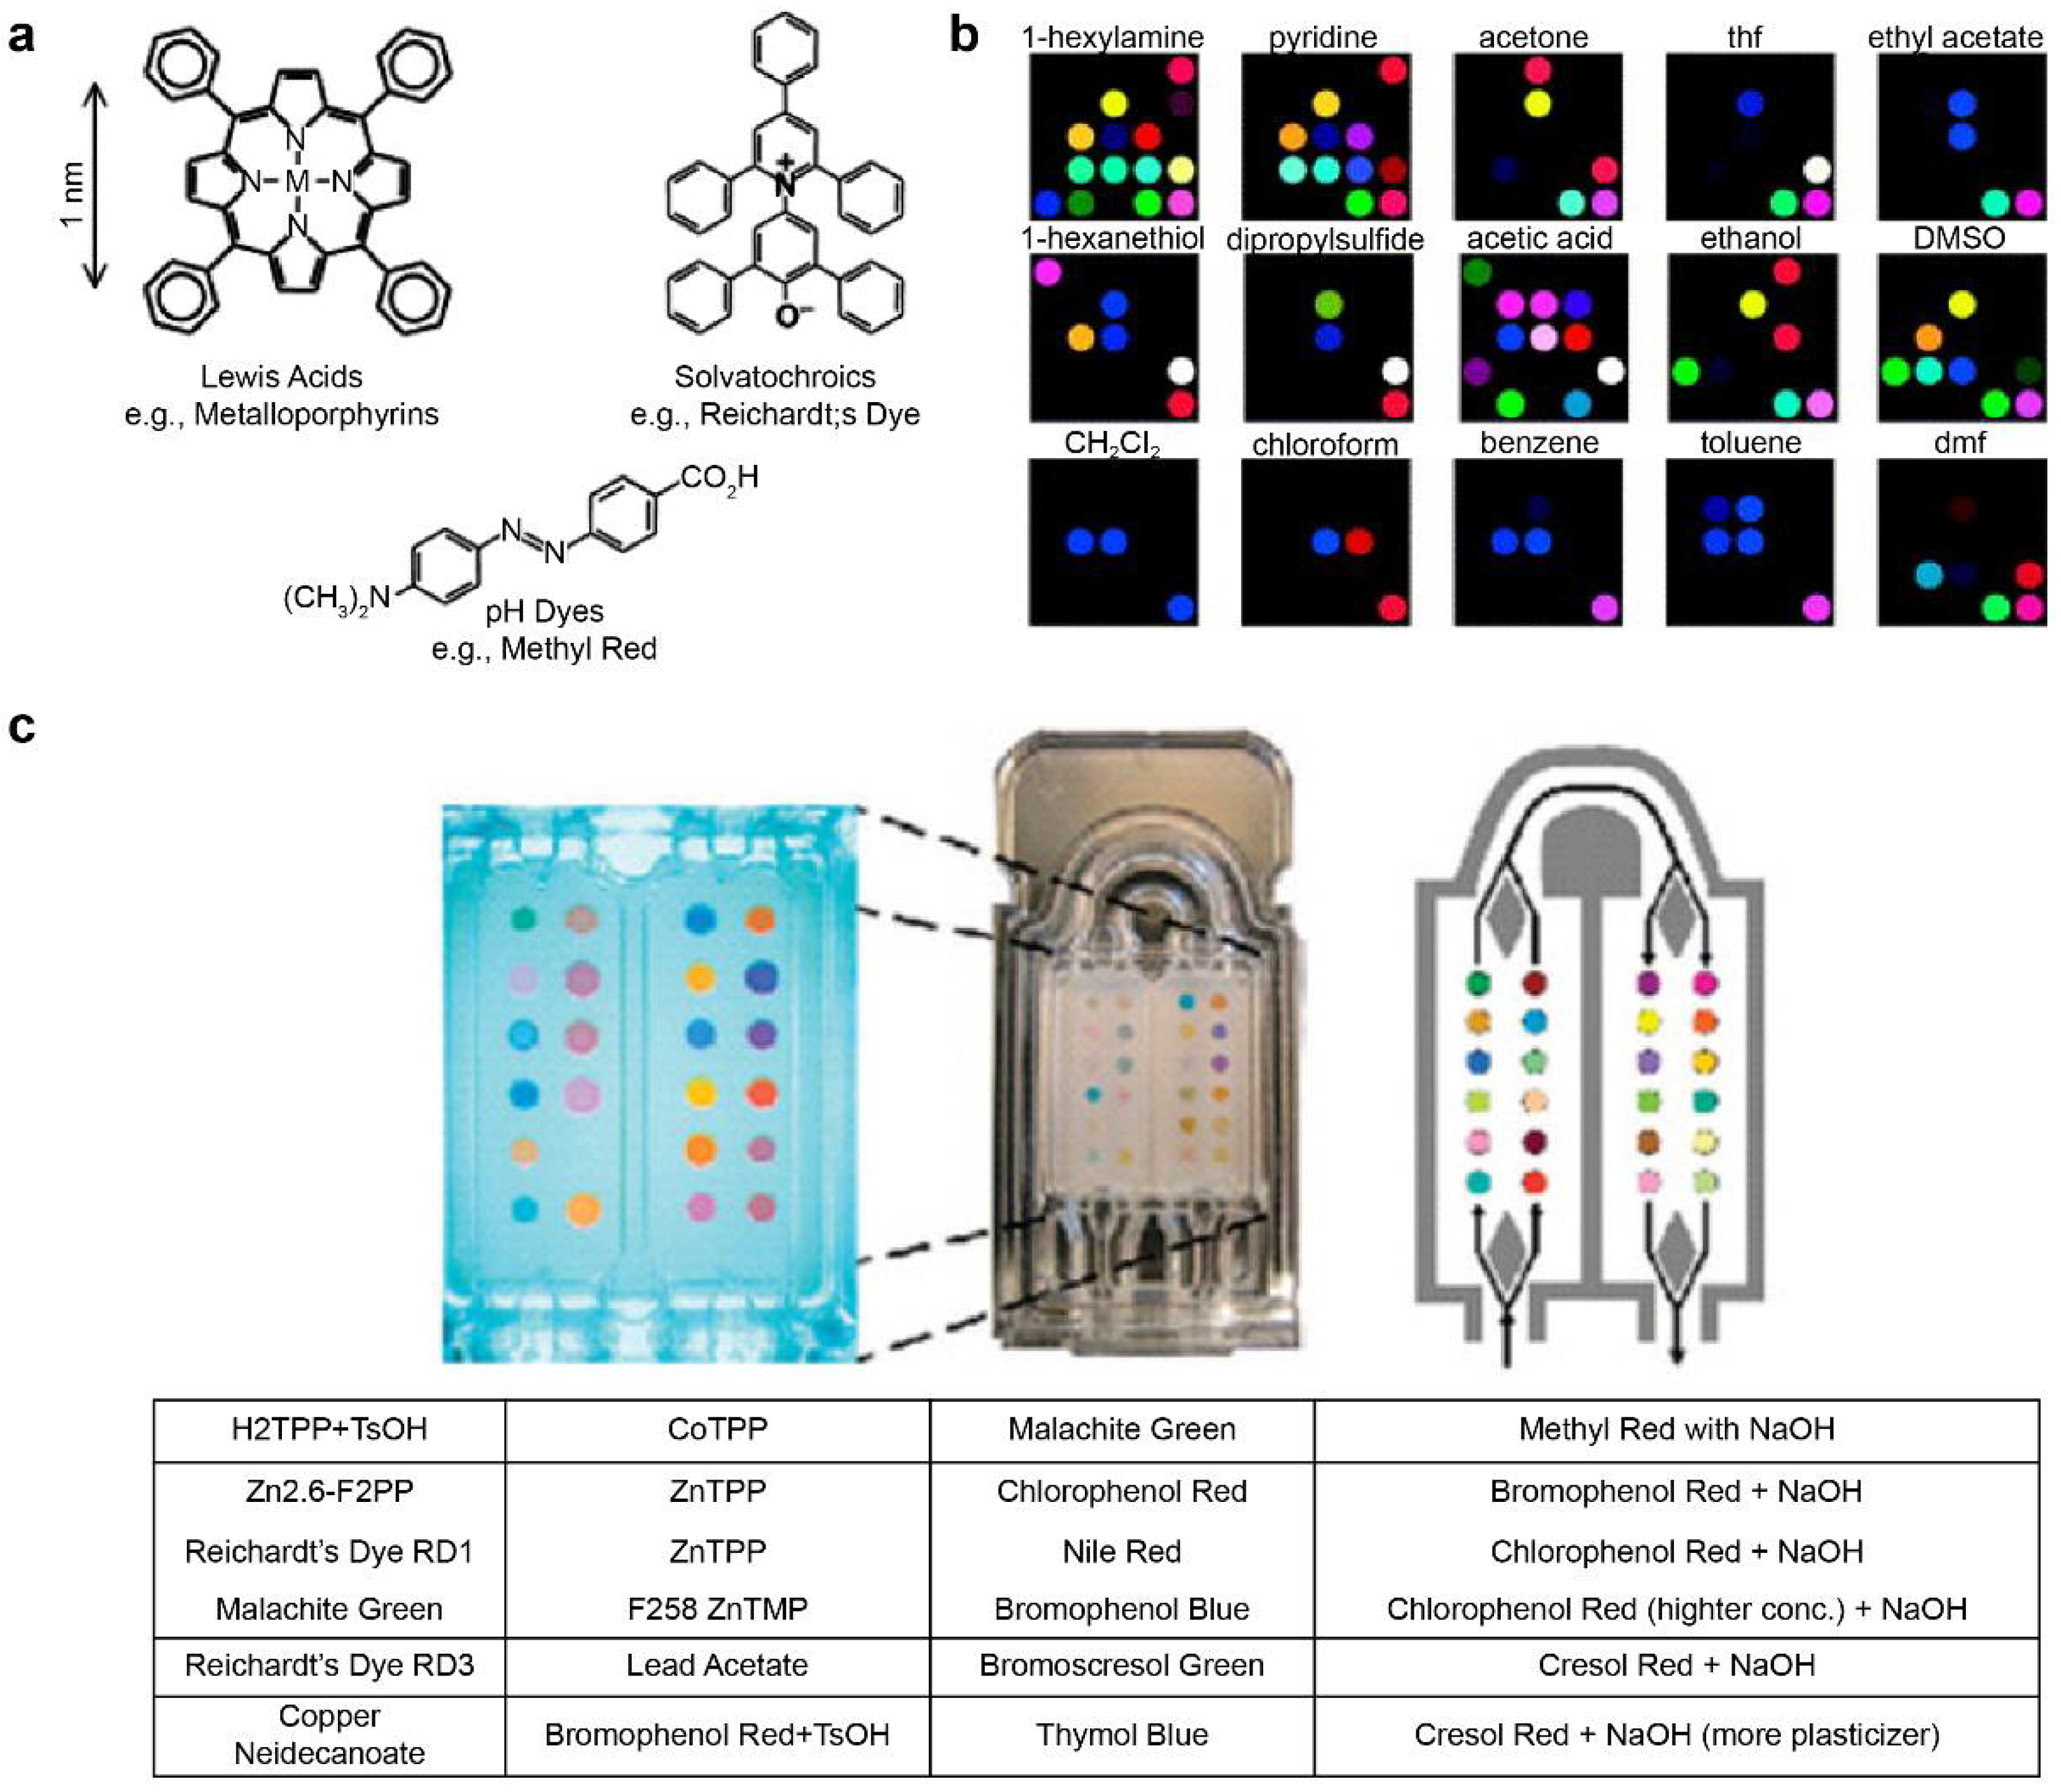
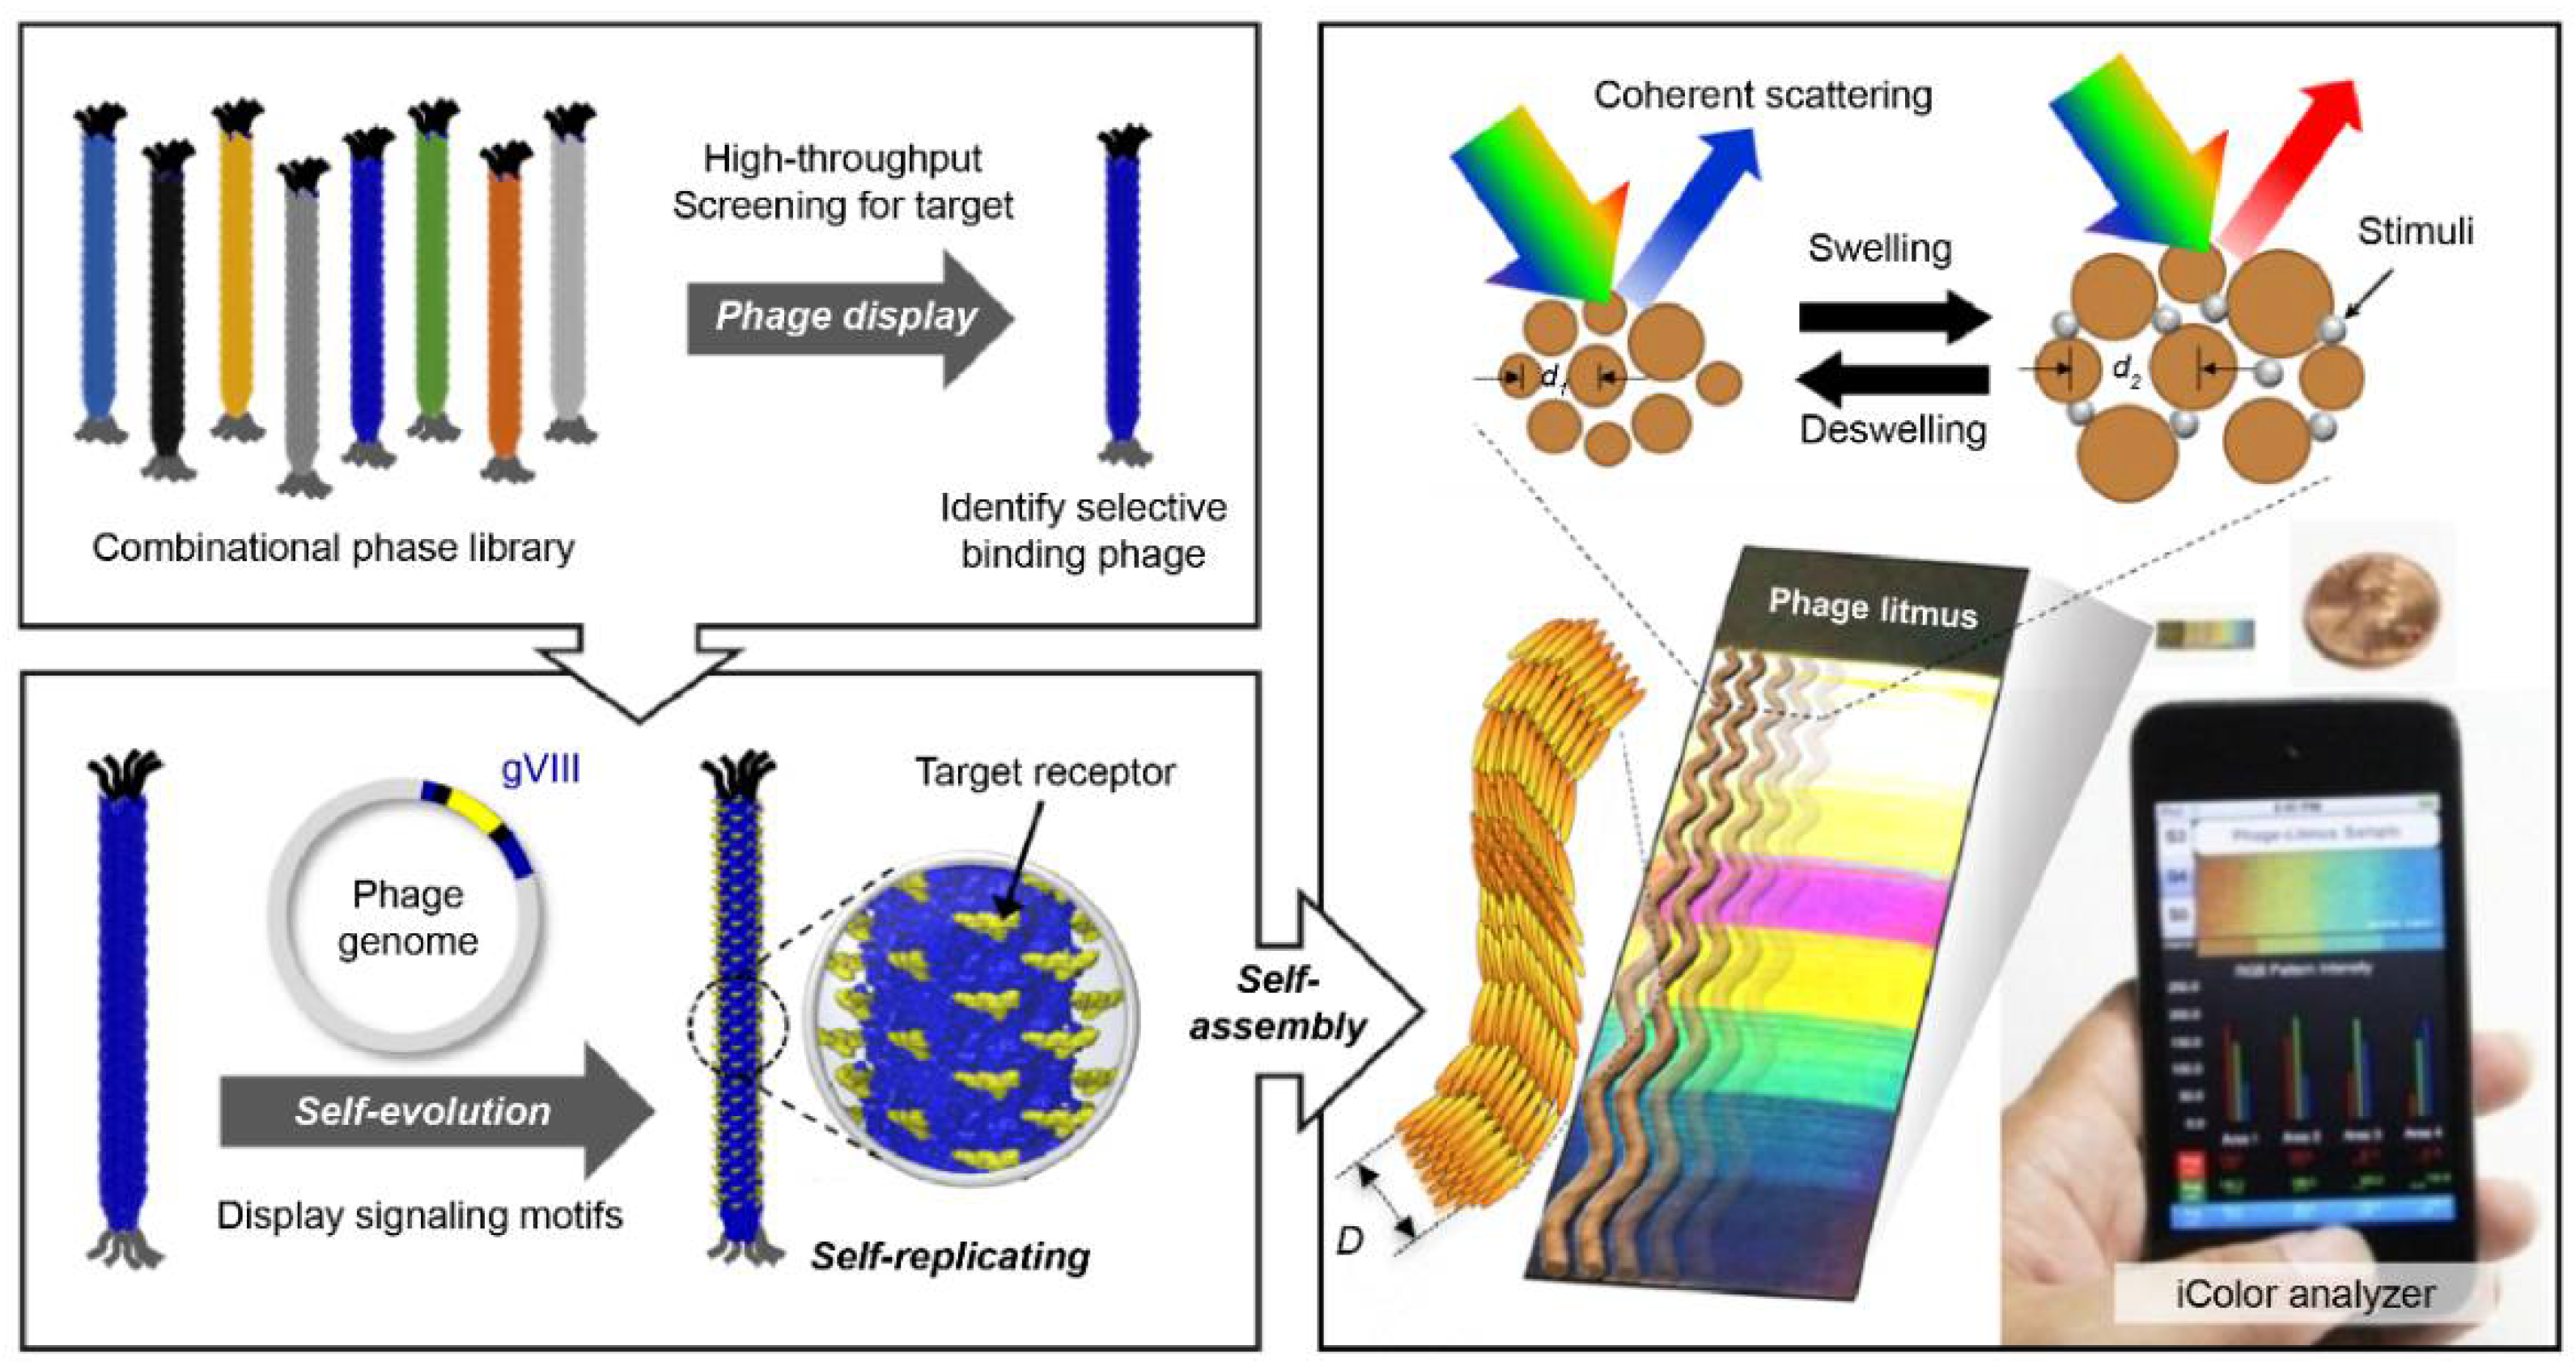
3.2. Colorimetric Sensor Array for an Artificial Nose System

The pattern information for specific reactions can be stored in the fingerprint form using metal-containing dye arrays that react at gas concentrations of hundreds of parts-per-billion. This technique is called smell seeding, and a number of studies focusing on the development of a personal chemical dosimeter for the detection, identification, and quantification of environmental and workplace VOCs have recently been published [123,124,125,126,127,128]. Furthermore, studies have been published on the development of medical diagnosis tools based on breath analysis. Rakow et al. fabricated a sensor array using the color transfer phenomenon of metal-containing dyes such as metalloporphyrin, which is sensitive to gas, and presented an artificial olfactory sensor model [129]. When there is a specific odor, the structure of metalloporphyrins and the color change (Figure 3a) [130]. Using 2D-displayed array metalloporphyrins, a pattern-recognition e-nose that detects a wide range of olfactants (including alcohols, amines, ethers, phosphines, phosphites, thioethers, and thiols) and weakly ligating solvent vapors (arenes, halocarbons, and ketones) was developed (Figure 3b) [130].
Mazzone et al. [103] analyzed exhaled breath samples from lung cancer patients using a colorimetric sensor array. The exhaled breath of 92 lung cancer patients and 229 control patients was obtained via the chromaticity sensor array. (Figure 3c) The technique is further expected to evaluate specific histologies of patients and to optimize them by incorporating clinical risk factors [103]. Other technologies for pathogenic fungal identification and rapid detection of bacteria have also been reported [131,132].
Kim et al. developed a superior chemical gas detection layer by simultaneously controlling nanostructures and catalytic functionalization [133]. The nanostructures derived from electrospinning act as highly dispersed ultrasmall catalysts. Electrospinning-derived 1D-dimensional MOs are nanomaterials with excellent advantages such as large surface-to-volume ratios, high porosity, and high gas permeability, which are beneficial for building chemical gas detection platforms. These materials are expanded to a variety of nanoarchitectures derived from metal organic frameworks, graphene oxide, and polymer templates, and they are used as a sensing sensor material [134,135,136].
Filamentous bacteriophage material is a functional bioreceptor with directed evolution (DE) properties (the Nobel Prize in Chemistry 2018) [137]. Kim et al. developed a multi-array sensor using a functional bacteriophage colorimetric sensor [138]. Phage-based colorimetric sensors classify various VOCs that can be used as an e-nose platform.
Phage display technology, which is based on the principle of natural selection and proliferation by mutation, can discover functional bio-reporter peptide sequences with selectivity for specific molecules [139]. Through a simple genetic manipulation, it is possible to produce a functional phage material for a specific bio-reporter peptide discovered through phage display screening. The phage has ssDNA, which contains genetic information. It is synthesized through biological reactions and can be mass-produced as a bioreporter material with high-purity specific reactions. Oh et al. analyzed the bioreceptor function of the functional bacteriophage and presented the results of optical colorimetric sensor devices using the phage as a building unit (Figure 4) [110]. This single phage unit has a uniform fiber shape of less than 1 μm and has liquid crystal characteristics. Thus, a self-assembled nanostructure can be fabricated. This self-assembled phage structure forms a microstructure with quasi-ordered pitches and scattered reflected light [140]. The color of the phage structure changes according to the size and arrangement of the phage bundles. The external stimuli caused by chemicals change the arrangement of the bundles and change the color of the phage structure. These are used as a chemical gas sensor for VOC classification [109], food origin analysis [141], environment monitoring [142], and breath diagnosis [143]. Extensive research on the pattern-recognition integrated analysis technology utilizing various color sensor arrays is currently underway. Various studies have been published for the following five cell types: human hepatocellular adenocarcinoma (SK-Hep-1), cervical cancer (HeLa), human colon cancer (HCT116), human non-small lung cancer (NCI-H1299), and normal human embryonic kidney (HEK293); cells of these types were incubated in minimum essential media (MEM) containing 10% fetal serum culture [108]. Because each cell type produces a unique composition of VOCs, the three-band optoelectronic sensors produce a unique color. The results of the unique color change were obtained with 99.8% reliable data via 2D-linear discriminant analysis. The results of this study suggest the possibility of developing an effective diagnosis technology through further research.

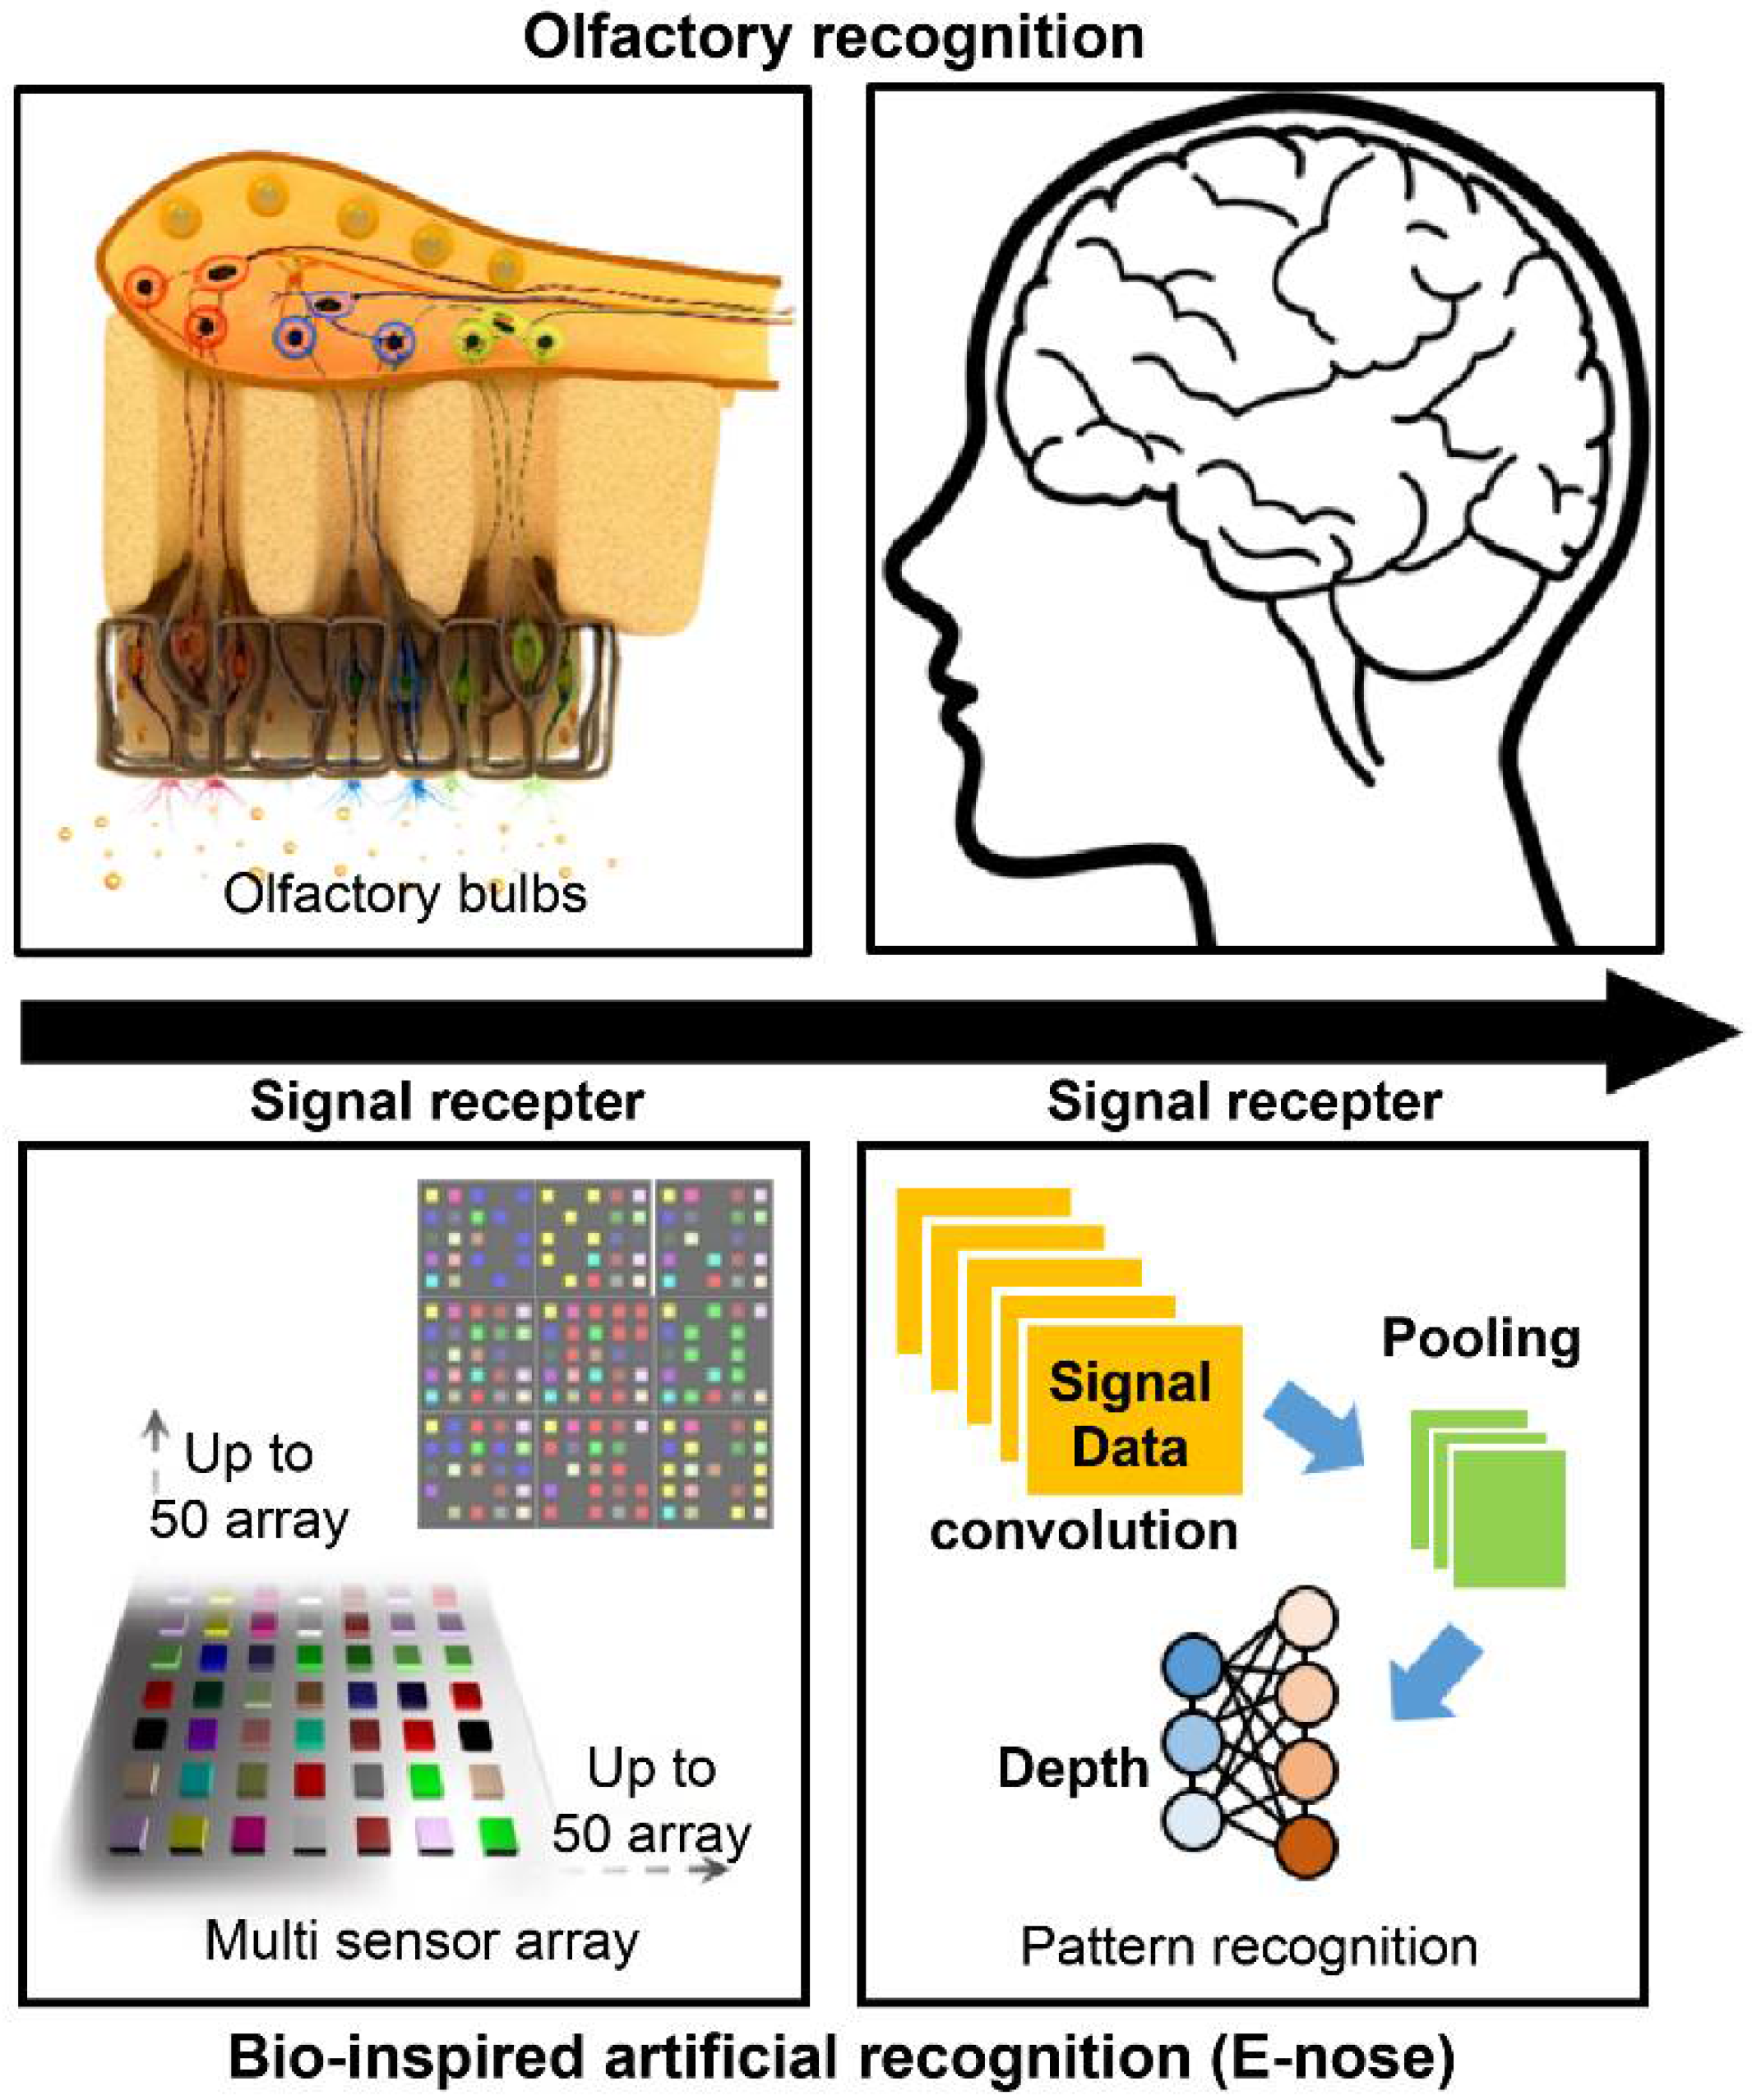
4. Signal Processing Technology Based on Olfactory Cognitive Mechanisms

An artificial olfactory sensor is composed of a gas sensor array, which consists of multiple independent channels and an AI, which is an e-nose system that can detect odors and quantitatively measure their types and concentrations. Fundamentally, signal detection and data processing are required in the olfactory recognition mechanism. By leveraging various sensor arrays to construct multichannel reporters, signal data processing is required. An increasing number of signal receptors results in varying patterns of sensor responses, and a systematic data analysis algorithm using a multisensor array allows for trending classification. By utilizing the pattern analysis of the measurement data using the sensor array, various diseases can be detected, and the influence of external environmental factors (smoking, gender, age, etc.) can be minimized using the accumulated database. The improved analysis algorithm for the accumulated data results in a high commercialization potential of the artificial nose system. Table 3 summarizes various disease diagnosis research cases through data processing using existing sensor arrays.

4.1. Artificial Intelligence Data Processing-Based Multisensor Pattern Recognition

Multivariate analysis of gas mixture data is required for the analysis of sensor array data. Principal component analysis (PCA) is a method that is often used for visually distinguishing between the same sample groups in a plot. A PCA plot is a two-dimensional picture of data from which the data maximum variance can be obtained. The intelligent olfactory sensor can be implemented through advanced data processing techniques using AI and machine learning (ML) with pre-processed data. The supervised learning methods are mainly used to establish a functional relationship between the measurement space and classification elements [165]. In the past decades, many learning methods have been developed, for example, least squares regression (PLS), support vector machine (SVM), artificial neural network (ANN), decision tree (DT), and K-nearest neighbor (KNN). Among these, neural networks such as multilayer perceptrons (MLPs) have been widely used. Recently, the deep neural network (DNN) has been developed as part of a broader family of ML methods based on artificial neural networks. The ML is currently the most common application of AI and its principle is based on the automatic detection of patterns in data and these patterns can be used for future pattern recognition. It has become possible to derive new information by predicting or classifying collected data or by extracting information from appropriate data [166,167].
Deep learning (DL) is also a branch of ML, and it is achieved through the ML based on neural networks. A neural network is inspired by biology, as shown in Figure 5, and it operates in the same way a biological brain solves problems with large units of axons connected to neurons. With the introduction of the concept of dropout, the over-fitting problem of neural networks was resolved, the accuracy was increased significantly, and the DL technology was newly highlighted [168]. This significantly reduced the computational time owing to the advancement of GPU hardware. In addition, the accuracy was considerably enhanced because accurate conclusions could be drawn through very fast iterative learning with big data. Recently, DL algorithms based on convolutional neural networks (CNNs) have shown excellent performance in various fields such as computer vision [169]. In particular, the performance of DL was further improved by the newly introduced ReLU activation function. The signal processing functions include sigmoid, tanh, and ReLU. The ReLU is a function that returns 0 when the value less than 0 is returned, and returns the same value when a value greater than 0 is found. The desired result can be outputted by applying ReLU in the internal hidden layer and sigmoid returning 1 if the value is greater than 0 in the output layer. This factor could be essential for the successful implementation of an intelligent olfactory sensor intended for the application in medical, environmental, and safety fields that require high performance based on big data [170,171,172]. Recently, several studies on the application of DL to intelligent olfactory sensors have been reported [173].

4.2. Multimodal (MM) Analysis

To analyze the concentration of a specific gas accurately, the influence of other gas components should be minimized. Several technologies are being developed for each sensor to minimize the effects of gases other than the gas component under analysis. However, few gases possess the same physical (mass, absorbance, etc.) and chemical (adsorption degree, reaction, etc.) properties. The gas components with the same chemical or physical properties cannot be separated using only a chemical or physical sensor. When a gas is analyzed based on several chemical or physical sensors, some measurement errors occur, and measurement sensitivity and reliability are not guaranteed.
By simultaneously analyzing measurement information of heterogeneous multimodal (MM) sensors, such as sensors that analyze chemical or physical properties, gas components that cannot be separated by the same type of the sensor method can now be separated. As a result, the gas analysis specificity can be improved. The ultralow-concentration (ppt or less) gases can be distinguished using MM information analysis based on measurement information of various kinds provided by pattern recognition-based sensors and AI technologies. The sensor-array that we introduced is also the multimodality concept. By arranging various sensors with different characteristics, each single sensor unit can complement each other against an external variable that cannot be distinguished. By extending the concept of multimodality, multi-array sensors of physical, chemical sensors, biosensors, etc. enables the identification of advanced information based on advanced discrimination.
The olfactory sensor technology is expected to develop into olfactory intelligence using pattern recognition, AI, and MM analysis. Consequently, the measurement sensitivity, accuracy, and reliability can be improved. Moreover, it is expected to develop into a future technology that provides new functions, such as early diagnosis/warning.

5. Conclusions

Clinical diagnosis and post-treatment monitoring technologies based on respiratory gas analysis have several advantages such as non-invasiveness, patient convenience, low cost, and real-time analysis. For successful implementation and use as a self-diagnostic device, this technology should be developed in the direction of miniaturization and simple sampling.
Organic compounds derived from the human body are indicators that assist with disease diagnosis. Body odor, sputum, urine, sweat, breath, etc. are the sources of odor required to analyze these organic compounds. Conductive polymer compounds with different physicochemical properties can be used to analyze the channel-specific pattern of electrical conductivity that changes depending on the type and concentration of gas molecules. Alternatively, olfactory receptors can be immobilized directly on each channel to provide specificity to gas molecules. In order for respiratory gas analysis to be established as a clinical examination tool, an in-depth and extensive clinical study of respiratory gas components and diseases should be conducted.
Olfactory sensors can be miniaturized and integrated using nanosensor technology, and they possess the advantage of low production costs. Currently, research is being carried out on the disease diagnosis analysis using various nanosensors. If a low-cost, easy-to-use, and portable artificial olfactory sensor is implemented, it can be extended and applied to all fields that require continuous monitoring. For the future development of diagnostic sensor technology in the form of an artificial olfactory perception model, multichannelling, miniaturization, weight reduction, low manufacturing cost, and sensor network construction are essential. Additionally, for the development of clinically reliable sensor array technology, a sensor element with high sensitivity as well as high selectivity performance should be developed, and a consistent breathing gas sampling method should be secured.
Advanced AI analysis methods such as DL are attracting significant attention because of their widespread use to improve the accuracy of signal analysis and result prediction of multichannel sensors in the future. Although the disease diagnosis using human breathing gas is still under development, a simple and convenient disease screening method using breathing gas has been designed through continuous gas analyzer development, sensor array technology development, and research on the relationship between human breathing gas and diseases. It is expected that this technology will be applied to disease screening in various forms, starting with the diseases.
Intelligent olfactory sensor technology holds potential for applications and services in various industries including medical, environmental, and safety fields that were previously impossible. In particular, the clinical equivalence and efficacy evaluation with existing medical devices for early disease monitoring using intelligent olfactory sensors in the medical field have been reported. Therefore, for the successful implementation of this technology, it is essential to develop a new technology that combines MM sensors that can provide high sensitivity, selectivity, and reliability with high-performance ML using big data.

Author Contributions

C.K., J.-W.O. and D.-W.H. proposed the research objective and the structure of the review article. C.K. and I.S.R. wrote the paper using materials supplied by J.-M.L., J.H.L., M.S.K. and S.H.L. J.-W.O. and D.-W.H. revised and improved the manuscript. J.-W.O. and D.-W.H. supervised the study. All authors have read and agreed to the published version of the manuscript.

Funding

This research was supported by the Basic Science Research Program through the National Research Foundation of Korea (NRF) funded by the Ministry of Education (No. 2020R1I1A1A01072566 and 2020R1I1A1A01069244) and by the Korea Medical Device Development Fund grant funded by the Korea government (the Ministry of Science and ICT, the Minis-try of Trade, Industry and Energy, the Ministry of Health and Welfare, the Ministry of Food and Drug Safety) (NTIS Number: 9991006781).

Institutional Review Board Statement

Not applicable.

Informed Consent Statement

Not applicable.

Data Availability Statement

Not applicable. No new data were created or analyzed in this study.

Conflicts of Interest

The authors declare no conflict of interest.

References

  1. Sarafoleanu, C.; Mella, C.; Georgescu, M.; Perederco, C. The importance of the olfactory sense in the human behavior and evolution. J. Med. Life 2009, 2, 196. [Google Scholar]
  2. Gardner, J.W. Electronic Noses and Olfaction 2000; IOP Publishing: Bristol, UK, 2001. [Google Scholar]
  3. Young, J.M.; Shykind, B.M.; Lane, R.P.; Tonnes-Priddy, L.; Ross, J.A.; Walker, M.; Williams, E.M.; Trask, B.J. Odorant receptor expressed sequence tags demonstrate olfactory expression of over 400 genes, extensive alternate splicing and unequal expression levels. Genome Biol. 2003, 4, 1–15. [Google Scholar] [CrossRef] [Green Version]
  4. Persaud, K.; Dodd, G. Analysis of discrimination mechanisms in the mammalian olfactory system using a model nose. Nature 1982, 299, 352–355. [Google Scholar] [CrossRef] [PubMed]
  5. Gardner, J.W.; Bartlett, P.N. A brief history of electronic noses. Sens. Actuators B Chem. 1994, 18, 210–211. [Google Scholar] [CrossRef]
  6. Aleixandre, M.; Lozano, J.; Gutiérrez, J.; Sayago, I.; Fernández, M.; Horrillo, M. Portable e-nose to classify different kinds of wine. Sens. Actuators B Chem. 2008, 131, 71–76. [Google Scholar] [CrossRef]
  7. Sysoev, V.V.; Goschnick, J.; Schneider, T.; Strelcov, E.; Kolmakov, A. A gradient microarray electronic nose based on percolating SnO2 nanowire sensing elements. Nano Lett. 2007, 7, 3182–3188. [Google Scholar] [CrossRef]
  8. Wilson, A.D. Review of electronic-nose technologies and algorithms to detect hazardous chemicals in the environment. Procedia Technol. 2012, 1, 453–463. [Google Scholar] [CrossRef] [Green Version]
  9. Kou, L.; Zhang, D.; Liu, D. A novel medical e-nose signal analysis system. Sensors 2017, 17, 402. [Google Scholar] [CrossRef] [Green Version]
  10. Baldwin, E.A.; Bai, J.; Plotto, A.; Dea, S. Electronic noses and tongues: Applications for the food and pharmaceutical industries. Sensors 2011, 11, 4744–4766. [Google Scholar] [CrossRef] [PubMed]
  11. Raj, V.B.; Singh, H.; Nimal, A.; Sharma, M.; Gupta, V. Oxide thin films (ZnO, TeO2, SnO2 and TiO2) based surface acoustic wave (SAW) E-nose for the detection of chemical warfare agents. Sens. Actuators B Chem. 2013, 178, 636–647. [Google Scholar] [CrossRef]
  12. Incalza, M.A.; D’Oria, R.; Natalicchio, A.; Perrini, S.; Laviola, L.; Giorgino, F. Oxidative stress and reactive oxygen species in endothelial dysfunction associated with cardiovascular and metabolic diseases. Vascul. Pharmacol. 2018, 100, 1–19. [Google Scholar] [CrossRef]
  13. Rani, V.; Deep, G.; Singh, R.K.; Palle, K.; Yadav, U.C. Oxidative stress and metabolic disorders: Pathogenesis and therapeutic strategies. Life Sci. 2016, 148, 183–193. [Google Scholar] [CrossRef]
  14. Hoamisligil, G.S. Inflammation and metabolic disorders. Nature 2006, 444, 860–867. [Google Scholar] [CrossRef]
  15. Boots, A.W.; Bos, L.D.; van der Schee, M.P.; van Schooten, F.-J.; Sterk, P.J. Exhaled molecular fingerprinting in diagnosis and monitoring: Validating volatile promises. Trends Mol. Med. 2015, 21, 633–644. [Google Scholar] [CrossRef]
  16. Phillips, M.; Cataneo, R.N.; Cummin, A.R.; Gagliardi, A.J.; Gleeson, K.; Greenberg, J.; Maxfield, R.A.; Rom, W.N. Detection of lung cancer with volatile markers in the breath. Chest 2003, 123, 2115–2123. [Google Scholar] [CrossRef] [PubMed] [Green Version]
  17. Dweik, R.; Boggs, P.; Erzurum, S.; Irvin, C.; Leigh, M.; Lundberg, J.; Olin, A.; Plummer, A.; Taylor, D. An official ATS clinical practice guideline: Interpretation of exhaled nitric oxide levels (FENO) for clinical applications. Am. J. Respir. Crit. Care Med. 2011, 184, 602–615. [Google Scholar] [CrossRef] [PubMed] [Green Version]
  18. Cao, W.; Duan, Y. Breath analysis: Potential for clinical diagnosis and exposure assessment. Clin. Chem. 2006, 52, 800–811. [Google Scholar] [CrossRef] [PubMed] [Green Version]
  19. Cheng, W.-H.; Lee, W.-J. Technology development in breath microanalysis for clinical diagnosis. J. Lab. Clin. Med. 1999, 133, 218–228. [Google Scholar] [CrossRef]
  20. Braun, P.X.; Gmachl, C.F.; Dweik, R.A. Bridging the collaborative gap: Realizing the clinical potential of breath analysis for disease diagnosis and monitoring–tutorial. IEEE Sens. J. 2012, 12, 3258–3270. [Google Scholar] [CrossRef]
  21. Das, S.; Pal, M. Non-invasive monitoring of human health by exhaled breath analysis: A comprehensive review. J. Electrochem. Soc. 2020, 167, 037562. [Google Scholar] [CrossRef]
  22. Buszewski, B.; Kęsy, M.; Ligor, T.; Amann, A. Human exhaled air analytics: Biomarkers of diseases. Biomed. Chromatogr. 2007, 21, 553–566. [Google Scholar] [CrossRef]
  23. Galassetti, P.R.; Novak, B.; Nemet, D.; Rose-Gottron, C.; Cooper, D.M.; Meinardi, S.; Newcomb, R.; Zaldivar, F.; Blake, D.R. Breath ethanol and acetone as indicators of serum glucose levels: An initial report. Diabetes Technol. Ther. 2005, 7, 115–123. [Google Scholar] [CrossRef] [Green Version]
  24. Wang, Z.; Wang, C. Is breath acetone a biomarker of diabetes? A historical review on breath acetone measurements. J. Breath Res. 2013, 7, 037109. [Google Scholar]
  25. Hibbard, T.; Killard, A.J. Breath ammonia analysis: Clinical application and measurement. Crit. Rev. Anal. Chem. 2011, 41, 21–35. [Google Scholar] [CrossRef]
  26. Enderby, B.; Smith, D.; Carroll, W.; Lenney, W. Hydrogen cyanide as a biomarker for Pseudomonas aeruginosa in the breath of children with cystic fibrosis. Pediatr. Pulmonol. 2009, 44, 142–147. [Google Scholar] [CrossRef] [PubMed]
  27. Marteus, H.; Törnberg, D.; Weitzberg, E.; Schedin, U.; Alving, K. Origin of nitrite and nitrate in nasal and exhaled breath condensate and relation to nitric oxide formation. Thorax 2005, 60, 219–225. [Google Scholar] [CrossRef] [PubMed] [Green Version]
  28. McCurdy, M.R.; Bakhirkin, Y.; Wysocki, G.; Lewicki, R.; Tittel, F.K. Recent advances of laser-spectroscopy-based techniques for applications in breath analysis. J. Breath Res. 2007, 1, 014001. [Google Scholar] [CrossRef] [PubMed] [Green Version]
  29. Van der Schee, M.P.; Fens, N.; Brinkman, P.; Bos, L.D.J.; Angelo, M.D.; Nijsen, T.M.E.; Raabe, R.; Knobel, H.H.; Vink, T.J.; Sterk, P.J. Effect of transportation and storage using sorbent tubes of exhaled breath samples on diagnostic accuracy of electronic nose analysis. J. Breath Res. 2012, 7, 016002. [Google Scholar] [CrossRef]
  30. Dweik, R.A.; Amann, A. Exhaled breath analysis: The new frontier in medical testing. J. Breath Res. 2008, 2, 030301. [Google Scholar] [CrossRef] [Green Version]
  31. Cazzola, M.; Segreti, A.; Capuano, R.; Bergamini, A.; Martinelli, E.; Calzetta, L.; Rogliani, P.; Ciaprini, C.; Ora, J.; Paolesse, R. Analysis of exhaled breath fingerprints and volatile organic compounds in COPD. COPD Res. Pract. 2015, 1, 1–8. [Google Scholar] [CrossRef] [Green Version]
  32. Maniscalco, M.; Paris, D.; Melck, D.J.; Molino, A.; Carone, M.; Ruggeri, P.; Caramori, G.; Motta, A. Differential diagnosis between newly diagnosed asthma and COPD using exhaled breath condensate metabolomics: A pilot study. Eur. Respir. J. 2018, 51, 1701825. [Google Scholar] [CrossRef] [PubMed] [Green Version]
  33. Pabst, F.; Miekisch, W.; Fuchs, P.; Kischkel, S.; Schubert, J.K. Monitoring of oxidative and metabolic stress during cardiac surgery by means of breath biomarkers: An observational study. J. Cardiothorac. Surg. 2007, 2, 1–8. [Google Scholar] [CrossRef] [PubMed] [Green Version]
  34. Cikach Jr, F.S.; Dweik, R.A. Cardiovascular biomarkers in exhaled breath. Prog. Cardiovasc. Dis. 2012, 55, 34–43. [Google Scholar] [CrossRef] [Green Version]
  35. Bajtarevic, A.; Ager, C.; Pienz, M.; Klieber, M.; Schwarz, K.; Ligor, M.; Ligor, T.; Filipiak, W.; Denz, H.; Fiegl, M. Noninvasive detection of lung cancer by analysis of exhaled breath. BMC Cancer 2009, 9, 348. [Google Scholar] [CrossRef] [Green Version]
  36. Guntner, A.T.; Koren, V.; Chikkadi, K.; Righettoni, M.; Pratsinis, S.E. E-nose sensing of low-ppb formaldehyde in gas mixtures at high relative humidity for breath screening of lung cancer? ACS Sens. 2016, 1, 528–535. [Google Scholar] [CrossRef]
  37. Fuchs, P.; Loeseken, C.; Schubert, J.K.; Miekisch, W. Breath gas aldehydes as biomarkers of lung cancer. Int. J. Cancer 2010, 126, 2663–2670. [Google Scholar] [CrossRef]
  38. Filipiak, W.; Filipiak, A.; Sponring, A.; Schmid, T.; Zelger, B.; Ager, C.; Klodzinska, E.; Denz, H.; Pizzini, A.; Lucciarini, P. Comparative analyses of volatile organic compounds (VOCs) from patients, tumors and transformed cell lines for the validation of lung cancer-derived breath markers. J. Breath Res. 2014, 8, 027111. [Google Scholar] [CrossRef] [PubMed]
  39. McCulloch, D.K. Classification of Diabetes Mellitus and Genetic Diabetic Syndromes; UpToDate: Waltham, MA, USA, 2007. [Google Scholar]
  40. Harris, M.I.; Robbins, D.C. Prevalence of adult-onset IDDM in the US population. Diabetes Care 1994, 17, 1337–1340. [Google Scholar] [CrossRef] [PubMed]
  41. Landin-Olsson, M.; Nilsson, K.; Lernmark, Å.; Sundkvist, G. Islet cell antibodies and fasting C-peptide predict insulin requirement at diagnosis of diabetes mellitus. Diabetologia 1990, 33, 561–568. [Google Scholar] [CrossRef] [Green Version]
  42. Niskanen, L.K.; Tuomi, T.; Karjalainen, J.; Groop, L.C.; Uusitupa, M.I. GAD antibodies in NIDDM: Ten-year follow-up from the diagnosis. Diabetes Care 1995, 18, 1557–1565. [Google Scholar] [CrossRef] [PubMed]
  43. Pasquale, L.R.; Kang, J.H.; Manson, J.E.; Willett, W.C.; Rosner, B.A.; Hankinson, S.E. Prospective study of type 2 diabetes mellitus and risk of primary open-angle glaucoma in women. Ophthalmology 2006, 113, 1081–1086. [Google Scholar] [CrossRef] [PubMed]
  44. Massick, S. Portable breath acetone measurements combine chemistry and spectroscopy. In Proceedings of the SPIE, San Jose, CA, USA, 28 January–1 February 2007. [Google Scholar]
  45. Reichard, G.; Skutches, C.; Hoeldtke, R.; Owen, O. Acetone metabolism in humans during diabetic ketoacidosis. Diabetes 1986, 35, 668–674. [Google Scholar] [CrossRef] [PubMed]
  46. Mathew, T.L.; Pownraj, P.; Abdulla, S.; Pullithadathil, B. Technologies for clinical diagnosis using expired human breath analysis. Diagnostics 2015, 5, 27–60. [Google Scholar] [CrossRef]
  47. Perez-Guaita, D.; Kokoric, V.; Wilk, A.; Garrigues, S.; Mizaikoff, B. Towards the determination of isoprene in human breath using substrate-integrated hollow waveguide mid-infrared sensors. J. Breath Res. 2014, 8, 026003. [Google Scholar] [CrossRef]
  48. Cox, M.M.; Nelson, D.L. Lehninger Principles of Biochemistry; WH Freeman: New York, NY, USA, 2013. [Google Scholar]
  49. Iorio, R.; Sepe, A.; Giannattasio, A.; Cirillo, F.; Vegnente, A. Hypertransaminasemia in childhood as a marker of genetic liver disorders. J. Gastroenterol. 2005, 40, 820–826. [Google Scholar] [CrossRef]
  50. Linden, D.R. Hydrogen sulfide signaling in the gastrointestinal tract. Antioxid. Redox Signal. 2014, 20, 818–830. [Google Scholar] [CrossRef]
  51. Belvisi, M.; Ward, J.; Mitchell, J.; Barnes, P. Nitric oxide as a neurotransmitter in human airways. Arch. Int. Pharmacodyn. Ther. 1995, 329, 97–110. [Google Scholar] [PubMed]
  52. Jain, B.; Rubinstein, I.; Robbins, R.A.; Leise, K.L.; Sisson, J.H. Modulation of airway epithelial cell ciliary beat frequency by nitric oxide. Biochem. Biophys. Res. Commun. 1993, 191, 83–88. [Google Scholar] [CrossRef] [PubMed]
  53. Belvisi, M.G.; Stretton, C.D.; Yacoub, M.; Barnes, P.J. Nitric oxide is the endogenous neurotransmitter of bronchodilator nerves in humans. Eur. J. Pharmacol. 1992, 210, 221–222. [Google Scholar] [CrossRef]
  54. Blitzer, M.L.; Loh, E.; Roddy, M.-A.; Stamler, J.S.; Creager, M.A. Endothelium-derived nitric oxide regulates systemic and pulmonary vascular resistance during acute hypoxia in humans. Am. J. Cardiol. 1996, 28, 591–596. [Google Scholar] [CrossRef] [Green Version]
  55. Combes, X.; Mazmanian, M.; Gourlain, H.; Herve, P. Effect of 48 hours of nitric oxide inhalation on pulmonary vasoreactivity in rats. Am. J. Respir. Crit. Care Med. 1997, 156, 473–477. [Google Scholar] [CrossRef] [PubMed]
  56. Melot, C.; Vermeulen, F.; Maggiorini, M.; Gilbert, E.; Naeije, R. Site of pulmonary vasodilation by inhaled nitric oxide in microembolic lung injury. Am. J. Respir. Crit. Care Med. 1997, 156, 75–85. [Google Scholar] [CrossRef]
  57. Buga, G.M.; Ignarro, L.J. Electrical field stimulation causes endothelium-dependent and nitric oxide-mediated relaxation of pulmonary artery. Am. J. Physiol. Heart Circ. Physiol. 1992, 262, H973–H979. [Google Scholar] [CrossRef]
  58. Que, L.G.; Yang, Z.; Stamler, J.S.; Lugogo, N.L.; Kraft, M. S-nitrosoglutathione reductase: An important regulator in human asthma. Am. J. Respir. Crit. Care Med. 2009, 180, 226–231. [Google Scholar] [CrossRef] [PubMed] [Green Version]
  59. McManus, J.B.; Shorter, J.H.; Nelson, D.D.; Zahniser, M.S.; Glenn, D.E.; McGovern, R.M. Pulsed quantum cascade laser instrument with compact design for rapid, high sensitivity measurements of trace gases in air. Appl. Phys. B 2008, 92, 387–392. [Google Scholar] [CrossRef]
  60. Stone, B.G.; Besse, T.J.; Duane, W.C.; Dean Evans, C.; DeMaster, E.G. Effect of regulating cholesterol biosynthesis on breath isoprene excretion in men. Lipids 1993, 28, 705–708. [Google Scholar] [CrossRef]
  61. Wilson, P.W.F. Overview of Established Risk Factors for Cardiovascular Disease. Available online: https://www.uptodate.com/contents/overview-of-established-risk-factors-for-cardiovascular-disease (accessed on 5 August 2021).
  62. Wilson, P.W.F.; Givens, J. Cardiovascular Disease Risk Assessment for Primary Prevention in Adults: Our Approach; UpToDate: Wellesley, MA, USA, 2020. [Google Scholar]
  63. Canto, J.G.; Kiefe, C.I.; Rogers, W.J.; Peterson, E.D.; Frederick, P.D.; French, W.J.; Gibson, C.M.; Pollack, C.V.; Ornato, J.P.; Zalenski, R.J. Number of coronary heart disease risk factors and mortality in patients with first myocardial infarction. JAMA 2011, 306, 2120–2127. [Google Scholar] [CrossRef]
  64. Rapsomaniki, E.; Timmis, A.; George, J.; Pujades-Rodriguez, M.; Shah, A.D.; Denaxas, S.; White, I.R.; Caulfield, M.J.; Deanfield, J.E.; Smeeth, L. Blood pressure and incidence of twelve cardiovascular diseases: Lifetime risks, healthy life-years lost, and age-specific associations in 1·25 million people. Lancet 2014, 383, 1899–1911. [Google Scholar] [CrossRef] [Green Version]
  65. Timmis, K.N.; McGenity, T.; Van Der Meer, J.R.; de Lorenzo, V. Handbook of Hydrocarbon and Lipid Microbiology; Springer: Berlin/Heidelberg, Germany, 2010. [Google Scholar]
  66. Efron, B. Censored data and the bootstrap. J. Am. Stat. Assoc. 1981, 76, 312–319. [Google Scholar] [CrossRef]
  67. Mazzone, P.J.; Hammel, J.; Dweik, R.; Na, J.; Czich, C.; Laskowski, D.; Mekhail, T. Diagnosis of lung cancer by the analysis of exhaled breath with a colorimetric sensor array. Thorax 2007, 62, 565–568. [Google Scholar] [CrossRef] [Green Version]
  68. Shawe-Taylor, J.; Cristianini, N. Kernel Methods for Pattern Analysis; Cambridge University Press: Cambridge, UK, 2004. [Google Scholar]
  69. Guyon, I.; Weston, J.; Barnhill, S.; Vapnik, V. Gene selection for cancer classification using support vector machines. Mach. Learn. 2002, 46, 389–422. [Google Scholar] [CrossRef]
  70. Paredi, P.; Kharitonov, S.A.; Leak, D.; Ward, S.; Cramer, D.; Barnes, P.J. Exhaled ethane, a marker of lipid peroxidation, is elevated in chronic obstructive pulmonary disease. Am. J. Respir. Crit. Care Med. 2000, 162, 369–373. [Google Scholar] [CrossRef]
  71. Scotter, J.; Allardyce, R.; Langford, V.; Hill, A.; Murdoch, D. The rapid evaluation of bacterial growth in blood cultures by selected ion flow tube–mass spectrometry (SIFT-MS) and comparison with the BacT/ALERT automated blood culture system. J. Microbiol. Methods 2006, 65, 628–631. [Google Scholar] [CrossRef]
  72. Thorn, R.M.S.; Reynolds, D.M.; Greenman, J. Multivariate analysis of bacterial volatile compound profiles for discrimination between selected species and strains in vitro. J. Microbiol. Methods 2011, 84, 258–264. [Google Scholar] [CrossRef] [PubMed]
  73. Allardyce, R.A.; Hill, A.L.; Murdoch, D.R. The rapid evaluation of bacterial growth and antibiotic susceptibility in blood cultures by selected ion flow tube mass spectrometry. Diagn. Microbiol. Infect. Dis. 2006, 55, 255–261. [Google Scholar] [CrossRef] [PubMed]
  74. Wendland, B.E.; Aghdassi, E.; Tam, C.; Carrrier, J.; Steinhart, A.H.; Wolman, S.L.; Baron, D.; Allard, J.P. Lipid peroxidation and plasma antioxidant micronutrients in Crohn disease. Am. J. Clin. Nutr. 2001, 74, 259–264. [Google Scholar] [CrossRef] [PubMed]
  75. Olopade, C.O.; Christon, J.A.; Zakkar, M.; Swedler, W.I.; Rubinstein, I.; Hua, C.-w.; Scheff, P.A. Exhaled pentane and nitric oxide levels in patients with obstructive sleep apnea. Chest 1997, 111, 1500–1504. [Google Scholar] [CrossRef] [PubMed] [Green Version]
  76. Hietanen, E.; Bartsch, H.; Bereziat, J.; Camus, A.; McClinton, S.; Eremin, O.; Davidson, L.; Boyle, P. Diet and oxidative stress in breast, colon and prostate cancer patients: A case-control study. Eur. J. Clin. Nutr. 1994, 48, 575–586. [Google Scholar]
  77. Mendis, S.; Sobotka, P.A.; Leia, F.L.; Euler, D.E. Breath pentane and plasma lipid peroxides in ischemic heart disease. Free Radic. Biol. Med. 1995, 19, 679–684. [Google Scholar] [CrossRef]
  78. Fanta, C.; Fletcher, S.; Wood, R.; Bochner, B.; Hollingsworth, H. An Overview of Asthma Management; UpToDate: Wellesley, MA, USA, 2009. [Google Scholar]
  79. Rennard, S.I.; Stolel, J.; Wilson, K. Chronic Obstructive Pulmonary Disease: Definition, Clinical Manifestations, Diagnosis, and Staging; UpToDate: Waltham, MA, USA, 2009. [Google Scholar]
  80. Wang, P.; Zhang, G.; Wondimu, T.; Ross, B.; Wang, R. Hydrogen Sulfide and Asthma. Exp. Physiol. 2011, 96, 847–852. [Google Scholar] [CrossRef]
  81. Gerald, L.B.; Carr, T.F. Patient Education: How to Use a Peak Flow Meter (beyond the Basics); UpToDate: Wellesley, MA, USA, 2020. [Google Scholar]
  82. Wenzel, S. Treatment of Severe Asthma in Adolescents and Adults; Bochner, B.S.T.W., Hollingsworth, H., Eds.; (online giriş Aralık 2014.); UpToDate: Wellesley, MA, USA, 2009. [Google Scholar]
  83. Shelhamer, J.H.; Levine, S.J.; Wu, T.; Jacoby, D.B.; Kaliner, M.A.; Rennard, S.I. Airway inflammation. Ann. Intern. Med. 1995, 123, 288–304. [Google Scholar] [CrossRef] [Green Version]
  84. Dweik, R.A. Exhaled Nitric Oxide Analysis and Applications; UpToDate: Wellesley, MA, USA, 2019. [Google Scholar]
  85. Calzone, K.A. Genetic biomarkers of cancer risk. In Seminars in Oncology Nursing; Elsevier: Amsterdam, The Netherlands, 2012; p. 28. [Google Scholar]
  86. Herceg, Z.; Hainaut, P. Genetic and epigenetic alterations as biomarkers for cancer detection, diagnosis and prognosis. Mol. Oncol. 2007, 1, 26–41. [Google Scholar] [CrossRef] [PubMed] [Green Version]
  87. Li, D.; Chan, D.W. Proteomic cancer biomarkers from discovery to approval: It’s worth the effort. Expert Rev. Proteom. 2014, 11, 135–136. [Google Scholar] [CrossRef] [PubMed] [Green Version]
  88. Aizpurua-Olaizola, O.; Toraño, J.S.; Falcon-Perez, J.M.; Williams, C.; Reichardt, N.; Boons, G.-J. Mass spectrometry for glycan biomarker discovery. Trends Anal. Chem. 2018, 100, 7–14. [Google Scholar] [CrossRef]
  89. Mishra, A.; Verma, M. Cancer biomarkers: Are we ready for the prime time? Cancers 2010, 2, 190–208. [Google Scholar] [CrossRef]
  90. Hamblin, M.R. Shining light on the head: Photobiomodulation for brain disorders. BBA Clin. 2016, 6, 113–124. [Google Scholar] [CrossRef] [Green Version]
  91. O’neill, H.; Gordon, S.; O’neill, M.; Gibbons, R.; Szidon, J. A computerized classification technique for screening for the presence of breath biomarkers in lung cancer. Clin. Chem. 1988, 34, 1613–1618. [Google Scholar] [CrossRef]
  92. Phillips, M.; Gleeson, K.; Hughes, J.M.B.; Greenberg, J.; Cataneo, R.N.; Baker, L.; McVay, W.P. Volatile organic compounds in breath as markers of lung cancer: A cross-sectional study. Lancet 1999, 353, 1930–1933. [Google Scholar] [CrossRef]
  93. Machado, R.F.; Laskowski, D.; Deffenderfer, O.; Burch, T.; Zheng, S.; Mazzone, P.J.; Mekhail, T.; Jennings, C.; Stoller, J.K.; Pyle, J. Detection of lung cancer by sensor array analyses of exhaled breath. Am. J. Respir. Crit. Care Med. 2005, 171, 1286–1291. [Google Scholar] [CrossRef] [Green Version]
  94. Phillips, M.; Cataneo, R.N.; Ditkoff, B.A.; Fisher, P.; Greenberg, J.; Gunawardena, R.; Kwon, C.S.; Rahbari-Oskoui, F.; Wong, C. Volatile markers of breast cancer in the breath. Breast J. 2003, 9, 184–191. [Google Scholar] [CrossRef] [Green Version]
  95. Knight, J.A. Free radicals: Their history and current status in aging and disease. Ann. Clin. Lab. Sci. 1998, 28, 331–346. [Google Scholar] [PubMed]
  96. Kneepkens, C.F.; Lepage, G.; Roy, C.C. The potential of the hydrocarbon breath test as a measure of lipid peroxidation. Free Radic. Biol. Med. 1994, 17, 127–160. [Google Scholar] [CrossRef]
  97. Phillips, M.; Cataneo, R.N.; Greenberg, J.; Gunawardena, R.; Naidu, A.; Rahbari-Oskoui, F. Effect of age on the breath methylated alkane contour, a display of apparent new markers of oxidative stress. J. Lab. Clin. Med. 2000, 136, 243–249. [Google Scholar] [CrossRef] [PubMed] [Green Version]
  98. Kumar, S.; Huang, J.; Abbassi-Ghadi, N.; Španĕl, P.; Smith, D.; Hanna, G.B. Selected ion flow tube mass spectrometry analysis of exhaled breath for volatile organic compound profiling of esophago-gastric cancer. Anal. Chem. 2013, 85, 6121–6128. [Google Scholar] [CrossRef] [PubMed]
  99. Zhou, X.; Xue, Z.; Chen, X.; Huang, C.; Bai, W.; Lu, Z.; Wang, T. Nanomaterial-based gas sensors used for breath diagnosis. J. Mater. Chem. B 2020, 8, 3231–3248. [Google Scholar] [CrossRef] [PubMed]
  100. Bogue, R. Nanosensors: A review of recent progress. Sens. Rev. 2008, 28, 12–17. [Google Scholar] [CrossRef]
  101. Khatoon, Z.; Fouad, H.; Alothman, O.Y.; Hashem, M.; Ansari, Z.A.; Ansari, S.A. Doped SnO2 nanomaterials for e-nose based electrochemical sensing of biomarkers of lung cancer. ACS Omega 2020, 5, 27645–27654. [Google Scholar] [CrossRef]
  102. Janzen, M.C.; Ponder, J.B.; Bailey, D.P.; Ingison, C.K.; Suslick, K.S. Colorimetric sensor arrays for volatile organic compounds. Anal. Chem. 2006, 78, 3591–3600. [Google Scholar] [CrossRef]
  103. Mazzone, P.J.; Wang, X.-F.; Xu, Y.; Mekhail, T.; Beukemann, M.C.; Na, J.; Kemling, J.W.; Suslick, K.S.; Sasidhar, M. Exhaled breath analysis with a colorimetric sensor array for the identification and characterization of lung cancer. J. Thorac. Oncol. 2012, 7, 137–142. [Google Scholar] [CrossRef] [PubMed] [Green Version]
  104. Srinivasan, P.; Prakalya, D.; Jeyaprakash, B. UV-activated ZnO/CdO nn isotype heterostructure as breath sensor. J. Alloys Compd. 2020, 819, 152985. [Google Scholar] [CrossRef]
  105. Jiang, Z.; Zhao, R.; Sun, B.; Nie, G.; Ji, H.; Lei, J.; Wang, C. Highly sensitive acetone sensor based on Eu-doped SnO2 electrospun nanofibers. Ceram. Int. 2016, 42, 15881–15888. [Google Scholar] [CrossRef]
  106. Chen, Y.-J.; Xiao, G.; Wang, T.-S.; Zhang, F.; Ma, Y.; Gao, P.; Zhu, C.-L.; Zhang, E.; Xu, Z.; Li, Q.-h. Synthesis and enhanced gas sensing properties of crystalline CeO2/TiO2 core/shell nanorods. Sens. Actuators B Chem. 2011, 156, 867–874. [Google Scholar] [CrossRef]
  107. Wang, T.; Ma, S.; Cheng, L.; Luo, J.; Jiang, X.; Jin, W. Preparation of Yb-doped SnO2 hollow nanofibers with an enhanced ethanol–gas sensing performance by electrospinning. Sens. Actuators B Chem. 2015, 216, 212–220. [Google Scholar] [CrossRef]
  108. Moon, J.-S.; Kim, W.-G.; Shin, D.-M.; Lee, S.-Y.; Kim, C.; Lee, Y.; Han, J.; Kim, K.; Yoo, S.Y.; Oh, J.-W. Bioinspired M-13 bacteriophage-based photonic nose for differential cell recognition. Chem. Sci. 2017, 8, 921–927. [Google Scholar] [CrossRef] [Green Version]
  109. Oh, J.-W.; Chung, W.-J.; Heo, K.; Jin, H.-E.; Lee, B.Y.; Wang, E.; Zueger, C.; Wong, W.; Meyer, J.; Kim, C. Biomimetic virus-based colourimetric sensors. Nat. Commun. 2014, 5, 1–8. [Google Scholar] [CrossRef] [Green Version]
  110. Barsan, N.; Koziej, D.; Weimar, U. Metal oxide-based gas sensor research: How to? Sens. Actuators B Chem. 2007, 121, 18–35. [Google Scholar] [CrossRef]
  111. Wang, C.; Yin, L.; Zhang, L.; Xiang, D.; Gao, R. Metal oxide gas sensors: Sensitivity and influencing factors. Sensors 2010, 10, 2088–2106. [Google Scholar] [CrossRef] [Green Version]
  112. Rothschild, A.; Komem, Y. The effect of grain size on the sensitivity of nanocrystalline metal-oxide gas sensors. J. Appl. Phys. 2004, 95, 6374–6380. [Google Scholar] [CrossRef]
  113. Thirupathi, B.; Smirniotis, P.G. Co-doping a metal (Cr, Fe, Co, Ni, Cu, Zn, Ce, and Zr) on Mn/TiO2 catalyst and its effect on the selective reduction of NO with NH3 at low-temperatures. Appl. Catal. B 2011, 110, 195–206. [Google Scholar] [CrossRef]
  114. Liu, T.; Zhang, Y.; Yang, X.; Hao, X.; Liang, X.; Liu, F.; Liu, F.; Yan, X.; Ouyang, J.; Lu, G. CeO2-based mixed potential type acetone sensor using MFeO3 (M: Bi, La and Sm) sensing electrode. Sens. Actuators B Chem. 2018, 276, 489–498. [Google Scholar] [CrossRef]
  115. Liu, T.; Yang, X.; Ma, C.; Hao, X.; Liang, X.; Liu, F.; Liu, F.; Yang, C.; Zhu, H.; Lu, G. CeO2-based mixed potential type acetone sensor using MMnO3 (M: Sr, Ca, La and Sm) sensing electrode. Solid State Ion. 2018, 317, 53–59. [Google Scholar] [CrossRef]
  116. Choi, S.-J.; Lee, I.; Jang, B.-H.; Youn, D.-Y.; Ryu, W.-H.; Park, C.O.; Kim, I.-D. Selective diagnosis of diabetes using Pt-functionalized WO3 hemitube networks as a sensing layer of acetone in exhaled breath. Anal. Chem. 2013, 85, 1792–1796. [Google Scholar] [CrossRef]
  117. Srinivasan, P.; Kulandaisamy, A.J.; Mani, G.K.; Babu, K.J.; Tsuchiya, K.; Rayappan, J.B.B. Development of an acetone sensor using nanostructured Co3O4 thin films for exhaled breath analysis. RSC Adv. 2019, 9, 30226–30239. [Google Scholar] [CrossRef] [Green Version]
  118. Ren, F.-J.; Yu, X.-b.; Ling, Y.-h.; Feng, J.-y. Micro-arc oxidization fabrication and ethanol sensing performance of Fe-doped TiO2 thin films. Int. J. Miner. Metall. Mater. 2012, 19, 461–466. [Google Scholar] [CrossRef]
  119. Li, S.; Liu, Y.; Wu, Y.; Chen, W.; Qin, Z.; Gong, N.; Yu, D. Highly sensitive formaldehyde resistive sensor based on a single Er-doped SnO2 nanobelt. Phys. B Condens. Matter 2016, 489, 33–38. [Google Scholar] [CrossRef]
  120. Wang, Y.; Zhang, H.; Sun, X. Electrospun nanowebs of NiO/SnO2 pn heterojunctions for enhanced gas sensing. Appl. Surf. Sci. 2016, 389, 514–520. [Google Scholar] [CrossRef]
  121. Li, G.; Zhang, X.; Lu, H.; Yan, C.; Chen, K.; Lu, H.; Gao, J.; Yang, Z.; Zhu, G.; Wang, C. Ethanol sensing properties and reduced sensor resistance using porous Nb2O5-TiO2 nn junction nanofibers. Sens. Actuators B Chem. 2019, 283, 602–612. [Google Scholar] [CrossRef]
  122. Rudnicka, J.; Walczak, M.; Kowalkowski, T.; Jezierski, T.; Buszewski, B. Determination of volatile organic compounds as potential markers of lung cancer by gas chromatography–mass spectrometry versus trained dogs. Sens. Actuators B Chem. 2014, 202, 615–621. [Google Scholar] [CrossRef]
  123. Zhang, C.; Suslick, K.S. Colorimetric sensor array for soft drink analysis. J. Agric. Food Chem. 2007, 55, 237–242. [Google Scholar] [CrossRef] [PubMed]
  124. Lim, S.H.; Feng, L.; Kemling, J.W.; Musto, C.J.; Suslick, K.S. An optoelectronic nose for the detection of toxic gases. Nat. Chem. 2009, 1, 562–567. [Google Scholar] [CrossRef] [PubMed] [Green Version]
  125. Musto, C.J.; Lim, S.H.; Suslick, K.S. Colorimetric detection and identification of natural and artificial sweeteners. Anal. Chem. 2009, 81, 6526–6533. [Google Scholar] [CrossRef] [Green Version]
  126. Suslick, B.A.; Feng, L.; Suslick, K.S. Discrimination of complex mixtures by a colorimetric sensor array: Coffee aromas. Anal. Chem. 2010, 82, 2067–2073. [Google Scholar] [CrossRef] [Green Version]
  127. Feng, L.; Musto, C.J.; Kemling, J.W.; Lim, S.H.; Suslick, K.S. A colorimetric sensor array for identification of toxic gases below permissible exposure limits. Chem. Commun. 2010, 46, 2037–2039. [Google Scholar] [CrossRef]
  128. Lin, H.; Jang, M.; Suslick, K.S. Preoxidation for colorimetric sensor array detection of VOCs. J. Am. Chem. Soc. 2011, 133, 16786–16789. [Google Scholar] [CrossRef] [Green Version]
  129. Rakow, N.A.; Suslick, K.S. A colorimetric sensor array for odour visualization. Nature 2000, 406, 710–713. [Google Scholar] [CrossRef]
  130. Suslick, K.S.; Rakow, N.A.; Sen, A. Colorimetric sensor arrays for molecular recognition. Tetrahedron 2004, 60, 11133–11138. [Google Scholar] [CrossRef]
  131. Carey, J.R.; Suslick, K.S.; Hulkower, K.I.; Imlay, J.A.; Imlay, K.R.; Ingison, C.K.; Ponder, J.B.; Sen, A.; Wittrig, A.E. Rapid identification of bacteria with a disposable colorimetric sensing array. J. Am. Chem. Soc. 2011, 133, 7571–7576. [Google Scholar] [CrossRef] [Green Version]
  132. Zhang, Y.; Askim, J.R.; Zhong, W.; Orlean, P.; Suslick, K.S. Identification of pathogenic fungi with an optoelectronic nose. Analyst 2014, 139, 1922–1928. [Google Scholar] [CrossRef] [Green Version]
  133. Kim, S.-J.; Choi, S.-J.; Jang, J.-S.; Cho, H.-J.; Kim, I.-D. Innovative nanosensor for disease diagnosis. Acc. Chem. Res. 2017, 50, 1587–1596. [Google Scholar] [CrossRef]
  134. Koo, W.-T.; Jang, J.-S.; Kim, I.-D. Metal-organic frameworks for chemiresistive sensors. Chem 2019, 5, 1938–1963. [Google Scholar] [CrossRef]
  135. Choi, S.-J.; Jang, B.-H.; Lee, S.-J.; Min, B.K.; Rothschild, A.; Kim, I.-D. Selective detection of acetone and hydrogen sulfide for the diagnosis of diabetes and halitosis using SnO2 nanofibers functionalized with reduced graphene oxide nanosheets. ACS Appl. Mater. Interfaces 2014, 6, 2588–2597. [Google Scholar] [CrossRef]
  136. Choi, S.-H.; Ankonina, G.; Youn, D.-Y.; Oh, S.-G.; Hong, J.-M.; Rothschild, A.; Kim, I.-D. Hollow ZnO nanofibers fabricated using electrospun polymer templates and their electronic transport properties. ACS Nano 2009, 3, 2623–2631. [Google Scholar] [CrossRef]
  137. Smith, G.P.; Petrenko, V.A. Phage display. Chem. Rev. 1997, 97, 391–410. [Google Scholar] [CrossRef]
  138. Kim, C.; Lee, H.; Devaraj, V.; Kim, W.-G.; Lee, Y.; Kim, Y.; Jeong, N.-N.; Choi, E.J.; Baek, S.H.; Han, D.-W. Hierarchical cluster analysis of medical chemicals detected by a bacteriophage-based colorimetric sensor array. Nanomaterials 2020, 10, 121. [Google Scholar] [CrossRef] [PubMed] [Green Version]
  139. Winter, G.; Griffiths, A.D.; Hawkins, R.E.; Hoogenboom, H.R. Making antibodies by phage display technology. Annu. Rev. Immunol. 1994, 12, 433–455. [Google Scholar] [CrossRef]
  140. Chung, W.-J.; Oh, J.-W.; Kwak, K.; Lee, B.Y.; Meyer, J.; Wang, E.; Hexemer, A.; Lee, S.-W. Biomimetic self-templating supramolecular structures. Nature 2011, 478, 364–368. [Google Scholar] [CrossRef] [PubMed]
  141. Seol, D.; Moon, J.-S.; Lee, Y.; Han, J.; Jang, D.; Kang, D.-J.; Moon, J.; Jang, E.; Oh, J.-W.; Chung, H. Feasibility of using a bacteriophage-based structural color sensor for screening the geographical origins of agricultural products. Spectrochim. Acta A Mol. Biomol. Spectrosc. 2018, 197, 159–165. [Google Scholar] [CrossRef] [PubMed]
  142. Moon, J.S.; Lee, Y.; Shin, D.M.; Kim, C.; Kim, W.G.; Park, M.; Han, J.; Song, H.; Kim, K.; Oh, J.W. Identification of Endocrine Disrupting Chemicals using a Virus-Based Colorimetric Sensor. Chem. Asian J. 2016, 11, 3097–3101. [Google Scholar] [CrossRef] [PubMed]
  143. Lee, J.-M.; Lee, Y.; Devaraj, V.; Nguyen, T.M.; Kim, Y.-J.; Kim, Y.H.; Kim, C.; Choi, E.J.; Han, D.-W.; Oh, J.-W. Investigation of bioelectronic nose based on programable surface chemistry of M13 bacteriophages for volatile organic compound detection: From basic properties of the biosensor to practical application. Biosens. Bioelectron. 2021, 188, 113339. [Google Scholar] [CrossRef] [PubMed]
  144. Peng, G.; Tisch, U.; Adams, O.; Hakim, M.; Shehada, N.; Broza, Y.Y.; Billan, S.; Abdah-Bortnyak, R.; Kuten, A.; Haick, H. Diagnosing lung cancer in exhaled breath using gold nanoparticles. Nat. Nanotechnol. 2009, 4, 669–673. [Google Scholar] [CrossRef]
  145. Thriumani, R.; Zakaria, A.; Hashim, Y.Z.H.-Y.; Jeffree, A.I.; Helmy, K.M.; Kamarudin, L.M.; Omar, M.I.; Shakaff, A.Y.M.; Adom, A.H.; Persaud, K.C. A study on volatile organic compounds emitted by in-vitro lung cancer cultured cells using gas sensor array and SPME-GCMS. BMC Cancer 2018, 18, 362. [Google Scholar] [CrossRef]
  146. Tirzīte, M.; Bukovskis, M.; Strazda, G.; Jurka, N.; Taivans, I. Detection of lung cancer in exhaled breath with an electronic nose using support vector machine analysis. J. Breath Res. 2017, 11, 036009. [Google Scholar] [CrossRef] [PubMed]
  147. Rocco, G. Every breath you take: The value of the electronic nose (e-nose) technology in the early detection of lung cancer. J. Thorac. Cardiovasc. Surg. 2018, 155, 2622–2625. [Google Scholar] [CrossRef] [PubMed] [Green Version]
  148. Peng, G.; Hakim, M.; Broza, Y.; Billan, S.; Abdah-Bortnyak, R.; Kuten, A.; Tisch, U.; Haick, H. Detection of lung, breast, colorectal, and prostate cancers from exhaled breath using a single array of nanosensors. Br. J. Cancer 2010, 103, 542–551. [Google Scholar] [CrossRef] [PubMed]
  149. Peled, N.; Hakim, M.; Bunn Jr, P.A.; Miller, Y.E.; Kennedy, T.C.; Mattei, J.; Mitchell, J.D.; Hirsch, F.R.; Haick, H. Non-invasive breath analysis of pulmonary nodules. J. Thorac. Oncol. 2012, 7, 1528–1533. [Google Scholar] [CrossRef] [Green Version]
  150. Pavlou, A.K.; Magan, N.; Jones, J.M.; Brown, J.; Klatser, P.; Turner, A.P. Detection of Mycobacterium tuberculosis (TB) in vitro and in situ using an electronic nose in combination with a neural network system. Biosens. Bioelectron. 2004, 20, 538–544. [Google Scholar] [CrossRef]
  151. Pavlou, A.K.; Magan, N.; McNulty, C.; Jones, J.M.; Sharp, D.; Brown, J.; Turner, A.P. Use of an electronic nose system for diagnoses of urinary tract infections. Biosens. Bioelectron. 2002, 17, 893–899. [Google Scholar] [CrossRef]
  152. Kateb, B.; Ryan, M.; Homer, M.; Lara, L.; Yin, Y.; Higa, K.; Chen, M.Y. Sniffing out cancer using the JPL electronic nose: A pilot study of a novel approach to detection and differentiation of brain cancer. NeuroImage 2009, 47, T5–T9. [Google Scholar] [CrossRef] [PubMed]
  153. Shehada, N.; Cancilla, J.C.; Torrecilla, J.S.; Pariente, E.S.; Brönstrup, G.; Christiansen, S.; Johnson, D.W.; Leja, M.; Davies, M.P.; Liran, O. Silicon nanowire sensors enable diagnosis of patients via exhaled breath. ACS Nano 2016, 10, 7047–7057. [Google Scholar] [CrossRef] [Green Version]
  154. Voss, A.; Baier, V.; Reisch, R.; von Roda, K.; Elsner, P.; Ahlers, H.; Stein, G. Smelling renal dysfunction via electronic nose. Ann. Biomed. Eng. 2005, 33, 656–660. [Google Scholar] [CrossRef]
  155. Schuermans, V.N.; Li, Z.; Jongen, A.C.; Wu, Z.; Shi, J.; Ji, J.; Bouvy, N.D. Pilot study: Detection of gastric cancer from exhaled air analyzed with an electronic nose in Chinese patients. Surg. Innov. 2018, 25, 429–434. [Google Scholar] [CrossRef]
  156. Xu, Z.; Broza, Y.; Ionsecu, R.; Tisch, U.; Ding, L.; Liu, H.; Song, Q.; Pan, Y.; Xiong, F.; Gu, K. A nanomaterial-based breath test for distinguishing gastric cancer from benign gastric conditions. Br. J. Cancer 2013, 108, 941–950. [Google Scholar] [CrossRef] [PubMed] [Green Version]
  157. Hanson, C.W.; Thaler, E.R. Electronic nose prediction of a clinical pneumonia score: Biosensors and microbes. J. Am. Soc. Anesthesiol. 2005, 102, 63–68. [Google Scholar] [CrossRef] [PubMed]
  158. Shykhon, M.; Morgan, D.; Dutta, R.; Hines, E.; Gardner, J. Clinical evaluation of the electronic nose in the diagnosis of ear, nose and throat infection: A preliminary study. J. Laryngol. Otol. 2004, 118, 706–709. [Google Scholar] [CrossRef] [PubMed]
  159. Nakhleh, M.; Badarny, S.; Winer, R.; Jeries, R.; Finberg, J.; Haick, H. Distinguishing idiopathic Parkinson’s disease from other parkinsonian syndromes by breath test. Parkinsonism Relat. Disord. 2015, 21, 150–153. [Google Scholar] [CrossRef] [PubMed]
  160. Hakim, M.; Billan, S.; Tisch, U.; Peng, G.; Dvrokind, I.; Marom, O.; Abdah-Bortnyak, R.; Kuten, A.; Haick, H. Diagnosis of head-and-neck cancer from exhaled breath. Br. J. Cancer 2011, 104, 1649–1655. [Google Scholar] [CrossRef] [Green Version]
  161. Wongchoosuk, C.; Lutz, M.; Kerdcharoen, T. Detection and classification of human body odor using an electronic nose. Sensors 2009, 9, 7234–7249. [Google Scholar] [CrossRef] [PubMed] [Green Version]
  162. Amal, H.; Leja, M.; Funka, K.; Lasina, I.; Skapars, R.; Sivins, A.; Ancans, G.; Kikuste, I.; Vanags, A.; Tolmanis, I. Breath testing as potential colorectal cancer screening tool. Int. J. Cancer 2016, 138, 229–236. [Google Scholar] [CrossRef] [PubMed]
  163. Amal, H.; Shi, D.Y.; Ionescu, R.; Zhang, W.; Hua, Q.L.; Pan, Y.Y.; Tao, L.; Liu, H.; Haick, H. Assessment of ovarian cancer conditions from exhaled breath. Int. J. Cancer 2015, 136, E614–E622. [Google Scholar] [CrossRef]
  164. Nakhleh, M.K.; Amal, H.; Jeries, R.; Broza, Y.Y.; Aboud, M.; Gharra, A.; Ivgi, H.; Khatib, S.; Badarneh, S.; Har-Shai, L. Diagnosis and classification of 17 diseases from 1404 subjects via pattern analysis of exhaled molecules. ACS Nano 2017, 11, 112–125. [Google Scholar] [CrossRef] [Green Version]
  165. Jombart, T.; Devillard, S.; Balloux, F. Discriminant analysis of principal components: A new method for the analysis of genetically structured populations. BMC Genet. 2010, 11, 94. [Google Scholar] [CrossRef] [Green Version]
  166. Lee, D.; Ahn, C.; Kim, B.; Pyo, H.; Kim, J.; Huh, C.; Kim, S. Intelligent Olfactory Sensor. Electron. Telecommun. Trends 2019, 34, 76–88. [Google Scholar]
  167. Turner, A.P.; Magan, N. Electronic noses and disease diagnostics. Nat. Rev. Microbiol. 2004, 2, 161–166. [Google Scholar] [CrossRef]
  168. Srivastava, N.; Hinton, G.; Krizhevsky, A.; Sutskever, I.; Salakhutdinov, R. Dropout: A simple way to prevent neural networks from overfitting. J. Mach. Learn. Res. 2014, 15, 1929–1958. [Google Scholar]
  169. Chung, H.; Lee, S.J.; Park, J.G. Deep neural network using trainable activation functions. In Proceedings of the 2016 International Joint Conference on Neural Networks (IJCNN), Vancouver, BC, Canada, 24–29 July 2016. [Google Scholar]
  170. Gutiérrez, J.; Horrillo, M.C. Advances in artificial olfaction: Sensors and applications. Talanta 2014, 124, 95–105. [Google Scholar] [CrossRef] [PubMed]
  171. Lee, D.-S.; Jung, J.-K.; Lim, J.-W.; Huh, J.-S.; Lee, D.-D. Recognition of volatile organic compounds using SnO2 sensor array and pattern recognition analysis. Sens. Actuators B Chem. 2001, 77, 228–236. [Google Scholar] [CrossRef]
  172. Lee, Y.-S.; Moon, P.-J. A comparison and Analysis of deep learning framework. J. Korea Inst. Electron. Commun. Sci. 2017, 12, 115–122. [Google Scholar]
  173. Peng, P.; Zhao, X.; Pan, X.; Ye, W. Gas classification using deep convolutional neural networks. Sensors 2018, 18, 157. [Google Scholar] [CrossRef] [PubMed] [Green Version]
Figure 1. Concept of an artificial nose (e-nose) system based on the olfactory perception pathway.
Biosensors 11 00337 g001
Figure 2. Metal–oxide nanomaterial-based electrochemical sensors. (a) Doped SnO2 nanomaterial sensor for lung cancer diagnosis. Data reproduced from Ref. [101]. Copyrights ACS 2020. (b) Diabetes diagnosis model using polycrystalline WO3 hemi-tube for H2S, selective acetone detecting sensors. Data reproduced from Ref. [116]. Copyrights ACS 2013.
Biosensors 11 00337 g002
Figure 3. Metal-containing dye sensor array-type e-nose. (a) Suslick used strong chemical reactions such as “Lewis acid/base dyes (i.e., metal ion-containing dyes),” “Brønsted acidic or basic dyes (i.e., pH indicators),” and “dyes with large permanent dipoles (i.e., zwitterionic solvatochromic dyes).” Various types of sensor arrays were fabricated using the base dye (b) Electronic nose model that classifies various types of VOCs using the manufactured sensor array. (c) Exhalation analysis of lung cancer patients using the e-nose technology. The images (a,b) were adapted with permission from [130]. The image (c) was adapted with permission from [103].
Biosensors 11 00337 g003
Figure 4. Colorimetric sensor system using an M13 bacteriophage as a functional biomaterial [109]. Peptide-based bioreceptor materials can secure various peptide sequences with desired functional groups using the phage display technology. Filamentous bacteriophage material with a scale less than 1 μm has approximately 2700 pairs of functional proteins on its surface. Hence, it can be used as a highly sensitive bioreceptor material. The synthesis process is based on internal DNA genetic information, and high-purity mass production is possible with simple genetic modifications. Phage units produced by bacteria have the same structure of a certain size and, thus have liquid crystal properties. A self-assembled structure can be produced using a bacteriophage as a unit, and it has liquid crystal properties; therefore, a color matrix can be produced by creating light scattering at regular distances formed by the structure. Based on the principle that phage self-assembled structures change the surface structure in response to external stimuli, a highly sensitive colorimetric sensor can be manufactured. This technique is referred to as the phage litmus.
Biosensors 11 00337 g004
Figure 5. Bioinspired from neuronal pathway: Artificial intelligence algorithms. Deep learning technology based on the neuronal signal process. A structure that draws correct conclusions via iterative learning through activation functions called Sigmoid, Tanh, and ReLU. By applying ReLU to the inner hidden layer and by applying the sigmoid function in the last output layer, the accuracy is significantly increased.
Biosensors 11 00337 g005
Table 1. Conventional measurements with the candidate group for biomarker volatile organic compounds (VOCs) in exhaled breath gas by a diagnosable disease. A simple and efficient e-nose platform that can distinguish VOCs in exhaled gas can be used as a selective self-diagnostic technology.
DiseaseConventional MeasurementBiomarker VOCsRef.
DiabetesGlucose level
Clinical biomarkers
Acetone[24]
Bacterial infectionComputed tomography (CT)
Gram stain
Microorganism culture
Morphological analysis
High isoprene
Ammonia
Hydrogen cyanide
Nitric oxide
Ethane
Pentane
[18,25,26,27,28]
AsthmaSpirometry
Peak expiratory flow
Lung function testing
Bronchoprovocation test
Acetone
Nitric oxide
Isoprene
Ammonia
[29,30]
COPDSpirometry
X-Ray, CT
Peak expiratory flow
Lung function testing
Acetone
Ethane
[31,32]
Cardiovascular disease (CVD)HDL & LDL cholesterol
High blood pressure
Clinical biomarkers
Obesity
Acetone
Pentane
Isoprene
[33,34]
CancerClinical biomarkers
Biopsy
CT, X-ray, MRI
Acetone
Formaldehyde
Ethane
Pentane
Isoprene
Ethanol
[35,36,37,38]
Table 2. Gas sensor technology applicable to future disease diagnosis.
Measurement TargetSensor TypeSensing MaterialsRef.
Lung cancerElectrochemical sensorUndoped SnO2, Co-SnO2, and Ni-SnO2 nanoparticles with cyclic voltammetry and electrochemical impedance spectroscopy/screen-printed electrode[101]
Colorimetric sensorColorimetric sensor array containing Lewis acid/base dyes (metal–organic complex dye)[102,103]
DiabetesElectrochemical sensorCo3O4 thin film with a cubic spinel phase with AC impedance analyses/gold interdigitated electrode pattern[104]
Pristine SnO2 nanofiber (undoped) and Eu-doped SnO2 nanofibers (1, 2, and 3 mol% of Eu3+) with gold electrodes and Pt wires[105]
Ethanol in a VOC mixtureElectrochemical sensorCeO2–TiO2 core shell nanorods with
Pt electrodes
[106]
Pristine SnO2 and Yb-doped SnO2 hollow nanofiber (0.5, 1.0, and 1.5 wt% Yb) with an Au electrode and a Pt wire[107]
Cancer cell cultureColorimetric sensorFunctional M13 bacteriophage-based colorimetric sensor array[108,109]
Table 3. Classification of disease groups through a data analysis algorithm using a sensor array.
DiseaseSensorData ProcessRef.
Lung cancerGold nanoparticle-based electrochemical sensorPCA[144]
Lung cancer
cell culture
Cyranose® 320LDA, PNN, KNN[145]
Lung cancerCyranose® 320SVM[93,146]
Lung cancer and COPDQCM sensor arrayPLS-DA[147]
Lung, breast, colorectal, and prostate cancersElectrochemical sensor single arrayPCA[148]
Pulmonary diseaseGC-MS/Chemo-nanoarrayDFA[149]
TuberculosisBH114-BloodhoundANN[150]
Urinary tract infectionsBH114-BloodhoundANN, PCA[151]
Brain cancer organoidsPolymer-carbon black based electro-chemical sensor arrayNormalized pattern[152]
Lung and gastric cancer, asthma and COPDFET sensorANN, DFA[153]
Renal dysfunctionElectrochemical sensor arrayPCA[154]
Gastric cancerAeonoseANN[155]
Gastric cancerMetal–organic ligand-based nanosensor arrayDFA[156]
PneumoniaCyranose® 320PLS-DA[157]
Ear, nose, and throat infectionCyranose® 320PCA[158]
Parkinson’s diseaseNanosensor arrayKNN[159]
Head and neck cancerGC-MSPCA, SVM[160]
Human armpit body odor classificationTagushi gas sensorsPCA[161]
Colorectal cancerGC-MSDFA[162]
Ovarian cancerGC-MSDFA[163]
Seventeen types of diseasesGold nanoparticle-based nanosensor arrayANN, hierarchal clustering analysis[164]
PCA; Principal component analysis; LDA; Linear discriminant analysis; PNN; Probabilistic neural network; ANN; Artificial neural network; KNN; k-Neural network; SVM; Support vector machine; DFA; Deterministic finite automaton; QCM; Quartz microbalance; PLS-DA; Partial least squares discriminant analysis; Cyranose® 320; a commercialized e-nose device, Cyrano Science, Pasadena, CA, USA; BH114-Bloodhound; a commercialized gas sensor array, Leeds, UK; Aenose; a commercialized e-nose device, The eNose Company, Zutphen, The Netherlands; FET; Field effect transistor.
Publisher’s Note: MDPI stays neutral with regard to jurisdictional claims in published maps and institutional affiliations.

