The Effect of Transcutaneous Auricular Vagal Nerve Stimulation (taVNS) on P3 Event-Related Potentials during a Bayesian Oddball Task


Abstract
:
1. Introduction
2. Experimental Section
2.1. Sample
2.2. Materials and Procedures
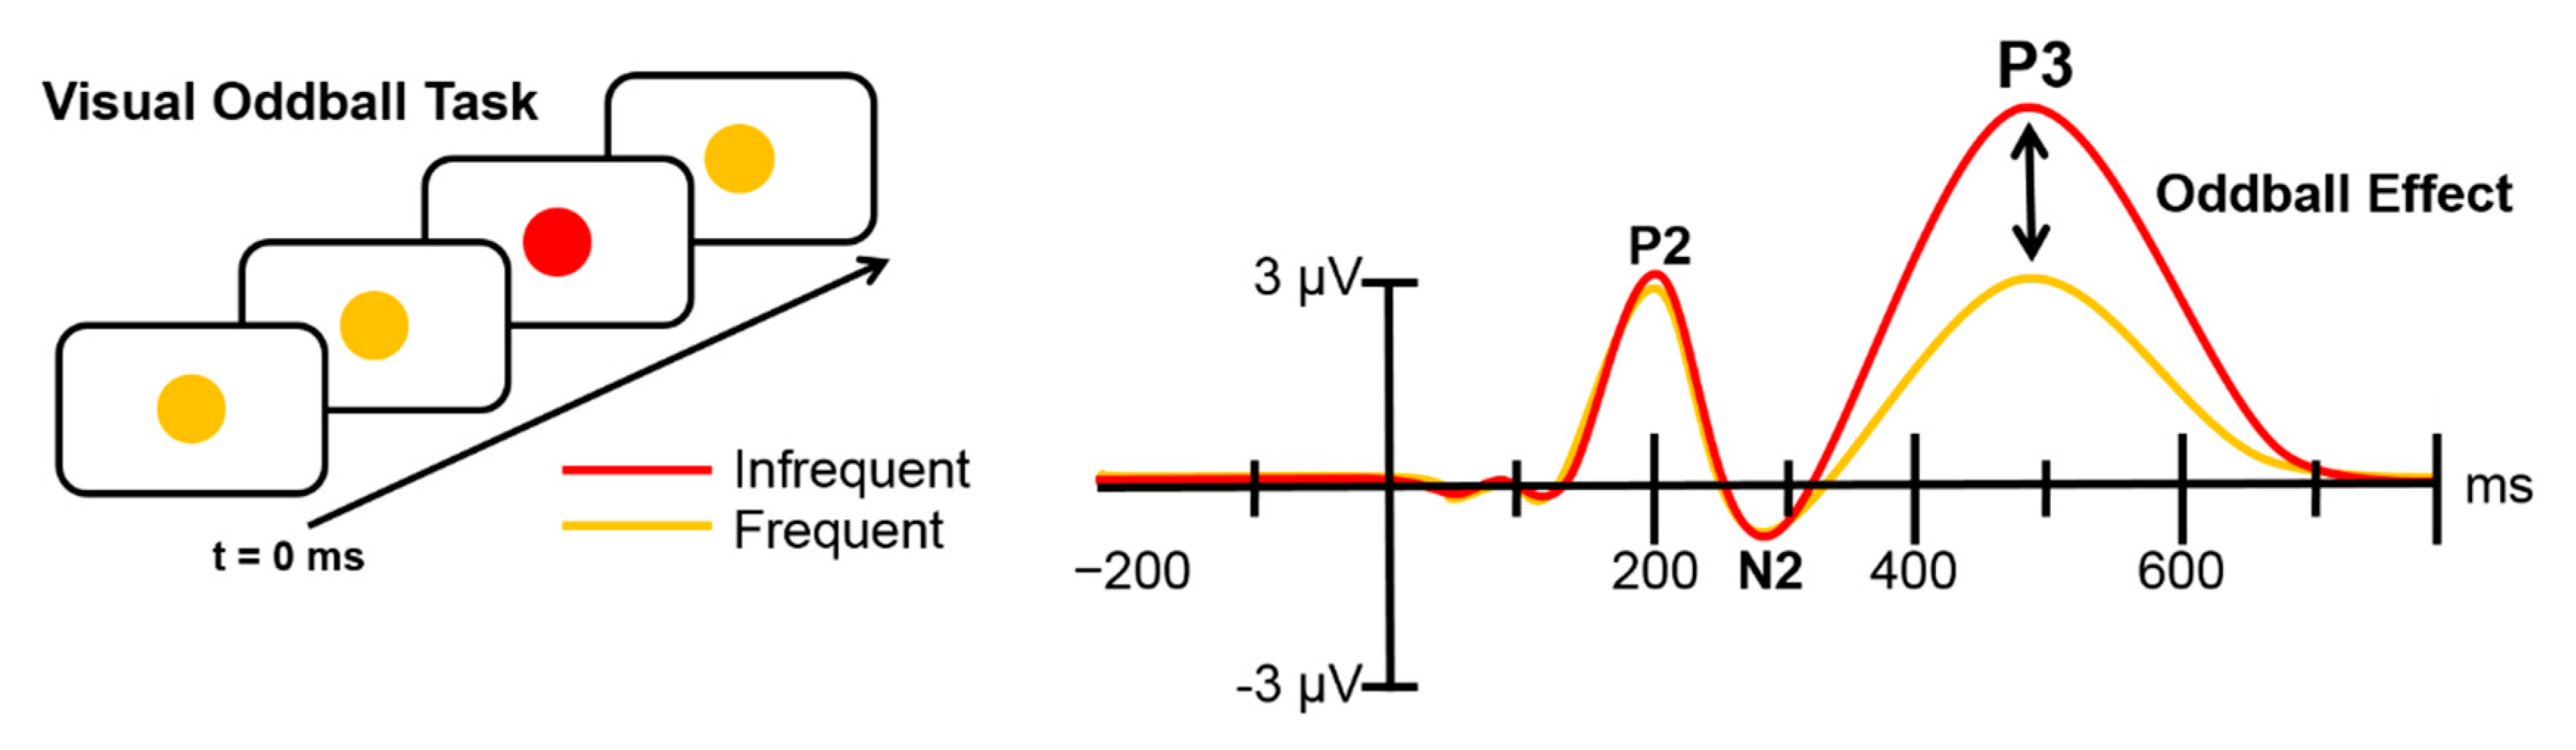
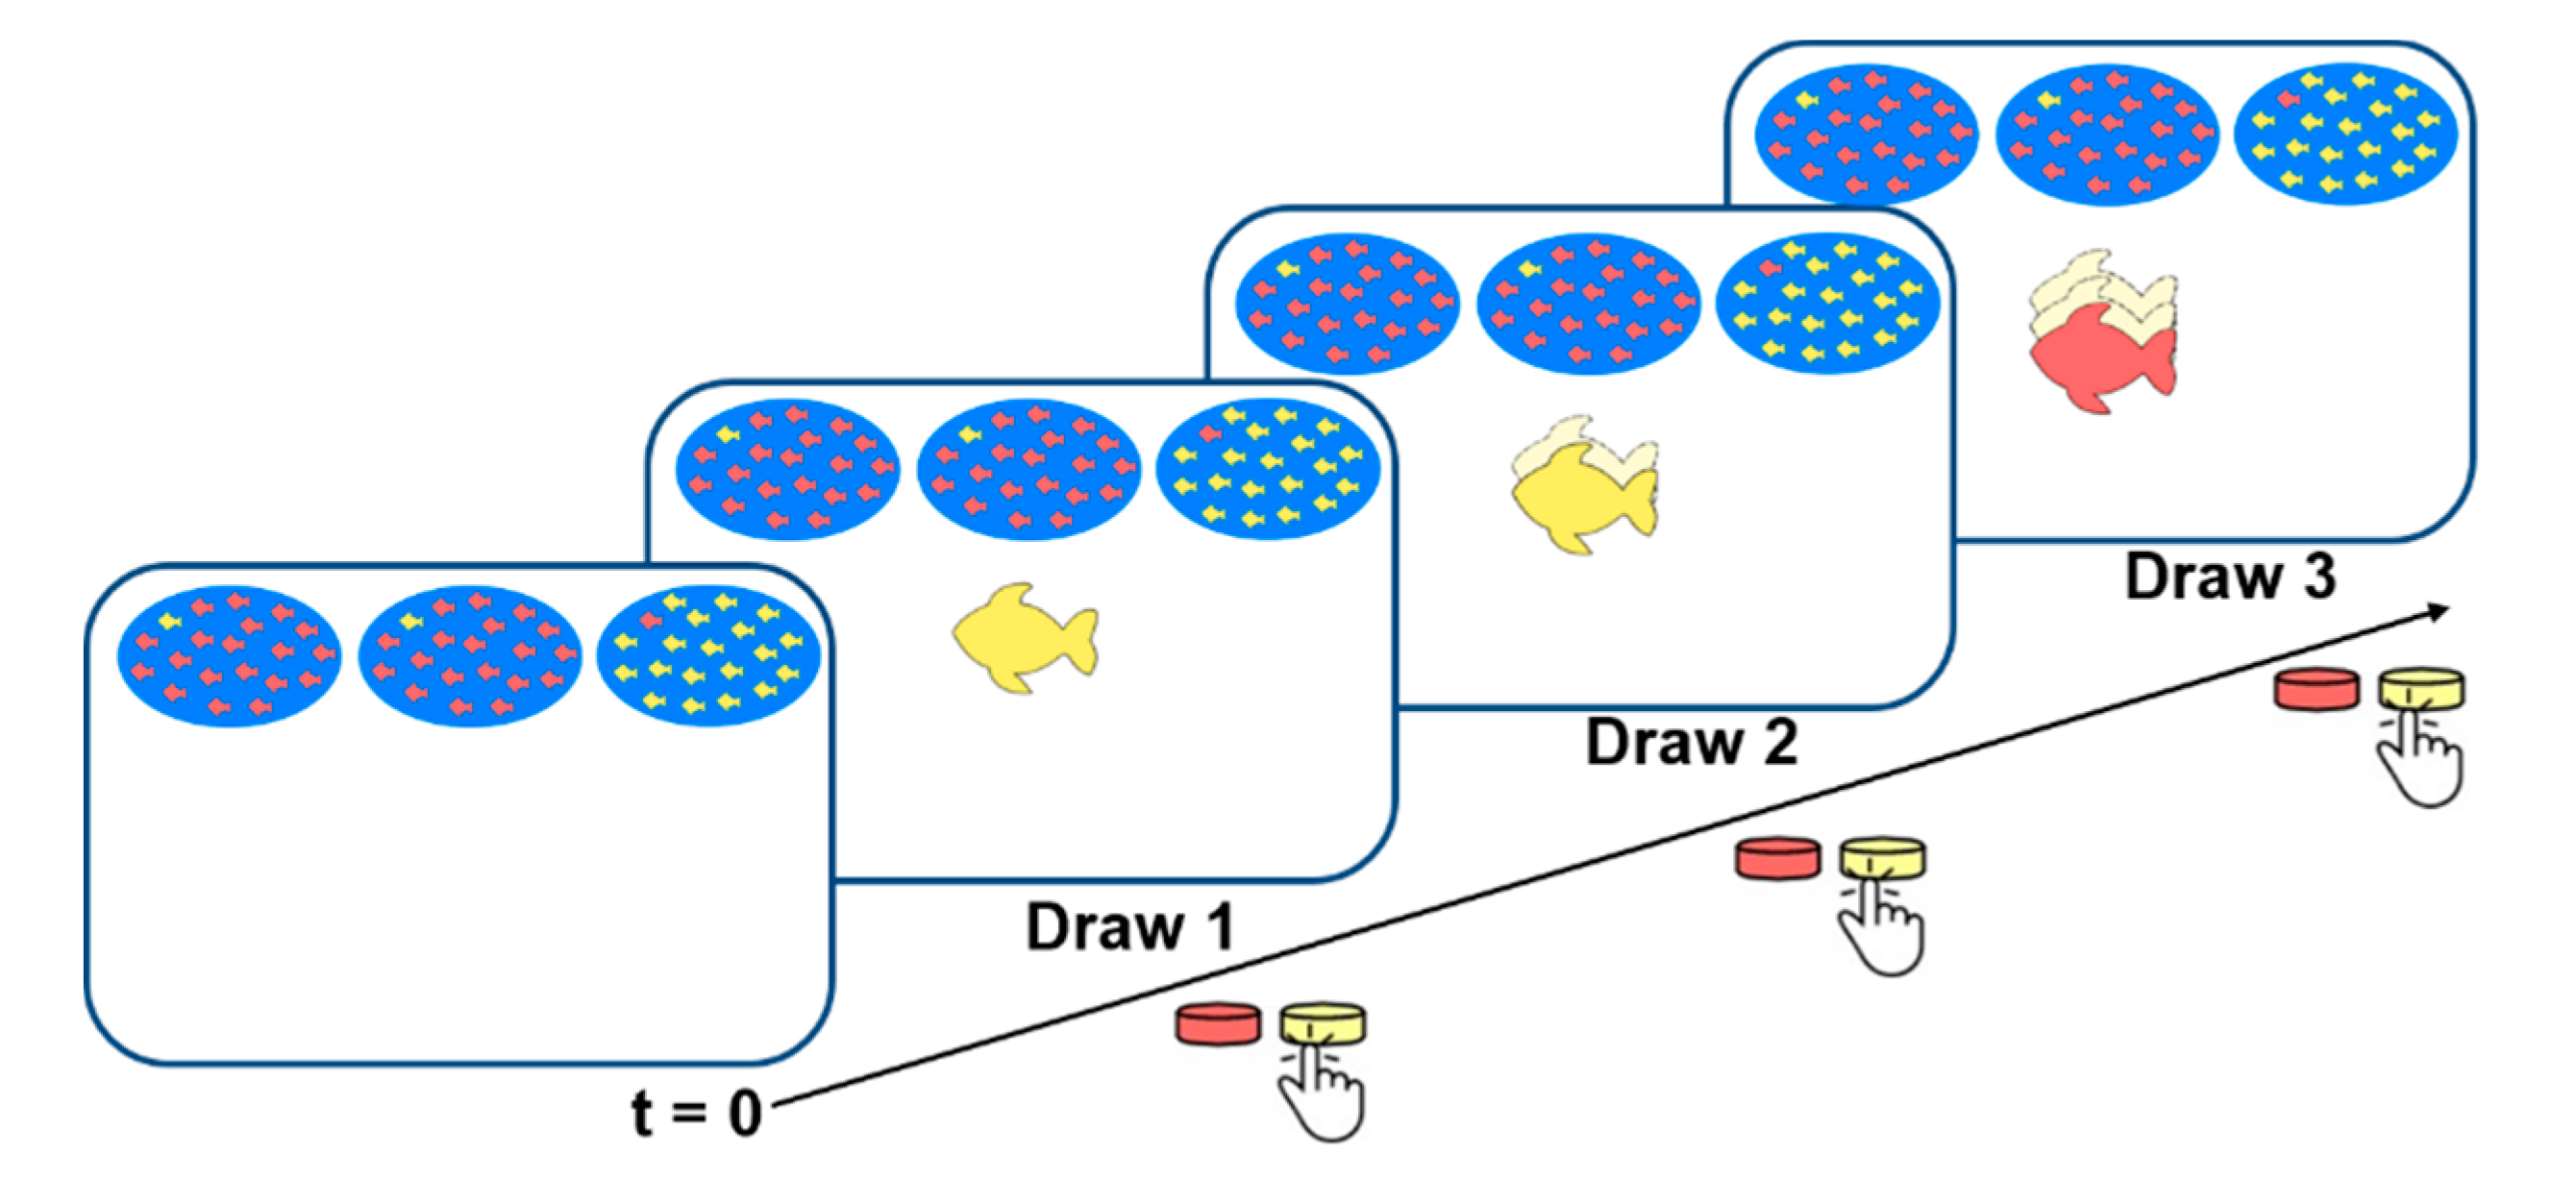
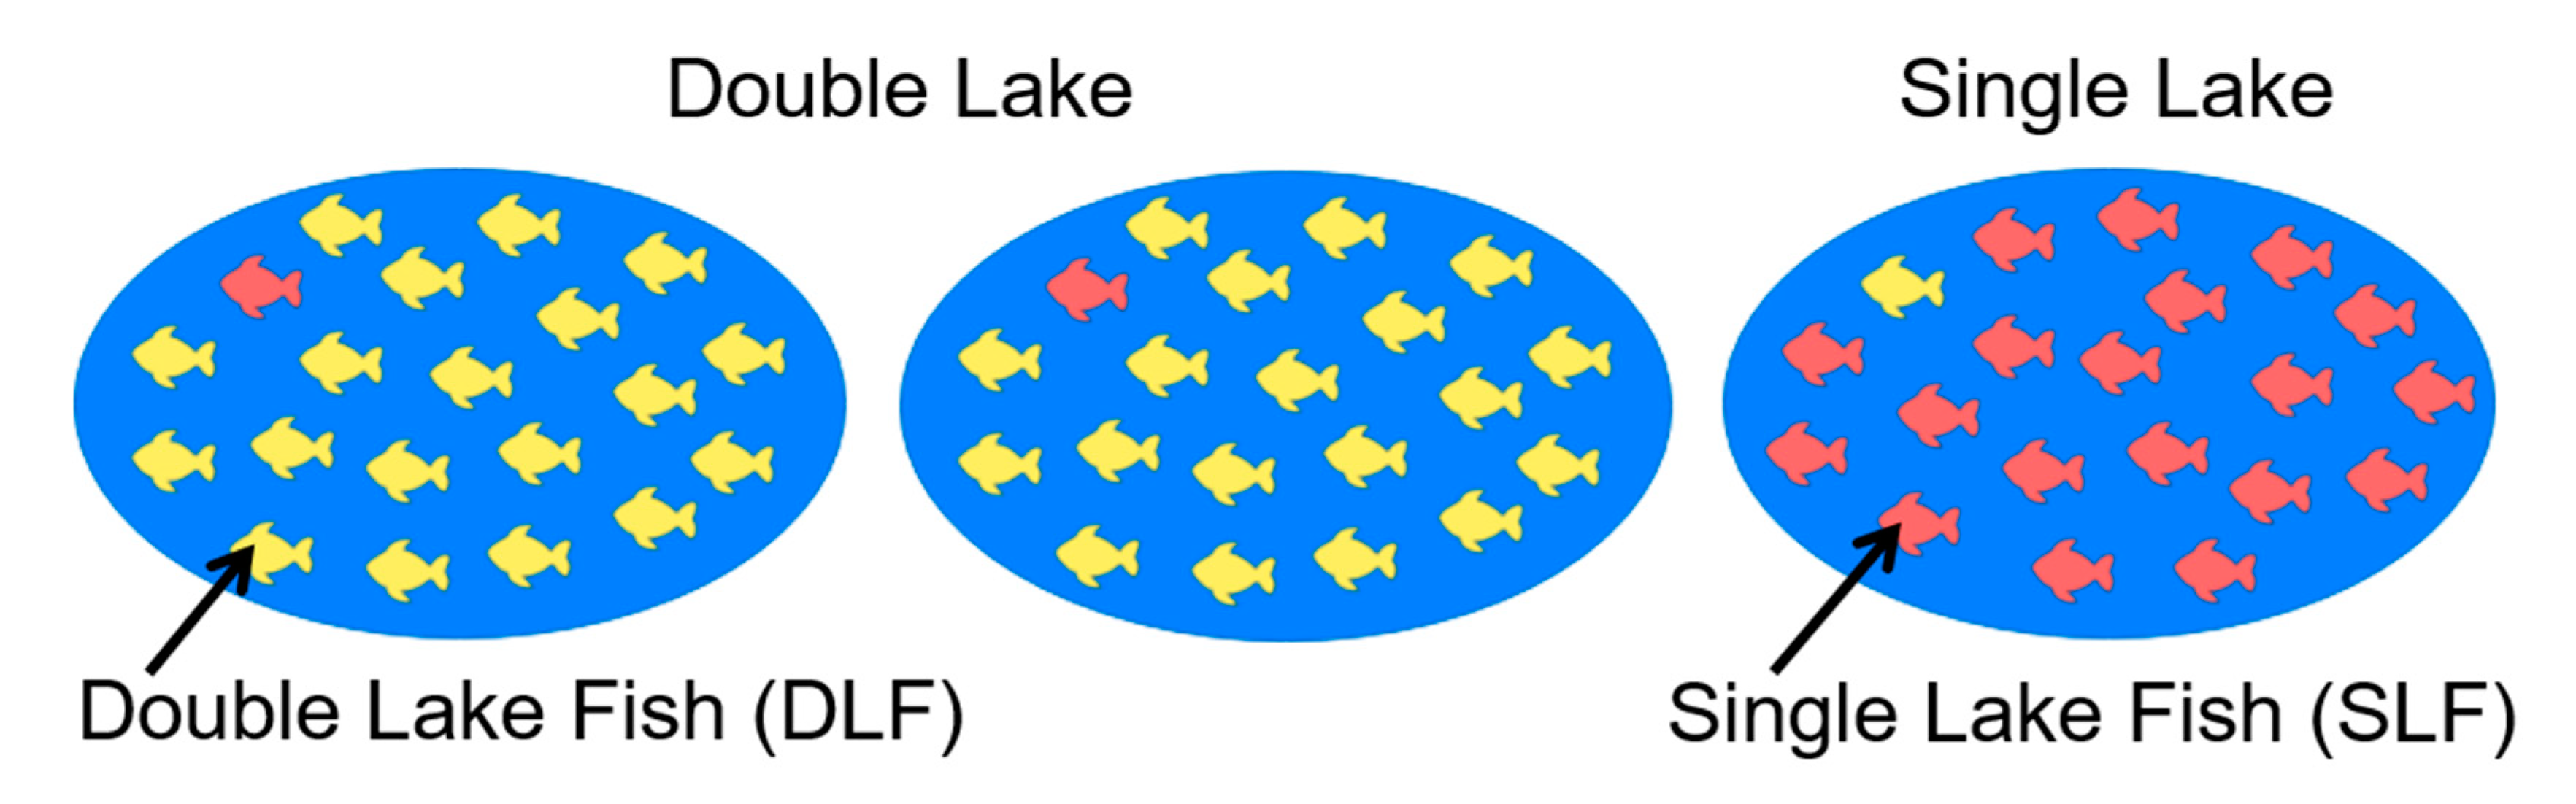
2.3. The Bayesian Oddball Paradigm
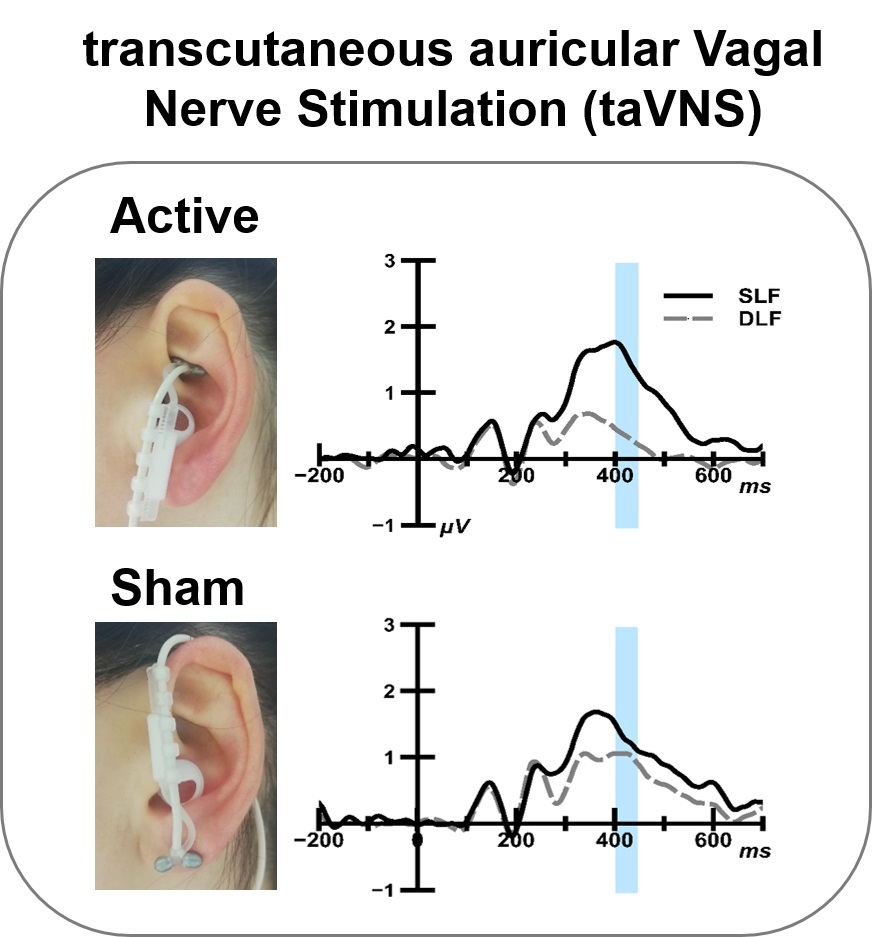
2.4. taVNS Stimulation
2.5. Electrophysiological Data Recording
2.6. Statistical Analysis
3. Results
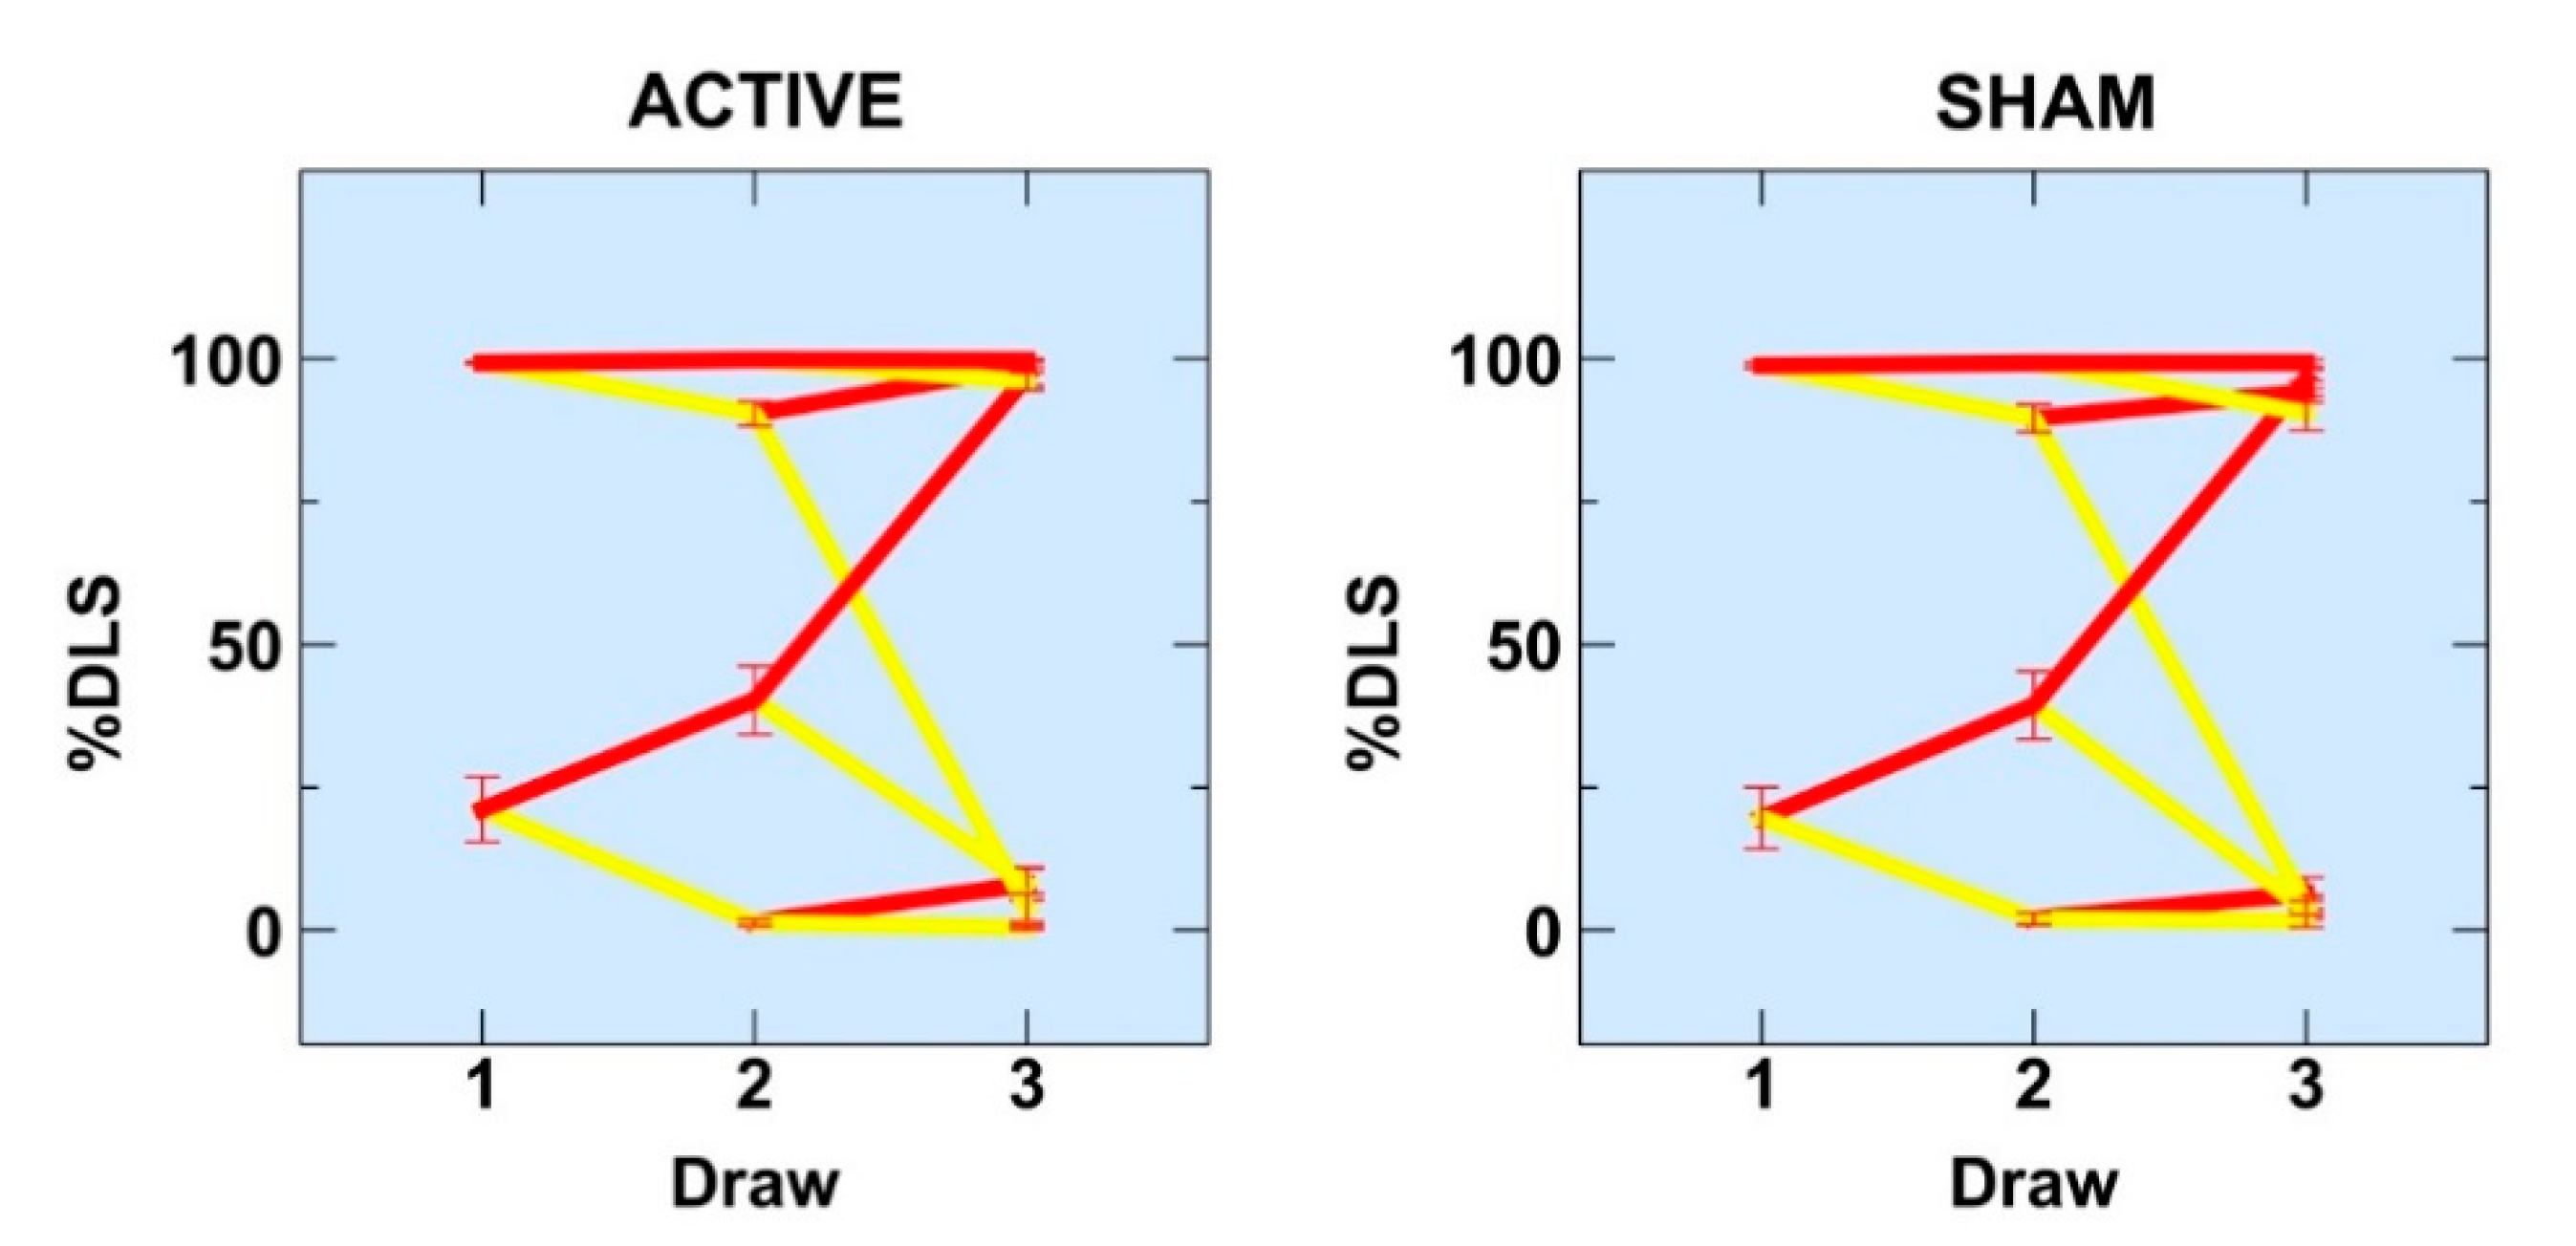
3.1. Behavioural Data
3.1.1. %DLS
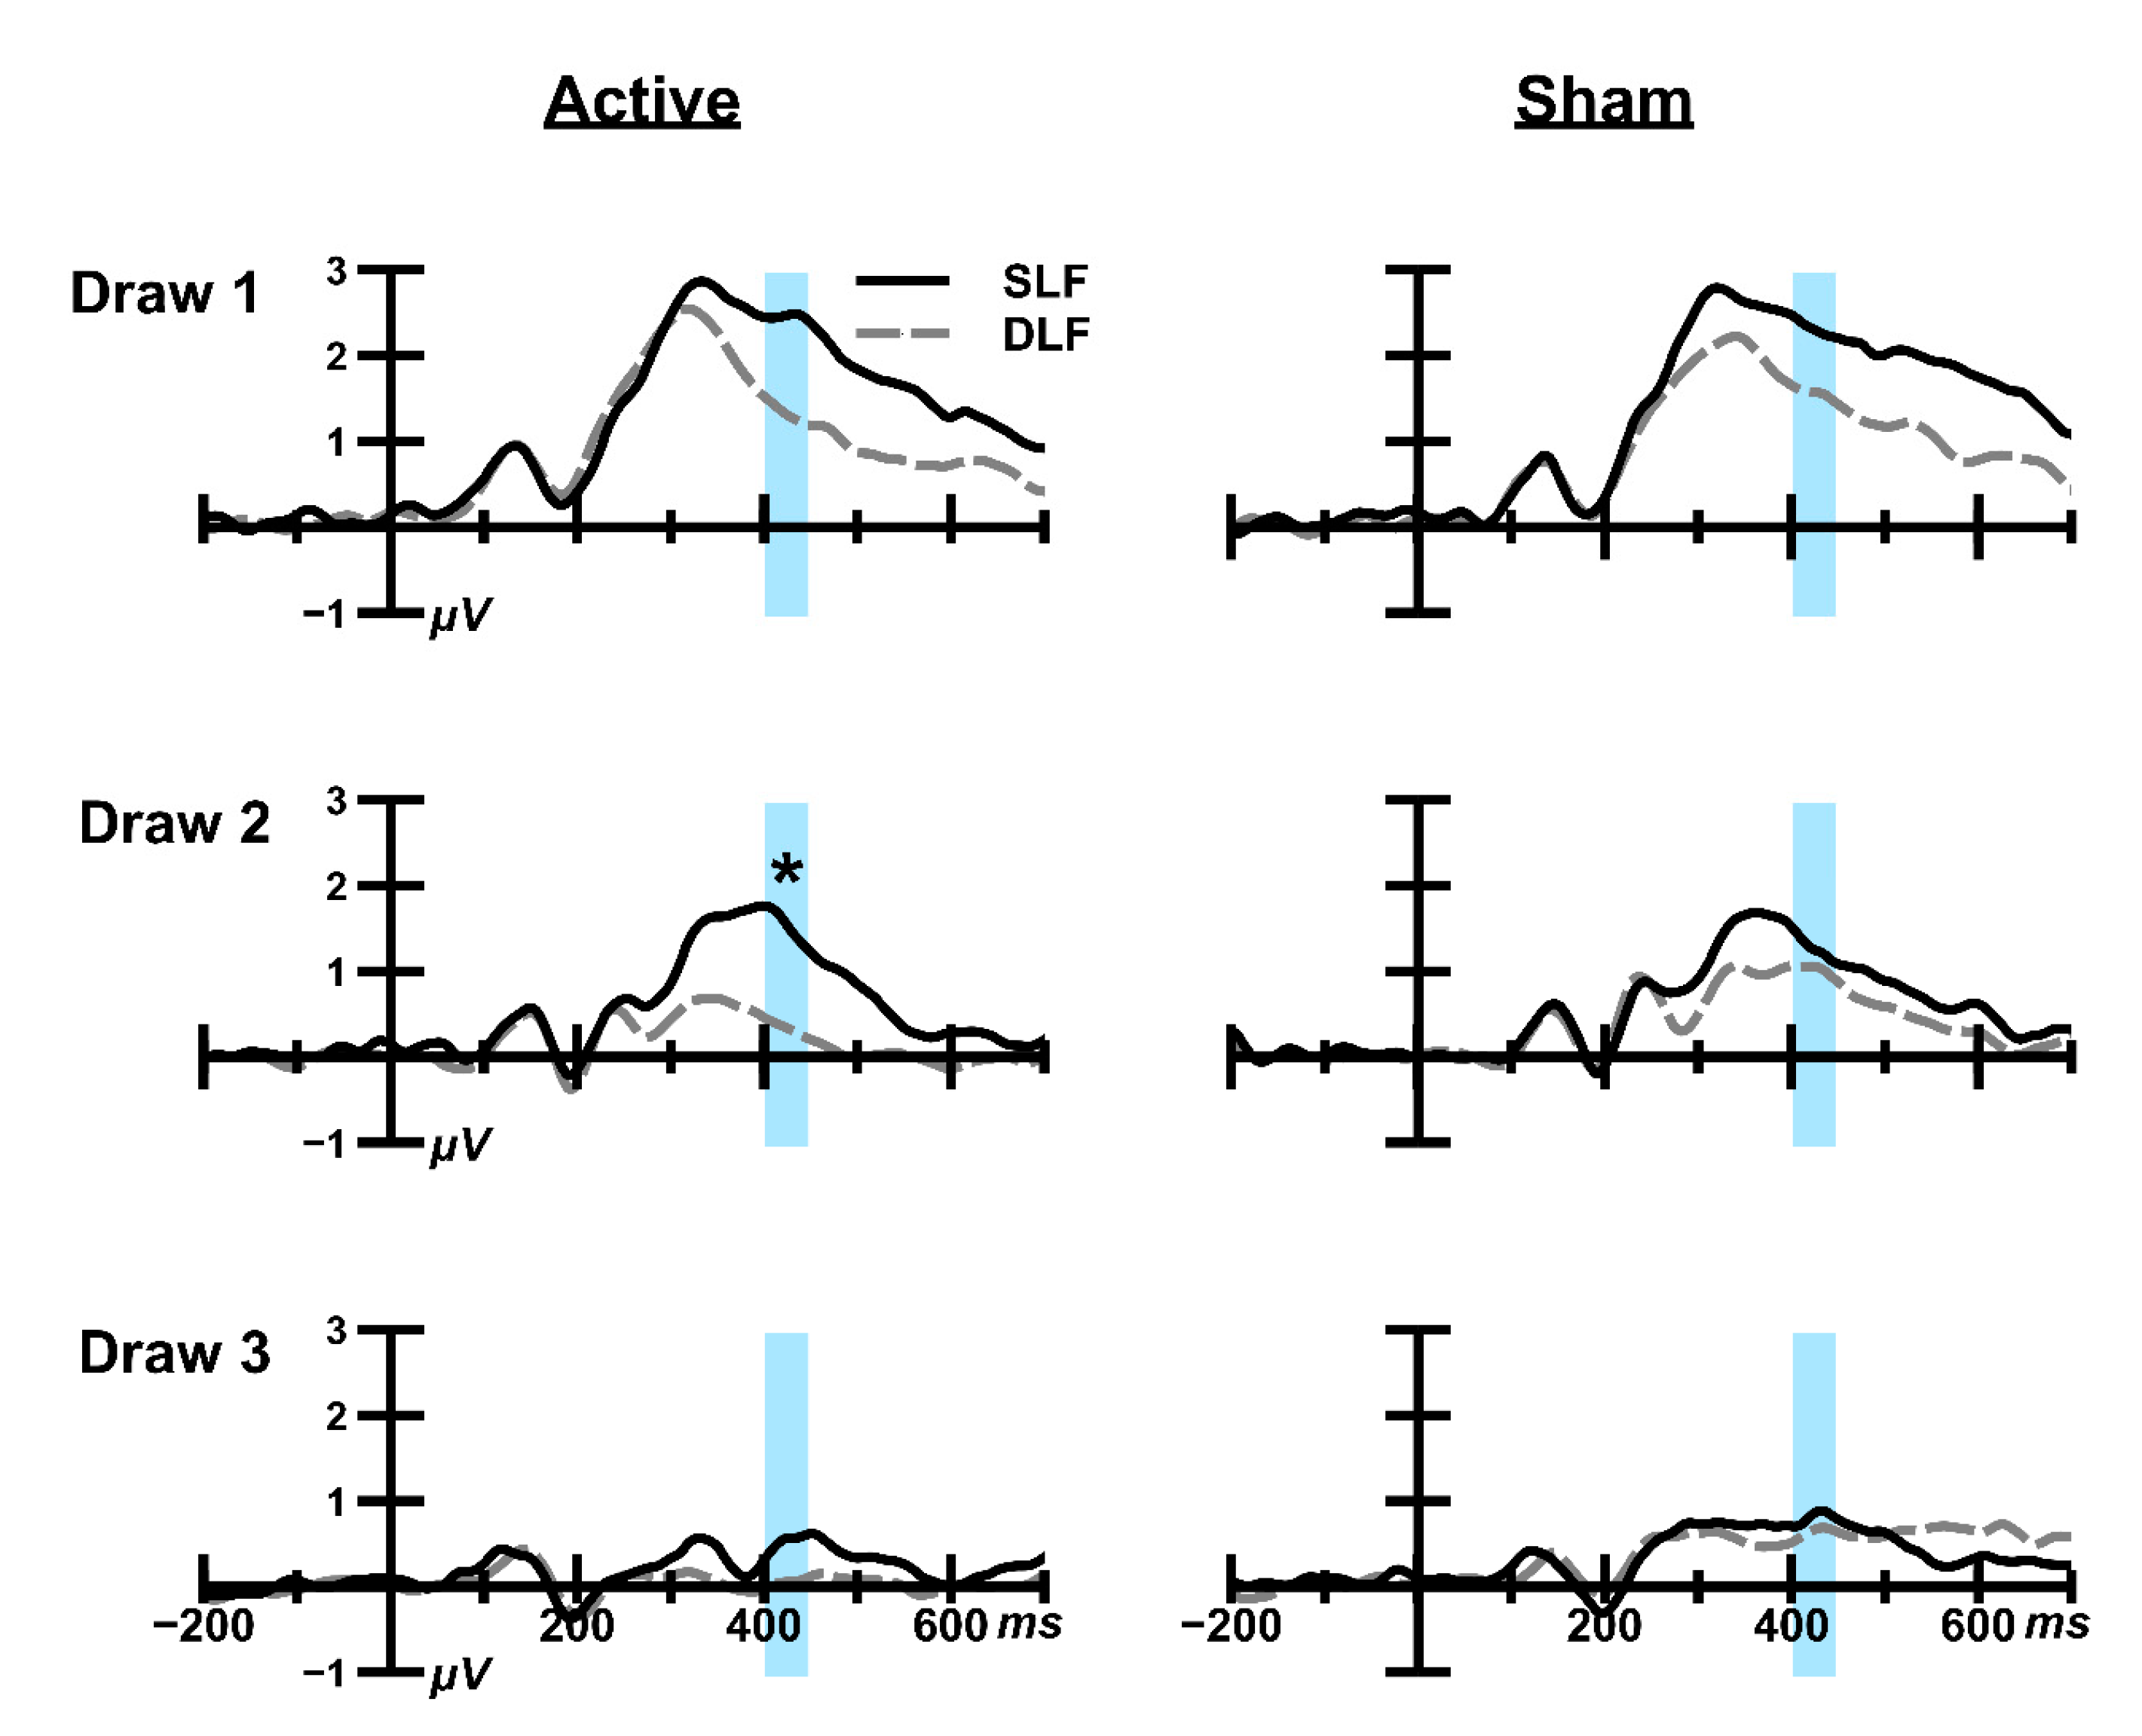
3.1.2. ERP Analysis
Draw 1
Draw 2
Draw 3
4. Discussion
5. Conclusions
Author Contributions
Funding
Conflicts of Interest
Appendix A

| Subject | Active taVNS in First Session | Version of Bayesian Oddball Task | |||
|---|---|---|---|---|---|
| Red DL, Left | Yellow DL, Left | Red DL, Right | Yellow DL, Right | ||
| 1 | ✔ | ✔ | |||
| 2 | ✔ | ||||
| 3 | ✔ | ✔ | |||
| 4 | ✔ | ||||
| 5 | ✔ | ✔ | |||
| 6 | ✔ | ||||
| 7 | ✔ | ✔ | |||
| 8 | ✔ | ||||
| 9 | ✔ | ✔ | |||
| 10 | ✔ | ||||
| 11 | ✔ | ✔ | |||
| 12 | ✔ | ||||
| 13 | ✔ | ✔ | |||
| 14 | ✔ | ||||
| 15 | ✔ | ✔ | |||
| 16 | ✔ | ||||
| 17 | ✔ | ✔ | |||
| 18 | ✔ | ||||
| 19 | ✔ | ✔ | |||
| 20 | ✔ | ||||
| 21 | ✔ | ✔ | |||
| 22 | ✔ | ||||
| 23 | ✔ | ✔ | |||
| 24 | ✔ | ||||
| 25 | ✔ | ✔ | |||
| 26 | ✔ | ||||
| 27 | ✔ | ✔ | |||
| 28 | ✔ | ||||
| 29 | ✔ | ✔ | |||
| 30 | ✔ | ||||
| 31 | ✔ | ✔ | |||
| 32 | ✔ | ||||
| 33 | ✔ | ✔ | |||
| 34 | ✔ | ||||
| 35 | ✔ | ✔ | |||
| 36 | ✔ | ||||
| 37 | ✔ | ✔ | |||
| 38 | ✔ | ||||
| 39 | ✔ | ✔ | |||
| 40 | ✔ | ||||
| 41 | ✔ | ✔ | |||
| 42 | ✔ | ||||
| 43 | ✔ | ✔ | |||
| 44 | ✔ | ||||
| 45 | ✔ | ✔ | |||
| 46 | ✔ | ||||
| 47 | ✔ | ✔ | |||
| Total | 20 | 11 | 11 | 11 | 8 |
Appendix B
| Draw 1 | % Occurrence | P(SL)/e | Draw 2 | % Occurrence | P(SL)/e | Draw 3 | % Occurrence | P(SL)/e |
|---|---|---|---|---|---|---|---|---|
| DLF | 0.65 | 0.03 | DLF | 0.60 | <0.01 | DLF | 0.57 | <0.01 |
| SLF | 0.03 | 0.03 | ||||||
| SLF | 0.05 | 0.33 | DLF | 0.03 | 0.03 | |||
| SLF | 0.02 | 0.90 | ||||||
| SLF | 0.35 | 0.90 | DLF | 0.05 | 0.33 | DLF | 0.03 | 0.03 |
| SLF | 0.02 | 0.90 | ||||||
| SLF | 0.30 | 0.99 | DLF | 0.02 | 0.90 | |||
| SLF | 0.29 | 0.99 |
Appendix C
| Subjects | Active | Sham | ||||||||||
|---|---|---|---|---|---|---|---|---|---|---|---|---|
| Draw 1 | Draw 2 | Draw 3 | Draw 1 | Draw 2 | Draw 3 | |||||||
| S | T | S | T | S | T | S | T | S | T | S | T | |
| 1 | - | - | - | - | - | - | - | - | - | - | - | - |
| 2 | 127 | 71 | 126 | 65 | 125 | 72 | 125 | 70 | 125 | 64 | 123 | 71 |
| 3 | 130 | 74 | 129 | 69 | 129 | 75 | 128 | 72 | 128 | 66 | 128 | 72 |
| 4 | 127 | 72 | 126 | 64 | 126 | 68 | 128 | 72 | 123 | 67 | 125 | 67 |
| 5 | 126 | 72 | 125 | 66 | 126 | 69 | 115 | 67 | 115 | 59 | 119 | 65 |
| 6 | 127 | 72 | 126 | 64 | 115 | 52 | 126 | 72 | 126 | 66 | 123 | 68 |
| 7 | 127 | 71 | 128 | 65 | 122 | 70 | 128 | 72 | 127 | 65 | 112 | 64 |
| 8 | 128 | 71 | 128 | 65 | 127 | 72 | 128 | 72 | 127 | 66 | 127 | 72 |
| 9 | 126 | 71 | 126 | 65 | 122 | 70 | 121 | 66 | 119 | 60 | 117 | 66 |
| 10 | 125 | 71 | 123 | 65 | 122 | 71 | 128 | 72 | 128 | 66 | 128 | 72 |
| 11 | 128 | 72 | 128 | 64 | 128 | 71 | 127 | 71 | 124 | 66 | 123 | 70 |
| 12 | 117 | 66 | 118 | 60 | 105 | 65 | 121 | 72 | 121 | 66 | 126 | 70 |
| 13 | 127 | 70 | 127 | 65 | 127 | 70 | 128 | 72 | 126 | 66 | 124 | 71 |
| 14 | 125 | 72 | 127 | 66 | 126 | 70 | 124 | 70 | 126 | 64 | 125 | 69 |
| 15 | 124 | 72 | 125 | 66 | 125 | 71 | 127 | 71 | 126 | 66 | 126 | 72 |
| 16 | 46 | 26 | 53 | 22 | 40 | 16 | 127 | 71 | 127 | 66 | 126 | 72 |
| 17 | 127 | 72 | 128 | 66 | 125 | 68 | - | - | - | - | - | - |
| 18 | 84 | 50 | 91 | 44 | 86 | 49 | 127 | 71 | 121 | 61 | 120 | 72 |
| 19 | 127 | 72 | 128 | 66 | 128 | 71 | 124 | 72 | 123 | 66 | 126 | 71 |
| 20 | 126 | 71 | 126 | 65 | 128 | 72 | 37 | 20 | 30 | 14 | 35 | 16 |
| 21 | 128 | 69 | 128 | 65 | 127 | 71 | 128 | 72 | 124 | 66 | 124 | 72 |
| 22 | 124 | 69 | 113 | 54 | 114 | 69 | 128 | 72 | 123 | 65 | 119 | 70 |
| 23 | 128 | 72 | 128 | 66 | 127 | 69 | 127 | 71 | 127 | 66 | 128 | 70 |
| 24 | 123 | 72 | 124 | 65 | 123 | 70 | 127 | 70 | 127 | 65 | 126 | 71 |
| 25 | 124 | 69 | 125 | 65 | 127 | 70 | 127 | 72 | 125 | 65 | 126 | 71 |
| 26 | 126 | 71 | 127 | 64 | 127 | 70 | 92 | 55 | 116 | 59 | 117 | 69 |
| 27 | 128 | 72 | 128 | 66 | 128 | 72 | 128 | 72 | 123 | 66 | 122 | 69 |
| 28 | 128 | 72 | 128 | 66 | 128 | 72 | 128 | 72 | 128 | 66 | 128 | 72 |
| 29 | 127 | 69 | 124 | 61 | 119 | 67 | 128 | 72 | 124 | 66 | 121 | 69 |
| 30 | 125 | 70 | 127 | 66 | 125 | 70 | 123 | 67 | 123 | 62 | 122 | 70 |
| 31 | 128 | 69 | 128 | 65 | 126 | 71 | 127 | 72 | 126 | 66 | 124 | 71 |
| 32 | 125 | 72 | 127 | 66 | 126 | 71 | 127 | 72 | 127 | 66 | 125 | 70 |
| 33 | 127 | 71 | 127 | 65 | 127 | 72 | 127 | 72 | 126 | 66 | 126 | 71 |
| 34 | 128 | 72 | 112 | 58 | 120 | 63 | 123 | 72 | 115 | 62 | 121 | 65 |
| 35 | 128 | 72 | 128 | 64 | 125 | 70 | 128 | 71 | 125 | 65 | 125 | 70 |
| 36 | 128 | 72 | 124 | 66 | 123 | 71 | 127 | 71 | 125 | 65 | 127 | 69 |
| 37 | 120 | 69 | 122 | 63 | 123 | 69 | 121 | 67 | 121 | 62 | 124 | 68 |
| 38 | 125 | 72 | 123 | 64 | 118 | 69 | 127 | 71 | 128 | 64 | 128 | 71 |
| 39 | 128 | 72 | 124 | 64 | 119 | 68 | 128 | 72 | 126 | 66 | 118 | 69 |
| 40 | 112 | 61 | 114 | 61 | 112 | 63 | 118 | 65 | 115 | 62 | 102 | 64 |
| 41 | - | - | - | - | - | - | - | - | - | - | - | - |
| 42 | - | - | - | - | - | - | - | - | - | - | - | - |
| 43 | - | - | - | - | - | - | - | - | - | - | - | - |
| 44 | 125 | 71 | 122 | 65 | 117 | 68 | 127 | 72 | 127 | 66 | 128 | 72 |
| 45 | 126 | 70 | 128 | 66 | 127 | 71 | 128 | 72 | 128 | 66 | 127 | 72 |
| 46 | 115 | 64 | 114 | 59 | 112 | 66 | 127 | 72 | 128 | 66 | 128 | 72 |
| 47 | 126 | 69 | 123 | 61 | 120 | 68 | 122 | 68 | 107 | 52 | 112 | 57 |
| Total: | 128 | 72 | 128 | 72 | 128 | 72 | 128 | 72 | 128 | 72 | 128 | 72 |
Appendix D
Appendix D.1. %. DLS

Appendix D.2. Reaction Times
| ACTIVE | ||||||||
|---|---|---|---|---|---|---|---|---|
| Draw 1 | M | SD | Draw 2 | M | SD | Draw 3 | M | SD |
| DLF | 496.6 | 115.0 | DLF | 325.3 | 88.5 | DLF | 293.3 | 96.8 |
| SLF | 471.8 | 299.7 | ||||||
| SLF* | 616.5 | 334.6 | DLF * | 557.1 | 140.3 | |||
| SLF | 585.8 | 228.2 | ||||||
| SLF | 594.9 | 141.7 | DLF* | 682.4 | 318.4 | DLF * | 558.2 | 246.1 |
| SLF | 560.1 | 205.0 | ||||||
| SLF | 369.8 | 96.1 | DLF * | 537.7 | 385.7 | |||
| SLF | 291.0 | 94.8 | ||||||
| SHAM | ||||||||
| Draw 1 | M | SD | Draw 2 | M | SD | Draw 3 | M | SD |
| DLF | 498.3 | 126.1 | DLF | 317.4 | 67.0 | DLF | 325.3 | 88.5 |
| SLF | 595.0 | 141.7 | ||||||
| SLF | 663.3 | 401.1 | DLF | 496.6 | 115.0 | |||
| SLF | 574.1 | 206.7 | ||||||
| SLF | 583.7 | 170.8 | DLF | 712.0 | 380.7 | DLF | 369.8 | 96.1 |
| SLF | 533.8 | 178.0 | ||||||
| SLF | 366.3 | 85.9 | DLF | 468.7 | 386.5 | |||
| SLF | 295.5 | 85.6 | ||||||
Appendix E
Appendix E.1. 300–349 ms
Appendix E.1.1. Draw 1
Appendix E.1.2. Draw 2
Appendix E.1.3. Draw 3
Appendix E.2. 350–399 ms
Appendix E.2.1. Draw 1
Appendix E.2.2. Draw 2
Appendix E.2.3. Draw 3
Appendix E.3. 450–499 ms
Appendix E.3.1. Draw 1
Appendix E.3.2. Draw 2
Appendix E.3.3. Draw 3
References
- Yuan, H.; Silberstein, S.D. Vagus nerve and vagus nerve stimulation, a comprehensive review: Part I. Headache J. Head Face Pain 2016, 56, 71–78. [Google Scholar] [CrossRef] [PubMed]
- Carreno, F.R.; Frazer, A. Vagal nerve stimulation for treatment-resistant depression. Neurother 2017, 14, 716–727. [Google Scholar] [CrossRef] [PubMed]
- Elliott, R.E.; Morsi, A.; Tanweer, O.; Grobelny, B.; Geller, E.; Carlson, C.; Doyle, W.K. Efficacy of vagus nerve stimulation over time: Review of 65 consecutive patients with treatment-resistant epilepsy treated with VNS > 10 years. Epilepsy Behav. 2011, 20, 478–483. [Google Scholar] [CrossRef] [PubMed]
- Labar, D.; Murphy, J.; Tecoma, E.; E VNS Study Group. Vagus nerve stimulation for medication-resistant generalized epilepsy. Neurol. 1999, 52, 1510. [Google Scholar] [CrossRef] [PubMed]
- Milby, A.H.; Halpern, C.H.; Baltuch, G.H. Vagus nerve stimulation for epilepsy and depression. Neurother 2008, 5, 75–85. [Google Scholar] [CrossRef] [PubMed]
- Aston-Jones, G.; Rajkowski, J.; Cohen, J. Role of locus coeruleus in attention and behavioral flexibility. Biol. Psychiatry 1999, 46, 1309–1320. [Google Scholar] [CrossRef]
- Broncel, A.; Bocian, R.; Kłos-Wojtczak, P.; Kulbat-Warycha, K.; Konopacki, J. Vagal nerve stimulation as a promising tool in the improvement of cognitive disorders. Brain Res. Bull. 2019, 155, 37–47. [Google Scholar] [CrossRef]
- Follesa, P.; Biggio, F.; Gorini, G.; Caria, S.; Talani, G.; Dazzi, L.; Biggio, G. Vagus nerve stimulation increases norepinephrine concentration and the gene expression of BDNF and bFGF in the rat brain. Brain Res. 2007, 1179, 28–34. [Google Scholar] [CrossRef]
- Barraco, I.R.A. Nucleus of the Solitary Tract; CRC Press: Boca Raton, FL, USA, 2019. [Google Scholar]
- Van Bockstaele, E.J.; Peoples, J.; Telegan, P. Efferent projections of the nucleus of the solitary tract to peri-locus coeruleus dendrites in rat brain: Evidence for a monosynaptic pathway. J. Comp. Neurol. 1999, 412, 410–428. [Google Scholar] [CrossRef]
- Fornai, F.; Ruffoli, R.; Giorgi, F.S.; Paparelli, A. The role of locus coeruleus in the antiepileptic activity induced by vagus nerve stimulation. Eur. J. Neurosci. 2011, 33, 2169–2178. [Google Scholar] [CrossRef]
- Grimonprez, A.; Raedt, R.; Portelli, J.; Dauwe, I.; Larsen, L.E.; Bouckaert, C.; Boon, P. The antidepressant-like effect of vagus nerve stimulation is mediated through the locus coeruleus. J. Psychiatr. Res. 2015, 68, 1–7. [Google Scholar] [CrossRef] [PubMed]
- Krahl, S.E.; Clark, K.B.; Smith, D.C.; Browning, R.A. Locus coeruleus lesions suppress the seizure-attenuating effects of vagus nerve stimulation. Epilepsia 1998, 39, 709–714. [Google Scholar] [CrossRef] [PubMed]
- Manta, S.; El Mansari, M.; Debonnel, G.; Blier, P. Electrophysiological and neurochemical effects of long-term vagus nerve stimulation on the rat monoaminergic systems. Int. J. Neuropsychopharmacol. 2013, 16, 459–470. [Google Scholar] [CrossRef] [PubMed] [Green Version]
- Raedt, R.; Clinckers, R.; Mollet, L.; Vonck, K.; El Tahry, R.; Wyckhuys, T.; Smolders, I. Increased hippocampal noradrenaline is a biomarker for efficacy of vagus nerve stimulation in a limbic seizure model. J. Neurochem. 2011, 117, 461–469. [Google Scholar] [CrossRef] [PubMed]
- Roosevelt, R.W.; Smith, D.C.; Clough, R.W.; Jensen, R.A.; Browning, R.A. Increased extracellular concentrations of norepinephrine in cortex and hippocampus following vagus nerve stimulation in the rat. Brain Res. 2006, 1119, 124–132. [Google Scholar] [CrossRef] [PubMed] [Green Version]
- Dorr, A.E.; Debonnel, G. Effect of vagus nerve stimulation on serotonergic and noradrenergic transmission. J. Pharmacol. Exp. Ther. 2006, 318, 890–898. [Google Scholar] [CrossRef] [PubMed]
- Bouckaert, C. Research on a Noninvasive Biomarker for Responders to Vagus Nerve Stimulation in Patients with Refractory Epilepsy. Ph.D. Thesis, Ghent University, Ghent, Belgium, 2017. [Google Scholar]
- Van Leusden, J.W.; Sellaro, R.; Colzato, L.S. Transcutaneous Vagal Nerve Stimulation (tVNS): A new neuromodulation tool in healthy humans? Front. Psychol. 2015, 6, 102. [Google Scholar] [CrossRef] [Green Version]
- Badran, B.W.; Dowdle, L.T.; Mithoefer, O.J.; LaBate, N.T.; Coatsworth, J.; Brown, J.C.; George, M.S. Neurophysiologic effects of transcutaneous auricular vagus nerve stimulation (taVNS) via electrical stimulation of the tragus: A concurrent taVNS/fMRI study and review. Brain Stimul. 2018, 11, 492–500. [Google Scholar] [CrossRef]
- Jacobs, H.I.; Riphagen, J.M.; Razat, C.M.; Wiese, S.; Sack, A.T. Transcutaneous vagus nerve stimulation boosts associative memory in older individuals. Neurobiol. Aging 2015, 36, 1860–1867. [Google Scholar] [CrossRef]
- Villani, V.; Tsakiris, M.; Azevedo, R.T. Transcutaneous vagus nerve stimulation improves interoceptive accuracy. Neuropsychologia 2019, 134, 107201. [Google Scholar] [CrossRef]
- Hachem, L.D.; Wong, S.M.; Ibrahim, G.M. The vagus afferent network: Emerging role in translational connectomics. Neurosurg. Focus 2018, 45, E2. [Google Scholar] [CrossRef] [PubMed] [Green Version]
- Ricardo, J.A.; Koh, E.T. Anatomical evidence of direct projections from the nucleus of the solitary tract to the hypothalamus, amygdala, and other forebrain structures in the rat. Brain Res. 1978, 153, 1–26. [Google Scholar] [CrossRef]
- Capone, F.; Assenza, G.; Di Pino, G.; Musumeci, G.; Ranieri, F.; Florio, L.; Di Lazzaro, V. The effect of transcutaneous vagus nerve stimulation on cortical excitability. J. Neural Transm. 2015, 122, 679–685. [Google Scholar] [CrossRef] [PubMed]
- Kraus, T.; Hösl, K.; Kiess, O.; Schanze, A.; Kornhuber, J.; Forster, C. Bold fMRI deactivation of limbic and temporal brain structures and mood enhancing effect by transcutaneous vagus nerve stimulation. J. Neural Transm. 2007, 114, 1485–1493. [Google Scholar] [CrossRef]
- Clancy, J.A.; Mary, D.A.; Witte, K.K.; Greenwood, J.P.; Deuchars, S.A.; Deuchars, J. Non-invasive vagus nerve stimulation in healthy humans reduces sympathetic nerve activity. Brain Stimul. 2014, 7, 871–877. [Google Scholar] [CrossRef]
- Chatterton, R.T., Jr.; Vogelsong, K.M.; Lu, Y.C.; Ellman, A.B.; Hudgens, G.A. Salivary α-amylase as a measure of endogenous adrenergic activity. Clin. Physiol. 1996, 16, 433–448. [Google Scholar] [CrossRef]
- Fischer, R.; Ventura-Bort, C.; Hamm, A.; Weymar, M. Transcutaneous vagus nerve stimulation (tVNS) enhances conflict-triggered adjustment of cognitive control. Cogn. Affect. Behav. Neurosci. 2018, 18, 680–693. [Google Scholar] [CrossRef] [Green Version]
- Sellaro, R.; Van Leusden, J.W.; Tona, K.D.; Verkuil, B.; Nieuwenhuis, S.; Colzato, L.S. Transcutaneous vagus nerve stimulation enhances post-error slowing. J. Cogn. Neurosci. 2015, 27, 2126–2132. [Google Scholar] [CrossRef]
- Steenbergen, L.; Sellaro, R.; Stock, A.K.; Verkuil, B.; Beste, C.; Colzato, L.S. Transcutaneous vagus nerve stimulation (taVNS) enhances response selection during action cascading processes. Eur. Neuropsychopharmacol. 2015, 25, 773–778. [Google Scholar] [CrossRef]
- Nieuwenhuis, S.; Aston-Jones, G.; Cohen, J.D. Decision making, the P3, and the locus coeruleus—Norepinephrine system. Psychol. Bull. 2005, 131, 510. [Google Scholar] [CrossRef]
- Murphy, P.R.; Robertson, I.H.; Balsters, J.H.; O’connell, R.G. Pupillometry and P3 index the locus coeruleus–noradrenergic arousal function in humans. Psychophysiology 2011, 48, 1532–1543. [Google Scholar] [CrossRef] [PubMed]
- Polich, J.; Heine, M.R. P300 topography and modality effects from a single-stimulus paradigm. Psychophysiology 1996, 33, 747–752. [Google Scholar] [CrossRef] [PubMed]
- Nieuwenhuis, S.; De Geus, E.J.; Aston-Jones, G. The anatomical and functional relationship between the P3 and autonomic components of the orienting response. Psychophysiology 2011, 48, 162–175. [Google Scholar] [CrossRef] [PubMed] [Green Version]
- Bennington, J.Y.; Polich, J. Comparison of P300 from passive and active tasks for auditory and visual stimuli. Int. J. Psychophysiol. 1999, 34, 171–177. [Google Scholar] [CrossRef]
- Schindel, R.; Rowlands, J.; Arnold, D.H. The oddball effect: Perceived duration and predictive coding. J. Vis. 2011, 11, 17. [Google Scholar] [CrossRef] [PubMed] [Green Version]
- Luck, S.J. An Introduction to the Event-Related Potential Technique; MIT Press: Cambridge, MA, USA, 2014. [Google Scholar]
- De Taeye, L.; Vonck, K.; Van Bochove, M.; Boon, P.; Van Roost, D.; Mollet, L.; Gadeyne, S. The P3 event-related potential is a biomarker for the efficacy of vagus nerve stimulation in patients with epilepsy. Neurotherapeutics 2014, 11, 612–622. [Google Scholar] [CrossRef] [Green Version]
- Rufener, K.S.; Geyer, U.; Janitzky, K.; Heinze, H.J.; Zaehle, T. Modulating auditory selective attention by non-invasive brain stimulation: Differential effects of transcutaneous vagal nerve stimulation and transcranial random noise stimulation. Eur. J. Neurosci. 2018, 48, 2301–2309. [Google Scholar] [CrossRef]
- Ventura-Bort, C.; Wirkner, J.; Genheimer, H.; Wendt, J.; Hamm, A.O.; Weymar, M. Effects of transcutaneous vagus nerve stimulation (tVNS) on the P300 and alpha-amylase level: A pilot study. Front. Hum. Neurosci. 2018, 12, 202. [Google Scholar] [CrossRef]
- Warren, C.; Tona, K.D.; Ouwerkerk, L.; Bosch, J.A.; Nieuwenhuis, S. The impact of transcutaneous vagal nerve stimulation on central noradrenergic activity as evidenced by salivary alpha amylase and the P3 event-related potential. In Proceedings of the CogSci 40th Annual Meeting of the Cognitive Science Society, Madison, WI, USA, 25–28 July 2018. [Google Scholar]
- Efron, B. Bayes’ theorem in the 21st century. Science 2013, 340, 1177–1178. [Google Scholar] [CrossRef]
- Kolossa, A.; Kopp, B.; Fingscheidt, T. A computational analysis of the neural bases of Bayesian inference. Neuroimage 2015, 106, 222–237. [Google Scholar] [CrossRef]
- Kopp, B.; Seer, C.; Lange, F.; Kluytmans, A.; Kolossa, A.; Fingscheidt, T.; Hoijtink, H. P300 amplitude variations, prior probabilities, and likelihoods: A Bayesian ERP study. Cogn. Affect. Behav. Neurosci. 2016, 16, 911–928. [Google Scholar] [CrossRef] [PubMed]
- Kopp, B. The P300 component of the event-related brain potential and Bayes’ theorem. Cogn. Sci. Lead. Edge 2008, 7, 87–96. [Google Scholar]
- Kolossa, A.; Fingscheidt, T.; Wessel, K.; Kopp, B. A model-based approach to trial-by-trial P300 amplitude fluctuations. Front. Hum. Neurosci. 2013, 6, 359. [Google Scholar] [CrossRef] [PubMed] [Green Version]
- Boos, M.; Seer, C.; Lange, F.; Kopp, B. Probabilistic inference: Task dependency and individual differences of probability weighting revealed by hierarchical Bayesian modeling. Front. Psychol. 2016, 7, 755. [Google Scholar] [CrossRef] [Green Version]
- Seer, C.; Lange, F.; Boos, M.; Dengler, R.; Kopp, B. Prior probabilities modulate cortical surprise responses: A study of event-related potentials. Brain Cogn. 2016, 106, 78–89. [Google Scholar] [CrossRef]
- Colzato, L.S.; Ritter, S.M.; Steenbergen, L. Transcutaneous vagus nerve stimulation (tVNS) enhances divergent thinking. Neuropsychologia 2018, 111, 72–76. [Google Scholar] [CrossRef]
- Colzato, L.S.; Wolters, G.; Peifer, C. Transcutaneous vagus nerve stimulation (tVNS) modulates flow experience. Exp. Brain Res. 2018, 236, 253–257. [Google Scholar] [CrossRef] [Green Version]
- Maraver, M.J.; Steenbergen, L.; Hossein, R.; Actis-Grosso, R.; Ricciardelli, P.; Hommel, B.; Colzato, L.S. Transcutaneous vagus nerve stimulation modulates attentional resource deployment towards social cues. Neuropsychologia 2020, 143, 107465. [Google Scholar] [CrossRef]
- Sellaro, R.; De Gelder, B.; Finisguerra, A.; Colzato, L.S. Transcutaneous vagus nerve stimulation (tVNS) enhances recognition of emotions in faces but not bodies. Cortex 2018, 99, 213–223. [Google Scholar] [CrossRef]
- Steenbergen, L.; Colzato, L.S.; Maraver, M.J. Vagal signaling and the somatic marker hypothesis: The effect of transcutaneous vagal nerve stimulation on delay discounting is modulated by positive mood. Int. J. Psychophysiol. 2020, 148, 84–92. [Google Scholar] [CrossRef]
- Redgrave, J.; Day, D.; Leung, H.; Laud, P.J.; Ali, A.; Lindert, R.; Majid, A. Safety and tolerability of Transcutaneous Vagus Nerve stimulation in humans; a systematic review. Brain Stimul. 2018, 11, 1225–1238. [Google Scholar] [CrossRef] [PubMed]
- Fallgatter, A.J.; Neuhauser, B.; Herrmann, M.J.; Ehlis, A.C.; Wagener, A.; Scheuerpflug, P.; Riederer, P. Far field potentials from the brain stem after transcutaneous vagus nerve stimulation. J. Neural Transm. 2003, 110, 1437–1443. [Google Scholar] [CrossRef]
- Peuker, E.T.; Filler, T.J. The nerve supply of the human auricle. Clin. Anat. 2002, 15, 35–37. [Google Scholar] [CrossRef] [PubMed]
- Ouyang, G.; Herzmann, G.; Zhou, C.; Sommer, W. Residue iteration decomposition (RIDE): A new method to separate ERP components on the basis of latency variability in single trials. Psychophysiology 2011, 48, 1631–1647. [Google Scholar] [CrossRef] [PubMed]
- Polich, J. Updating P300: An integrative theory of P3a and P3b. Clin. Neurophysiol. 2007, 118, 2128–2148. [Google Scholar] [CrossRef] [PubMed] [Green Version]
- Linden, D.E. The P300: Where in the brain is it produced and what does it tell us? Neuroscience 2005, 11, 563–576. [Google Scholar] [CrossRef] [PubMed]
- O’Donnell, B.F.; Friedman, S.; Swearer, J.M.; Drachman, D.A. Active and passive P3 latency and psychometric performance: Influence of age and individual differences. Int. J. Psychophysiol. 1992, 12, 187–195. [Google Scholar] [CrossRef]
- Mertens, R.; Polich, J. P300 from a single-stimulus paradigm: Passive versus active tasks and stimulus modality. Electroencephalogr. Clin. Neurophysiol. Evoked Potentials Sect. 1997, 104, 488–497. [Google Scholar] [CrossRef]
- Polich, J. Habituation of P300 from auditory stimuli. Psychobiology 1989, 17, 19–28. [Google Scholar]
- Ravden, D.; Polich, J. Habituation of P300 from visual stimuli. Int. J. Psychophysiol. 1998, 30, 359–365. [Google Scholar] [CrossRef]
- Desmedt, J.E. P300 in serial tasks: An essential post-decision closure mechanism. In Progress in Brain Research; Elsevier: Oxford, UK, 1980; Volume 54, pp. 682–686. [Google Scholar]
- Kopp, B.; Wolff, M. Brain mechanisms of selective learning: Event-related potentials provide evidence for error-driven learning in humans. Biol. Psychol. 2000, 51, 223–246. [Google Scholar] [CrossRef]
- Moritz, S.; Van Quaquebeke, N.; Lincoln, T.M. Jumping to conclusions is associated with paranoia but not general suspiciousness: A comparison of two versions of the probabilistic reasoning paradigm. Schizophr. Res. Treat. 2012, 2012, 384039. [Google Scholar] [CrossRef] [PubMed] [Green Version]
- Speechley, W.J.; Whitman, J.C.; Woodward, T.S. The contribution of hypersalience to the “jumping to conclusions” bias associated with delusions in schizophrenia. J. Psychiatry Neurosci. 2010, 35, 7. [Google Scholar] [CrossRef] [PubMed] [Green Version]
- Van der Leer, L.; Hartig, B.; Goldmanis, M.; McKay, R. Delusion proneness and ‘jumping to conclusions’: Relative and absolute effects. Psychol. Med. 2015, 45, 1253–1262. [Google Scholar] [CrossRef] [Green Version]
- Woodward, T.S.; Munz, M.; LeClerc, C.; Lecomte, T. Change in delusions is associated with change in “jumping to conclusions”. Psychiatry Res. 2009, 170, 124–127. [Google Scholar] [CrossRef]
- Woodward, T.S.; Mizrahi, R.; Menon, M.; Christensen, B.K. Correspondences between theory of mind, jumping to conclusions, neuropsychological measures and the symptoms of schizophrenia. Psychiatry Res. 2009, 170, 119–123. [Google Scholar] [CrossRef]
- Mello-Carpes, P.B.; Izquierdo, I. The nucleus of the solitary tract → nucleus paragigantocellularis→ locus coeruleus → CA1 region of dorsal hippocampus pathway is important for consolidation of object recognition memory. Neurobiol. Learn. Mem 2013, 100, 56–63. [Google Scholar] [CrossRef] [Green Version]
- Schwarz, L.A.; Luo, L. Organization of the locus coeruleus-norepinephrine system. Curr. Biol. 2015, 25, R1051–R1056. [Google Scholar] [CrossRef] [Green Version]
- Sara, S.J. The locus coeruleus and noradrenergic modulation of cognition. Nat. Rev. Neurosci. 2009, 10, 211. [Google Scholar] [CrossRef]
- Usher, M.; Davelaar, E.J. Neuromodulation of decision and response selection. Neural Netw. 2002, 15, 635–645. [Google Scholar] [CrossRef]
- Keute, M.; Ruhnau, P.; Heinze, H.J.; Zaehle, T. Behavioral and electrophysiological evidence for GABAergic modulation through transcutaneous vagus nerve stimulation. Clin. Neurophysiol. 2018, 129, 1789–1795. [Google Scholar] [CrossRef] [PubMed]
- Li, R.; Song, W.Q.; Du, J.B.; Huo, S.; Shan, G.X. Connecting the P300 to the diagnosis and prognosis of unconscious patients. Neural Regen. Res. 2015, 10, 473. [Google Scholar] [PubMed]
- Lugo, Z.R.; Quitadamo, L.R.; Bianchi, L.; Pellas, F.; Veser, S.; Lesenfants, D.; Mattia, D. Cognitive processing in non-communicative patients: What can event-related potentials tell us? Front. Hum. Neurosci. 2016, 10, 569. [Google Scholar] [CrossRef] [PubMed] [Green Version]
- Szuromi, B.; Czobor, P.; Komlósi, S.; Bitter, I. P300 deficits in adults with attention deficit hyperactivity disorder: A meta-analysis. Psychol. Med. 2011, 41, 1529–1538. [Google Scholar] [CrossRef]
- Polich, J.; Kok, A. Cognitive and biological determinants of P300: An integrative review. Biol. Psychol. 1995, 41, 103–146. [Google Scholar] [CrossRef]
- Fang, J.; Rong, P.; Hong, Y.; Fan, Y.; Liu, J.; Wang, H.; Liu, R. Transcutaneous vagus nerve stimulation modulates default mode network in major depressive disorder. Biol. Psychiatry 2016, 79, 266–273. [Google Scholar] [CrossRef] [Green Version]
- Trevizol, A.P.; Taiar, I.; Barros, M.D.; Liquidatto, B.; Cordeiro, Q.; Shiozawa, P. Transcutaneous vagus nerve stimulation (tVNS) protocol for the treatment of major depressive disorder: A case study assessing the auricular branch of the vagus nerve. Epilepsy Behav. 2015, 53, 166–167. [Google Scholar] [CrossRef]
- Hasan, A.; Wolff-Menzler, C.; Pfeiffer, S.; Falkai, P.; Weidinger, E.; Jobst, A.; Quast, S. Transcutaneous noninvasive vagus nerve stimulation (tVNS) in the treatment of schizophrenia: A bicentric randomized controlled pilot study. Eur. Arch. Psychiatry Clin. Neurosci. 2015, 265, 589–600. [Google Scholar] [CrossRef]
- Cornblatt, B.A.; Keilp, J.G. Impaired attention, genetics, and the pathophysiology of schizophrenia. Schizophr. Bull. 1994, 20, 31–46. [Google Scholar] [CrossRef]
- Veiel, H.O. A preliminary profile of neuropsychological deficits associated with major depression. J. Clin. Exp. Neuropsychol. 1997, 19, 587–603. [Google Scholar] [CrossRef]
- Amir, N.; Beard, C.; Burns, M.; Bomyea, J. Attention modification program in individuals with generalized anxiety disorder. J. Abnorm. Psychol. 2009, 118, 28. [Google Scholar] [CrossRef] [PubMed] [Green Version]
- MacNamara, A.; Proudfit, G.H. Cognitive load and emotional processing in generalized anxiety disorder: Electrocortical evidence for increased distractibility. J. Abnorm. Psychol. 2014, 123, 557. [Google Scholar] [CrossRef] [PubMed] [Green Version]
- Bodin, C.; Aubert, S.; Daquin, G.; Carron, R.; Scavarda, D.; McGonigal, A.; Bartolomei, F. Responders to vagus nerve stimulation (VNS) in refractory epilepsy have reduced interictal cortical synchronicity on scalp EEG. Epilepsy Res. 2015, 113, 98–103. [Google Scholar] [CrossRef] [PubMed]
- Sackeim, H.A.; Rush, A.J.; George, M.S.; Marangell, L.B.; Husain, M.M.; Nahas, Z.; Simpson, R.K., Jr. Vagus nerve stimulation (VNS™) for treatment-resistant depression: Efficacy, side effects, and predictors of outcome. Neuropsychopharmacology 2001, 25, 713. [Google Scholar] [CrossRef] [Green Version]
- Conroy, M.A.; Polich, J. Normative variation of P3a and P3b from a large sample: Gender, topography, and response time. J. Psychophysiol. 2007, 21, 22–32. [Google Scholar] [CrossRef]
- Yuan, J.; He, Y.; Qinglin, Z.; Chen, A.; Li, H. Gender differences in behavioral inhibitory control: ERP evidence from a two-choice oddball task. Psychophysiology 2008, 45, 986–993. [Google Scholar] [CrossRef]


© 2020 by the authors. Licensee MDPI, Basel, Switzerland. This article is an open access article distributed under the terms and conditions of the Creative Commons Attribution (CC BY) license (http://creativecommons.org/licenses/by/4.0/).
Share and Cite
Warren, C.V.; Maraver, M.J.; de Luca, A.; Kopp, B. The Effect of Transcutaneous Auricular Vagal Nerve Stimulation (taVNS) on P3 Event-Related Potentials during a Bayesian Oddball Task. Brain Sci. 2020, 10, 404. https://0-doi-org.brum.beds.ac.uk/10.3390/brainsci10060404
Warren CV, Maraver MJ, de Luca A, Kopp B. The Effect of Transcutaneous Auricular Vagal Nerve Stimulation (taVNS) on P3 Event-Related Potentials during a Bayesian Oddball Task. Brain Sciences. 2020; 10(6):404. https://0-doi-org.brum.beds.ac.uk/10.3390/brainsci10060404
Chicago/Turabian StyleWarren, Claire V., María J. Maraver, Alberto de Luca, and Bruno Kopp. 2020. "The Effect of Transcutaneous Auricular Vagal Nerve Stimulation (taVNS) on P3 Event-Related Potentials during a Bayesian Oddball Task" Brain Sciences 10, no. 6: 404. https://0-doi-org.brum.beds.ac.uk/10.3390/brainsci10060404