
Relationship between Amyloid-β Deposition and the Coupling between Structural and Functional Brain Networks in Patients with Mild Cognitive Impairment and Alzheimer’s Disease


Abstract
:1. Introduction
2. Materials and Methods
2.1. Participants
2.2. Clinical and Neuropsychological Assessment
2.3. MRI Acquisition
2.4. PET-CT Acquisition
2.5. White Matter Lesion Quantification
2.6. Dementia/Cognitively Impaired Subtype Classification
2.7. Amyloid Burden
2.8. Network Construction
2.8.1. Anatomical Parcellation
2.8.2. Structural Brain Network Construction
2.8.3. Functional Brain Network Construction
2.9. The Structural–Functional Connectivity Coupling
2.10. Statistical Analysis
3. Results
4. Discussion
4.1. Prodromal Alzheimer’s Disease
4.2. Alzheimer’s Disease Dementia
4.3. Previous Investigations of Brain Network Coupling in Alzheimer’s Disease
4.4. Limitations
5. Conclusions
Author Contributions
Funding
Institutional Review Board Statement
Informed Consent Statement
Data Availability Statement
Conflicts of Interest
References
- Querfurth, H.W.; LaFerla, F.M. Alzheimer’s disease. N. Engl. J. Med. 2010, 362, 329–344. [Google Scholar] [CrossRef] [PubMed] [Green Version]
- Hardy, J.A.; Higgins, G.A. Alzheimer’s disease: The amyloid cascade hypothesis. Science 1992, 256, 184–185. [Google Scholar] [CrossRef] [PubMed]
- Sperling, R.A.; Laviolette, P.S.; O’Keefe, K.; O’Brien, J.; Rentz, D.M.; Pihlajamaki, M.; Marshall, G.; Hyman, B.T.; Selkoe, D.J.; Hedden, T.; et al. Amyloid deposition is associated with impaired default network function in older persons without dementia. Neuron 2009, 63, 178–188. [Google Scholar] [CrossRef] [PubMed] [Green Version]
- Palmqvist, S.; Scholl, M.; Strandberg, O.; Mattsson, N.; Stomrud, E.; Zetterberg, H.; Blennow, K.; Landau, S.; Jagust, W.; Hansson, O. Earliest accumulation of beta-amyloid occurs within the default-mode network and concurrently affects brain connectivity. Nat. Commun. 2017, 8, 1214. [Google Scholar] [CrossRef] [Green Version]
- Small, S.A.; Schobel, S.A.; Buxton, R.B.; Witter, M.P.; Barnes, C.A. A pathophysiological framework of hippocampal dysfunction in ageing and disease. Nat. Rev. Neurosci. 2011, 12, 585–601. [Google Scholar] [CrossRef]
- Jack, C.R.; Knopman, D.S.; Jagust, W.J.; Petersen, R.C.; Weiner, M.W.; Aisen, P.S.; Shaw, L.M.; Vemuri, P.; Wiste, H.J.; Weigand, S.D.; et al. Tracking pathophysiological processes in Alzheimer’s disease: An updated hypothetical model of dynamic biomarkers. Lancet Neurol. 2013, 12, 207–216. [Google Scholar] [CrossRef] [Green Version]
- Okello, A.; Koivunen, J.; Edison, P.; Archer, H.A.; Turkheimer, F.E.; Nagren, K.; Bullock, R.; Walker, Z.; Kennedy, A.; Fox, N.C.; et al. Conversion of amyloid positive and negative MCI to AD over 3 years: An 11C-PIB PET study. Neurology 2009, 73, 754–760. [Google Scholar] [CrossRef] [Green Version]
- Forsberg, A.; Engler, H.; Almkvist, O.; Blomquist, G.; Hagman, G.; Wall, A.; Ringheim, A.; Langstrom, B.; Nordberg, A. PET imaging of amyloid deposition in patients with mild cognitive impairment. Neurobiol. Aging 2008, 29, 1456–1465. [Google Scholar] [CrossRef]
- Roberts, R.O.; Aakre, J.A.; Kremers, W.K.; Vassilaki, M.; Knopman, D.S.; Mielke, M.M.; Alhurani, R.; Geda, Y.E.; Machulda, M.M.; Coloma, P.; et al. Prevalence and Outcomes of Amyloid Positivity Among Persons without Dementia in a Longitudinal, Population-Based Setting. JAMA Neurol. 2018, 75, 970–979. [Google Scholar] [CrossRef]
- Ten Kate, M.; Redolfi, A.; Peira, E.; Bos, I.; Vos, S.J.; Vandenberghe, R.; Gabel, S.; Schaeverbeke, J.; Scheltens, P.; Blin, O.; et al. MRI predictors of amyloid pathology: Results from the EMIF-AD Multimodal Biomarker Discovery study. Alzheimer’s Res. Ther. 2018, 10, 100. [Google Scholar] [CrossRef]
- Yu, M.; Sporns, O.; Saykin, A.J. The human connectome in Alzheimer disease—relationship to biomarkers and genetics. Nat. Rev. Neurol. 2021, 17, 545–563. [Google Scholar] [CrossRef]
- Honey, C.J.; Sporns, O.; Cammoun, L.; Gigandet, X.; Thiran, J.P.; Meuli, R.; Hagmann, P. Predicting human resting-state functional connectivity from structural connectivity. Proc. Natl. Acad. Sci. USA 2009, 106, 2035–2040. [Google Scholar] [CrossRef] [Green Version]
- Honey, C.J.; Thivierge, J.P.; Sporns, O. Can structure predict function in the human brain? Neuroimage 2010, 52, 766–776. [Google Scholar] [CrossRef]
- Zhang, Z.; Liao, W.; Chen, H.; Mantini, D.; Ding, J.R.; Xu, Q.; Wang, Z.; Yuan, C.; Chen, G.; Jiao, Q.; et al. Altered functional-structural coupling of large-scale brain networks in idiopathic generalized epilepsy. Brain 2011, 134, 2912–2928. [Google Scholar] [CrossRef] [Green Version]
- Baum, G.L.; Cui, Z.; Roalf, D.R.; Ciric, R.; Betzel, R.F.; Larsen, B.; Cieslak, M.; Cook, P.A.; Xia, C.H.; Moore, T.M.; et al. Development of structure-function coupling in human brain networks during youth. Proc. Natl. Acad. Sci. USA 2020, 117, 771–778. [Google Scholar] [CrossRef] [Green Version]
- Zhang, R.; Shao, R.; Xu, G.; Lu, W.; Zheng, W.; Miao, Q.; Chen, K.; Gao, Y.; Bi, Y.; Guan, L.; et al. Aberrant brain structural-functional connectivity coupling in euthymic bipolar disorder. Hum. Brain Mapp. 2019, 40, 3452–3463. [Google Scholar] [CrossRef]
- Zarkali, A.; McColgan, P.; Leyland, L.A.; Lees, A.J.; Rees, G.; Weil, R.S. Organisational and neuromodulatory underpinnings of structural-functional connectivity decoupling in patients with Parkinson’s disease. Commun. Biol. 2021, 4, 86. [Google Scholar] [CrossRef]
- Koubiyr, I.; Besson, P.; Deloire, M.; Charre-Morin, J.; Saubusse, A.; Tourdias, T.; Brochet, B.; Ruet, A. Dynamic modular-level alterations of structural-functional coupling in clinically isolated syndrome. Brain 2019, 142, 3428–3439. [Google Scholar] [CrossRef]
- Sun, Y.; Yin, Q.; Fang, R.; Yan, X.; Wang, Y.; Bezerianos, A.; Tang, H.; Miao, F.; Sun, J. Disrupted functional brain connectivity and its association to structural connectivity in amnestic mild cognitive impairment and Alzheimer’s disease. PLoS ONE 2014, 9, e96505. [Google Scholar] [CrossRef] [Green Version]
- Bao, Y.W.; Chau, A.C.M.; Chiu, P.K.; Shea, Y.F.; Kwan, J.S.K.; Chan, F.H.W.; Mak, H.K. Heterogeneity of Amyloid Binding in Cognitively Impaired Patients Consecutively Recruited from a Memory Clinic: Evaluating the Utility of Quantitative 18F-Flutemetamol PET-CT in Discrimination of Mild Cognitive Impairment from Alzheimer’s Disease and Other Dementias. J. Alzheimer’s Dis. 2021, 79, 819–832. [Google Scholar] [CrossRef]
- Wong, A.; Xiong, Y.Y.; Kwan, P.W.; Chan, A.Y.; Lam, W.W.; Wang, K.; Chu, W.C.; Nyenhuis, D.L.; Nasreddine, Z.; Wong, L.K.; et al. The validity, reliability and clinical utility of the Hong Kong Montreal Cognitive Assessment (HK-MoCA) in patients with cerebral small vessel disease. Dement. Geriatr. Cogn. Disord. 2009, 28, 81–87. [Google Scholar] [CrossRef]
- Fazekas, F.; Chawluk, J.B.; Alavi, A.; Hurtig, H.I.; Zimmerman, R.A. MR signal abnormalities at 1.5 T in Alzheimer’s dementia and normal aging. AJR Am. J. Roentgenol. 1987, 149, 351–356. [Google Scholar] [CrossRef] [Green Version]
- Petersen, R.C.; Smith, G.E.; Waring, S.C.; Ivnik, R.J.; Tangalos, E.G.; Kokmen, E. Mild cognitive impairment: Clinical characterization and outcome. Arch. Neurol. 1999, 56, 303–308. [Google Scholar] [CrossRef]
- McKhann, G.M.; Knopman, D.S.; Chertkow, H.; Hyman, B.T.; Jack, C.R., Jr.; Kawas, C.H.; Klunk, W.E.; Koroshetz, W.J.; Manly, J.J.; Mayeux, R.; et al. The diagnosis of dementia due to Alzheimer’s disease: Recommendations from the National Institute on Aging-Alzheimer’s Association workgroups on diagnostic guidelines for Alzheimer’s disease. Alzheimer’s Dement. 2011, 7, 263–269. [Google Scholar] [CrossRef] [Green Version]
- Vandenberghe, R.; Van Laere, K.; Ivanoiu, A.; Salmon, E.; Bastin, C.; Triau, E.; Hasselbalch, S.; Law, I.; Andersen, A.; Korner, A.; et al. 18F-flutemetamol amyloid imaging in Alzheimer disease and mild cognitive impairment: A phase 2 trial. Ann. Neurol. 2010, 68, 319–329. [Google Scholar] [CrossRef]
- Buckley, C.J.; Sherwin, P.F.; Smith, A.P.; Wolber, J.; Weick, S.M.; Brooks, D.J. Validation of an electronic image reader training programme for interpretation of [18F]flutemetamol beta-amyloid PET brain images. Nucl. Med. Commun. 2017, 38, 234–241. [Google Scholar] [CrossRef] [Green Version]
- Tzourio-Mazoyer, N.; Landeau, B.; Papathanassiou, D.; Crivello, F.; Etard, O.; Delcroix, N.; Mazoyer, B.; Joliot, M. Automated anatomical labeling of activations in SPM using a macroscopic anatomical parcellation of the MNI MRI single-subject brain. Neuroimage 2002, 15, 273–289. [Google Scholar] [CrossRef]
- Ashburner, J. A fast diffeomorphic image registration algorithm. Neuroimage 2007, 38, 95–113. [Google Scholar] [CrossRef]
- Friston, K.J.; Williams, S.; Howard, R.; Frackowiak, R.S.; Turner, R. Movement-related effects in fMRI time-series. Magn. Reason. Med. 1996, 35, 346–355. [Google Scholar] [CrossRef]
- Fox, M.D.; Zhang, D.; Snyder, A.Z.; Raichle, M.E. The global signal and observed anticorrelated resting state brain networks. J. Neurophysiol. 2009, 101, 3270–3283. [Google Scholar] [CrossRef] [Green Version]
- Zuo, X.N.; Ehmke, R.; Mennes, M.; Imperati, D.; Castellanos, F.X.; Sporns, O.; Milham, M.P. Network centrality in the human functional connectome. Cereb. Cortex 2012, 22, 1862–1875. [Google Scholar] [CrossRef] [PubMed]
- Millar, P.R.; Ances, B.M.; Gordon, B.A.; Benzinger, T.L.S.; Fagan, A.M.; Morris, J.C.; Balota, D.A. Evaluating resting-state BOLD variability in relation to biomarkers of preclinical Alzheimer’s disease. Neurobiol. Aging 2020, 96, 233–245. [Google Scholar] [CrossRef] [PubMed]
- Jones, D.T.; Knopman, D.S.; Gunter, J.L.; Graff-Radford, J.; Vemuri, P.; Boeve, B.F.; Petersen, R.C.; Weiner, M.W.; Jack, C.R., Jr.; Alzheimer’s Disease Neuroimaging Initiative. Cascading network failure across the Alzheimer’s disease spectrum. Brain 2016, 139, 547–562. [Google Scholar] [CrossRef] [PubMed]
- Alexander-Bloch, A.; Giedd, J.N.; Bullmore, E. Imaging structural co-variance between human brain regions. Nat. Rev. Neurosci. 2013, 14, 322–336. [Google Scholar] [CrossRef] [Green Version]
- Voevodskaya, O.; Pereira, J.B.; Volpe, G.; Lindberg, O.; Stomrud, E.; van Westen, D.; Westman, E.; Hansson, O. Altered structural network organization in cognitively normal individuals with amyloid pathology. Neurobiol. Aging 2018, 64, 15–24. [Google Scholar] [CrossRef]
- Prescott, J.W.; Guidon, A.; Doraiswamy, P.M.; Roy Choudhury, K.; Liu, C.; Petrella, J.R.; Alzheimer’s Disease Neuroimaging Initiative. The Alzheimer structural connectome: Changes in cortical network topology with increased amyloid plaque burden. Radiology 2014, 273, 175–184. [Google Scholar] [CrossRef] [Green Version]
- Gu, Z.; Jamison, K.W.; Sabuncu, M.R.; Kuceyeski, A. Heritability and interindividual variability of regional structure-function coupling. Nat. Commun. 2021, 12, 4894. [Google Scholar] [CrossRef]
- Gordon, B.A.; Blazey, T.M.; Su, Y.; Hari-Raj, A.; Dincer, A.; Flores, S.; Christensen, J.; McDade, E.; Wang, G.; Xiong, C.; et al. Spatial patterns of neuroimaging biomarker change in individuals from families with autosomal dominant Alzheimer’s disease: A longitudinal study. Lancet Neurol. 2018, 17, 241–250. [Google Scholar] [CrossRef] [Green Version]
- Benzinger, T.L.; Blazey, T.; Jack, C.R., Jr.; Koeppe, R.A.; Su, Y.; Xiong, C.; Raichle, M.E.; Snyder, A.Z.; Ances, B.M.; Bateman, R.J.; et al. Regional variability of imaging biomarkers in autosomal dominant Alzheimer’s disease. Proc. Natl. Acad. Sci. USA 2013, 110, E4502–E4509. [Google Scholar] [CrossRef] [Green Version]
- Yu, M.; Engels, M.M.A.; Hillebrand, A.; van Straaten, E.C.W.; Gouw, A.A.; Teunissen, C.; van der Flier, W.M.; Scheltens, P.; Stam, C.J. Selective impairment of hippocampus and posterior hub areas in Alzheimer’s disease: An MEG-based multiplex network study. Brain 2017, 140, 1466–1485. [Google Scholar] [CrossRef]
- Buckner, R.L.; Sepulcre, J.; Talukdar, T.; Krienen, F.M.; Liu, H.; Hedden, T.; Andrews-Hanna, J.R.; Sperling, R.A.; Johnson, K.A. Cortical hubs revealed by intrinsic functional connectivity: Mapping, assessment of stability, and relation to Alzheimer’s disease. J. Neurosci. 2009, 29, 1860–1873. [Google Scholar] [CrossRef] [Green Version]
- Schultz, A.P.; Chhatwal, J.P.; Hedden, T.; Mormino, E.C.; Hanseeuw, B.J.; Sepulcre, J.; Huijbers, W.; LaPoint, M.; Buckley, R.F.; Johnson, K.A.; et al. Phases of Hyperconnectivity and Hypoconnectivity in the Default Mode and Salience Networks Track with Amyloid and Tau in Clinically Normal Individuals. J. Neurosci. 2017, 37, 4323–4331. [Google Scholar] [CrossRef]
- Cao, R.; Wang, X.; Gao, Y.; Li, T.; Zhang, H.; Hussain, W.; Xie, Y.; Wang, J.; Wang, B.; Xiang, J. Abnormal Anatomical Rich-Club Organization and Structural-Functional Coupling in Mild Cognitive Impairment and Alzheimer’s Disease. Front. Neurol. 2020, 11, 53. [Google Scholar] [CrossRef]
- Wang, J.; Khosrowabadi, R.; Ng, K.K.; Hong, Z.; Chong, J.S.X.; Wang, Y.; Chen, C.Y.; Hilal, S.; Venketasubramanian, N.; Wong, T.Y.; et al. Alterations in Brain Network Topology and Structural-Functional Connectome Coupling Relate to Cognitive Impairment. Front. Aging Neurosci. 2018, 10, 404. [Google Scholar] [CrossRef]
- Dai, Z.; Lin, Q.; Li, T.; Wang, X.; Yuan, H.; Yu, X.; He, Y.; Wang, H. Disrupted structural and functional brain networks in Alzheimer’s disease. Neurobiol. Aging 2019, 75, 71–82. [Google Scholar] [CrossRef]
- Huijbers, W.; Schultz, A.P.; Papp, K.V.; LaPoint, M.R.; Hanseeuw, B.; Chhatwal, J.P.; Hedden, T.; Johnson, K.A.; Sperling, R.A. Tau Accumulation in Clinically Normal Older Adults Is Associated with Hippocampal Hyperactivity. J. Neurosci. 2019, 39, 548–556. [Google Scholar] [CrossRef] [Green Version]
- Franzmeier, N.; Rubinski, A.; Neitzel, J.; Kim, Y.; Damm, A.; Na, D.L.; Kim, H.J.; Lyoo, C.H.; Cho, H.; Finsterwalder, S.; et al. Functional connectivity associated with tau levels in ageing, Alzheimer’s, and small vessel disease. Brain 2019, 142, 1093–1107. [Google Scholar] [CrossRef]
- Hatashita, S.; Wakebe, D. Amyloid-beta Deposition and Long-Term Progression in Mild Cognitive Impairment due to Alzheimer’s Disease Defined with Amyloid PET Imaging. J. Alzheimer’s Dis. 2017, 57, 765–773. [Google Scholar] [CrossRef]


| HC | MCI_Aβ- | MCI_Aβ+ | AD | p-Value | |
|---|---|---|---|---|---|
| Final sample size (n) ^ | 12 | 21 | 11 | 12 | - |
| Age range | 54.0 ± 16.8 a,b,c | 75.9 ± 7.0 a | 74.5 ± 7.6 b | 74.5 ± 8.7 c | <0.001 |
| Sex (female/male) | 7/5 | 11/10 | 7/4 | 7/5 | 0.94 |
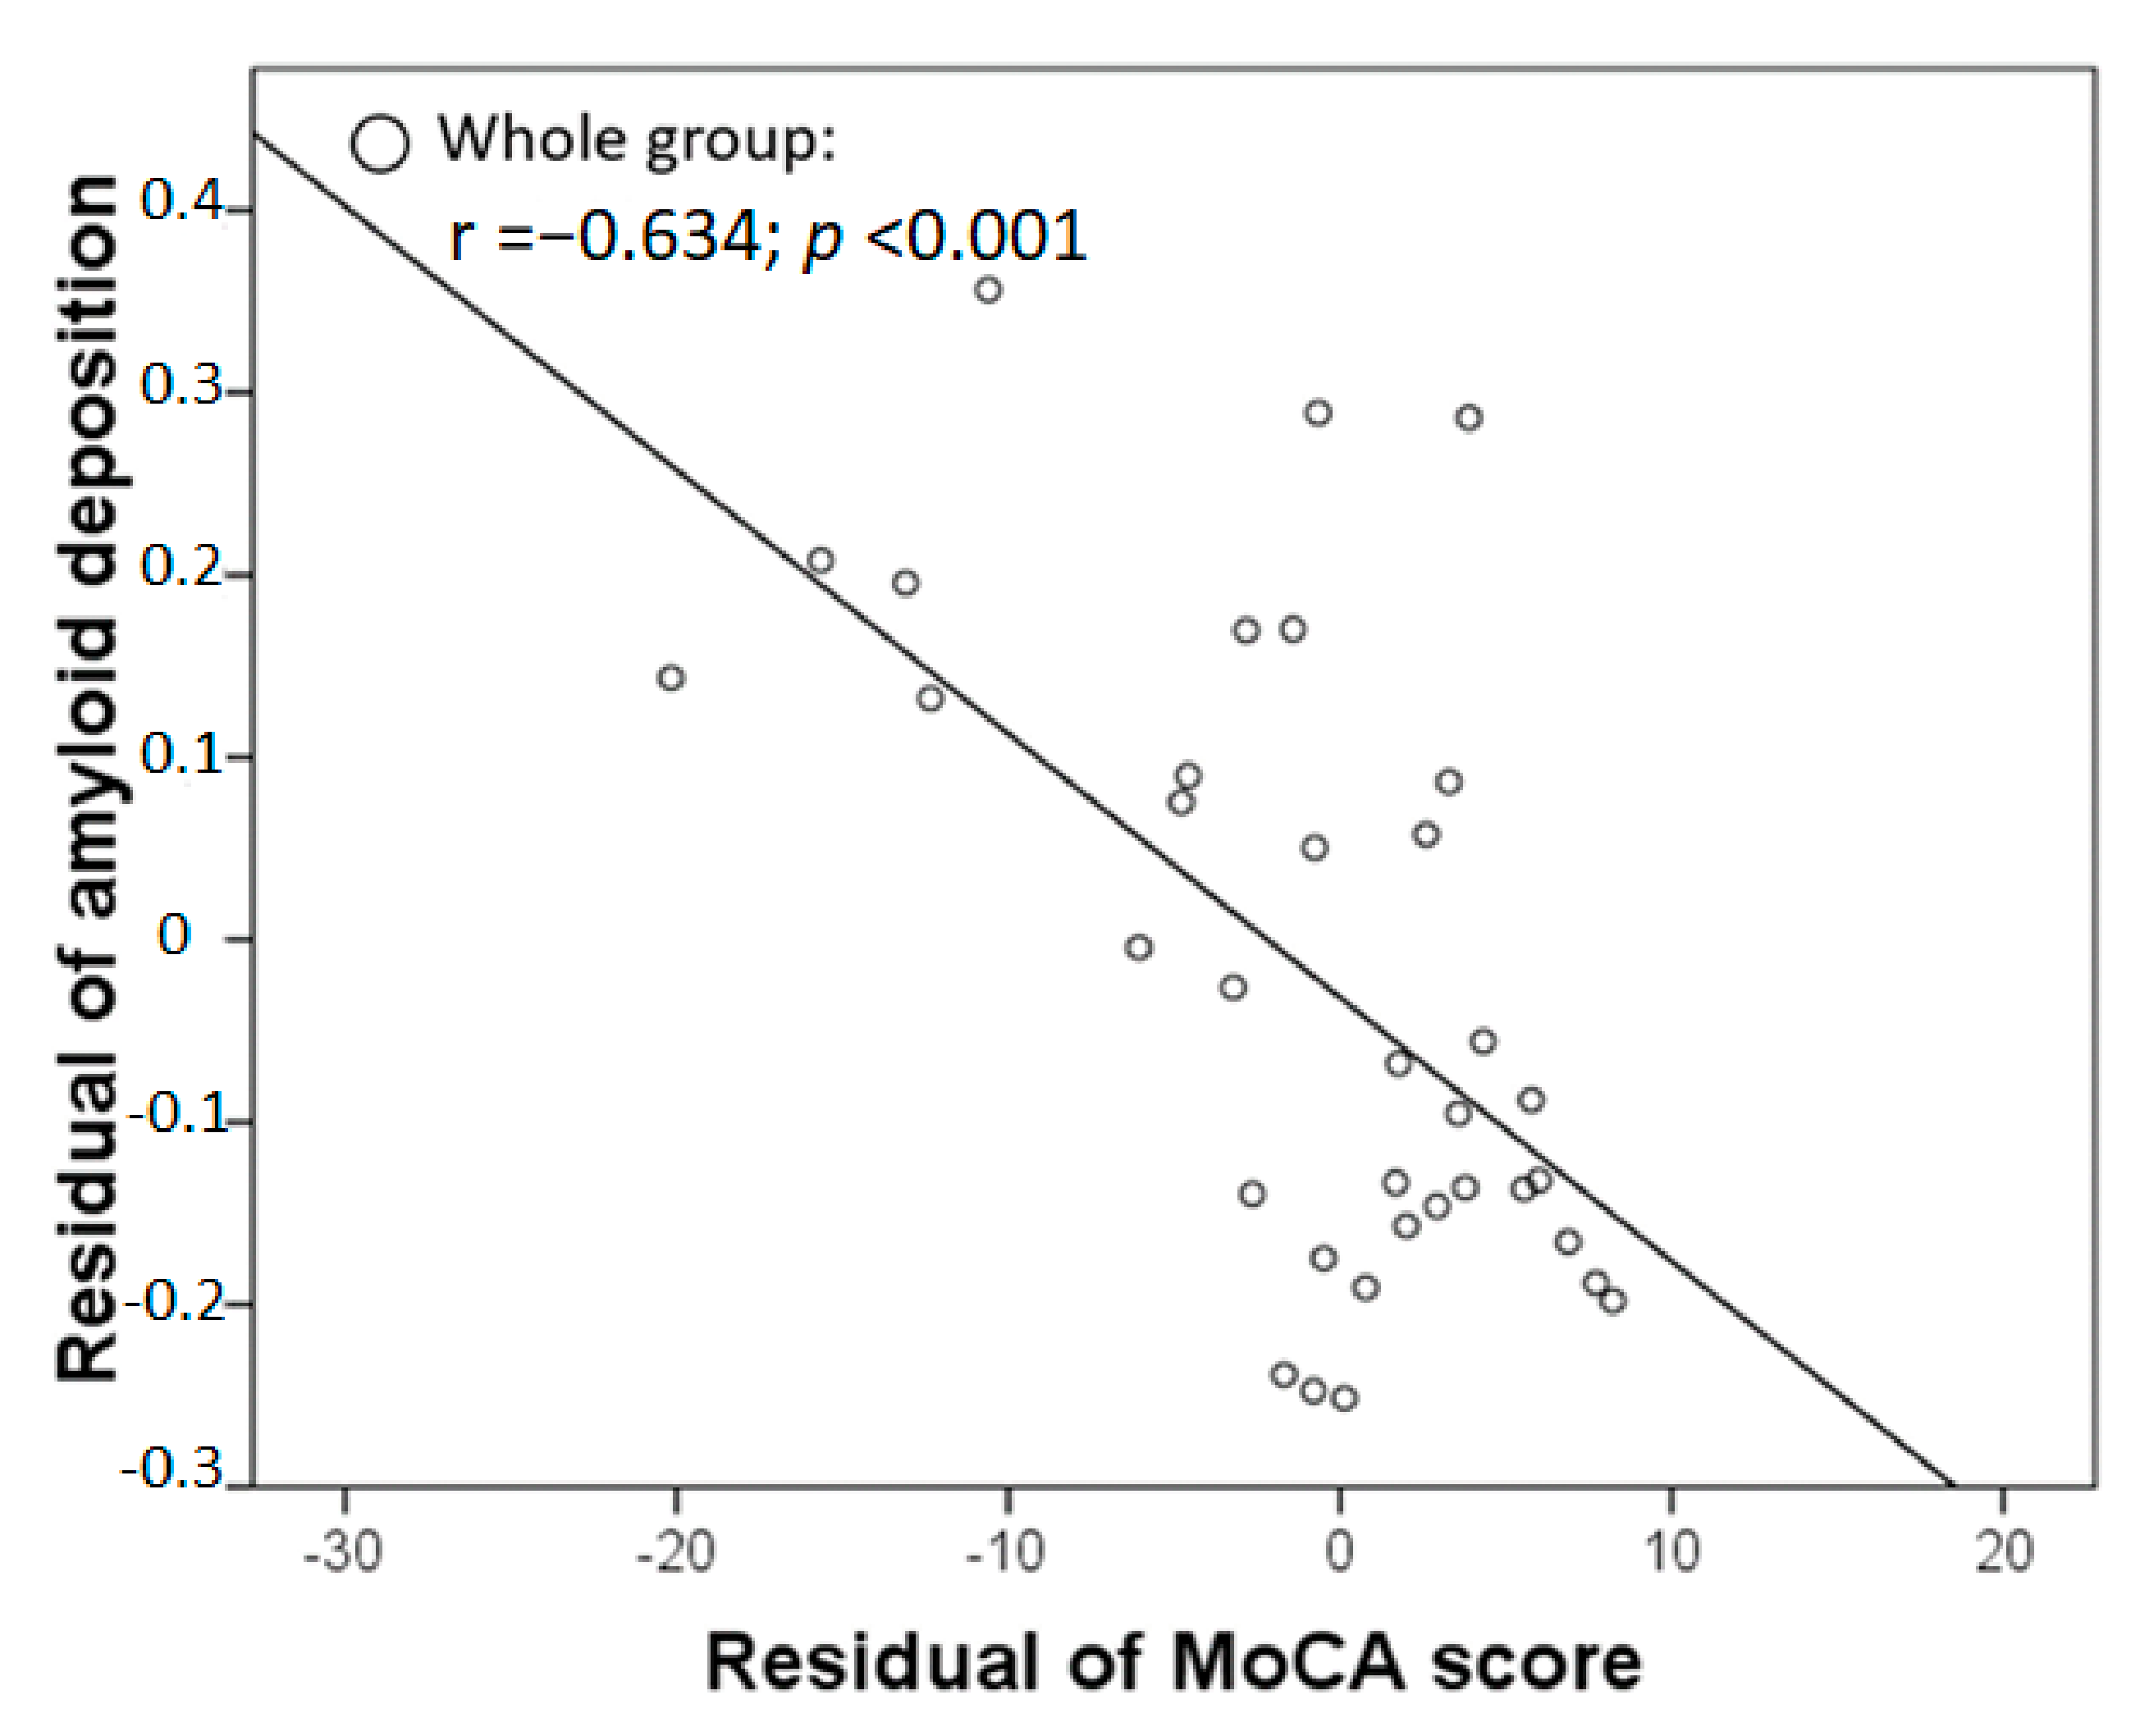
| HK-MoCA | 28.7 ± 1.3 d,e,f (n = 12) | 23.0 ± 3.2 d,g (n = 19) | 19.0 ± 4.3 e (n = 7) | 12.0 ± 7.6 fg (n = 9) | <0.001 |
| Fazekas Scale | 0.58 ± 0.67 h,i,j | 3.95 ± 1.28 h | 3.64 ± 1.80 i | 3.00 ± 1.65 j | <0.001 |
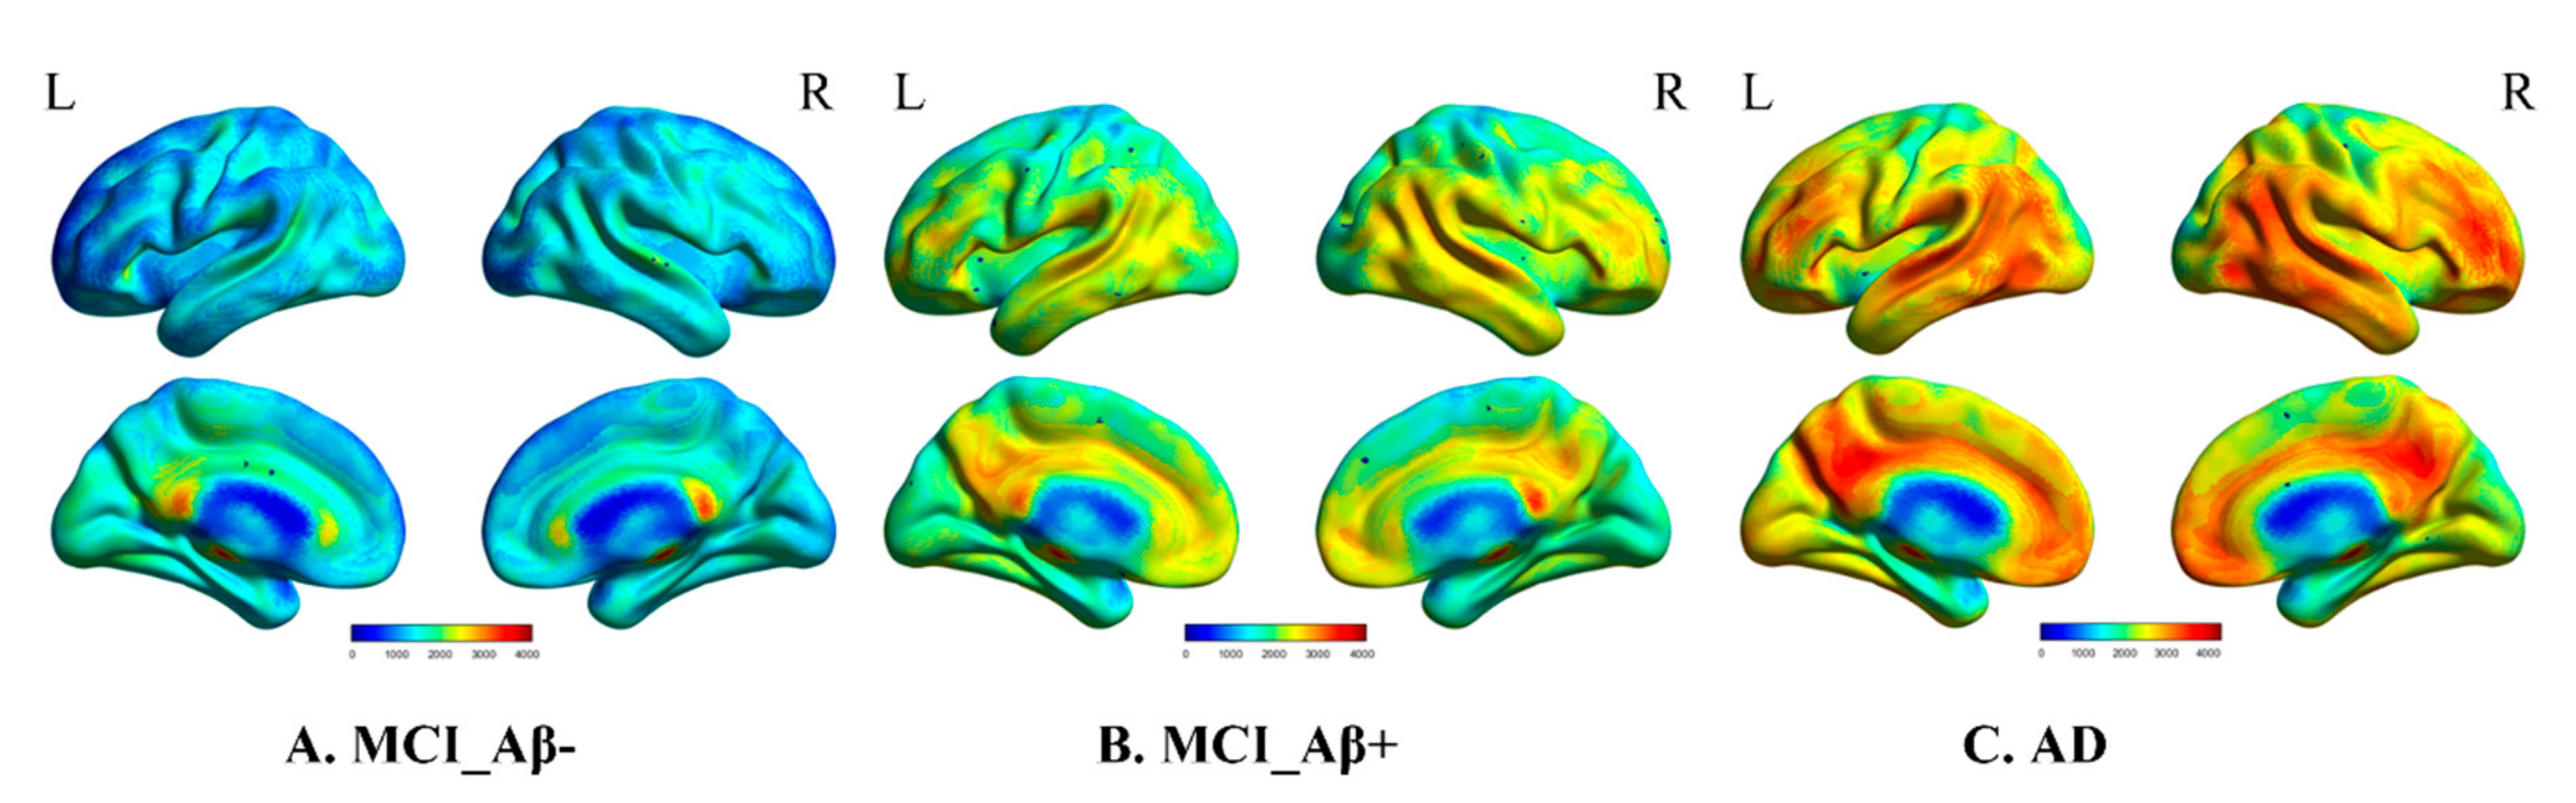
| Aβ deposition | - | 0.42 ± 0.04 k,l | 0.71 ± 0.12 k | 0.78 ± 0.10 l | <0.001 |
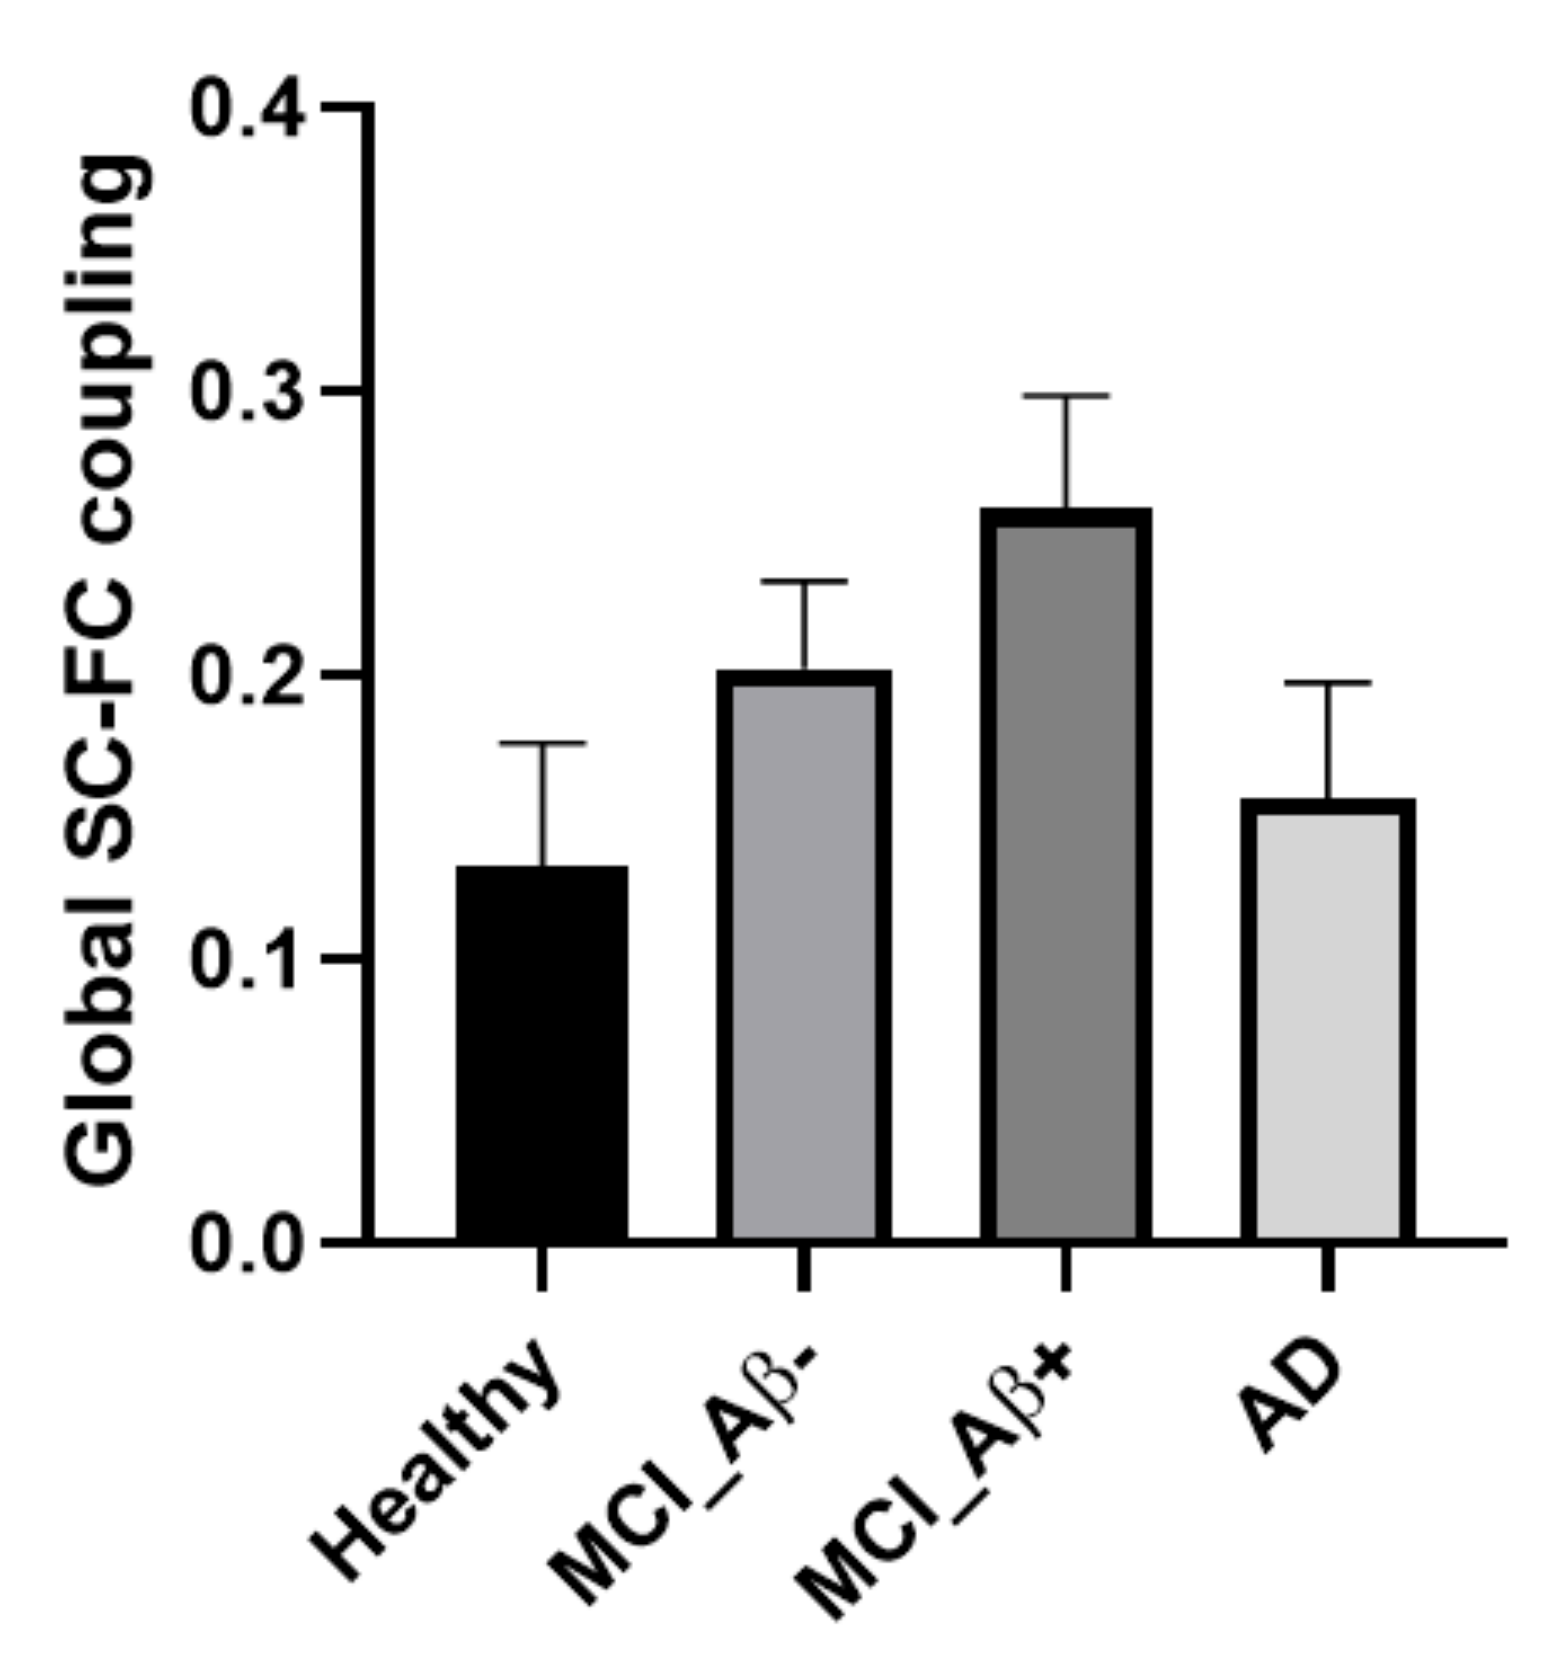
| Global SC-FC coupling | 0.13 ± 0.04 | 0.20 ± 0.03 | 0.26 ± 0.04 | 0.16 ± 0.04 | 0.16 |
Publisher’s Note: MDPI stays neutral with regard to jurisdictional claims in published maps and institutional affiliations. |
© 2021 by the authors. Licensee MDPI, Basel, Switzerland. This article is an open access article distributed under the terms and conditions of the Creative Commons Attribution (CC BY) license (https://creativecommons.org/licenses/by/4.0/).
Share and Cite
Zhang, H.; Hui, E.S.; Cao, P.; Mak, H.K.F. Relationship between Amyloid-β Deposition and the Coupling between Structural and Functional Brain Networks in Patients with Mild Cognitive Impairment and Alzheimer’s Disease. Brain Sci. 2021, 11, 1535. https://0-doi-org.brum.beds.ac.uk/10.3390/brainsci11111535
Zhang H, Hui ES, Cao P, Mak HKF. Relationship between Amyloid-β Deposition and the Coupling between Structural and Functional Brain Networks in Patients with Mild Cognitive Impairment and Alzheimer’s Disease. Brain Sciences. 2021; 11(11):1535. https://0-doi-org.brum.beds.ac.uk/10.3390/brainsci11111535
Chicago/Turabian StyleZhang, Hui, Edward S. Hui, Peng Cao, and Henry K. F. Mak. 2021. "Relationship between Amyloid-β Deposition and the Coupling between Structural and Functional Brain Networks in Patients with Mild Cognitive Impairment and Alzheimer’s Disease" Brain Sciences 11, no. 11: 1535. https://0-doi-org.brum.beds.ac.uk/10.3390/brainsci11111535