1. Introduction
1.1. GHG Emissions along the Life Cycle of Buildings
Climate change is one of the most challenging science and policy issues of the current time, the negative effects of which are driven by constantly increasing emissions of anthropogenic greenhouse gases (GHGs). The importance of reducing GHG emissions is a subject of numerous global commitments [
1] and is globally recognised in the Sustainable Development Goals [
2]. The building and construction sector plays a key role in global climate change, contributing about 39% of GHG emissions [
3,
4]. These emissions could potentially increase threefold by 2060 due to the increased need for adequate housing, electricity and improved facilities for billions of people in developing economies of the Global South [
5]. In the past, the assessment of building energy use and related GHG emissions was mainly focused on the energy used for operation [
6,
7,
8]. So-called embodied GHG emissions, which are associated with construction material production, construction and transport processes, maintenance and replacement and end-of-life treatment, were hardly considered. However, as recent studies have shown, the success in reducing operational energy demand and related GHG emissions through increased energy efficiency of building envelopes and building systems has been accompanied by an increase in embodied GHG emissions in both relative and absolute terms [
9]. Hence, to effectively reduce global energy use and GHG emissions by buildings and construction, a life cycle perspective is required when analysing and optimising buildings [
10]. Hence, environmental targets such as “carbon budgets” are increasingly being formulated for building construction and operation [
11].
Existing studies analysing energy and GHG emissions across the life cycle of buildings provide insights for residential and office buildings but are limited in their geographic scope, i.e., the climate regions studied (
Table 1). One study [
12] showed that the primary life cycle energy of buildings could mostly be attributed to operational use (80–90% share), compared to a much smaller share (10–20%) related to embodied energy. The results of a review [
13] indicated that life cycle GHG emissions are lower in passive and low-energy types of buildings, in comparison to buildings with conventional energy. Another review [
14] indicated that the existing literature dealing with life cycle assessment and energy analysis was difficult to compare due to the specific type, climate and local regulations of building-based case studies. These studies were not equally distributed in the world; only a few studies were located in tropical or humid subtropical climate areas. Similar findings can be found in [
15], suggesting that most of the investigated case studies did not consider the site specificity or geographic and climatic site conditions, which produced vast differences in the results.
Additionally, several studies indicate that life cycle assessment (LCA) calculation assumptions and calculation methods differ significantly depending on the specific research approach, leading to differences in the results and increased uncertainty in the analyses [
8,
13,
16,
17,
18]. The use of different functional units, system boundaries or methodological frameworks may result in uncertainty in life cycle assessment as a decision-making support tool for building design or policymaking processes [
14,
19]. A meta-study [
9] reviewed more than 650 building LCA case studies to analyse life cycle-related GHG emissions. In that study, the authors showed, based on the final data sample consisting of 238 case studies, that building life cycle GHG emissions are decreasing due to energy efficiency improvements. However, it was found that embodied GHG emissions have increased in both relative and absolute terms and are dominating the time frame relevant to reaching climate targets. While this study provides crucial insights into building life cycle-related GHG emissions, it is also limited in its geographic scope to cases from temperate and continental climate regions.
1.2. Research Gap for Warm and Humid Climate Zones
As presented in the previous sections, and summarised in
Table 1, the existing body of literature mostly analysed buildings located in cold and temperate climates. Hence, there is a research gap regarding GHG emissions across the life cycle of buildings located in warm and humid, subtropical and tropical climate regions. This gap in the literature is appalling, considering the geographic extent of these climate regions and the number of people inhabiting them. By 2060, more than half of new residential buildings are expected to be constructed, with remarkably rapid growth, in Africa, Asia and Latin America, regions that have humid subtropical and tropical climates [
20].
The importance of studying buildings in these regions is further emphasised, as warm climates are nearly twice as sensitive to local temperature changes due to global heating and, hence, more affected by related harmful effects than cold or temperate climate regions [
21]. Consequently, there is an urgent need to address environmental impacts related to the rapid growth of buildings in these regions, especially in the residential construction sector, by implementing building design strategies that enable significant reduction of GHG emissions.
1.3. Research Questions
This paper studies GHG emissions profiles and design strategies for reducing GHG emissions of residential buildings in humid subtropical and tropical climates based on a systematic review and analysis of published building LCA studies. The selected studies assess both embodied and operational GHG emissions, i.e., GHG emissions across the full building life cycle. The two main research questions guiding this study are the following:
What is the current state of life cycle GHG emissions of residential buildings in tropical and subtropical climate regions?
Which building design strategies are effective for reducing both operational and embodied GHG emissions for residential buildings in the selected regions?
The primary target audience of this paper is building design professionals interested in investigating the relevant drivers of and effective strategies for reducing life cycle-related GHG emissions of residential buildings in humid subtropical and tropical climates.
2. Materials and Methods
2.1. Data Collection
The analysis presented in this paper is based on a systematic review of the scientific literature [
22]. In order to be transparent and reproducible, the systematic literature review (SLR) follows a step-by-step approach.
First, based on the formulated research question(s), a set of keywords is defined for searching the scientific databases. Second, all of the studies identified through the database search are screened for their relevance to the research question(s) and excluded if they are out of scope. In the first exclusion phase, studies are screened based on their title and, in the second phase, based on the abstract. In the third phase, the remaining studies are analysed in full. In this phase, the information relevant to the research question(s) is systematically extracted and documented for further analysis.
The details of the procedure applied in this study are described in the following and graphically presented in
Figure 1. Based on the research questions (previous section), the keyword string was defined as: (LCA OR life cycle assessment AND residential* AND warm climate). The database search was conducted using Scopus, searching abstract, title and keywords, limited to articles in the English language and excluding grey literature (books, theses, etc.). The search was conducted on 5 October 2020.
The initial sample of 332 articles was screened and excluded by title, reducing it to 108 articles. Screening and exclusion by abstract led to a selection of 79 articles presenting 126 case studies for full-paper analysis. The full-paper analysis and data extraction included documentation of metadata and methodological and building-oriented features (
Section 2.2).
The collection of 31 articles identified as relevant after the full-paper analysis was used as a base to perform a complementary snowballing procedure [
23]. In addition, another six articles describing 13 case studies were identified as relevant to the research based on the screened literature. The final data sample consists of 37 articles representing life cycle GHG emission assessments of 75 case studies of residential buildings operating in humid subtropical or tropical climates.
The articles were published between 2004 and 2018. This collection serves as the base sample, the basis of the data extraction process and analysis presented in the following chapters. The data collection procedure is similar to the approach proposed by Röck et al. [
9]. However, a specific focus on prevailing climate conditions in this research resulted in the collection of 24 articles covering 47 case studies that were not taken into consideration in the previous analysis.
2.2. Data Extraction Features
Articles in the base sample were analysed based on the full paper to extract data on building-related features, as well as methodological aspects that could significantly influence the value and comparability of life cycle GHG emissions results. An overview of selected criteria documented for the collected studies is presented in
Table 2.
The overview of the methodological and building-related features among 75 case studies (base sample) is presented in
Appendix A,
Table A1 and
Table A2, respectively. All case study buildings have been assigned with a unique ID, noted in the following text (see
Table A1 for details).
3. Meta-Analysis and Data Harmonisation
3.1. Meta-Analysis of the Data Sample
Information was extracted from the studies in the data sample based on the defined features and analysed to prepare for the harmonisation in the next step. Similarities and differences in building-related and methodological characteristics were investigated within a comprehensive meta-analysis, which is available in
Appendix A.
Selected findings are presented below.
3.1.1. Geographic Location of Case Studies
Studies in the final sample span of 75 case studies within 13 countries (
Table 3). Most of the case studies (49) are in Asia, followed by Oceania (18), South America (4) and North America (4).
3.1.2. System Boundaries
A detailed analysis of life cycle processes and stages among the case study sample can be found in
Appendix A (
Table A3). That analysis indicates that, among the 75 case studies, 60 are characterised by cradle-to-grave system boundaries. Moreover, an in-depth analysis of the energy use stage module (B6) scope shows that the complete coverage of building energy use from space heating, ventilation, space cooling, domestic hot water production, lighting and appliances is present in 55 case studies. The simplification and minimisation of system boundaries while omitting some building life cycle processes can lead to differences in estimated life cycle GHG emissions [
13,
17].
The discussion about this issue based on the analysed collection of case studies is presented in
Appendix B.1.1.
3.1.3. Main Structural Materials
The primary structural material of case study buildings varies between timber, steel, concrete, reinforced concrete, masonry (brick), stone, mud and different combinations of these (
Figure 2). Reinforced concrete is the most common material, followed by timber and concrete.
3.1.4. GHG Emissions from Electricity Mix
Regarding the analysed case buildings, the value of the GHG emission factor of electricity is clearly stated in 37 case studies (
Figure 3) and varies from 0.23 kgCO
2eq/kWh in Colombia (CS22CO) to 1.20 kgCO
2eq/kWh in China (CS27CN). In other studies, the GHG emission factor of the local electricity mix is not documented, leading to difficulties in interpreting the results. Additionally, only eight case studies, CS1-2AU, CS22CO, CS27CN and CS33-36CN, clearly define the system boundaries of the presented GHG emission electricity factor that consider both direct and indirect emissions from electricity generation and transportation.
The GHG emissions factor of the electricity grid is the highest in Australia, China, Hong Kong, Malaysia and Thailand, where the energy mix is mostly based on fossil fuels, with a dominant share of coal or lignite. GHG emissions from the electricity grid are decreasing in countries like Japan and South Korea, where the energy mix is based on a dominant share of nuclear energy sources, and is the lowest in Brazil and Columbia, characterised by an energy mix based on renewable energy sources (
Figure 3).
The use of scientifically unconfirmed electricity GHG emission factors can lead to unreliability of the whole life cycle GHG assessment. The analysis of CS29CN indicates that the electricity GHG emission factor of 0.54 kgCO
2eq/kWh is not reliable for the energy mix in Nanjing, China, which is dominated by hard coal and presents significantly higher values of GHG emissions [
24,
25].
3.2. Harmonisation of GHG Emission Values
The preliminary examination of assessment methods showed the need for harmonisation of life cycle GHG emissions results from the different case studies to allow comparisons. Hence, as shown in
Figure 4, a two-step harmonisation procedure was applied to normalise the reference study period (RSP) and to ensure consistency of system boundaries, amongst other aspects.
In the first harmonisation step, the cases were: (i) checked for compliance with the necessary inclusion of the main LCA phases based on the ISO14040/14044 standards and (ii) harmonised to a 50-year RSP and the reference unit of kgCO
2eq/m
2 gross floor area (GFA) by using Equation (1):
where
is the harmonised life cycle GHG emissions value after the 50-year normalisation (kgCO
2eq/m
2 RSP=50years), GHG is life cycle GHG emissions before harmonisation extracted from full-paper analyses (kgCO
2eq/m
2) and RSP is the reference study period considered in the analysed case study. The choice of the RSP relates to the predominant choice of building lifetime among the collected data sample, in which nearly 60% of case studies employ a 50-year time frame (
Figure A4 in
Appendix B.2.2).
The second harmonisation step (i) excluded all case studies in which the system boundaries did not follow the cradle-to-grave definition; (ii) limited studies to those for which the operational energy stage (B6) incorporated all building energy connected with space heating, cooling, ventilation, domestic hot water and lighting/appliances; (iii) limited studies to only standard residential building typology (excluding temporary housing type) and (iv) excluded case studies in which the methodology regarding the operational energy use assessment was not transparent.
Consequently, the sample used for the final analysis consisted of 20 articles describing 36 case studies, the locations of which are presented in
Figure 5.
4. Analysis of Life Cycle GHG Emissions and Relevant Features
4.1. Embodied and Life Cycle GHG Emissions Results
The performed harmonisation allowed a substantial reduction in the variation in life cycle GHG emissions results (see
Appendix C) and enabled a comparison of the harmonised results in the final data sample (36 case studies), which is presented in this section.
As shown in
Figure 6, the lowest value of life cycle GHG emissions is 491 kgCO
2eq/m
2 in CS69TH, and the highest is 4811 kgCO
2eq/m
2 in CS27CN. The variation of embodied GHG emissions ranges from 122 kgCO
2eq/m
2 in the timber-based structure CS54JP to 2103 kgCO
2eq/m
2 in CS31CN, which is based on the aluminium frame structure. The GHG emissions related to the operational energy used varied from 0 kgCO
2eq/m
2 in the zero energy buildings CS19BR, CS67 and 69TH to 3956 kgCO
2eq/m
2 in highly energy-intensive building CS37-38HK. The main causes of such a large range are related to the buildings’ energy performances and the GHG emission intensity of electricity from the local grid.
The range of harmonised GHG emissions from 36 residential buildings analysed in the current review is similar to that of another study [
13], whose data sample consisted of 31 residential case studies mainly located in temperate climates. In that study, the range of total GHG emissions varied between 518 and 4475 kgCO
2eq/m
2. However, an in-depth comparison between review articles indicated a significant difference in the maximum value of the harmonised embodied GHG emissions range. In the comparative study, these emissions varied between 180 and 1050 kgCO
2eq/m
2. That difference is caused by the inclusion of CS31CN in the current review, whose high value of embodied GHG emission (2103 kgCO
2eq/m
2) is related to the combination of extensive use of photovoltaic (PV) systems characterised by high embodied GHG emission load and low floor area (30 m
2). The analysis of the results shows that the range of embodied GHG emissions (122–782 kgCO
2eq/m
2) defined by cradle-to-grave system boundaries related to single-family constructions operating in the developed economies of Australia, Japan and the US are comparable to the embodied GHG emissions (378–672 kgCO
2eq/m
2) presented in the International Energy Agency (IEA) Annex 57 report [
26].
4.2. Influence of Energy Performance
Determining the energy performance level of the case study buildings was required to examine the influence of energy efficiency on embodied and operational GHG emission values. The classification of energy performance of the buildings in this research was based on the passive and low energy standards of the Passive House Institute [
27], which are implemented globally in the residential construction sector. The definition of a low-energy building is based on a limit value of annual primary energy use related to heating, cooling, ventilation, domestic hot water and plug loads. However, in most of the 26 case studies, the annual energy use of the buildings was based on the final energy use. To overcome this limitation, the final energy use values were transformed into their primary form by implementing primary electricity conversion factors, which were obtained from existing research and local government reports [
28,
29,
30,
31,
32,
33]. As a result, the residential buildings CS20-21BR; CS22CO [
34]; CS31CN and CS65, 66 and 68TH were defined as low-energy, with the total annual primary operational energy use not exceeding 120 kWh/m
2a. The solar-powered houses CS67 and 69TH, with an annual renewable energy generation higher than the annual energy needs, are classified as net-zero energy buildings. The rest of the buildings, which did not fulfil the low or net-zero energy requirements, were defined as conventional type.
The results of the present study indicate the existence of different GHG emission trends related to the energy performance of buildings. Zero-energy buildings present the lowest total GHG emissions among all case studies considered (
Figure 7), with a 100% share of embodied to total GHG emission value (
Figure 8). Low-energy buildings present a percentage of embodied GHG emission of 20–56% (
Figure 8), except for CS31CN, which shows an extreme amount (82%) caused by the combination of extensive use of PV modules, aluminium-based construction characterised by high embodied GHG emissions load and low floor area (30 m
2).
Convectional residential buildings contribute to the highest total GHG emissions, which, on average, are 51% and 80% higher than low- and zero-energy buildings, respectively (
Figure 7). The observed share of embodied-to-total GHG emissions is between 12% and 38% (
Figure 8). The electricity factor of GHG emissions has a strong influence on the emission profile of buildings. This can be observed by comparing low-energy buildings (CS65, 66 and 68TH) in Thailand with low-energy houses (CS22CO and CS21BR) in Colombia and Brazil. These buildings present similar values of embodied GHG emissions (242–601 kgCO
2eq/m
2), as well as annual primary operational electricity use (69–102 kWh/m
2a). However, the difference in the electricity emission factor leads to high variations in the share of embodied-to-total GHG emissions, with a 20–29% share in buildings in Thailand and 41–56% share in single-family buildings in Colombia and Brazil, respectively.
4.3. Influence of Building Typology
To study the influence of different residential building types, we plotted the embodied, operational and life cycle GHG emission values for single-family (SF) and multi-family (MF) buildings (
Figure 9). The MF type is characterised by 40% higher total life cycle GHG emissions, on average, than the single-family type.
The variation in total life cycle GHG emissions is high in both residential building types, with MF ranging between 700 kgCO2eq/m2 (CS20BR) and 4811 kgCO2eq/m2 (CS27CN) and SF ranging between 491 kgCO2eq/m2 (CS69TH) and 4554 kgCO2eq/m2 (CS32).
Both types of residential construction present similar average values of embodied GHG emissions: 650 and 740 kgCO2eq/m2 for SF and MF, respectively. These results are similar to findings from the Base Carbone database, which investigates GHG emission profiles of residential buildings in France.
However, the multi-family type of building presents higher lower and upper limit values than a single-family type. This can be attributed to the inapplicability of timber-based structure and oversized reinforced concrete structure in high-rise multi-family buildings.
The main difference in total life cycle GHG emissions between residential building types is driven by operational GHG emissions, which, on average, are 78% higher in multi-family buildings. This is contrary to the findings from the US residential energy use survey in 2009 [
35] and a study by Obrinsky and Walter in 2016 [
36]. The main reason of this is that case studies of multi-family buildings included in the final sample are mostly based on existing stock and characterised by the “convectional” energy performance with the limited implementation of energy efficiency measures. This leads to twofold higher annual energy use, on average, compared to case studies based on single-family buildings.
4.4. Influence of Building Location and Climate Zone
As shown in the final sample (36 case studies;
Figure A5 in
Appendix C), the highest life cycle GHG emissions are found in Mainland China (CN), Hong Kong (HK) and South Korea (KR), characterised by a low energy-efficient multi-family construction sector. In contrast, the lowest impacts can be observed in Japan (JP), Colombia (CO) and Brazil (BR), characterised by low-energy performances or low-GHG emission grids based on renewable or nuclear energy sources (
Figure 3).
Based on the current systematic literature review, it can be stated that residential buildings operating in humid subtropical climates on average present 60% higher embodied GHG emissions than those operating in the tropical climates (
Figure 10). This can be attributed to the fact that most of the case study buildings in tropical climate zones are characterised as lightweight single-family constructions with the extensive use of local natural materials. In contrast, the residential construction sector in humid subtropical climate areas is dominated by heavily reinforced concrete multi-family buildings. Moreover, the data analysis indicates that constructions in humid subtropical climate areas are characterised by 75% higher total life cycle GHG emissions, on average, than those in tropical climate areas (
Figure 10). Higher emissions are driven by the operational GHG emissions part, which is found to be, on average, 225% higher in humid subtropical than tropical climates. One of the main contributing factors of higher operational GHG emissions is demanding climate conditions in the humid subtropical zone (
Figure A6 in
Appendix C), which, compared to the tropical climate, leads to the significant energy-related use of both space heating and cooling. Climate conditions in tropical areas enable the use of a bioclimatic design approach for residential buildings, as in CS22CO, where no space heating or cooling is needed to meet adaptive thermal comfort requirements, leading to a significant reduction in operational GHG emissions.
Comparing the current results with a previous harmonised analysis of 15 residential case studies by Chastas et al. [
11], it can be stated that residential buildings operating in humid subtropical climates present, on average, 65% higher total GHG emissions than those operating in temperate and continental climate zones. One of the biggest contributing factors is the dominant share of buildings characterised by highly efficient performances (passive and low-energy) in developed economies located in temperate and continental climate zones.
4.5. Influence of Main Structural Materials
Among the harmonised final data sample, the dominant construction materials used for load-bearing structures vary between reinforced concrete (RC), concrete (C), steel (S), masonry brick (M) and wood (W), combined with secondary materials (All). The highest embodied and life cycle GHG emissions are induced by using reinforced concrete and steel as the primary building materials (
Figure 11).
Embodied GHG emissions in the building structures based on reinforced concrete range from 267 kgCO2eq/m2 in CS58KR to 1503 kgCO2eq/m2 in CS61KR, and the total life cycle GHG emissions range from 2093 kgCO2eq/m2 in CS62KR to 4811 kgCO2eq/m2 in CS27CN. The relatively low value of embodied GHG emissions in CS58KR is due to the extensive use of high-strength concrete, which results in a decreased quantity of concrete and rebar. As a result, embodied GHG emissions were reduced by 43% compared to the same high-rise building design (CS57KR) when utilising standard reinforced concrete. Embodied GHG emissions related to steel-based buildings present a high variation, with values between 188 kgCO2eq/m2 in CS55JP and 2103 kgCO2eq/m2 in CS31CN, nearly half of which comes from extensive use of PV modules. The use of concrete and masonry (brick) materials in the structure evidenced a similar variation, with concrete structures ranging between 349 kgCO2eq/m2 in CS22CO and 1050 kgCO2eq/m2 in CS64MY and masonry (brick) structures varying between 369 kgCO2eq/m2 in CS24CN and 933 kgCO2eq/m2 in CS28CN. The use of wood as the primary structural material led to the lowest embodied and total life cycle emissions. Embodied GHG emissions range between 122 kgCO2eq/m2 in CS54JP and 491 kgCO2eq/m2 in CS69TH, and the life cycle GHG emissions vary between 491 kgCO2eq/m2 in CS69TH and 2100 kgCO2eq/m2 in CS73US.
5. Building Design Strategies for Reducing GHG Emissions
To compare building design strategies for GHG reduction in the analysed case studies, strategies were categorised into seven main groups (detailed description in
Table 4): maximisation of timber use (S1), improvement of thermal properties (S2), use of materials with lower embodied GHG emissions (S3), increased use of local materials (S4), extension of building lifespan (S5), form optimisation (material efficiency) (S6) and implementation of renewable energy generation, i.e., on-site PV energy system (S7). The reduction potential of embodied, operational and life cycle GHG emissions relative to the baseline design scenario in each recognised strategy is presented in
Figure 12 and
Figure 13.
Strategy S1, related to maximisation of timber used in the building structure, is the most common among case study buildings and presents an emission reduction potential of 5% (CS1AU and CS32CN) to 69% (CS15AU) and 1% (CS32) to 21% (CS15AU) for the embodied and total life cycle GHG emissions, respectively. The influence of S1 on the reduction of operational GHG emissions is marginal (1–4%;
Figure 13) and related mostly to the lower thermal conductivity of timber compared with steel, concrete or brick. In this strategy, both the embodied and total GHG emission reduction potentials are strictly correlated with the extent of timber use, which is the lowest in CS32CN, where only the external aluminium wall is replaced with a timber-based wall, while the highest reductions occur in CS15AU, where timber was implemented entirely as the primary structural material.
Additionally, the use of the different methods related to the accounting of carbon-storage credits from timber-based product leads to discrepancies in the reduction efficiency potentials among the analysed case studies. The highest benefits are for CS13-15AU, in which the carbon-storage benefits are included in the life cycle assessment results. Excluding that component, the embodied GHG emission savings would have been reduced twofold.
Strategy S2, related to improving the thermal properties of the building, e.g., by insulating building partitions or complete frames, presents a substantial potential for reducing operational GHG emissions in the range of 7–44%, which can be mainly correlated with a decrease of space heating energy demand. Implementing additional insulation materials may lead to increased embodied GHG emission values relative to the baseline design scenario, as in CS3AU (+10%) and CS5AU (+5%). Despite the increased embodied GHG emissions, the strategy presents a life cycle GHG emission reduction potential of 1% (CS3AU) to 26% (CS66TH).
A combination of strategies S1 and S2, identified in CS68TH, leads to a reduction in terms of both embodied and operational GHG emissions, increasing the total life cycle GHG emission reduction potentials to 35% relative to the baseline scenario.
Among all available GHG emission reduction strategies, implementing renewable energy sources based on the extensive use of solar energy generated by photovoltaic panels (S7) is identified as the most efficient in terms of life cycle emission reduction, with a range of efficiency between 48% (CS31CN) and 66% (CS69TH). In this strategy, the significant increase of embodied GHG emissions (41–79%) is overcome by a massive compensation (92–100%) of operational GHG emissions. The life cycle GHG reduction potential is the highest in locations characterised by high emissions related to electricity use from the local grid.
The GHG emission factor of electricity has a dominant influence on life cycle GHG emissions and is a key parameter for choosing the most effective design strategies toward low-emission buildings, which is in-line with the findings of [
37,
38].
In addition, the implementation of strategies in the analysed sample is dominated by the single-family building type. Based on this, it was found that there is little research on GHG reduction strategies implemented in multi-family buildings, which are dominant in developing economies and characterised by higher life cycle GHG emissions.
6. Contributions and Limitations of the Current Review
The current review is an effort to fill the research gap in systematic identification and assessment of the existing literature on GHG emissions along the life cycle of residential buildings in humid subtropical and tropical climate regions. The results show the influence of building-oriented factors on GHG emission profiles and allow the identification and discussion of promising strategies for reducing the environmental impact.
The most important limitations of this study are related to the following:
The possible omission of existing studies in the data collection procedure.
The underestimation of embodied GHG emissions among case studies, taking into consideration the dominant use of the process-based assessment method, which is sensitive to truncation error.
The application of linear harmonisation of the embodied GHG emissions to the reference study period of 50 years is a straightforward approach to increase the comparability of the results. However, the replacement of construction materials and the associated environmental impacts during the study period occurs in a discrete period of time. Scaling these impacts linearly induces errors.
7. Conclusions and Outlook
Within the collection of 71 case studies, most of the life cycle GHG emission assessments were performed for buildings located in humid subtropical climates. The highest life cycle GHG emissions were found in the rapidly developing residential construction sectors of China, Hong Kong and India. The results of this study demonstrate that residential buildings with net-zero or low-energy performances have the potential to reduce the total life cycle GHG emissions by 50–80% compared to the most common conventional energy performance. The share of embodied GHG emissions among total GHG emissions ranges from 16% to 100%, with an average share of 27%, which is similar to previous research mostly based on case studies of buildings located in cold and temperate climates. The differences in the ratio between the embodied and total life cycle GHG emissions are mainly attributable to the choice of material in the building structure, energy performance and electricity emission factor for the grid mix used in the calculation of emissions from the operation.
The results indicate that the design strategy connected with the implementation of renewable energy sources in the form of photovoltaic systems provides the best reduction in terms of life cycle GHG emissions.
Furthermore, analysing the geographic locations of the buildings showed that most studies were located in humid subtropical climates, with only 15 case studies in tropical climates. This finding highlights the need for future research on the life cycle assessment for GHG emission reduction strategies in the tropical residential construction sector, especially taking into consideration ongoing efforts towards the redevelopment of slums and market implementation of governmental housing units in developing economies. This study furthermore identified a research gap related to developing and assessing the GHG emission reduction measures in multi-family buildings, which present higher life cycle GHG emissions than single-family buildings.
Several additional aspects were identified that future research efforts should focus on. The study identified the significant GHG emission reduction potentials by substituting high-emission materials such as steel and concrete with bio-based low-carbon materials. Further research and development of such materials, such as timber-based products or bamboo for construction, is needed to support market implementation. The analysis of promising design strategies should be advanced to develop specific design guidelines for low-emission, carbon-neutral buildings in warm and humid climate regions. Such guidelines will be crucial in enabling decarbonisation of building construction and operation, for both the refurbishment of new buildings and renovation of existing buildings. Science-based targets and guidelines are needed to inform effective policies and implement related requirements in building codes and standards. To that effect, harmonising building life cycle assessment studies in terms of methodology and results and reporting is important. Efforts for such harmonisations are under way in international research collaborations such as the IEA EBC Annex 72 project.
Author Contributions
Conceptualization, D.S., A.H.-W. and A.G.; methodology, D.S. and M.R.; formal analysis, D.S. and M.R.; investigation, D.S., M.R., A.H.-W. and A.G.; writing—original draft preparation, D.S.; writing—review and editing, D.S., M.R., A.H.-W. and A.G.; visualization, D.S.; supervision, A.H.-W. and A.G.; project administration, A.G. All authors have read and agreed to the published version of the manuscript.
Funding
This research received no external funding.
Acknowledgments
The authors gratefully acknowledge the support from the Research Council of Norway and several partners through the Research Centre on Zero Emission Neighbourhoods in Smart Cities (FME ZEN). Martin Röck acknowledge the support from Austrian Academy of Sciences (OeAW) through a DOC Fellowship (2019/1). Aoife Houlihan Wiberg acknowledges the support from TheBelfast School of Architecture and the Built Environment, Ulster University, UK.
Conflicts of Interest
The authors declare no conflict of interest.
Appendix A. List of Case Studies and Basic Properties
Table A1.
Overview of 75 case studies: methodological principles.
Table A1.
Overview of 75 case studies: methodological principles.
Case
Study | Reference | Calculation, Impact Assessment Method (Impact Indicator) | Operational Energy Assessment Methodology (Software/Data Source) |
|---|
| CS1AU | Carre, 2011 [39] | PLCA/AIA, GWP (kgCO2eq) | BPS |
| CS2AU | (Accurate) |
CS3AU
CS4AU
CS5AU
CS6AU | Islam et al., 2015 [40] | PLCA/AIA, GWP (kgCO2eq) | BPS
(Accurate) |
| CS7AU | Holloway et al., 2007 [41] | IO/n/s, GWP (kgCO2eq) | Statistical data
(Energy suppliers local, data) |
| CS8AU |
| CS9AU |
CS10AU
CS11AU |
| CS12AU | Ximenes and Grant, 2013 [42] | PLCA/n/s, GWP (kgCO2eq) | n/s |
| CS13AU |
| CS14AU |
| CS15AU |
| CS16AU | Lawania and Biswas, 2016 [43] | PLCA/IPPC (2007), | |
| CS17AU | GWP (kgCO2eq) | BPS
(Accurate) |
| CS18AU |
| CS19BR | Gomes et al., 2018 [44] | PLCA/CML2001, GWP (kgCO2eq) | BPS (Energy +) |
| CS20BR | Evangelista et al., 2018 [45] | PLCA/ILCD (2011) | Statistical
(National data) |
| CS21BR | GWP (kgCO2eq) | |
| CS22CO | Ortiz-Rodríguez et al., 2010 [34] | PLCA/CML | Statistical |
| GWP (kgCO2eq) | (Energy suppliers’ data) |
| CS23CN | Zhan et al., 2018 [46] | Hybrid, IPPC (2006)
GWP (kgCO2eq) | n/s |
| CS24CN | D. Li et al., 2016 [47] | PLCA/n/s CO2 (kgCO2) | Statistical |
| (National/local data) |
CS25CN
CS26CN | Wu et al., 2017 [48] | PLCA/n/s, GWP (kgCO2eq) | BPS (Dest) and meter data |
| CS27CN | Huang et al., 2018 [49] | PLCA/ReCiPe Midpoint GWP (kgCO2eq) | Meter data |
| CS28CN | Yang et al., 2018 [50] | PLCA/IPPC (2007),
GWP (kgCO2eq) | BPS (Design Builder) |
| CS29CN | D. Z. Li et al., 2013 [51] | PLCA/n/s, CO2 (kgCO2) | Statistical (Local and field survey data) |
| CS30CN | Zeng and Ren, 2012 [52] | Hybrid, IPPC (2007)
GWP (kgCO2eq) | n/s |
CS31CN
CS32CN | Dong et al., 2018 [53] | PLCA/n/s, CO2 (kgCO2) | BPS
(Energy +) |
CS33CN
CS34CN
CS35CN
CS36CN | Satola et al., 2020 [54] | PLCA/ReCiPe Midpoint GWP (kgCO2eq) | BPS
(Trnsys) |
CS37HK
CS38HK | Yim et al., 2018 [55] | PLCA/IPPC (2007)
GWP (kgCO2eq) | Statistical
(National data) |
CS39HK
CS40HK
CS41HK | Gan et al., 2018 [56] | PLCA/n/s
GWP (kgCO2eq) | BPS (DOE-2 software) |
CS42IN
CS43IN | Chel and Tiwari, 2009 [57] | n/s/n/s, CO2 (kgCO2) | BPS (n/s) |
| CS44IN | Ishaq et al., 2019 [58] | PLCA/n/s, CO2 (kgCO2) | BPS (DOE2) |
CS45ID
CS46ID
CS47ID
CS48ID
CS49ID
CS50ID | Surahman et al., 2015 [59] | IO/n/s, CO2 (kgCO2) | Meter data |
| CS51JP | Tonooka et al., 2014 [60] | IO/n/s, CO2 (kgCO2) | n/s |
| CS52JP | Ohta, 2017 [61] | IO/n/s, CO2 (kgCO2) | BPS
(n/s) |
| CS53JP |
| CS54JP | Gerilla et al., 2007 [62] | IO/CML, GWP (kgCO2eq) | Statistical (n/s) |
| CS55JP |
| CS56KR | S. Tae et al., 2011 [63] | PLCA/n/s, CO2 (kgCO2) | Statistical
(National data) |
CS57KR
CS58KR | S. Tae et al., 2016 [64] | IO/n/s, CO2 (kgCO2) |
CS59KR
CS60KR | Cho and Chae, 2016 [65] | PLCA/n/s, CO2 (kgCO2) | Statistical
(National benchmark data) |
CS61KR
CS62KR | Baek et al., 2016 [66] | IO/n/s, CO2 (kgCO2) | BPS
(Ecodesigner) |
| CS63KR | Roh et al., 2016 [67] | PLCA/n/s, CO2 (kgCO2) | BPS
(n/s) |
| CS64MY | Rashid et al., 2017 [30] | PLCA/CML2(2001)
GWP (kgCO2eq) | BPS
(Open studio) |
CS65TH
CS66TH
CS67TH
CS68TH
CS69TH | Bukoski et al., 2017 [68] | PLCA/ReCiPe Midpoint
V.1.1, GWP (kgCO2eq) | BPS
(Design Builder) |
CS70TW
CS71TW | Chang and Lee, 2013 [69] | PLCA/IPPC (2007)
GWP (kgCO2eq) | BPS
(DOE-2 software) |
| CS72US | Fesanghary et al., 2012 [70] | PLCA/n/s, GWP (kgCO2eq) | BPS
(Energy +) |
| CS73US | Mosteiro-romero et al., 2014 [71] | PLCA/BEES, GWP (kgCO2eq) | BPS
(RemDesign) |
| CS74US | Winistorfer et al., 2005 [72] | PLCA/Athena, CO2 (kgCO2) | n/s |
| CS75US |
Table A2.
Overview of 75 case studies: building-oriented features.
Table A2.
Overview of 75 case studies: building-oriented features.
Case
Study | Location/Climate | Type | GFA (m2) | Main
Materials | RSP (Years) |
|---|
| CS1AU | Sydney/HST | SF | 202 | W,C | 50 |
| CS2AU | S,C |
CS3AU
CS4AU
CS5AU
CS6AU | Brisbane/HST | SF | 101 | | 50 |
| W,C |
| |
| CS7AU | Sydney/HST | SF | 174 | C | 65 |
| CS8AU | 164 | C,M |
| CS9AU | 323 | M,C |
| CS10AU | 219 | C |
| CS11AU | 213 | M |
| CS12AU | Sydney/HST | SF | 221 | C,M | 50 |
| CS13AU | 221 | W |
| CS14AU | 296 | C,M |
| CS15AU | 296 | W |
| CS16AU | Perth/HST | SF | 243 | M | 50 |
| CS17AU | C |
| CS18AU | W |
| CS19BR | Campinas/HST | LL | 1005 | S,C | 50 |
| CS20BR | Salvador/TR | MF | 10,778 | C,S | 50 |
| CS21BR | SF | 561 | C,W |
| CS22CO | Pamplona/TR | SF | 125 | C,S | 50 |
| CS23CN | Guangzhou/HST | MF | 4235 | RC | 70 |
| CS24CN | Nanjing/HST | MF | 1839 | M,C | 50 |
| CS25CN | Shanghai/HST | MF | 138,048 | RC | 50 |
| CS26CN | 67,063 | RC |
| CS27CN | Fuzhou/HST | MF | 29,910 | RC | 50 |
| CS28CN | Baiguoba/HST | SF | 423 | M,C | 50 |
| CS29CN | Nanjing/HST | MF | 1459 | M,C | 70 |
| CS30CN | Shanghai/HST | MF | 2831 | RC | 50 |
CS31CN
CS32CN | Nanjing/HST | SF | 30 | S(Al),PV
S(Al) | 20 |
CS33CN
CS34CN
CS35CN
CS36CN | Shanghai/HST | SF | 27 | S | 25 |
| S |
| S,PV |
| S,PV,ES |
CS37HK
CS38HK | Hong Kong/HST | MF | 33,078 | RC | 50 |
CS39HK
CS40HK
CS41HK | Hong Kong/HST | MF | 38,360 | RC | 50 |
CS42IN
CS43IN | New Delhi/HST | SF | 94 | RC
Mud | 50 |
| CS44IN | Uttar Pradesh/HST | MF | 5664 | RC | 30 |
| CS45ID | | SF | 45 | | 20 |
| CS46ID | Jakarta/TR | 95 | ST,M | 35 |
| CS47ID | | 207 | | 50 |
| CS48ID | Bandung/TR | 57 | C,M | 20 |
| CS49ID | | 127 | | 35 |
| CS50ID | | 300 | | 50 |
| CS51JP | Tokyo/HST | SF | 126 | W | 100 |
| CS52JP | Kameyama/HST | SF | 147 | W | 50 |
| CS53JP |
CS54JP
CS55JP | SagaHST | SF | 150 | W
S,RC | 35 |
| CS56KR | Busan/HST | MF | 3440 | RC | 60 |
CS57KR
CS58KR | 14,424 | RC | 50
100 |
CS59KR
CS60KR | Gwangju/HST | MF | 1078 | RC | 30 |
CS61KR
CS62KR | Pohang/HST | MF | 11,401
19,303 | RC
RC | 40
80 |
| CS63KR | Seoul/HST | MF | 208,393 | RC | 40 |
| CS64MY | Kuala Lumpur/TR | SF | 246 | C,M | 50 |
| CS65TH | | | | RC | 50 |
| CS66TH | | | | S |
| CS67TH | Bangkok/TR | SF | | S,PV |
| CS68TH | | | 148 | W |
| CS69TH | | | | W,PV |
CS70TW
CS71TW | Hsinchu/HST | SF | 326 | RC
S | 30 |
| CS72US | Baton Rouge/HST | SF | 186 | C | 25 |
| CS73US | New Jersey/HST | SF | 317 | W | 65 |
| CS74US | Atlanta/HST | SF | 202 | C | 75 |
| CS75US | W |
Appendix B. Meta-Analysis
Appendix B.1. Methodological Features
Appendix B.1.1. System Boundaries
Table A3.
Life cycle processes and stages (EN 15978) of 75 life cycle GHG emission assessments of the residential buildings.
Table A3.
Life cycle processes and stages (EN 15978) of 75 life cycle GHG emission assessments of the residential buildings.
| | Product Stage | Construction Stage | Use Stage | End of Life | Benerfits |
|---|
| Case Study, CS | Raw Material Supply, A1 | Transport, A2 | Manufacturing, A3 | Transport, A4 | Installation, A5 | Use, B1 | Maintenance, B2 | Repair, B3 | Replacement, B4 | Refurbishment, B5 | Operational Energy Use, B6 | Operational Water Use, B7 | Deconstruction Demolition, C1 | Transport, C2 | Waste Processing, C3 | Disposal. C4 | Reuse–Recovery–Recycling, D |
|---|
1 to 2
AU | x | x | x | x | x | | x | | x | | H,V,C | | x | x | x | x | X |
3–6
AU | x | x | x | x | x | | x | | x | | H,V,C | | x | x | x | x | X |
7–11
AU | x | x | x | x | x | | | | x | | H,V,C,
DHW,L,A | x | x | | | | |
| 12–15AU | x | x | x | x | | | x | | x | | H,V,C | | | x | x | x | X |
| 16–18AU | x | x | x | x | x | | | | | | H,V,C,
DHW,L,A | | | | | | |
| 19BR | x | x | x | x | x | | x | | x | | H,V,C,
DHW,L,A | | x | x | | | |
| 20 to 21BR | x | x | x | x | x | | | | x | | H,V,C,
DHW,L,A | x | x | x | x | x | |
| 22CO | x | x | x | x | x | | x | | x | | H,V,C,
DHW,L,A | | x | x | x | x | |
| 23CN | x | x | x | x | x | | x | | x | | H,V,C,L | | x | x | x | x | X |
| 24CN | x | x | x | x | x | | x | | x | | H,V,C,
DHW,L,A | | x | x | x | x | X |
| 25 to 26CN | x | x | x | x | x | | x | | x | | H,V,C,
DHW,L,A | | x | x | x | x | X |
| 27CN | x | x | x | x | x | | | | x | | H,V,C,
DHW,L,A | | x | x | | x | |
| 28CN | x | x | x | x | x | | x | | x | | H,V,C,
DHW,L,A | | x | x | x | x | |
| 29CN | x | x | x | x | x | | x | | x | | H,V,C,
DHW | | x | x | x | x | X |
| 30CN | x | x | x | x | x | | x | | x | | H,V,C,
DHW,L,A | | x | x | x | x | X |
| 31 to 32CN | x | x | x | x | | | | | x | | H,V,C,
DHW,L,A | | x | x | | x | |
| 33–36CN | x | x | x | x | x | | x | | x | | H,V,C,
DHW,L,A | | x | x | x | x | X |
| 37 to 38HK | x | x | x | x | | | | | x | | H,V,C,
DHW,L,A | | x | x | | x | |
| 39–41HK | x | x | x | x | | | | | | | H,V,C | | | | | | |
42 to 43
IN | x | x | x | | | | | | | | H,V,C | | | | | | |
| 44 IN | n/c | | H,V,C,L | | n/c |
45–50
ID | x | x | x | | | | | | x | | H,V,C,
DHW,L,A | | | | | | |
| 51 JP | x | x | x | | | | x | | x | | H,V,C,
DHW,L,A | | x | x | x | x | X |
52 to 53
JP | x | x | x | x | x | | | | | | H,V,C,
DHW,L,A | | | | | | |
54 to 55
JP | x | x | x | x | | | x | | x | | H,V,C,
DHW,L,A | | | | | x | |
| 56–58KR | x | x | x | x | x | | x | | x | | H,V,C,
DHW,L,A | | x | x | x | x | X |
| 59 to 60KR | x | x | x | x | x | | x | | | | H,V,C,
DHW,L,A | | | | x | x | X |
| 61 to 62KR | x | x | x | x | x | | x | | x | | H,V,C,
DHW,L,A | | x | x | x | x | X |
| 63KR | x | x | x | x | x | | x | | x | | H,V,C,
DHW,L,A | | x | x | x | x | X |
| 64MY | x | x | x | x | x | | x | | x | | H,V,C,
DHW,L,A | | x | x | x | x | X |
| 65–69TH | x | x | x | x | x | | x | | x | | H,V,C,
DHW,L,A | | x | x | x | x | X |
| 70 to 71TW | x | x | x | x | x | | x | | x | | H,V,C,
DHW,L,A | | x | x | x | x | |
| 72US | x | x | x | x | x | | x | | x | | H,V,C | | x | x | x | x | |
| 73US | x | x | x | x | x | | x | | x | | H,V,C,
DHW,L,A | | x | x | x | x | X |
| 74 to 75US | x | x | x | x | x | | x | | | | H,V,C | | x | x | x | x | |
Sensitive analysis of 40 case studies characterised by cradle-to-grave system boundaries with a complete B6 scope indicates that excluding the energy demands of domestic hot water, lighting and appliances leads to the highest deviation of total life cycle GHG emissions in the range of 19–81%. Excluding the construction stage (A4–A5) results in a variation between 0.1% and 26.7%. Herein, the most extensive deviation value occurs in CS19BR, and it is mainly caused by the removal and transportation of a large volume of earth to the building site to create a vertical bridge between two wings of the building. Excluding this study, the deviation is reduced to a range of 0.1%–5.3%. Excluding the maintenance (B2) and replacement process (B4) modules resulted in a deviation range between 0.9% and 9.9%. This variation is primarily caused by a high uncertainty surrounding future replacement and maintenance scenarios. Excluding the entire end-of-life module (C1–C4) resulted in a deviation ranging between 0.5% and 4.2%.
Appendix B.1.2. Calculation Method of the Life Cycle GHG Emission Assessment
The life cycle GHG emission assessment embodies a process-based (PLCA), input-output-based (IO) or hybrid-based calculation method. The selection of the approach depends mostly on data availability and quality, and each method always presents varying degrees of completeness and reality. While the process-based method covers the GHG emissions and material inputs to each system process, the complexity of this arrangement may produce a misleading life cycle assessment [
73]. Additionally, the PLCA method inherently suffers from a truncation error made in the selection of system boundaries, which may not cover significant environmental impacts associated with the inputs and outputs located outside the system boundaries [
74,
75,
76,
77]. The recently published Australian EPiC database [
78] shows an average truncation error of ~60% across 131 building materials.
The input-output methodology uses economic input-output data for the entire construction sector, but applying this method can lead to problems with data aggregation and unreliability [
79]. Additional factors contributing to the uncertainty of the IO method are the homogeneity and linearity assumptions [
80].
The hybrid method is a combination of the PLCA- and IO-based methods. In this case, the process-based methodology is used up to the stage where reliable and complete information is no longer available, and then, the IO-based method is used, with the aim of reducing the negative features of the two basic calculation methodologies.
In most of the 52 collected case studies, the life cycle GHG emission assessment was calculated using the PLCA methodology, while the IO methodology was applied in 20 case studies (
Figure A1). In contrast, the hybrid-based method was only utilised in two case studies, CS23CN and CS30CN.
The literature shows that IO and hybrid-based assessments tend to report higher impacts than PLCA due to higher system completion [
81,
82,
83]. Furthermore, Crawford and Stephan [
84] and Crawford et al. [
85] found that a hybrid LCI can produce embodied energy figures two to four times larger at a whole-building level compared to using process analysis data only.
Under this review, it is made evident that, on average, case studies CS7-11AU, which applied the IO calculation method, provided nearly 110% higher embodied GHG emissions compared to the PLCA-based results of the Australian single-family buildings (CS12 and14 and 16 and 17AU) with similar structure types. However, assessing the direct impact of PLCA or IO methodology on the embodied GHG emission value is challenging, taking into consideration other factors such as the simplification of the material inventory and outdated IO construction data in IO-based case studies. Overall, the implementation of hybrid methods improves the system resolution and leads to higher emissions than the PLCA method [
75]. This comes from looking at the hybrid-based CS23CN case study, where the embodied GHG emission was 145% higher than that in a comparable multi-family building from case study CS29CN, which was assessed using the process-based methodology.
Figure A1.
Life cycle assessment calculation method employed with 75 case studies.
Figure A1.
Life cycle assessment calculation method employed with 75 case studies.
Appendix B.1.3. Impact Assessment Method and Indicators
The choice of impact assessment method varied among the examined case studies (
Table A1). In 39 case studies, the method was not clearly stated. In contrast, in CS22CO, the authors indicated that different impact assessment methods could deliver results with the same order of magnitude if the same life cycle inventory databases were used. The midpoint indicator of the global warming potential, GWP (CO
2eq), was used in 44 case studies in the sample. In other case studies, the life cycle impact was based only on the CO
2 emissions. Due to the complexity of the procedure and lack of available data, the uncertainty related to a different choice of impact assessment method and scope of GHG emissions could not be estimated in this review.
Appendix B.1.4. Operational Energy Use Assessment Methodology
Operational energy use can be defined as the energy required to preserve the comfort conditions inside the building and needed in day-to-day maintenance [
12]. This notion incorporates the energy needs connected with heating, ventilation and air-conditioning (HVAC), domestic hot water (DHW), lighting (L) and appliances (A). A critical review of the collected literature indicates that the assessment methodology of GHG emissions related to the energy use stage (B6) is mainly based on a multiplying relation between the annual final energy annual consumption and the GHG emission factors of energy carriers. An in-depth analysis of the operational energy stage (B6) is then crucial for a complete life cycle GHG emission assessment due to its dominant contribution compared to other life cycle stages.
The collected case studies employed various operational energy use assessment methodologies (
Table A1), which generally can be divided into two main groups—namely, engineering or statistical methods. Engineering methods are based on building performance simulations or direct on-site measurements via energy meters. The building performance simulation is used in most of the case studies (40), followed by statistical methods (19) and on-site measurements (7) (
Figure A2). The accuracy of the building performance simulation results depends mainly on the accuracy of the building model, experience of the user and simulation software, which applies different methods in integrated or separated simulation engines [
86].
This study indicates that the methodology for the building performance simulation (BPS) assessment among the analysed sample is mostly simplified, which makes an uncertainty analysis challenging. Moreover, it can be pointed out that CS42 and 43IN, CS52 and 53JP and CS63KR lack a clarification of the used BPS software or simulation engine, which leads to the uncertainty of the simulation outcomes in the form of the annual, final energy use. The use of metered energy data provides the most reliable energy use results. Still, its implementation is limited to already-constructed buildings.
The source of statistical data in the collected literature sample is based on energy suppliers, government data, construction energy benchmarks and survey field databases, which cover local or national data ranges. However, in CS54 and 55JP, the data source used for the statistical method is not clear, whereas in CS12-15AU, CS23CN, CS30CN, CS51JP and CS74 and 75US, the operational energy use assessment method is not stated, leading to uncertainty in the results.
The performed analysis indicated that none of the investigated case studies included the possible effects of climate change during the building lifespan in the assessment’s calculations. This can be identified as a significant uncertainty factor, especially taking into consideration that the location of the case study buildings is in the humid subtropical or tropical climate regions, which are the parts of the world likely to be affected by global warming impacts the most [
87]. This will lead to significant increases in the building operational energy use and related GHG emissions [
5]. This was deeply investigated in the research of [
88] by simulating the impact of climate change scenarios in two cities in Brazil with humid subtropical and tropical climates, respectively. They found that the mean annual outdoor temperature is likely to increase by 4.6 °C and 5.1 °C (respectively) by 2060. The total energy demand and related operational GHG emissions from heating and cooling in residential case-buildings located in humid subtropical and tropical climates can thus increase by 99% and 48%, respectively, compared to the 2020 figures. In addition, the related climate changes in the temperature and humidity profiles in humid subtropical and tropical climates can lead to a significant increase in the peak sensible and latent cooling loads [
89,
90]. As a result, the embodied emissions related to replacement of the technical systems may increase due to the need to provide more extensive cooling and ventilation system capacities.
Figure A2.
Energy use assessment methodology employed among 75 case studies.
Figure A2.
Energy use assessment methodology employed among 75 case studies.
Appendix B.2. Building-Related Features
Appendix B.2.1. Building and Climate Types
Globally, residential construction sectors differ in terms of energy efficiency and GHG emissions related to building types, construction materials, fabrication processes and transportation activity [
91]. Moreover, different climate conditions have a direct impacts on the building design and operational energy use [
92] and significantly contribute to GHG emissions. This systematic literature review focuses on the residential construction sector and contains 52 single-family (SF) buildings, 22 multi-family (MF) buildings and one zero-energy residential living laboratory (LL) case study building (
Figure A3).
Most of the analysed case studies (43) are based on existing building stock, while the others (32) are based on the assessment of GHG emissions of newly built or designed residential buildings. Based on the collected case studies, it seems that there is a lack of life cycle GHG emission assessments of refurbished building stock. This can be identified as a research gap, since the need for GHG emission reduction in the existing building stock is apparent and urgent in both developing and developed economies [
93].
The analysis further indicates that the number of case studies analysing residential buildings in tropical climates is limited. The collected literature data sample includes 18 case studies describing buildings located in tropical climate areas, while 57 case studies are based on constructions operating in humid subtropical climate areas (
Table A2).
Figure A3.
Residential building type distribution among 75 case studies.
Figure A3.
Residential building type distribution among 75 case studies.
Appendix B.2.2. Building Lifespan
The building lifespan is a key factor that influences the total GHG emissions related to the building life cycle [
94]. The estimation of a building’s lifespan is mostly based on national regulations, research literature or construction market estimations. Particularly, the lifespan of a building directly influences the recurring GHG emissions by maintenance, repair, refurbishment or replacement in the building use life cycle stage [
13].
The building lifespans in the collected case studies vary between 20 and 100 years (
Figure A4), with 58% (41 case studies) having a 50-year lifespan. Case studies CS1 and 2AU, CS3-6AU, CS27CN and CS51JP emphasise, with a sensitivity analysis, the difficulties related to forecasting the precise building lifespan by testing the initial assumption. As an example, in CS1 and 2AU, changing the building service life from 50 to 75 years imposes a 12% reduction of annualised embodied GHG emissions. The estimated building lifespan can also depend on the housing quality class, especially in developing economies with high social and economic disparities, as in CS45-50ID, where low, medium and luxury housing classes have estimated building service lives of 25, 35 and 50 years, respectively. Studies CS57 and 58KR indicate that material durability is an essential factor influencing the lifespan of high-rise multi-family buildings. In these studies, changing the concrete from normal to a high-strength type resulted in an extension of the estimated building service life from 50 to 100 years and produced an 8% reduction of the annualised embodied GHG emissions.
Figure A4.
Building lifespan distribution among 75 residential buildings.
Figure A4.
Building lifespan distribution among 75 residential buildings.
Appendix B.2.3. Building Structural Materials
The use of specific materials in building structures depends on the building type, construction regulations, local access and cost. The extensive literature indicates that reinforced concrete and steel-based building structures have the highest environmental impacts among traditional materials, while timber-based structures are widely characterised by low values of embodied GHG emissions [
95,
96,
97,
98,
99].
In this literature review focusing on residential buildings, the primary structural materials vary between timber, steel, concrete, reinforced concrete, masonry (brick), stone, mud and different combinations of these (
Figure 2).
The focus of bio-based materials applied in building structures is on industrialised types of wood, and the collected literature lacks a consideration of other bio-based forest or agricultural materials that are extensively accessible in tropical and humid subtropical climate regions [
100]. This gap can be related to the economic development of bio-based materials, which is still in the early stages and faces several challenges in the construction industry related to scepticism from architects, insurers and contractors [
101]. However, including bio-based building materials can effectively reduce the environmental impact of the construction sector.
The embodied GHG reduction potential related to the use of bamboo as a primary structural material was investigated by Yu et al. [
102]. The results showed that the bamboo-based structures of residential buildings in Shanghai provided a 48% reduction compared to traditional clay brick-based structures.
Furthermore, a study performed by Zea Escamilla et al. [
103] concluded that the transition to a low-carbon residential sector in the tropical Philippines would be much faster with the implementation of industrialised bamboo production than with industrialised wood production. Adding to this, the sustainable validity of bio-based agricultural products used in residential constructions in Argentina was investigated [
104]. In that study, the life cycle analysis results showed that external walls based on straw bales and straw clay blocks had four- and threefold lower GHG emissions than fired-brick walls and had significantly better thermal performances.
One of the biggest uncertainties related to life cycle GHG emission assessments of buildings with extensive uses of bio-based materials is in assessing the biogenic carbon flows related to the sequestration and storage of carbon dioxide within a product. Currently, there is no scientific consensus on which accounting method is the most appropriate [
105]. The most recent LCA calculation guidelines recommend separately including compensative GHG emissions in “additional benefits and loads beyond the system boundary” (module D) only if bio-based materials come from sustainably managed forests or cultivations in which total carbon pools can be assumed to be stable or increasing.
Appendix C. Result Harmonisation
The first step of the harmonisation procedure resulted in a narrowing of the initial literature sample, with 73 case studies that had a wide variety of total life cycle GHG emissions, between 310 kgCO
2eq/m
2 in CS1AU and 8407 kgCO
2eq/m
2 in CS33CN (
Figure A5). The embodied GHG emissions varied between 66 kgCO
2eq/m
2 in CS15AU and kgCO
2eq/m
2 in CS36CN, and the GHG emissions connected with operational energy use varied from 0 kgCO
2eq/m
2 in zero-energy buildings CS19BR, CS35 and 36CN and CS67 and 69TH to 7111 kgCO
2eq/m
2 in CS33CN. The main causes of such a large range are related to the energy performance of the building and the GHG emission intensity of the electricity from the local grid, which varies between 0.23 kgCO
2eq/kWh in Colombia (CS22CO) [
34] to 1.20 kgCO
2eq/kWh in Fuzhou (
Figure 3).
Figure A5.
Harmonised embodied and operational GHG emissions from 75 case studies (bold and underlined values refer to the 36 case studies included in the final sample).
Figure A5.
Harmonised embodied and operational GHG emissions from 75 case studies (bold and underlined values refer to the 36 case studies included in the final sample).
Figure A6.
Annual (a) heating and (b) cooling degree days in relation to the climate zone, based on 18 case study locations.
Figure A6.
Annual (a) heating and (b) cooling degree days in relation to the climate zone, based on 18 case study locations.
References
- Rogelj, J.; Den Elzen, M.; Höhne, N.; Fransen, T.; Fekete, H.; Winkler, H.; Schaeffer, R.; Sha, F.; Riahi, K.; Meinshausen, M. Paris Agreement climate proposals need a boost to keep warming well below 2 C. Nature 2016, 534, 631–639. [Google Scholar] [CrossRef] [PubMed] [Green Version]
- Griggs, D.; Stafford-Smith, M.; Gaffney, O.; Rockström, J.; Öhman, M.C.; Shyamsundar, P.; Steffen, W.; Glaser, G.; Kanie, N.; Noble, I. Sustainable development goals for people and planet. Nature 2013, 495, 305–307. [Google Scholar] [CrossRef] [PubMed]
- Dean, B.; Dulac, J.; Petrichenko, K.; Graham, P. Towards zero-emission efficient and resilient buildings: Global Status Report. Glob. Alliance Build. Constr. 2016, 33, 5–6. [Google Scholar]
- Edenhofer, O. Climate Change 2014: Mitigation of Climate Change; Cambridge University Press: Cambridge, UK, 2015; Volume 3, ISBN 110705821X. [Google Scholar]
- Pachauri, R.K.; Allen, M.R.; Barros, V.R.; Broome, J.; Cramer, W.; Christ, R.; Church, J.A.; Clarke, L.; Dahe, Q.; Dasgupta, P.; et al. Climate Change 2014: Synthesis Report. Contribution of Working Groups I, II and III to the Fifth Assessment Report of the Intergovernmental Panel on Climate Change; Pachauri, R.K., Meyer, L., Eds.; IPCC: Geneva, Switzerland, 2014. [Google Scholar]
- Andresen, I. Towards Zero Energy and Zero Emission Buildings—Definitions, Concepts, and Strategies. Curr. Sustain. Energy Rep. 2017, 4, 63–71. [Google Scholar] [CrossRef]
- Rasmussen, F.N.; Malmqvist, T.; Moncaster, A.; Wiberg, A.H.; Birgisdóttir, H. Analysing methodological choices in calculations of embodied energy and GHG emissions from buildings. Energy Build. 2018, 158, 1487–1498. [Google Scholar] [CrossRef]
- Birgisdottir, H.; Moncaster, A.; Wiberg, A.H.; Chae, C.; Yokoyama, K.; Balouktsi, M.; Seo, S.; Oka, T.; Lützkendorf, T.; Malmqvist, T. IEA EBC annex 57 ‘evaluation of embodied energy and CO2 eq for building construction’. Energy Build. 2017, 154, 72–80. [Google Scholar] [CrossRef] [Green Version]
- Röck, M.; Saade, M.R.M.; Balouktsi, M.; Rasmussen, F.N.; Birgisdottir, H.; Frischknecht, R.; Habert, G.; Lützkendorf, T.; Passer, A. Embodied GHG emissions of buildings—The hidden challenge for effective climate change mitigation. Appl. Energy 2020, 258, 114107. [Google Scholar] [CrossRef]
- Ürge-Vorsatz, D.; Lucon, O.; Akbari, H.; Bertoldi, P.; Cabeza, L.F.; Eyre, N.; Gadgil, A.; Harvey, D.; Jiang, Y.; Liphoto, E.; et al. Climate Change 2014: Mitigation. Chapter 9: Buildings; Report by the Intergovernmental Panel on Climate Change; Cambridge University Press: Cambridge, UK; New York, NY, USA, 2014. [Google Scholar]
- Habert, G.; Röck, M.; Steininger, K.; Lupísek, A.; Birgisdottir, H.; Desing, H.; Chandrakumar, C.; Pittau, F.; Passer, A.; Rovers, R.; et al. Carbon budgets for buildings: Harmonising temporal, spatial and sectoral dimensions. Build. Cities 2020, 1, 429–452. [Google Scholar] [CrossRef]
- Ramesh, T.; Prakash, R.; Shukla, K.K. Life cycle energy analysis of buildings: An overview. Energy Build. 2010, 42, 1592–1600. [Google Scholar] [CrossRef]
- Chastas, P.; Theodosiou, T.; Kontoleon, K.J.; Bikas, D. Normalising and assessing carbon emissions in the building sector: A review on the embodied CO2 emissions of residential buildings. Build. Environ. 2018, 130, 212–226. [Google Scholar] [CrossRef]
- Cabeza, L.F.; Rincón, L.; Vilariño, V.; Pérez, G.; Castell, A. Life cycle assessment (LCA) and life cycle energy analysis (LCEA) of buildings and the building sector: A review. Renew. Sustain. Energy Rev. 2014, 29, 394–416. [Google Scholar] [CrossRef]
- Chau, C.K.; Leung, T.M.; Ng, W.Y. A review on life cycle assessment, life cycle energy assessment and life cycle carbon emissions assessment on buildings. Appl. Energy 2015, 143, 395–413. [Google Scholar] [CrossRef]
- Chastas, P.; Theodosiou, T.; Bikas, D. Embodied energy in residential buildings-towards the nearly zero energy building: A literature review. Build. Environ. 2016, 105, 267–282. [Google Scholar] [CrossRef]
- Dixit, M.K. Life cycle embodied energy analysis of residential buildings: A review of literature to investigate embodied energy parameters. Renew. Sustain. Energy Rev. 2017, 79, 390–413. [Google Scholar] [CrossRef]
- Malmqvist, T.; Nehasilová, M.; Moncaster, A.; Birgisdottir, H.; Rasmussen, F.N.; Wiberg, A.H.; Potting, J. Design and construction strategies for reducing embodied impacts from buildings—Case study analysis. Energy Build. 2018, 166, 35–47. [Google Scholar] [CrossRef] [Green Version]
- Säynäjoki, A.; Heinonen, J.; Junnila, S.; Horvath, A. Can life-cycle assessment produce reliable policy guidelines in the building sector? Environ. Res. Lett. 2017, 12. [Google Scholar] [CrossRef] [Green Version]
- Abergel, T.; Dean, B.; Dulac, J. Towards a Zero-Emission, Efficient, and Resilient Buildings and Construction Sector: Global Status Report 2017; UN Environment and International Energy Agency: Paris, France, 2017. [Google Scholar]
- Ganopolski, A.; Friedrich, T.; Elison Timm, O.; Tigchelaar, M.; Timmermann, A. Nonlinear climate sensitivity and its implications for future greenhouse warming. Sci. Adv. 2016, 2, e1501923. [Google Scholar] [CrossRef] [Green Version]
- Booth, A.; Carroll, C. Systematic searching for theory to inform systematic reviews: Is it feasible? Is it desirable? Health Inf. Libr. J. 2015, 32, 220–235. [Google Scholar] [CrossRef]
- Wohlin, C. Guidelines for snowballing in systematic literature studies and a replication in software engineering. In Proceedings of the 18th International Conference on Evaluation and Assessment in Software Engineering, London, UK, 13–14 May 2014; p. 38. [Google Scholar]
- Ang, B.W.; Su, B. Carbon emission intensity in electricity production: A global analysis. Energy Policy 2016, 94, 56–63. [Google Scholar] [CrossRef]
- Zhang, M.; Liu, X.; Wang, W.; Zhou, M. Decomposition analysis of CO2 emissions from electricity generation in China. Energy Policy 2013, 52, 159–165. [Google Scholar] [CrossRef]
- Birgisdóttir, H.; Houlihan-Wiberg, A.; Malmqvist, T.; Moncaster, A.; Rasmussen, F.N. IEA EBC ANNEX 57—Subtask 4: Case Studies and Recommendations for the Reduction of Embodied Energy and Embodied Greenhouse Gas Emissions from Buildings; Institute for Building Environment and Energy Conservation: Tokyo, Japan, 2016; ISBN 978-4-909107-08-4. [Google Scholar]
- Passive House Institute Criteria for the Passive House. EnerPHit and PHI Low Energy Building Standard. Passiv. House Inst. 2016, 1–25, 3. [Google Scholar]
- Phumpradab, K.; Gheewala, S.; Sagisaka, M. Life cycle assessment of natural gas power plants in Thailand. Int. J. Life Cycle Assess. 2009, 14, 354–363. [Google Scholar] [CrossRef]
- To, W.M.; Lee, P.K.C. Energy consumption and economic development in Hong Kong, China. Energies 2017, 10, 1883. [Google Scholar] [CrossRef] [Green Version]
- Zhou, N.; Price, L.; Ohshita, S.; Zheng, N.; Min, H. Berkeley National Laboratory A Guidebook for Low-Carbon Development at the Local Level. Energy 2011, 13–15. [Google Scholar] [CrossRef] [Green Version]
- Sangoi, J.M.; Ghisi, E. Energy Efficiency of Water Heating Systems in Single-Family Dwellings in Brazil. Water 2019, 11, 1068. [Google Scholar] [CrossRef] [Green Version]
- An, H.J.; Yoon, J.H.; An, Y.-S.; Heo, E. Heating and Cooling Performance of Office Buildings with a-Si BIPV Windows Considering Operating Conditions in Temperate Climates: The Case of Korea. Sustainability 2018, 10, 4856. [Google Scholar] [CrossRef] [Green Version]
- Ball, A.; Billing, J.; Mccluskey, C.; Pham, P.; Pittman, O.; Lawson, S.; Ahmad, S.; Starr, A.; Rousseau, J.; Lambert, N. Australian Energy Update 2018. Aust. Gov. Dep. Environ. Energy 2018, 3, 32. [Google Scholar]
- Ortiz-Rodríguez, O.; Castells, F.; Sonnemann, G. Life cycle assessment of two dwellings: One in Spain, a developed country, and one in Colombia, a country under development. Sci. Total Environ. 2010, 408, 2435–2443. [Google Scholar] [CrossRef]
- EIA, U.S. Residential Energy Consumption Survey (RECS). Table HC7 2008, 7, 42–46. [Google Scholar]
- Obrinsky, M.; Walter, C. Energy Efficiency in Multifamily Rental Homes: An Analysis of Residential Energy Consumption Data. J. Sustain. Real Estate 2016, 8, 2–19. [Google Scholar]
- Stephan, A.; Stephan, L. Achieving net zero life cycle primary energy and greenhouse gas emissions apartment buildings in a Mediterranean climate. Appl. Energy 2020, 280, 115932. [Google Scholar] [CrossRef]
- Martinopoulos, G. Are rooftop photovoltaic systems a sustainable solution for Europe? A life cycle impact assessment and cost analysis. Appl. Energy 2020, 257, 114035. [Google Scholar] [CrossRef]
- Carre, A. A Comparative Life Cycle Assessment of Alternative Constructions of a Typical Australian House Design; Forest and Wood Products Australia Limited: Melbourne, Australia, 2011; ISBN 978-1-921763-14-4. [Google Scholar]
- Islam, H.; Jollands, M.; Setunge, S.; Haque, N.; Bhuiyan, M.A. Life cycle assessment and life cycle cost implications for roofing and floor designs in residential buildings. Energy Build. 2015, 104, 250–263. [Google Scholar] [CrossRef]
- Holloway, D.; Pullen, S.; Holloway, D. The Environmental Impacts of Residential Development: Case Studies of 12 Estates in Sydney University of New South Wales Final Report of ARC Linkage Project LP 0348770 Linkage Partner: Landcom The Environmental Impacts of Residential Development: Case; City Futures Research Centre, University of New South Wales: Melbourne, Australia, 2007. [Google Scholar]
- Ximenes, F.A.; Grant, T. Quantifying the greenhouse benefits of the use of wood products in two popular house designs in Sydney, Australia. Int. J. Life Cycle Assess. 2013, 18, 891–908. [Google Scholar] [CrossRef]
- Lawania, K.K.; Biswas, W.K. Achieving environmentally friendly building envelope for Western Australia’s housing sector: A life cycle assessment approach. Int. J. Sustain. Built Environ. 2016, 5, 210–224. [Google Scholar] [CrossRef] [Green Version]
- Gomes, V.; Saade, M.; Lima, B.; Silva, M. Exploring lifecycle energy and greenhouse gas emissions of a case study with ambitious energy compensation goals in a cooling-dominated climate. Energy Build. 2018, 173, 302–314. [Google Scholar] [CrossRef]
- Evangelista, P.P.A.; Kiperstok, A.; Torres, E.A.; Gonçalves, J.P. Environmental performance analysis of residential buildings in Brazil using life cycle assessment (LCA). Constr. Build. Mater. 2018, 169, 748–761. [Google Scholar] [CrossRef]
- Zhan, J.; Liu, W.; Wu, F.; Li, Z.; Wang, C. Life cycle energy consumption and greenhouse gas emissions of urban residential buildings in Guangzhou city. J. Clean. Prod. 2018, 194, 318–326. [Google Scholar] [CrossRef]
- Li, D.; Cui, P.; Lu, Y. Development of an automated estimator of life-cycle carbon emissions for residential buildings: A case study in Nanjing, China. Habitat Int. 2016, 57, 154–163. [Google Scholar] [CrossRef]
- Wu, X.; Peng, B.; Lin, B. A dynamic life cycle carbon emission assessment on green and non-green buildings in China. Energy Build. 2017, 149, 272–281. [Google Scholar] [CrossRef]
- Huang, L.; Liu, Y.; Krigsvoll, G.; Johansen, F. Life cycle assessment and life cycle cost of university dormitories in the southeast China: Case study of the university town of Fuzhou. J. Clean. Prod. 2018, 173, 151–159. [Google Scholar] [CrossRef]
- Yang, X.; Hu, M.; Wu, J.; Zhao, B. Building-information-modeling enabled life cycle assessment, a case study on carbon footprint accounting for a residential building in China. J. Clean. Prod. 2018, 183, 729–743. [Google Scholar] [CrossRef]
- Li, D.Z.; Chen, H.X.; Hui, E.C.M.; Zhang, J.B.; Li, Q.M. A methodology for estimating the life-cycle carbon efficiency of a residential building. Build. Environ. 2013, 59, 448–455. [Google Scholar] [CrossRef]
- Zeng, D.; Ren, H. Assessment of Building Greenhouse Gas Emissions Based on Hybrid Life-cycle Model. In Proceedings of the 2nd International Conference on Electronic and Mechanical Engineering and Information Technology, Shenyang, China, 7 September 2012; Atlantis Press: Paris, France, 2012. [Google Scholar]
- Dong, L.; Wang, Y.; Li, H.X.; Jiang, B.; Al-Hussein, M. Carbon reduction measures-based LCA of prefabricated temporary housing with renewable energy systems. Sustainability 2018, 10, 718. [Google Scholar] [CrossRef] [Green Version]
- Satola, D.; Kristiansen, A.B.; Houlihan-Wiberg, A.; Gustavsen, A.; Ma, T.; Wang, R.Z. (2020). Comparative life cycle assessment of various energy efficiency designs of a container-based housing unit in China: A case study. Build. Environ. 2020, 186, 107358. [Google Scholar] [CrossRef]
- Yim, S.; Ng, S.; Hossain, M.; Wong, J. Comprehensive Evaluation of Carbon Emissions for the Development of High-Rise Residential Building. Buildings 2018, 8, 147. [Google Scholar] [CrossRef] [Green Version]
- Gan, V.J.L.; Deng, M.; Tse, K.T.; Chan, C.M.; Lo, I.M.C.; Cheng, J.C.P. Holistic BIM framework for sustainable low carbon design of high-rise buildings. J. Clean. Prod. 2018, 195, 1091–1104. [Google Scholar] [CrossRef]
- Chel, A.; Tiwari, G.N. Thermal performance and embodied energy analysis of a passive house—Case study of vault roof mud-house in India. Appl. Energy 2009, 86, 1956–1969. [Google Scholar] [CrossRef]
- Ishaq, A.; Khan, R.A.; Meezab, S. Life Cycle Environmental Assessment of an Office and Residential Building in Northern India. Int. J. Innov. Technol. Explor. Eng. 2019, 4, 114–121. [Google Scholar]
- Surahman, U.; Kubota, T.; Higashi, O. Life Cycle Assessment of Energy and CO2 Emissions for Residential Buildings in Jakarta and Bandung, Indonesia. Buildings 2015, 5, 1091–1104. [Google Scholar] [CrossRef] [Green Version]
- Tonooka, Y.; Takaguchi, H.; Yasui, K.; Maeda, T. Life Cycle Assessment of a Domestic Natural Materials Wood House. Energy Procedia 2014, 61, 1634–1637. [Google Scholar] [CrossRef] [Green Version]
- Ohta, I. Embodied CO2 Evaluation of a Zero Life-Cycle CO2 Home: A Case Study of an Actual Industrialized Home. J. Asian Archit. Build. Eng. 2017, 16, 231–237. [Google Scholar] [CrossRef] [Green Version]
- Gerilla, G.P.; Teknomo, K.; Hokao, K. An environmental assessment of wood and steel reinforced concrete housing construction. Build. Environ. 2007, 42, 2778–2784. [Google Scholar] [CrossRef]
- Tae, S.; Shin, S.; Woo, J.; Roh, S. The development of apartment house life cycle CO2 simple assessment system using standard apartment houses of South Korea. Renew. Sustain. Energy Rev. 2011, 15, 1454–1467. [Google Scholar] [CrossRef]
- Tae, S.; Baek, C.; Roh, S. Life Cycle CO2 Evaluation on Reinforced Concrete Structures With High-Strength Concrete. Environ. Impact Assess. Rev. 2016, 31, 17–38. [Google Scholar] [CrossRef]
- Cho, S.H.; Chae, C.U. A study on life cycle CO2 emissions of low-carbon building in South Korea. Sustainability 2016, 8, 579. [Google Scholar] [CrossRef] [Green Version]
- Baek, C.; Tae, S.; Kim, R.; Shin, S. Life Cycle CO2 assessment by block type changes of apartment housing. Sustainability 2016, 8, 752. [Google Scholar] [CrossRef] [Green Version]
- Roh, S.; Tae, S.; Suk, S.J.; Ford, G.; Shin, S. Development of a building life cycle carbon emissions assessment program (BEGAS 2.0) for Korea’s green building index certification system. Renew. Sustain. Energy Rev. 2016, 53, 954–965. [Google Scholar] [CrossRef]
- Bukoski, J.J.; Chaiwiwatworakul, P.; Gheewala, S.H. The Life Cycle Assessment of an Energy-Positive Peri-Urban Residence in a Tropical Regime. J. Ind. Ecol. 2017, 21, 1115–1127. [Google Scholar] [CrossRef]
- Chang, Y.S.; Lee, K.P. Life Cycle Carbon Dioxide Emission Assessment of Housing in Taiwan. Appl. Mech. Mater. 2013, 479–480, 1071–1075. [Google Scholar] [CrossRef]
- Fesanghary, M.; Asadi, S.; Woo, Z. Design of low-emission and energy-ef fi cient residential buildings using a multi-objective optimization algorithm. Build. Environ. 2012, 49, 245–250. [Google Scholar] [CrossRef]
- Mosteiro-romero, M.; Krogmann, U.; Wallbaum, H.; Ostermeyer, Y.; Senick, J.S.; Andrews, C.J. Relative importance of electricity sources and construction practices in residential buildings: A Swiss-US comparison of energy related life-cycle impacts. Energy Build. 2014, 68, 620–631. [Google Scholar] [CrossRef]
- Winistorfer, P.; Chen, Z.J.; Lippke, B.; Stevens, N. Energy consumption and greenhouse gas emissions related to the use, maintenance, and disposal of a residential structure. Wood Fiber Sci. 2005, 37, 128–139. [Google Scholar]
- Davies, P.J.; Emmitt, S.; Firth, S.K. Challenges for capturing and assessing initial embodied energy: A contractor’s perspective. Constr. Manag. Econ. 2014, 32, 290–308. [Google Scholar] [CrossRef] [Green Version]
- Lenzen, M. Errors in conventional and Input-Output—Based Life—Cycle inventories. J. Ind. Ecol. 2000, 4, 127–148. [Google Scholar] [CrossRef]
- Crawford, R.H. Validation of a hybrid life-cycle inventory analysis method. J. Environ. Manag. 2008, 88, 496–506. [Google Scholar] [CrossRef]
- Majeau-Bettez, G.; Strømman, A.H.; Hertwich, E.G. Evaluation of process-and input–output-based life cycle inventory data with regard to truncation and aggregation issues. Environ. Sci. Technol. 2011, 45, 10170–10177. [Google Scholar] [CrossRef]
- Crawford, R.H.; Bontinck, P.-A.; Stephan, A.; Wiedmann, T.; Yu, M. Hybrid life cycle inventory methods—A review. J. Clean. Prod. 2018, 172, 1273–1288. [Google Scholar] [CrossRef]
- Crawford, R.H.; Stephan, A.; Prideaux, F. Environmental Performance in Construction (EPiC) Database; Univeristy of Melbourne: Melbourne, Australia, 2019. [Google Scholar] [CrossRef]
- Guan, J.; Zhang, Z.; Chu, C. Quantification of building embodied energy in China using an input–output-based hybrid LCA model. Energy Build. 2016, 110, 443–452. [Google Scholar] [CrossRef]
- Crawford, R. Life Cycle Assessment in the Built Environment; Taylor & Francis: New York, NY, USA, 2011; ISBN 1135245096. [Google Scholar]
- Crawford, R.H.; Treloar, G.J. Validation of the use of Australian inpit-output data for building embodied energy simulation. In Proceedings of the Eighth International Building Performance Simulation Association Conference on Building Simulation: For better Building Design, Eindhoven, The Netherlands, 11–14 August 2003; pp. 235–242. [Google Scholar]
- Nässén, J.; Holmberg, J.; Wadeskog, A.; Nyman, M. Direct and indirect energy use and carbon emissions in the production phase of buildings: An input-output analysis. Energy 2007, 32, 1593–1602. [Google Scholar] [CrossRef]
- Omar, W.M.S.W. A hybrid life cycle assessment of embodied energy and carbon emissions from conventional and industrialised building systems in Malaysia. Energy Build. 2018, 167, 253–268. [Google Scholar] [CrossRef]
- Crawford, R.H.; Stephan, A. The Significance of Embodied Energy in Certified Passive Houses; World Academy of Science, Engineering and Technology (WASET): Turkey. 2013, p. 253. Available online: https://www.researchgate.net/publication/257939548_The_significance_of_embodied_energy_in_certified_passive_houses (accessed on 23 December 2020).
- Crawford, R.H.; Stephan, A.; Prideaux, F. A Comprehensive Database of Environmental Flow Coefficients for Construction Materials: Closing the Loop in Environmental Design; Architectural Science Association (ANZAScA): Melbourne, Australia, 2019. [Google Scholar]
- Dodoo, A.; Tettey, U.Y.A.; Gustavsson, L. Influence of simulation assumptions and input parameters on energy balance calculations of residential buildings. Energy 2017, 120, 718–730. [Google Scholar] [CrossRef]
- Ramon, D.; Allacker, K. Integrating climate change in life cycle assessment of buildings: Literature review. IOP Conf. Ser. Earth Environ. Sci. 2019, 323, 012064. [Google Scholar] [CrossRef]
- Invidiata, A.; Ghisi, E. Impact of climate change on heating and cooling energy demand in houses in Brazil. Energy Build. 2016, 130, 20–32. [Google Scholar] [CrossRef]
- Chen, Y.; Li, M.; Xiong, M.; Cao, J.; Li, J. Future climate change on energy consumption of office buildings in different climate zones of china. Pol. J. Environ. Stud. 2018, 27, 45–53. [Google Scholar] [CrossRef]
- Stagrum, A.E.; Kvande, T.; Engeba, A.; Andenæs, E.; Lohne, J. Climate implication and adaptation measures for energy use in buildings—A scoping review. IOP Conf. Ser. Earth Environ. Sci. 2019, 297. [Google Scholar] [CrossRef]
- Yan, H.; Shen, G.; Fan, L.; Wang, Y.; Zhang, L. Greenhouse gas emissions in building construction: A case study of One Peking in Hong Kong. Build. Environ. 2010, 45, 949–955. [Google Scholar] [CrossRef] [Green Version]
- Kristiansen, A.B.; Ma, T.; Wang, R.Z. Perspectives on industrialized transportable solar powered zero energy buildings. Renew. Sustain. Energy Rev. 2019, 108, 112–124. [Google Scholar] [CrossRef]
- Ouyang, J.; Ge, J.; Shen, T.; Hokao, K.; Gao, J. The Reduction Potential of Energy Consumption, CO2 Emissions and Cost of Existing Urban Residential Buildings in Hangzhou City, China. J. Asian Arch. Build. Eng. 2008, 7, 139–146. [Google Scholar] [CrossRef] [Green Version]
- Hallouin, T.; Lasvaux, S.; Bazzana, M.; Bonnet, R. Building Life Cycle Assessment (LCA): Results sensitivity to the choice of LCA data and reference service lives of construc-tion products. In WSB14 Barcelona; 2014; pp. 1–30. ISBN 978-84-697-1815-5. Available online: https://www.researchgate.net/publication/304211307_Building_Life_Cycle_Assessment_LCA_results_sensitivity_to_the_choice_of_LCA_data_and_reference_service_lives_of_construction_products (accessed on 23 December 2020).
- Monahan, J.; Powell, J.C. An embodied carbon and energy analysis of modern methods of construction in housing: A case study using a lifecycle assessment framework. Energy Build. 2011, 43, 179–188. [Google Scholar] [CrossRef]
- Pomponi, F.; De Wolf, C.; Moncaster, A. Embodied Carbon in Buildings; Springer: Berlin/Heidelberg, Germany, 2018. [Google Scholar] [CrossRef]
- Hassan, S.A.; Jassim, J.A.A.W. The role of multi-story structural building systems on reducing embodied energy consumption and carbon emissions. IOP Conf. Ser. Mater. Sci. Eng. 2019, 518, 22031. [Google Scholar] [CrossRef]
- Zeitz, A.; Griffin, C.T.; Dusicka, P. Comparing the embodied carbon and energy of a mass timber structure system to typical steel and concrete alternatives for parking garages. Energy Build. 2019, 199, 126–133. [Google Scholar] [CrossRef]
- Guo, H.; Liu, Y.; Meng, Y.; Huang, H.; Sun, C.; Shao, Y. A Comparison of the energy saving and carbon reduction performance between reinforced concrete and cross-laminated timber structures in residential buildings in the severe cold region of China. Sustainability 2017, 9, 1426. [Google Scholar] [CrossRef] [Green Version]
- Amziane, S. Overview on biobased building material made with plant aggregate. Sustain. Constr. Mater. Technol. 2016. [Google Scholar] [CrossRef]
- Van der Meer, Y. Sustainable Bio-Based Materials: Opportunities and Challenges; Biobased Materials; RS: FSE AMIBM; RS: FSE Biobased Materials; Sciences; Aachen-Maastricht Institute for Biobased; RS: FSE Sciences. 2017. Available online: https://www.narcis.nl/publication/RecordID/oai:cris.maastrichtuniversity.nl:publications%2Fb6c14514-8524-4233-842c-ead81bbb74d6 (accessed on 23 December 2020).
- Yu, D.; Tan, H.; Ruan, Y. A future bamboo-structure residential building prototype in China: Life cycle assessment of energy use and carbon emissi. Energy Build. 2011, 43, 2638–2646. [Google Scholar] [CrossRef]
- Escamilla, E.Z.; Habert, G.; Wohlmuth, E. When CO2 counts: Sustainability assessment of industrialized bamboo as an alternative for social housing programs in the Philippines. Build. Environ. 2016, 103, 44–53. [Google Scholar] [CrossRef]
- González, A.D. Energy and carbon embodied in straw and clay wall blocks produced locally in the Andean Patagonia. Energy Build. 2014, 70, 15–22. [Google Scholar] [CrossRef]
- Tellnes, L.G.F.; Ganne-Chedeville, C.; Dias, A.; Dolezal, F.; Hill, C.; Escamilla, E.Z. Comparative assessment for biogenic carbon accounting methods in carbon footprint of products: A review study for construction materials based on forest products. IForest 2017, 10, 815–823. [Google Scholar] [CrossRef] [Green Version]
Figure 1.
Systematic review of the literature flowchart. GHG: greenhouse gas and LCA: life cycle assessment.
Figure 1.
Systematic review of the literature flowchart. GHG: greenhouse gas and LCA: life cycle assessment.
Figure 2.
Main structural materials of 75 residential buildings.
Figure 2.
Main structural materials of 75 residential buildings.
Figure 3.
GHG emission factor of electricity from local grids identified in 37 case studies (colour of bars indicates dominant source in energy mix: black, fossil fuel; blue, nuclear and green, renewable).
Figure 3.
GHG emission factor of electricity from local grids identified in 37 case studies (colour of bars indicates dominant source in energy mix: black, fossil fuel; blue, nuclear and green, renewable).
Figure 4.
Flowchart showing harmonisation procedure.
Figure 4.
Flowchart showing harmonisation procedure.
Figure 5.
Locations of 36 case studies in the final sample.
Figure 5.
Locations of 36 case studies in the final sample.
Figure 6.
Harmonised embodied and life cycle GHG emissions from 36 case studies.
Figure 6.
Harmonised embodied and life cycle GHG emissions from 36 case studies.
Figure 7.
Operational and embodied GHG emissions in relation to the energy performances of 26 case buildings.
Figure 7.
Operational and embodied GHG emissions in relation to the energy performances of 26 case buildings.
Figure 8.
Share of embodied and operational-to-total GHG emissions in relation to the energy performances of 26 case buildings.
Figure 8.
Share of embodied and operational-to-total GHG emissions in relation to the energy performances of 26 case buildings.
Figure 9.
(a) Embodied, (b) operational and (c) total life cycle GHG emissions in relation to the residential building typology. n, number of case studies with a specific building typology.
Figure 9.
(a) Embodied, (b) operational and (c) total life cycle GHG emissions in relation to the residential building typology. n, number of case studies with a specific building typology.
Figure 10.
(a) Embodied, (b) operational and (c) total life cycle GHG emissions in relation to the climate zone. n, number of case studies with a specific climate location.
Figure 10.
(a) Embodied, (b) operational and (c) total life cycle GHG emissions in relation to the climate zone. n, number of case studies with a specific climate location.
Figure 11.
(a) Embodied and (b) total life cycle GHG emissions in relation to the primary structure materials. RC, reinforced concrete; C, concrete; S, steel; M, masonry brick; W, wood and All, secondary materials. n, number of case studies with a specific primary structure material.
Figure 11.
(a) Embodied and (b) total life cycle GHG emissions in relation to the primary structure materials. RC, reinforced concrete; C, concrete; S, steel; M, masonry brick; W, wood and All, secondary materials. n, number of case studies with a specific primary structure material.
Figure 12.
Embodied and life cycle GHG emission reduction potentials of the identified design strategies.
Figure 12.
Embodied and life cycle GHG emission reduction potentials of the identified design strategies.
Figure 13.
Operational and life cycle GHG emission reduction potentials of the identified design strategies.
Figure 13.
Operational and life cycle GHG emission reduction potentials of the identified design strategies.
Table 1.
Overview of literature review articles analysing life cycle greenhouse gas (GHG) emissions of buildings.
Table 1.
Overview of literature review articles analysing life cycle greenhouse gas (GHG) emissions of buildings.
| Reference | Number of Cases Analysed | Typology (Residential, Office, etc.) | Climate Region Focus | Life Cycle Stages (Embodied, Operational, Full Life Cycle) | Indicators |
|---|
| Ramesh et al., 2010 [12] | 73 | Residential and office buildings | Temperate (C), continental (D) | Embodied and operational | Primary energy |
| Cabeza et al., 2014 [14] | 38 | Residential, office and industrial buildings | Temperate (C), continental (D) | Embodied and operational | Primary energy, GHG emissions |
| Säynäjoki et al., 2017 [19] | 116 | Residential, office and communal buildings | Temperate (C), continental (D) | Embodied | GHG emissions |
| Chastas et al., 2018 [13] | 95 | Residential | Temperate (C), | Embodied and operational | GHG emissions |
| Röck et al., 2020 [9] | 238 | Residential and office buildings | Temperate (C), continental (D) | Embodied and operational | GHG emissions |
Table 2.
Overview of methodological and building-related criteria influencing the life cycle.
Table 2.
Overview of methodological and building-related criteria influencing the life cycle.
| Feature | Description |
|---|
| Methodological Features |
Life cycle
calculation method | Description of life cycle calculation methodology: process-based, input-output or hybrid |
| System boundaries | Processes included in life cycle assessment (LCA) study |
| Impact assessment method | Life cycle impact assessment method and category/indicator employed in study |
Operational energy
assessment methodology | Method, software and data source used for assessing operational energy use |
| Building Related Features |
| Location/climate | Location (country, city) of case building and climate type according to Koppen-Geiger classification |
| Building type/function | Residential building type: single-family (SF) or multi-family (MF) |
| Gross floor area | Total area of building measured between exterior walls |
| Main structural materials | Primary type of materials used for building construction |
| Lifespan | Life expectancy of building |
| Electricity mixes | Factor applied for evaluating greenhouse gas (GHG) emissions from local electricity grid (kgCO2eq/m2/kWh) |
Table 3.
Geographic location of 75 residential construction case studies from the literature data sample.
Table 3.
Geographic location of 75 residential construction case studies from the literature data sample.
| Geographic Region | Location | Quantity |
|---|
| Oceania | Australia (AU) | 18 |
| South America | Brazil (BR) | 3 |
| Colombia (CO) | 1 |
| Asia | China (CN) | 14 |
| Hong Kong (HK) | 5 |
| India (IN) | 3 |
| Indonesia (ID) | 6 |
| Japan (JP) | 5 |
| South Korea (KR) | 8 |
| Malaysia (MY) | 1 |
| Taiwan (TW) | 2 |
| Thailand (TH) | 5 |
| North America | USA (US) | 4 |
Table 4.
Overview of GHG emission reduction strategies.
Table 4.
Overview of GHG emission reduction strategies.
| | | | GHG Emission Reduction (−) or Increase (+) (%) Relative to Baseline Scenario |
|---|
| Reduction Strategy | Case Study | Description | Embodied | Operational | Total Life Cycle |
|---|
| S1: Maximise use of timber | CS1
AU | Replacement of steel structure frame (base design CS2AU) with timber frame | −30% | −4% | −17% |
| Replacement of concrete slab (base design CS2AU) with elevated timber floor | −21% | −3% | −12% |
| Replacement of brick veneer (base design CS2AU) with weatherboard cladding | −9% | −1% | −5% |
CS13
AU | Switch concrete sub-floor, double brick wall covering and roof steel frame (base design CS12) to timber products | −44% | −1% | −16% |
CS15
AU | Switch concrete sub-floor, double brick wall covering and roof steel frame (base design CS14) to timber products | −69% | −1% | −21% |
CS32
CN | Replace aluminium panel wall (base design CS31CN) with timber wall | −6% | 0% | −5% |
| S2: Improve thermal properties | CS4
AU | Implement reflective insulation for non-insulated carpet floor (base design CS3) | +10% | −7% | −1% |
CS5
AU | Replace non-insulated carpet floor (base design CS3) with insulated hardwood timber floor | +5% | −44% | −26% |
CS66
TH | Replace non-insulated reinforced concrete structure (base design CS65TH) with insulated steel frame | −19% | −29% | −26% |
| S1+S2: Maximise use of timber + improve thermal properties | CS69
TH | Replace non-insulated reinforced concrete structure (base design CS65TH) with insulated timber frame | −52% | −29% | −35% |
| S3: Use lower EC materials | CS58
KR | Replace standard concrete (base design CS57KR) with non-cement concrete panels and amorphous steel fibre concrete (low GHG emission) | −25% | 0% | −7% |
CS61
TW | Replace reinforced concrete structure (base design CS66TW) with lightweight steel frame | −34% | −18% | −25% |
| S4: Increase use of local materials | CS51
JP | Replace standard timber construction with (a) locally produced timber, (b) no laminated wood, (c) natural and locally produced insulation materials | −73% | −41% | −48% |
| S5: Extend building lifetime | CS58
KR | Extend 50-year building lifespan (base design CS57KR) to 100 years by replacing standard 24 MPa strength concrete (base design CS57KR) with high-strength (40 MPa) concrete | −50% | 0% | −8% |
| S6: Optimise form (material efficiency) | CS62
KR | Optimise building form and design by using T-type instead of flat-type concrete blocks (base design CS61KR) | −21% | −30% | −25% |
| S7: Implement PV systems (on site) | CS31
CN | Implement on-site PV system of 2.8 kW in reference to design scenario CS32CN | +79% | −92% | −48% |
CS67
TH | Implement on-site PV system of 5 kW in reference to design scenario CS66TH | +41% | −100% | −59% |
CS69
TH | Implement PV system of 5 kW in reference to design scenario CS68TH | +70% | −100% | −66% |
| Publisher’s Note: MDPI stays neutral with regard to jurisdictional claims in published maps and institutional affiliations. |
© 2020 by the authors. Licensee MDPI, Basel, Switzerland. This article is an open access article distributed under the terms and conditions of the Creative Commons Attribution (CC BY) license (http://creativecommons.org/licenses/by/4.0/).


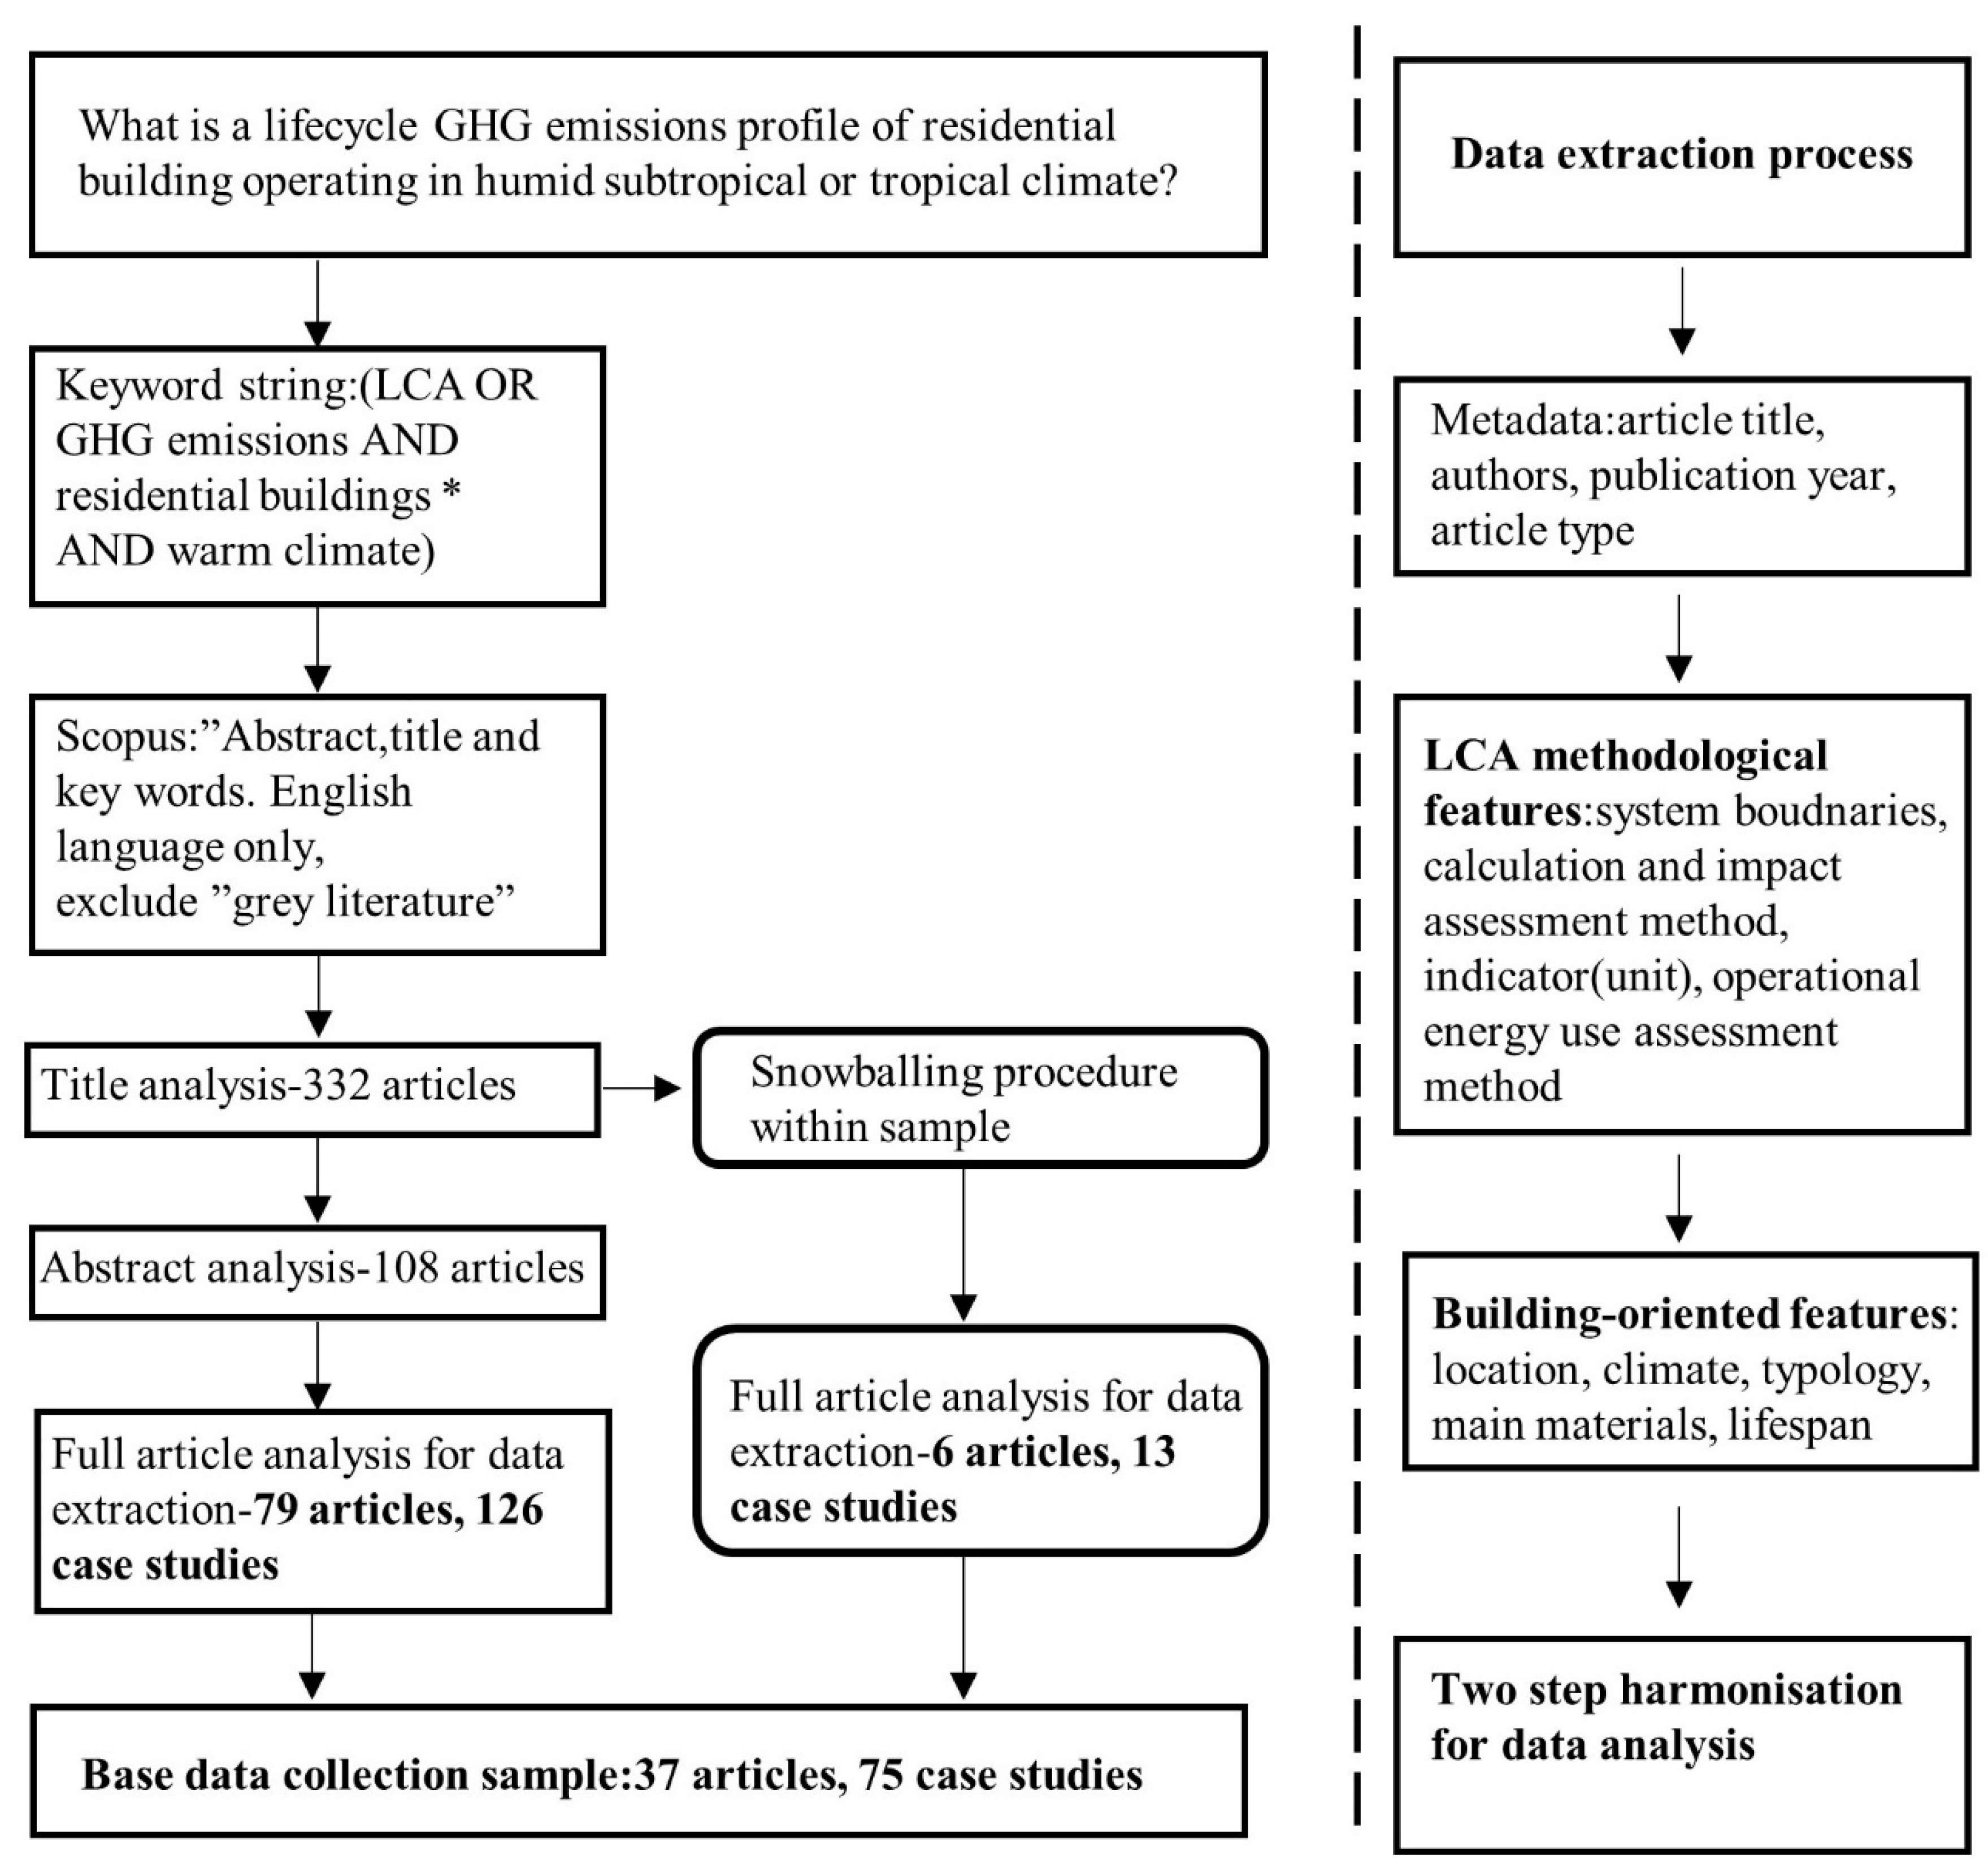
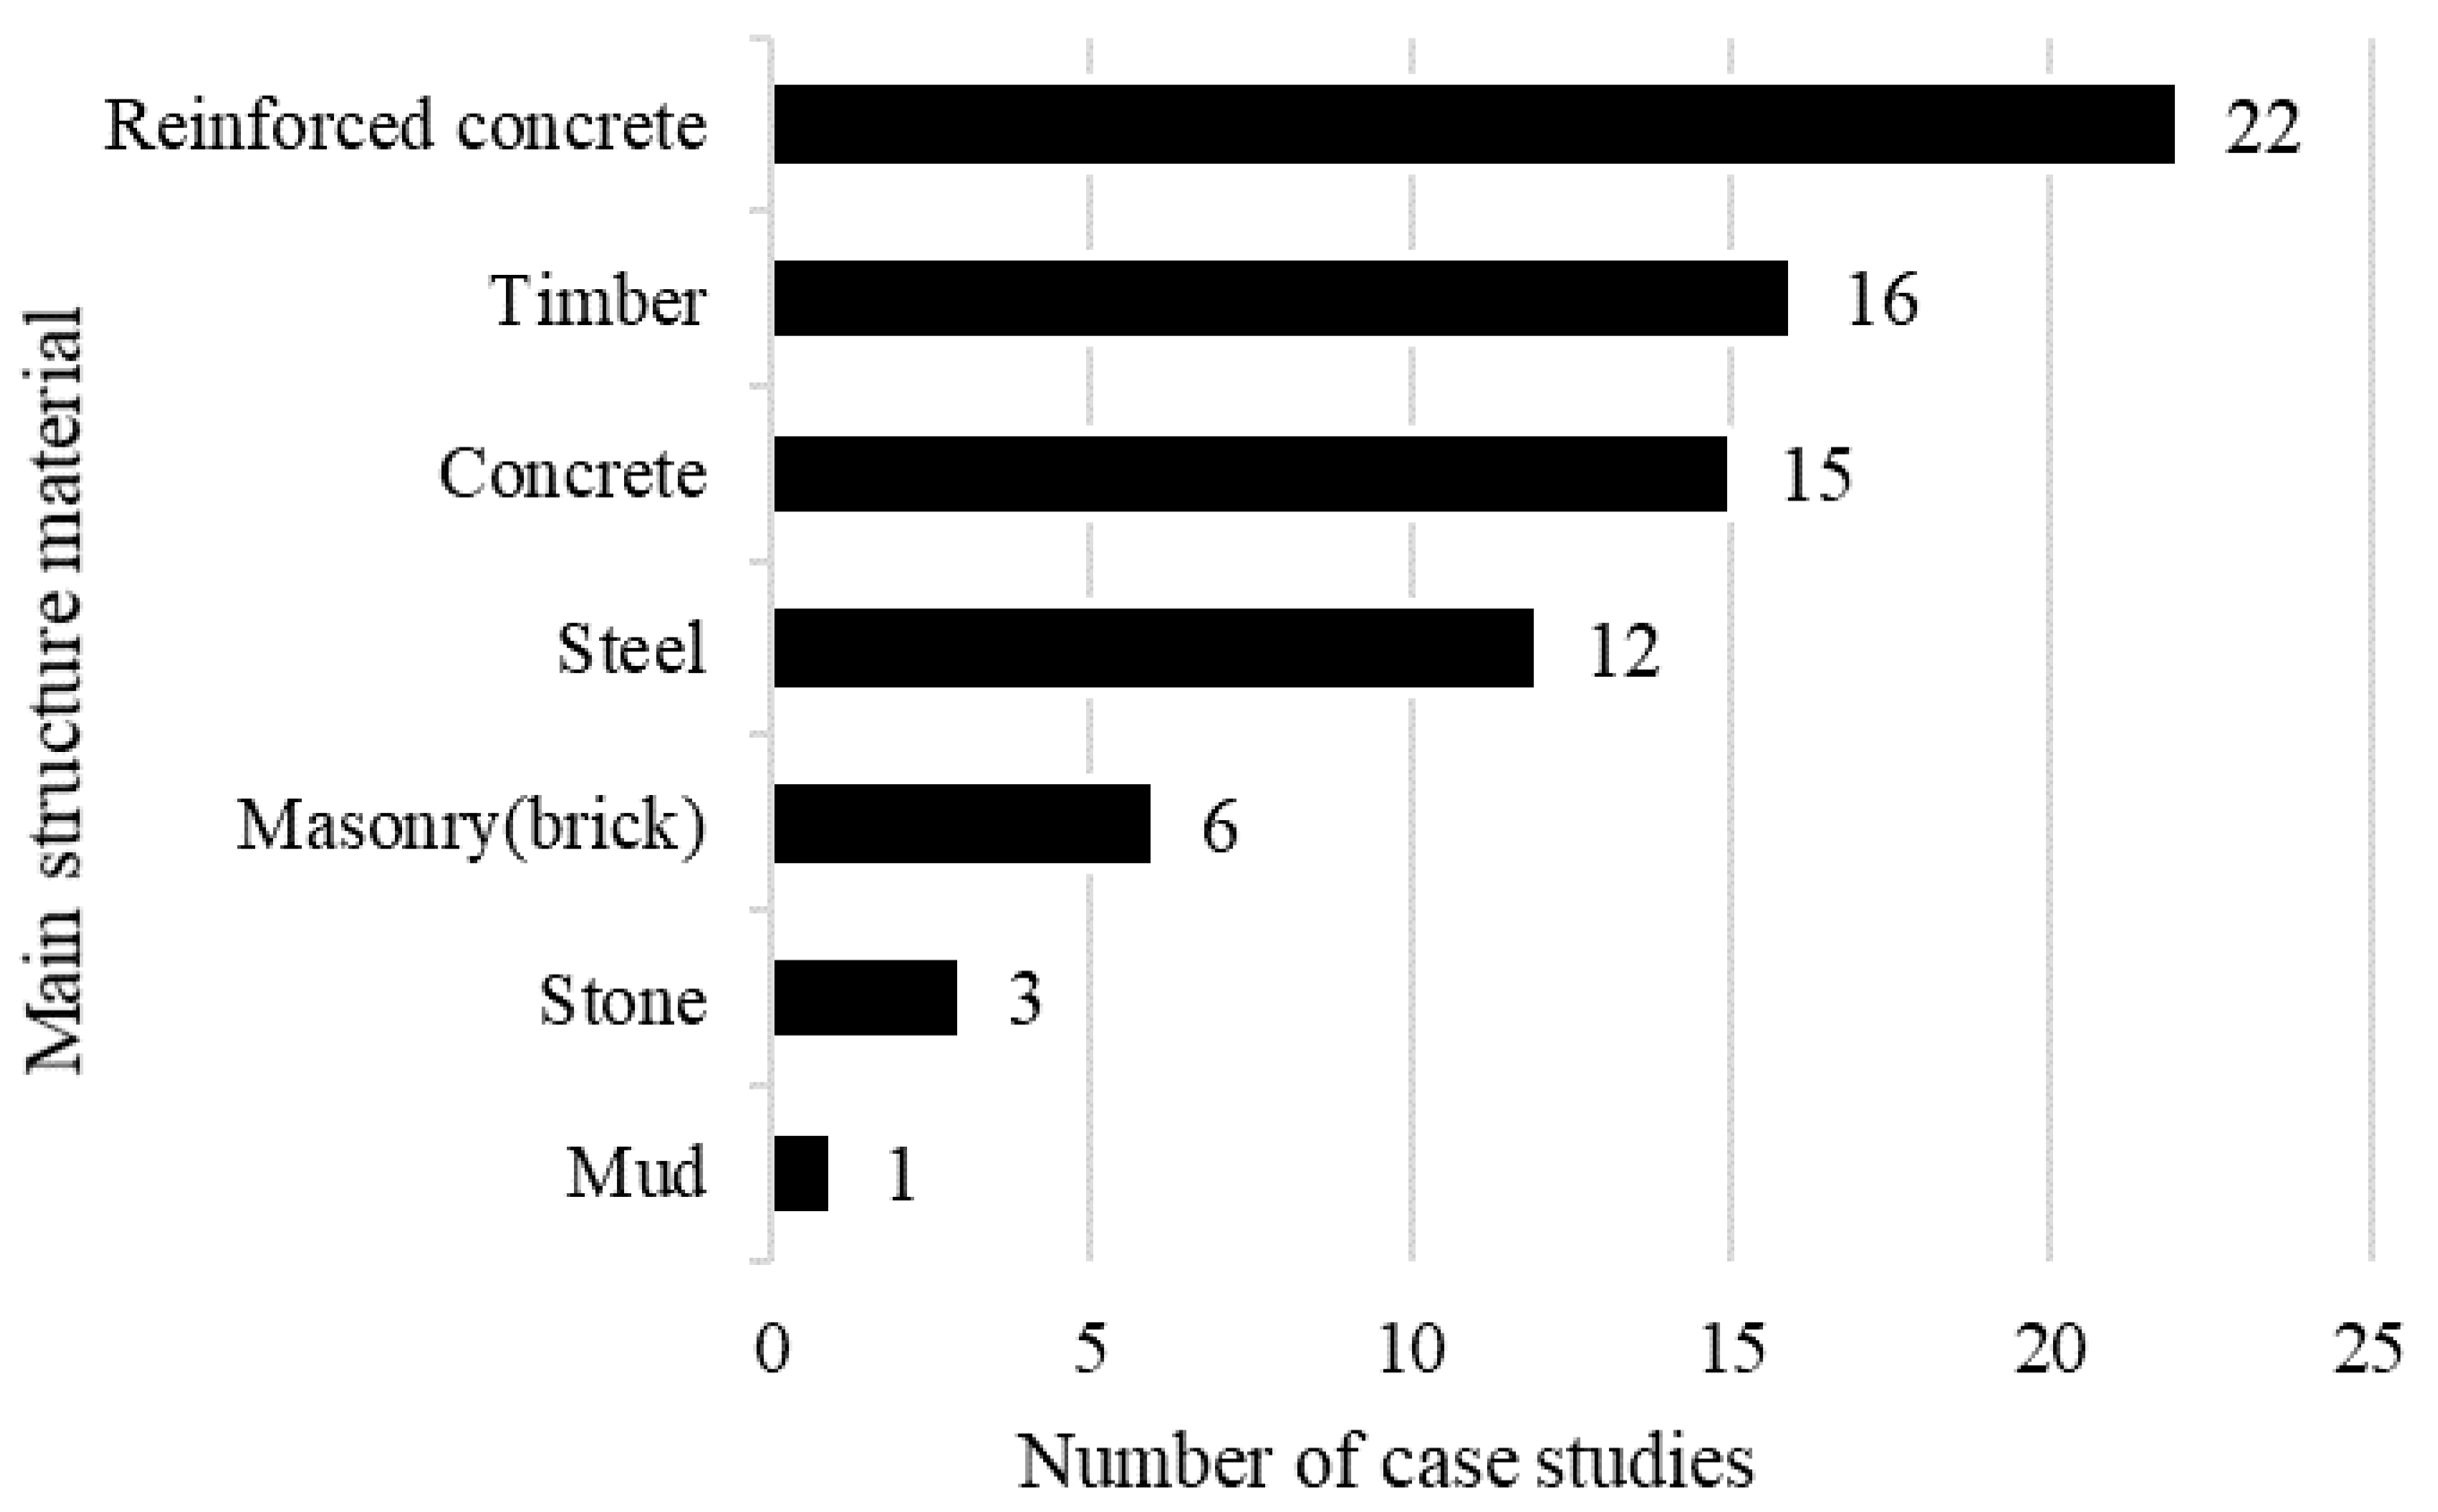
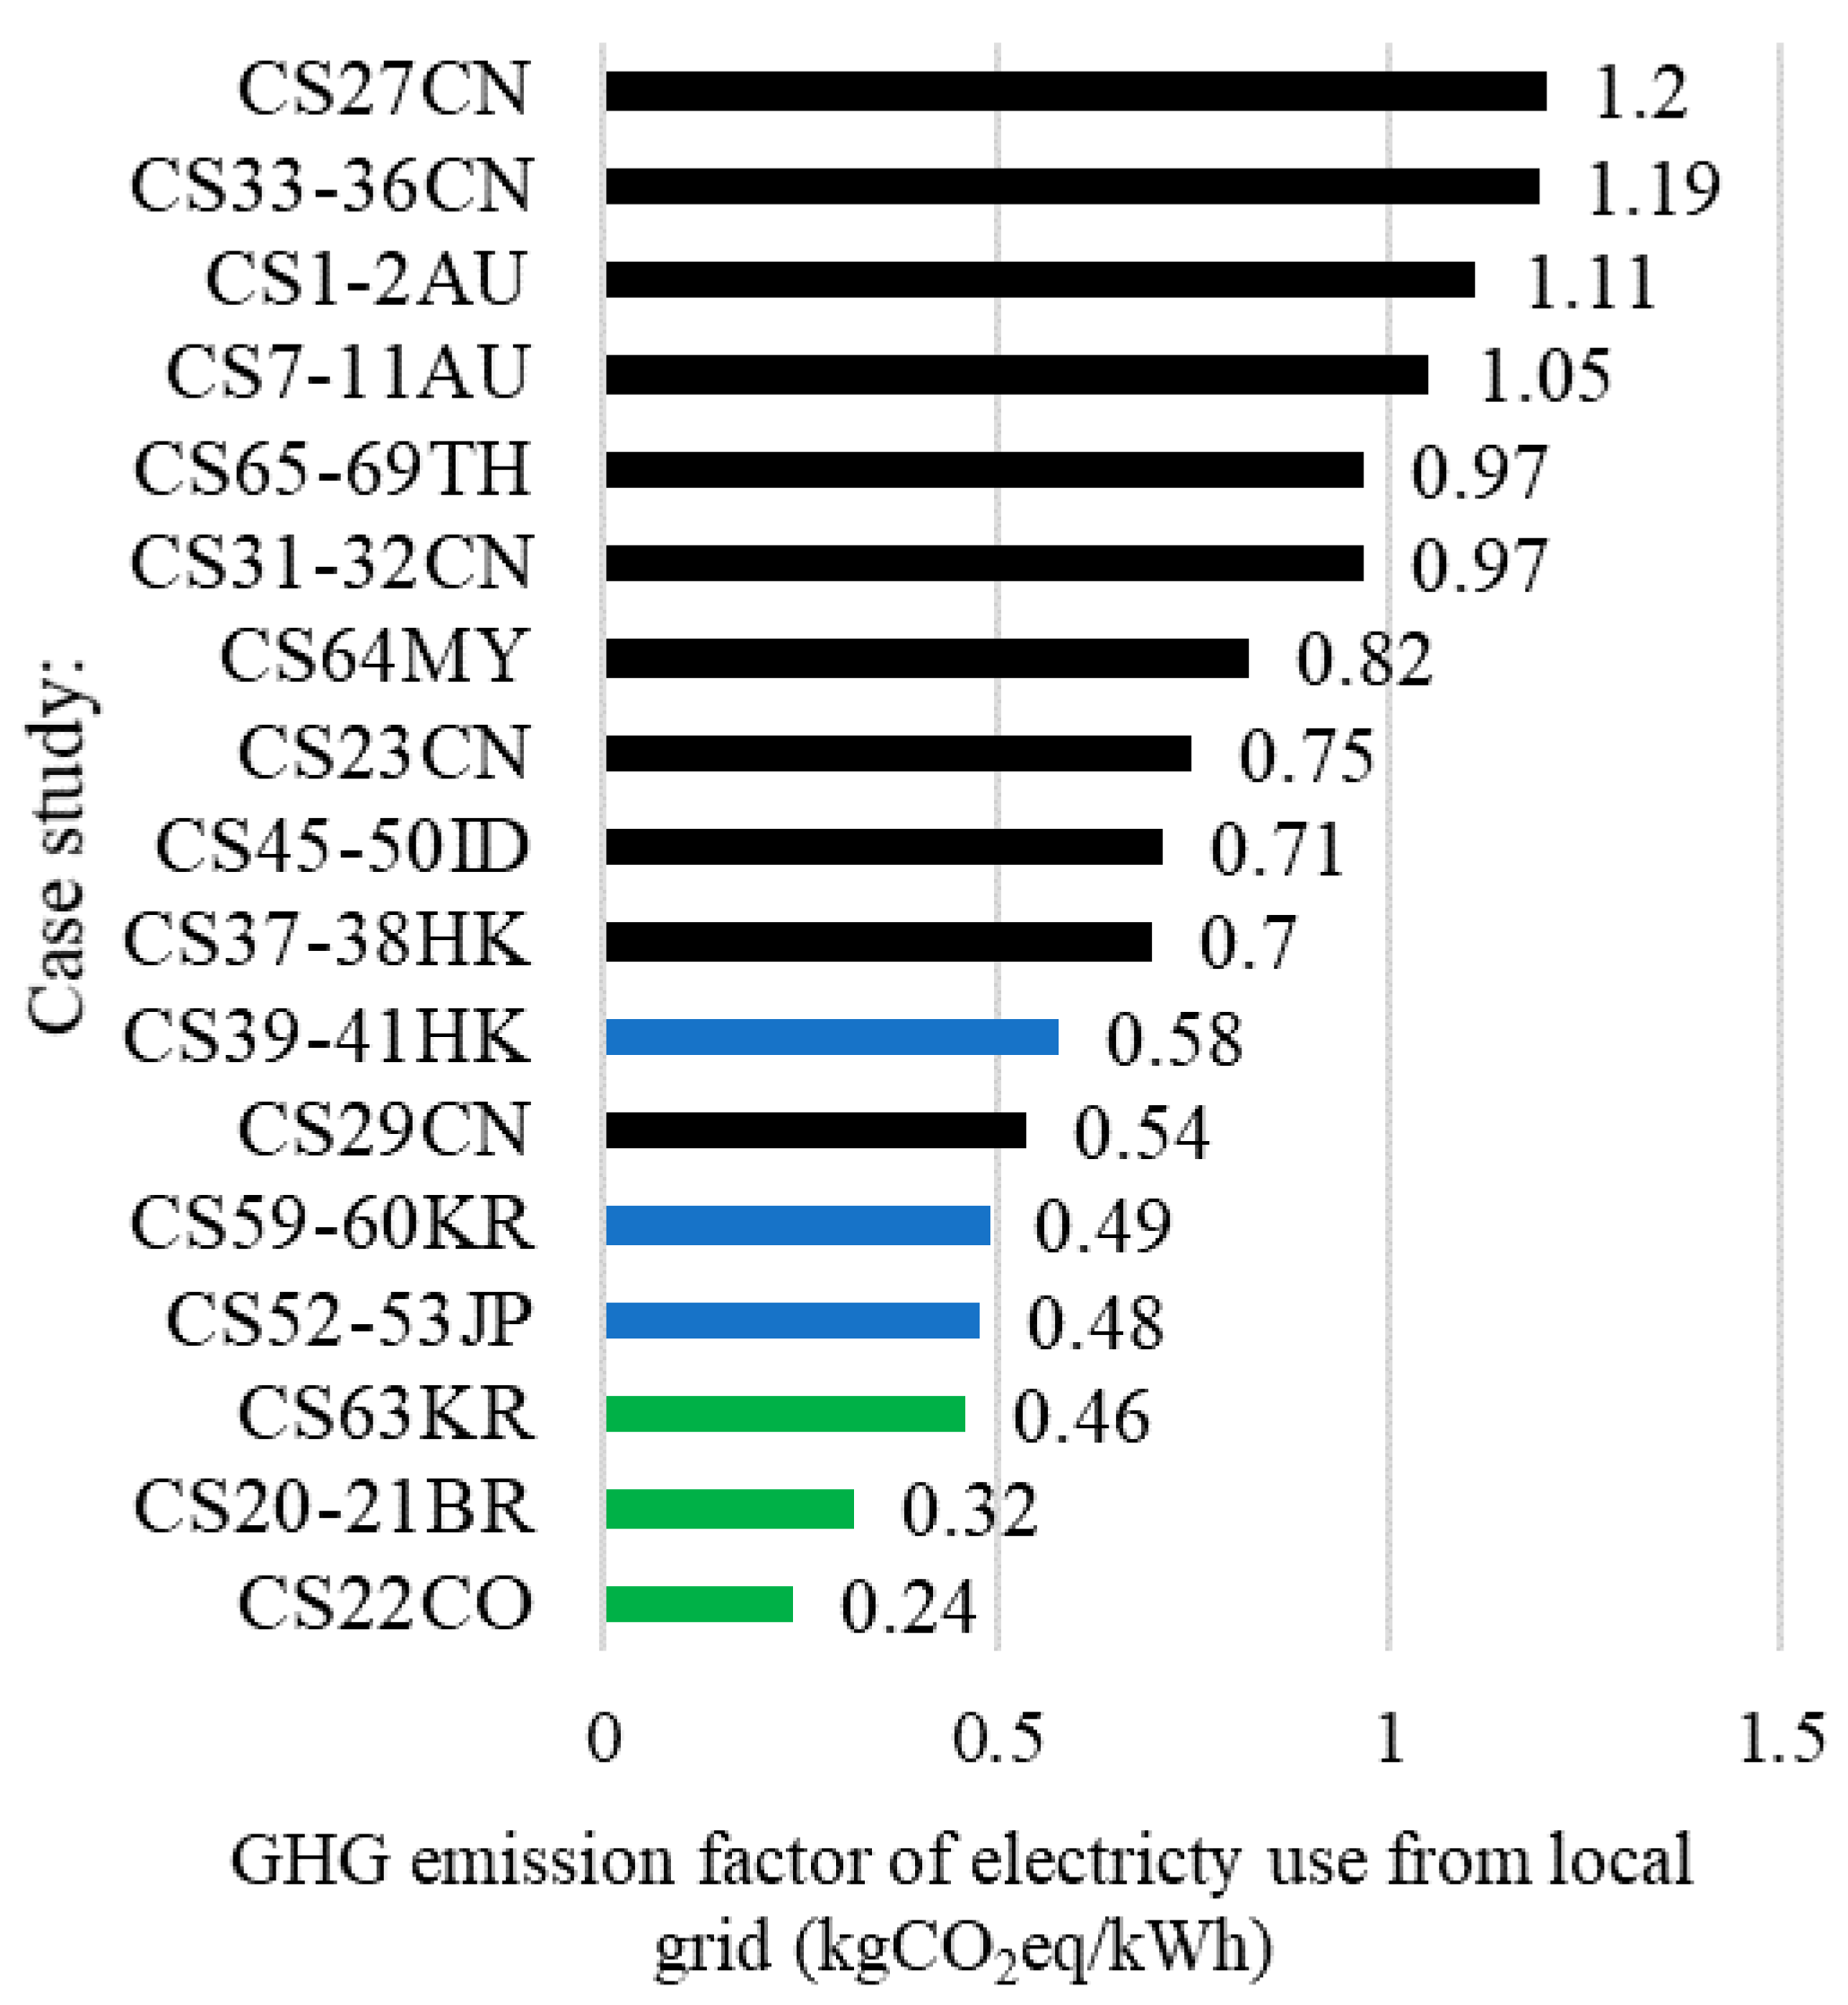
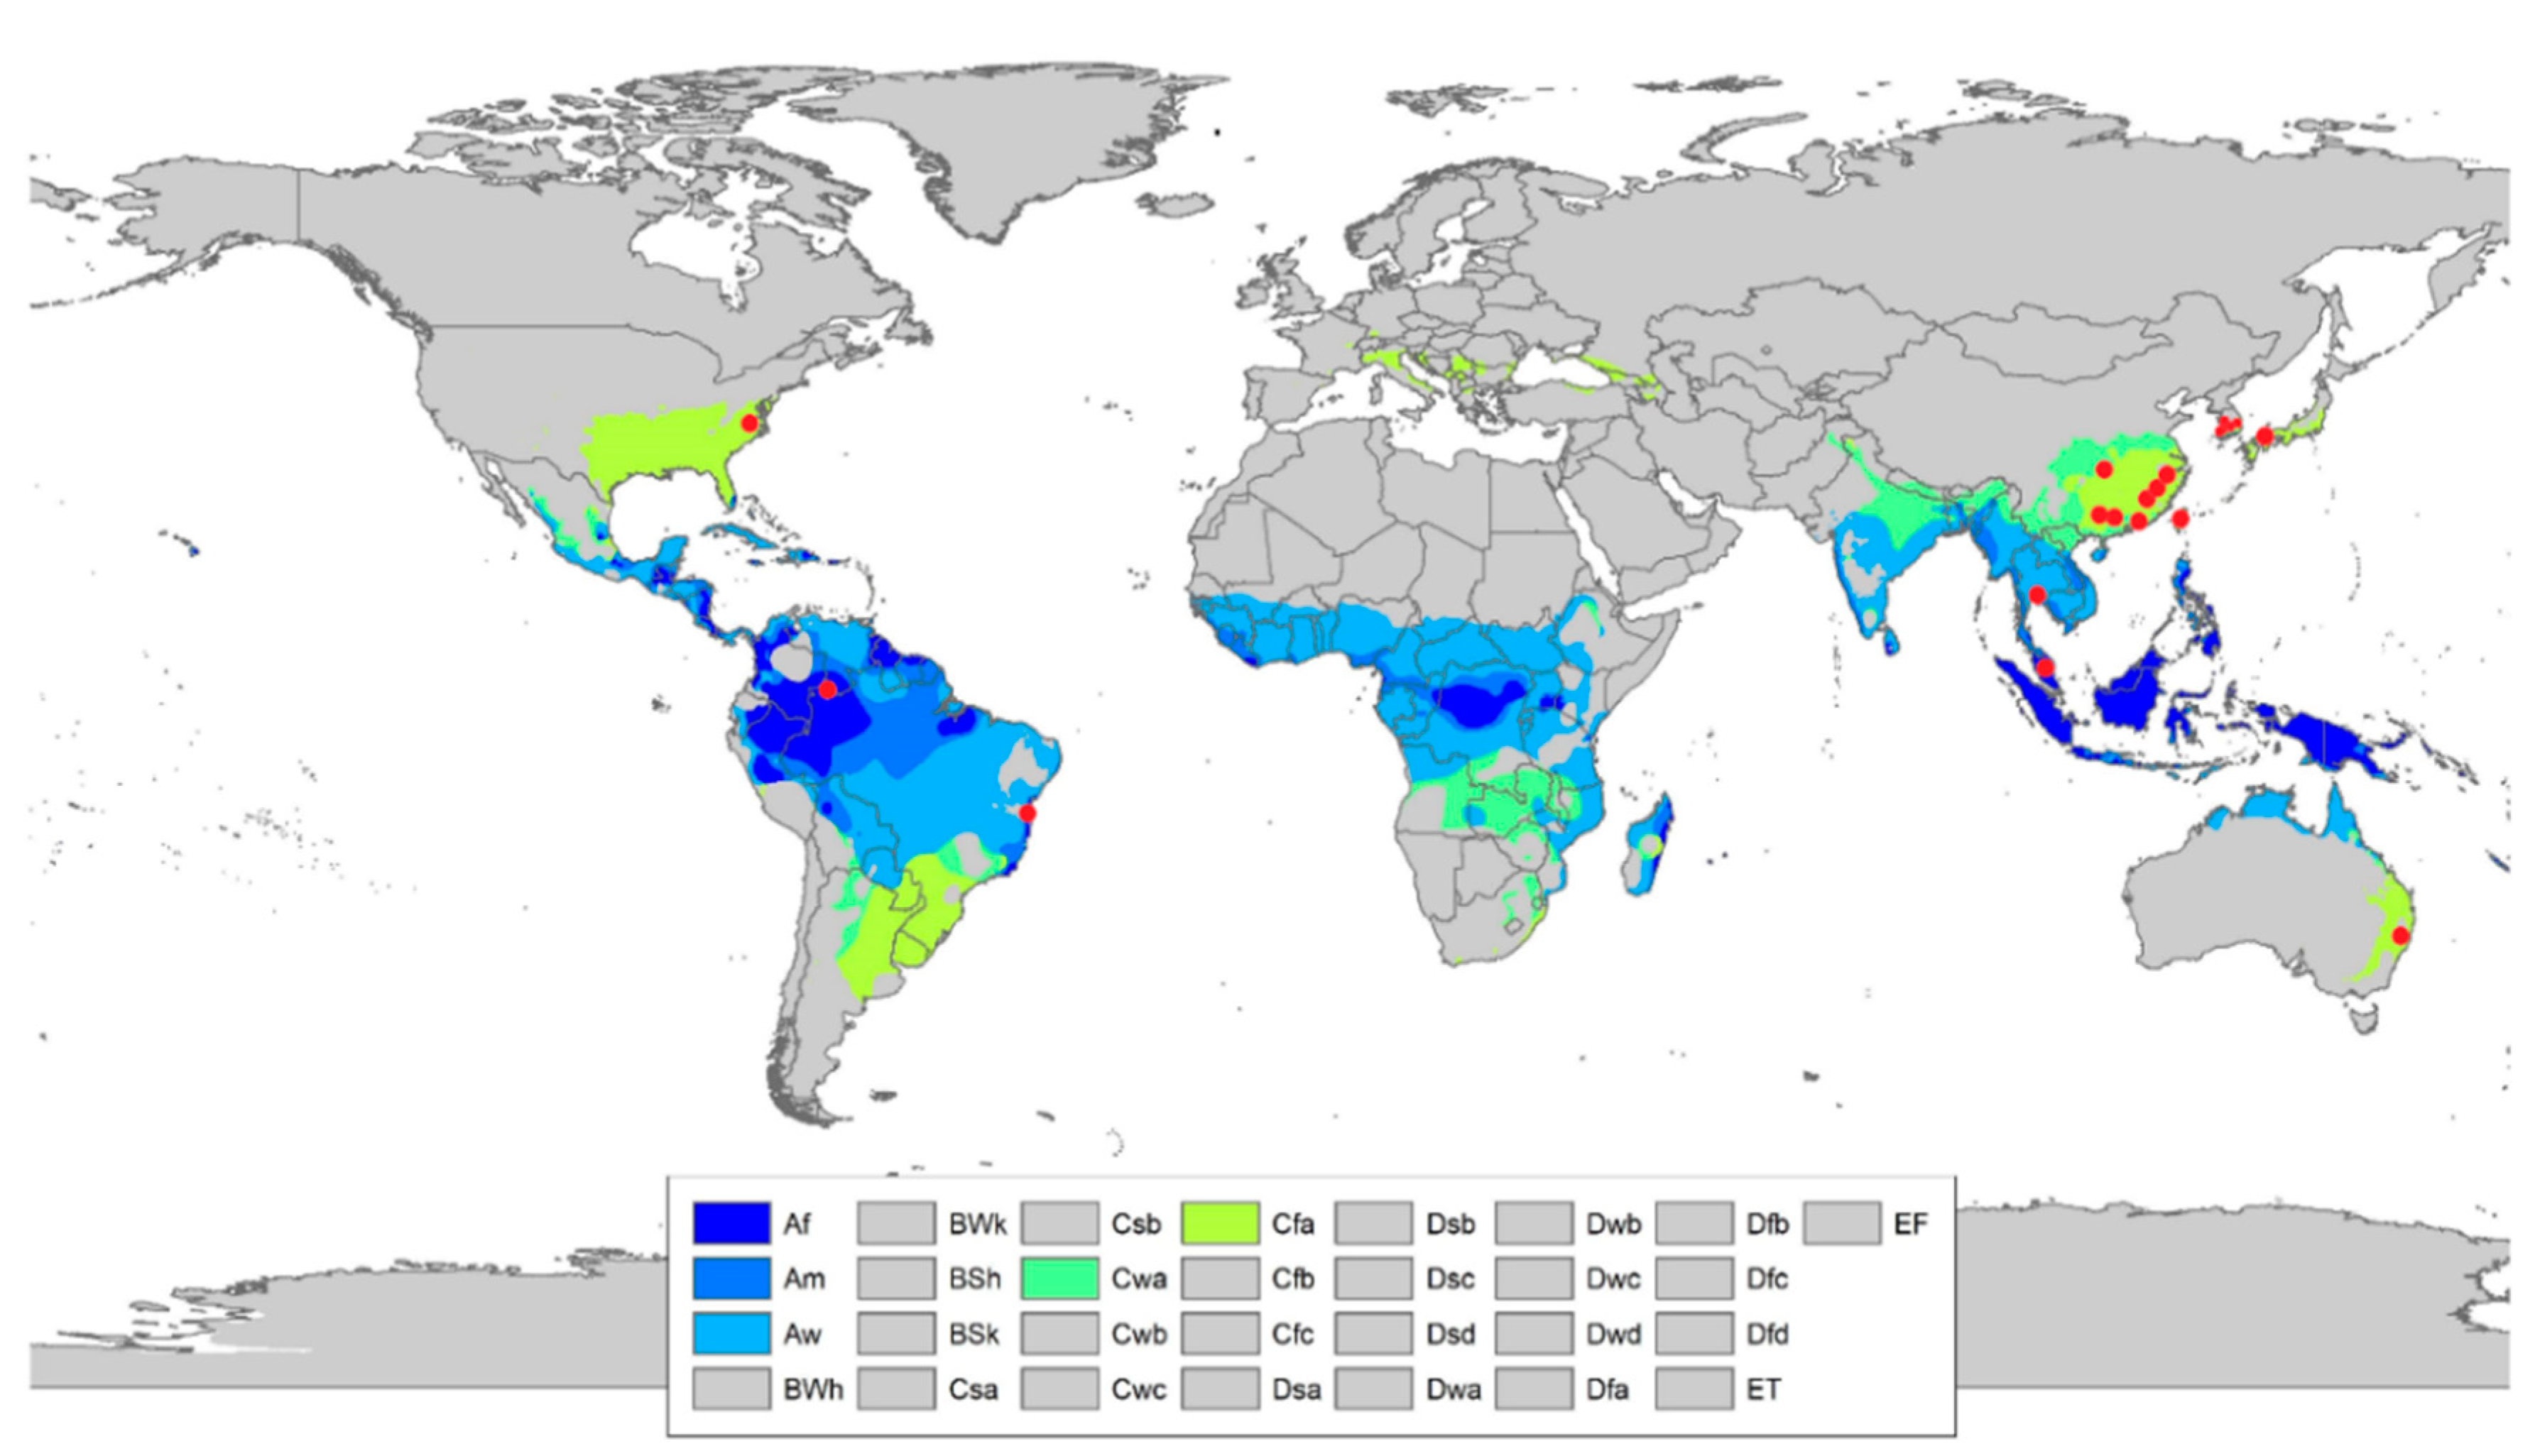
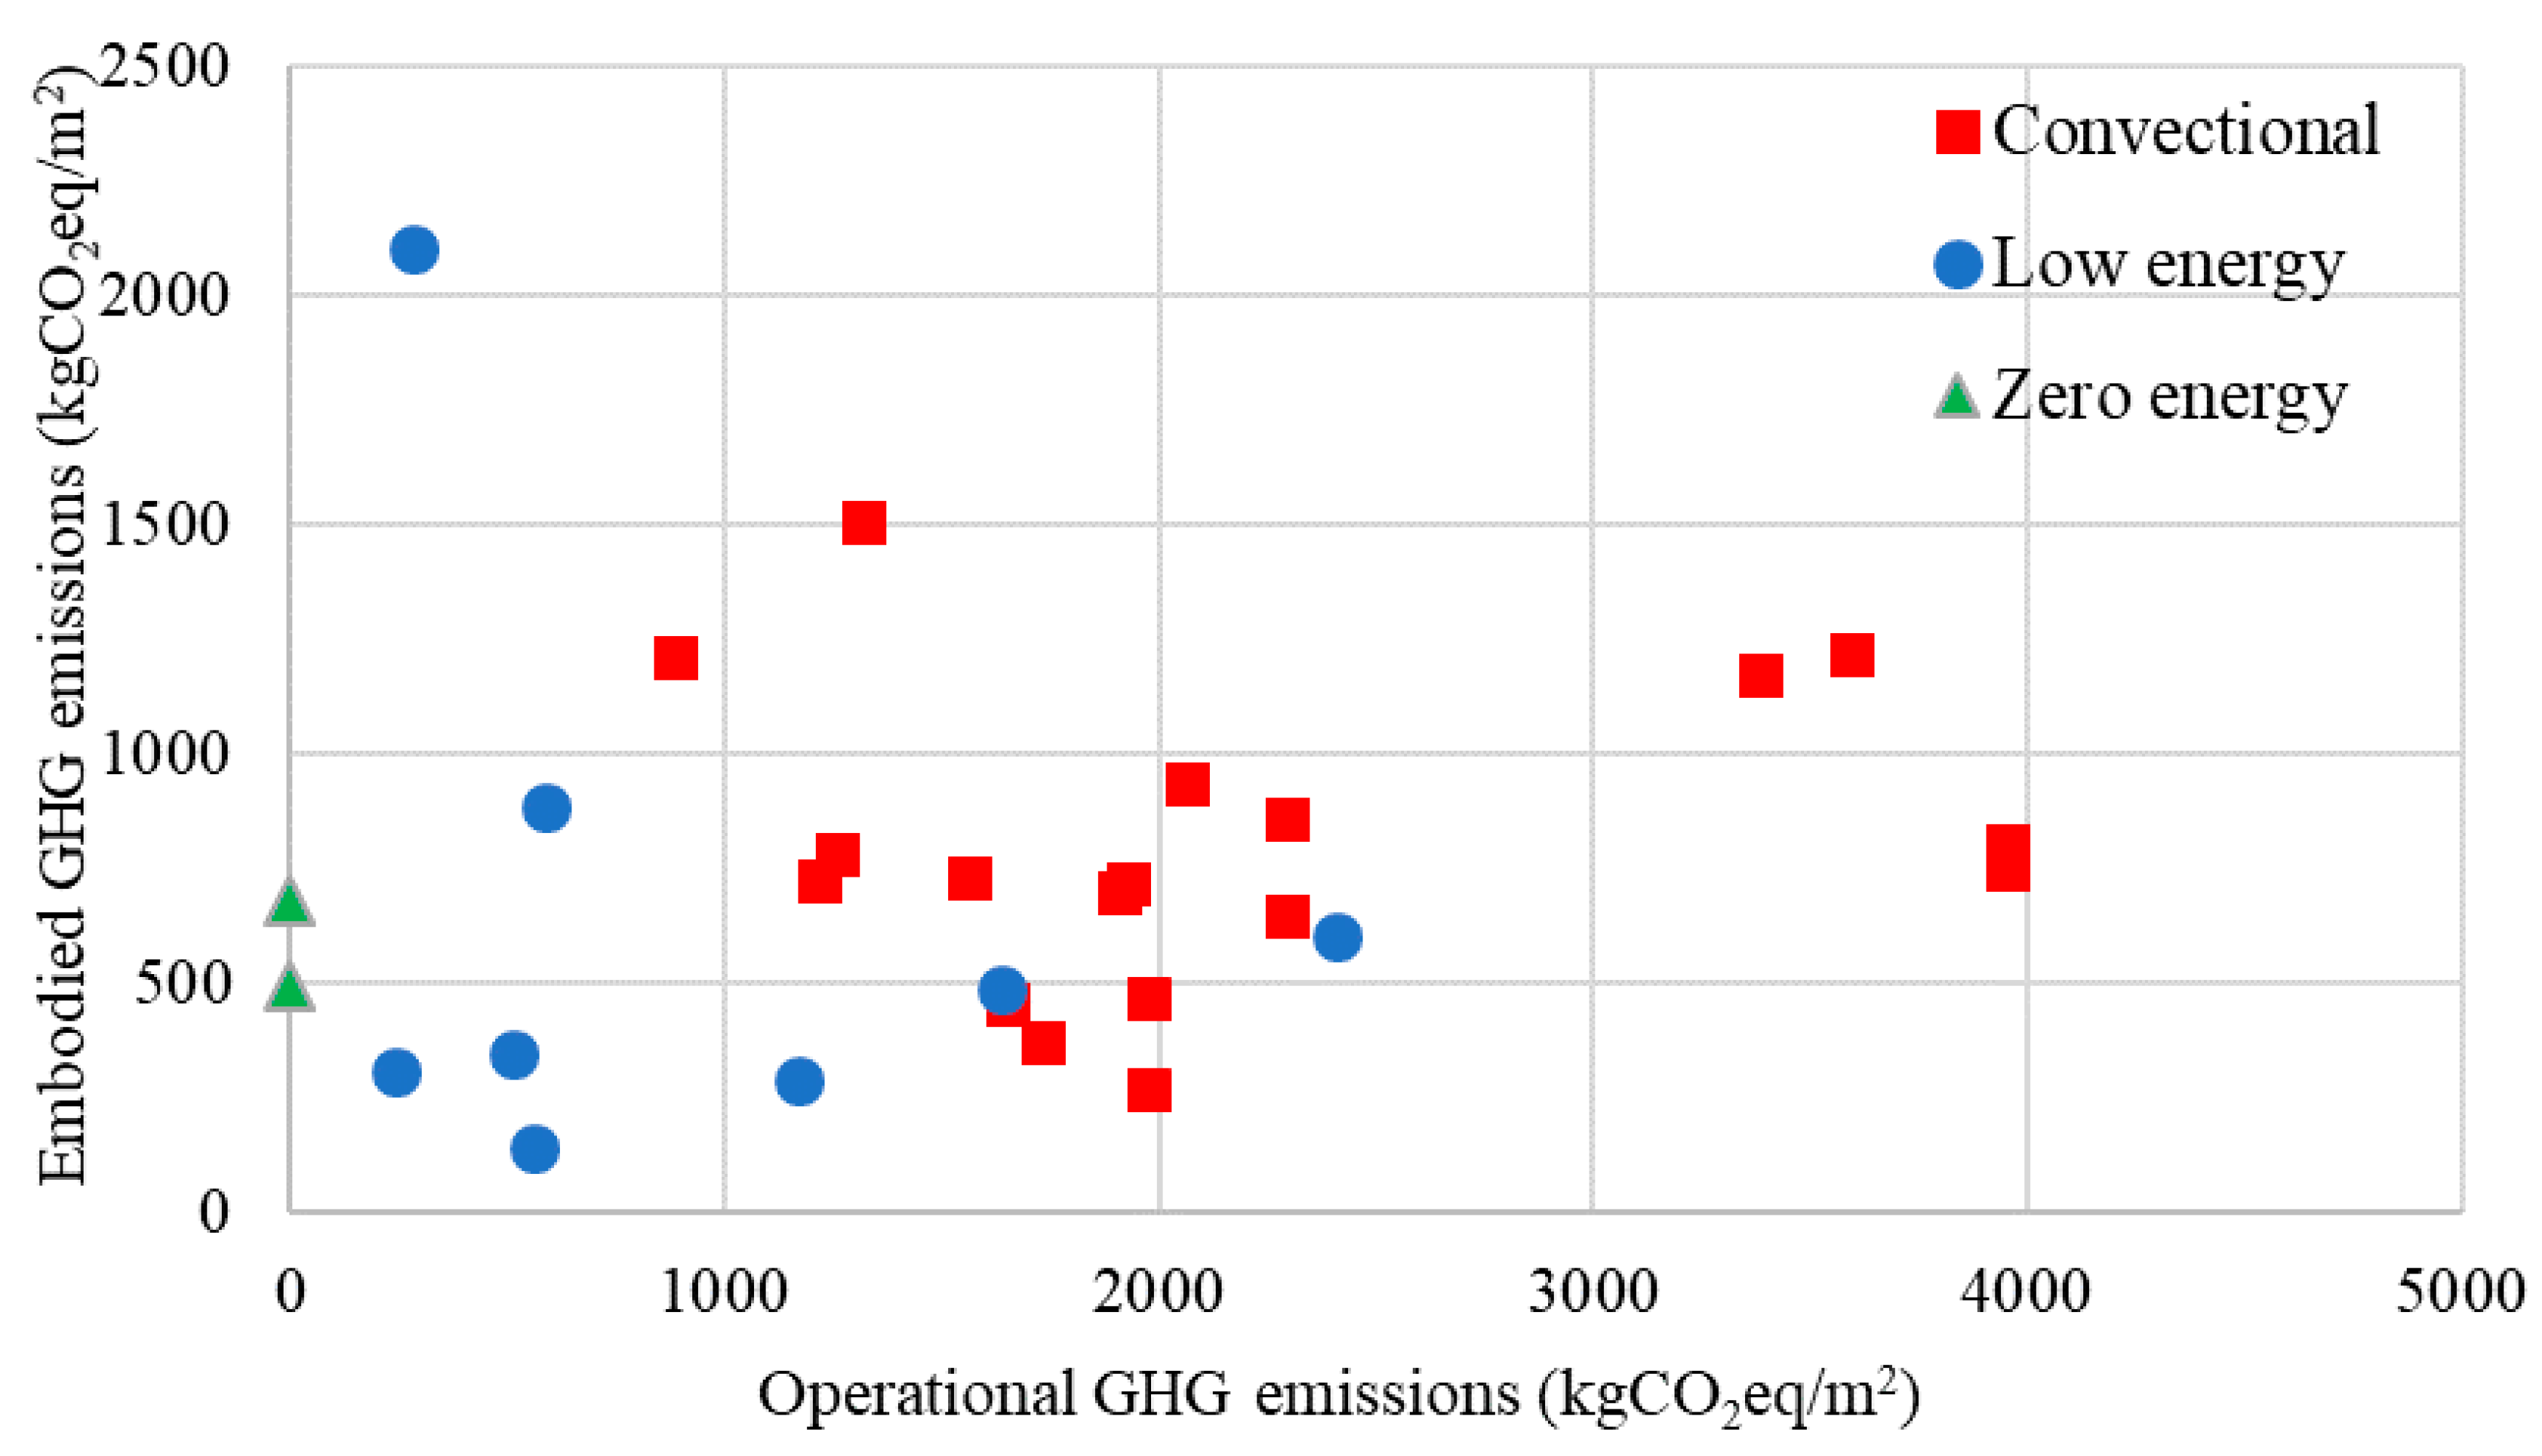
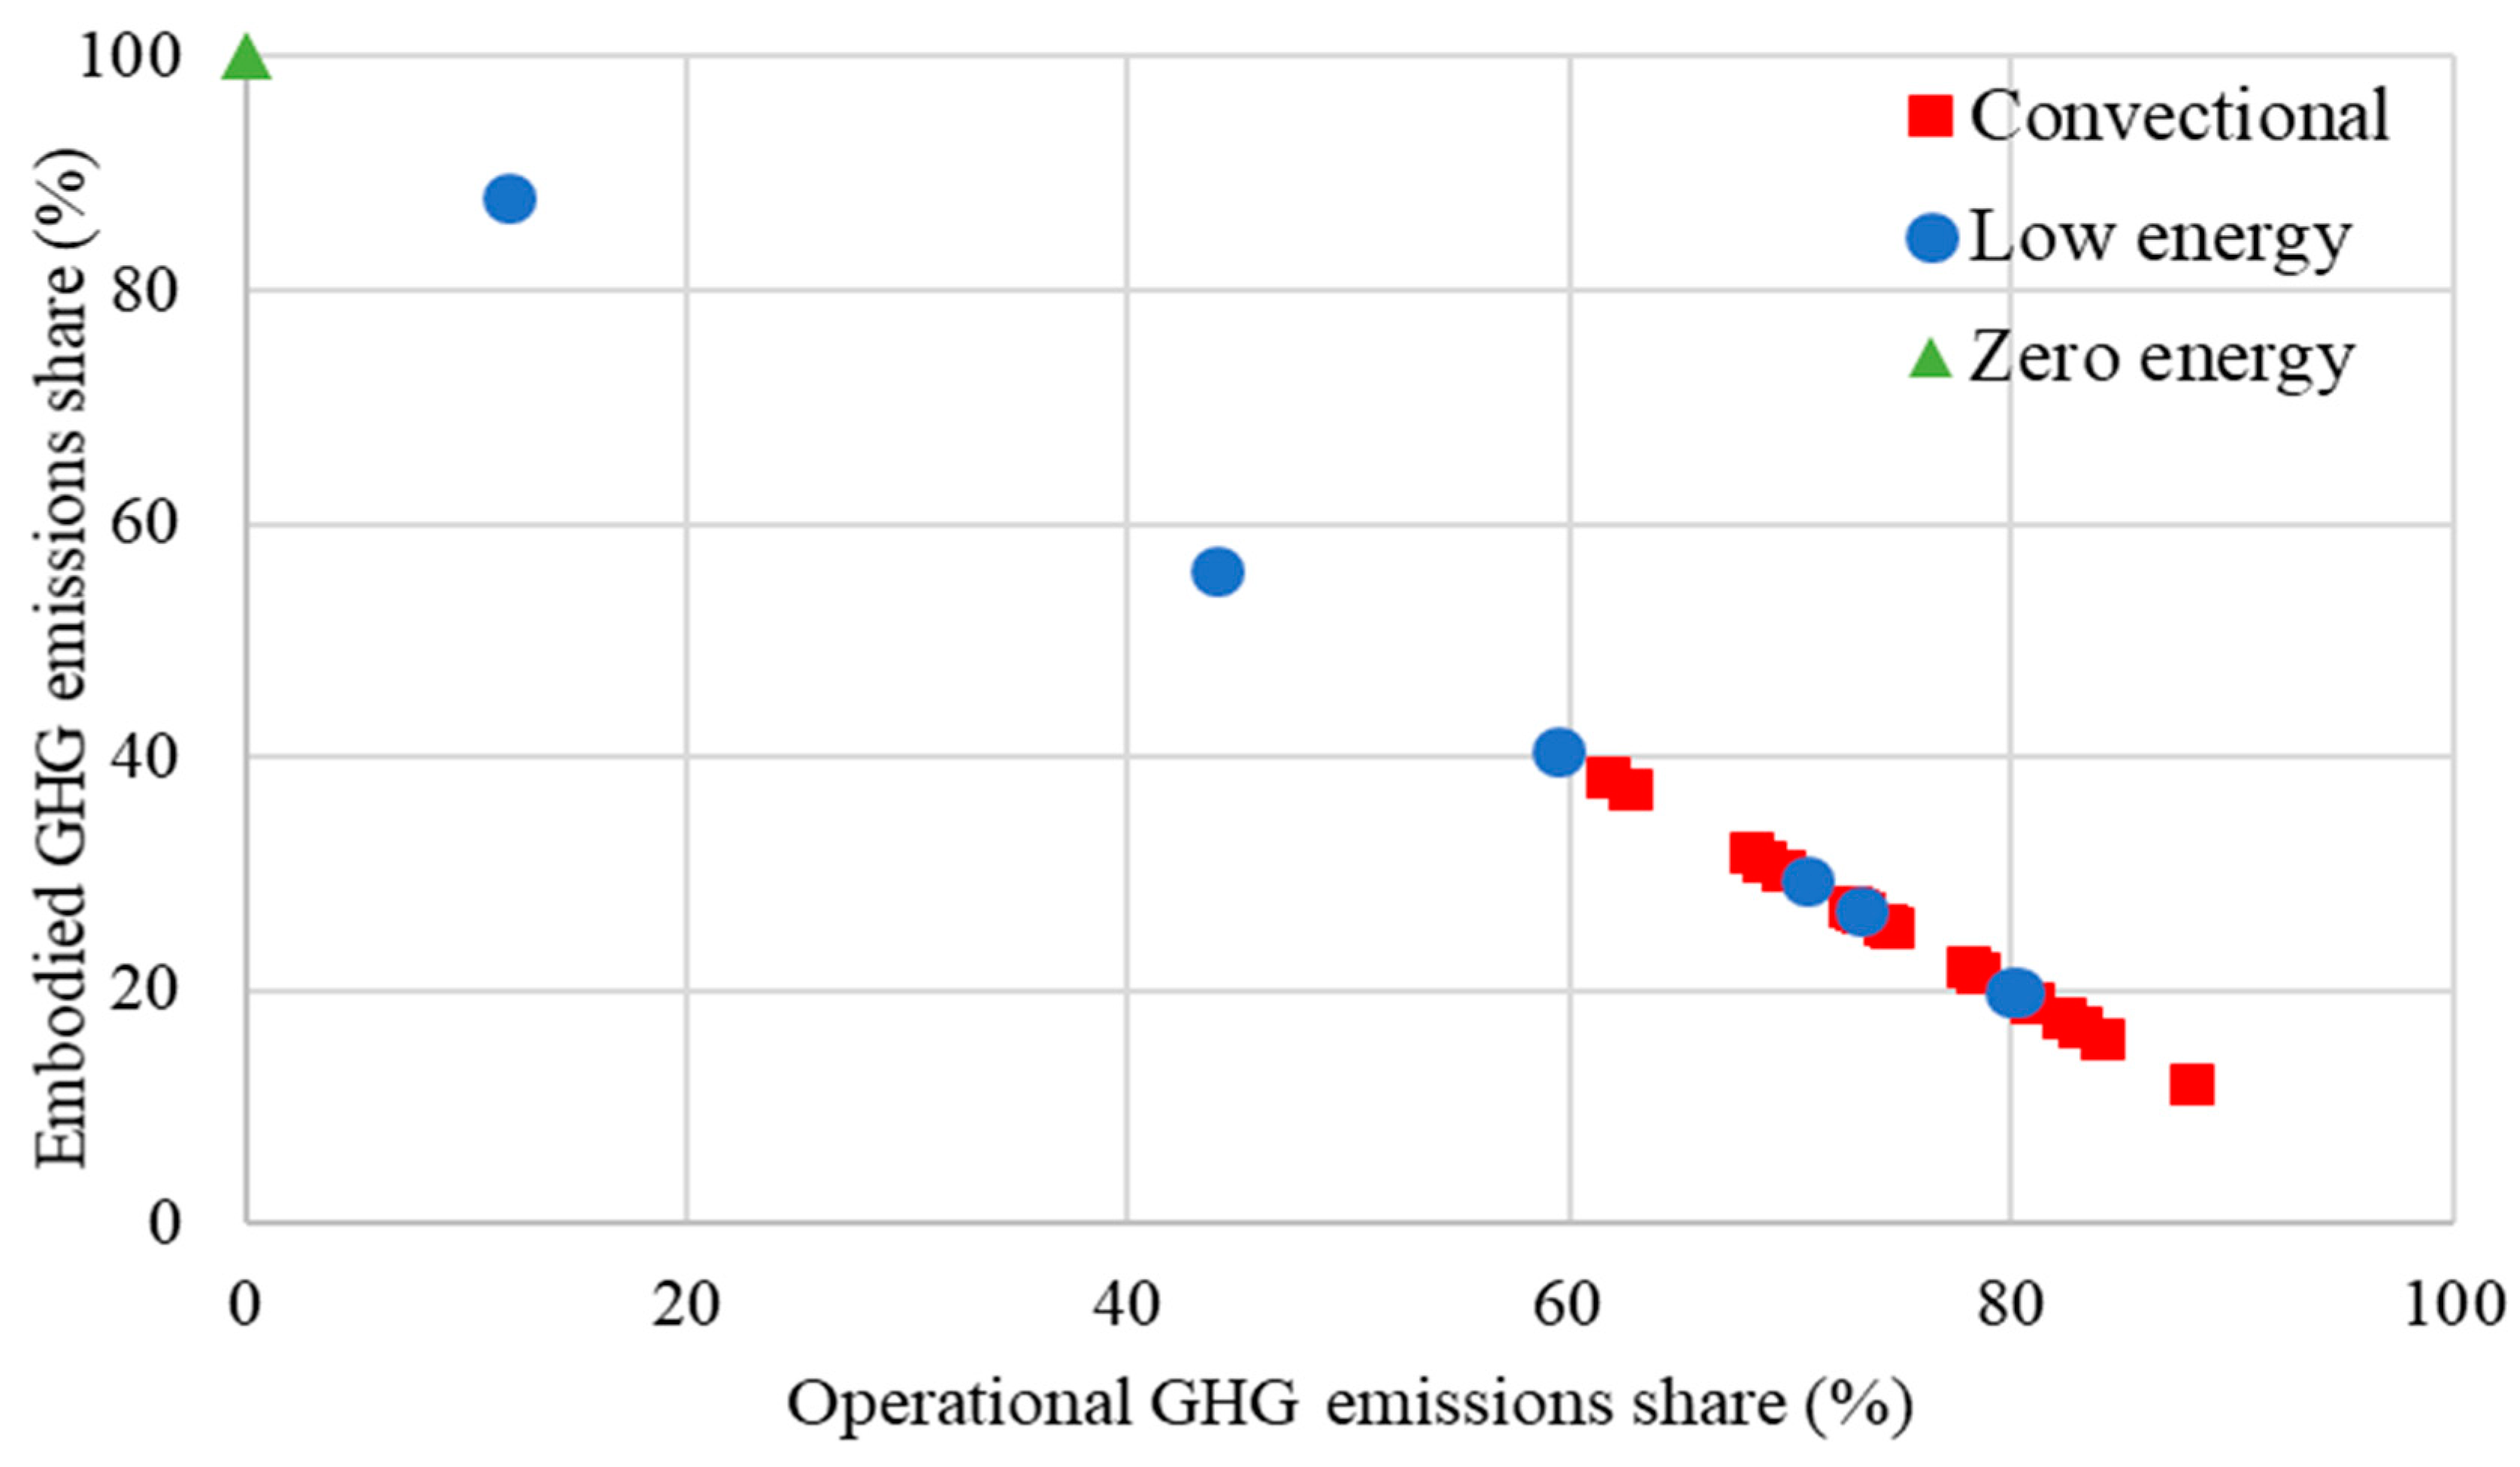
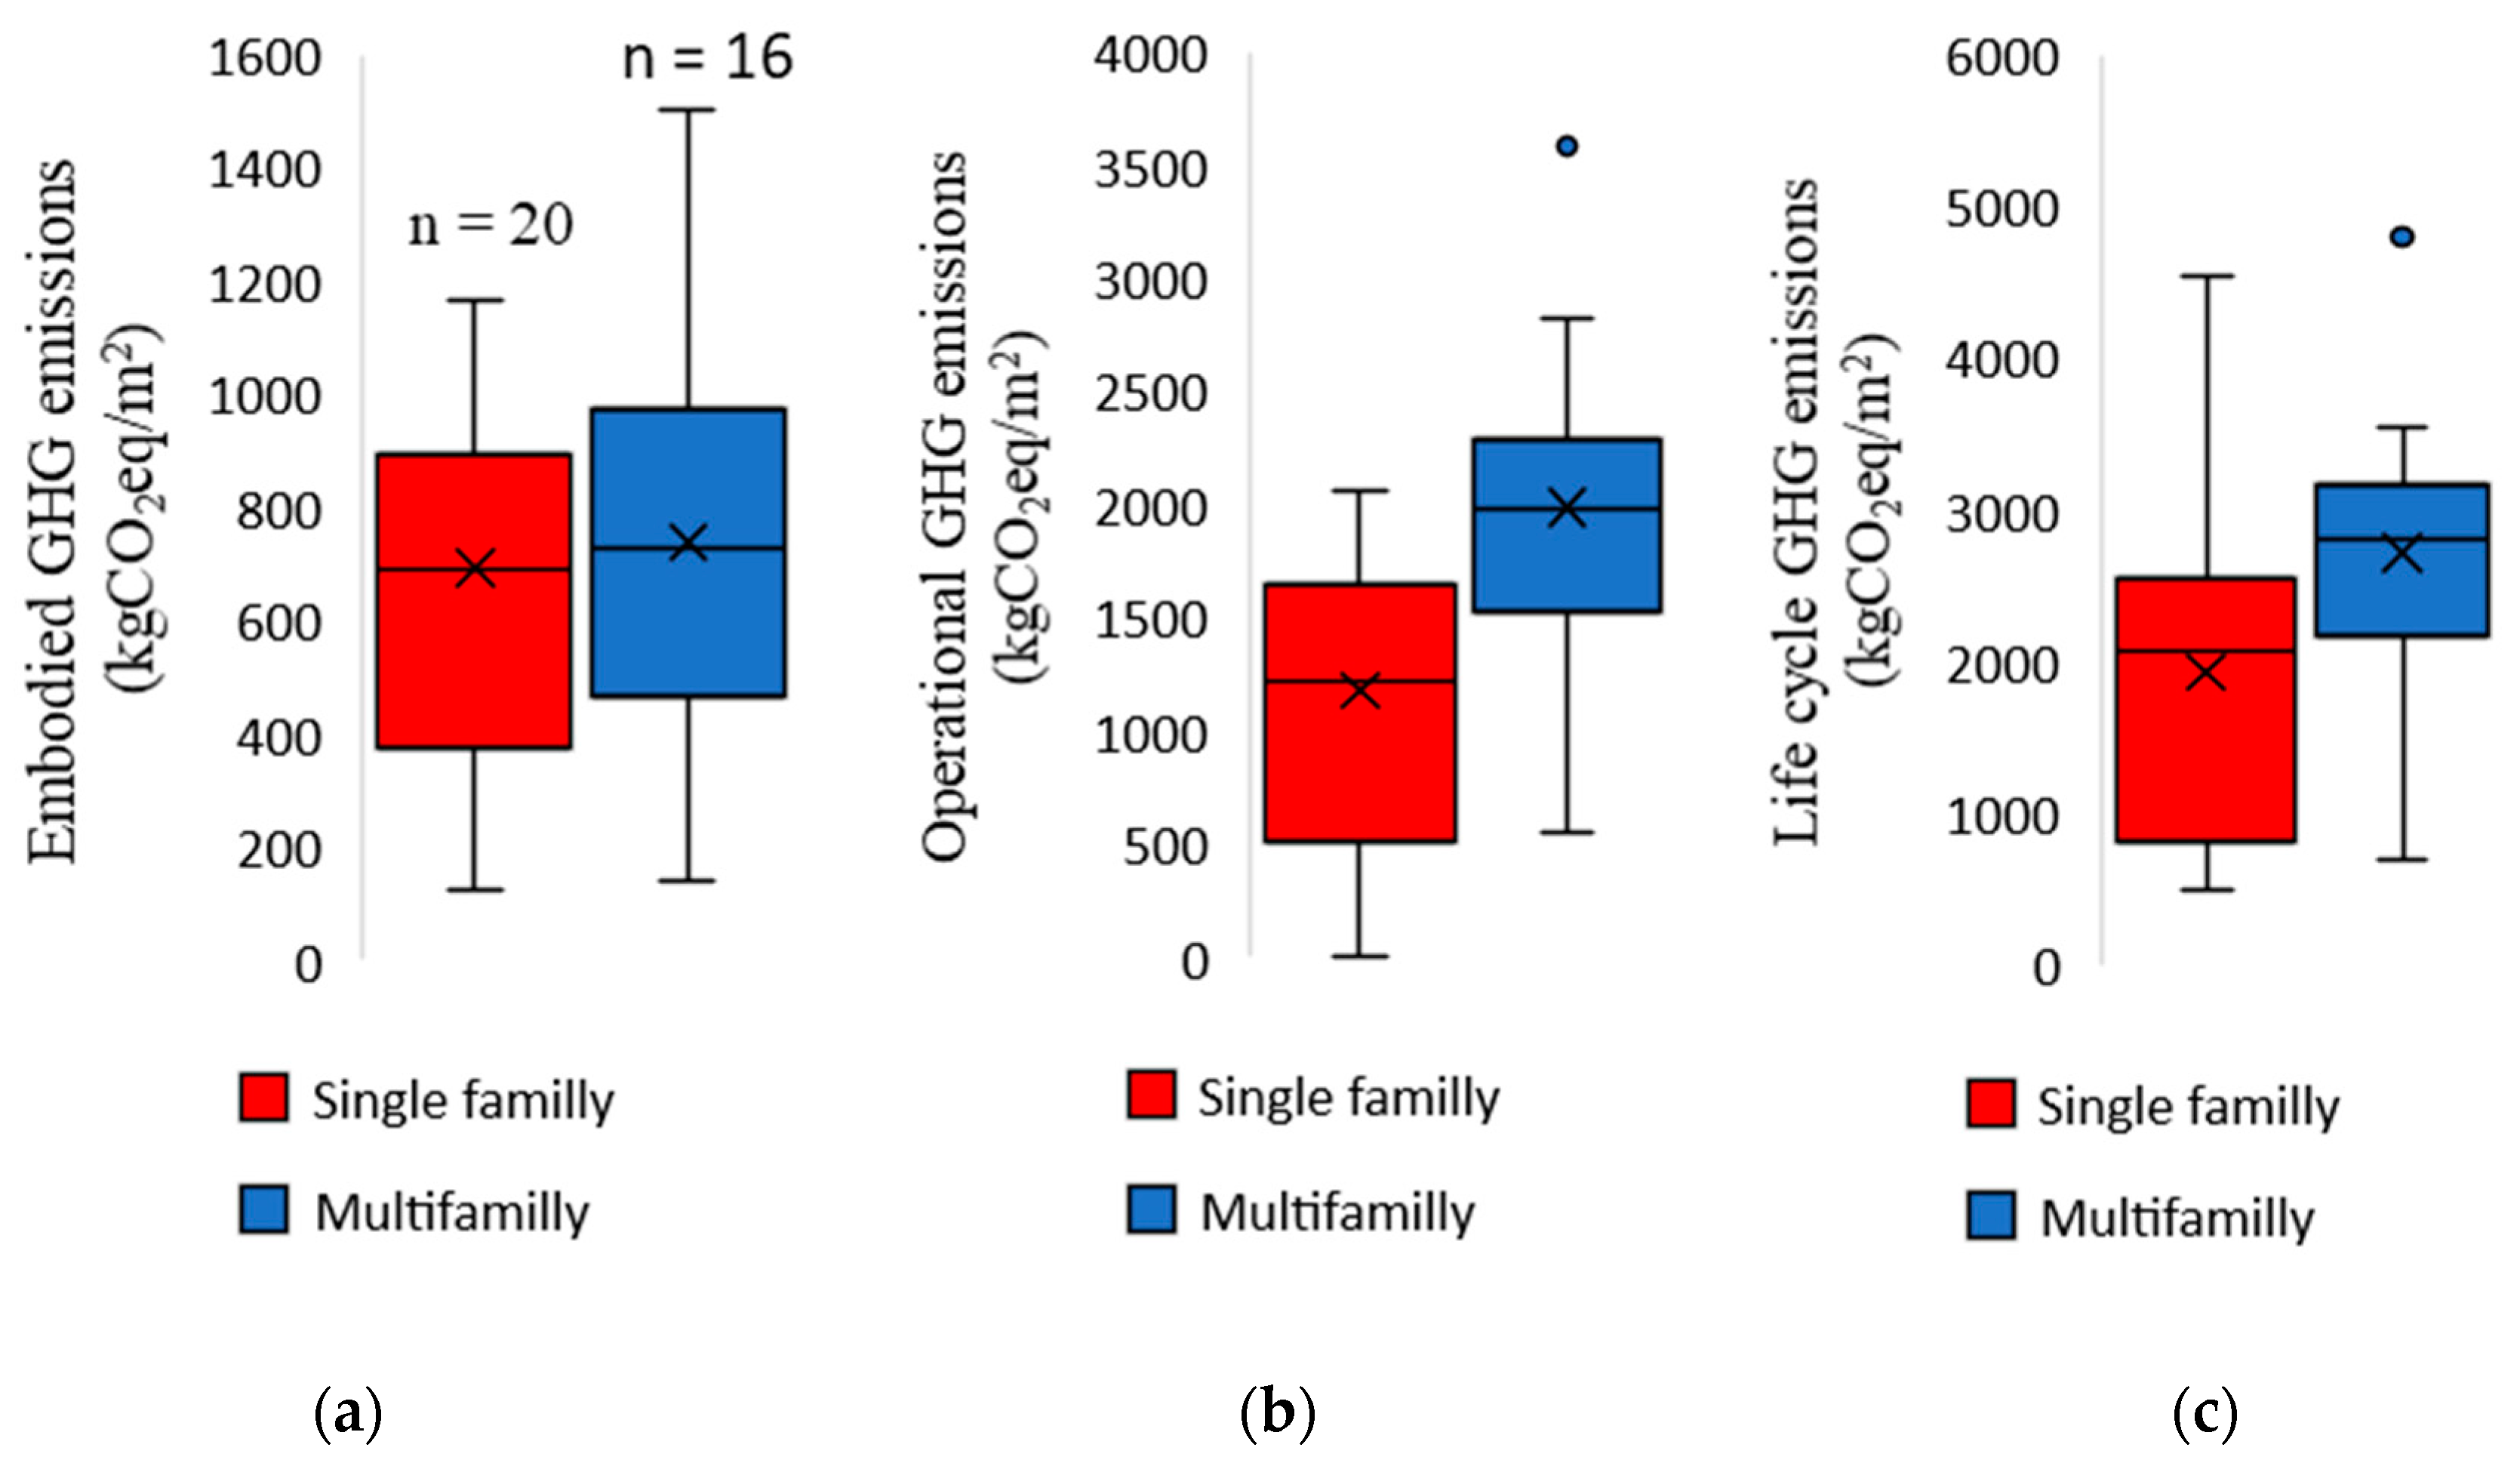
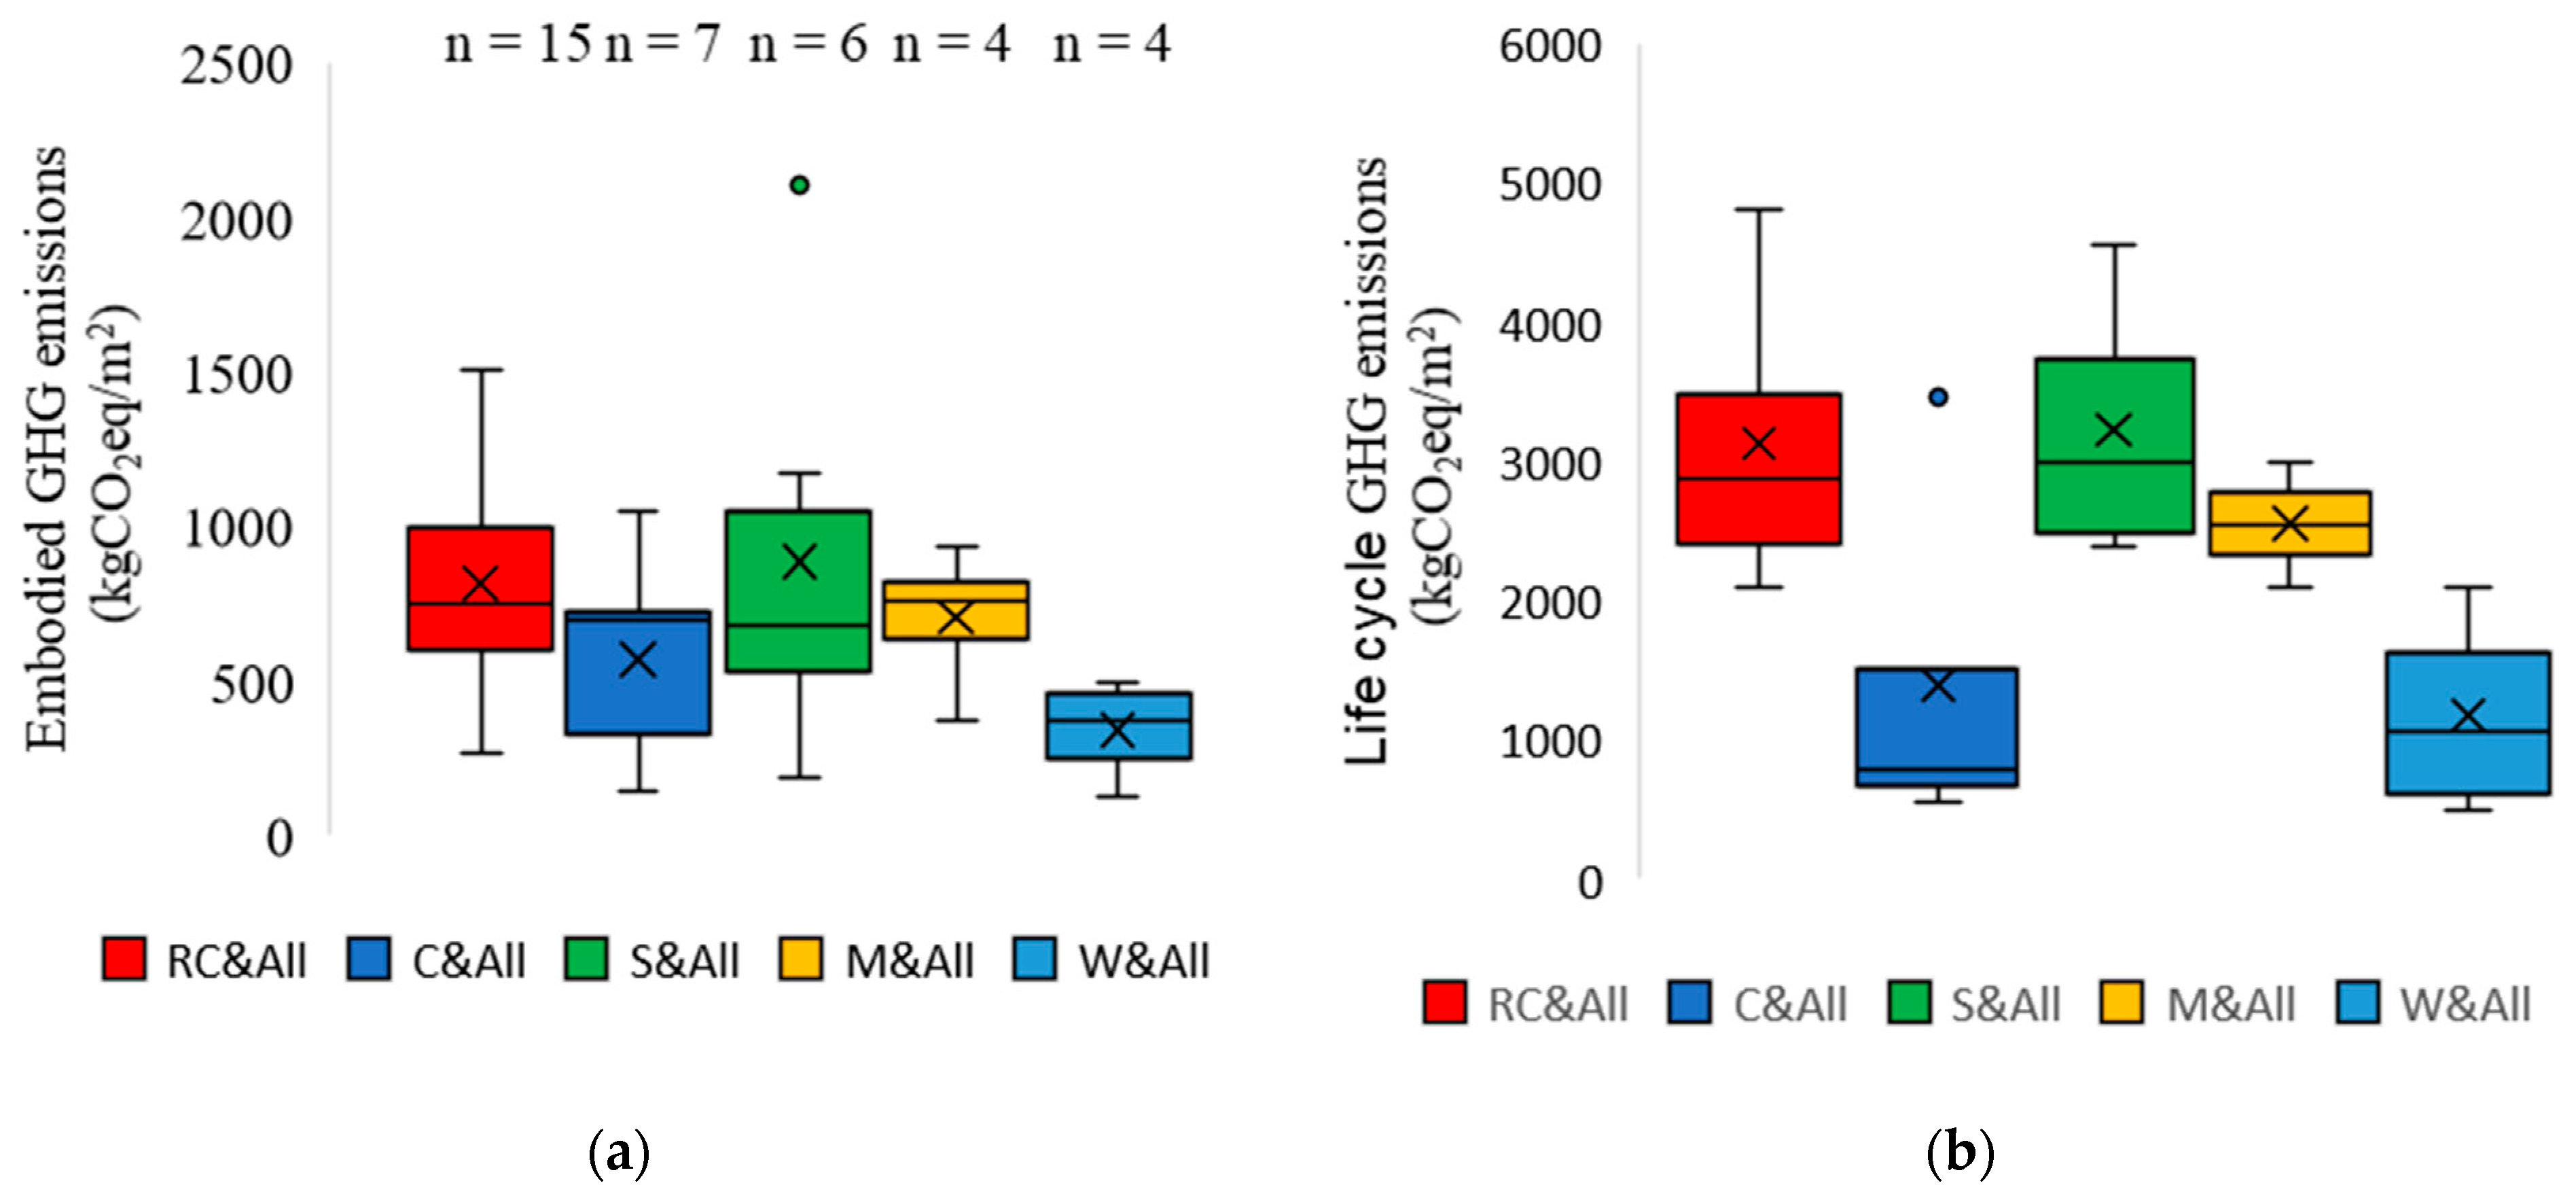
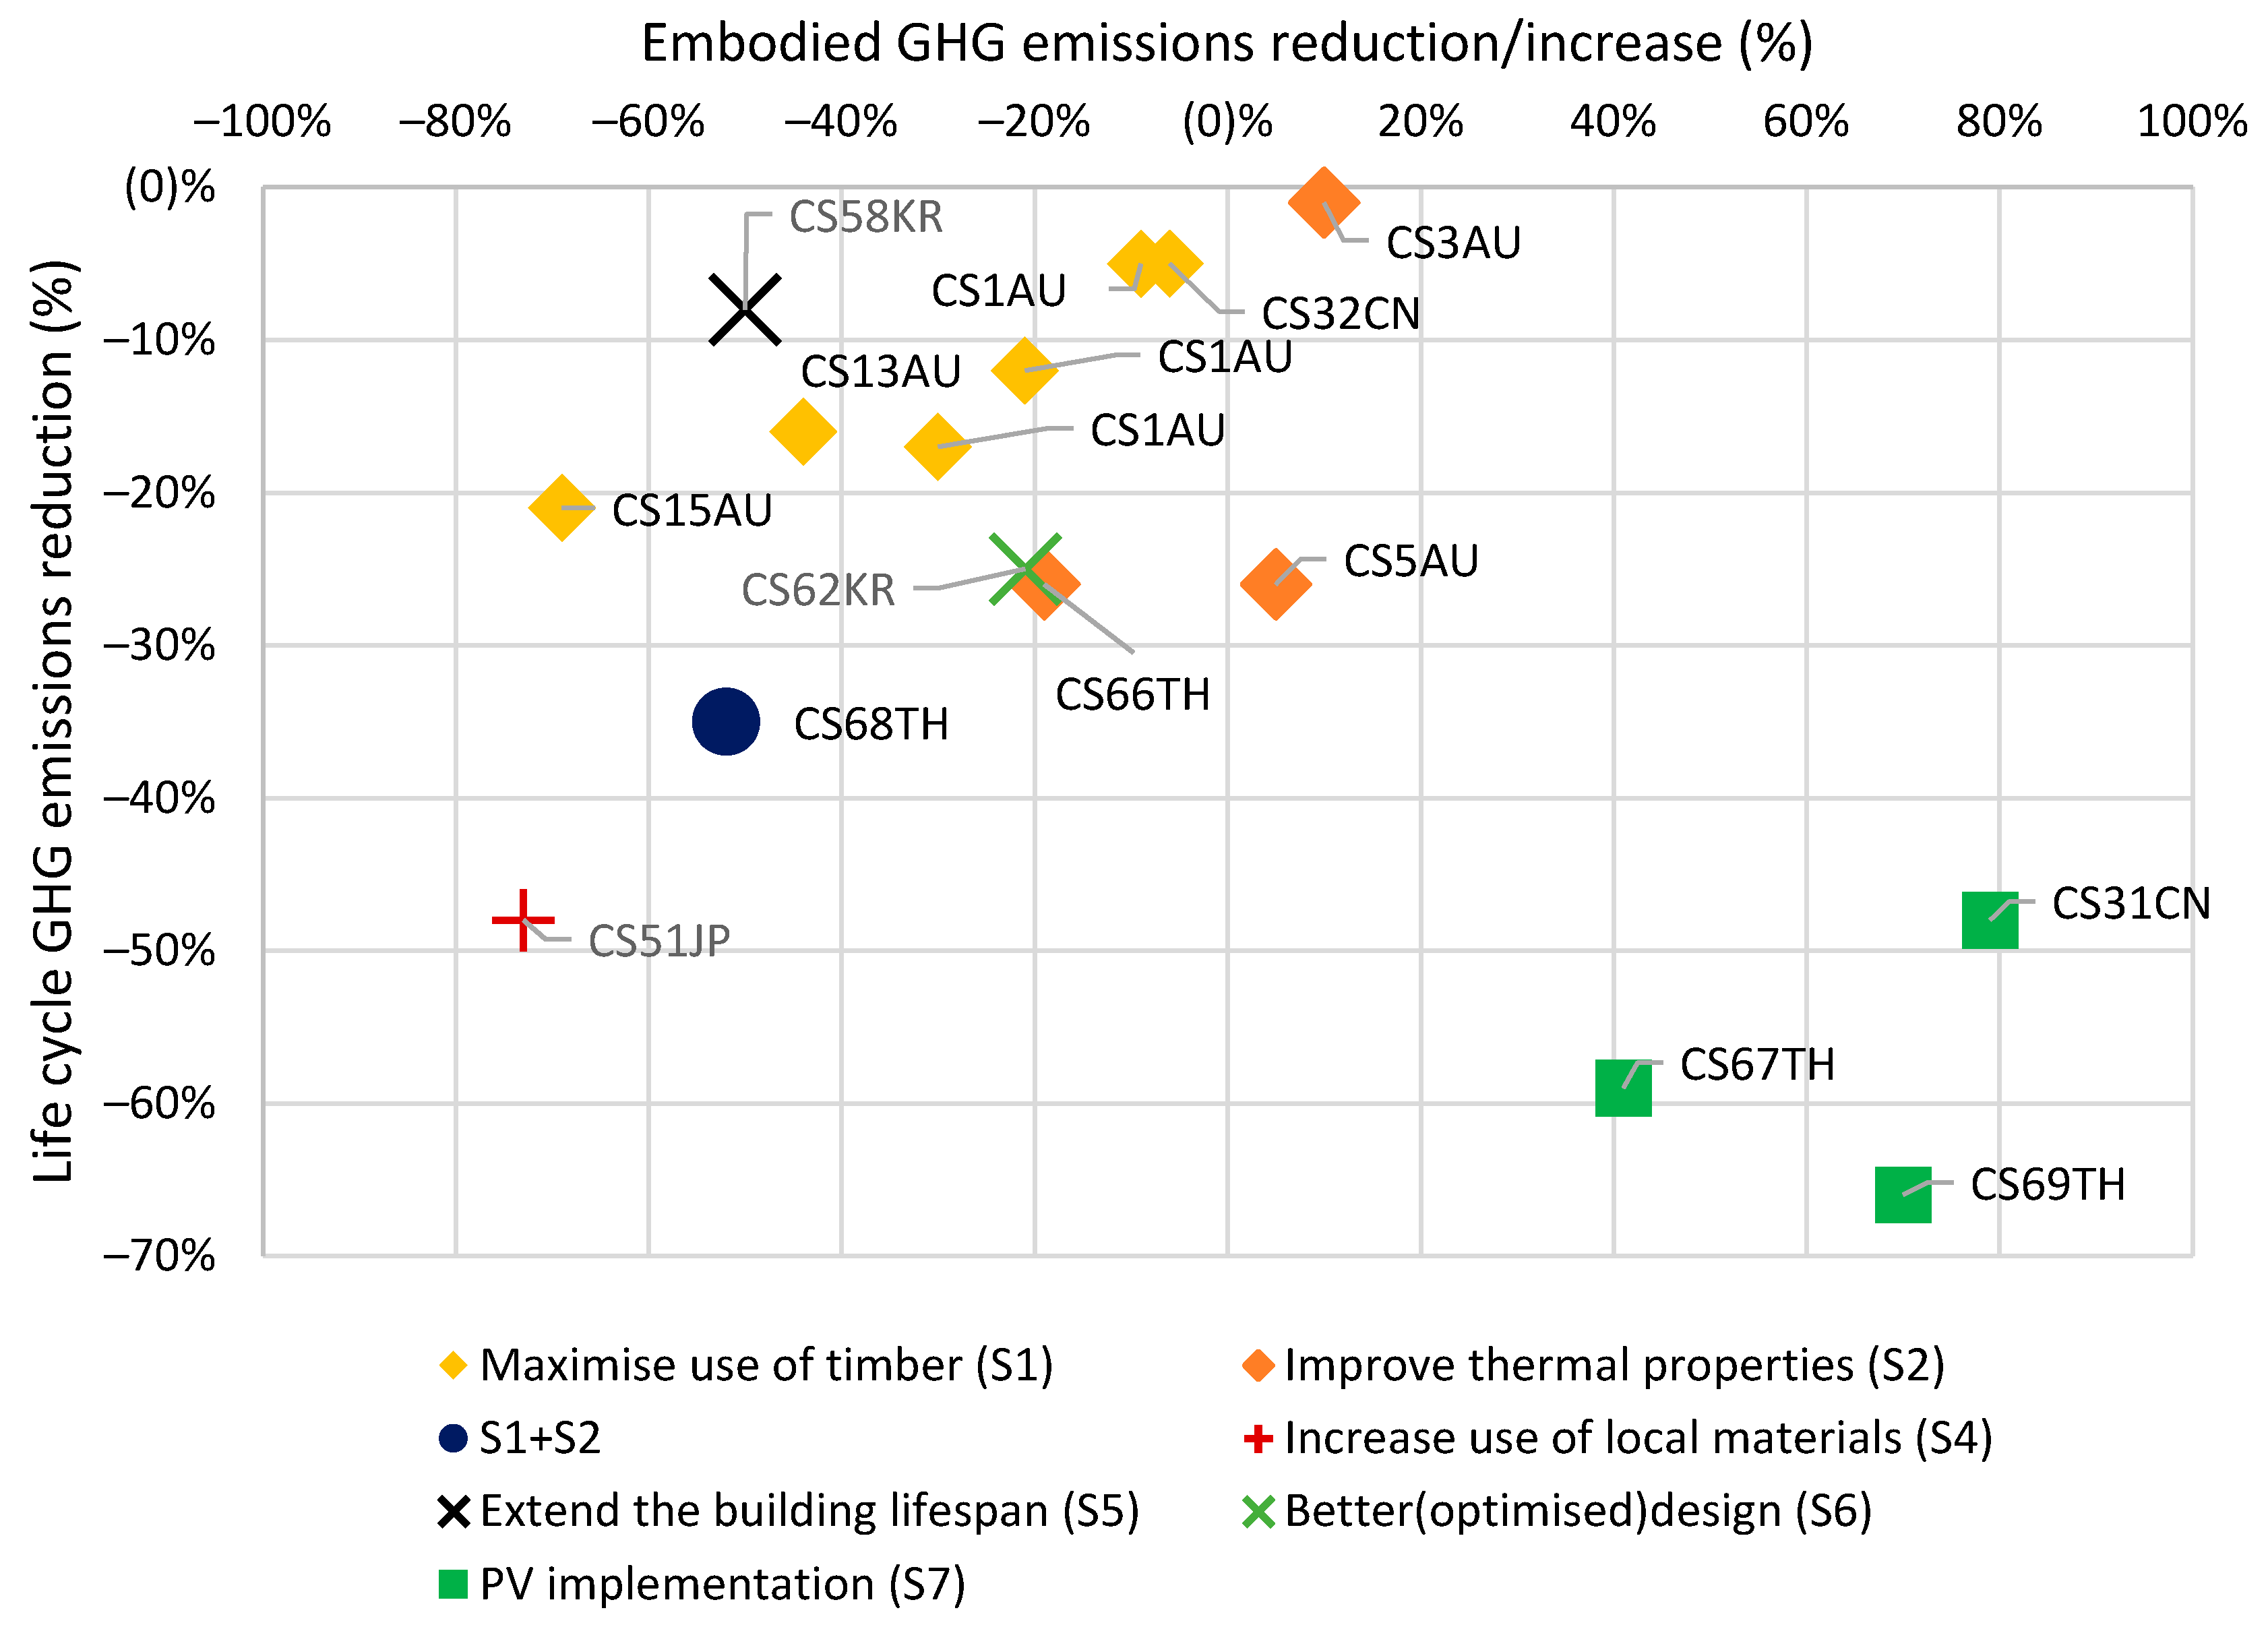
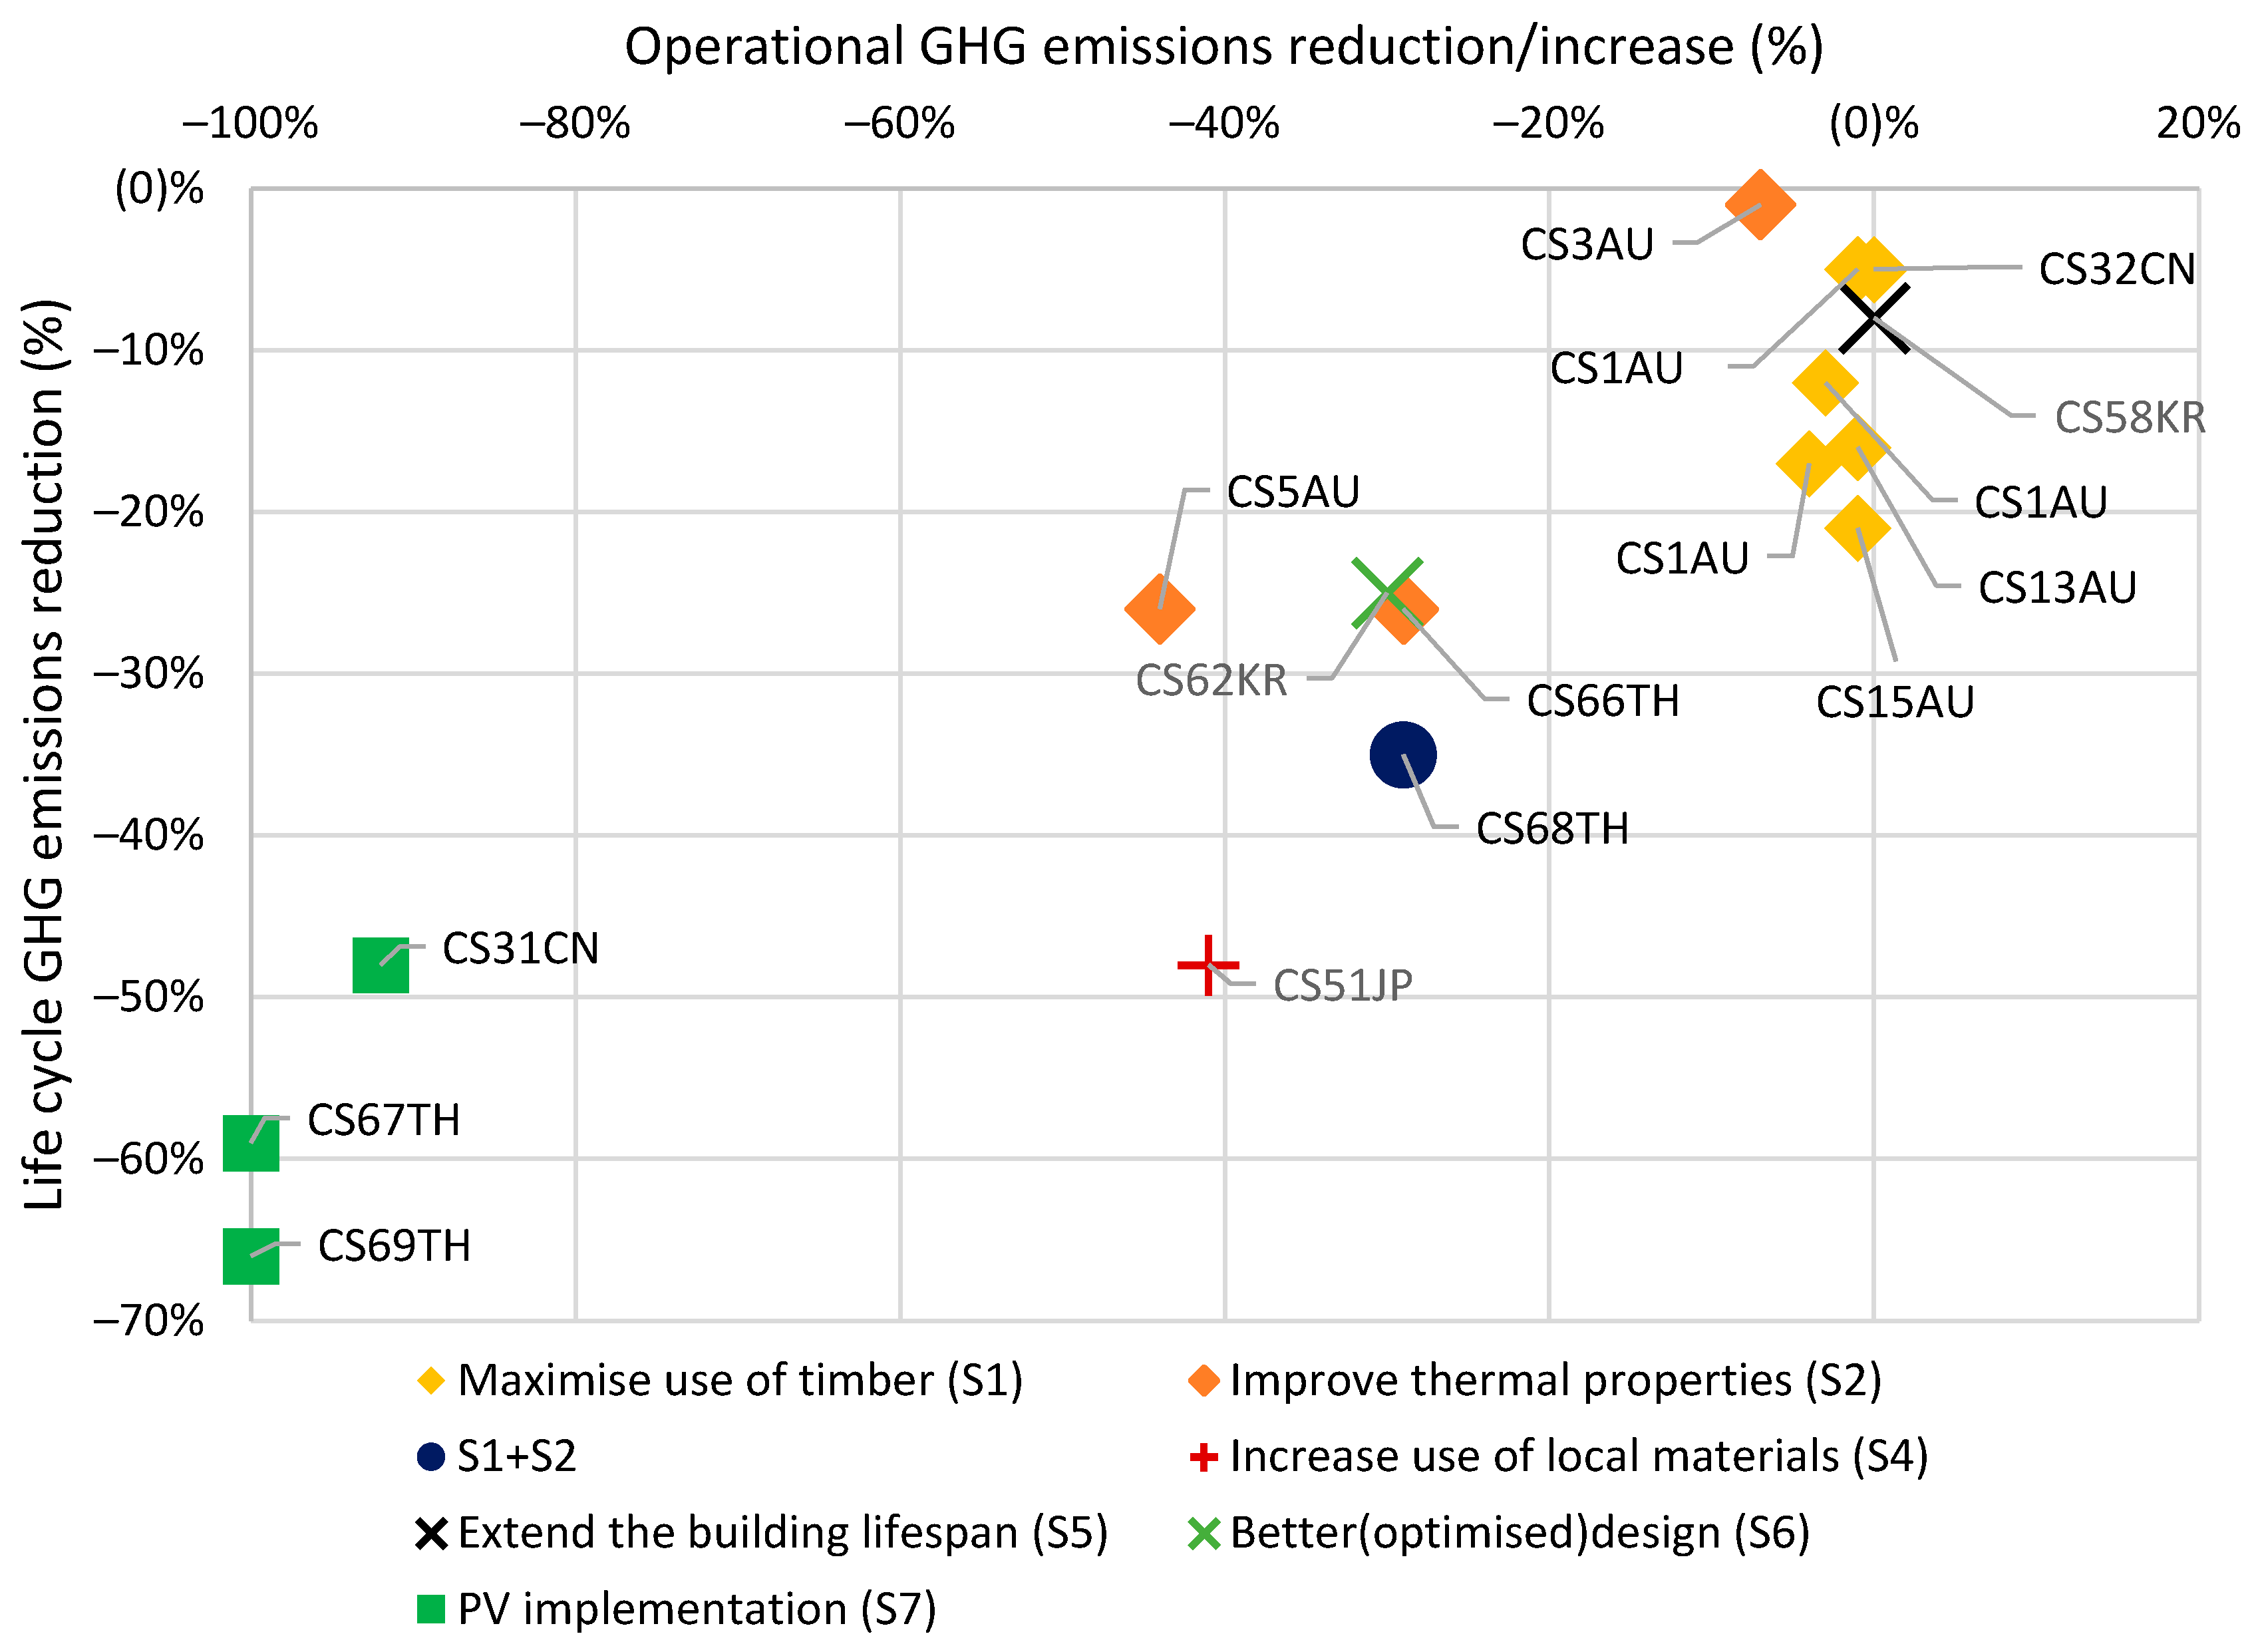
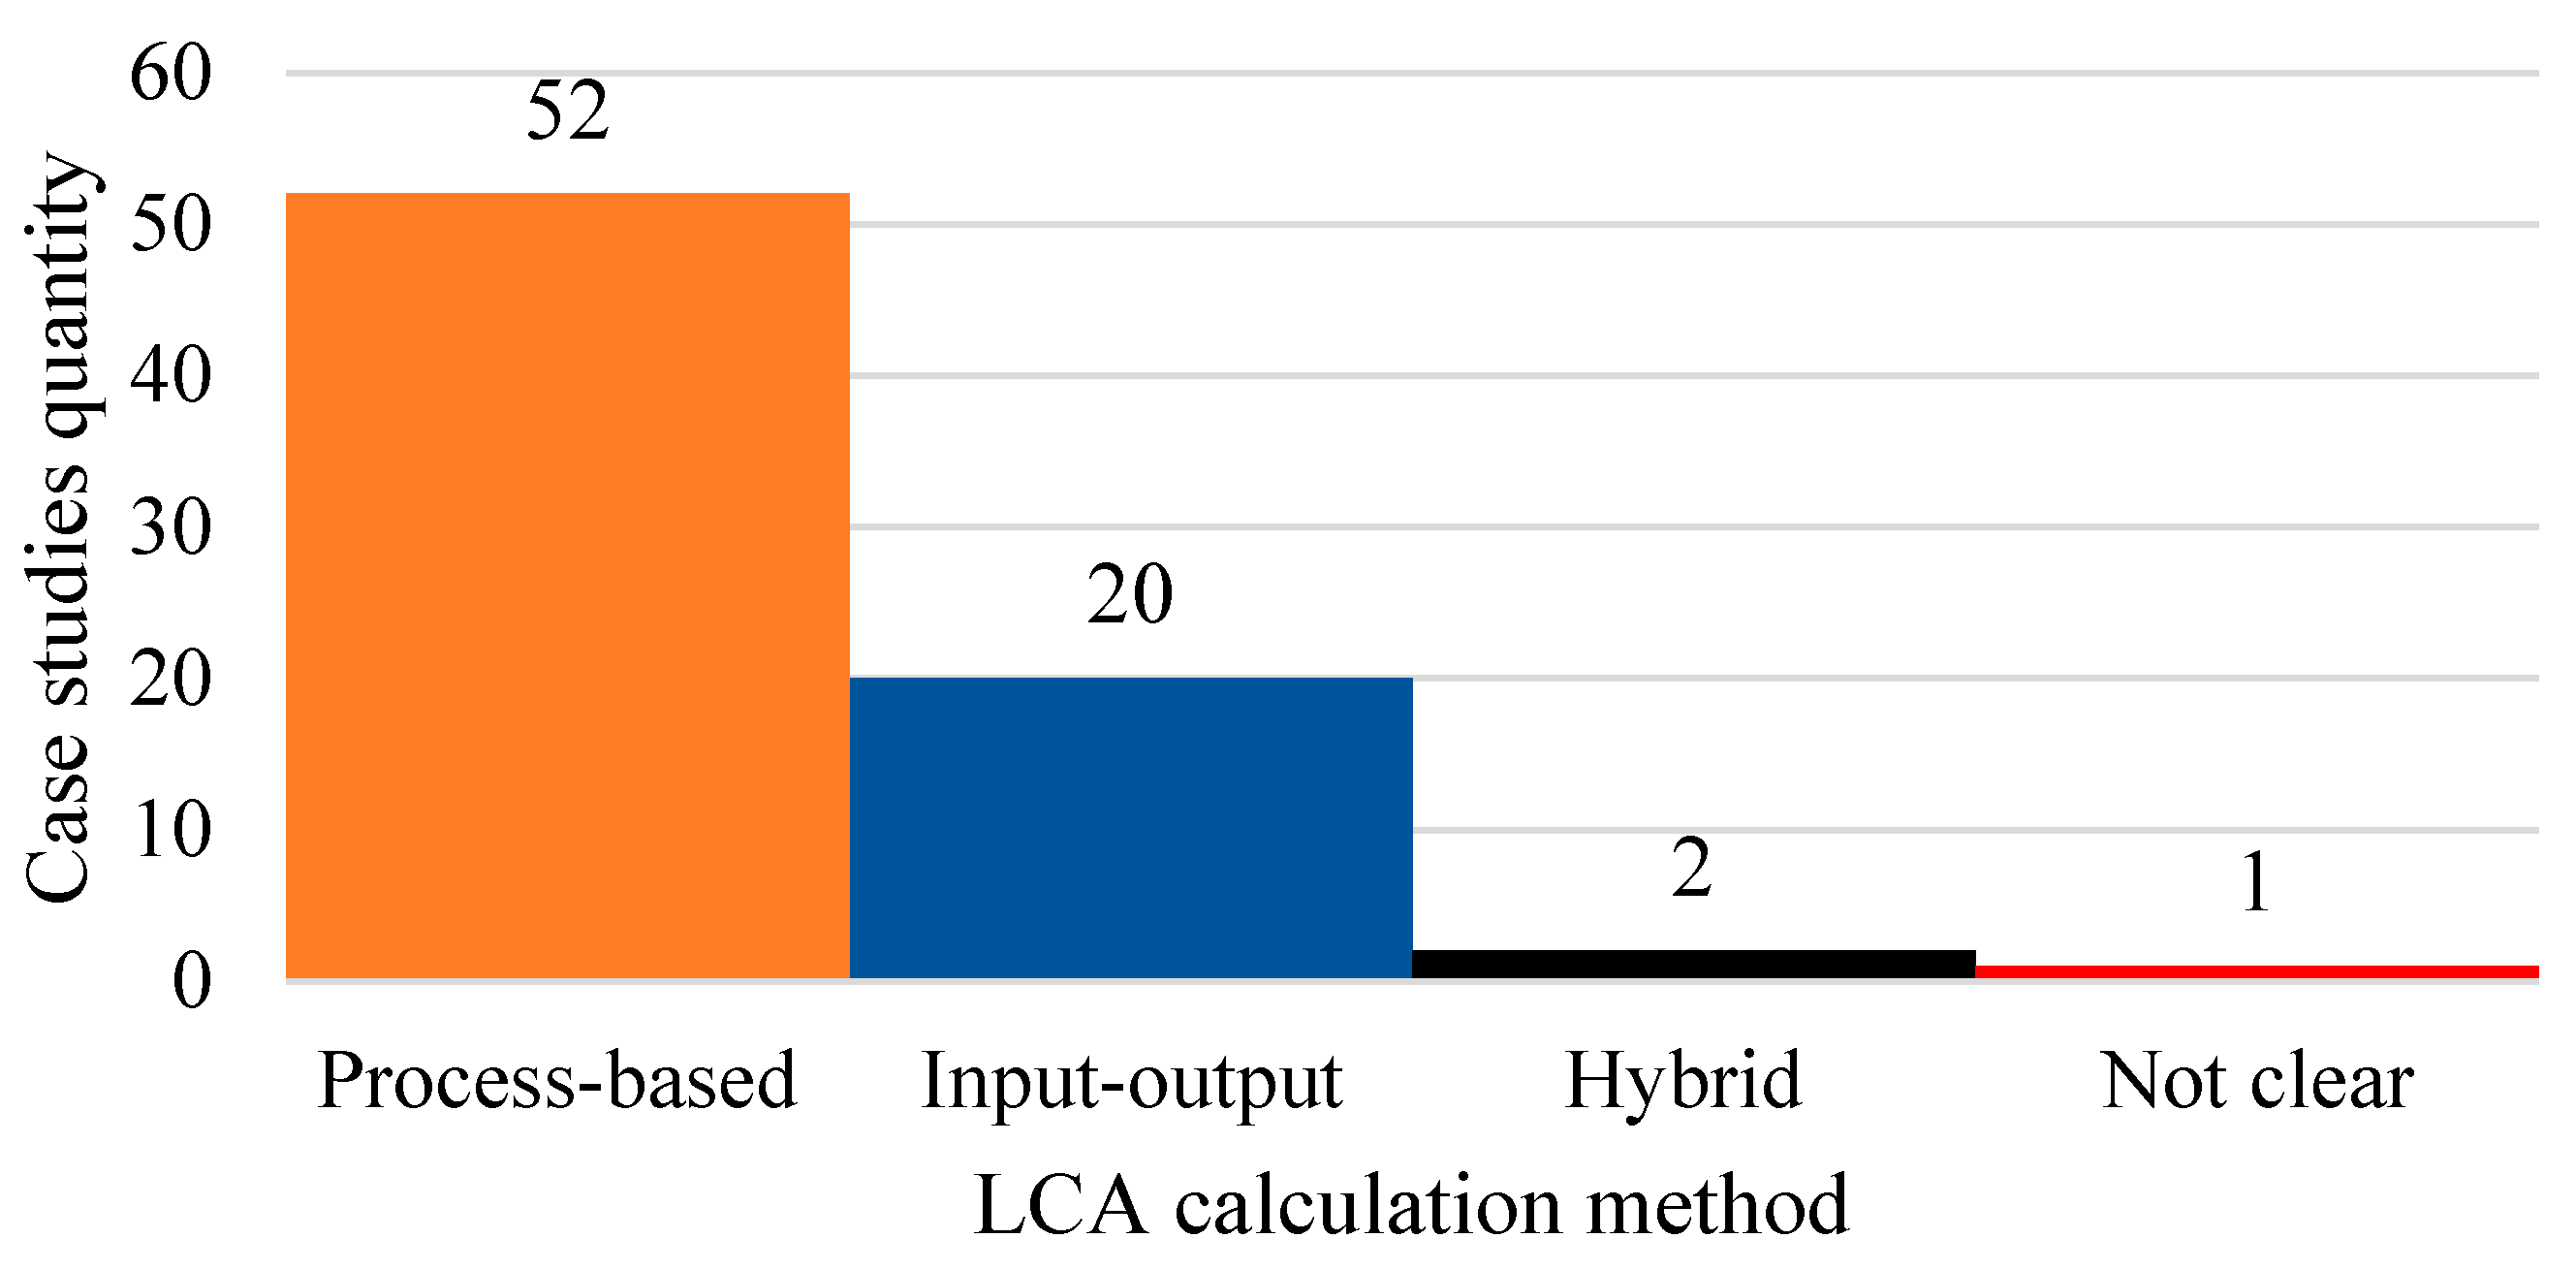
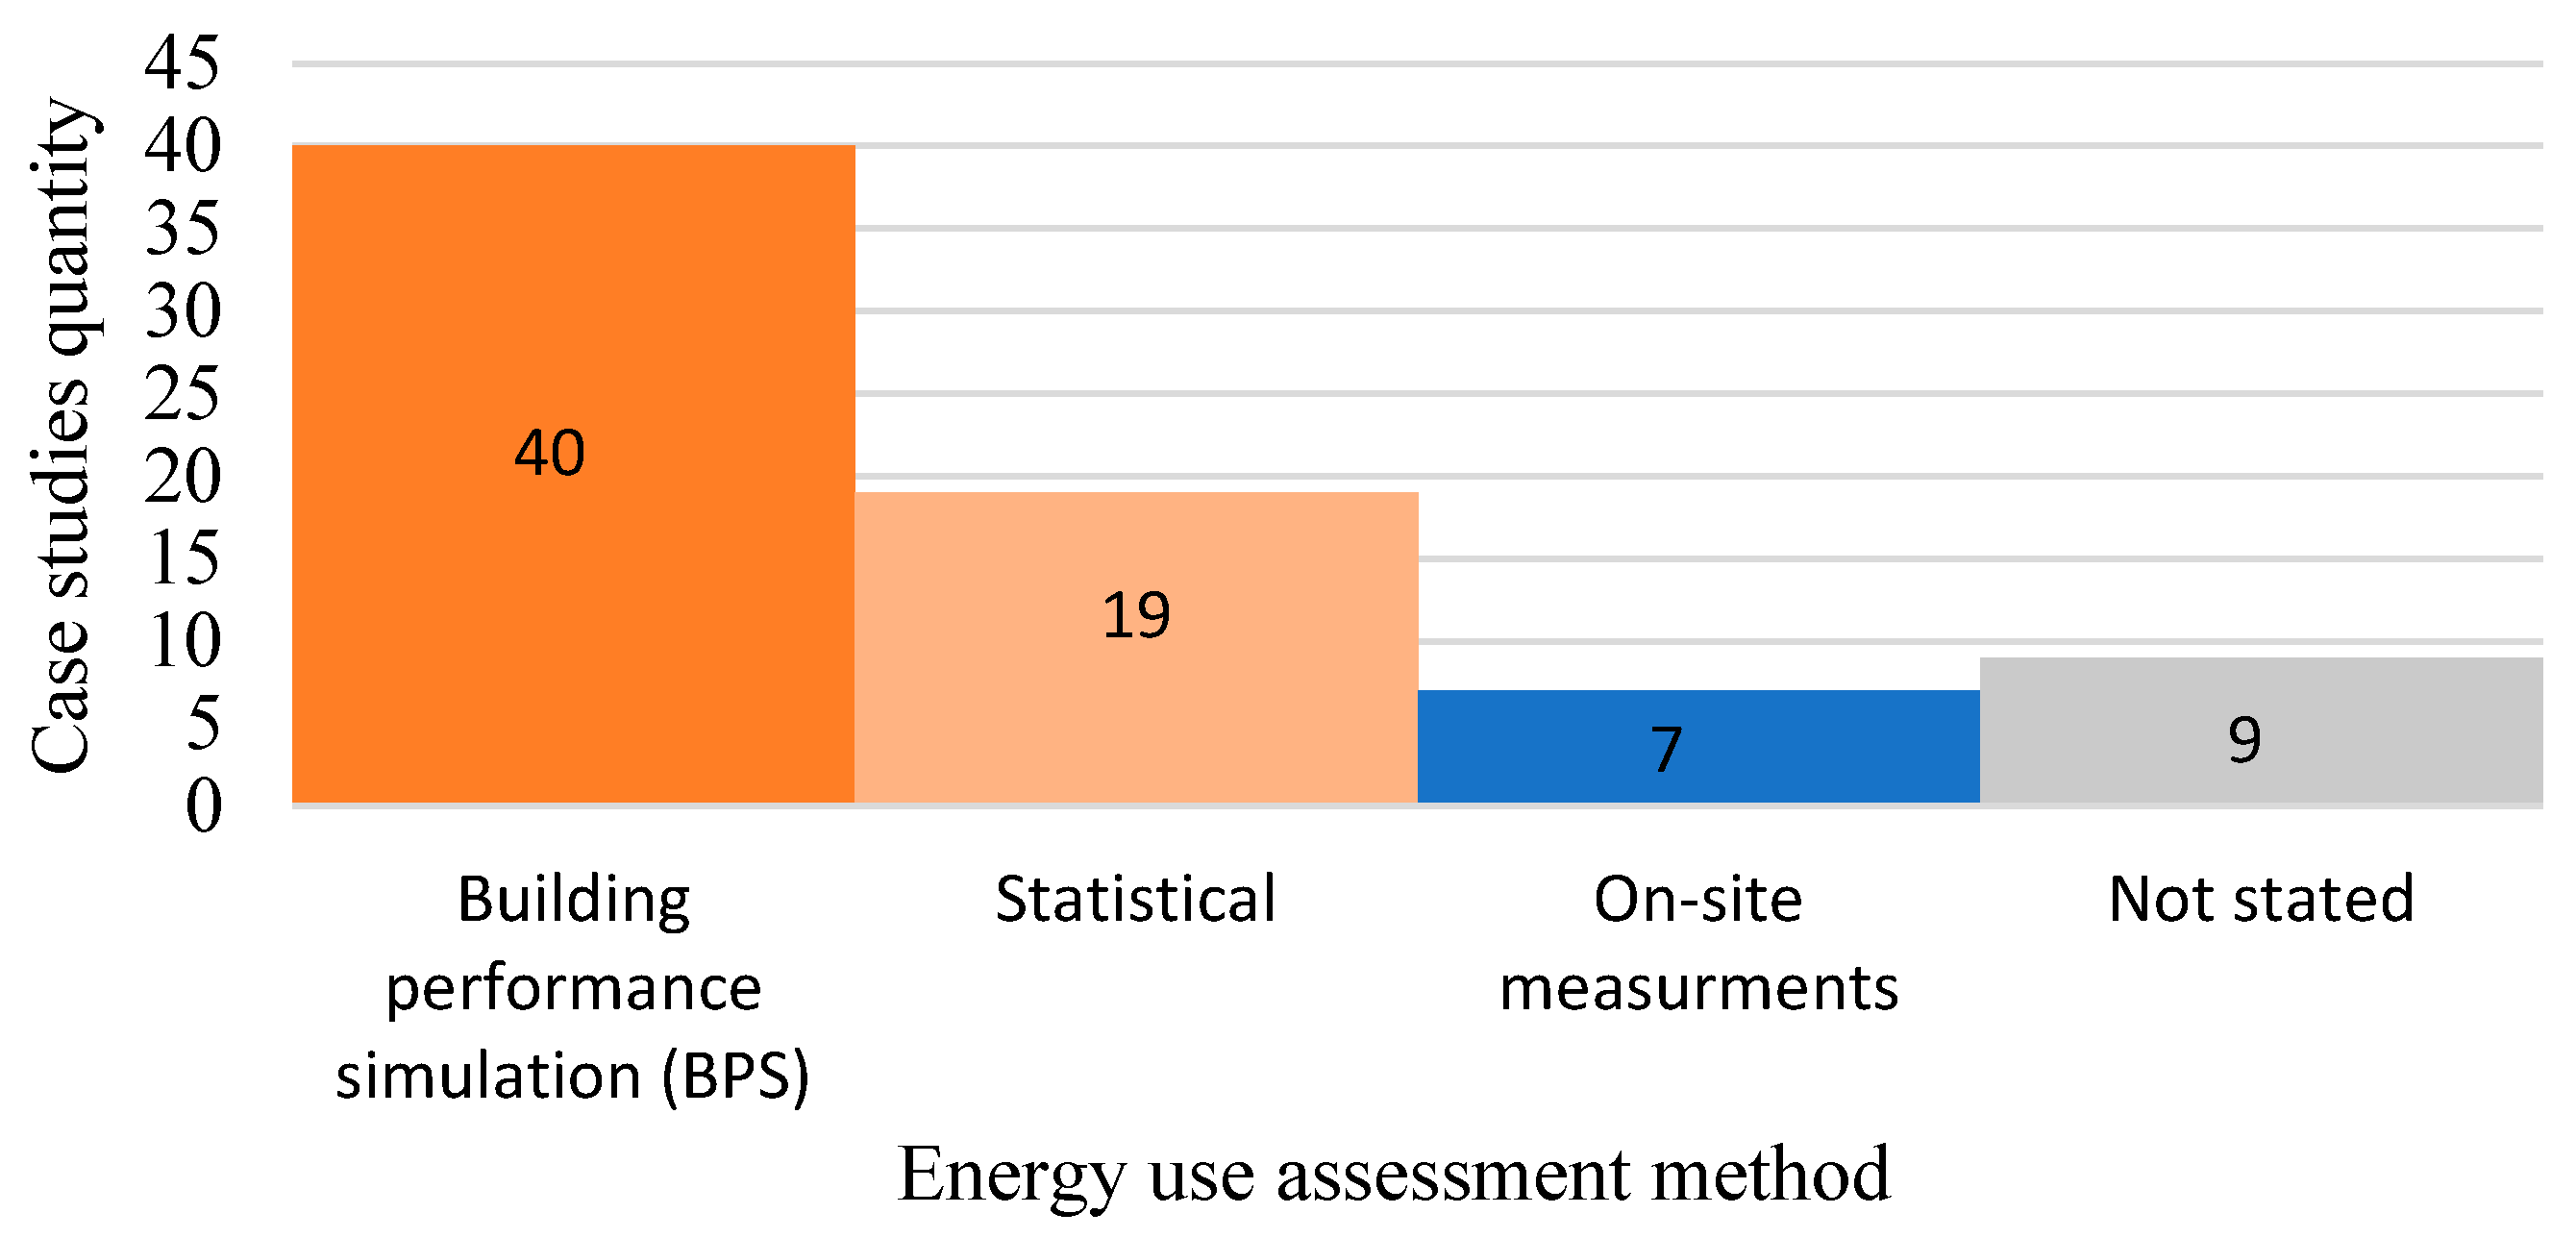
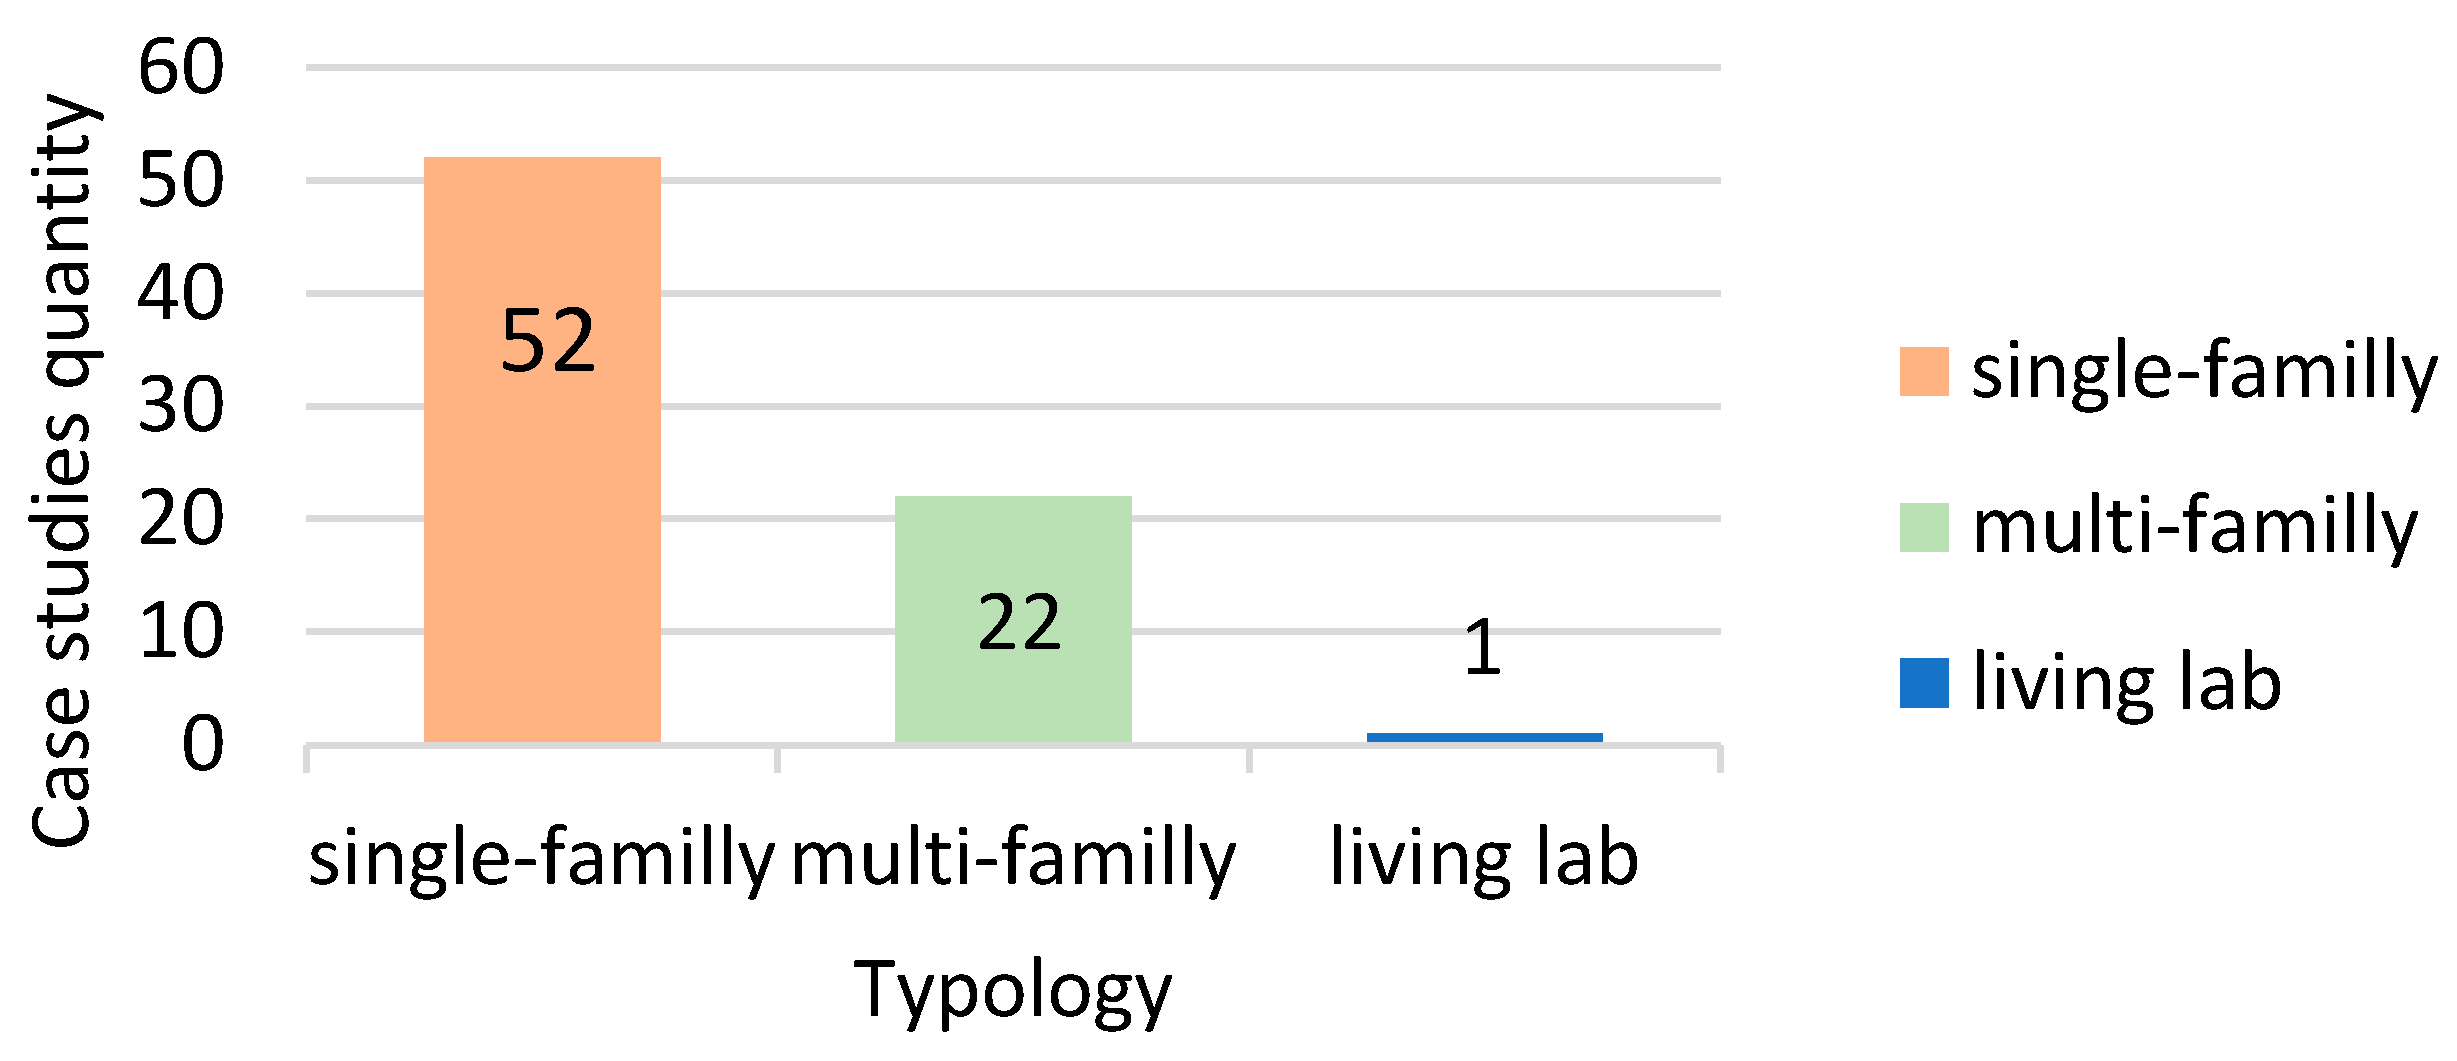
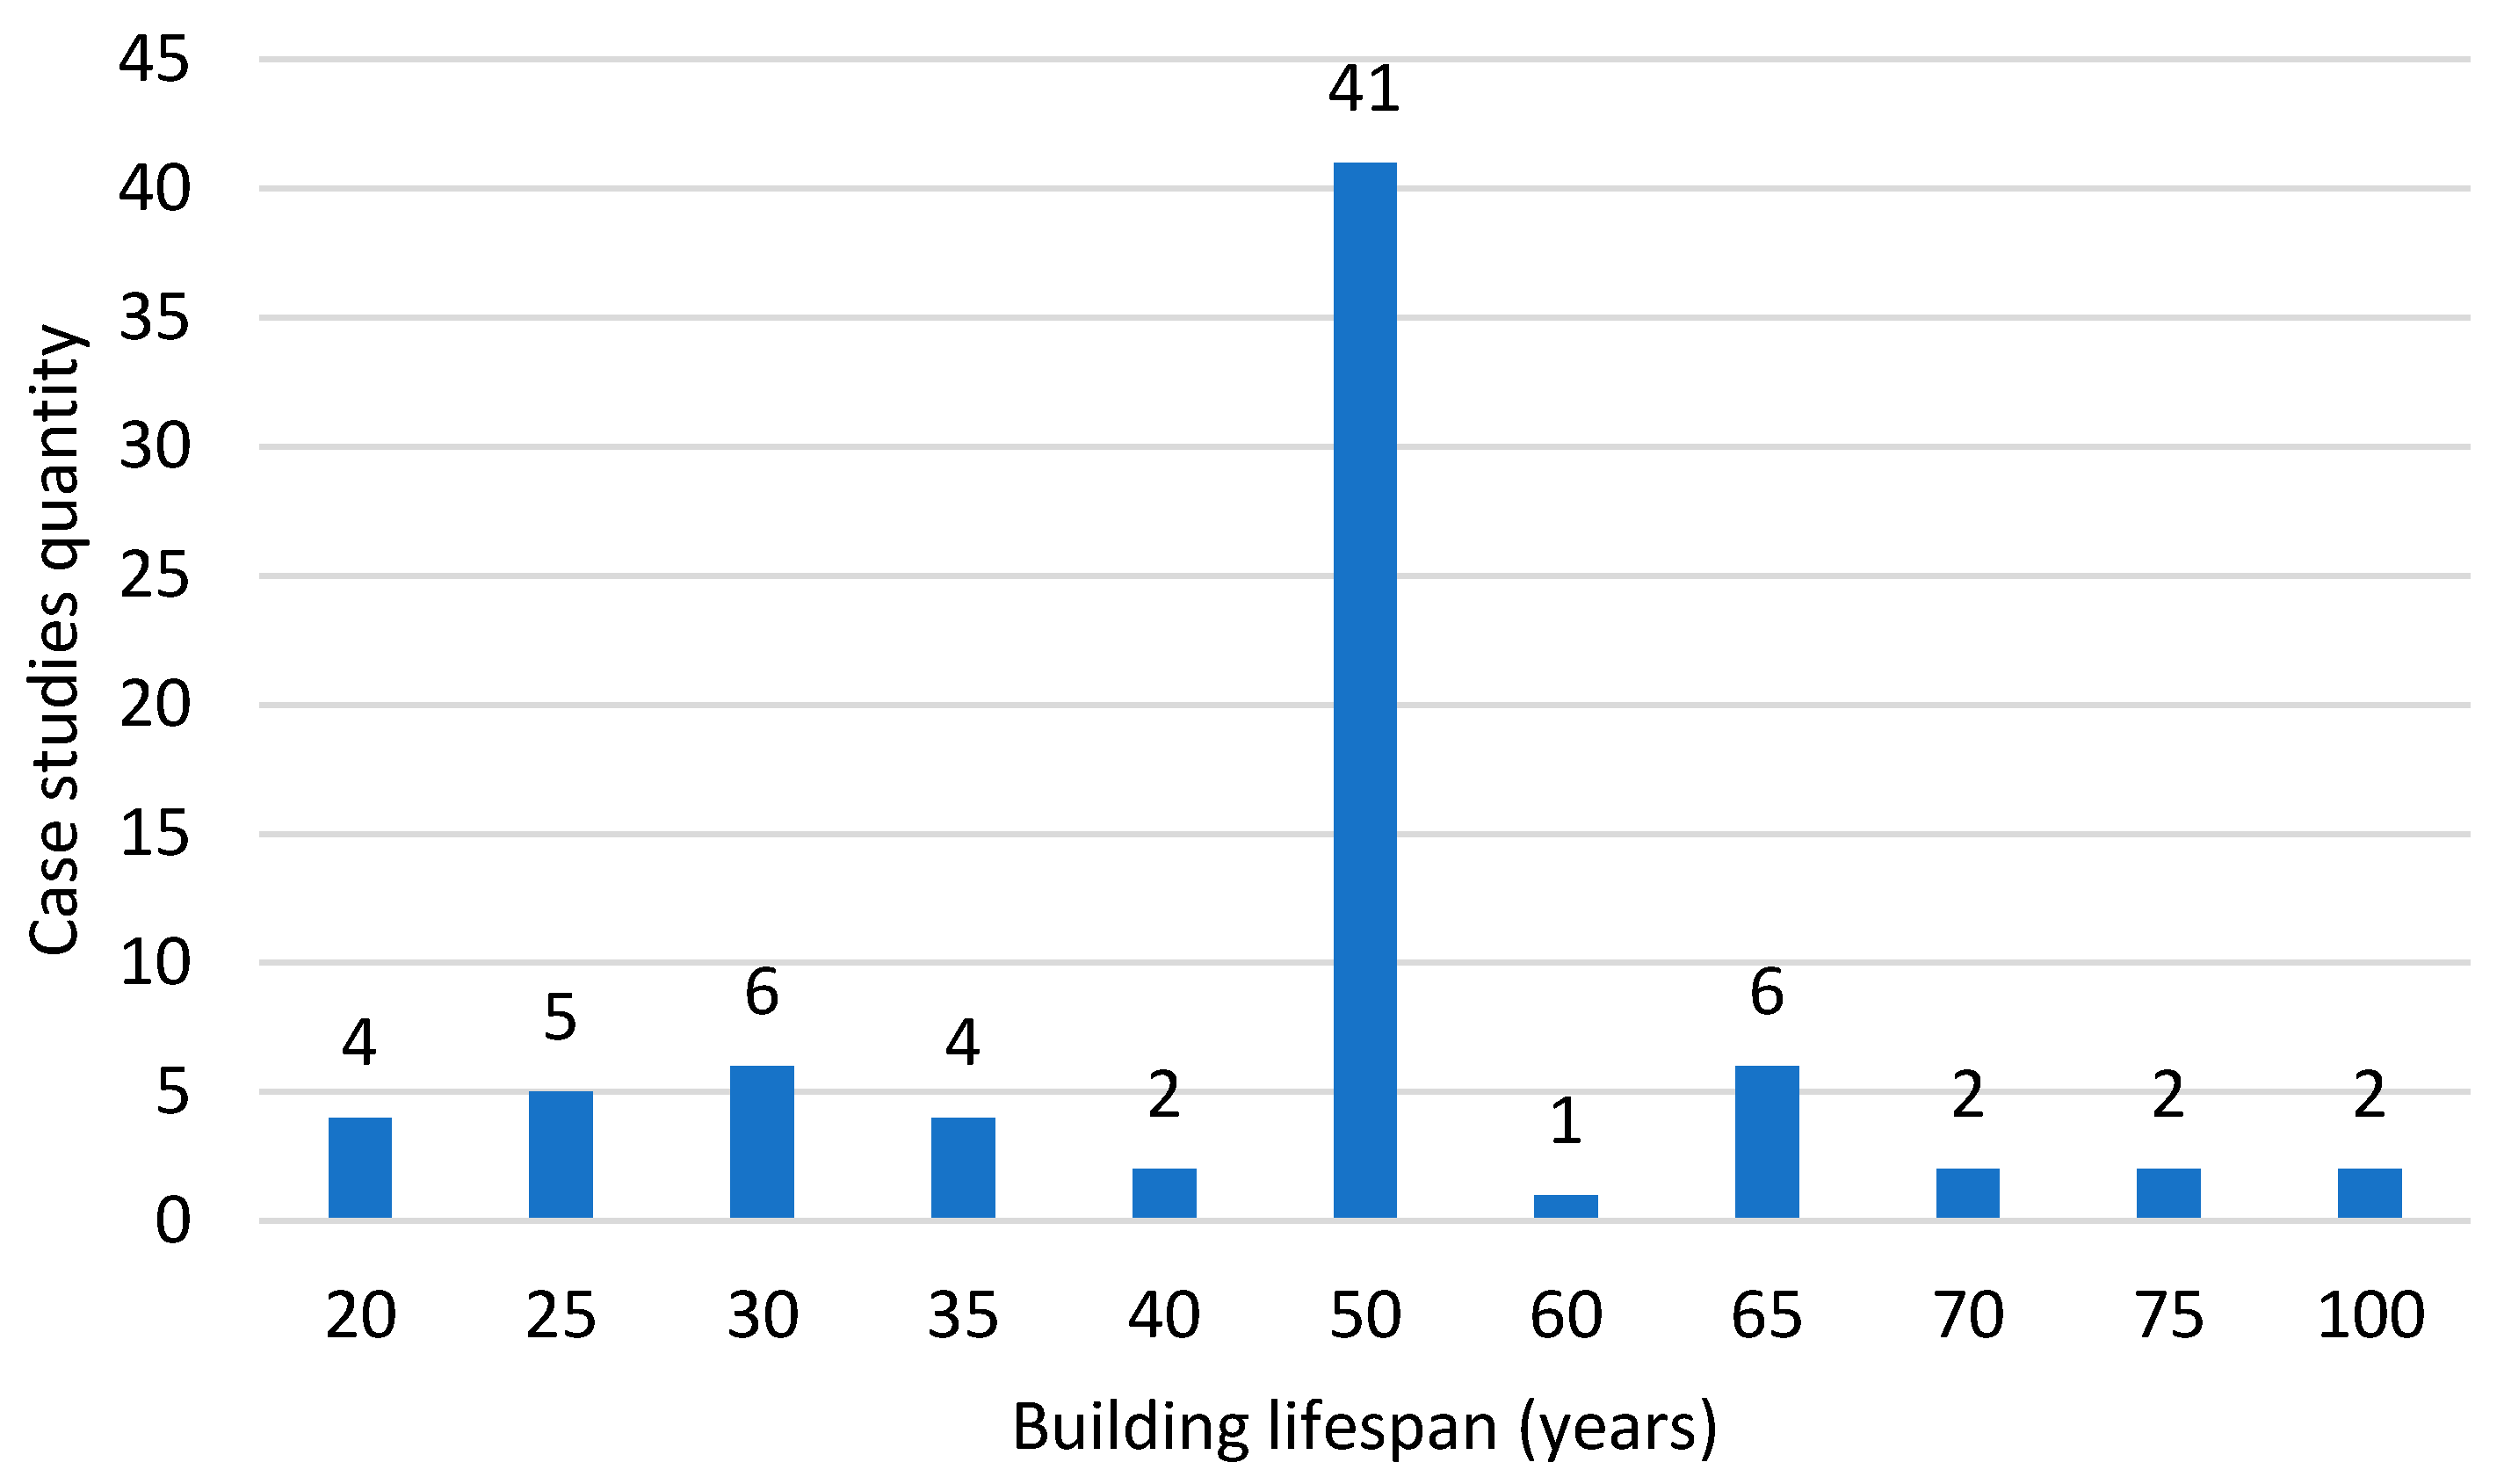
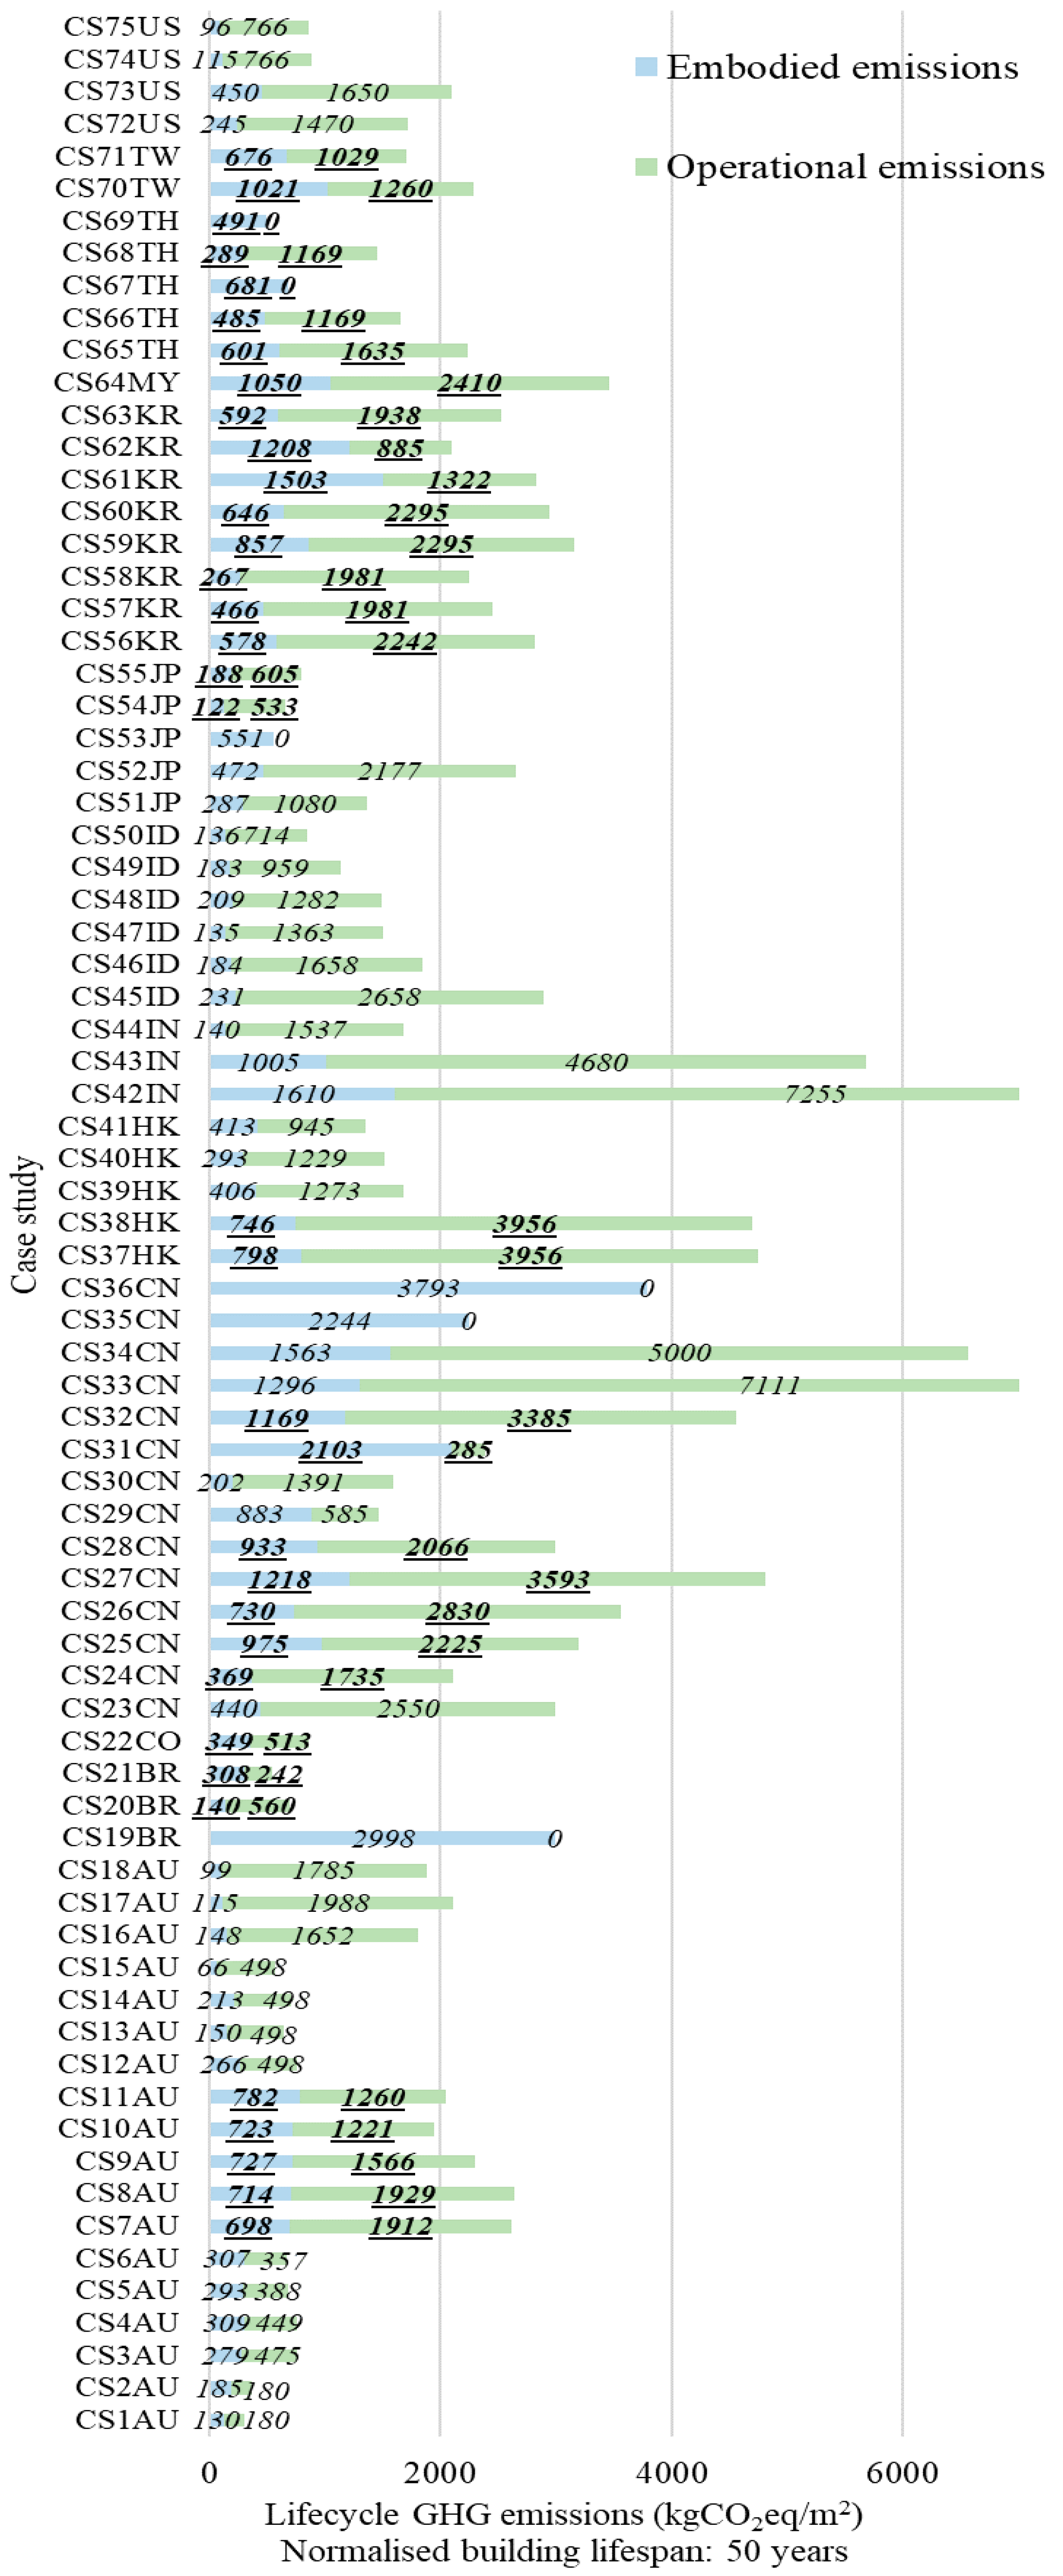
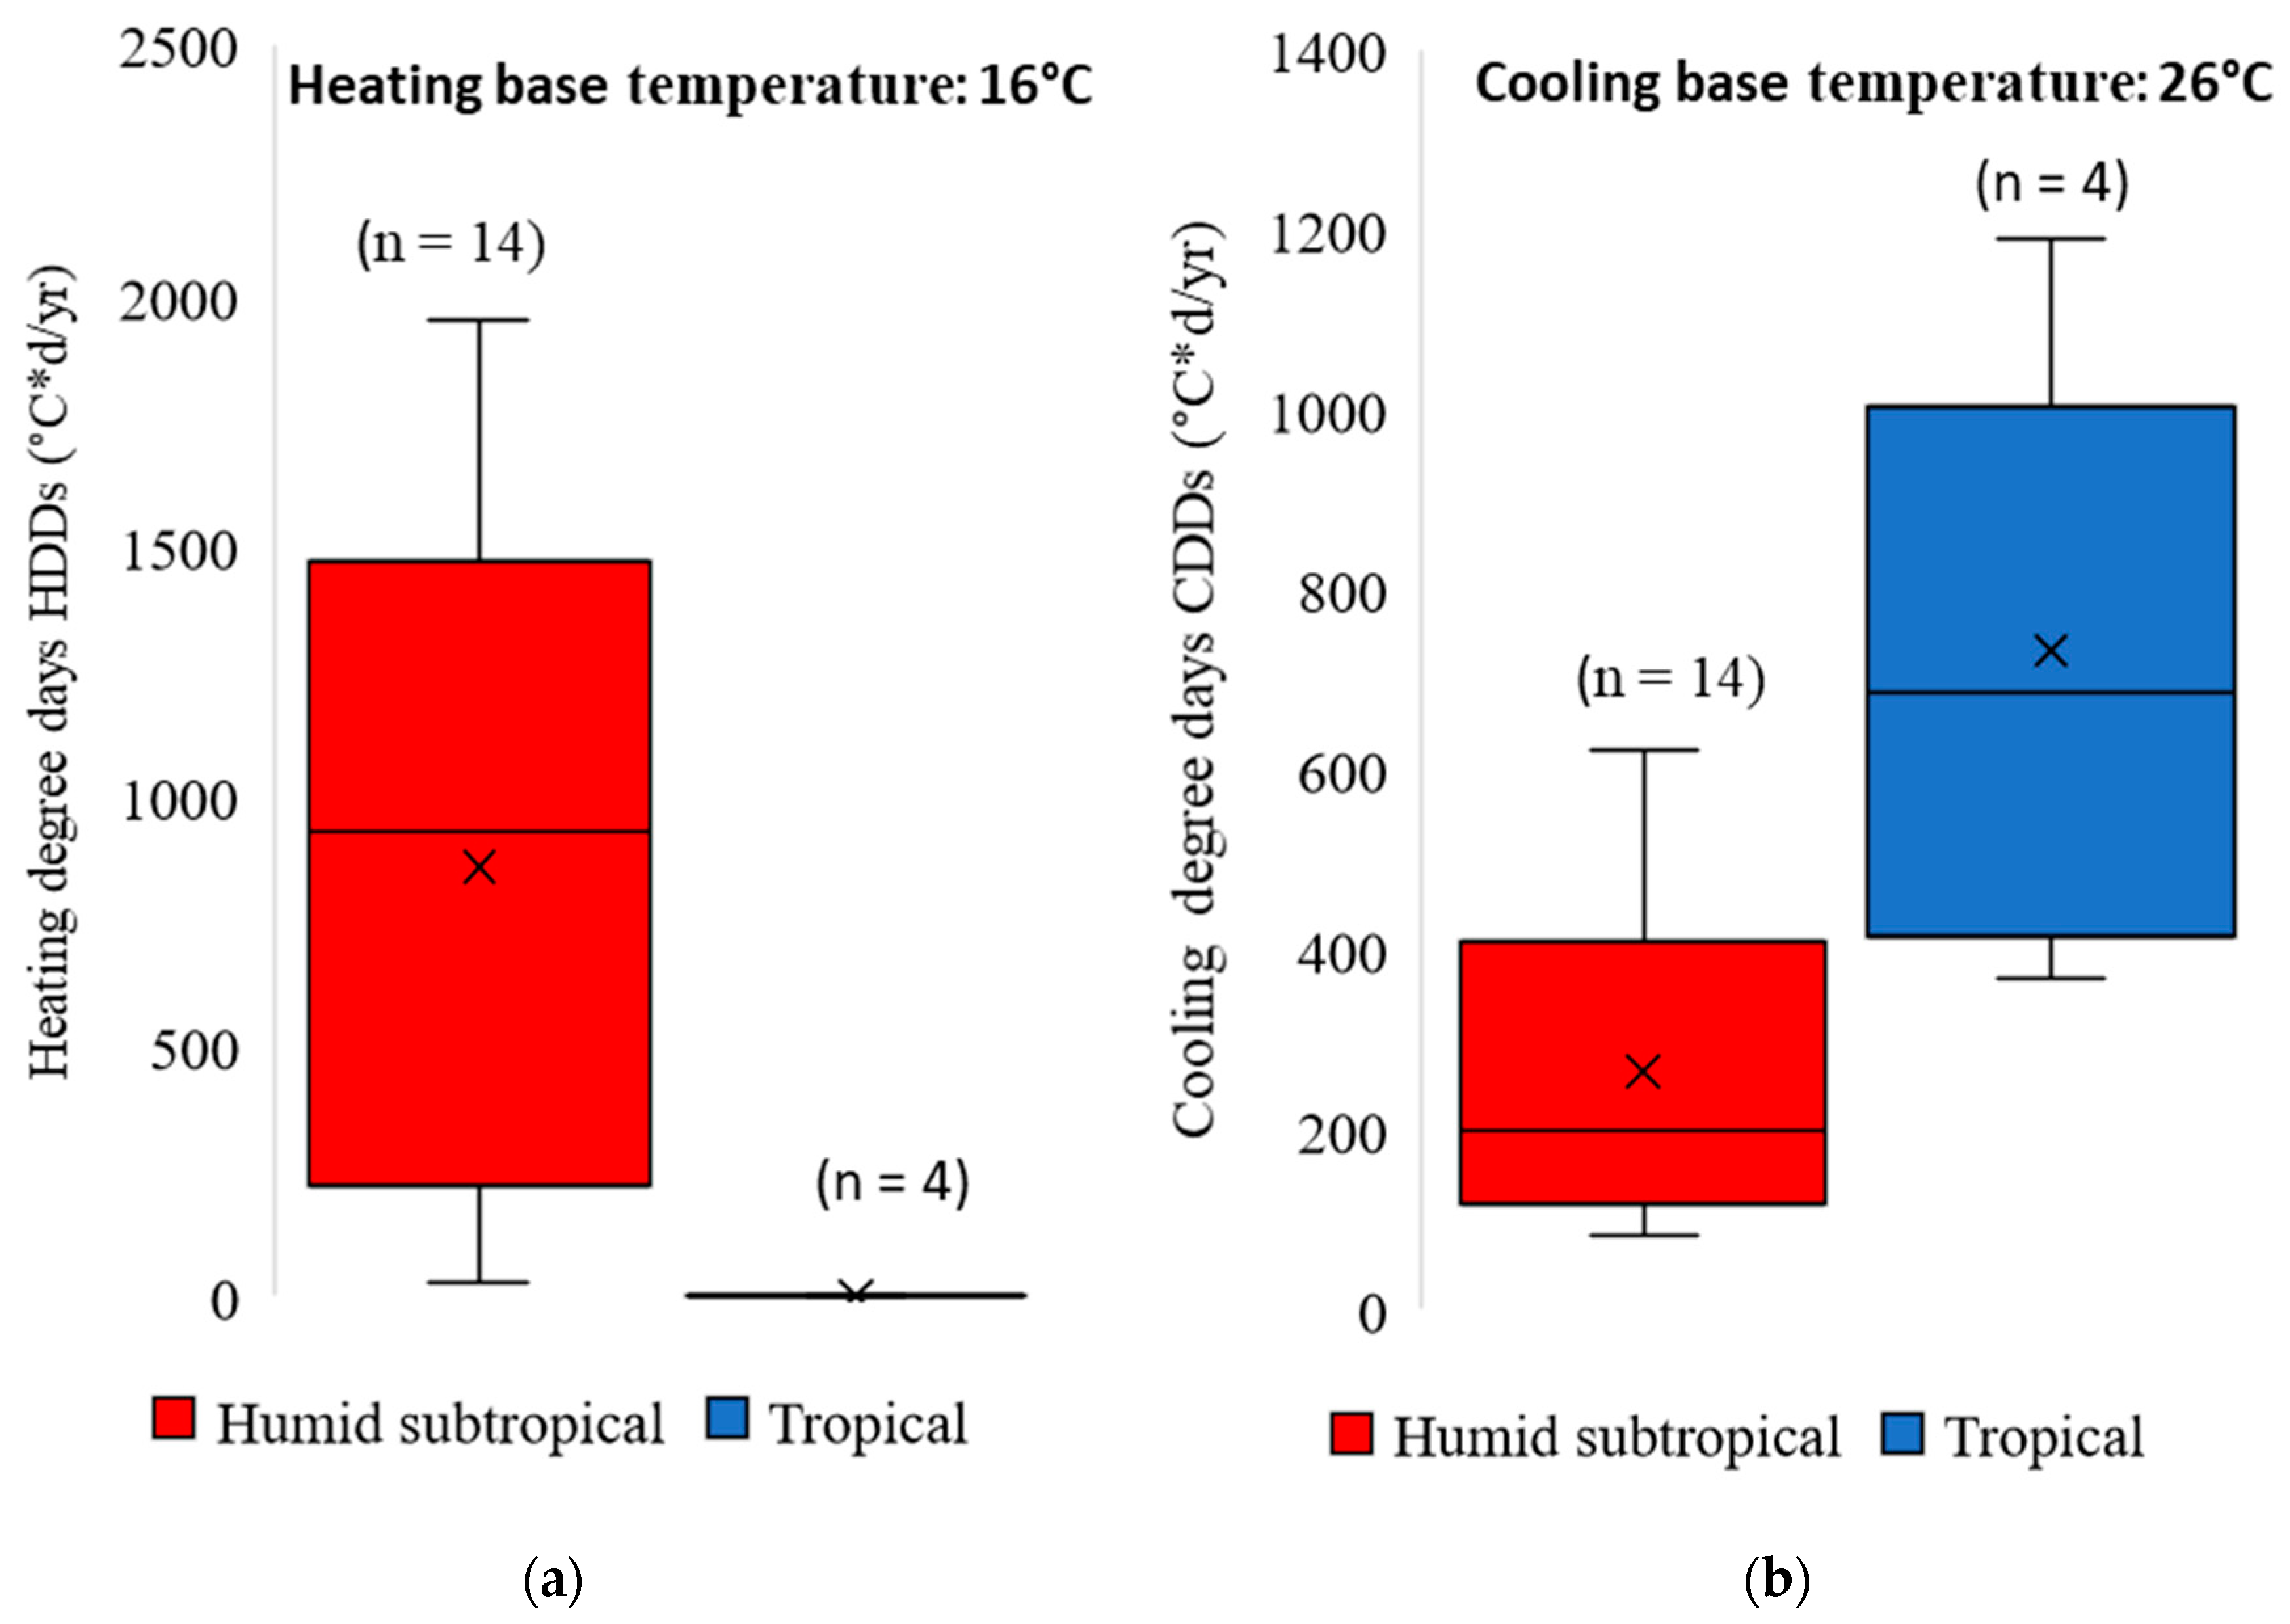


