Automated Positioning of Anchors for Personal Fall Arrest Systems for Steep-Sloped Roofs


1
McKinstry Co. LCC, 5005 3rd Ave S, Seattle, WA 98134, USA
2
Department of Construction Management, Guggenheim Hall, Colorado State University, Fort Collins, CO 80523, USA
*
Author to whom correspondence should be addressed.
Buildings 2021, 11(1), 10; https://0-doi-org.brum.beds.ac.uk/10.3390/buildings11010010
Submission received: 28 September 2020
/
Revised: 21 December 2020
/
Accepted: 22 December 2020
/
Published: 25 December 2020
(This article belongs to the Special Issue Application of Computer Technology in Buildings)
Abstract
:Falls account for about one-third of all construction fatalities with most fatalities in the roofing trade. Even though a personal fall arrest system (PFAS) is required for fall protection, proper placement of PFAS anchor points is an issue evidenced by the high number of fatalities caused by incorrect anchor positioning. The research goal was to proof the concept of optimizing the location of the PFAS anchor points on steep-sloped roofs. This goal was achieved by: (1) Developing an algorithm for converting the required local jurisdiction construction regulations and standards for PFAS anchor positioning into machine-readable rules; and (2) Developing and validating an algorithm for optimizing the location of PFAS anchor points. The K-Nearest Neighbor Search (KNNS) optimization algorithm was selected in this research and was implemented into a standalone computer tool using Python programming language. The tool calculates the potential anchor locations that satisfy the fall clearance and swing hazard requirements and then displays the anchor locations both graphically and numerically. The optimization algorithm was validated using the K-fold Cross-Validation method, which proved the algorithm was adequately accurate and consistent. The research contribution is the proof of the concept that the development of an optimization algorithm and automated field-level tool for optimal selection of PFAS anchor points is possible, further research and refinement could help steep-sloped roofing companies improve their safety practices.
1. Introduction
According to the Bureau of Labor Statistics [1], there were 5250 U.S. work-related fatalities in 2018. Of these, 731 were construction trade workers, ranking second behind motor vehicle operators [2]. The major cause of U.S. construction fatalities in 2018 was a fall from height (33.5%) [3]. Similarly, fall from height is one of the major causes of fatalities internationally. For example, falls from heights was the primary cause of construction-related fatalities in Hong Kong in 2019 accounting for 17.7% of all fatalities in construction [4]. In an effort to increase worker safety the U.S. Occupational Safety and Health Administration (OSHA) regularly publishes standards providing guidance for the workforce. In order to emphasize safety while working at heights, the current fall protection standards include requirements related to the most frequent violation citations [5]. According to OSHA [5], in 2019, fall protection in construction was the top cited standard following inspections of worksites by OSHA. When the available data are analyzed at the trade level, the roofing profession, constantly working at heights, was the top trade in annual fatal falls from 2011 to 2015 [6]. In 2018, roofers had a fatality rate more than 10 times the all-worker rate [2]. According to the Center for Construction Research and Training (CPWR) report [6], the majority of the fatalities in the U.S. occur in small size companies with less than 19 employees.
Personal Fall Arrest System (PFAS) anchorage is vital to saving the worker’s life by successfully arresting a worker during a fall. There are several different types of PFAS, but the rules governing their design and installation are generally the same. PFAS is a proven means of protecting workers while working at heights and is required for workers on steep-sloped roofs (slope of 4:12 or greater, herein referred to as “roofing”, “roofs”). PFAS consists of three major components: (1) anchorage connectors, (2) body harness, and (3) deceleration device. While all three components work as a unit, the success of a PFAS system starts with a well-placed and secure anchor point to a structure. Anchor points can be both permanent and temporary and typically do not damage the roof system.
As with any system, there is no guarantee the system will result in a zero-fatality outcome. Chi et al. [7] and Hu et al. [8] found that one of the main causes of falls was improper use of personal protective equipment (PPE). About 54% of the fall decedents did not have access to a PFAS while 23% had access to a PFAS but were not using it at the time of fall [9]. There were also cases where fatalities happened because a PFAS failed to provide protection against a fall hazard [10]. Studies show that the failure of a PFAS to protect worker lives typically emanates from the absence or misuse of PFAS (e.g., harness improperly worn, extending a retractable lifeline too far and improper selection of anchor points) [10,11]. Accidents are also caused by the improper selection of anchor points such as: (1) negating swing hazard, (2) insufficient fall clearance, and (3) not tying off to an appropriate structure [10,11].
Construction contractors in the U.S. are legally bound to provide fall protection for their workers based on the OSHA regulations. Each employee working “on a steep roof with unprotected sides and edges 6 feet or more above lower levels shall be protected from falling by guardrail systems with toe-boards, safety net systems, or personal fall arrest systems” [12]. There are no exclusions, this rule applies to the entire U.S. construction industry. Similar to the U.S., other countries’ regulations also require the use of PPE. As an example, the Hong Kong Safety Management System (SMS) framework includes hazard control by utilizing PPE [13].
According to the American National Standards Institute (ANSI) [14] a qualified person (e.g., professional engineer (PE), or structural engineer) is required to design the PFAS system, while a competent person (i.e., safety manager) supervises its installation and maintenance. OSHA [15] defines a competent person as “one who is capable of identifying existing and predictable hazards in the surroundings or working conditions which are unsanitary, hazardous, or dangerous to employees, and who has authorization to take prompt corrective measures to eliminate them”. However, a PE/structural engineer and safety manager may not always be present on the jobsite. Therefore, individuals with little or no professional training may install the PFAS. This may result in an increase in improper PFAS installations, which can create a number of safety concerns. In addition, Fang et al. [16] pointed out a need for research on inspection of the appropriate use of PPE.
Based on the field practices that require a competent person’s involvement in the PFAS installation, there is a need for optimizing and automating the selection of adequate anchor to reduce errors that occur when manual calculations of anchor locations are performed by a human. In the last decade, several attempts were made to automate the safety practices in construction processes and to track the real-time status of workers on the jobsite using sensing technologies [17]. However, the literature suggests that an algorithm for optimizing anchor points that is compliant with local jurisdictional PFAS design regulations and a tool that implements the algorithm that can be used in the field have not been developed at this time. In this research, an algorithm is defined as a set of precise and unambiguous instructions to be executed by a computer program [18].
Therefore, the goal of this research was to proof the concept of optimizing the locations of PFAS anchor points on a steep-slope roof project using a single slope simple gable roof design. The research developed an optimization algorithm as the basis for building a tool to help field workers with the selection of PFAS anchor points. Since the algorithm uses both the U.S. OSHA regulations and ANSI standards, development of the algorithm required an understanding of the standards and regulations and what processes would operationalize an algorithm in the form of a Windows-based computer tool (APP). This resulted in two guiding research questions. The first question defined what the algorithm(s) would look like (process mapping and decision points) to guide the process to answer the second question, how to merge multiple algorithms to make the tool work. The answer to the first question is that the algorithm can be used to identify decision points and show processes like: (1) the type of deceleration device that should be used based on PFAS’s specifications, and (2) the optimal locations for the anchorage that satisfy fall clearance and swing hazard requirements. The answer to the second question, how to make the computer tool work, led to the identification of four main objectives: (1) Developing an algorithm for defining a set of rules for positioning of PFAS anchor points, (2) Developing an optimization algorithm for making decisions about anchorage positioning, (3) Automating the optimization process by implementing the optimization algorithm into a Windows-based computer tool, and (4) Validating the optimization algorithm.
As a result, to proof the concept, this research developed an optimization algorithm and implemented the algorithm into a computer tool that automates the optimal anchor point selection on steep-sloped roofs, using a single slope simple gable roof design, to encourage greater worker safety on the jobsite. Using the OSHA and ANSI rules, the tool can be used by a competent person (e.g., safety manager) in situations where the qualified person (i.e., PE/structural engineer) is not present on a job site. These requirements may be different in other countries, so a clear understanding of local and national jurisdiction regulations is critical to proper tool use. The potential users of the tool are roofing trades working on the steep-sloped roofs, typically on small and mid-sized projects. The use of the tool could potentially improve their safety practices. A tool of this type is simple to use and could be financially feasible, especially for smaller companies with limited safety resources.
2. Literature Review
2.1. The Need for Using a Personal Fall Arrest System (PFAS) in Roofing Construction
Huang and Hinze [19] categorized fall accidents based on the type of facility being constructed (e.g., single family or multi-family dwelling) as well as nature of the construction effort (e.g., new construction, addition, etc.). They looked at fall rates and project costs and found that the greatest portion of the falls was on projects with costs less than USD 50,000 followed by falls on the projects in the USD 50,000–USD 250,000 range. Dong et al. [9] analyzed the National Institute for Occupational Safety and Health (NIOSH) statistics in the Fatality Assessment and Control Evaluation (FACE) reports and found that the percentage of falls from 6–15-foot heights increased from 13.9% for 1982–1992 to 48.7% for 2004–2014. These studies focused on the high percentage of falls in the residential industry identified by cost range and fall height. According to the CPWR [6], the risk of falling at the workplace depends on the type of construction trade. Roofers were the trade with the highest rate of fatal falls; 291 fatalities from 2011–2015 [6]. Despite the statistics, both Cable [20] and Stromme [21] argued that the residential industry considers that a 30-min exposure to the fall hazard with no fall protection is reasonable. In addition, residential contractors perceived that the use of fall protection decreases productivity and adds financial burden [22]. These findings highlighted the reasons some residential companies do not provide fall protection to their workers even though this is the project cost range and fall height where most falls happen.
2.2. Personal Fall Arrest System (PFAS) Compliance for Roofers
According to OSHA [12], the use of a PFAS is not limited to a specific roof slope and shall be utilized in any project with unprotected edges 6 feet or more above the lower level. Perry et al. [11] compared five construction trades including roofers, carpenters, electricians, ironworkers, and painters in terms of their compliance with safety regulations. Their findings indicated that the use of PFAS was 3% lower than applying other safety practices and that carpenters and roofers complied with safety regulations less frequently than other trades resulting in their higher risk of falls. One of the reasons for roofer’s noncompliance with requirements for PFAS use was neglecting PFAS design standards. These standards include: (1) when selecting an anchor point, the PE should look for swing hazards, and proper time frame for avoiding suspension trauma [23], (2) free fall distance affects clearances and maximum arresting force applied to the fallen worker and, thus, should be given adequate attention, (3) avoid excessive rope slack, and (4) avoid use of non-structural elements as anchors [12,14,24]. Johnson et al. [25] argued that non-compliance with fall protection regulations and lack of PFAS or other fall protection strategies (as main causes of fall fatalities) can further be attributed to unsafe behavior, design difficulties, and cost competitiveness of the home building and roofing industries.
2.3. Information Technology Application in Construction Safety
The construction industry is a late adopter when it comes to technology [26]. The current safety planning approaches are inefficient because they mainly use text-based checklists rather than smart tools that incorporate information technology [27]. However, information technology could help with the automation of some of the standard construction practices. A study by Teizer [28] indicated that the fatality rate in the U.S. construction industry has not increased significantly over the past decade due to the industrialization and automation of work tasks. Therefore, identification of potential hazards on a construction site is an opportunity area for automation.
Various automated models were developed by previous studies that focused on fall protection. Navon and Kolton [29] developed an automated model to monitor and control fall hazards. The model identifies dangerous activities and areas where falls may happen and provides plan for installing guardrails. Then the model constantly compares the existing and planned guardrails and issues warnings if a guardrail is missing in a building under construction. Wang et al. [30] developed a method, which integrates OSHA safety regulations related to excavation pits and a building information model of a pit. The method automatically identifies cave-in and fall hazards in a 3D point-cloud model of the excavated construction pit. The method also uses the 3D model to propose and visualize protective safety measures such as guardrails for fall protection as well as soldier piles, bearing plate and lagging walls for cave-in protection.
Several previous studies used a rule-checking approach to automate safety practices. Malekitabar et al. [31] identified five sets of safety drivers that improve the hazard identification process and used object oriented programming concepts to make the risk drivers quantifiable for building information modeling (BIM) software. Solihin and Eastman [32] developed a framework for defining rules for creating a BIM rule-checking process. They identified three key principles for defining the rulesets during tool development: (1) streamlining the rules and clarifying the dependencies, (2) clarifying when each individual rule is applicable and under what terms each rule will be satisfied in order to avoid confusion in the interpretation of overlapping rules by the computer, and (3) interpreting rules into computable true/false forms if possible. Fall protection professionals that work on developing an automated process for investigating the rules for different hazardous scenarios can benefit by considering these key principles.
Rule-checking approaches have also been used for fall protection. For example, Benjaoran and Bhokha [33] created a rule-checking system using 4D CAD building models to automatically identify working-at-height hazards in building design. The system also proposes safety measures and integrates them into the 4D model of construction schedule; thus, the project participants are able to visualize potential safety hazards and prevent them before the actual construction starts. Qi et al. [34] compiled fall protection best practices into computer rules in order to create a prevention through design (PtD) tool to improve fall protection planning in the project design phase. Zhang et al. [27] developed a framework that integrated an automated rule-checking system and a commercially available BIM tool. Their framework could be used in the project planning phase to integrate fall protection measures with work breakdown structures and project schedules. In a later study, Zhang et al. [35] developed an automated BIM-based safety framework that integrates rule-checking algorithms to identify potential fall hazards based on the construction schedule, visualizing hazards for the workers, and helping to plan the fall protection accordingly. Mistikoglu et al. [36] utilized a data-mining algorithm to extract rules that show the associations between construction fall causes and the degree of injury. The chances of fatalities increased with increased fall distance and decreased when safety training was provided.
Ontology-based rule-checking expert systems can help safety managers manage safety hazards in an intelligent way. Guo and Goh [37] found that inadequate designs of active fall protection are common regardless of the standards mandating fall protection on sites. They developed an ontology that focused on fall from heights and formalized knowledge about the design of active fall protection such as PFAS. Their ontology can be integrated in an Industry Foundation Classes (IFC)-based building information model and can be used as a decision support system for the PFAS design. They conducted semi-structured interviews with construction professionals and found that the following concepts (anchorage design, height of work platform) and attributes (worker weight, slope of work platform, anchorage accessibility and ease of connecting) were important for PFAS design. The ontology can help PEs standardize PFAS design; therefore, PEs can benefit from using rule-checking expert systems when designing active fall protection.
Nguyen et al. [38] developed a generic model utilizing a Bayesian Network (BN) to develop an effective quantitative risk assessment tool that predicts risk from falls from heights. The computational module was programmed and developed in MATLAB. Their validation process included validations of data, the generic BN model, and the computational module. The authors utilized a case project to demonstrate the capability of the developed BN approach. They also performed a verification of the computational module to confirm that computer programming was correct and accurate. The authors claimed that their approach would improve safety and productivity on construction projects and would help project team take actions that would reduce the risk of falls.
Wang and Qin [39] developed an approach that considers various working routes on construction site in regard to potential fall risks and then selects the route that has the minimal fall risk. Their approach integrates building information model, a Bayesian Belief Network (BBN) method and ant colony algorithm. The building information model is used to retrieve building geometry which BBN uses to assess potential fall risks in the case of different fall scenarios. The data from the BNN analysis are then used as an input for the ant colony algorithm that provides a plan for safe working routes on a construction site. Fang et al. [16] developed a method for automated inspection of PPE use by steeplejacks that were performing aerial work outside of exterior walls. They used a computer vision method, that is, a deep learning-based occlusion mitigation method, for checking PPE. Their PPE inspection included wearing harness, proper anchorage, and wearing hardhats.
3. Research Methodology
The goal of this proof-of-concept research was to develop and validate an algorithm for optimizing the location of PFAS anchor points on steep-sloped roof using a single slope simple gable roof design. While a complex roof design could be used, the proof of concept used a simple roof design for the optimization of fall protection anchors. This research used an applied research methodology, which is appropriate for the proof-of-concept development of an algorithm [40]. The research consisted of four major phases (see Table 1). In phase one, a rule-set algorithm was developed by examining the local and national jurisdiction required construction safety standards and regulations. These were then converted into machine-readable rules to examine fall clearance and swing hazard rules for different scenarios. In phase two, the rule-set algorithm was incorporated into the algorithm for selecting the optimal anchor locations using the K-Nearest Neighbors Search (KNNS) algorithm as a basis. In phase three, the optimization algorithm was implemented in the Python programming language to develop an automated tool for selecting optimal locations of PFAS anchor points. After the tool was developed, the algorithm and the tool were tested using 20 different input data scenarios to verify the algorithm and tool development and to test if the tool runs smoothly. In the fourth phase of the study, K-fold Cross-Validation was used to validate the accuracy and consistency of the optimization algorithm. In summary, the proof of concept demonstrated how to develop an optimization algorithm and create a tool, APP in this case, that is beneficial to the safety of construction workers.
4. Development and Validation of an Algorithm for Optimizing Location of PFAS Anchors
4.1. Developing a Rule-Set Algorithm for PFAS Anchor Positioning
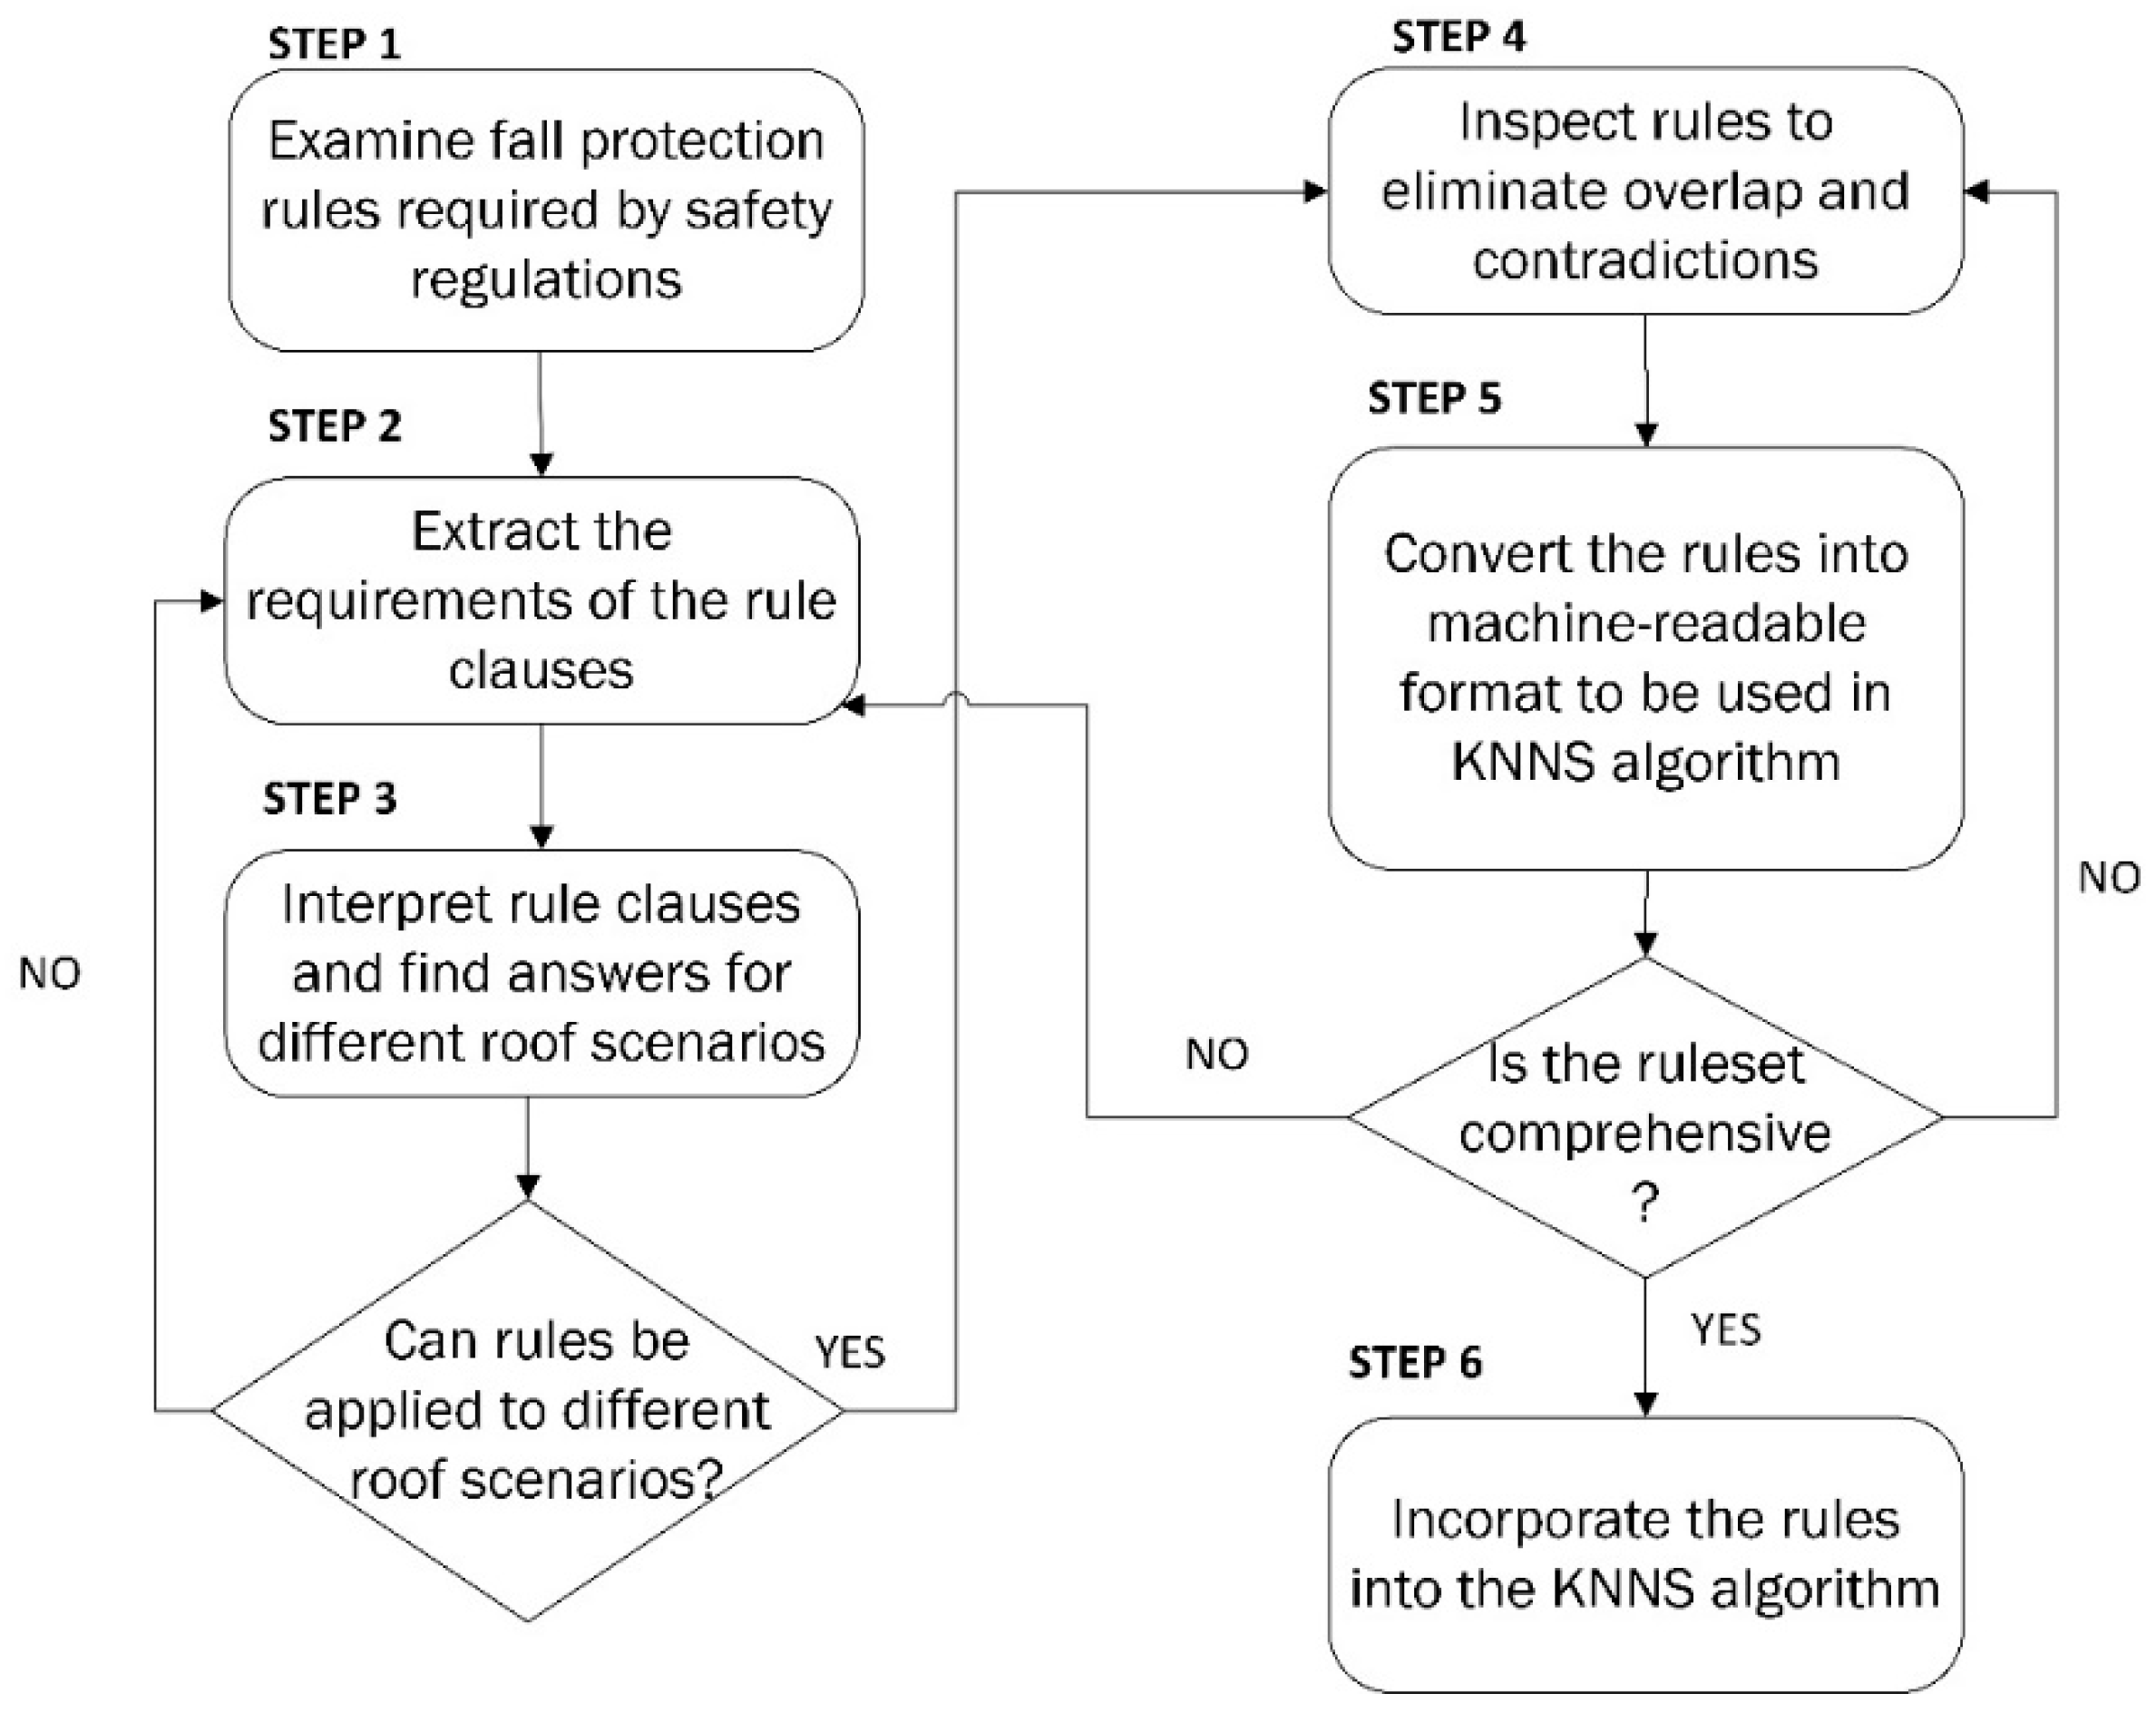
In the first research phase, a six-step algorithm for defining and examining a set of rules for anchor positioning was developed (Figure 1).
The first step of the rule-set algorithm includes examining the fall protection rules from the local and national jurisdiction safety standards and regulation clauses. As an example, this research used the U.S. American National Standards Institute (ANSI) and U.S. American Society of Safety Engineers (ASSE), ASSE recently changed their name to the American Society of Safety Professionals (ASSP) ANSI/ASSE [14,41,42] and the U.S. OSHA [12] regulations and standards. More specifically, the standards and regulations examined included: ANSI/ASSE Z359.18-2017 [41], ANSI/ASSE Z359.2-2017 [42], ANSI/ASSE Z359.6-2016 [13], OSHA 1926.502 subpart M [43] and OSHA 1926.501 [12]. The goal of the first step of the algorithm was to identify dependencies between the rules and opportunities for streamlining. In the second step of the algorithm, the requirements for the rule clauses were extracted, while the third step interpreted the rule clauses and additional questions for the various roof scenarios were answered. Table 2 shows an example of the process of the rule analysis, rule interpretation and additional questions explored by the authors.
The framework for the classification of rules developed by Solihin and Eastman [32] was adopted for phases one and two of this research. Their framework is a comprehensive roadmap for finalizing the database of rules for the algorithm. Using their framework, in the fourth step of the algorithm, every rule is inspected and refined in order to avoid overlap and contradiction with the other rules. Rule clauses were written in a homogenous, simple and clear format and the conditions under which each rule would be satisfied were defined. To avoid ambiguities in computer interpretation of the rules, the authors developed a set of questions regarding the coverage of rules (see Table 2). As a result, the possible contradictory and overlapping clauses were minimized.
In the fifth step of the algorithm, the rules are converted into a machine-readable format. In the sixth step, if the rule-set is sufficiently comprehensive, it is incorporated into the KNNS optimization algorithm.
4.2. Developing K-Nearest Neighbors (KNNS)-Based Optimization Algorithm for PFAS Anchor Positioning
In phase two of the research, the rule-set presented in Section 4.1 was incorporated into an optimization algorithm. Several existing optimization algorithms such as Nearest Centroid Classifier (NCC), Artificial Neural Network (ANN), and K-nearest neighbors (KNNS) algorithms were considered for this research. NCC is a machine-learning algorithm that computes the centroid of each class of data and measures the distance of each point to the centroid of other classes [44]. Since the optimization dataset in this research is considered one single class, the authors decided this method was not appropriate for this research. ANN consists of a framework for many different machine-learning algorithms that work together and process complex data inputs [45]. ANN is a time-consuming and complex method that is unnecessarily complex for research of this type. Based on the analysis of these algorithms, the authors selected KNNS as the best fit for this research because it works based on local proximity measurement, which is a problem of finding the point in a given set of points that is closest to a given point. Another reason for utilizing the KNNS algorithm in this research was the comprehensive evaluation of distances between every two data points without eliminating any potential result point and overcomplicating the analysis. However, the prediction time may become an issue with a big dataset and require higher memory capacity [46]. The KNNS algorithm is also very useful for optimizing nonlinear arrays of data, which is the case in this research. KNNS also matches the level of computation needed for the optimization in this research. In summary, the KNNS algorithm: (1) specifies a positive integer K-number along with a new sample; (2) selects K entries in our database closest to the sample; and (3) measures and classifies the distance of the entries [46].
At this stage of the research, the decision variables used in the optimization algorithm were narrowed down to fall clearance and swing hazard requirements to streamline the optimization process. It should be noted that meeting an allowed weight range of worker is needed as an algorithm prerequisite due to the loads imposed by a falling worker. This variable is discussed later in the paper. The structural calculations were not incorporated in the optimization algorithm because OSHA requires that a structural engineer (i.e., a human) rather than a computer tool performs the strength calculations. The KNNS optimization algorithm was used to filter the structurally sound anchor points that satisfy both the fall clearance and swing hazard requirements. For this research, the KNNS optimization algorithm consisted of:
- Decision variables:
- o
- The allowable distance of working platform from the roof edge;
- o
- The allowable angle of the working platform in case of a nearby barrier that might lead to fall swing hazard;
- The constraints:
- o
- The roof height;
- o
- The distance of the roof edge to the closest lower obstruction;
- o
- The PFAS features;
- o
- The roof dimensions;
- o
- Location of barriers leading to swing hazard;
- The objective:
- o
- Finding the optimal locations for positioning anchors.
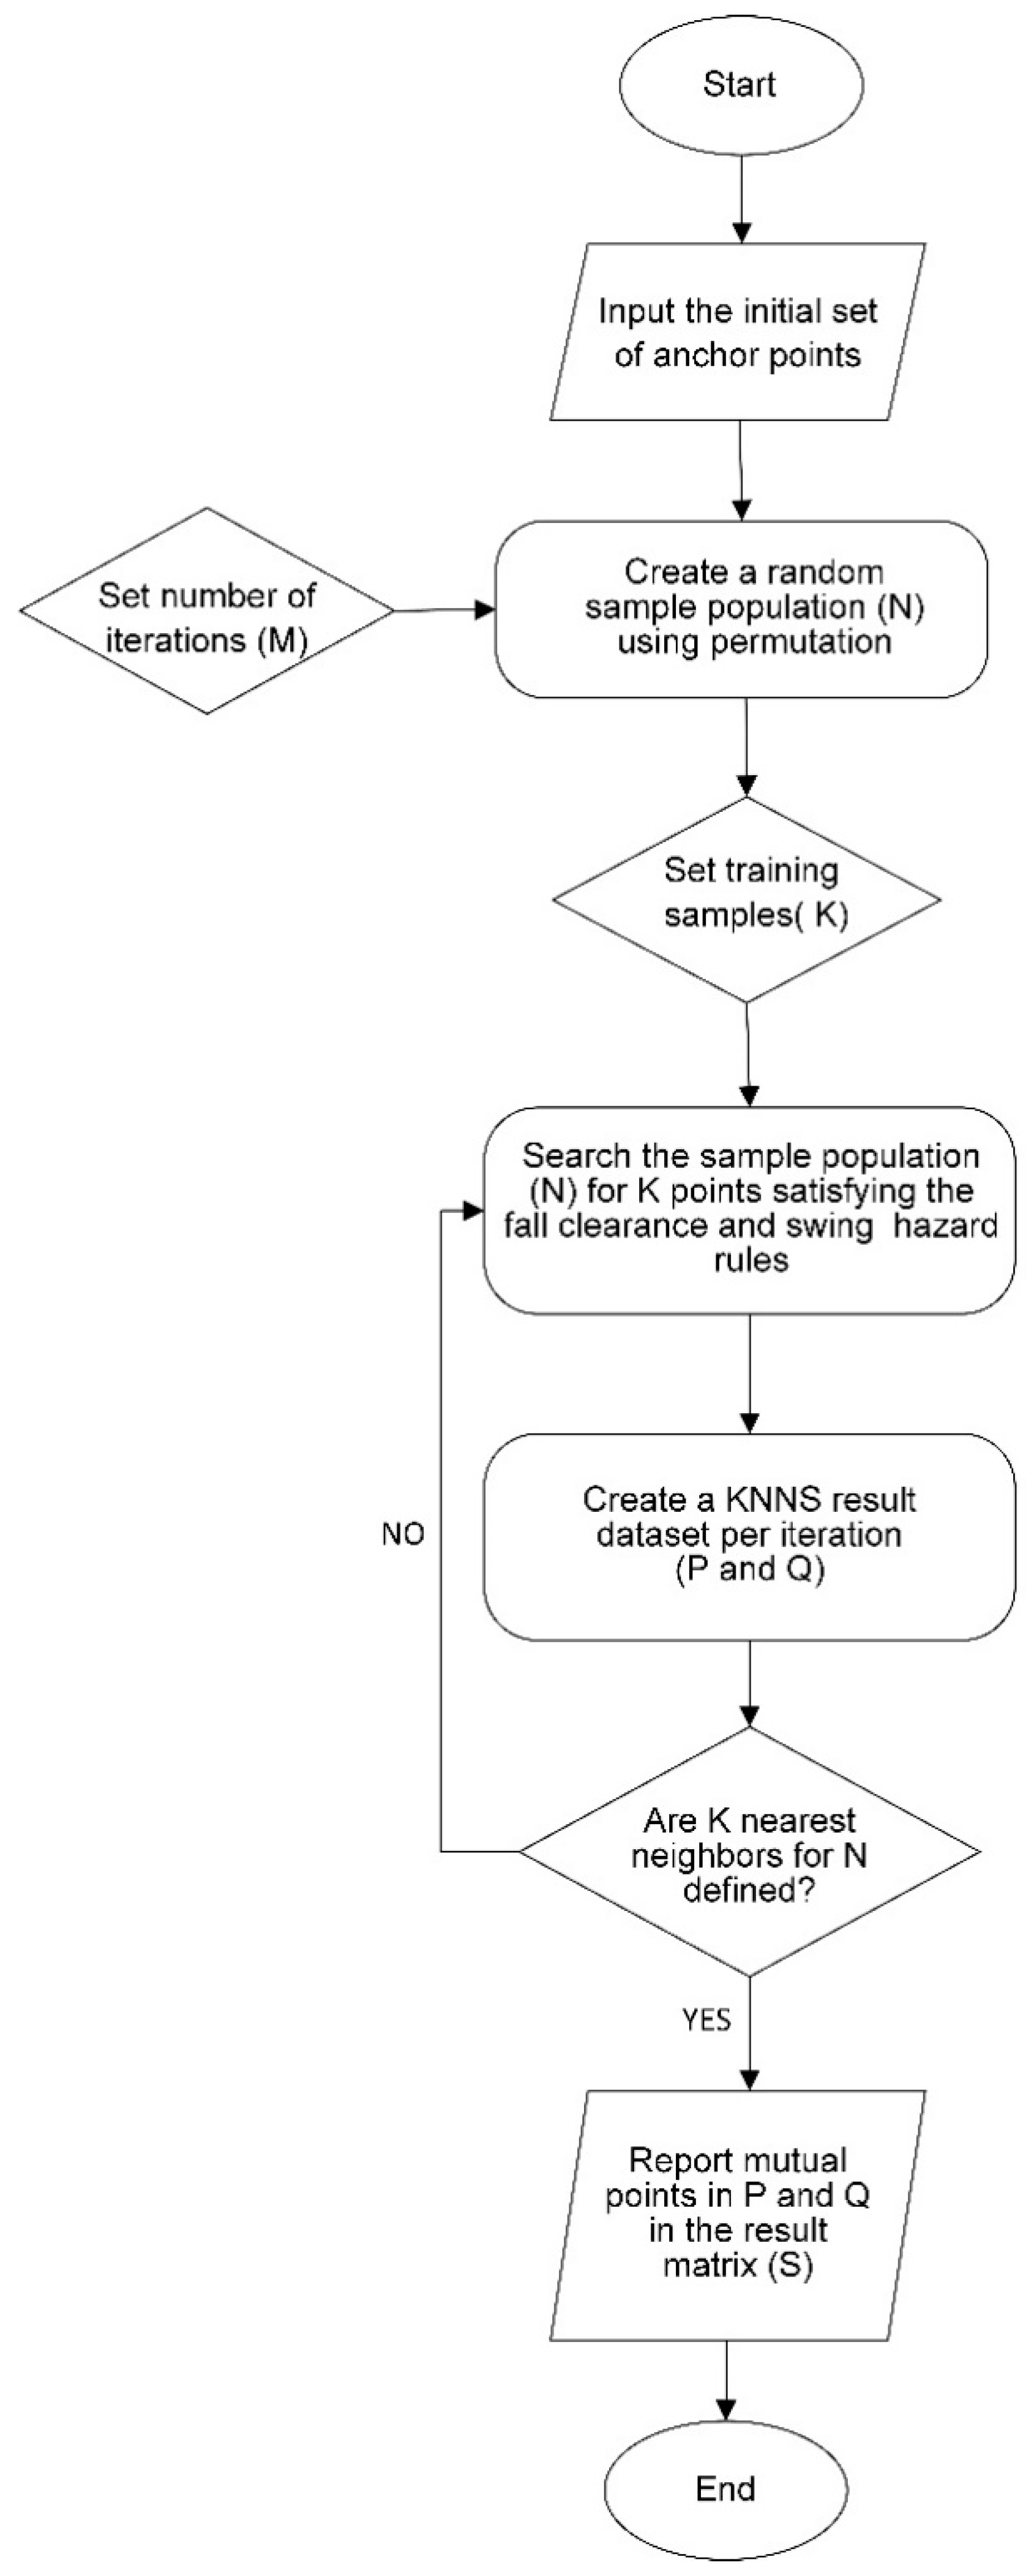
Figure 2 shows an algorithm for optimizing the location of PFAS anchor points developed by this research.
In the first step of the algorithm, a KNNS query problem was established by defining a set of potential anchor points with respect to the roof configuration. For example, for a 50 foot by 12 foot gable roof, a set of 86,400 potential anchor points was inputted. In this proof-of-concept study, a simple roof geometry and limited number of points were used to minimize the computational time. Note that more complex roof shapes and larger number of potential anchor points would require more computational power and longer computation time. In the next step, from the initial set of 86,400 potential anchor points, two sets of 8000 points (n = 8000) were randomly selected as the sample population. The number of iterations (M) was set at two; iteration 1 considered the first set of 8000 points while iteration 2 considered the second set of 8000 points. Each iteration considered all 8000 points for fall clearance and swing hazard rule compliance. The points that complied with both rules created a new set of points P and Q that were results of the iterations 1 and 2 respectively. The possible number of anchor points in the sets of points P and Q varied since the initial 8000 points were randomly selected through permutation. The two sets of points, P and Q, were then compared and the mutual points (that is, the anchor points with the same coordinates in both P and Q sets), were defined as a new set of anchor points named S, which represents the results of the tool.
Note that based on the tool user preferences, which are user input values driven from the building specific parameters, the values of n and M could change. The authors selected the values of n for illustration purposes and the values of M based on the goal of having a short computation time. The reason for using only two sets of the points was the limited capacity of the computer CPU and memory (see Table 3).
4.3. Implementation of the Optimization Algorithm into an Automated Tool Using Python
In phase three of the research, the optimization algorithm was implemented in the Python 3.6 programming language to develop an automated tool for selecting optimal locations of PFAS anchor points. The tool was programmed using various Python modules including Numpy, Sympy, TkInter, Mathplotlib, Math and Pil. The Python script was then compiled into a standalone executable tool, which runs in the Windows operating system negating the need to install Python or its modules to be able to run the application. In order to create a simple, user-friendly graphical user interface (GUI) for the tool and to compile the Python script, the TkInter 3.7.1 was used. TkInter is Python’s de-facto standard GUI package. The TkInter advantage over other GUI toolkits is that it is an object-oriented toolkit that is the most compatible with Python and offers a wide array of useful widgets.
Modeling the algorithm in Python started with setting up the tool interface and coding the functions and definitions required to translate the algorithm into a tool (see Listing 1. The basis for the programming of the optimization algorithm was the use of call-back function. In object-oriented programming (e.g., Python), a function is a block of code that is used to perform a single action. A Python class was created to include all the definitions that put together different functions of the tool. A class is an extensible code template for creating an object or implementing a behavior. The definition named “_init_(self)” was created for the purpose of collecting the user input values.
Listing 1. An example of tool interface setup in Python.

In the next step of the coding, entry boxes were created for collecting the input values from the user. In this step, the label and entry commands set the entry box and the description text for each entry box. The text used for each label included the description, the abbreviation and the unit (e.g., Roof Length in feet). Input values were then entered using the entry command and 16 input parameters were defined for this tool (see self.label and self.entry in Listing 2). The “print” definition was created in order to automatically insert the resulting output in the text pad in the main menu. As a result, the user can simply save the text pad file as a record of the tool run. The “on_button” definition is in charge of the subsequent calculation of the tool. The “Enter” button on the user input panel corresponds to the “on_button” definition, where the tool runs the optimization for the input values entered by the user. This function creates a matrix of points on the roof, inch by inch. Then through the “Euclidean distance” definition, the distance of each point from the input anchor is measured as part of the KNNS optimization algorithm. The initial matrix consists of all the points (e.g., 86,400 points for a 50 foot by 12 foot gable roof) in the user-defined range of potential anchor points. The number of anchor points in the initial matrix varies based on the input values. The algorithm programmed for K-nearest neighbor classifier (KNNS) consisted of first creating the initial matrix dataset from the user inputs entered through the Canvas module (see Listing 2).
Listing 2. Creating initial matrix.

In the next step, the KNNS algorithm coding was integrated into the main code. From the entry values a result matrix consisting of the roof point coordinates in form of [i,j] was created as the main dataset, where i belongs to self.entry2 and j belongs to self.entry3 sets. In the next step, a second dataset was created from the main dataset using permutation from NumPy to split the data randomly. The purpose of the permutation is classifying the points by grouping them together with similar points. In this algorithm, nearest neighbors of other points were predicted based on the sample classified groups. In other words, the code searches through the dataset for K similar groups of points for each input point in the result matrix.
To determine the similarity of two points within the dataset, a Euclidean distance metric was selected. Since the dataset in this algorithm is a quantitative type (that is, it has numerical values), a mathematical definition of distance was used (see Listing 3).
Listing 3. Example of K-nearest neighbors (KNNS) definition code.

Next, the fall clearance and swing hazard calculations were performed for each set by conditional statements in the form of if/else statements. The qualified points in terms of both fall clearance and swing hazard requirements were then divided into two new sets of points (P and Q). The final results came from the comparison of these two data sets and the mutual points (that is, the anchor points with the same coordinates/location on a roof) were reported to the user of the tool through the Matplotlib module. The same training model was applied to the next round in the optimization algorithm. The Matplotlib module plots the result points on a roof plane (the actual working surface on the roof, not the plan view surface), where the user can visually compare the results and evaluate the PFAS design decisions.
4.4. Workflow of the Automated Tool for PFAS Anchor Positioning
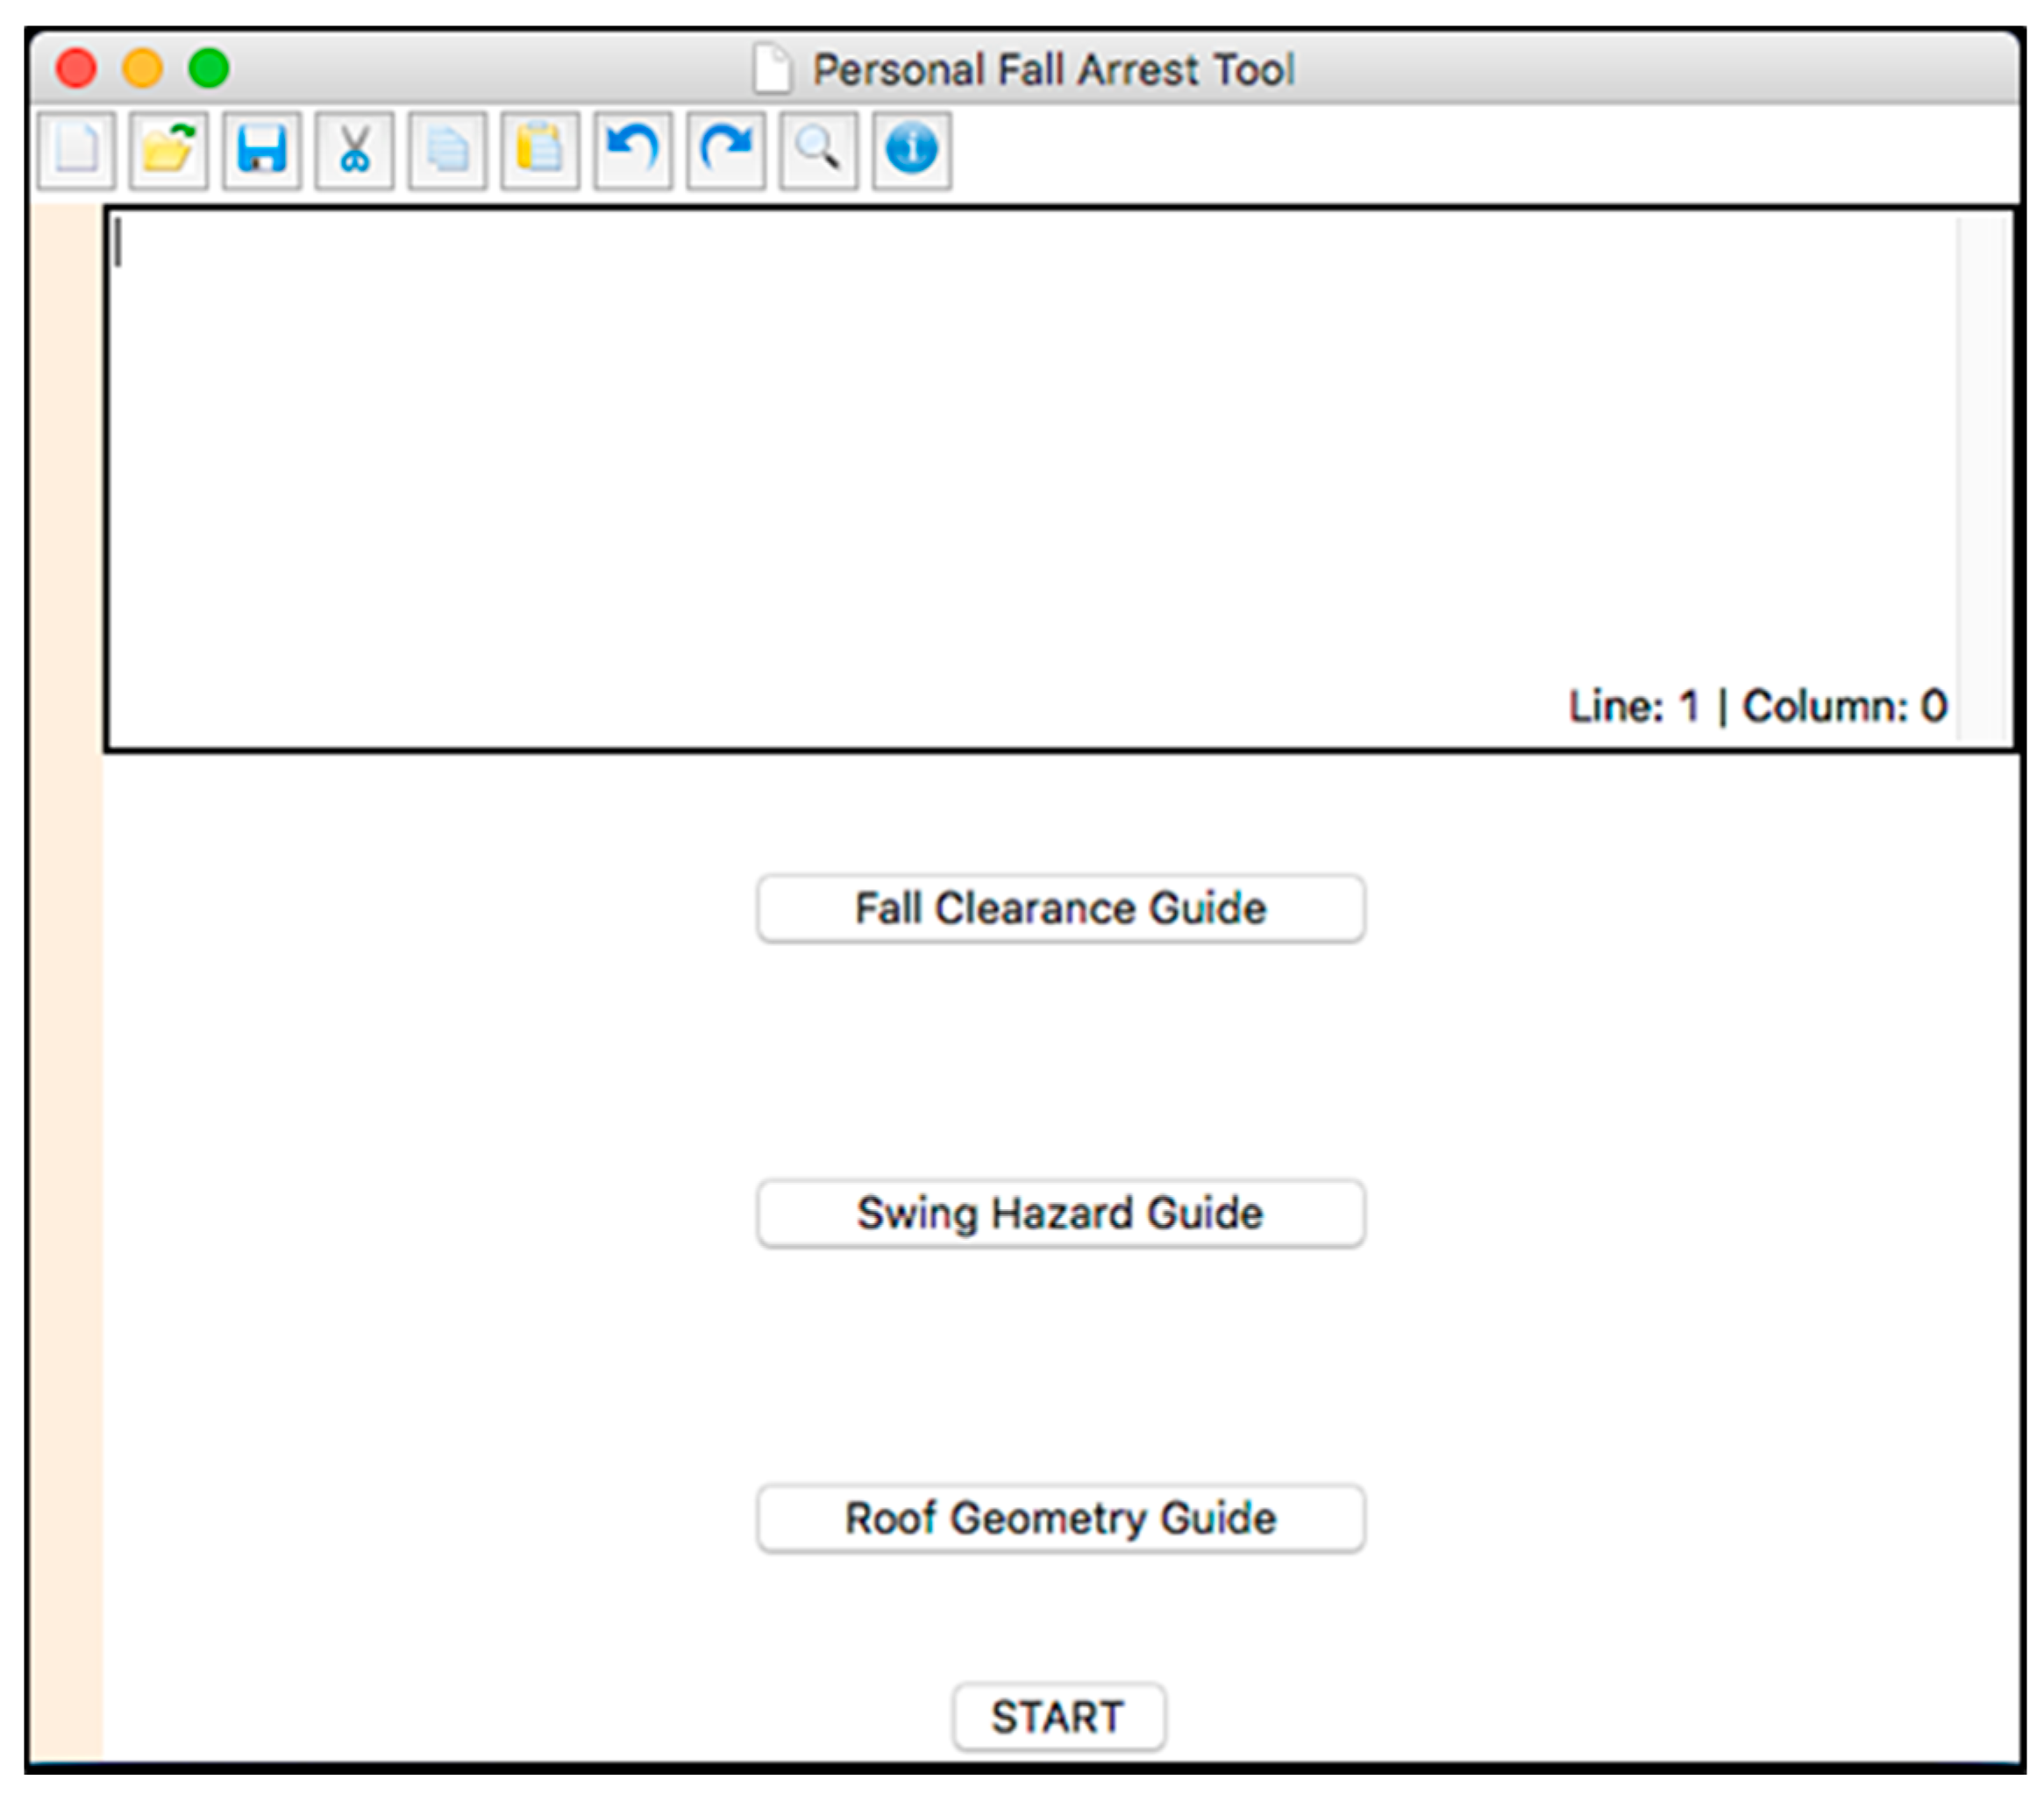
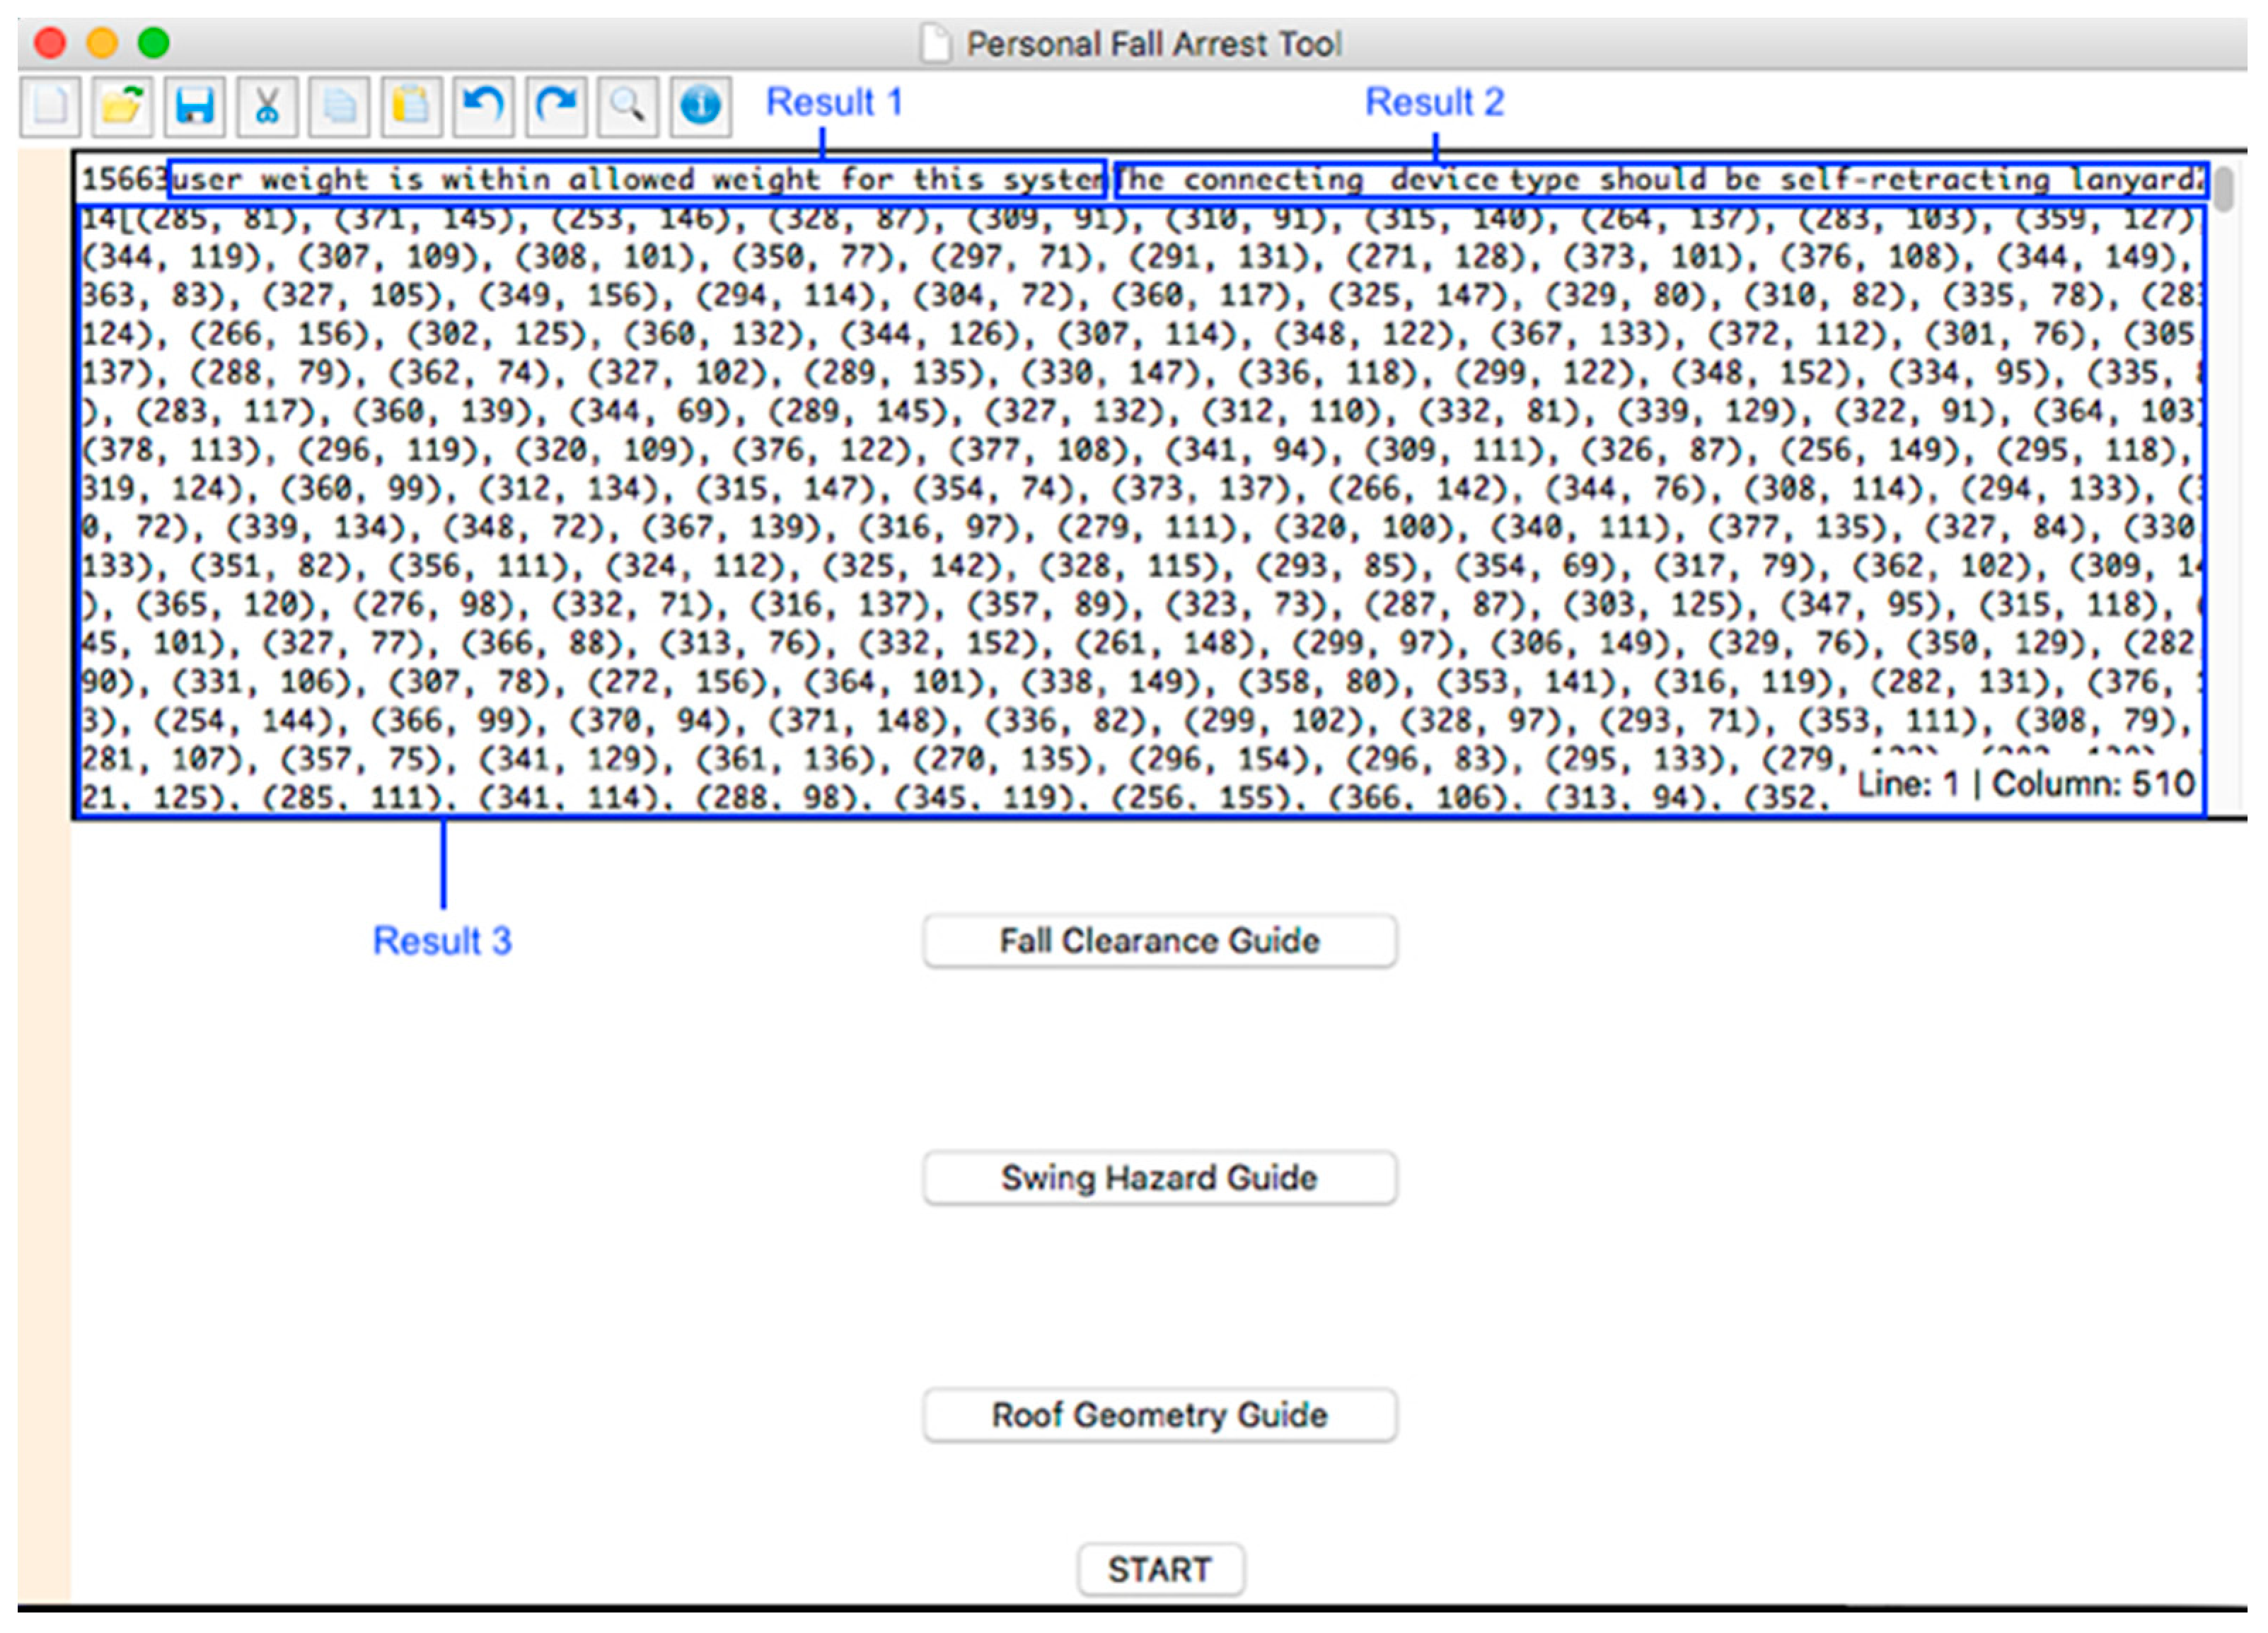
The tool GUI’s main menu consists of a toolbar with conventional icons (e.g., open file, save file, copy, paste, etc.), a text pad, three buttons for fall clearance, swing hazard and roof geometry guides, and a START button (Figure 3).
The tool workflow incorporates the following processes in order:
- Clicking on the START button in the main menu to open the user input panel (see Figure 3);
- Entering the project-specific values for the parameters requested in each command line in the user input panel (see Figure 7);
- Running the optimization process by clicking on Enter button (see Figure 7);
- Saving the output results as a report for future reference.
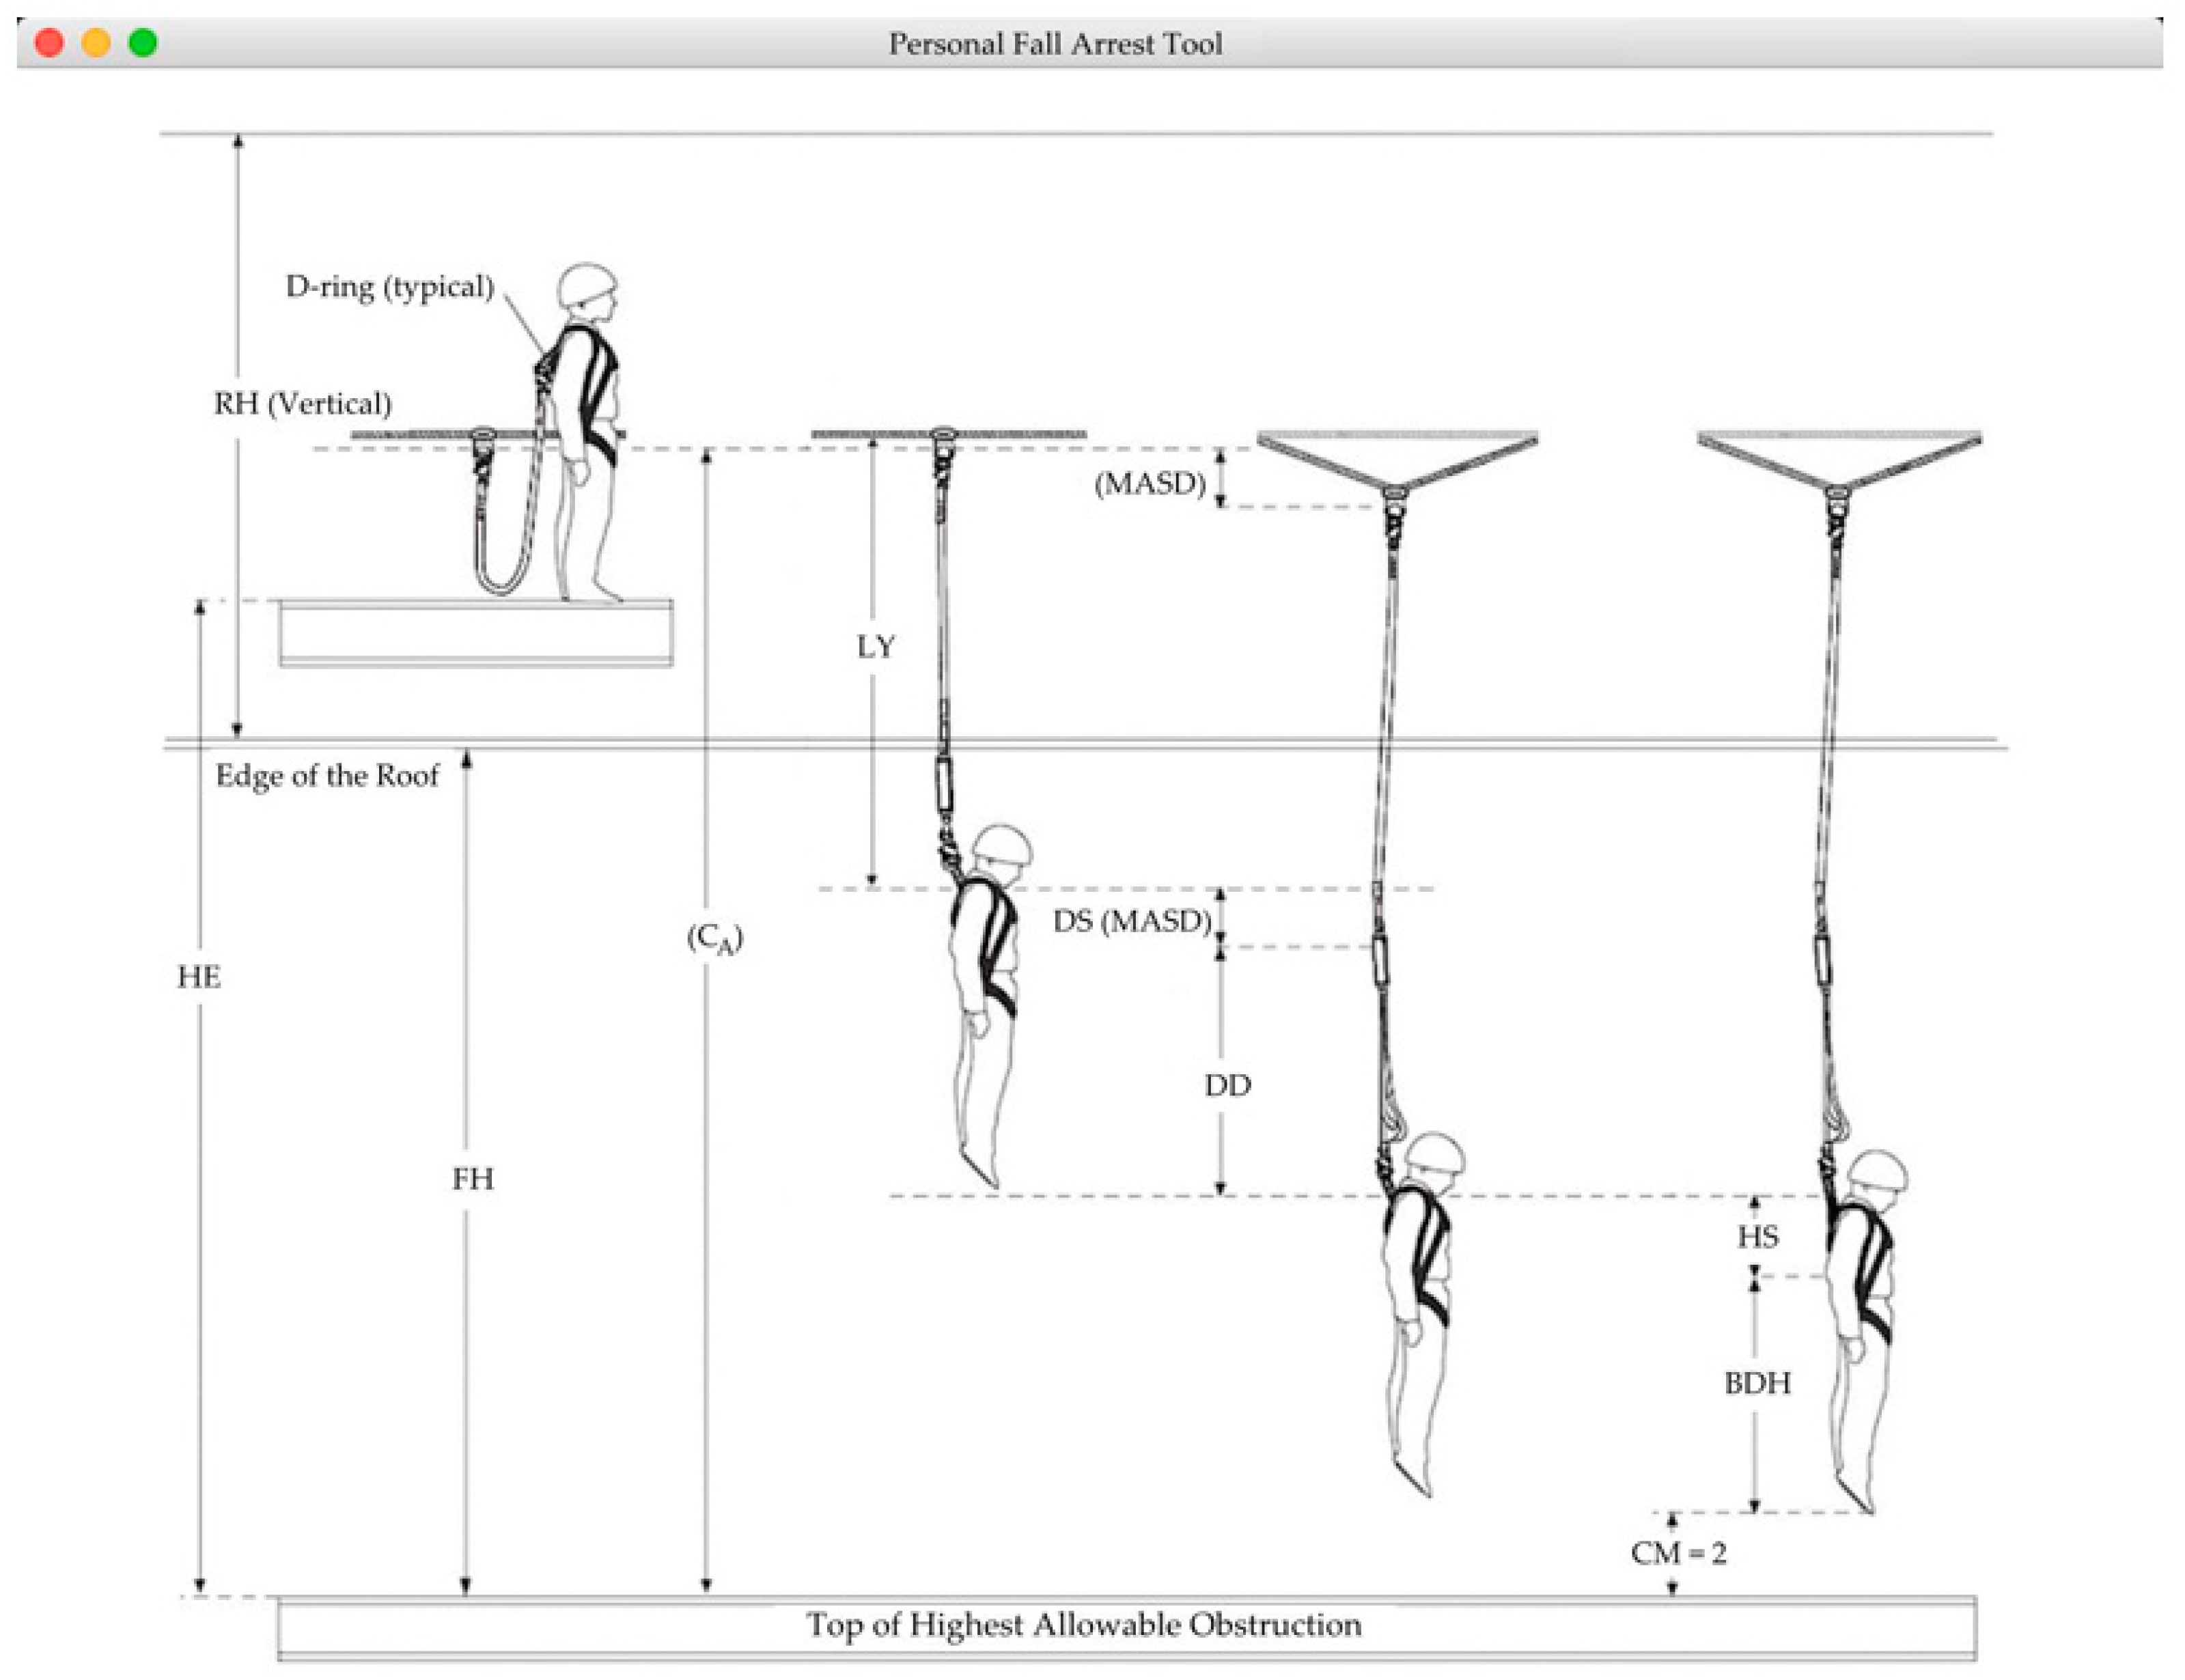
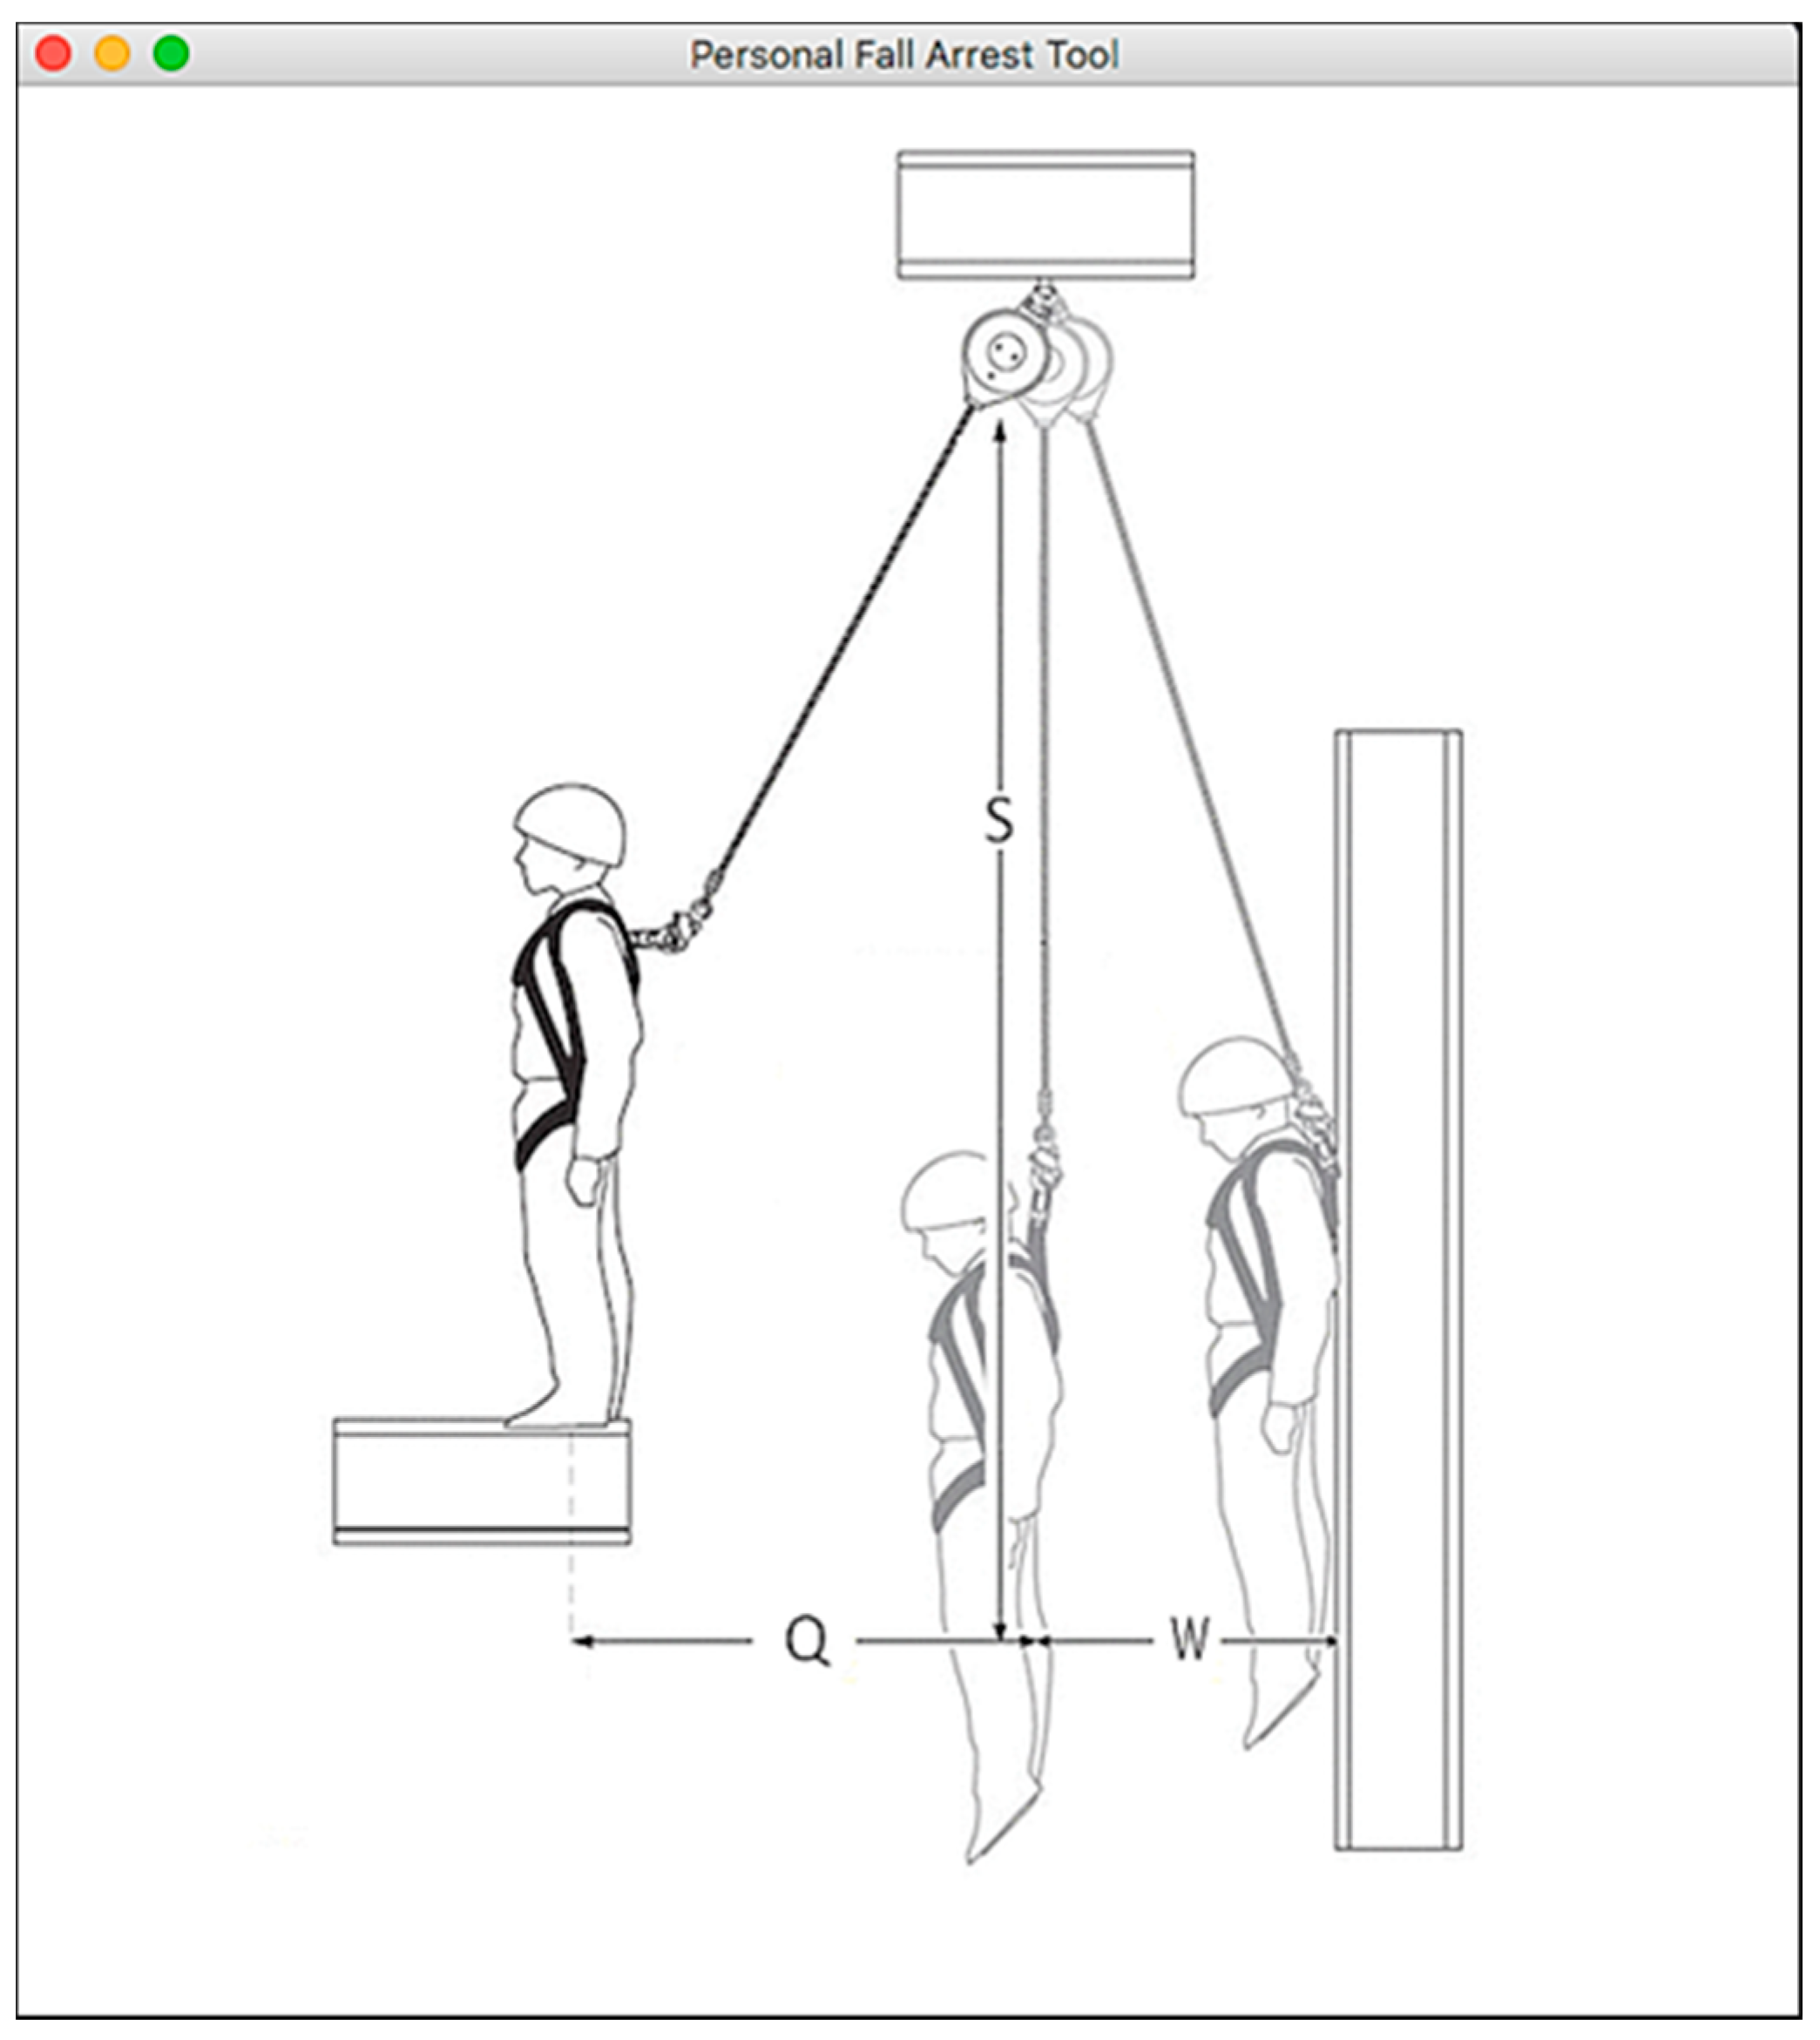
The purpose of the tool is to support the decision-making process; in other words, the early involvement of the competent person (i.e., safety manager) would be necessary. To help the competent person get a better understanding of the input parameters, two diagrams that present the parameters graphically were adapted from ANSI [14]. These diagrams were modified to meet the programming needs of the tool. The diagrams (see Figure 4 and Figure 5) are accessed by clicking on the fall clearance guide and swing hazard guide buttons in the main menu of the tool (see Figure 3).
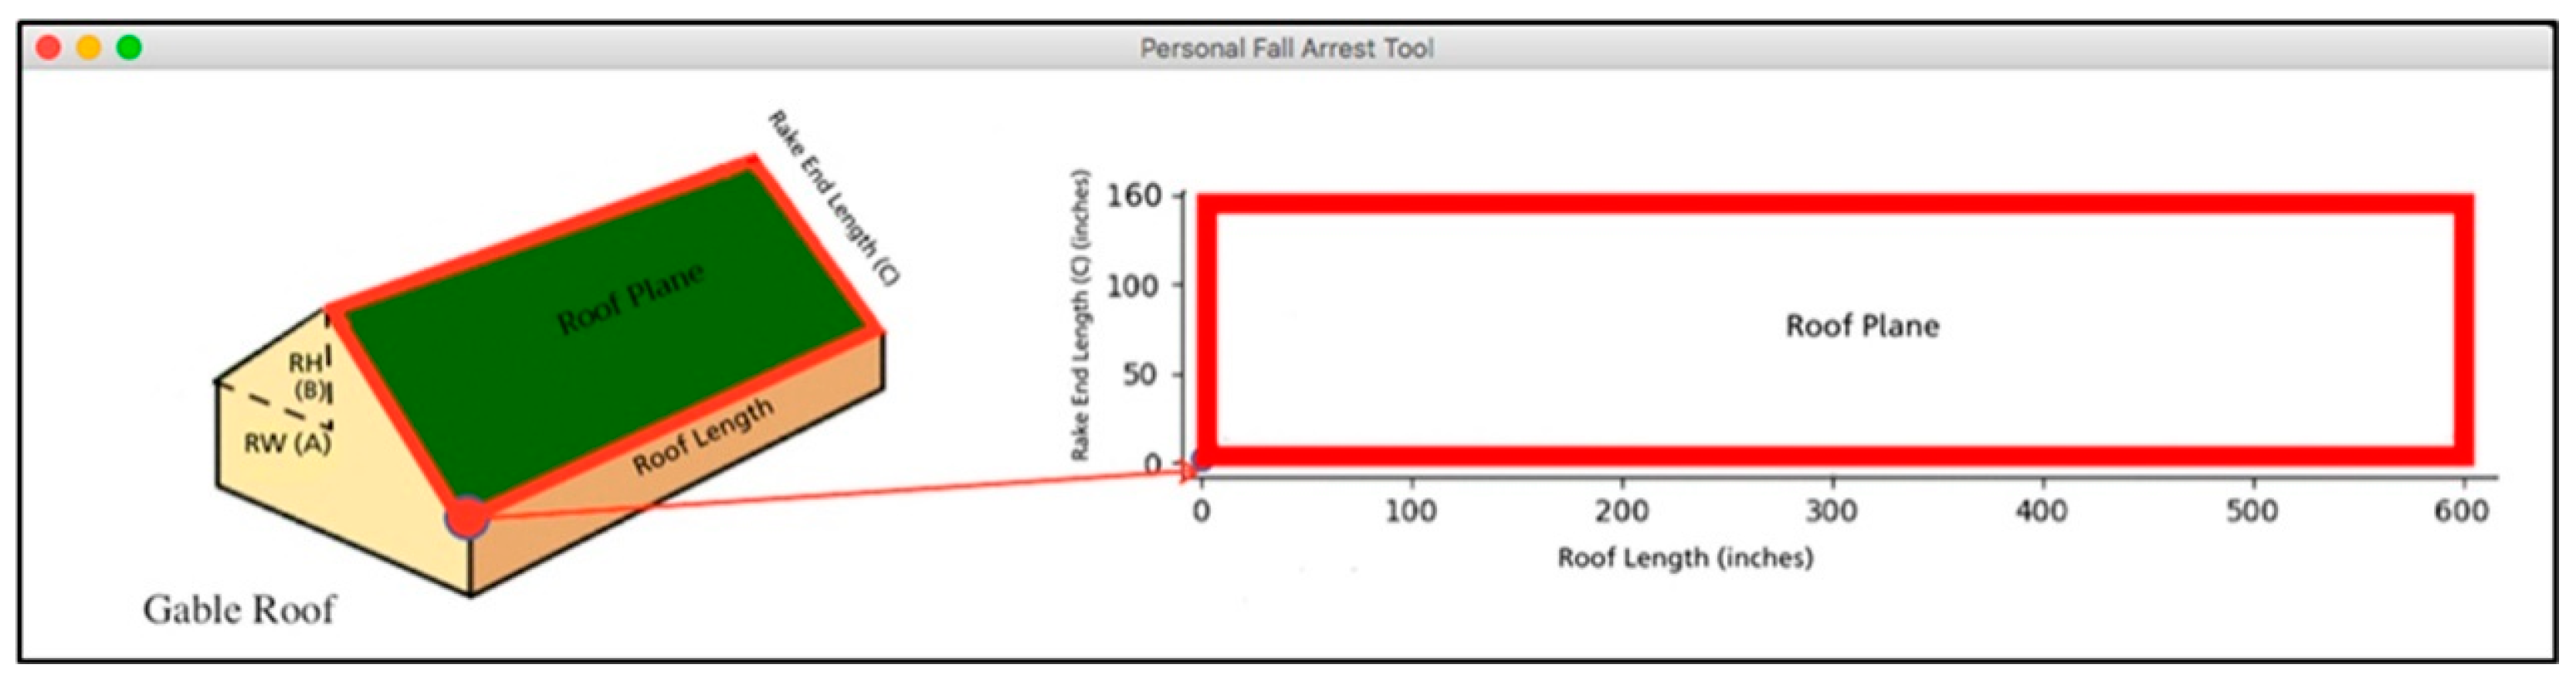
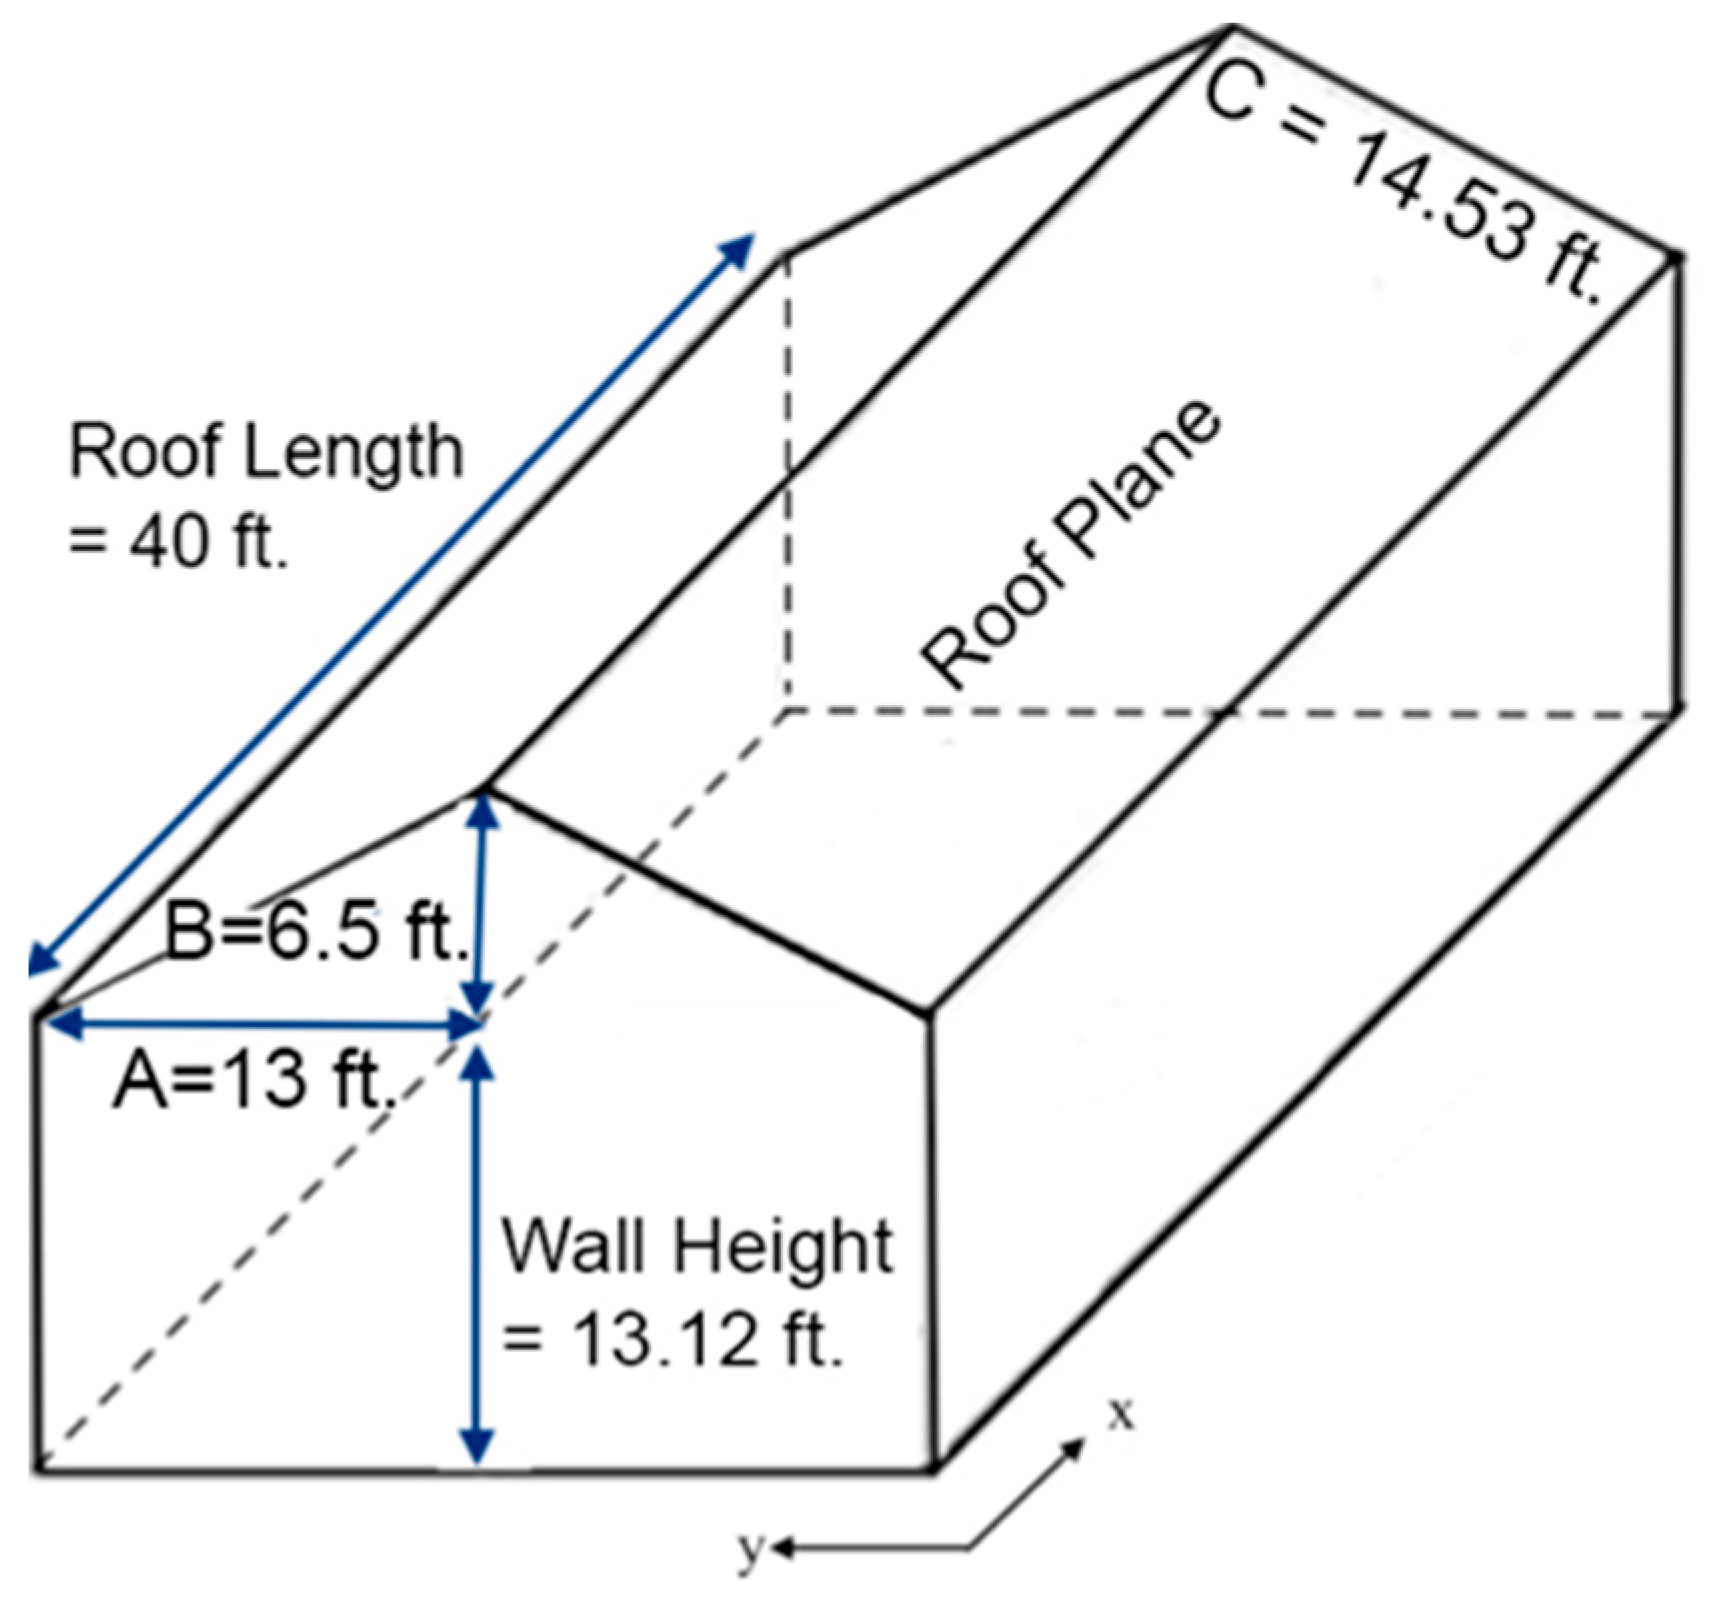
The third button on the main menu corresponds to the “Roof Geometry Guide” diagram that has a dual purpose (see Figure 6). The 3D picture on the left helps the tool user identify the input values for roof dimensions while the 2D view of the roof plane on the right helps the user interpret the graphical output of the tool. The formula A2 + B2 = C2 is used to determine the hypotenuse of a triangle and the following terms are used to equate this formula to using the “Roof Geometry Guide”. The roof width, one-half the distance of the building width, is referred to as the run or A. The rise is represented by B. The Hypotenuse or rake end length (used here) is represented by C. The rake end length (C) and the roof length (i.e., building length) define the area of the roof plane or working area where the potential anchor points will be placed as shown in Figure 8, the tool’s graphical output. The user can open the three guide windows simultaneously with the user input panel to refer to the parameter definitions for the input values.
The tool user (a competent person, safety manager) needs to click on the “START” button in the main menu and then input project-specific values in the input panel (see Figure 7). The input parameters include:
- Building dimensions (e.g., roof height B), distance between structural members (e.g., trusses or rafters) and suggested locations for the working platform as well as the potential location of the initial anchor point,
- PFAS specifications (e.g., lanyard length, harness stretch, etc.),
- Worker information (e.g., worker weight and height) and
- Location of physical barriers (e.g., a chimney).
The competent person can also select default values of the input parameters that are built in the tool in the case that these default values could be applied to a project. The default values are based on some of the commonly found jobsite conditions. The built-in default values included:
- Maximum number of PFAS users = one user (that is, only one worker can be attached to the anchor; this is the most common type of PFAS used on projects);
- Maximum arrest force (FCLR) = 1800 lbs.;
- Maximum arrest load = 5000 lbs.;
- Stretch-out of the harness = 1 ft.;
- Clearance margin (CM) = 2 ft.;
- Maximum deceleration distance = 3.5 ft.;
- D-ring shift (MASD) = 1 ft.;
- D-ring height (HI) = 5 ft. for 6 ft. tall workers;
- XZ = straightening of the worker (ft.) + harness stretch (XW) (ft.) = 1 ft.;
- Maximum deployment of shock absorber = 42 inches;
- Self-retracting device; fall arrest force:
- o
- Class A: 1350 lbs.
- o
- Class B: 900 lbs.
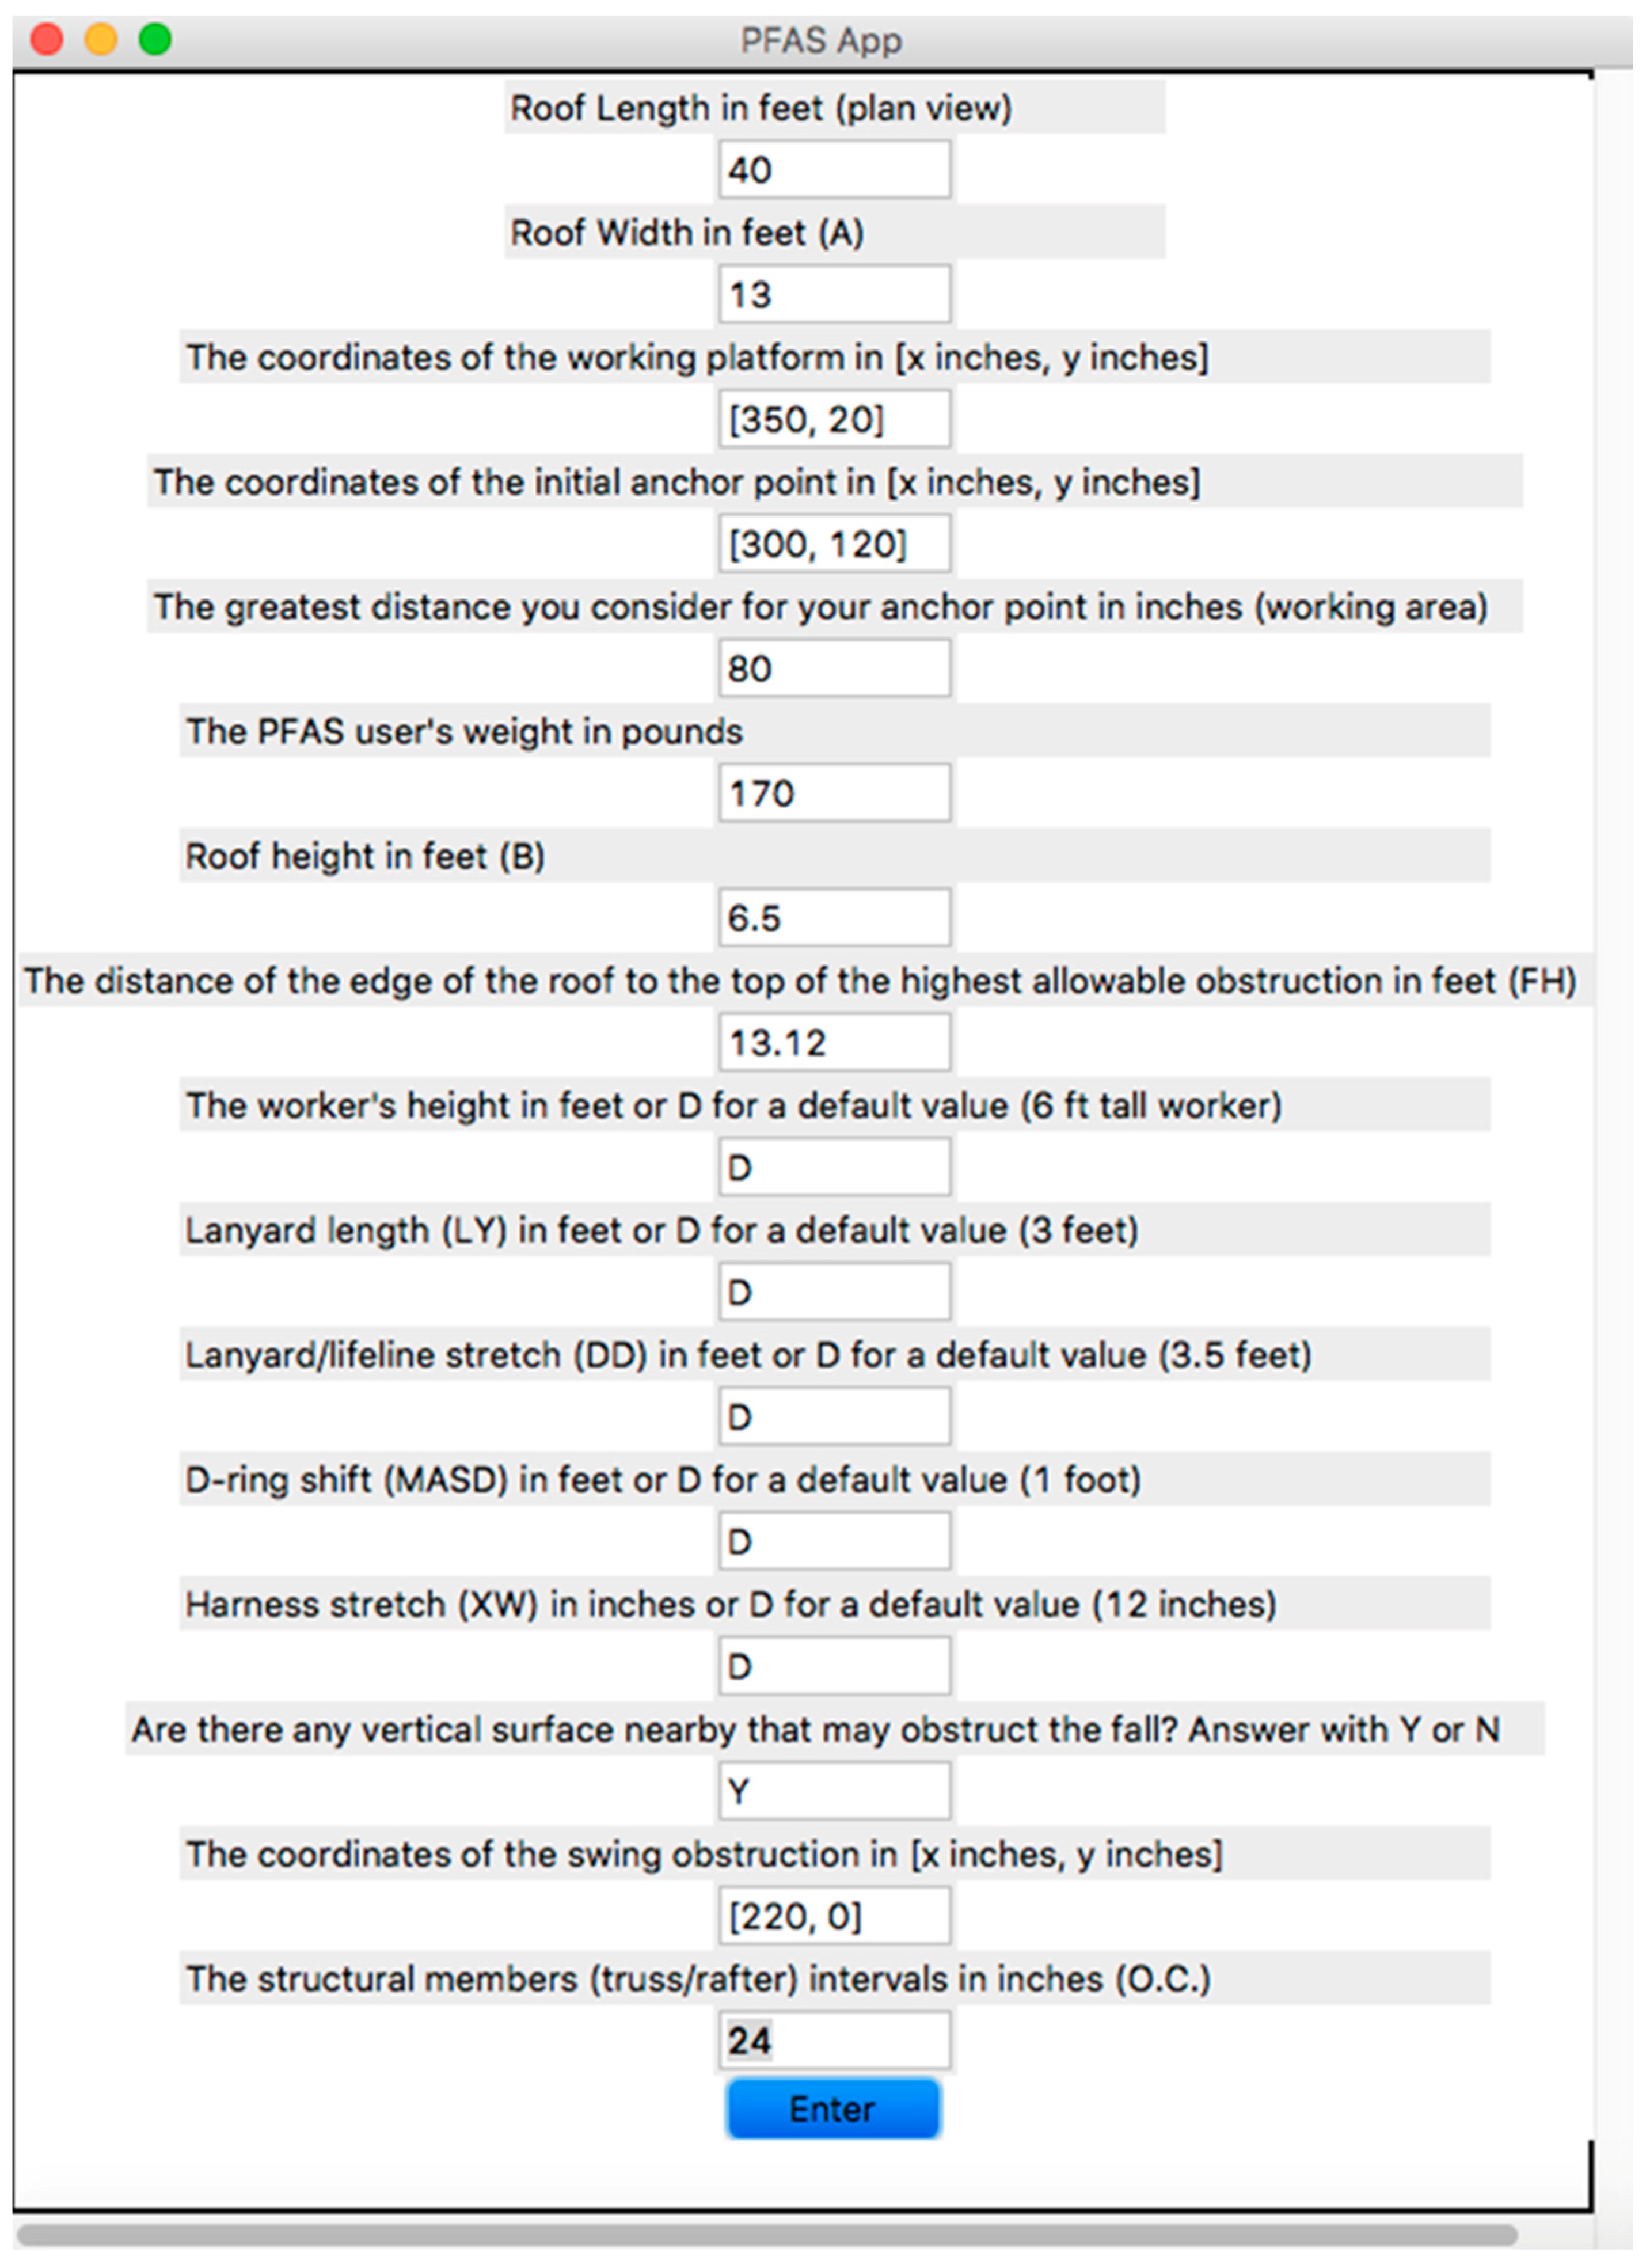
As shown in Figure 7, the user input panel consists of 16 project-specific values that the tool user will need to input in order to proceed with the optimization of anchor points. The worker weight input is the prerequisite to run the tool; if the worker weight is outside of the allowed range of weights defined by OSHA (i.e., 130 to 310 lbs.), the tool will not proceed with the calculations of anchor points. If the worker weight is within allowed range, the tool user will be able to initiate the optimization process. Regarding the working area input, the tool user enters the location of the working platform as an initial location, knowing that the working platform is a dynamic parameter that changes as the worker moves the anchor in relation to the working area. OSHA defines working platform as a walking-working surface that is elevated above the surrounding area [47]. The working area is defined as the area of a circle with a radius of the lanyard length, centered at the initial anchor point. An initial location of the potential anchor point and the working platform are needed to calculate the lanyard stretch value for the optimization process. The largest distance from the anchor point (working area) is determined by the lanyard length. The user should enter the greatest distance from the initial anchor point that workers can work on without negatively affecting the worker’s productivity. The user input panel also requires the distance between trusses or stick-built roof components. In this example, the standard U.S. spacing units are 12” on center (o.c.), 16” o.c. or 24” o.c.
The tool evaluates the values entered in the user input panel by checking if the input values exceed the minimum and maximum values. Next, the tool runs the optimization process. After the optimization is carried out, the tool provides the following output results to the user:
- The anchor points within the PFAS user’s working area that satisfy fall clearance and swing hazard requirements.
- The type of deceleration device that should be used (e.g., self-retracting lanyard, shock absorber, etc.).
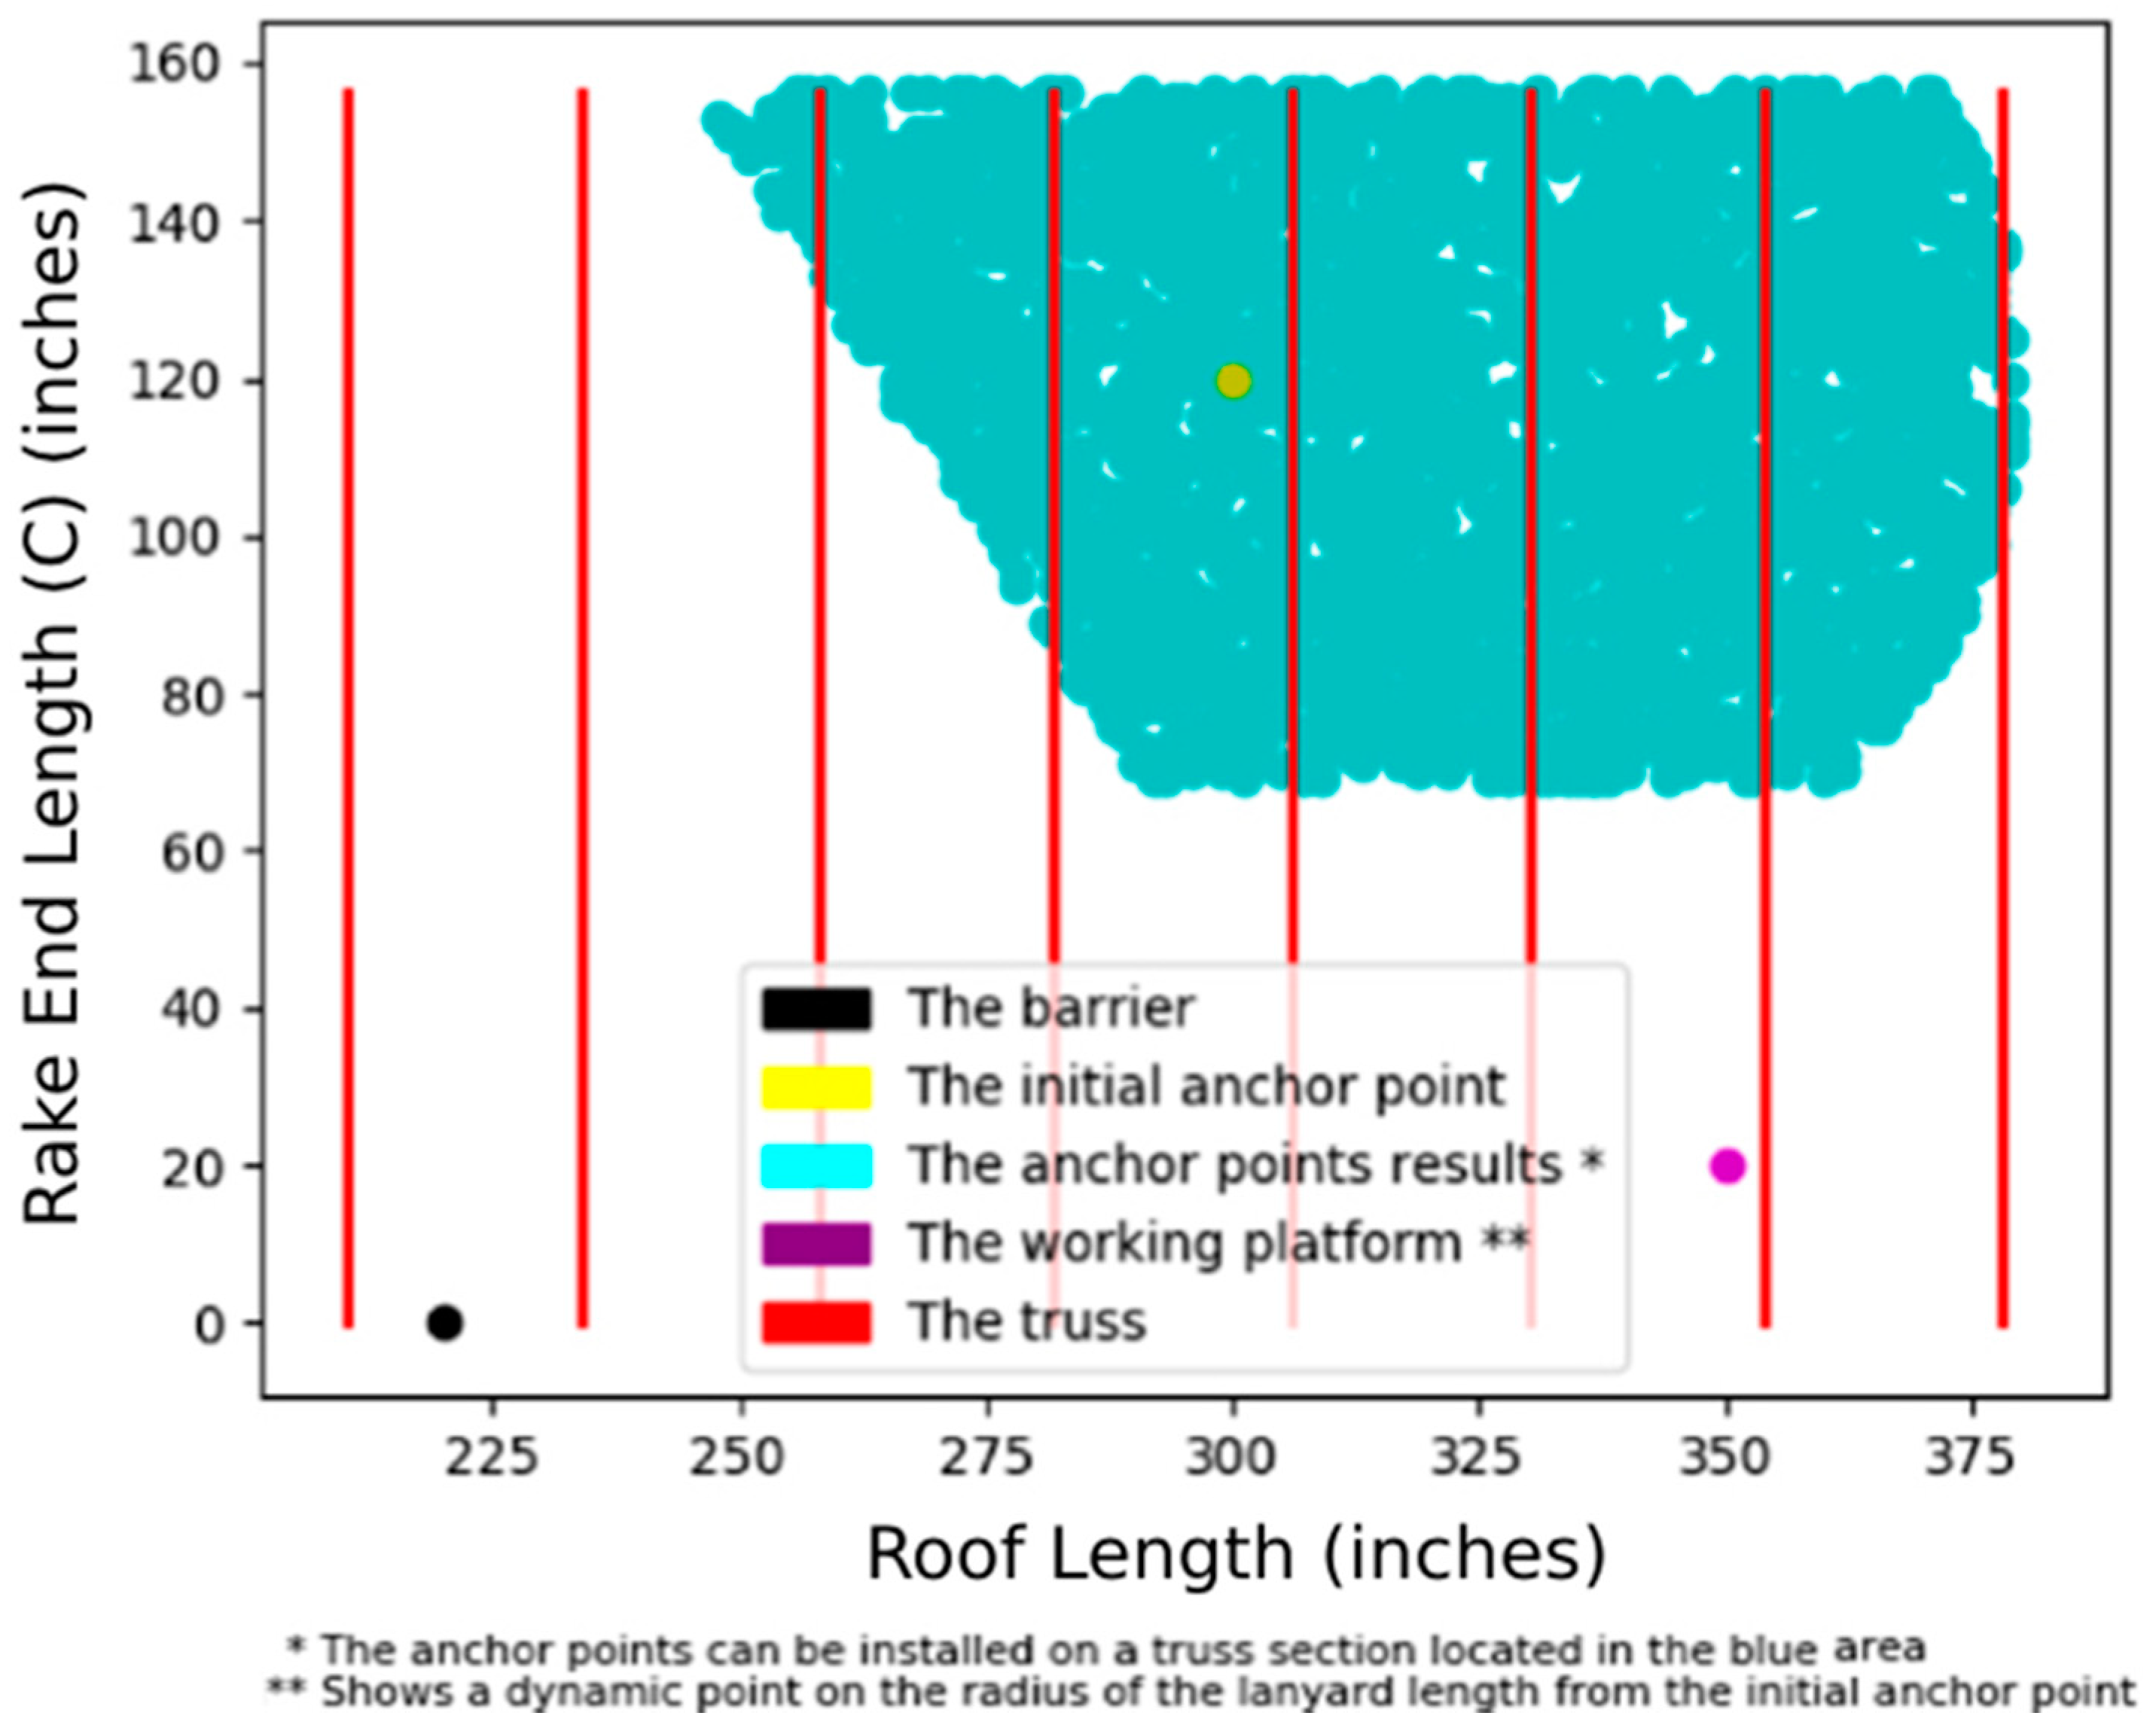
The potential anchor point locations are graphically displayed on a coordinate plane plotted in Matplotlib Python module (see Figure 8). The blue area in Figure 8 represents the potential optimal locations of anchor points but the anchors can be installed only on structurally sound points within this area. All the structural members that could be used for anchors should be determined by the structural engineer prior to running the tool. In this study the structural points are the top chord of a truss system and shown by red lines. The initial anchor point represented by the yellow dot in Figure 8 is the tool user’s starting place to look for structurally sound anchor points in the blue highlighted area with the closest proximity to the yellow dot.
In addition to the graphical output, the numerical output of the optimal anchor point coordinates is automatically inserted in the text pad in the main menu (see Figure 9, Result 3). The tool notifies the user via the same text pad what type of the deceleration (i.e., connecting) device shall be used (see Figure 9, Result 2).
With the use of the tool the qualified person (that is, structural engineer or PE) does not need to be present on the jobsite all the time. Before running the tool, the qualified person gives primary instructions to the competent person (e.g., safety manager) about the structural members that have sufficient strength to be selected for the anchor points; in this study they are represented by red lines indicating a top truss chord within the blue anchor point area (Figure 8). For the rest of the job duration, the competent person can run the tool multiple times as needed as the work progresses and the locations of any barriers change or as new barriers appear. The tool output for all iterations should be evaluated by competent person (e.g., safety manager, foreman, project manager, superintendent) on the jobsite to make sure the anchor points are located on the approved structural members. This iterative process minimizes the need for the presence of the qualified person (i.e., structural engineer or PE) on the jobsite for PFAS design for the whole project duration.
4.5. Testing the Optimization Algorithm and the Tool for PFAS Anchor Positioning
In phase three of the research, the algorithm and the tool were tested for 20 different scenarios to verify the algorithm and tool development and to test if the tool runs smoothly. The 20 scenarios came from changing the 16 user input values (e.g., roof dimensions, working platform location, worker information, PFAS specifications, potential locations of barriers leading to swing hazard) shown in Figure 7. The 20 scenarios were run using the tool and checked by a manual calculation. These two sets of the output results were compared to verify the tool results against the human (manually) calculated results for the same scenarios. As an illustration of the automated process for anchor positioning, the authors present here a scenario of PFAS anchor point optimization using a single slope simple gable roof as an example. In this scenario, a six-foot tall worker is working on a 6.5-foot-high gable roof and the worker’s height from the edge of the roof to the working platform equals one foot. The height of the edge of the roof to the top of the highest allowable obstruction (i.e., ground level) is 13.12 feet (see Figure 10). The worker’s D-ring is below the anchor location. The roof dimensions are 26 feet by 40 feet and the worker’s weight is 170 pounds.
Based on the input values in this scenario, the required clearance below the anchorage (CA) was calculated manually by the authors using Equation (1) that was adopted from ANSI [14].
where:
CA = LY + DD + MASD + HI +XW + CM
- CA = Required clearance below the anchorage (ft.)
- LY = Lanyard length (Default Value (DV) = 3 ft.)
- DD = Lanyard/lifeline stretch (DV = 3.5 ft.)
- MASD = D-ring shift (DV = 1 ft.)
- HI = Back D-ring height (DV = 5 ft.)
- XW = Harness stretch (DV = 1 ft.)
- CM = Clearance margin (DV = 2 ft.).
Using the input values and Equation (1) the required clearance below the anchorage (CA) value was found to be 15.5 ft. in this scenario.
CA = 3 + 3.5 + 1 + 5 + 1 + 2 = 15.5 ft.
Since the required clearance below the anchorage (CA) of 15.5 ft. is smaller than the 18.5 ft. required by the standards, a self-retracting lanyard shall be used as the deceleration device. Based on the input values in this roof scenario, the free fall distance (FF) was calculated manually using Equation (2) which was adopted from ANSI [14].
where:
FF = FFA + HDA + LY
- FF = Free fall distance (ft.)
- FFA = Free fall due to the activation distance of the fall arrester (to lock onto the vertical lifeline) (ft.)
- HDA = Vertical distance from the D-ring to where the lanyard connects to the anchorage connector (HDA is negative if the D-ring is initially below the fall arrestor) (ft.)
- LY = Lanyard length (DV = 3 ft.)
- FF = − (6 − 6.5) + 3 = 3.5 ft.
Since the free fall distance (FF) of 3.5 ft. is smaller than 4 ft. recommended by the ANSI standard, the free fall distance complies with ANSI standards. In the addition to the free fall distance, the harness stretch distance and the swing drop distance must also be less than 4 ft. to avoid any swing hazards.
In addition to the manual calculations, the computer tool developed by this research was utilized to evaluate the PFAS design for this scenario. Out of 15,663 anchor points that initially entered the optimization process, 2481 anchor points were the results of the optimization. The tool output included the following three results:
The blue area in Figure 8 demonstrates the 2481 potential anchor points over the entire working area defined by the tool user in addition to the blue points over the red colored approved structural members where the anchors should be installed. In other words, the locations of the roof trusses are shown as red lines to help the tool user select the acceptable anchor points on the trusses as they are considered structural components of the roof. Without additional engineering and blocking, the points between the trusses represent the roof sheathing and may lack the structural strength required for anchor point (i.e., 5000 lbs.). The competent person (e.g., safety manager) can choose anchor points from the tool output as long as work is being done in the zone that was determined as the working area in the user input panel. The two footnotes (e.g., *, **) below the roof plane drawing in Figure 8 help the tool user to better interpret the output results of the tool.
In addition, due to the existence of a physical barrier (e.g., a chimney), the boundaries of the acceptable anchor point zone are presented as part of the results to make sure the tool user is aware of the swing hazard risk. The results of this scenario indicated that any point below the Rake End Length (C) of 63 inches will result in a swing hazard by the barrier identified as point with coordinates [x = 220 inches, y = 0]. The results of this roof scenario obtained by the tool were compared to the manual calculations completed by the authors. There was no difference between the tool results and the manually calculated results, which showed that the tool provided correct results for this scenario. In addition, the tool provided output results in about 30 min, while the same calculations preformed manually would take five business days. The reason for time-consuming manual calculations is a typical 5-day long communication among the project stakeholders, which could be eliminated with the use of the tool.
4.6. Validation of the Algorithm for Optimizing PFAS Anchor Positioning
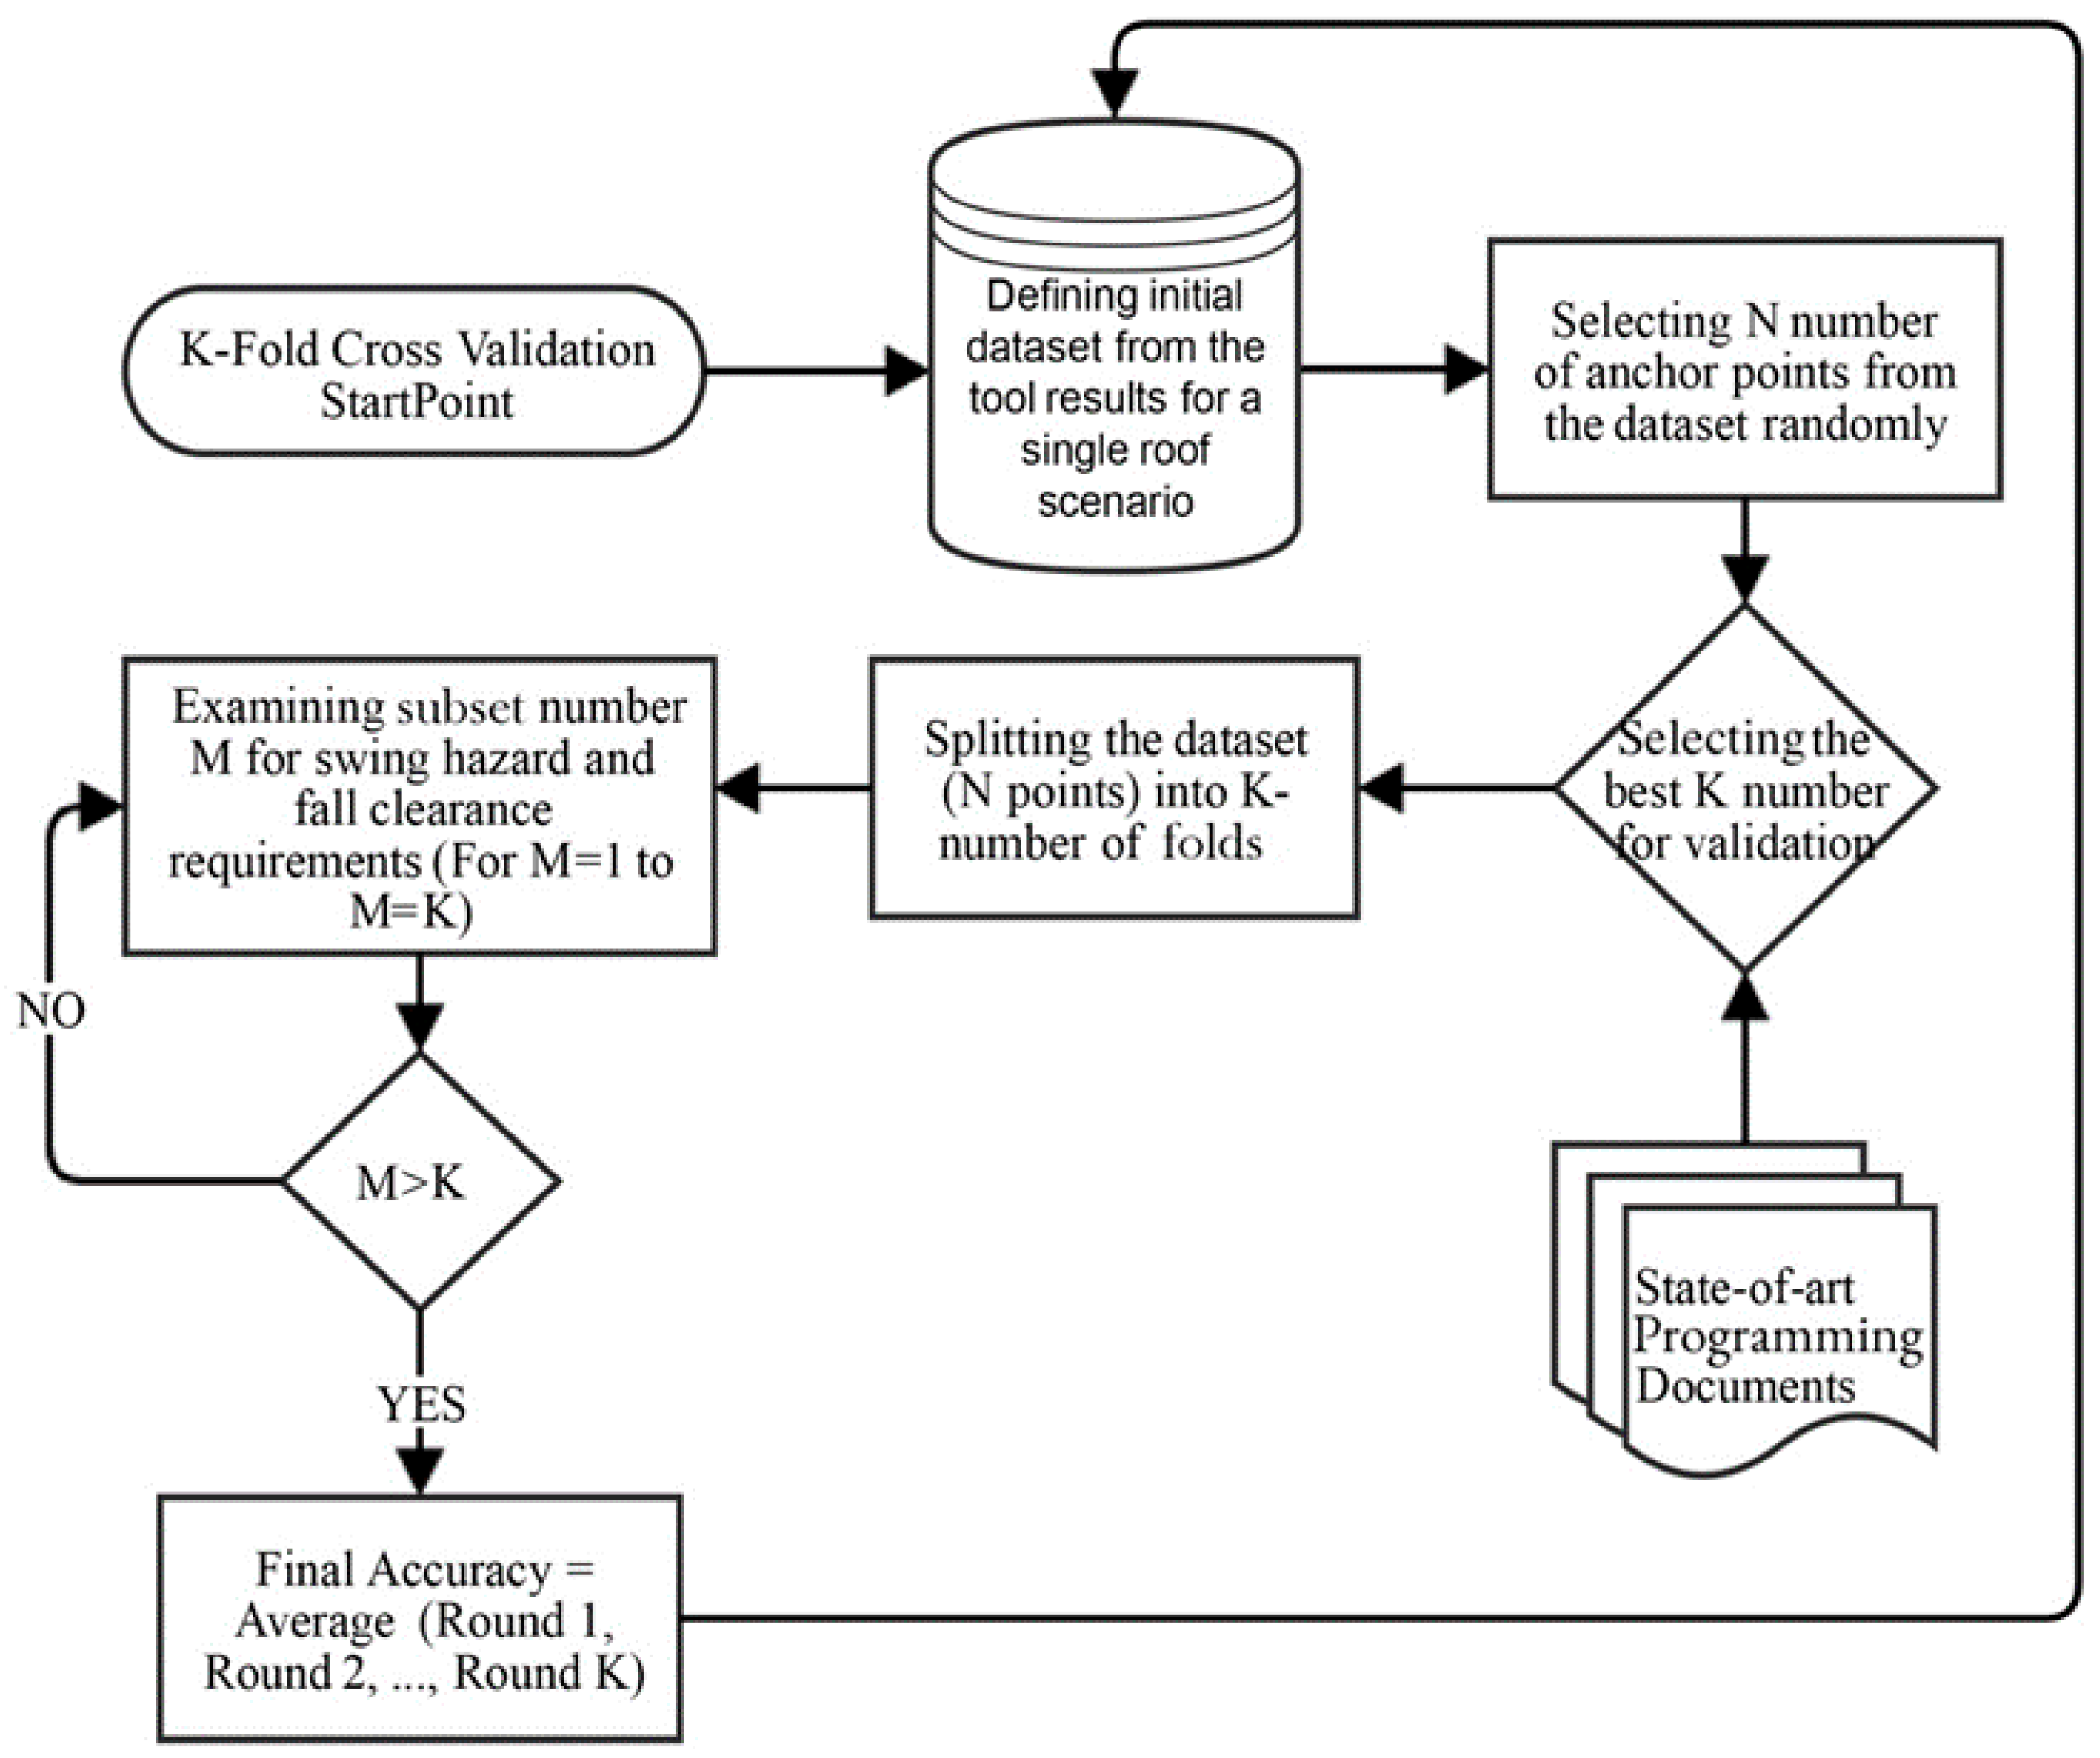
In phase four of the research, the algorithm for optimizing PFAS anchor locations was validated. The validation of the accuracy and consistency of the algorithm output results was necessary to evaluate the programming of the optimization algorithm. In this research, the accuracy refers to the number of output results that satisfied fall clearance and swing hazard requirements. Based on Hu et al.’s [48] definition of consistency as an insignificant difference between the reference and simulation data, in this research consistency refers to frequency of getting the same results for the same input in several iterations of running the tool. In order to select the validation method appropriate for this research, the authors explored several methods for validating the results of a KNNS optimization algorithm. Some of these methods include Likelihood-ratio Test and K-fold Cross-Validation [49]. The Likelihood-ratio Test is a statistical test for computing p-value based on the goodness of fit test for an alternative model against a null model [50]. This method has an advantage of validating the statistical optimizations; however, this validation model is not a good fit for the geometrical optimizations used in this research. In addition, the Likelihood-ratio Test could be altered to meet the needs of the algorithm validation. To validate the accuracy of the optimization algorithm developed by this research, the authors selected the K-fold Cross-Validation, which is used to estimate the skill of a model for a given problem. The K-fold Cross-Validation is used in settings where the goal is a prediction, and one wants to estimate how accurately a predictive model will perform in practice. This method is simple to understand and implement and it uses a resampling procedure to evaluate the results in a limited data sample [51]. In this research, the original K-fold Cross-Validation method was slightly modified to meet the needs of the optimization algorithm developed for this tool. Utilization of the modified K-fold Cross-Validation process consisted of several steps (see Figure 11).
- In the first step, an initial dataset for the validation was defined by running the algorithm for the roof scenario presented in the paper sub-Section 4.5. This dataset included 2481 anchor points that were the simulation output results for this roof scenario.
- In the next step, 200 anchor points (n = 200) were randomly selected from the initial dataset of 2481 anchor points. The selection of the number n was based on the logical ratio between K and n where K is defined as number of folds.
- The number of folds K was then selected based on the literature review. Several previous K-fold Cross-validation studies were investigated to make a decision about the number of folds K, for example, see Python for Engineers [52]. Since the value of K should statistically represent the initial dataset, experimentation showed that five number of folds (K = 5) generally create proper results [53].
- In the next step, the dataset containing 200 anchor points (n = 200) was partitioned into five equal subsets (K = 5). Each subset had, therefore, 40 points and each subset (called a fold) was named as f1, f2, …, fK (i.e., S1, S2, S3, S4, and S5).
- At this stage, five rounds of validation were carried out (see Figure 12). The number of rounds was selected based on the number of folds, that is, in this research the number of folds and the number of rounds were the same (i.e., five). In each round, for M = 1 to M = K (where M = number of loop in programming language), the fold fM was used as the validation set and the remaining four folds (i.e., K-1 folds) were used as a training set. In this research, training the optimization algorithm means developing the results of the validation subset based on the results of the training subsets. For example, in Round 1, the subset S1 was used as the validation subset, and the subsets S2-S5 were used as the training sets. In summary, the optimization algorithm was trained using four folds as the training subsets, after which the validation subset was evaluated. This was all done through a loop of examining fall clearance and swing hazard for five subsets of anchor points (where M = number of subset; values of M = 1 to M = K) in each of five rounds with subset content varying in each round. This validation method required developing a rule-checking Python script for each anchor point entry and was done through loops of rule-checking statements. Each of the criteria in the rule-checking (i.e., type of deceleration device, fall clearance, and swing hazard verification) was given a numerical weight (which is internally selected by the validation code) and the automated validation code calculated the accuracy ratios for each of the five subsets based on these weighted criteria.
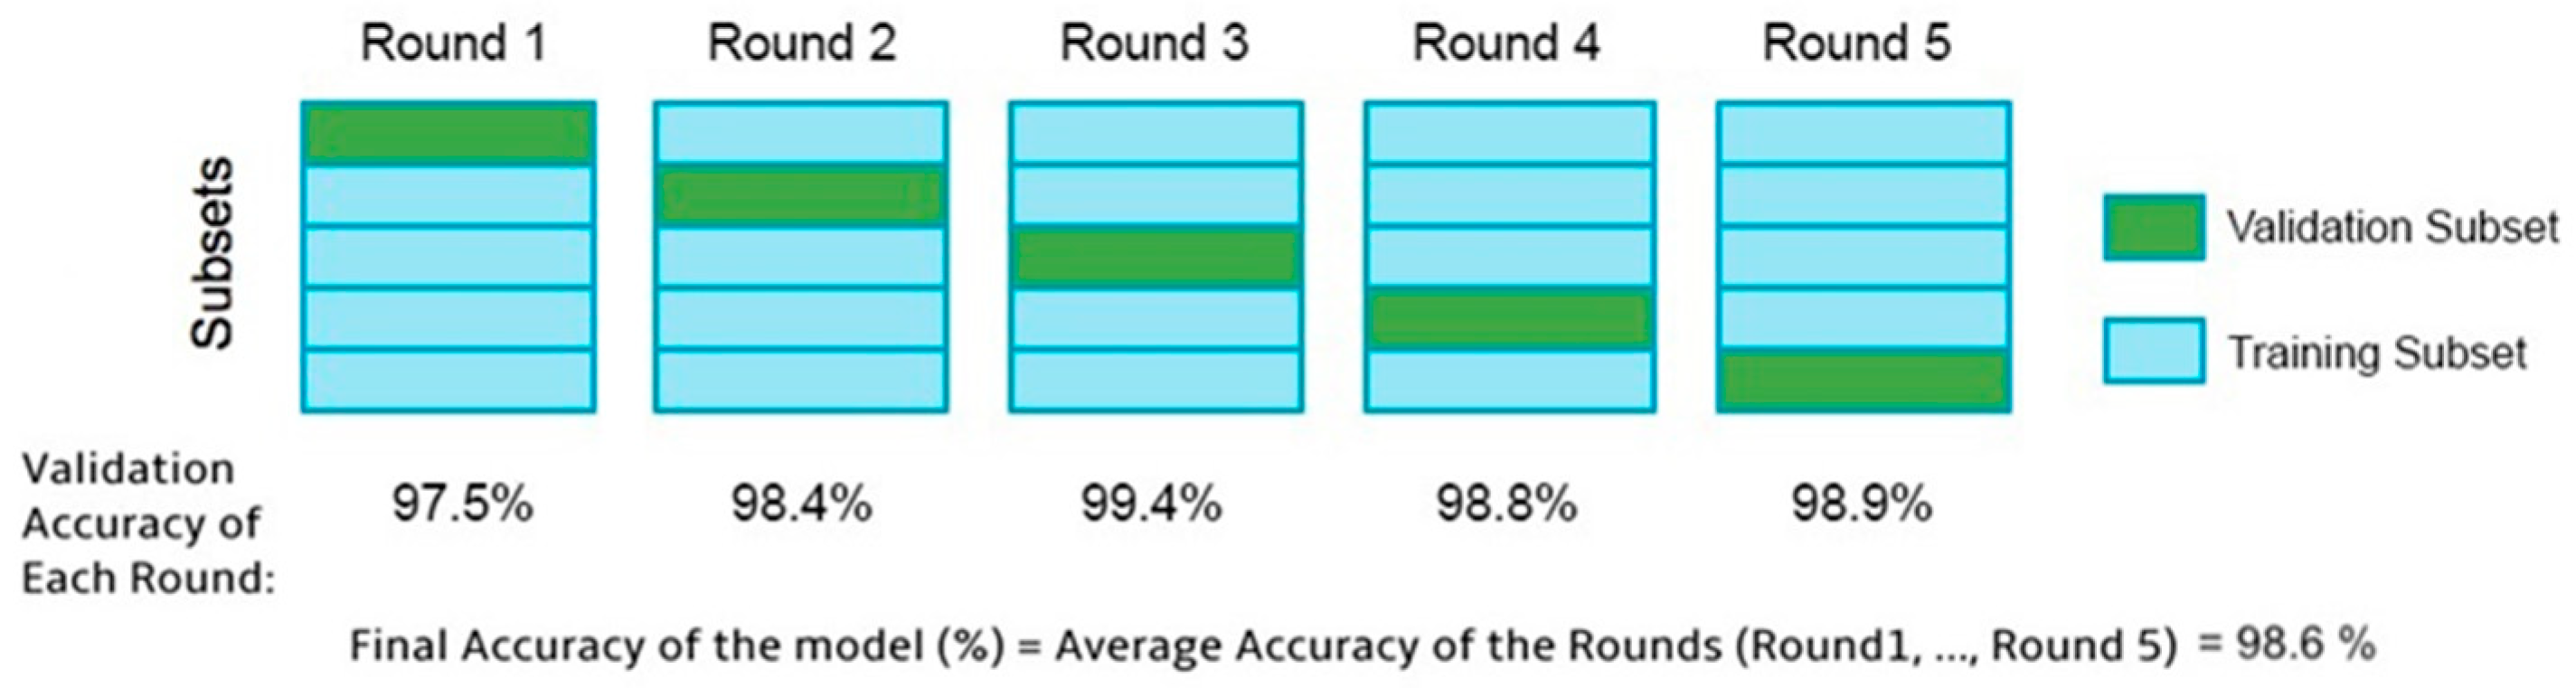
- Using the training and validation subsets in each round, the optimization of points was completed, and the accuracy of the algorithm was calculated by comparing the training results with the validation set. The accuracy percentage of the anchor points in one subset was calculated as a ratio of correct anchor points to all anchor points in a subset. The accuracy percentage of each round was then calculated by averaging accuracies of all five subsets in that specific round. For example, in Round 1, validation accuracy was 97.5%, which means that 97.5% of the anchor point results satisfied both fall clearance and swing hazard requirements. Therefore, 97.5% comes from all five subset accuracy percentages in Round 1.
- The final accuracy of the optimization algorithm was then calculated by averaging the accuracies of the five rounds of K-fold Cross Validation (see Figure 12). The results showed that 98.6% of the output results (that is, anchor points) satisfied all the fall clearance and swing hazard requirements and that there was a 1.4% error pertaining to the results that did not satisfy the swing hazard requirement. In other words, three out of 200 anchor points or 1.4% of points had some error pertaining to the swing hazard calculations. We expect that the error happened due to the complexity of swing hazard situations. For this reason, the algorithm might have incorrectly assumed the direction in which swing would happen in these three cases.
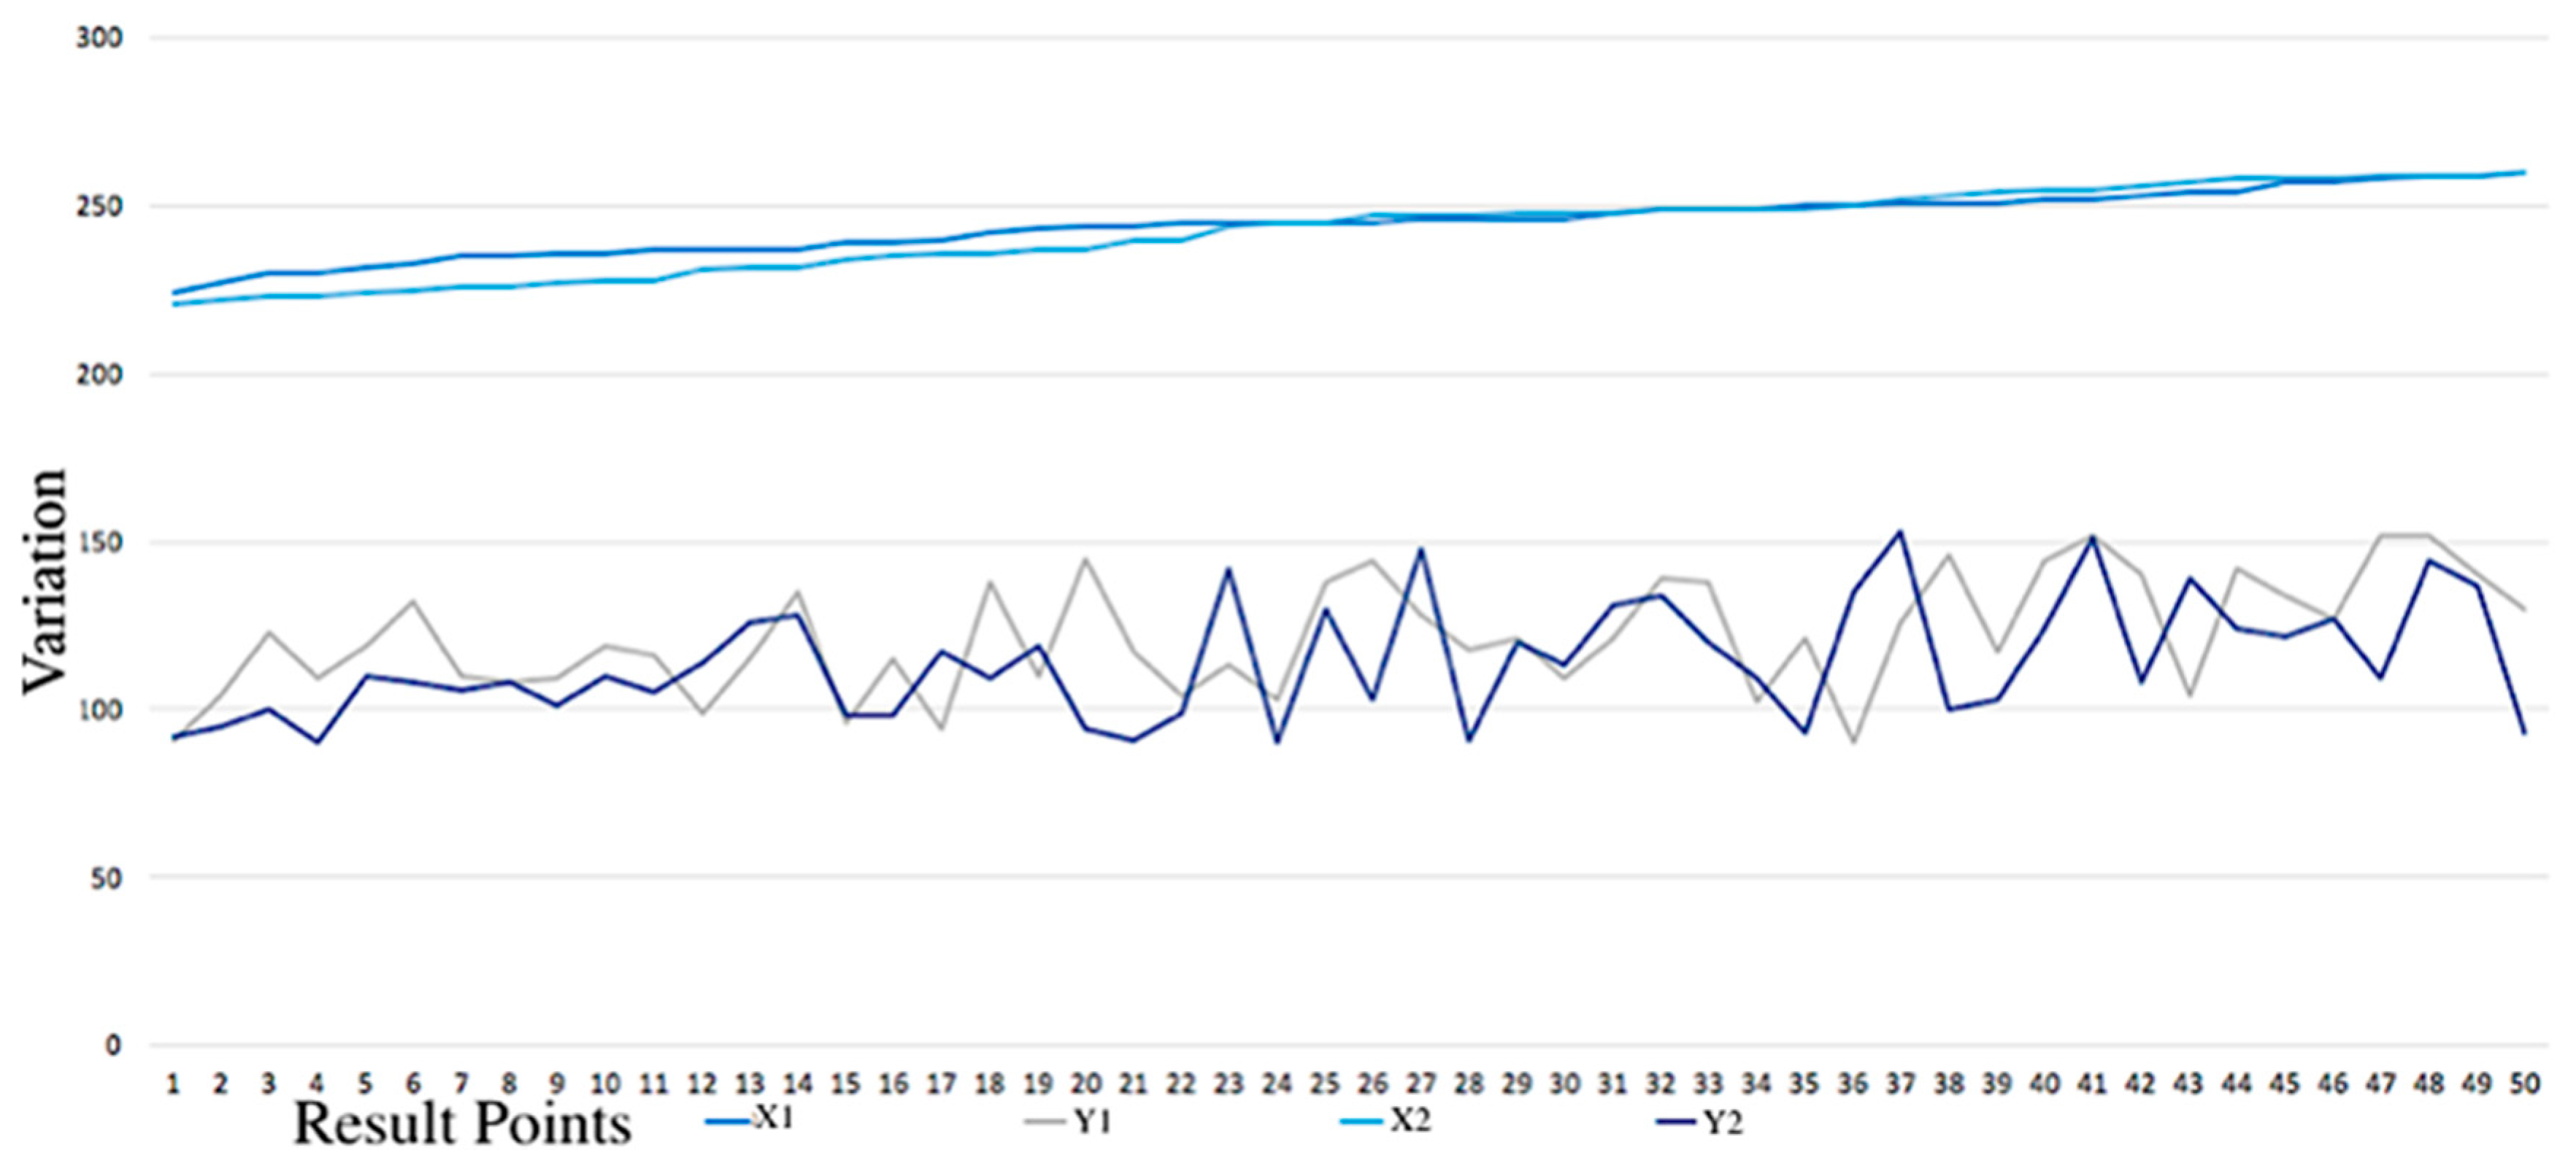
In the next step, to examine the consistency of results, the variation between the two groups of output results for the single roof scenario presented in the paper sub-Section 4.5 was tested (Figure 13). We used a 40 foot by 13 foot roof plane and defined a set of 15,663 potential anchor points. From this set, 1000 anchor points (n = 1000) were randomly selected as the sample population. The number of iterations (M) was set at two. Each iteration considered all 1000 points for fall clearance and swing hazard rule compliance. There were 238 anchor points in each group of output results for the same roof scenario.
Two anchor points from these two different groups of results were compared against each other and the variation in their X and Y coordinates is shown in Figure 13. The same process was repeated for each pair of closest anchor points in the results dataset. The average variation in the coordinates of the similar anchor points was equal to 0.13%. This showed that the results differed for 0.13% anchor points each time the tool was run for the same input for a single roof scenario. Considering that the optimization algorithm in this research was based on the selection of the best fit of the data in the random dataset of anchor points, the 0.13% variation in the results for each run is considered a negligible variance and, therefore, the results are considered consistent.
5. Conclusions
A fall from height is a major cause of construction fatalities over the last decade. Even though personal fall arrest system (PFAS) is an effective means of protecting the worker’s life in the case of a fall, a PFAS is either not used or misused by improper selection of anchor points [11]. To address this problem, this proof-of-concept research developed and validated an algorithm and a tool for optimizing the location of PFAS anchors on steep-sloped roofs based on fall clearance and swing hazard requirements. The K-nearest neighbors (KNNS) algorithm was used as a basis for the development of the optimization algorithm, while the Python programming language was utilized to implement the algorithm into a standalone computer tool. The optimization algorithm and the computer tool were validated using the K-fold Cross validation which indicated that the tool output results were accurate and consistent.
The contribution of this proof-of-concept research is the development of the optimization algorithm and a tool that can help a competent person (e.g., safety manager) to select the safest anchor points on a steep-sloped roof using a single slope simple gable roof example. Future research could test if the tool worked equally well on a complex multi-sloped roof by breaking the roof into single planes or plane areas determined by the PFAS constraints. The tool helps eliminate human errors related to PFAS design and the anchor point calculations related to fall clearance and swing hazards. As a result, the tool can help roofing contractors comply with any regulatory jurisdiction fall protection regulations. This would help ensure that the worker’s life can be fully trusted to the PFAS with fewer technical team members (e.g., structural engineer/PE, project manager) needed. The target users of this this type of tool are small-sized companies (i.e., residential, roofing trades, small commercial, etc.) because they are statistically in the most danger of falling from height due to lack of proper safety equipment. Small companies may lack the economic resources needed to employ a qualified person (e.g., structural engineer/PE) as a full-time staff member. Thus, they can take advantage of this type of tool by hiring a qualified person to partially design the PFAS from the structural strength standpoint and then the in-house competent person could use the tool for calculations of fall clearance and swing hazard as the work progresses.
To make this tool available for more complex roof systems, more research must be performed. This could be in the form of a product development team for commercial purposes. The importance of this proof-of-concept work is the outlining of the processes, issues, and logic needed to make a tool of this type work for a simple roof design. The development team will conduct the actual field testing.
6. Research Limitations, Delimitations and Future Research
This research had the following limitations:
- The KNNS optimization algorithm was at first intended to start the optimization with 10 iterations of 8000 population data sets, but due to the capacity limitations of the CPU and memory, the optimization happened at two iterations of 8000 population data sets.
- The goal was to create a user-friendly tool. A highly graphical user interface was partly achieved with the use of TkInter and Matplotlib modules but most of the Python modules used were unable to depict the calculations in a graphical way. Therefore, the problem remained partially unsolved.
This research was delimited by:
- Only the basic PFAS type was examined, that is, PFAS for a single worker weighing between 130 and 310 pounds equipped with a deceleration device, a full body harness, a lanyard and one rigid anchor point. Other PFAS types (e.g., horizontal lifeline with multiple users PFAS) were not investigated;
- The study focused only on falls of construction workers. Other fall-related hazards such as struck-by falling objects were out of scope of this research;
- Only a simple roof geometry such as a single slope gable roof was considered in this study in order to demonstrate the development of the optimization algorithm and a tool, APP in this case, which are beneficial to the safety of construction workers. In other words, the gable roof was used as an example to demonstrate the methodology and the tool development. Thus, the results of this study may not be applicable to other roof geometries unless they are broken into individual component slope areas representing the single slope portion of a gable roof used in this study;
- Only a single physical barrier as an example of swing hazard was used for the tool development and to proof the concept of this research;
- The structural calculations were not included in the optimization model because the U.S. OSHA requires the strength calculations to be performed by a structural engineer, that is, by a human and not a computer tool;
- Only U.S. OSHA and ANSI safety standards and regulations were used. The research methodology could be utilized to include other countries’ fall protection regulations too.
- The British Imperial System of units is used in the tool for both input and output values since the U.S. OSHA regulations that were integrated into the tool also utilize these units. In addition, we utilized Imperial Units since we aim to pilot-test the tool with companies in the U.S. that use Imperial Units. Use of different safety standards and regulations that are country specific and use of SI units is possible if the study methodology is to be replicated for different countries and regions;
- The aesthetics of anchor points installed on roofs were not considered;
- Financial feasibility of developing and using the tool was out of scope of this study.
In the future, the tool will be tested on an actual construction site. The anticipated challenges for a successful field implementation include the ever-changing location of potential barriers for a swing hazard and the project-specific structural limitations in selecting proper anchor points. Future research would focus on the further development of the tool into a fully automated PFAS design process. The design will include an optimization algorithm with respect to multiple aspects of PFAS such as strength calculations and accessibility for multiple types of projects with various roof geometries and more complex roof shapes. Additionally, the algorithm and the tool could be expanded to incorporate multiple physical barriers with various dimensions to address swing hazards. As for the graphical improvements, the tool can benefit from an interactive 3D model exchange with design software such as Autodesk RevitTM or Trimble SketchUpTM. The 3D model can be imported into the tool from the most-commonly used BIM design software with different file formats (e.g., RVT, IFC, 3DS) and the tool could automatically recognize the project values from the 3D model as opposed to the user entering them manually. Future versions of the tool could also include a mobile application with the purpose of facilitating the use of the tool on a construction jobsite.
Author Contributions
Conceptualization, A.H., S.O. and S.G.; methodology, A.H., S.O. and S.G.; software development, A.H.; algorithm validation, A.H.; formal analysis, A.H., S.O. and S.G.; writing—original draft preparation, A.H., S.O. and S.G.; writing—review and editing, A.H., S.O. and S.G.; visualization, A.H., S.O. and S.G. All authors have read and agreed to the published version of the manuscript.
Funding
This research received no external funding.
Institutional Review Board Statement
Not applicable since the study did not involve humans or animals.
Informed Consent Statement
Not applicable since the study did not involve humans or animals.
Data Availability Statement
The data presented in this study are available in this article.
Conflicts of Interest
The authors declare no conflict of interest.
References
- Bureau of Labor Statistics. Economic News Release. Table 3. Fatal Occupational Injuries Counts and Rates for Selected Occupations 2017–2018. Available online: https://www.bls.gov/news.release/cfoi.t03.htm (accessed on 24 December 2020).
- Bureau of Labor Statistics. Economic News Release. Census of Fatal Occupational Injuries Summary. 2018. Available online: https://www.bls.gov/news.release/cfoi.nr0.htm (accessed on 15 November 2019).
- Bureau of Labor Statistics. Injuries, Illnesses, and Fatalities. Table A-9. Fatal Occupational Injuries by Event or Exposure for All Fatal Injuries and Major Private Industry Sector, all United States. 2018. Available online: https://www.bls.gov/iif/oshwc/cfoi/cftb0330.htm (accessed on 24 December 2020).
- Occupational Health and Safety Statistics 2019; Labour Department, The Government of Hong Kong Special Administrative Region: Hong Kong, China, 2020.
- Commonly Used Statistics, Top. 10 Most Frequently Cited OSHA Standards Violated in FY2019; Occupational Safety and Health Administration (OSHA): Washington, DC, USA, 2019.
- The Construction Chart Book: The U.S. Construction Industry and its Workers, 6th ed.; The Center for Construction Research and Training: Silver Spring, MD, USA, 2018; pp. 1–74.
- Chi, C.F.; Chang, T.C.; Ting, H.I. Accident patterns and prevention measures for fatal occupational falls in the construction industry. Appl. Ergon. 2005, 36, 391–400. [Google Scholar] [CrossRef] [PubMed]
- Hu, K.; Rahmandad, H.; Smith-Jackson, T.; Winchester, W. Factors influencing the risk of falls in the construction industry: A review of the evidence. Constr. Manag. Econ. 2011, 29, 397–416. [Google Scholar] [CrossRef]
- Dong, X.S.; Largay, J.A.; Choi, S.D.; Wang, X.; Cain, C.T.; Romano, N. Fatal falls and PFAS use in the construction industry: Findings from the NIOSH FACE reports. Accid. Anal. Prev. 2017, 102, 136–143. [Google Scholar] [CrossRef] [Green Version]
- Hinze, W.J.; Olbina, S. Problem areas in personal fall protection. In Proceedings of the 14th Rinker International Conference CIB W99 Evolution of and Directions in Construction Safety and Health, Gainesville, FL, USA, 9–11 March 2008; pp. 406–418. [Google Scholar]
- Perry, M.J.; McQueen, A.; Kim, S. Evaluating Fall Safety Compliance Among Skilled Trades in Construction; Small Study Final Report; CPWR: Silver Spring, MD, USA, 2015. [Google Scholar]
- Duty to Have Fall Protection; 29 CFR 1926.501; Occupational Safety and Health Administration (OSHA): Washington, DC, USA, 2015.
- Yiu, N.S.; Chan, D.W.; Sze, N.; Shan, M.; Chan, A.P. Implementation of Safety Management System for Improving Construction Safety Performance: A Structural Equation Modelling Approach. Buildings 2019, 9, 89. [Google Scholar] [CrossRef] [Green Version]
- Specifications and Design Requirements for Active Fall Protection Systems; ASSE Z359.6; American National Standards Institute (ANSI): Washington, DC, USA, 2016.
- Standard 1926.32–Definitions; Occupational Safety and Health Administration (OSHA): Washington, DC, USA, 1993.
- Fang, Q.; Li, H.; Luob, X.; Dinga, L.; Luoa, H.; Lia, C. Computer vision aided inspection on falling prevention measures for steeplejacks in an aerial environment. Autom. Constr. 2018, 93, 148–164. [Google Scholar] [CrossRef]
- Costin, A.M.; Teizer, J.; Schoner, B. RFID and BIM-enabled worker location tracking to support real-time building protocol and data visualization. J. Inf. Technol. Constr. 2015, 20, 495–517. [Google Scholar]
- Domingos, P. The Master Algorithm: How the Quest for the Ultimate Learning Machine Will Remake Our World, 1st ed.; Basic Books, Hachette Book Group: New York, NY, USA, 2015. [Google Scholar]
- Huang, X.; Hinze, J. Analysis of construction worker fall accidents. J. Constr. Eng. Manag. 2003, 129, 262–271. [Google Scholar] [CrossRef]
- Cable, J. ASSE: Are You a “Self-Interpreter” of OSHA Fall Protection Standards? Available online: https://www.ehstoday.com/ppe/fall-protection/article/21910020/asse-are-you-a-selfinterpreter-of-osha-fall-protection-standards (accessed on 24 December 2020).
- Stromme, M.H. Five Fall Protection Myths: Clear up Construction Industry Misconceptions. Available online: https://www.ishn.com/articles/91777-5-fall-protection-myths- (accessed on 24 December 2020).
- Johnson, B. Bad Timing for New OSHA Rules on Fall Protection? Available online: https://finance-commerce.com/2011/06/bad-timing-for-new-osha-rules/ (accessed on 24 December 2020).
- OSHA Technical Manual; Occupational Safety and Health Administration (OSHA): Washington, DC, USA, 2016.
- Roofing Industry Fall Protection from A to Z; National Roofing Contractors Association (NRCA): Rosemont, IL, USA, 2011.
- Johnson, H.M.; Singh, A.; Young, R.H.F. Fall protection analysis for workers on residential roofs. J. Constr. Eng. Manag. 1998, 124, 418–428. [Google Scholar] [CrossRef]
- Teizer, J.; Allread, B.S.; Fullerton, C.E.; Hinze, J. Autonomous pro-active real-time construction worker and equipment operator proximity safety alert system. Autom. Constr. 2010, 19, 630–640. [Google Scholar] [CrossRef]
- Zhang, S.; Teizer, J.; Lee, J.K.; Eastman, C.M.; Venugopal, M. Building information modeling (BIM) and safety: Automatic safety checking of construction models and schedules. Autom. Constr. 2013, 29, 183–195. [Google Scholar] [CrossRef]
- Teizer, J. 3D range imaging camera sensing for active safety in construction. J. Inf. Technol. Constr. 2008, 13, 103–117. [Google Scholar]
- Navon, R.; Kolton, O. Algorithms for automated monitoring and control of fall hazards. J. Comput. Civ. Eng. 2007, 21, 21–28. [Google Scholar] [CrossRef]
- Wang, J.; Zhang, S.; Teizer, J. Geotechnical and safety protective equipment planning using range point cloud data and rule checking in building information modeling. Autom. Constr. 2015, 49, 250–261. [Google Scholar] [CrossRef]
- Malekitabar, H.; Ardeshir, A.; Sebt, M.H.; Stouffs, R. Construction safety risk drivers: A BIM approach. Saf. Sci. 2016, 82, 445–455. [Google Scholar] [CrossRef]
- Solihin, W.; Eastman, C. Classification of rules for automated BIM rule checking development. Autom. Constr. 2015, 53, 69–82. [Google Scholar] [CrossRef]
- Benjaoran, V.; Bhokha, S. An integrated safety management with construction management using 4D CAD model. Saf. Sci. 2010, 48, 395–403. [Google Scholar] [CrossRef]
- Qi, J.; Issa, R.R.; Olbina, S.; Hinze, J. Use of building information modeling in design to prevent construction worker falls. J. Comput. Civ. Eng. 2013, 28, 1–10. [Google Scholar] [CrossRef]
- Zhang, S.; Sulankivi, K.; Kiviniemi, M.; Romo, I.; Eastman, C.M.; Teizer, J. BIM-based fall hazard identification and prevention in construction safety planning. Saf. Sci. 2015, 72, 31–45. [Google Scholar] [CrossRef]
- Mistikoglu, G.; Gerek, I.H.; Erdis, E.; Usmen, P.M.; Cakan, H.; Kazan, E.E. Decision tree analysis of construction fall accidents involving roofers. Expert Syst. Appl. 2015, 42, 2256–2263. [Google Scholar] [CrossRef]
- Guo, B.H.W.; Goh, Y.M. Ontology for design of active fall protection systems. Autom. Constr. 2017, 82, 138–153. [Google Scholar] [CrossRef]
- Nguyen, L.D.; Tran, D.Q.; Chandrawinata, M.P. Predicting safety risk of working at heights using Bayesian networks. J. Constr. Eng. Manag. 2016, 142, 1–11. [Google Scholar] [CrossRef]
- Wang, T.K.; Qin, C. Integration of BIM, Bayesian Belief network, and ant colony algorithm for assessing fall risk and route planning. In Proceedings of the 2018 Construction Research Congress, New Orleans, LA, USA, 2–4 April 2018; pp. 207–220. [Google Scholar]
- Creswell, J.W. Educational Research: Planning, Conducting, and Evaluating Quantitative and Qualitative Research, 6th ed.; Pearson: Lincoln, NE, USA, 2013. [Google Scholar]
- Safety Requirements for Anchorage Connectors for Active Fall Protection Systems; ASSE Z359.18; American National Standards Institute (ANSI): Washington, DC, USA, 2017.
- Requirements for a Comprehensive Managed Fall Protection Program; ASSE Z359.2; American National Standards Institute (ANSI): Washington, DC, USA, 2017.
- Subpart M App C, Personal Fall Arrest Systems—Non-Mandatory Guidelines for Complying with 1926.502(d); 1926.502; Occupational Safety and Health Administration (OSHA): Washington, DC, USA, 2015.
- Dhillon, I.S.; Modha, D.S. A data-clustering algorithm on distributed memory multiprocessors. Large-Scale Parallel Data Mining. In Lecture Notes in Computer Science; Zaki, M.J., Ho, C.T., Eds.; Springer: Berlin, Germany, 2002; Volume 1759, pp. 245–260. [Google Scholar]
- Graupe, D. Principles of Artificial Neural Networks, 3rd ed.; World Scientific Publishers: Singapore, 2013. [Google Scholar]
- Altman, N.S. An introduction to kernel and nearest-neighbor nonparametric regression. Am. Stat. 1992, 46, 175–185. [Google Scholar] [CrossRef] [Green Version]
- 1910.21 Occupational Health and Safety Standards, Subpart Walking-Working Surfaces, Scope and Definitions; Occupational Safety and Health Administration (OSHA): Washington, DC, USA, 2016.
- Hu, Y.; Ma, P.; Yang, M.; Wang, Z. A consistency test method for simulation data considering shape and distance of series. In Part I Communications in Computer and Information Science, Proceedings of the Asia Simulation Conference, Shanghai, China, 27–30 October 2012; Xiao, T., Zhang, L., Fei, M., Eds.; Springer: Berlin, Germany, 2012. [Google Scholar]
- Dasarathy, B.V. Nearest Neighbor ({NN}) Norms: {NN} Pattern Classification Techniques; IEEE Computer Society Press: Michigan, MI, USA, 1991. [Google Scholar]
- Stehman, S.V. Selecting and interpreting measures of thematic classification accuracy. Remote Sens. Environ. 1997, 62, 77–89. [Google Scholar] [CrossRef]
- Kuhn, M.; Johnson, K. Applied Predictive Modelling; Springer: New York, NY, USA, 2013. [Google Scholar]
- Python for Engineers. Cross Validation and Model Selection. Available online: https://www.pythonforengineers.com/cross-validation-and-model-selection/ (accessed on 24 December 2020).
- Brownlee, J. A Gentle Introduction to K-Fold Cross-Validation. Available online: https://machinelearningmastery.com/k-fold-cross-validation/ (accessed on 24 December 2020).
Figure 1.
A rule-set algorithm for personal fall arrest system (PFAS) anchor positioning.

Figure 2.
Algorithm for optimizing location of PFAS anchor points.

Figure 3.
The PFAS tool’s main menu.

Figure 4.
Fall clearance guide (adapted from American National Standards Institute (ANSI)/ASSE [14]).
Figure 4.
Fall clearance guide (adapted from American National Standards Institute (ANSI)/ASSE [14]).

Figure 5.
Swing hazard guide (adapted from ANSI/ASSE [14]).
Figure 5.
Swing hazard guide (adapted from ANSI/ASSE [14]).

Figure 6.
Roof geometry guide.

Figure 7.
The user input panel with 16 input parameters (for the gable roof scenario).

Figure 8.
The tool’s graphical output of the results (for the gable roof scenario).

Figure 9.
The tool’s numerical output of the results in the text pad in the main menu (for the gable roof scenario).
Figure 9.
The tool’s numerical output of the results in the text pad in the main menu (for the gable roof scenario).

Figure 10.
3D view of the gable roof used to test the optimization algorithm and the tool.

Figure 11.
K-fold Cross-Validation Model used in this research.

Figure 12.
Validation accuracy of 5-fold cross validation.

Figure 13.
Example of variation of X and Y coordinates of 50 anchor points (out of 238 results). Horizontal numbers present anchor points in each group.
Figure 13.
Example of variation of X and Y coordinates of 50 anchor points (out of 238 results). Horizontal numbers present anchor points in each group.


Table 1.
Research objectives and methods.
| Research Phase | Research Objectives | Research Methods | Programming Language/Tool Used | Function of the Programming Language/Tool | |
|---|---|---|---|---|---|
| 1 | Developing a rule-set algorithm | (a) Defining a set of rules for positioning the anchor points in PFAS | Examining the construction worker safety standards and regulations and converting them into machine-readable rules | N/A | N/A |
| (b) Examining the rules for various scenarios | Rule-checking of fall clearance and fall swing | Manual calculations | Developing a rule-set to be used as a database for the optimization algorithm and the automated tool | ||
| 2 | Developing an optimization algorithm | Determining the decision matrix that consists of decision variables, constrains and objective | KNNS optimization algorithm | N/A | |
| 3 | Developing an automated tool for anchor positioning in form of a Windows-based computer application | Implementing KNNS optimization algorithm into an independent tool using computer programming | Python and various Python modules such as Numpy, TkInter, Sympy, Mathplotlib, Math and Pil | Developing a computer program with a simple user-friendly interface/GUI | |
| Testing the algorithm and the tool for 20 different scenarios | Tool calculations and manual calculations | N/A | |||
| 4 | Validating the optimization algorithm | Selecting the proper method for validating the optimization algorithm and performing the validation | K-fold Cross-Validation | N/A | |
Table 2.
Examples of standard clauses from Occupational Safety and Health Administration (OSHA) [12] and interpretation process.
Table 2.
Examples of standard clauses from Occupational Safety and Health Administration (OSHA) [12] and interpretation process.
| OSHA Regulations | The Research Interpretation of the Rules | |||
|---|---|---|---|---|
| OSHA Clause Number | OSHA Requirements | Clause Description | Fall Protection Area | Questions |
| Title 29 Code of Federal Regulations (CFR) Subpart M–Fall Protection, 29 CFR 1926.501(b)(11) 1926.502(d)(16)(iii) | Guardrail systems with toe-boards, safety net systems, or PFAS | PFAS, when stopping a fall, shall be rigged such that an employee can neither free fall more than 6 feet (1.8 m), nor contact any lower level | A steep roof with unprotected sides and edges 6 feet (1.8 m) or more above lower level |
|
| OSHA subpart M 1926.502(d)(23) | PFAS structural requirements for anchors | PFAS shall not be attached to guardrail systems, standard railings, ladders, scaffolding, light fixtures, conduit or plumbing, ductwork or pipe vents, or any item or structure not capable of meeting OSHA structural load requirements. | A steep roof with unprotected sides and edges 6 feet (1.8 m) or more above lower level |
|
Table 3.
Experimental environment of the tool.
| Category | Specifications |
|---|---|
| Operating System | Windows 10 |
| Memory | 16 GB |
| CPU | Intel(R) Core i7-6700 3.40 GHz |
| Tool Launch Time | 5.50 s |
| Average Computation Time | 71.81 s |
Publisher’s Note: MDPI stays neutral with regard to jurisdictional claims in published maps and institutional affiliations. |
© 2020 by the authors. Licensee MDPI, Basel, Switzerland. This article is an open access article distributed under the terms and conditions of the Creative Commons Attribution (CC BY) license (http://creativecommons.org/licenses/by/4.0/).
Share and Cite
MDPI and ACS Style
Heidari, A.; Olbina, S.; Glick, S. Automated Positioning of Anchors for Personal Fall Arrest Systems for Steep-Sloped Roofs. Buildings 2021, 11, 10. https://0-doi-org.brum.beds.ac.uk/10.3390/buildings11010010
AMA Style
Heidari A, Olbina S, Glick S. Automated Positioning of Anchors for Personal Fall Arrest Systems for Steep-Sloped Roofs. Buildings. 2021; 11(1):10. https://0-doi-org.brum.beds.ac.uk/10.3390/buildings11010010
Chicago/Turabian StyleHeidari, Azin, Svetlana Olbina, and Scott Glick. 2021. "Automated Positioning of Anchors for Personal Fall Arrest Systems for Steep-Sloped Roofs" Buildings 11, no. 1: 10. https://0-doi-org.brum.beds.ac.uk/10.3390/buildings11010010
Note that from the first issue of 2016, this journal uses article numbers instead of page numbers. See further details here.