
Thermal Comfort and Sleep Quality of Indonesian Students Living in Japan during Summer and Winter


1
Department of Architecture and Civil Engineering, Toyohashi University of Technology, Toyohashi 441-8580, Japan
2
Department of Industrial Engineering, Faculty of Engineering, Diponegoro University, Semarang 50275, Indonesia
3
Department of Architecture, Faculty of Environmental & Urban Engineering, Kansai University, Suita 564-8680, Japan
*
Author to whom correspondence should be addressed.
Buildings 2021, 11(8), 326; https://0-doi-org.brum.beds.ac.uk/10.3390/buildings11080326
Submission received: 7 June 2021
/
Revised: 21 July 2021
/
Accepted: 22 July 2021
/
Published: 28 July 2021
(This article belongs to the Special Issue Emerging Methodologies and Technologies for Assessing the Impact of Air Quality and Thermal, Visual, and Acoustic Comfort on Indoor Environmental Quality)
Abstract
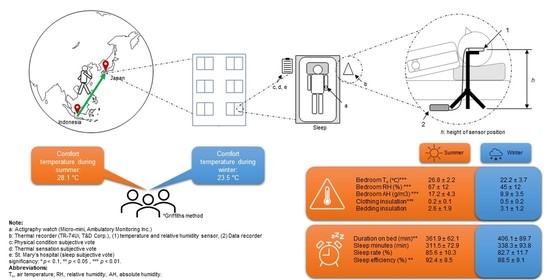
:Thermal comfort is crucial in satisfaction and maintaining quality sleep for occupants. In this study, we investigated the comfort temperature in the bedroom at night and sleep quality for Indonesian students during summer and winter. Eighteen male Indonesian students aged 29 ± 4 years participated in this study. The participants had stayed in Japan for about six months. We evaluated the sleep parameters using actigraphy performed during summer and winter. All participants completed the survey regarding thermal sensation, physical conditions, and subjective sleepiness before sleep. The temperature and relative humidity of participants’ bedrooms were also measured. We found that the duration on the bed during winter was significantly longer than that during summer. However, sleeping efficiency during winter was significantly worse than that during summer. The bedroom temperature of the participants was in the range of comfort temperature in Indonesia. With the average bedroom air temperature of 22.2 °C, most of the participants still preferred “warm” and felt “slightly comfortable” during winter. The average comfort temperature each season calculated using the Griffiths method was 28.1 °C during summer and 23.5 °C during winter. In conclusion, differences in adaptive action affect bedroom thermal conditions. Furthermore, habits encourage the sleep performance of Indonesian students.
1. Introduction
Sleep improves work efficiency and maintains health at work and school. Commonly, poor sleep quality and fatigue are attributed to discomfort conditions in hot summer [1]. A survey by the Japan Meteorological Agency in 2003 revealed that the symptoms experienced in summer include “sleep disorders” (over 50% participants) and “fatigue/not being well” (around 30%) [2]. The healthy participants also suffered great fatigue at high atmospheric temperatures (44 °C) and humidity (80%) [3]. Previous Nordic epidemiology reported that sleep quality is poor in summer [4] and in the middle of winter [5,6]. Meanwhile, in temperate zones, the sleep duration of the residents is longer in winter than in summer [7,8,9]. Occupants experience longer sleep and fewer complaints [8,10,11,12].
Scientific reports have proven that photoperiod might relate to sleep durations [13]. Moreover, this difference in sleep length between summer and winter might also be caused by ethnicity and culture [10]. Kume et al. (2017) revealed that Japanese exhibit significantly short sleep duration with higher levels of activity at night in summer, where Thai participants (living in Thailand) have poor sleep at night all year round [14]. Nevertheless, there are only a few studies on seasonal effects on sleep in different nationalities, particularly in the same temperate zone. How adaptive a foreigner’s sleeping quality is in a new thermal environment is not clarified. Because Japan does not adopt daylight saving time, natural seasonal variability in sleep measures could be investigated properly [15].
Many previous studies on indoor thermal environments, especially microenvironments (e.g., sleeping space or bedroom), revealed that comfort temperature is crucial in maintaining quality sleep [16,17]. In different seasons, variations in indoor temperatures could have different impacts on sleep measures. Indoor temperatures correlate strongly with the outdoor temperature during summer and a weak association at cooler temperatures [18]. Thermal comfort is usually improved using recommendations of applicable standards. However, standards for calculating thermal comfort (ASHRAE 55, Atlanta, Georgia, GA, USA, ISO 7730, Geneva, Switzerland) are applied worldwide for all individuals, ignoring ethnicity and nationality of origin. ASHRAE Standard 55 explains the differences in thermal comfort during winter and summer in the same country. Still, it does not consider the differences in individual thermal preferences of different countries. For individuals from other countries, Havenith et al. (2020) reported several standards for calculating thermal comfort by adding an adaptive model [19]. The adaptive comfort temperature study is attractive to individuals who have lived in their home country for about 20 years (e.g., university students) and then moved to another country with a different climate.
Previous studies have investigated the comfort temperatures for the traditional environment, such as residences and offices [20,21,22] and for special environments, such as sports [23], even different seasons [22,24,25]. These studies mostly assessed occupant’s daily activities. Studies on adaptive comfort temperatures have been widely conducted in Japan. However, only a few studies have investigated sleep parameters and foreigners living outside their home countries. Being natives of a tropical region (06°12′0.00″ S, 106°48′59.9″ E Jakarta, Indonesia), Indonesian students may show long-term adaptation to Japanese season (>20 years), similar to the case of Japanese Brazilians [26]. However, once relocated to a temperate zone (34°46′9″ N, 137°23′29.5″ E Toyohashi, Japan), they may need to put in a considerable effort to adapt to the new environment. To adjust the indoor temperature, occupants can make their rooms warmer or cooler using an air conditioner (AC).
In this study, we conducted a field survey of thermal comfort in summer and winter in Indonesian students. In addition, no studies have investigated the sleep quality of foreigners living outside their home countries. The sleep qualities were also measured to investigate their correlation with the thermal environment of actual bedrooms. We hypothesized that the winter would be more challenging to the individual formerly living in a tropical zone.
2. Materials and Methods
2.1. Time and Location
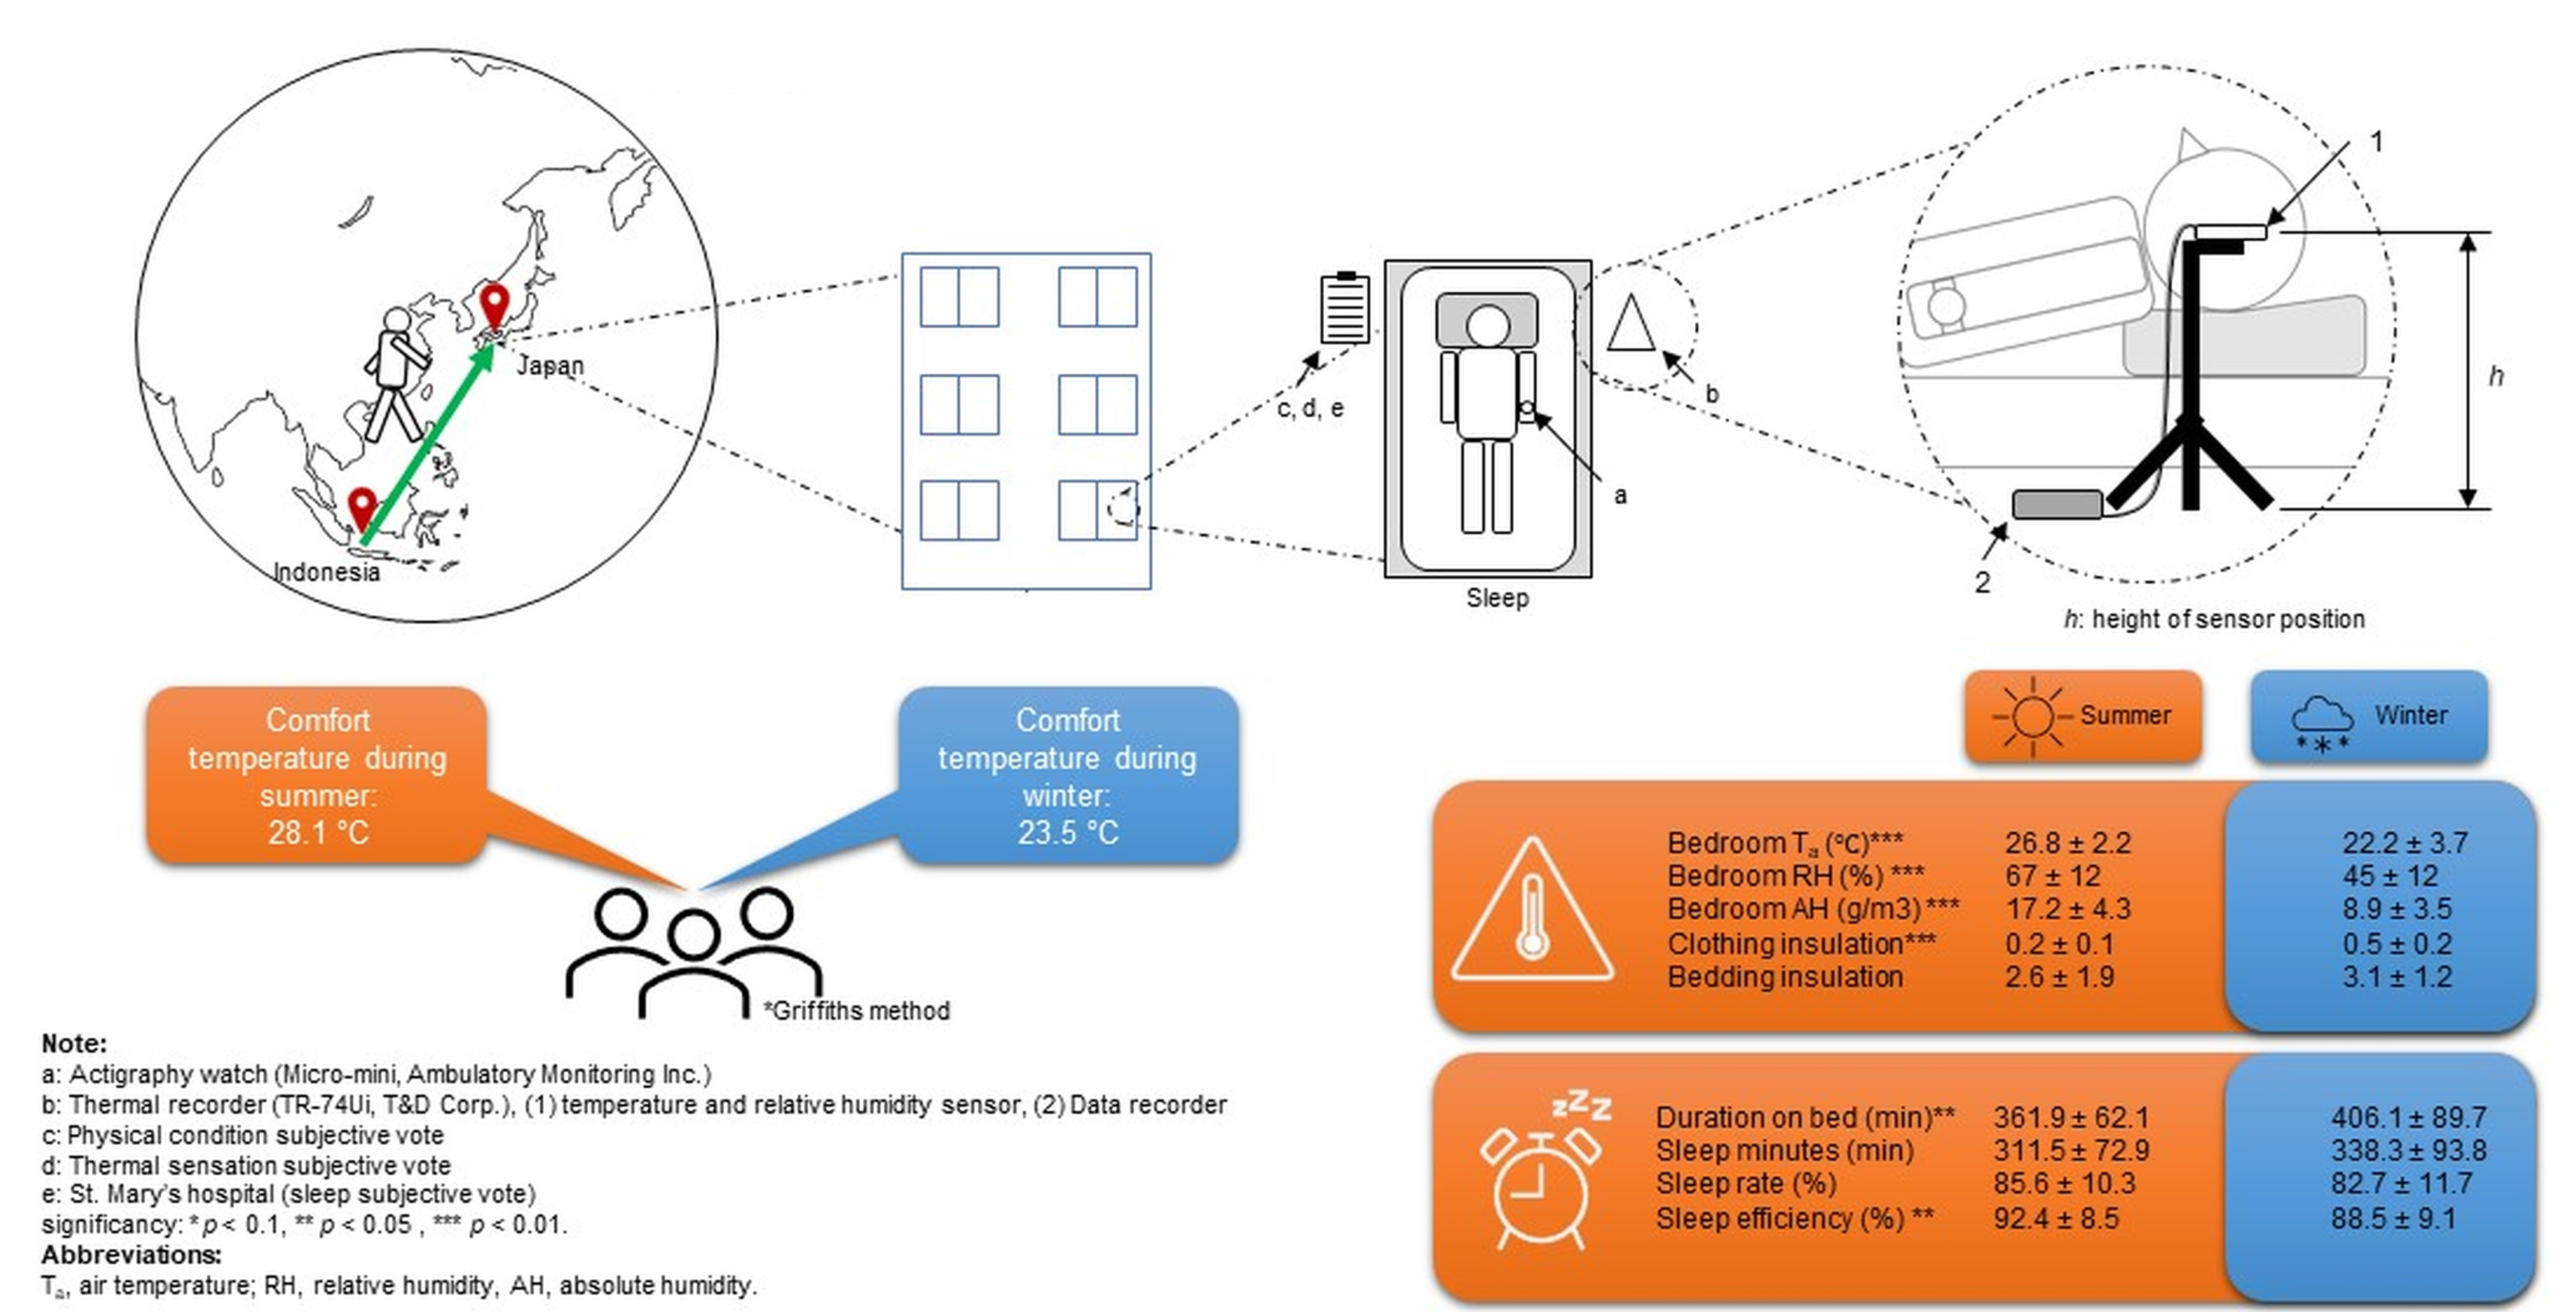
The experiments were conducted from August to September 2019 (summer) and January to March 2020 (winter) in Toyohashi city, Aichi Prefecture, Japan (lat 34°46′9″ N, long 137°23′29.5″ E). Toyohashi city is classified as Cfa: humid subtropical climate (Köppen-Geiger climate classification system) [27,28]. The city is hot and humid in summer and relatively mild in winter. This study was conducted at the participants’ houses with house types: university dormitory, private apartment, and public apartment (Figure 1). Cooling and heating were not specified modes. This type of building has provided a small vent or opening for natural ventilation in the bedroom. However, in this study, we did not ask the participants how to use natural ventilation. Occupants operated split-type AC during summer and winter. The AC was used to adjust the bedroom air temperature to the participant’s preference during summer and winter.
2.2. Procedure
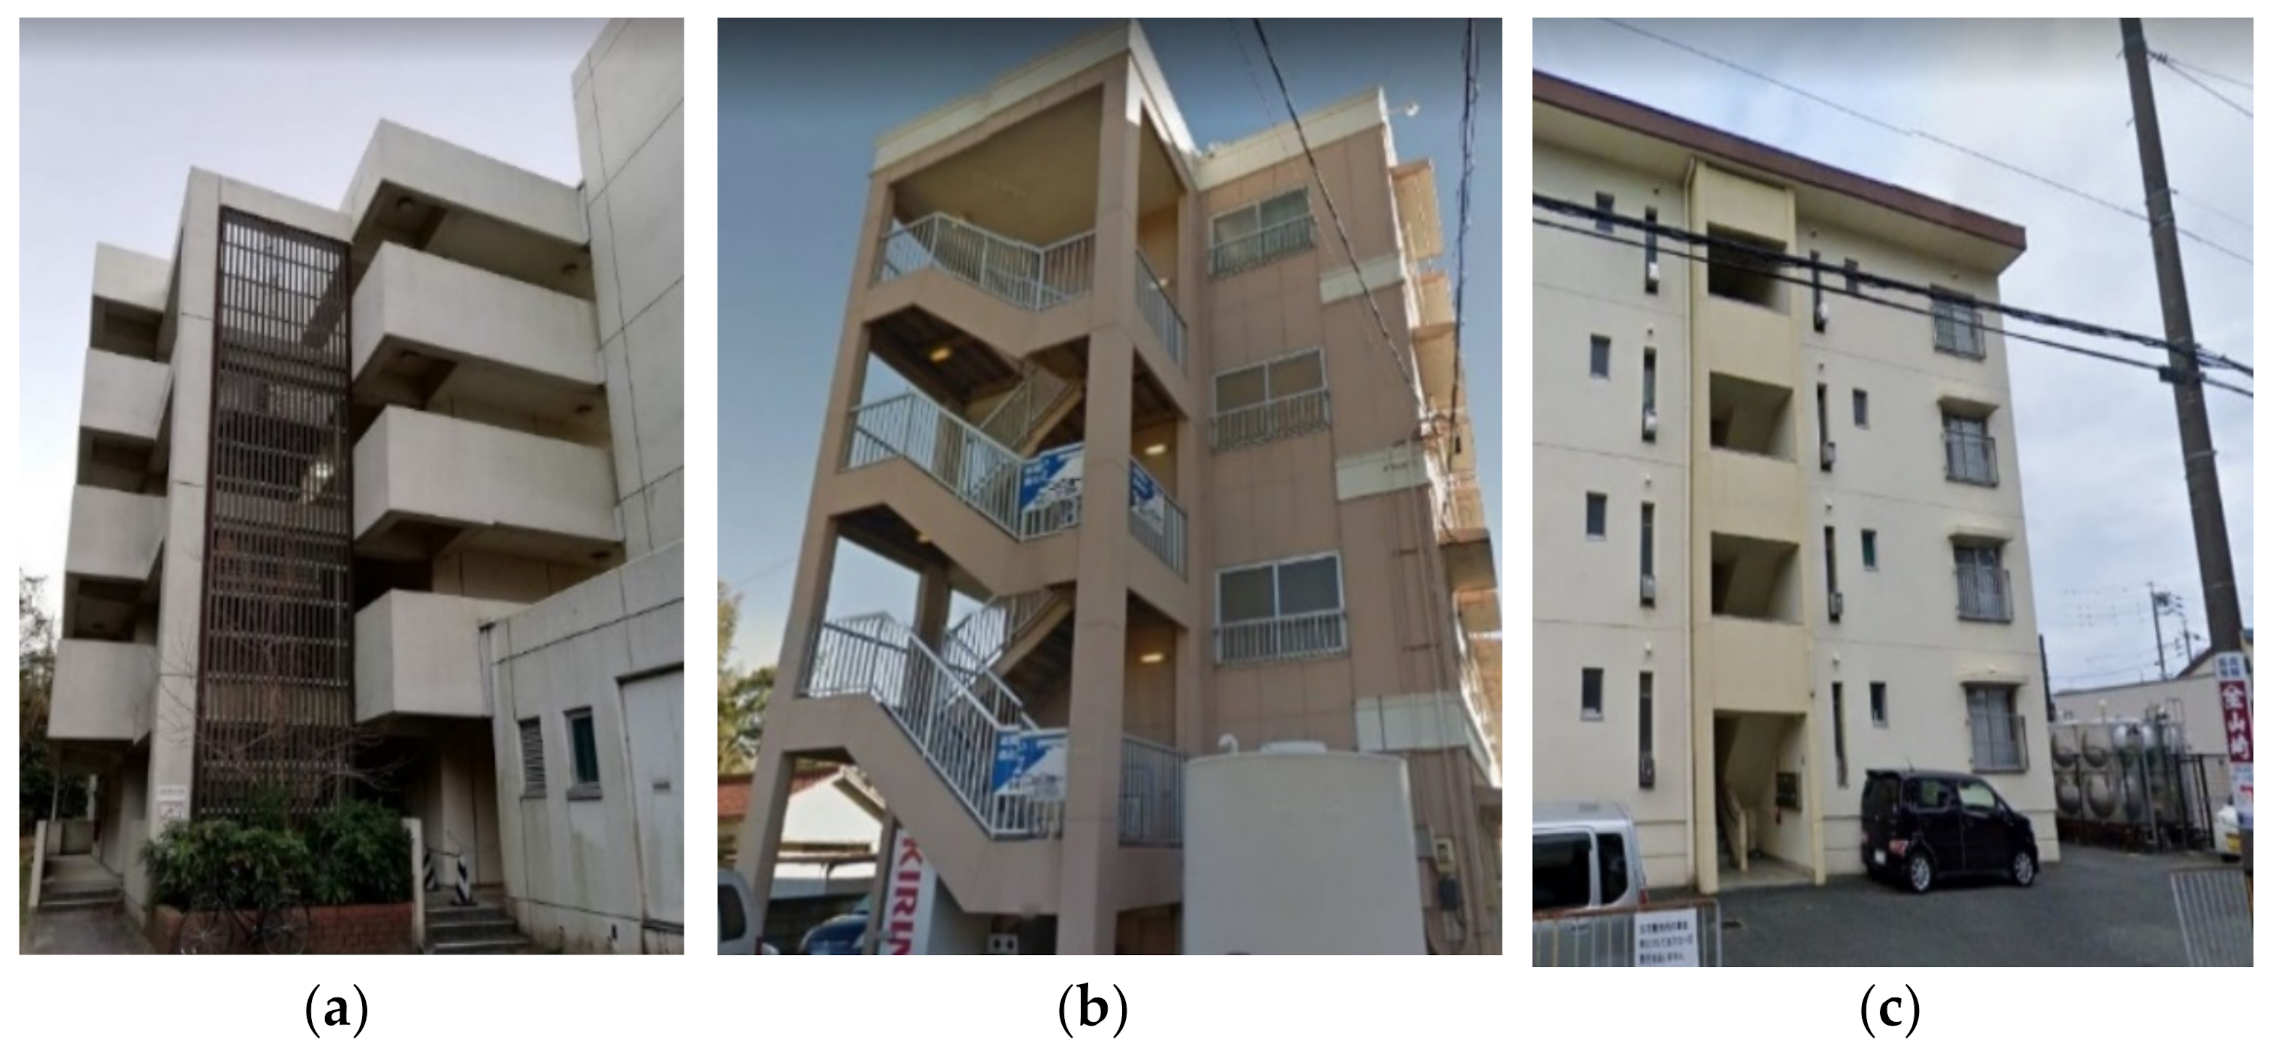
The participants were briefed and provided written and approved consent by the research ethic committee of Toyohashi University of Technology (TUT), Toyohashi, Japan. The participants’ physical and mental conditions were confirmed by their answers to a subjective vote. Participants were asked to wear an actigraphy (Micro-mini, Ambulatory Monitoring, Inc., Ardsley, NY, USA) to measure the sleep parameters (duration on bed, sleep duration, sleep rate, and sleep efficiency) based on wrist activity [29] and set a thermal recorder (TR-74Ui, T&D Corp., Matsumoto, Japan) for temperature and relative humidity measurement of the bedroom environment during the sleep. The following formulas were used to calculate the sleep rate and efficiency.
The experimental instruments were calibrated. Figure 2 shows the setting instruments during sleep measurement, and Table 1 summarizes the type of instrument, parameter, and accuracy. The type of house and furniture may affect the bedroom air temperature (Ta) and relative humidity (RH). Previous studies reported that the temperature and humidity variation are influenced by proximity to heat or humidity sources (laundry, shower, and kitchen) [30]. However, the behavior of respondents in indoor thermal regulations, such as opening windows [30], using fan/AC/heater [31,32], and clothing and bedding [33,34] might vary, over a season [18]. Thus, we instructed respondents to place the sensor and data logger closer and parallel to the head while sleeping, as shown in Figure 2.
2.3. Thermal Comfort Survey
The participants completed a subjective sensation survey (thermal sensation, physical condition, and sleep subjective vote) before and (sleep subjective sensation) after wake-up. Clothing, time of sleep and wake-up, and temperature were not controlled (natural) during sleep. The thermal sensation questionnaire recorded thermal perception before sleep. The questionnaire consisted of two sections. The first section included participants’ demographic information (e.g., age and gender), the second section was related to the standard nine-point thermal sensation scales, humidity sensation, airflow sensation, sweating sensation, thermal comfort sensation, thermal preference, and thermal satisfaction (Table 2). The thermal sensation questionnaire presented nine-point standards from the society of heating, air-conditioning and sanitary engineers of Japan (SHASE) thermal sensation scale: very cold (−4), cold (−3), cool (−2), slightly cool (−1), neutral (0), slightly warm (1), warm (2), hot (3), and very hot (4).
2.4. Physical Condition and Sleep Sensation Survey
The physical condition and St. Mary’s Hospital (SMH) sleep questionnaires used were adapted from previous studies by Tsuzuki et al. (2011) and Shahid et al. (2012), respectively [9,35]. The physical condition survey was filled out before sleep. The questionnaire consisted of 12 questions were written in English for Indonesian students. The questions included
- What time did you wake up this morning?
- Did you take a daytime nap today?
- What time did you have dinner?
- What time did you take a bath or shower?
- Did you engage in intense physical activity or work today?
- How is your current physical condition compared to your usual condition?
- How is your current sleepiness in comparison to your normal condition?
- How is your mental feeling in comparison to your usual condition?
- Are you more anxious or less anxious today compared to usual?
- What kind of clothes did you wear when you sleep?
- What kind of comforter (ex: Blankets) did you use when you sleep?
- What kind of air-conditioning did you use when you sleep?
The SMH questionnaire was completed after wake-up. The participants were asked to answer 14 questions about subjective sleep sensations. The questions included:
- What time did you settle down for the night?
- What time did you fall asleep last night?
- What time did you finally wake this morning?
- What time did you get up this morning?
- How was your sleep?
- How many times did you wake up?
- How much sleep did you have last night?
- How much sleep did you have during the day?
- How well did you sleep last night?
- How clearheaded did you feel after getting up this morning?
- How satisfied were you with last night’s sleep?
- Were you troubles by waking early and being unable to get off to sleep again?
- How much difficulty did you have in getting off to sleep last night?
- How long did it take you to fall asleep last night?
2.5. Statistical Method
The survey and experiment were designed as longitudinal (repeated measurements of the same variables and a limited number of participants). The participants included 18 Indonesian students. The study was conducted for four nights in summer and three nights in winter. Since the number of data for each season was under 50, the normality test was conducted by the Anderson–Darling test. For a normality hypothesis (p-value) under 0.05, a nonparametric test was employed. Two-sample t-tests and analysis of variance (ANOVA) were implemented. One-way ANOVA for repeated measures was performed to analyze the indoor environment and sleep quality. Pearson’s correlation was conducted to evaluate the correlation between the thermal environment (indoor and outdoor) and sleep quality. All data were analyzed using Minitab version 19 (Minitab, LLC, State College, PA, USA), and all graphic charts were exported using Daniel’s XL by Daniel Kraus toolbox.
3. Results
3.1. Participants Information
Eighteen healthy male students participated in this study. The participants were Indonesian students at the Toyohashi University of Technology. The participants have the following information (mean ± standard deviation): 29 ± 4 years of age, 72.02 ± 13.7 kg of body weight, 169 ± 5 cm of height, and 24.4 ± 4.7 kg/m2 of body mass index.
3.2. Outdoor and Indoor Thermal Conditions
The outdoor environment data were provided by the Japan Meteorological Agency (JMA) [28]. The average monthly outdoor temperature reached its minimum in February 2020 (avg: 8.5 °C, min: −0.3 °C, max: 20.7 °C) and maximum in August 2020 (avg: 29.7 °C, min: 23.2 °C, max: 41.1 °C). The minimum average monthly outdoor relative humidity was obtained in February 2020 (avg: 57%, min: 18%) and the maximum was attained in July 2020 (avg: 87%, min: 46%). Accordingly, the outdoor air temperature and relative humidity during summer (25.4 ± 2.8 °C, 84 ± 8%) were higher than those during winter (7.7 ± 3.0 °C, 68 ± 17%).
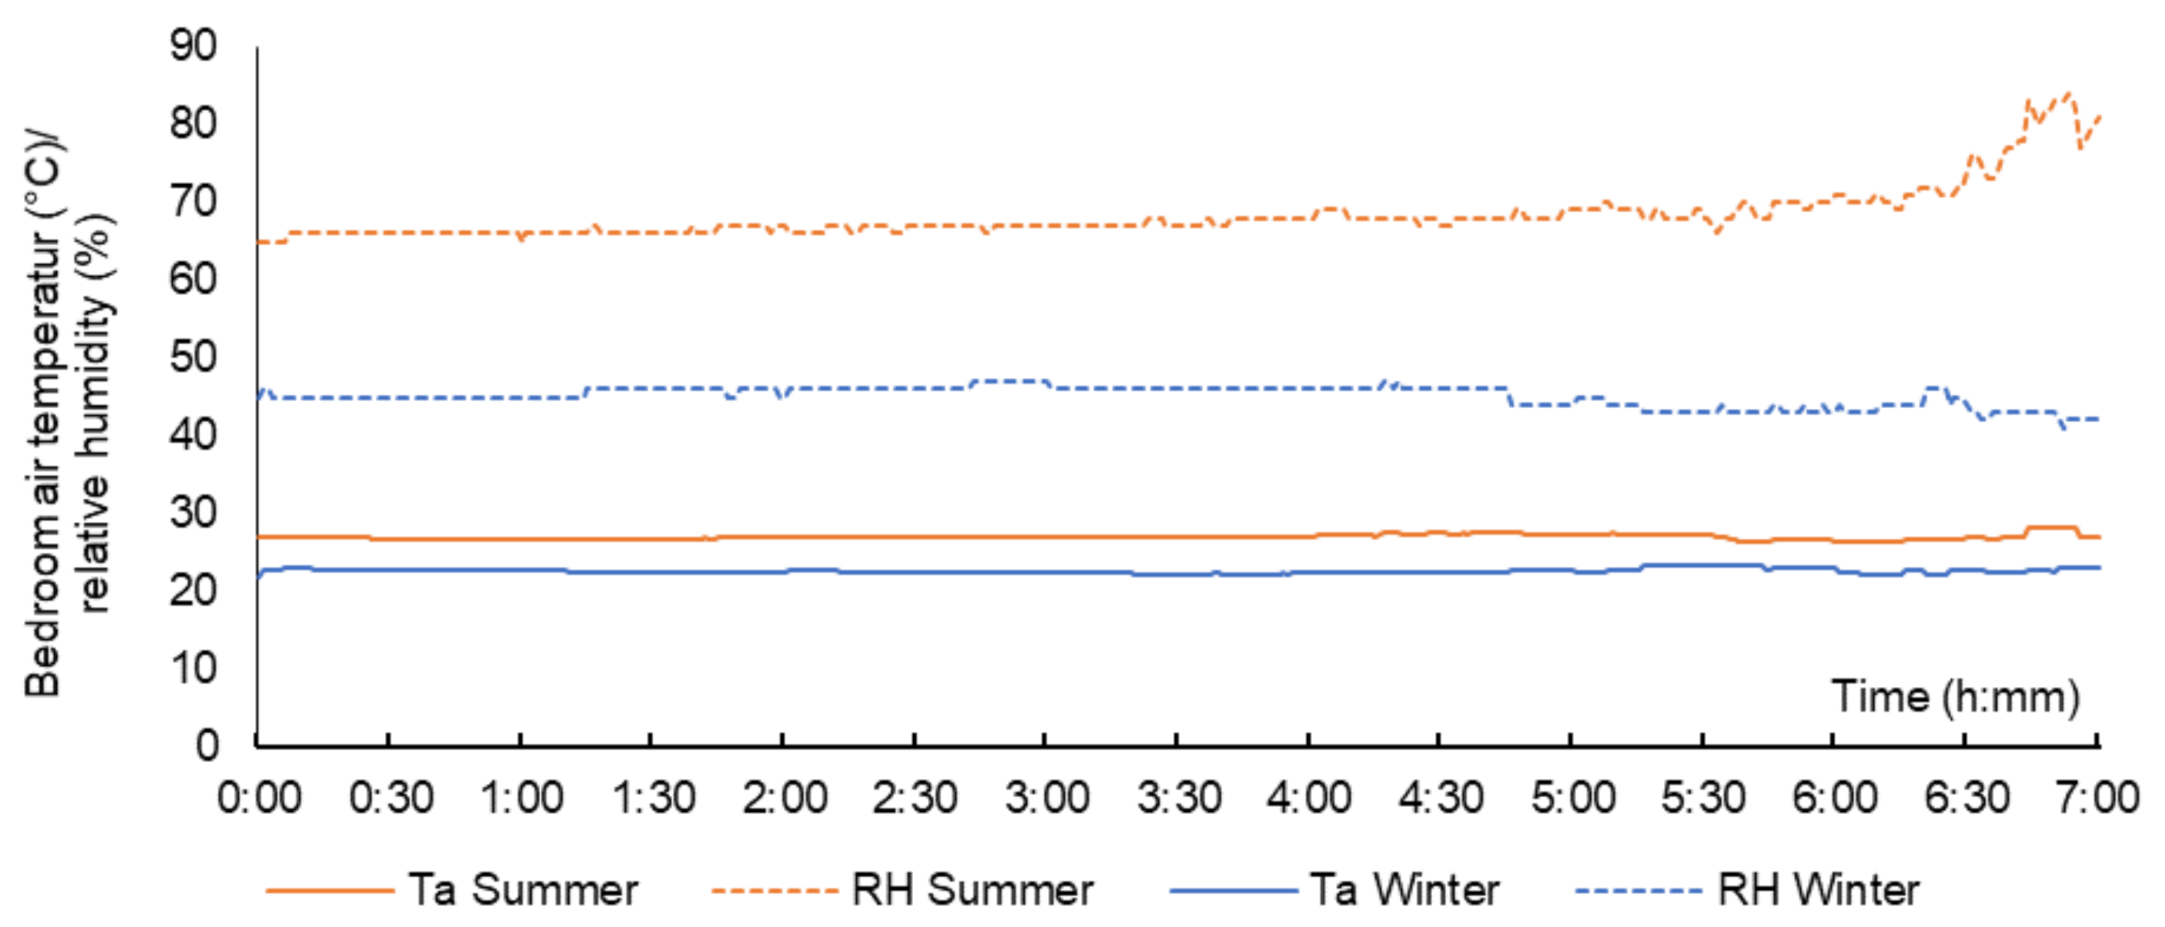
Table 3 summarizes the results of the bedroom thermal environment investigated in two seasons during sleep, and Figure 3 shows the indoor air temperature and relative humidity during sleep. The total sample points were 59. Sunrise was at 05:07 ± 19 min in summer and 06:27 ± 25 min in winter. Sunset was at 18:27 ± 28 min in summer and 17:25 ± 24 min in winter. The daylight hours were longer in summer (13 h 19 ± 47 min) than in the winter (10 h 57 ± 49 min). The average indoor air temperature was higher than the outdoor temperature in both summer and winter, whereas the indoor relative humidity was contradictory. Moreover, the average indoor (bedroom) air temperature and relative humidity in summer were significantly higher than them in winter (all ps < 0.01).
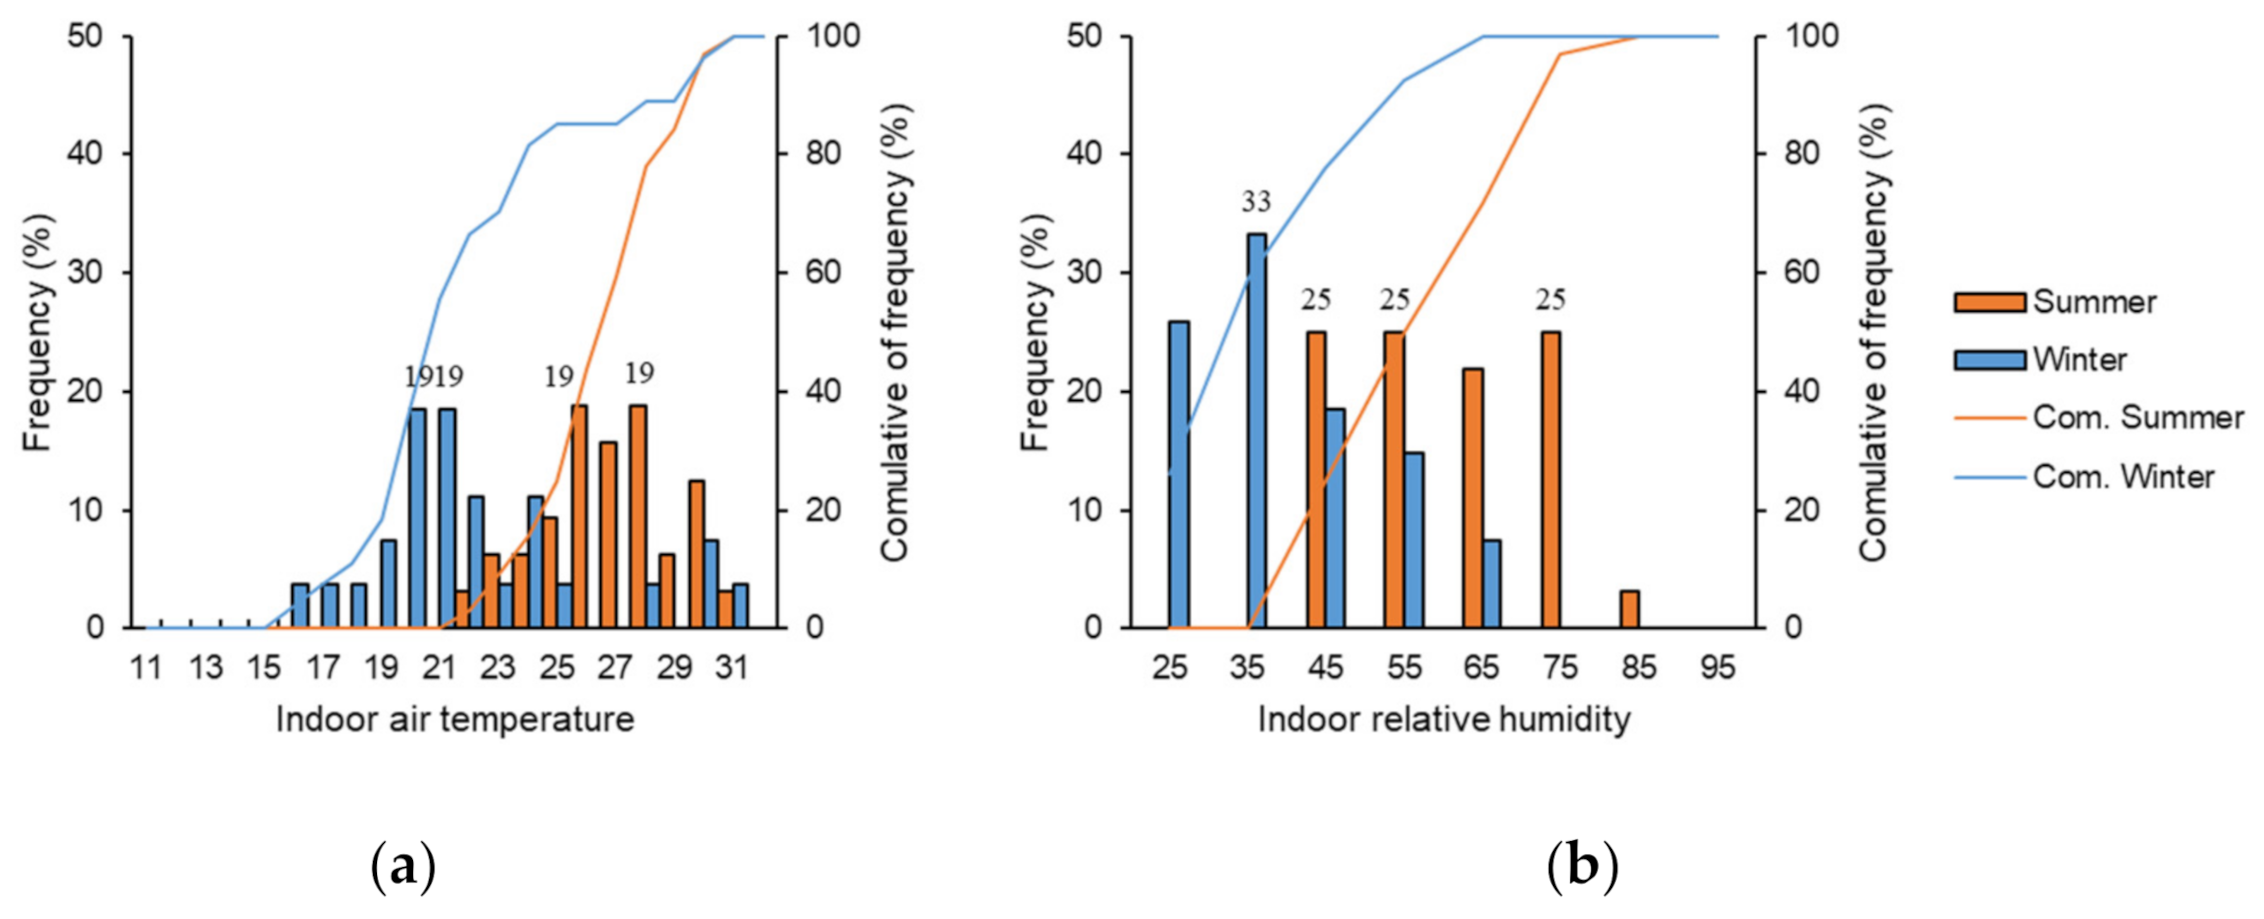
The indoor air temperature and relative humidity were grouped in 1 °C and 10% bins, respectively. The frequency distribution of the indoor air temperature within each bin is shown in Figure 4a. The highest frequency was recorded at the indoor air temperatures of 26 °C and 28 °C during summer. In winter, the highest frequency was at indoor air temperatures of 20 °C and 21 °C. The frequency distribution of indoor relative humidity is shown in Figure 4b. The minimum indoor relative humidity was 35% and 25% of RH during summer and winter, respectively.
A significant seasonal effect was observed in both indoor air temperature (p < 0.01; df = 1; F = 33.23) and relative humidity (p < 0.01; df = 1; F = 47.64). In the bedding condition during sleep, in summer, 96.9% and 84.4% of participants wore short sleeves and short pants, respectively. In winter, 44.4% and 33.3% of participants wore short sleeves and short pants, respectively.
3.3. Sleep Quality
3.3.1. Physical Condition before Sleep
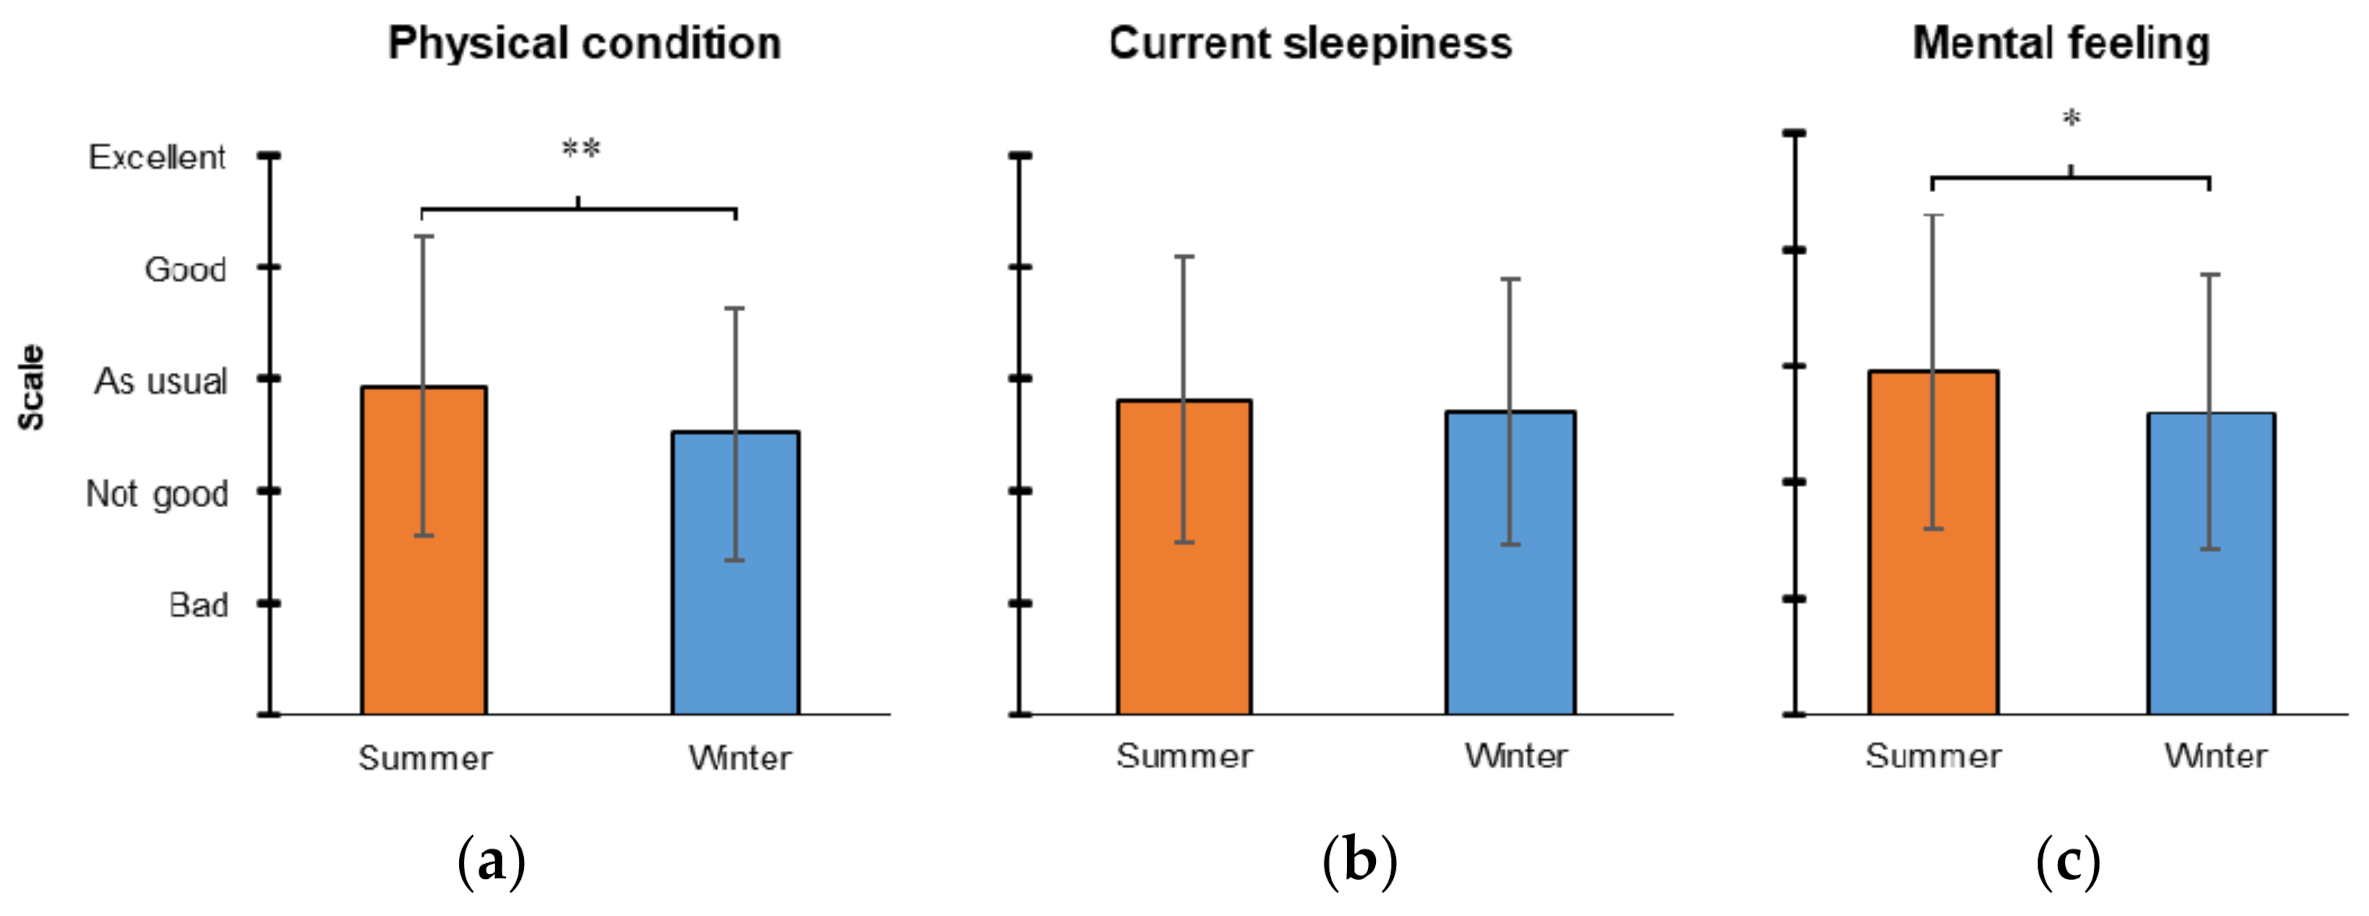
In the previous night’s sleep experience during summer, participants woke up at 5:49 on average. In winter, they woke up on average at 5:53. During the day, in summer, 21.9% of the participants took a nap, and 16.7% took a nap in winter. We also analyzed the physical condition sensation (physical condition, sleepiness, and mental feeling) before the participants slept. The average subjective assessment of physical conditions is shown in Figure 5. Participants felt physical condition and mental feeling sensation better in summer than in winter (p < 0.05, p < 0.1, respectively). However, participants felt the same in current sleepiness during summer and winter.
3.3.2. Sleep Quality
The participants went to bed at 23:49 (95 min) and woke up at 05:50 (108 min) during summer. In winter, they went to bed at 23:30 (111 min) and woke up at 06:15 (76 min). The subjective sleep quality showed no significant difference between summer and winter on the previous night of the experiment. Moreover, there was no significant difference between the participants’ wake-up time and sunrise time during summer and winter.
Table 4 summarizes the average sleep parameters (duration on the bed, sleep minutes, SR, SE, and sleep latency) based on the actigraphy data. Significant differences in sleep quality parameters were observed between the seasons. We conducted one-way ANOVA using the sleep quality parameters (duration on the bed, sleep minute, SR, SE, and sleep latency) as the dependent variables and season (summer, winter) as the independent variables. The duration on the bed and SE were significantly different between summer and winter.
3.3.3. Sleep Sensation
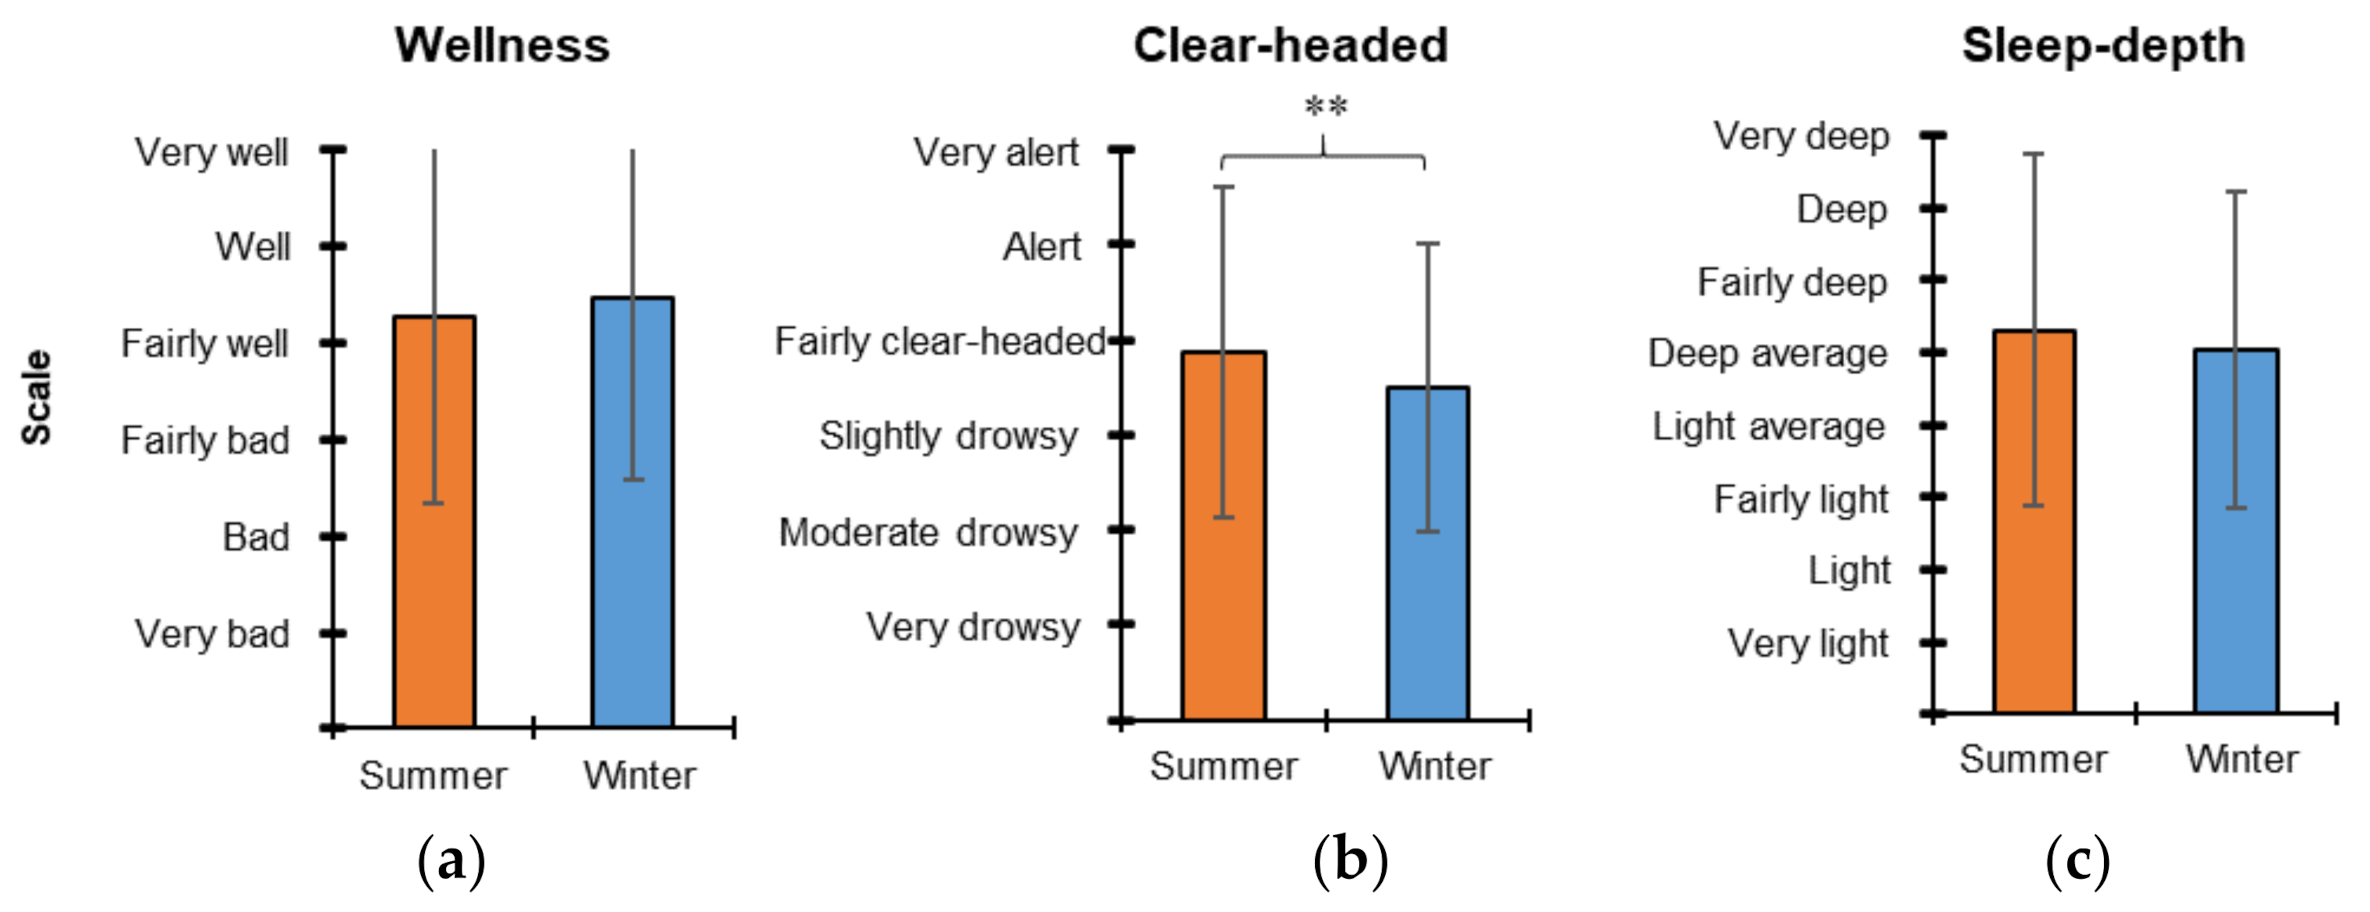
Furthermore, we analyzed sleep sensation (sleep depth, wake-up times, wellness, and clearheadedness in the morning) using the SMH questionnaire and measured bedroom temperature after wake-up. There was a significant difference in the “clearheaded in the morning” parameter between summer and winter (p < 0.05) (see Figure 6).
3.4. Comfort Temperature
3.4.1. Thermal Sensation
Participants filled out the questionnaires (thermal sensation and physical condition) before sleeping. Table 5 summarizes the thermal sensation and thermal comfort percentage for each nationality in summer and winter before sleep. In the summer, 41% of the participants felt slightly cool, and 33% felt neutral and slightly cool during winter. Furthermore, in the thermal comfort sensation, 47% of the participants felt slightly comfortable during summer, and 26% felt neutral and slightly uncomfortable during winter.
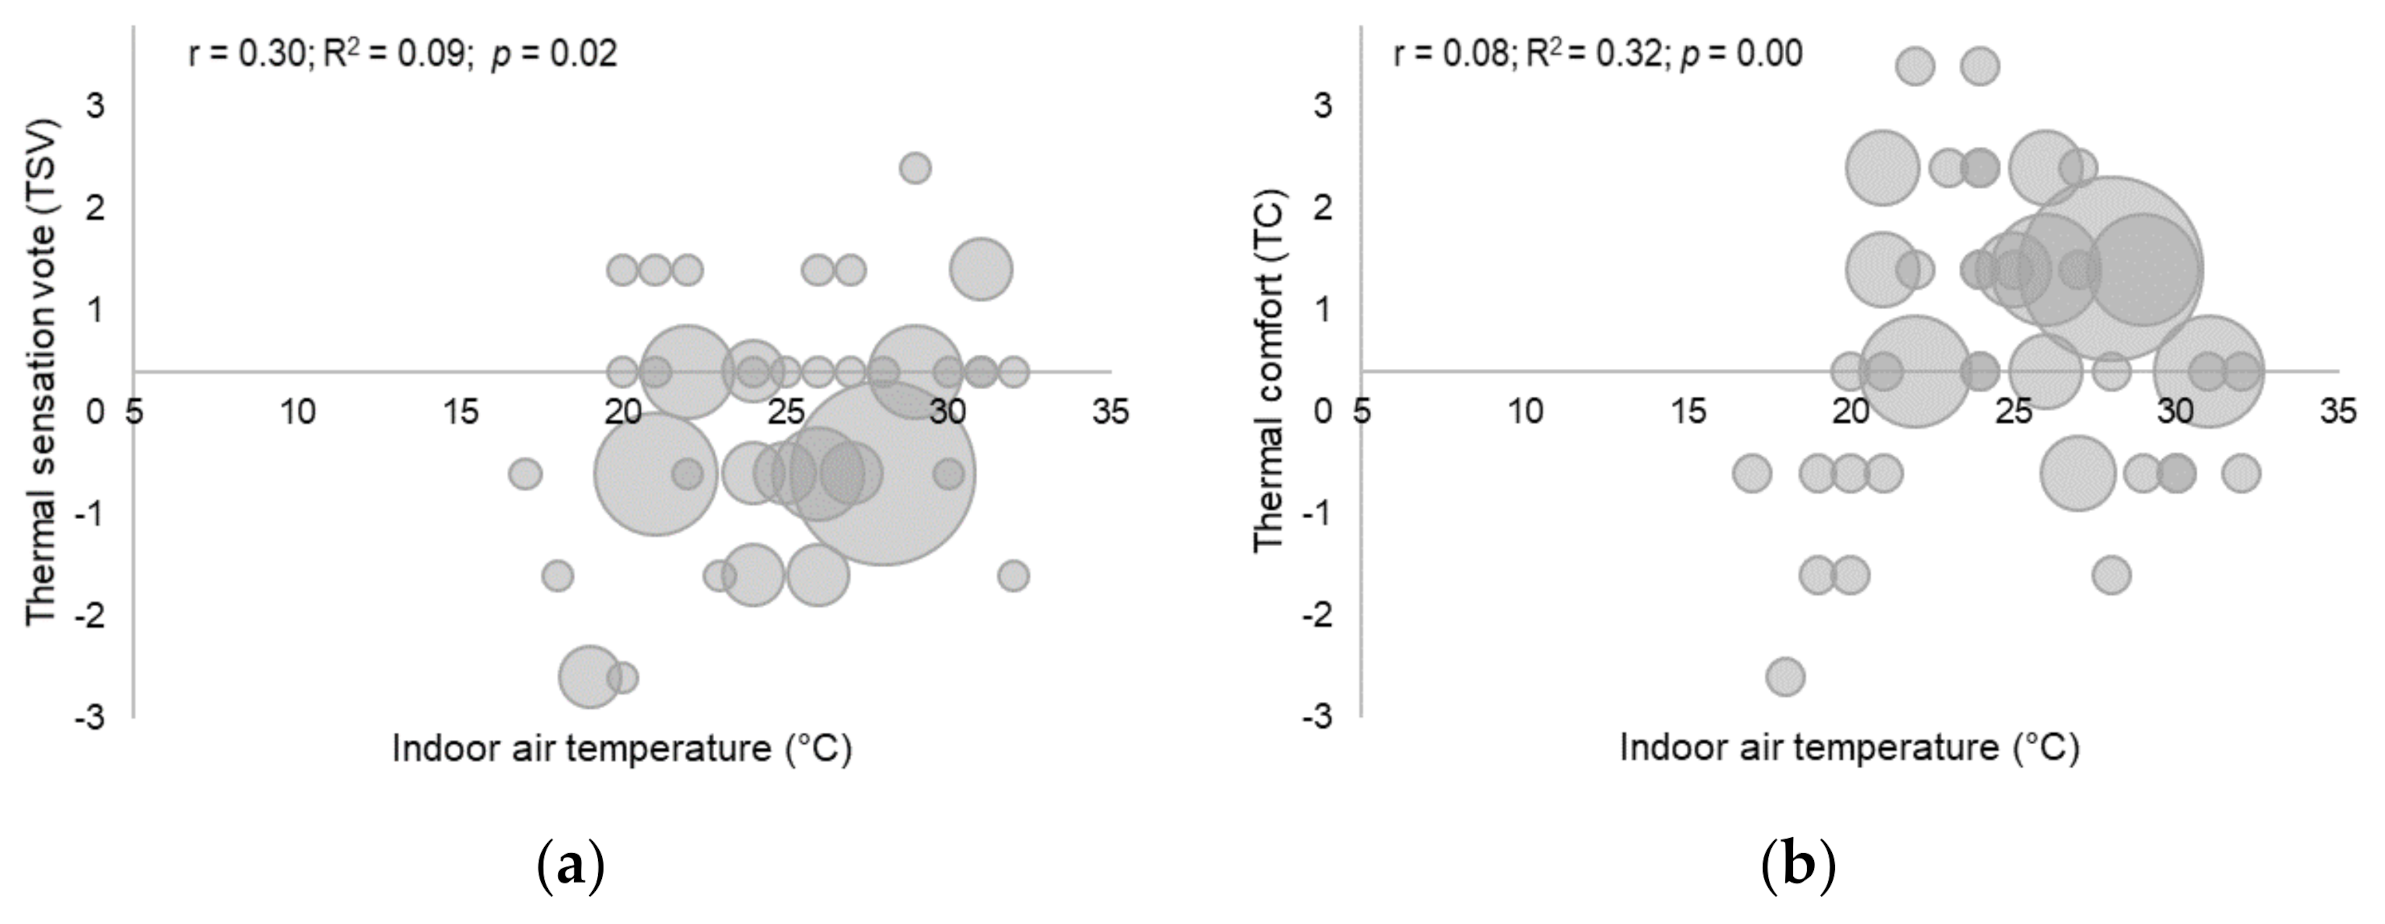
Further, we analyzed the correlation of the two subjective sensations above with indoor air temperature. The indoor air temperature was rounded to 1 °C to calculate the frequency of the correlation between physical and subjective measurements. The frequency and correlation between the indoor air temperature and thermal sensation vote (TSV) and thermal comfort (TC) are shown in Figure 7. There was a significant correlation between Ta and TSV (p < 0.05) and between Ta and TC (p < 0.01). The mean of Ta for TSV of “−1, 0, +1 (extended neutral)” was 28.1 °C during summer and 22.1 °C during winter.
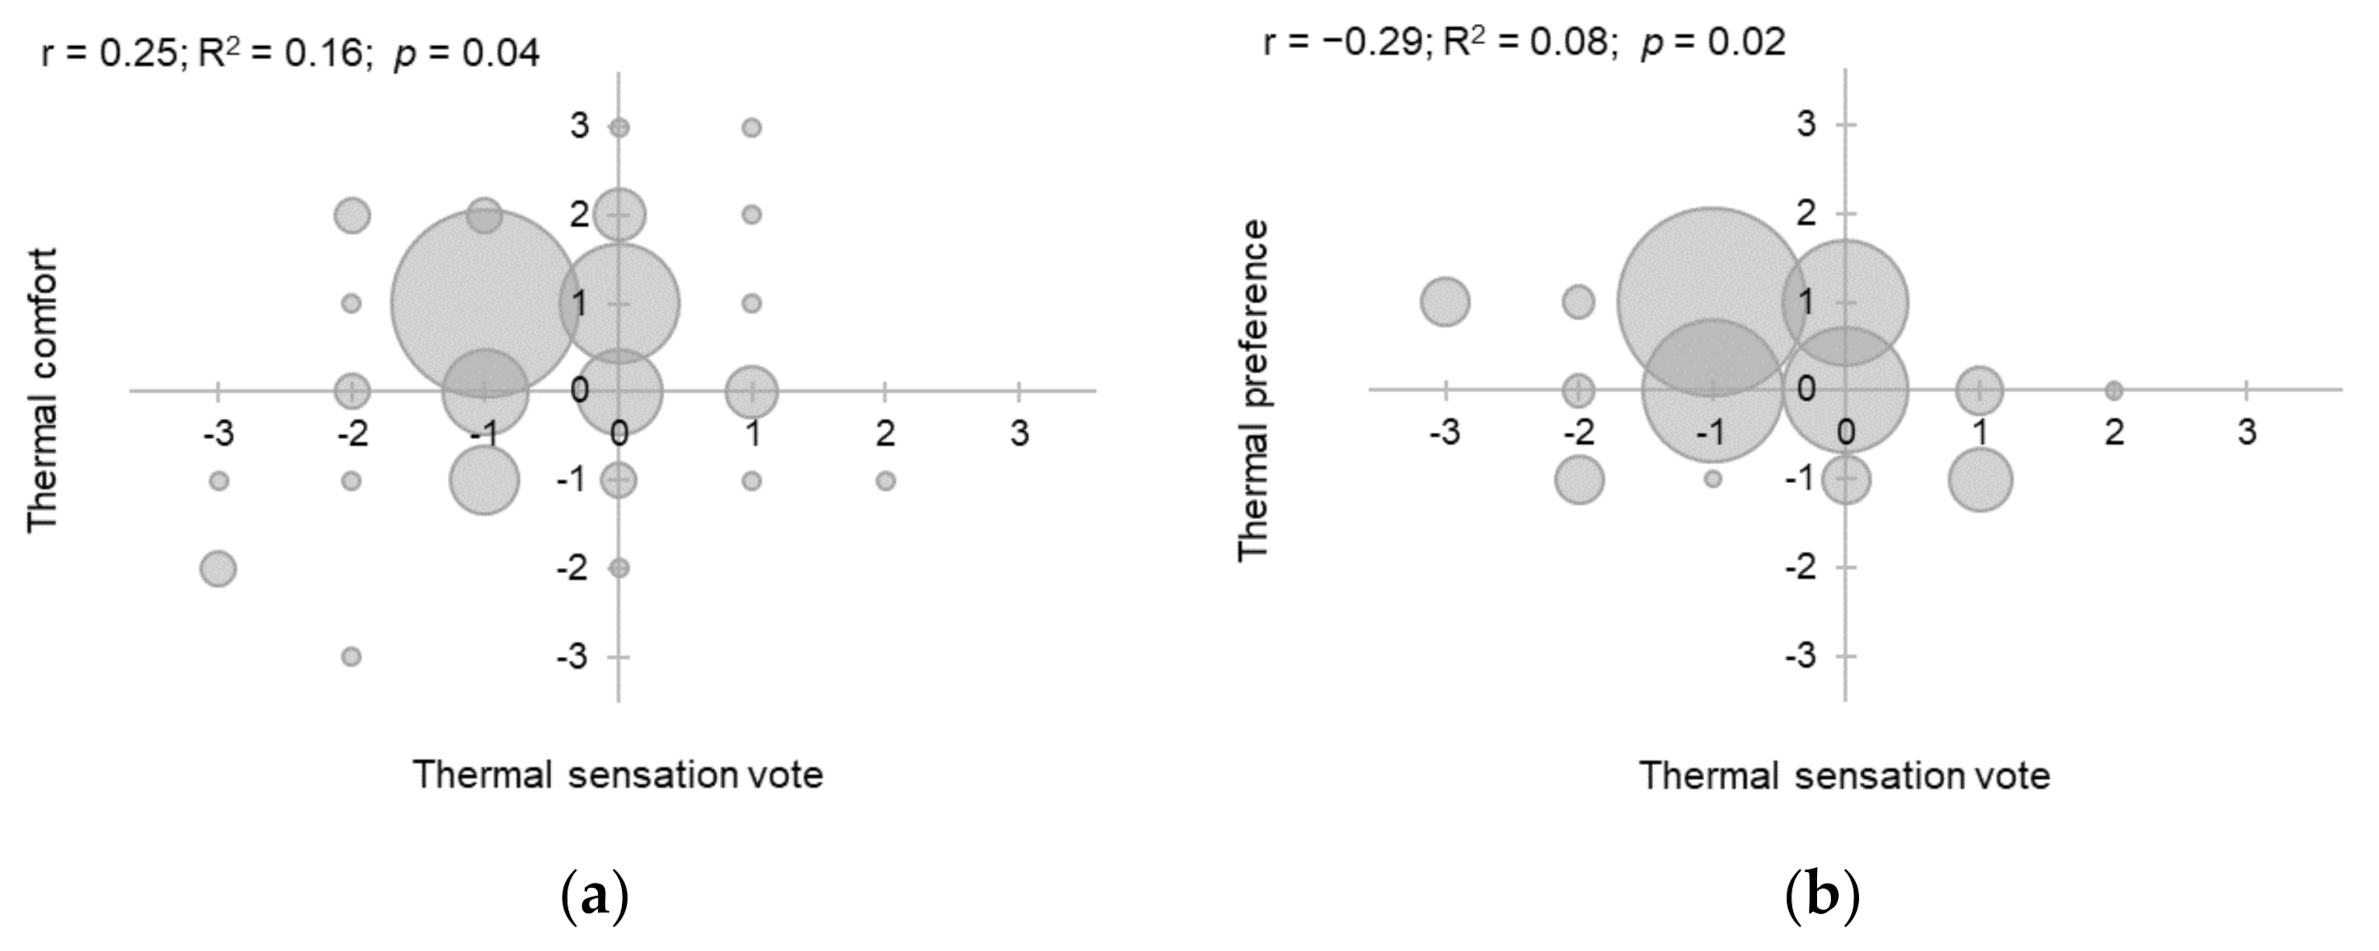
We also analyzed the highest thermal preference (TP) of the indoor environment before sleep. During summer, 41% of the participants felt neutral, and in winter, 63% felt “prefer warm” (see Table 6). The mean temperature for the TP of “0: neutral” was 26.3 °C during summer. In winter, the temperature was 23.1 °C. Furthermore, we analyzed the correlation between TSV, TC, and TP (Figure 8). There was a significant correlation between TSV and TC (p < 0.01) and between TSV and TP (p < 0.05).
3.4.2. Comfort Temperature
Rijal (2014) reported that the linear regression model is inappropriate for predicting the comfort temperature [36]. Thus, we employed the Griffiths method to predict the thermal comfort temperature for each participant from the TSV votes [37] as follows:
where TCg is the comfort temperature using the Griffiths method, Ta indoor air temperature (°C), and α the regression coefficient. In the Griffiths method, we converted the seven-point thermal sensation coefficient, which is often used as 0.25, 0.33, and 0.50 [38,39]. The three regression coefficients of the nine-point thermal sensation used the Honjo et al. conversion: 0.33, 0.44, and 0.67 [40]. With the same method, we calculated TP. Table 7 summarizes the comfort air temperature calculated using the Griffiths method.
TCg = Ta + (0 − TSV)/α,
3.5. Correlation of Indoor Thermal Conditions and Sleep Quality
Table 8 summarizes the correlation between the physical parameters (Ta, RH, and AH) and sleep quality parameters (duration on bed, sleep minute, SR, SE, and sleep latency). There was a significant correlation between the relative humidity, duration on the bed, and sleep minutes for the participants both in summer and winter (p < 0.01, p < 0.01, respectively). There was also a significant correlation between the relative humidity and duration on the bed (p < 0.05).
4. Discussion
In this study, we compared the thermal environment where occupants made themselves for sleeping in summer and winter. The sleep quality for the Indonesian students was analyzed by objective measurements and subjective sensations. Because Indonesia is located on the equator, the length of daytime and outdoor air temperature are almost the same in the summer and winter seasons. We investigated whether the Indonesian students could control their ambient thermal environment for sleep in their bedroom and have good sleep quality in winter. The Indonesian students had not experienced a cold climate before going to Japan. Moreover, the people living in Japan are exposed to longer daytime in hot summer and shorter daytime in cold winter. This is the first study to investigate the thermal environment and sleep parameters of foreign students from another climate zone.
The actual range of average Ta and RH in the bedroom was 21–31 °C with 25–65% in the winter and 22–32 °C with 45–85% in the summer, respectively. The average bedroom temperature and relative humidity of participants during summer (22.2 °C and 45%) were statistically higher than those during winter (26.8 °C and 67%). In the winter, the average bedroom temperature of participants was significantly higher than that outdoor temperature. Although the ministry of energy, trade, and industry of Japan recommends an indoor temperature of 20 °C in winter [41], participants still used ACs or heaters while sleeping at night. As natives, the Japanese usually use AC for only a short period before and after sleeping and not continuously while sleeping [32,42]. A previous study on young Japanese in Tsukuba, Japan, for 6 months in one year (2-month interval: February, April, June, August, October, and December) reported that the ambient temperature before going to sleep in December (winter) is 14.5 °C [42] and average bedroom temperature is 10 °C for old persons during winter [32]. High room temperatures set in winter by Indonesians could result in higher energy consumption. Previous studies also reported that developing countries’ residents consume higher energy than those of developed countries [43]. According to Karyono (2000), in Indonesia, ACs consume energy twelve-fold higher than natural ventilation [44].
Moreover, the Japanese use thick feather bedding and long-sleeved pajamas [42]. The Japanese prefer to set up bedsheets (futon, in Japanese) rather than use AC to adjust the bedroom thermal conditions in summer and winter. In summer, the arrangement of bed sheets consists of a mattress and summer blanket (hada kakebuton in Japanese), whereas mattress in winter comprises warmer mattress cover, winter blanket (moufu in Japanese), and blanket (kakebuton in Japanese). In contrast, the Indonesian students in this study turn on the heater or AC while sleeping.
Furthermore, we analyzed the comfort temperature of the participants each season. The comfort temperature for the participants was higher than that in previous studies on the Japanese (Fukuoka (26.1 °C for male, 26.8 °C for female) [21]; Tokyo (26.1 °C) [24]; Osaka (27.6 °C) [45]; Kanto (27.1 °C) [46]) and foreigners (Tokai (24–26.5 °C)) [47]. However, in previous studies, thermal environments under 28.4 °C were acceptable [45], whereas the Indonesian’s comfort temperature was close to the comfort temperature range in previous studies (24–29 °C) conducted in Jakarta [44,48,49,50], Bandung [48], Medan, Surabaya, Makassar [50], and dan Jogja [51]. Thus, in this study, the Indonesian students could accept the Japanese summer. In winter, they felt prefer warm. The average comfort temperature calculated using the Griffith method was higher than that in previous studies on the Japanese Kanto (20.2 °C) [25] and Gifu (18.9 °C) [24]. As foreign students, the comfort temperature of Indonesian students was higher than previous studies conducted in the same city with nonspecific mode (22 °C) [52].
Our results were because Indonesia’s climate is dominantly classified as Af (tropical rainforest), followed by Am (tropical monsoon) and Aw (tropical savanna) with dry winter characteristics. It is generally warm (average air temperature in 2020 was 27.3 °C). Based on this condition, Indonesian students were familiar with the warm weather and inexperienced Toyohashi’s winter conditions (mild). Thus, the Indonesian students continued to use heaters or AC in the bedroom during the night sleeping period. As former residences of a tropical country, Indonesian students may undergo long-term adaptation to the new climate (more than 20 years), which may be a case similar to that of Japanese Brazilians [26]. However, once living in a temperate zone (34°46′9″ N Toyohashi, Japan), they probably need more considerable effort to adapt to a new environment. Not only temperature difference but also daylight time vary with a maximum of 285 min [28]. This seasonal variability might affect sleep quality and daytime performance.
The Indonesian students showed different thermal adaptive actions in summer and winter. In summer, participants showed action in choosing clothes (short sleeves and shorts). However, in selecting blankets, average Indonesian students choose a thick blanket. In winter, some Indonesian students wear short sleeves and shorts. There was probably a response to using AC with heating mode or heater during sleep. Those habits of how to choose the clothing and how to use the AC might influence the indoor temperature, thermal sensation, sleep duration, and SR for the Indonesian students. However, SE and subjective sleep sensation were worse in the winter
For the sleep quality, there was no significant difference between the wake-up time for the Indonesian students and the sunrise time in both summer and winter. The average sleep minute was 311.5 min (72.9 min) in summer and 338.3 min (93.8 min) in winter. This result is slightly different from that of previous studies in that sleep duration in winter was longer than that in summer [8,10,11,12]. The average difference in the current study (around 16 min) is close to that of Suzuki et al. (2019) (11.4 min). Moreover, Suzuki et al. (2019) explained that various factors, including sampling process, climate, ethnicity or race, and culture or behavior, contribute to the difference. The difference in seasonal day lengths between winter and summer could be a major contributing factor to the seasonal sleep duration.
We found that the duration on the bed and SE were significantly different between summer and winter. However, there was no significant difference in sleep minutes and sleep rates between summer and winter. Moreover, there was no difference in the wake-up and sunrise times. From the actigraphy measurement, we conclude that the Indonesian participants’ wake-up time follows sunrise. In sleep subjective sensation, one parameter (clearheaded in the morning) during winter was worse in summer. Although the duration on the bed for the participants during winter was longer than that in summer, the participants experience worse physical conditions and a clearheaded sensation in winter than that in summer. We used three parameters of environmental condition to analyze the correlation with sleep quality. Relative humidity and absolute humidity showed a negative correlation with the duration on the bed and sleep minutes of the participants. The participants had worse quality of sleep and subjective sensation (clearheaded) during the winter season. Meanwhile, sleep can restore mental, physical, and cognitive well-being [53,54]. These seasonal variations may affect not only the sleep quality but also the daytime performance of tropical natives. Thus, this result could have a good correlation with daytime physiology and psychology. Further research is required to determine the correlation between sleep quality and sensation as well as daytime work and cognitive performance.
5. Conclusions
A survey on the TC and sleep quality of Indonesian students in Toyohashi city (Chubu area of Japan) was conducted during summer and winter. The following results were obtained:
- Although the average bedroom air temperature and relative humidity of Indonesian students during winter (22.2 °C and 45% RH) were lower than those during summer (26.8 °C and 67% RH), the bedroom air temperature was still higher than the Japanese government recommendation.
- The average comfort temperature calculated using the Griffiths method was 28.1 °C in summer and 23.5 °C in winter. Although the comfort temperature of Indonesian students living in Japan is within the range of comfort temperature in Indonesia, the comfort temperature of Indonesian students is higher than that in previous studies on Japanese and foreigners.
- The wake-up time of the Indonesian students monitored follows the sunrise time. Thus, the duration on the bed for the Indonesian students in winter was longer than that in summer. However, the SE and subjective sleep sensation of the Indonesian students were worse in winter than in summer.
6. Limitations to the Study
Limitations to the study, including a reduced number of participants, the subjective sensation responses, and different types of air conditioners, should be considered when interpreting the results. The limitations to the present study are as follows:
- Because the survey was planned to be longitudinal, the total number of participants was determined using the G * Power analysis. The total number of Indonesian students at the Toyohashi University of Technology was 29 male students per April 2020. Respondents’ criteria should also be considered (i.e., gender, age (20–35 years old), healthy, no sleep disorders, and willingness to participate). Both considerations resulted in 18 participants in this field study with an actual power of 0.91.
- The subjective sensation is strongly marked by the subjectivity of measures and might differ by instrument (i.e., sleep sensation and actigraphy).
- Ta and RH were measured in the bedroom and calculated using the average thermal monitoring data collected during sleep. The type of air conditioner or natural ventilation system was not identified in detail by the questionnaire. Although different types of air conditioners might influence the fluctuation of Ta and RH during sleep, the standard deviation was not high.
Author Contributions
W.B. and K.T. designed the study and contributed to results interpretation. W.B. collected and analyzed the data and wrote the manuscript. K.T. provided resources and funding supports, reviewed, edited the manuscript, and supervised the research. Both authors have read and agreed to the published version of the manuscript.
Funding
This research received no external funding.
Institutional Review Board Statement
The research involved human participants, which was conducted according to the Helsinki Declaration’s rules 1975 (2013). Prior to conducting the research, the research ethics committee of Toyohashi University of Technology (TUT), Toyohashi, Japan, issued approvals R1-11 and R2-09/2020.6.23.
Informed Consent Statement
All participants agreed to the experimental procedures and the publication of data.
Data Availability Statement
The authors confirm that the data supporting the findings of this study are available within the article. Permission to reproduce material from other sources was not applicable.
Acknowledgments
This field survey was approved and facilitated by Toyohashi University of Technology (TUT), Toyohashi, Japan. We appreciate the help and cooperation of the participants who volunteered for this survey and experiment. We thank the students of the laboratory for their assistance during the experiment.
Conflicts of Interest
The authors declare no conflict of interest.
References
- Fujii, H.; Fukuda, S.; Narumi, D.; Ihara, T.; Watanabe, Y. Fatigue and sleep under large summer temperature differences. Environ. Res. 2015, 138, 17–21. [Google Scholar] [CrossRef]
- Ministry of The Environment of Japan. Survey Work Report on the Environmental Impact of Heat Island Measures. Available online: https://www.env.go.jp/air/report/h21-06/ (accessed on 4 June 2021). (In Japanese)
- González-Hidalgo, G.; Sánchez-Flores, H.; López-Castellanos, G. Prueba de esfuerzo a 44 °C y 80% de humedad. Rev. Medica del IMSS 2011, 49, 487–492. (In Spanish) [Google Scholar]
- Ohayon, M.M.; Partinen, M. Insomnia and global sleep dissatisfaction in Finland. J. Sleep Res. 2002, 11, 339–346. [Google Scholar] [CrossRef] [PubMed]
- Husby, R.; Lingjaerde, O. Prevalence of reported sleeplessness in northern Norway in relation to sex, age and season. Acta Psychiatr. Scand. 1990, 81, 542–547. [Google Scholar] [CrossRef]
- Pallesen, S.; Sivertsen, B.; Nordhus, I.H.; Bjorvatn, B. A 10-year trend of insomnia prevalence in the adult Norwegian population. Sleep Med. 2014, 15, 173–179. [Google Scholar] [CrossRef] [PubMed]
- Rosen, L.N.; Rosenthal, N.E. Seasonal variations in mood and behavior in the general population: A factor-analytic approach. Psychiatry Res. 1991, 38, 271–283. [Google Scholar] [CrossRef]
- Okawa, M.; Shirakawa, S.; Uchiyama, M.; Oguri, M.; Kohsaka, M.; Mishima, K.; Sakamoto, K.; Inoue, H.; Kamei, K.; Takahashi, K. Seasonal variation of mood and behaviour in a healthy middle-aged population in Japan. Acta Psychiatr. Scand. 1996, 94, 211–216. [Google Scholar] [CrossRef]
- Tsuzuki, K.; Sakoi, T.; Sakata, Y. Seasonal variation in ambient thermal environment and sleep of the elderly living in the nursing homes. In Proceedings of the 12th International Conference on Indoor Air Quality and Climate 2011, Austin, TX, USA, 5–10 June 2011; Volume 2, pp. 1215–1217. [Google Scholar]
- Suzuki, M.; Taniguchi, T.; Furihata, R.; Yoshita, K.; Arai, Y.; Yoshiike, N.; Uchiyama, M. Seasonal changes in sleep duration and sleep problems: A prospective study in Japanese community residents. PLoS ONE 2019, 14, e0215345. [Google Scholar] [CrossRef] [PubMed]
- Volkov, J.; Rohan, K.J.; Yousufi, S.M.; Nguyen, M.C.; Jackson, M.A.; Thrower, C.M.; Stiller, J.W.; Postolache, T.T. Seasonal changes in sleep duration in African American and African college students living in Washington, D.C. Sci. World J. 2007, 7, 880–887. [Google Scholar] [CrossRef] [PubMed] [Green Version]
- Pallesen, S.; Nordhus, I.H.; Nielsen, G.H.; Havik, O.E.; Kvale, G.; Johnsen, B.H.; Skjotskift, S. Prevalence of insomnia in the adult Norwegian population. Sleep 2001, 24, 771–779. [Google Scholar]
- Wehr, T.A. In short photoperiods, human sleep is biphasic. J. Sleep Res. 1992, 1, 103–107. [Google Scholar] [CrossRef]
- Kume, Y.; Makabe, S.; Singha-Dong, N.; Vajamun, P.; Apikomonkon, H.; Griffiths, J. Seasonal effects on the sleep–wake cycle, the rest–activity rhythm and quality of life for Japanese and Thai older people. Chronobiol. Int. 2017, 34, 1377–1387. [Google Scholar] [CrossRef]
- Hashizaki, M.; Nakajima, H.; Shiga, T.; Tsutsumi, M.; Kume, K. A longitudinal large-scale objective sleep data analysis revealed a seasonal sleep variation in the Japanese population. Chronobiol. Int. 2018, 35, 933–945. [Google Scholar] [CrossRef] [PubMed] [Green Version]
- Zheng, G.; Li, K.; Wang, Y. The effects of high-temperature weather on human sleep quality and appetite. Int. J. Environ. Res. Public Health 2019, 16, 270. [Google Scholar] [CrossRef] [Green Version]
- Van Loenhout, J.A.F.; le Grand, A.; Duijm, F.; Greven, F.; Vink, N.M.; Hoek, G.; Zuurbier, M. The effect of high indoor temperatures on self-perceived health of elderly persons. Environ. Res. 2016, 146, 27–34. [Google Scholar] [CrossRef]
- Nguyen, J.L.; Schwartz, J.; Dockery, D.W. The relationship between indoor and outdoor temperature, apparent temperature, relative humidity, and absolute humidity. Indoor Air 2014, 24, 103–112. [Google Scholar] [CrossRef] [Green Version]
- Havenith, G.; Griggs, K.; Qiu, Y.; Dorman, L.; Kulasekaran, V.; Hodder, S. Higher comfort temperature preferences for anthropometrically matched Chinese and Japanese versus white-western-middle-European individuals using a personal comfort/cooling system. Build. Environ. 2020, 183, 107162. [Google Scholar] [CrossRef]
- Damiati, S.A.; Zaki, S.A.; Rijal, H.B.; Wonorahardjo, S. Field study on adaptive thermal comfort in office buildings in Malaysia, Indonesia, Singapore, and Japan during hot and humid season. Build. Environ. 2016, 109, 208–223. [Google Scholar] [CrossRef]
- Mustapa, M.S.; Zaki, S.A.; Rijal, H.B.; Hagishima, A.; Ali, M.S.M. Thermal comfort and occupant adaptive behaviour in Japanese university buildings with free running and cooling mode offices during summer. Build. Environ. 2016, 105, 332–342. [Google Scholar] [CrossRef]
- Rijal, H.B.; Humphreys, M.A.; Nicol, J.F. Adaptive model and the adaptive mechanisms for thermal comfort in Japanese dwellings. Energy Build. 2019, 202, 109371. [Google Scholar] [CrossRef]
- Fantozzi, F.; Lamberti, G.; Leccese, F.; Salvadori, G. The Indoor Thermal Environment in Fencing Halls: Assessment of the Environmental Conditions Through an Objective and Subjective Approach. In Advances in Intelligent Systems and Computing; Janusz, K., Ed.; Springer: Berlin/Heidelberg, Germany, 2020; Volume 1215, pp. 223–229. [Google Scholar]
- Rijal, H.B.; Honjo, M.; Kobayashi, R.; Nakaya, T. Investigation of comfort temperature, adaptive model and the window-opening behaviour in Japanese houses. Archit. Sci. Rev. 2013, 56, 54–69. [Google Scholar] [CrossRef]
- Rijal, H.B.; Humphreys, M.A.; Nicol, F. Study on adaptive model. Part 3. Development of the adaptive model for thermal comfort in Japanese houses. Anu. Meet. Archit. Inst. Jpn. 2014, 41201, 403–406. [Google Scholar]
- Katsuura, T.; Tachibana, M.E.; Lee, C.; Okada, A.; Kikuchi, Y. Comparative studies on thermoregulatory responses to heat between Japanese Brazilians and Japanese. Physiol. Anthropol. 1992, 11, 105–111. [Google Scholar] [CrossRef]
- Kottek, M.; Grieser, J.; Beck, C.; Rudolf, B.; Rubel, F. World map of the Köppen-Geiger climate classification updated. Meteorol. Z. 2006, 15, 259–263. [Google Scholar] [CrossRef]
- Japan Meteorology Agency. Tables of Monthly Climate Statistics. Available online: http://www.data.jma.go.jp/obd/stats/data/en/smp/index.html (accessed on 20 January 2020).
- Cole, R.J.; Kripke, D.F.; Gruen, W.; Mullaney, D.J.; Gillin, J.C. Automatic Sleep/Wake Identification From Wrist Activity. Sleep 1992, 15, 461–469. [Google Scholar] [CrossRef]
- Wallace, L.A.; Emmerich, S.J.; Howard-Reed, C. Continuous measurements of air change rates in an occupied house for 1 year: The effect of temperature, wind, fans, and windows. J. Expo. Anal. Environ. Epidemiol. 2002, 12, 296–306. [Google Scholar] [CrossRef] [PubMed] [Green Version]
- Hibino, Y.; Hokoi, S.; Yoshida, K.; Takada, S.; Nakajima, M.; Yamate, M. Thermal physiological response to local heating and cooling during sleep. Front. Archit. Res. 2012, 1, 51–57. [Google Scholar] [CrossRef] [Green Version]
- Tsuzuki, K.; Morito, N.; Nishimiya, H. Sleep quality and air conditioner use. Extrem. Physiol. Med. 2015, 4, A129. [Google Scholar] [CrossRef] [Green Version]
- Okamoto-Mizuno, K.; Tsuzuki, K.; Ohshiro, Y.; Mizuno, K. Effects of an electric blanket on sleep stages and body temperature in young men. Ergonomics 2005, 48, 749–757. [Google Scholar] [CrossRef] [PubMed]
- Okamoto-Mizuno, K.; Tsuzuki, K. Effects of season on sleep and skin temperature in the elderly. Int. J. Biometeorol. 2010, 54, 401–409. [Google Scholar] [CrossRef] [PubMed]
- Shahid, A.; Wilkinson, K.; Marcu, S.; Shapiro, C.M. St. Mary’s Hospital Sleep Questionnaire. In STOP, THAT and One Hundred Other Sleep Scales; Shahid, A., Wilkinson, K., Marcu, S., Shapiro, C.M., Eds.; Springer: New York, NY, USA, 2012; pp. 363–365. ISBN 978-1-4419-9893-4. [Google Scholar]
- Rijal, H. Investigation of Comfort Temperature and Occupant Behavior in Japanese Houses during the Hot and Humid Season. Buildings 2014, 4, 437–452. [Google Scholar] [CrossRef]
- Griffiths, I.D. Solar Energy Applications to Buildings and Solar Radiation Data; Steemers, T.C., Ed.; Kluwer Academic Publisher: AH Dordrecht, The Netherlands, 1988; Volume 40, pp. 110–114. [Google Scholar]
- Rijal, H.; Tuohy, P.; Humphreys, M.; Nicol, J.; Samuel, A.; Raja, I.; Clarke, J. Development of adaptive algorithms for the operation of windows, fans, and doors to predict thermal comfort and energy use in Pakistani buildings. Am. Soc. Heat. Refrig. Air Cond. Eng. Trans. 2008, 114, 555–573. [Google Scholar]
- Humphreys, M.A.; Rijal, H.B.; Nicol, J.F. Updating the adaptive relation between climate and comfort indoors; new insights and an extended database. Build. Environ. 2013, 63, 40–55. [Google Scholar] [CrossRef]
- Honjo, M.; Rijal, H.B.; Kobayashi, R.; Nakaya, T. Investigation of comfort temperature and the adaptive model in Japanese houses. In Proceedings of the 7th Windsor Conference: The Changing Context of Comfort in an Unpredictable World Cumberland Lodge, Windsor, UK, 12–15 April 2012. [Google Scholar]
- Ministry of Economy, Trade, and Industry of Japan. Summer Energy Conservation Measures. Available online: https://www.meti.go.jp/english/press/2017/0529_003.html (accessed on 25 April 2021). (In Japanese)
- Tsuzuki, K.; Sakoi, T.; Mori, I.; Mizuno, T. Effects of seasonal thermal environment on young people’s sleep and thermal comfort. In Proceedings of the 2014 Architectural Institute of Japan Conference (Kinki), Kobe, Japan, 12–14 September 2014; pp. 311–312. (In Japanese). [Google Scholar]
- Kwong, Q.J.; Adam, N.M.; Sahari, B.B. Thermal comfort assessment and potential for energy efficiency enhancement in modern tropical buildings: A review. Energy Build. 2014, 68, 547–557. [Google Scholar] [CrossRef]
- Karyono, T.H. Report on thermal comfort and building energy studies in Jakarta—Indonesia. Build. Environ. 2000, 35, 77–90. [Google Scholar] [CrossRef]
- Nakaya, T.; Matsubara, N.; Kurazumi, Y. Use of occupant behaviour to control the indoor climate in Japanese residences. In Proceedings of the Air Conditioning and the Low Carbon Cooling Challenge—Windsor 2008 Conference, London, UK, 27–29 July 2008. [Google Scholar]
- Rijal, H.B.; Humphreys, M.; Nicol, F. Adaptive thermal comfort in Japanese houses during the summer season: Behavioral Adaptation and the Effect of Humidity. Buildings 2015, 5, 1037–1054. [Google Scholar] [CrossRef]
- Draganova, V.Y.; Yokose, H.; Tsuzuki, K.; Nabeshima, Y. Field study on nationality differences in adaptive thermal comfort of university students in dormitories during summer in Japan. Atmosphere 2021, 12, 566. [Google Scholar] [CrossRef]
- Karyono, T.H. Thermal comfort study and the potential of energy saving for cooling in Bandung, Indonesia. In Proceedings of the 2nd Malay Architecture & 8th Sustainable Environmental Architecture, Surabaya, Indonesia, 23–24 August 2007; pp. 1–11. [Google Scholar]
- Karyono, T.H. Predicting comfort temperature in Indonesia, an initial step to reduce cooling energy consumption. Buildings 2015, 5, 802–813. [Google Scholar] [CrossRef] [Green Version]
- Alfata, M.N.F.; Sujatmiko, W.; Widyahantari, R. Thermal Comfort Study in the Office Buildings in Medan, Jakarta, Surabaya and Makassar; Final Report of Innovation Research: The Effect of Air Movement on Thermal Comfort in Some Office Buildings in Some Big Cities in Indonesia; Jakarta, Indonesia. Unpublished annual report. 2012. [Google Scholar]
- Feriadi, H.; Wong, N.H. Thermal comfort for naturally ventilated houses in Indonesia. Energy Build. 2004, 36, 614–626. [Google Scholar] [CrossRef]
- Draganova, V.; Tsuzuki, K.; Nabeshima, Y. Field Study on Nationality Differences in Thermal Comfort of University Students in Dormitories during Winter in Japan. Buildings 2019, 9, 213. [Google Scholar] [CrossRef] [Green Version]
- Vyazovskiy, V.V.; Delogu, A. NREM and REM sleep: Complementary roles in recovery after wakefulness. Neuroscientist 2014, 20, 203–219. [Google Scholar] [CrossRef] [PubMed]
- Hirshkowitz, M.; Whiton, K.; Albert, S.M.; Alessi, C.; Bruni, O.; DonCarlos, L.; Hazen, N.; Herman, J.; Katz, E.S.; Kheirandish-Gozal, L.; et al. National sleep foundation’s sleep time duration recommendations: Methodology and results summary. Sleep Health 2015, 1, 40–43. [Google Scholar] [CrossRef] [PubMed]
Figure 1.
Participants’ house types: (a) university dormitory, (b) private apartment, and (c) public apartment.
Figure 1.
Participants’ house types: (a) university dormitory, (b) private apartment, and (c) public apartment.

Figure 2.
Experimental procedure.

Figure 3.
Average bedroom air temperature and relative humidity during sleep by the time; Abbreviation: Ta, indoor air temperature, RH, indoor relative humidity.
Figure 3.
Average bedroom air temperature and relative humidity during sleep by the time; Abbreviation: Ta, indoor air temperature, RH, indoor relative humidity.

Figure 4.
Frequency distribution of the (a) indoor air temperature and (b) relative humidity; Abbreviation: Com., cumulative.
Figure 4.
Frequency distribution of the (a) indoor air temperature and (b) relative humidity; Abbreviation: Com., cumulative.

Figure 5.
Physical conditions sensation during summer and winter: (a) physical condition, (b) current sleepiness, and (c) mental feeling; Significancy: * p < 0.1, ** p < 0.05.
Figure 5.
Physical conditions sensation during summer and winter: (a) physical condition, (b) current sleepiness, and (c) mental feeling; Significancy: * p < 0.1, ** p < 0.05.

Figure 6.
Sleep experience based on SMH questionnaire: (a) wellness, (b) clearheadedness, and (c) sleep-depth; Significancy: ** p < 0.05.
Figure 6.
Sleep experience based on SMH questionnaire: (a) wellness, (b) clearheadedness, and (c) sleep-depth; Significancy: ** p < 0.05.

Figure 7.
Correlation between (a) indoor air temperature and thermal sensation, and (b) indoor air temperature and thermal comfort.
Figure 7.
Correlation between (a) indoor air temperature and thermal sensation, and (b) indoor air temperature and thermal comfort.

Figure 8.
Correlation between: (a) thermal sensation and thermal comfort, and (b) thermal sensation and thermal preference.
Figure 8.
Correlation between: (a) thermal sensation and thermal comfort, and (b) thermal sensation and thermal preference.


Table 1.
Types of instruments and parameters.
| Type of Instruments | Parameter | Range (Accuracy) |
|---|---|---|
| TR-74Ui | air temperature (Ta) relative humidity (RH) | 0 °C–55 °C (±0.5 °C) 10–95% (±5%) |
| Micro-mini Actigraphy | duration on bed (DB) sleep duration (SD) sleep rate (SR) sleep efficiency (SE) | / |
Table 2.
Scale of thermal comfort, preference, and satisfaction.
| Scale | Thermal Comfort | Thermal Preference | Thermal Satisfaction |
|---|---|---|---|
| 3 | Very comfortable | ||
| 2 | Comfortable | Satisfied | |
| 1 | Slightly comfortable | Prefer warmer | Slightly satisfied |
| 0 | Neutral | Prefer neutral | Neutral |
| −1 | Slightly uncomfortable | Prefer cooler | Slightly unsatisfied |
| −2 | Uncomfortable | Unsatisfied | |
| −3 | Very uncomfortable |
Table 3.
Average indoor thermal environment of participant’s bedroom and outdoor thermal environment.
Table 3.
Average indoor thermal environment of participant’s bedroom and outdoor thermal environment.
| Summer (n = 32) | Winter (n = 27) | Significancy | |
|---|---|---|---|
| Bedroom Ta (°C) | 26.8 ± 2.2 | 22.2 ± 3.7 | p < 0.01 |
| Bedroom RH (%) | 67 ± 12 | 45 ± 12 | p < 0.01 |
| Bedroom AH (g/m3) | 17.2 ± 4.3 | 8.9 ± 3.5 | p < 0.01 |
| Clothing insulation | 0.2 ± 0.1 | 0.5 ± 0.2 | p < 0.01 |
| Bedding insulation | 2.6 ± 1.9 | 3.1 ± 1.2 | p = 0.23 |
Abbreviations: Ta, indoor air temperature; RH, indoor relative humidity; AH, indoor absolute humidity; n, number of measurements.
Table 4.
Sleep parameters.
| Parameters | Summer (n = 32) | Winter (n = 27) | |||
|---|---|---|---|---|---|
| Mean | SD | Mean | SD | Sig. | |
| Duration on bed (min) | 361.9 | 62.1 | 406.1 | 89.7 | p < 0.05 |
| Sleep minutes (min) | 311.5 | 72.9 | 338.3 | 93.8 | p = 0.23 |
| Sleep rate (%) | 85.6 | 10.3 | 82.7 | 11.7 | p = 0.32 |
| Sleep efficiency (%) | 92.4 | 8.5 | 88.5 | 9.1 | p < 0.05 |
| Sleep latency (min) | 25.4 | 24.7 | 24.7 | 31.4 | p = 0.92 |
Abbreviation: n, number of measurements, SD, standard deviation.
Table 5.
Percentage of thermal sensation and comfort in summer and winter.
| Thermal Sensation | Thermal Comfort | |||||
|---|---|---|---|---|---|---|
| Scale | Summer | Winter | Scale | Summer | Winter | |
| 3 | Hot | 0% | 0% | Very comfortable | 0% | 7% |
| 2 | Warm | 0% | 4% | Comfortable | 16% | 11% |
| 1 | Slightly warm | 13% | 11% | Slightly comfortable | 47% | 19% |
| 0 | Neutral | 31% | 33% | Neutral | 25% | 26% |
| −1 | Slightly cool | 41% | 33% | Slightly uncomfortable | 9% | 26% |
| −2 | Cool | 16% | 7% | Uncomfortable | 3% | 7% |
| −3 | Cold | 0% | 11% | Very uncomfortable | 0% | 4% |
Table 6.
Percentage of thermal preference and acceptance in summer and winter.
| Thermal Preference | ||
|---|---|---|
| Scale | Summer | Winter |
| Prefer warm | 25% | 63% |
| Neutral | 41% | 37% |
| Prefer cool | 34% | 0% |
Table 7.
Average comfort air temperature calculated using the Griffiths method.
| α | Summer (n = 32) | Winter (n = 27) | |
|---|---|---|---|
| TCg (°C) | 0.33 | 28.6(2.2) | 24.0(4.5) |
| 0.44 | 28.1(1.9) | 23.5(3.9) | |
| 0.67 | 27.7(1.7) | 23.0(3.6) | |
| Avg | 28.1(1.9) | 23.5(4.0) | |
| TPg (°C) | 0.33 | 27.1(2.8) | 20.2(4.3) |
| 0.44 | 27.0(2.4) | 20.7(4.1) | |
| 0.67 | 26.9(2.3) | 21.2(4.0) | |
| Avg | 27.0(2.5) | 20.7(4.1) |
Abbreviation: α, regression coefficient; n, number of measurements; TCg, comfort air temperature by Griffiths; TPg, preference air temperature by Griffiths.
Table 8.
Correlation between physical and sleep quality parameters.
| Season | DB | SM | SR | SE | SL | |
|---|---|---|---|---|---|---|
| T | Summer | 0.10 | 0.05 | −0.07 | 0.02 | 0.12 |
| Winter | 0.23 | 0.21 | 0.07 | 0.07 | 0.02 | |
| All | −0.04 | 0.02 | 0.10 | 0.17 | 0.05 | |
| RH | Summer | −0.25 | −0.19 | −0.01 | −0.17 | −0.29 |
| Winter | * −0.37 | ** −0.40 | −0.26 | −0.18 | 0.11 | |
| All | *** −0.41 | *** −0.33 | −0.01 | 0.02 | −0.05 | |
| AH | Summer | −0.13 | −0.11 | −0.03 | −0.11 | −0.16 |
| Winter | −0.19 | −0.25 | −0.21 | −0.16 | 0.07 | |
| All | ** −0.30 | * −0.22 | 0.04 | 0.08 | −0.02 |
Significancy: * p < 0.1, ** p < 0.05, *** p < 0.01; Statistic represent Pearson r correlation each physical and sleep parameter. Abbreviation: T, bedroom temperature; RH, bedroom relative humidity; DB, duration on bed; SM, sleep minute; SR, sleep rate; SE, sleep efficiency; SL, sleep latency.
Publisher’s Note: MDPI stays neutral with regard to jurisdictional claims in published maps and institutional affiliations. |
© 2021 by the authors. Licensee MDPI, Basel, Switzerland. This article is an open access article distributed under the terms and conditions of the Creative Commons Attribution (CC BY) license (https://creativecommons.org/licenses/by/4.0/).
Share and Cite
MDPI and ACS Style
Budiawan, W.; Tsuzuki, K. Thermal Comfort and Sleep Quality of Indonesian Students Living in Japan during Summer and Winter. Buildings 2021, 11, 326. https://0-doi-org.brum.beds.ac.uk/10.3390/buildings11080326
AMA Style
Budiawan W, Tsuzuki K. Thermal Comfort and Sleep Quality of Indonesian Students Living in Japan during Summer and Winter. Buildings. 2021; 11(8):326. https://0-doi-org.brum.beds.ac.uk/10.3390/buildings11080326
Chicago/Turabian StyleBudiawan, Wiwik, and Kazuyo Tsuzuki. 2021. "Thermal Comfort and Sleep Quality of Indonesian Students Living in Japan during Summer and Winter" Buildings 11, no. 8: 326. https://0-doi-org.brum.beds.ac.uk/10.3390/buildings11080326
Note that from the first issue of 2016, this journal uses article numbers instead of page numbers. See further details here.