
Applied Element Modelling of Warping Effects in Thin-Walled C-Shaped Steel Sections


Department of Science, Technology and Society, University School for Advanced Studies IUSS Pavia, Piazza Della Vittoria 15, 27100 Pavia, Italy
Buildings 2021, 11(8), 328; https://0-doi-org.brum.beds.ac.uk/10.3390/buildings11080328
Submission received: 13 June 2021
/
Revised: 19 July 2021
/
Accepted: 27 July 2021
/
Published: 29 July 2021
(This article belongs to the Special Issue Sustainable and Green Construction Materials: Opportunities for New and Existing Structures)
Abstract
:The Applied Element Method (AEM) is a relatively recent numerical technique, originally conceived for simulating the large displacement nonlinear response of reinforced concrete, masonry and steel structures, and successful applications have been presented by various researchers. Recently, AEM was used to model the mechanical behaviour of steel storage pallet racks, i.e., particular cold-formed steel structures typically employed for storing goods and materials. Such systems are often subjected to peculiar displacements and stresses due to warping effects, which are inherent and often govern their behaviour, increasing the peak strength and ultimate displacement demand. This phenomenon has not been studied through AEM yet; hence, this work investigates the capabilities of AEM in simulating the warping effects in typical steel rack members, i.e., thin-walled C-shaped sections. Preliminary results and comparison against established modelling approaches indicate that AEM can accurately simulate this phenomenon, both in terms of displacements and stresses.
1. Introduction
The modelling and analysis of multiple types of structures have been largely carried out using the Finite Element Method (FEM), a pivotal method, adopted worldwide, to evaluate buildings’ performance before they reach significant damages and the separation of structural elements. Despite its large capabilities, the FEM is not suitable to simulate the response of structures in the case that, for example, a floor fails and hits the underlying slab. Indeed, FEM assumes that nodes and elements have to remain connected to each other; otherwise, singularities in the global stiffness matrix occur. On the contrary, the Discrete Element Method (DEM) is more appropriate in the case of post-failure situations since it permits element separation. However, within a DEM framework, the development of structural models can be a complex task, and high computational efforts are often demanded [1]. Moreover, since generally DEM software is based on explicit numerical methods, the modelling of static or quasi-static simulations is computationally inefficient, requiring dynamic relaxation schemes and suitable calibration of the damping factors [2].
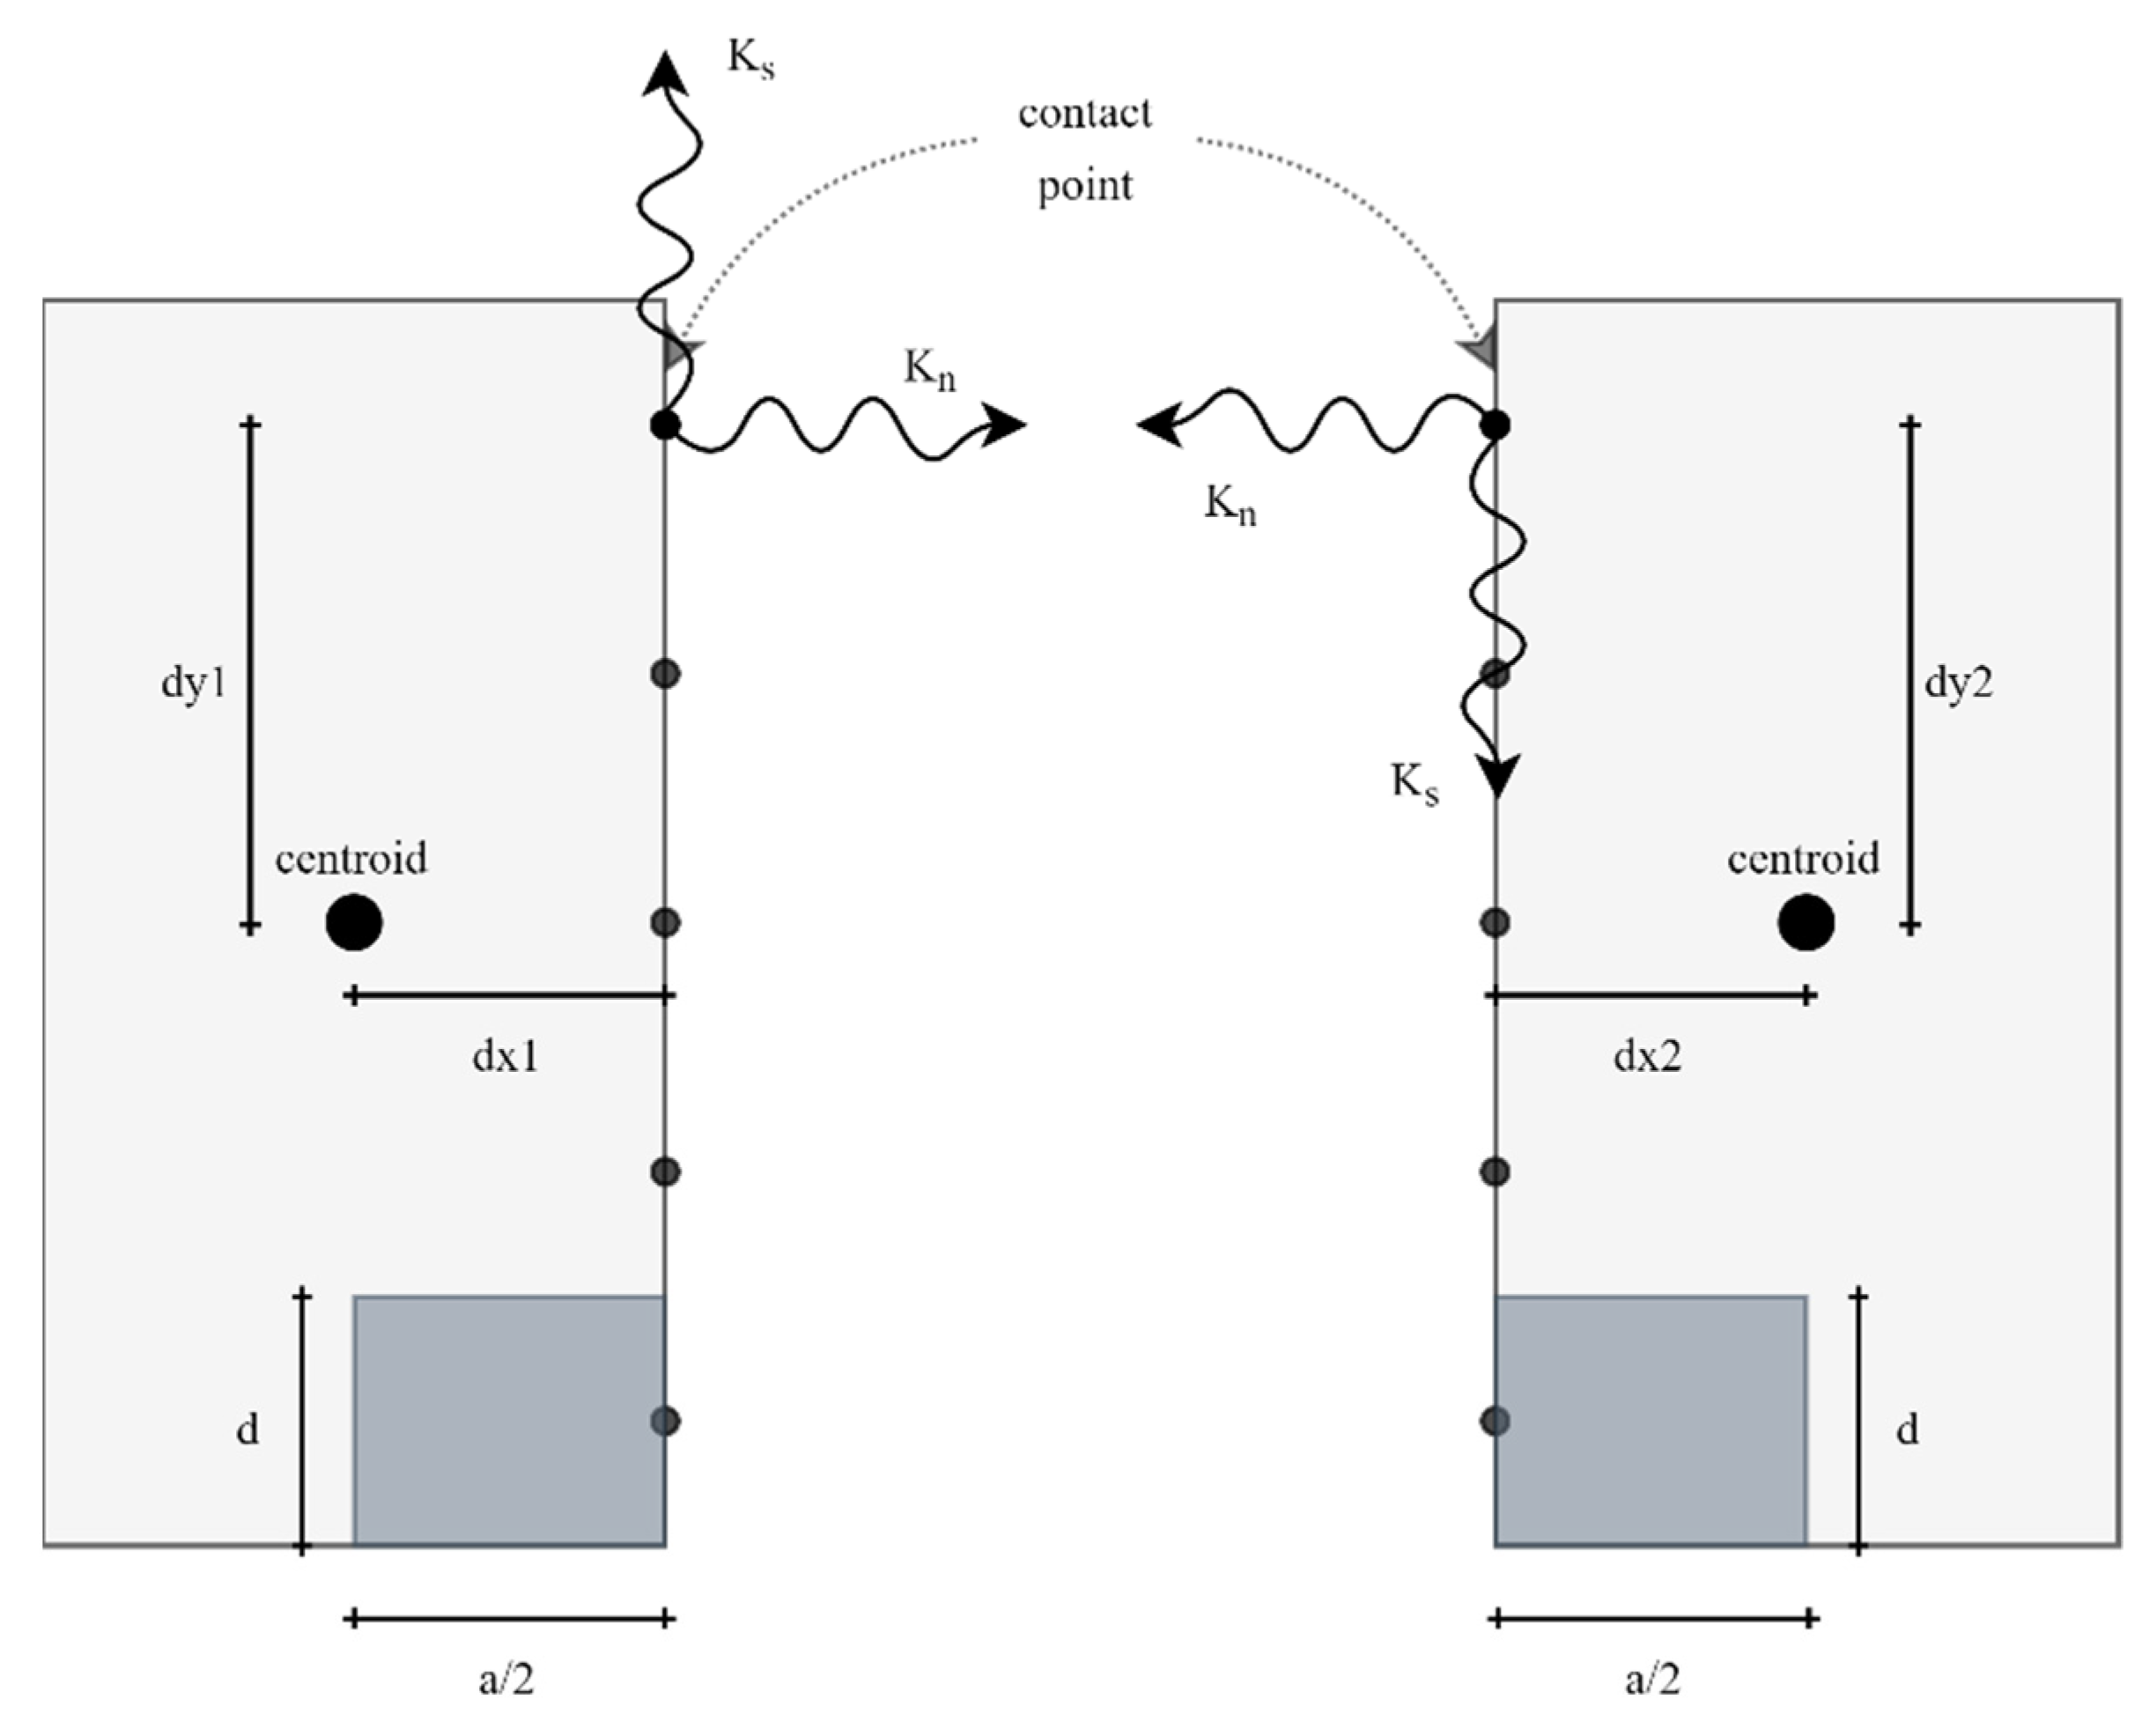
Considering the advantages and shortcomings of the FEM and DEM methods, the Applied Element Method (AEM) was firstly proposed by Meguro and Tagel-Din [3]. This numerical approach aims to provide a tool that is able to perform the assessment and evaluation of buildings’ performance in pre- and post-failure scenarios. AEM combines the best features of both FEM and DEM, providing a new efficient and complete tool for structural analysis. When using the AEM, structures and structural items/components are all modelled as an aggregation of rigid block elements, which are connected by themselves with springs in the normal and tangential directions (Figure 1). The springs simulate the stresses and strains of a certain area of the elements connected, and their stiffness is computed as in Equation (1):
where E and G are the elastic and shear moduli, respectively; d is the distance between the springs; a is the length of the representative area; and t is the thickness of the element.
It should be noted that the degrees of freedom are assumed to be at the centroid of the blocks; thus, as a consequence, the number of springs does not influence the dimension of the global stiffness matrix. Summing up the contribution of each spring and taking into account the relative coordinate of the spring contact point with respect to the centroid, the final element stiffness matrix can be computed. For the sake of simplicity, the element stiffness matrix of a single spring, for the case of two-dimensional (2D) analysis, is reported in Equation (2):
where Kn and Ks are the normal and shear stiffnesses, as per Equation (1), while dx1, dx2, dy1 and dy2 are the distances of the contact points with respect to their relative centroid, as depicted in Figure 1. In the study of Meguro and Tagel-Din [3], the theory and formulation of AEM for small deformation analysis considering the effects of Poisson’s ratio was presented. Further considerations regarding the effect of the number of springs and blocks were also made. Consequently, the AEM was validated for the case of large deformations analyses under dynamic loading conditions [4]. It is worth noting that an AEM formulation does not need a geometric stiffness matrix, entailing a simpler numerical procedure in comparison with the cumbersome one adopted by FEM. Ensuing research studies investigated the accuracy of AEM formulation in the case of reinforced concrete structures with nonlinear constitutive material laws applied at the springs [5,6]. The outcomes demonstrated again the feasibility of AEM since it was possible to accurately estimate the failure behaviour, including crack initiation and propagation, both with monotonic and cyclic loads. Subsequently, a new, improved AEM approach was developed [7,8], namely IAEM (Improved Applied Element Method), where a smaller number of elements in modelling can be applied, saving time and resources.
The accuracy of AEM was verified also in the case of thin plate elements, in which the effect of the Poisson’s ratio plays a key role [9,10]. Other researchers instead [11] introduced an extension for the multi-layered IAEM to model bonded prestressed concrete structures. In addition, a Gaussian-based AEM was also developed in order to obtain a low computational cost and a higher accuracy for progressive collapse analyses [12]. Recent applications of AEM addressed also the seismic behaviour of unreinforced masonry structures [2,13,14,15,16,17,18], and blast loads on masonry [19] and masonry infill walls [20]. The AEM was adopted for several progressive collapse assessments for precast prestressed reinforced concrete beams [21,22] and steel moment frames structures [23,24]. Moreover, simulations for the assessment of failure modes of reinforced concrete walls subjected to monotonic loads [25] were compared with experimental tests.
Another successful application [26,27] was related to the investigation of the potential reason for the Morandi bridge failure, which occurred in Genoa on 14 August 2018, while in [28], the collapse of the Tsuyagawa bridge, damaged by the Tohoku tsunami, was investigated.
The AEM framework was also adopted in research studies focused on the robustness of steel storage pallet racks under accidental loading situations, such as collision with a forklift truck [29]. The outcomes highlighted that the most accurate results were obtained through AEM, if compared with the notional upright removal that is traditionally performed with FEM software.
Even though the AEM was introduced decades ago, several aspects should still be investigated. Considering specifically the AEM application [29] to steel storage pallet racks, analysts may wonder whether all structure-specific aspects are well captured or not in the AEM framework. As can be found in the literature, steel storage pallet racks can suffer greatly from warping [30] and, jointly, second order effects [31,32]; these aspects could be an additional threat for steel storage rack safety since partial collapse mechanisms will be more likely to occur [33], thus increasing further the already complex task of researchers to understand and prevent failures and damages [34]. Although second order effects can be well simulated both with FEM and AEM formulations, warping needs more attention. In the case of FEM, the traditional beam-column element with six degrees of freedom (6DOFs) per node should be replaced with an advanced beam–column element with seven degrees of freedom (7DOFs) per node [30,31,32], in which the seventh DOF represents the warping. The warping effects lead to an overall higher flexibility, measurable with lower critical loads and higher fundamental periods, and also to an increase in the stresses, as can be gathered by the outcomes presented in Bernuzzi et al. [30]. Note that such an increase of stresses produces an additional internal force in the element, namely bimoment. In addition to this, rack uprights are often open cross-sections, in which the distance between the shear centre and the centroid is not negligible; the 7DOFs formulation permits to capture this distance, if any. As highlighted by Bernuzzi et al. [30], neglecting such an aspect can lead to unconservative results in terms of displacements, rotations and stresses. Furthermore, even if steel storage pallet rack members are one of the utmost examples of how impactful warping can be, the theory of thin-walled beams [35] is still general and applicable to any member, such as the commonly adopted steel I-shaped sections.
Albeit that the FEM formulation with 7DOFs is the reference option for rack structures to capture the warping deformations, it cannot help researchers and engineers when investigating the response for particular cases, such as impact loadings, blast loadings and progressive collapse, if the most common implicit solver is adopted. Together with FEM formulations using an explicit solver [36,37,38,39,40,41], AEM, with its features, could be a novel option for investigations in these two research fields. The abovementioned literature [14,21,22,23,24,26,27,28,29,30] highlights the need for further investigations on both aspects (impact loads and warping effects). As a consequence, a formulation that is able to predict reliable results, integrating the two characteristics, would be advantageous. With the above in mind, this paper aims at investigating the actual capabilities of the AEM formulation in capturing warping effects to enable its applicability in the analysis of steel storage pallet racks. To this end, a custom AEM-based C# code capable of performing linear static analysis in a three-dimensional (3D) environment was developed. A representative warping-affected thin-walled C-shaped section was selected as the case study and subjected to a shear load in order to induce warping displacement and bimoment stresses. Finally, the AEM outcomes were compared with those of a FEM software [42] that features both traditional 6DOFs and refined 7DOFs formulations.
2. Description of the Numerical Models
To investigate the effectiveness of the AEM in simulating warping effects, a parametric analysis was performed. In particular, an open C-shaped steel section was selected, varying its web and flanges thickness between 2 mm (Section #1), 4 mm (Section #2) and 8 mm (Section #3). This choice relies upon the fact that, as is well known from the literature, thin-walled open cross-sections are the most prone to exhibiting warping effects. The scope of sequencing the thickness in such a range is to cover a relatively wide part of the market supply for storage racking systems of this particular shape. The shared properties of the C-shaped sections are the height (h), equal to 100 mm and the width (w), equal to 80 mm. The sections are reported in Figure 2, while additional information related to the geometric characteristics is provided in Table 1. For all the models, a value of elastic modulus E = 210000 N/mm2 was assumed. It should be noted that plastic deformations are not considered since the aim of this study is to evaluate the applicability of AEM in capturing warping deformations, which can occur already in the elastic range, rather than computing the actual bearing capacity of the beams under investigation. In addition, thin-walled, open cross-sections often belong to Class 3 or Class 4, according to Eurocode 3 [43]; therefore, plastic deformations cannot be reached, due to the occurrence of local buckling.
As per the structural scheme, a cantilevered beam was selected to maximise the warping effects. A constant shear load of 10 kN was applied to the free end of the beam. It can be noted that in order to apply the load at the centroid of the section, the load was distributed along each block element composing the free end, in which each load was scaled proportionally to its influence area. The direction of the load is the same as the asymmetric axes of the section (i.e., parallel to the web lengthwise); in this way, a coupled flexural–torsional behaviour is expected. Moreover, several beam lengths were used, ranging from 100 mm to 1000 mm.
Furthermore, the parametric study also comprised several numerical discretisation schemes. Firstly, the influence of the refinement of the mesh along the length, i.e., in the longitudinal direction of the beam, was investigated. In this direction, the beam was subdivided into 20, 60, 100, 140 and 180 block elements. As an additional parameter to be investigated, the discretisation along the section was taken and varied as described hereinafter. The web and flanges were subdivided into 10, 20 and 30 block elements. With these modelling approaches, a large number of analyses (450 in total) were performed, providing insight into the numerical modelling discretisation influence for a broad variety of cases. For comparative purposes, the same beams were also modelled with a finite element software [42] capable of performing analyses with both 6DOFs and 7DOFs formulations. Experimental tests could also be added to better appraise the accuracy of the different numerical methods adopted. However, since the 7DOFs formulation is a well-established approach [35,44,45,46] and several experimental full-scale tests on steel storage racks [47,48,49] have confirmed its accuracy, the 7DOFs formulation was taken as the reference method for the numerical investigation proposed in this study.
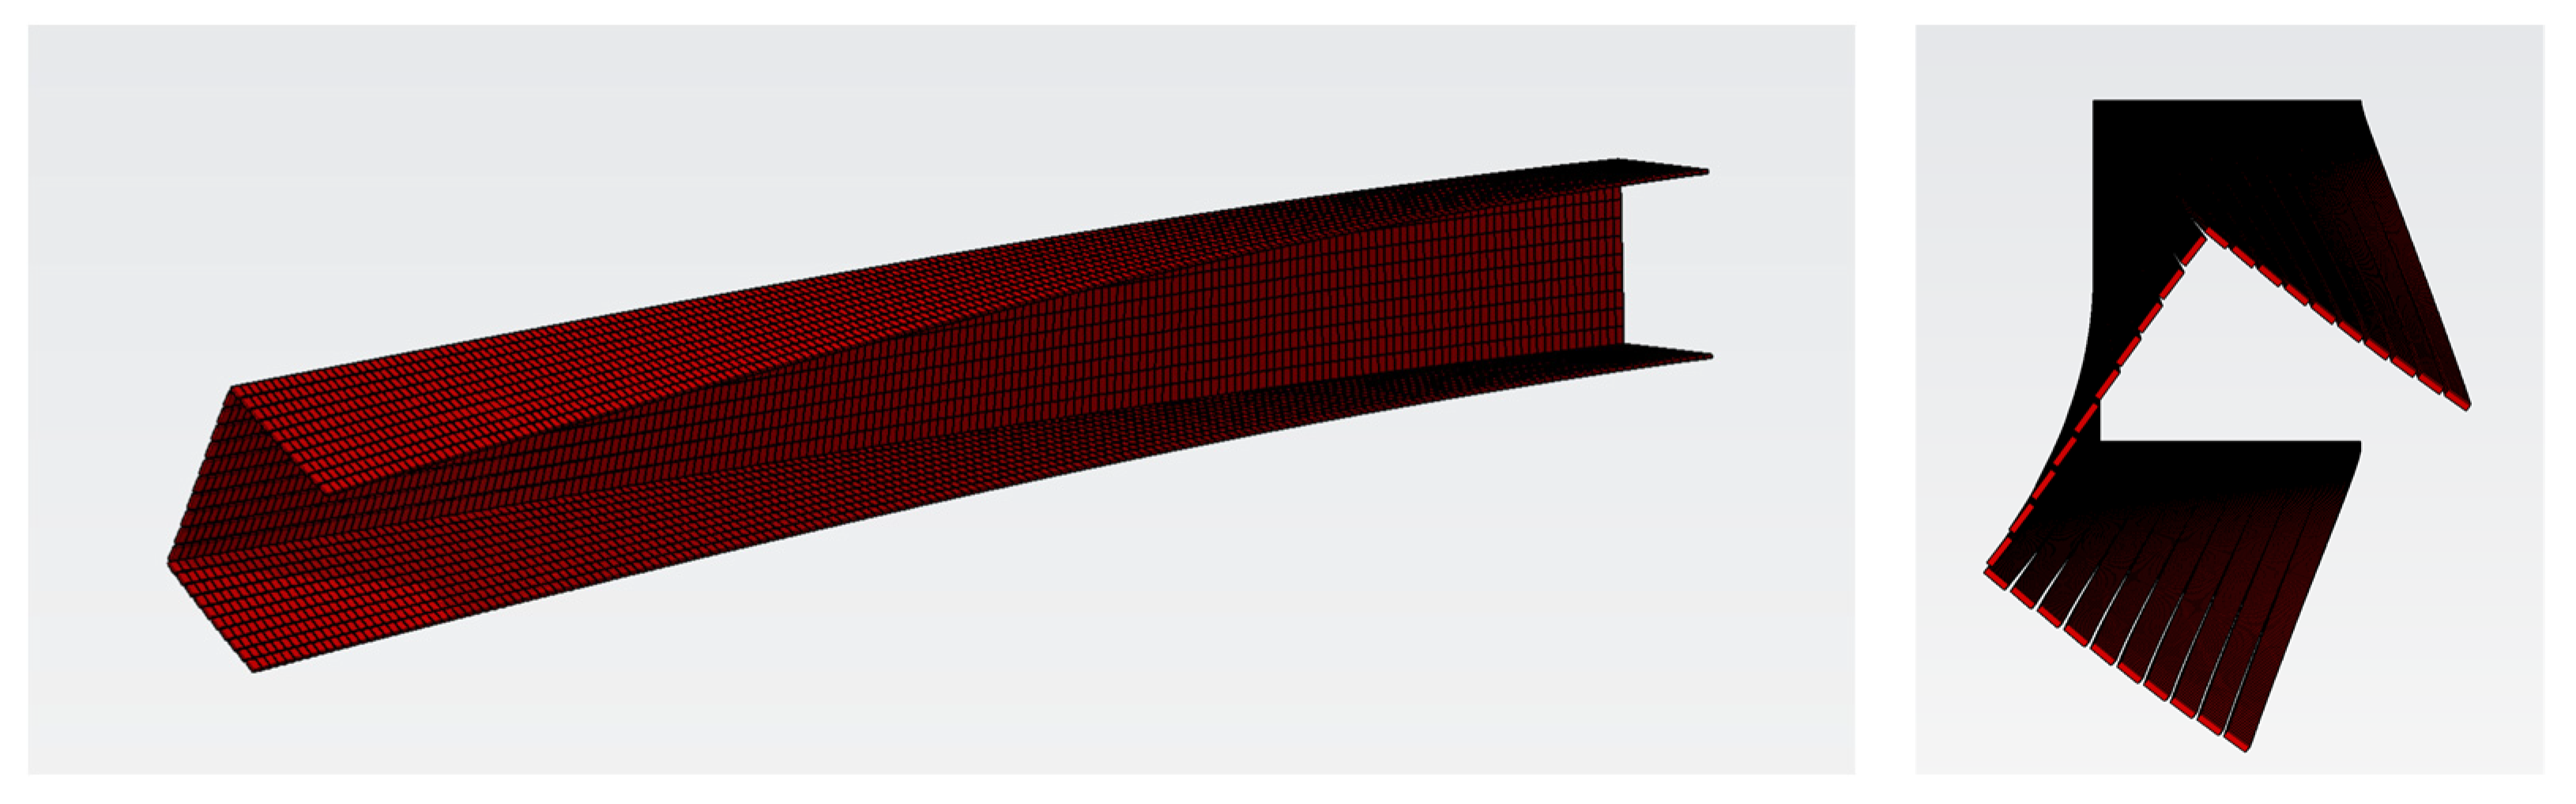
The numerical analyses focused on the evaluation of the vertical displacement of the free end of the beam and the normal stresses, which develop at the fixed end. Indeed, due to the coupling of flexural and torsional behaviour, the free end not only translates but also rotates about the shear centre, increasing consequently, the vertical displacement. As an example, the deformation predicted by adopting the AEM model is represented in Figure 3.
Such a behaviour can be accurately captured with a 7DOFs formulation. On the contrary, a traditional 6DOFs formulation will simulate only the flexural behaviour; therefore, only the translational displacement will be provided. Moreover, as already mentioned, the warping in the section causes additional normal stresses, which lead to the onset of the bimoment internal force. Additionally, in this case, the 6DOFs formulation cannot estimate such effects.
3. Numerical Analyses
As mentioned above, 450 analyses were performed, varying the section thickness, the beam length and the beam and section discretisation. The outcomes are reported in the following subparagraphs in terms of vertical displacement, normal stresses and bimoment.
3.1. Vertical Displacement
The first key parameter for evaluating the AEM efficiency in capturing the warping effect is the vertical displacement of the centroid at the free end of the beam. As C-shaped sections rotate about their shear centre instead of their centroid, when a shear load is applied, a coupled flexural–torsional behaviour is generally observed. The torsional rotation about the shear centre increases the total vertical displacement. Therefore, the outcomes of analyses performed with a 6 and 7DOFs formulations will inevitably be different since the traditional 6DOFs formulation is not able, by definition, to simulate the torsional rotation in a suitable manner. Since the AEM formulation has been broadly validated in terms of flexural displacement, the results herein presented will focus on the estimation of the torsional rotation.
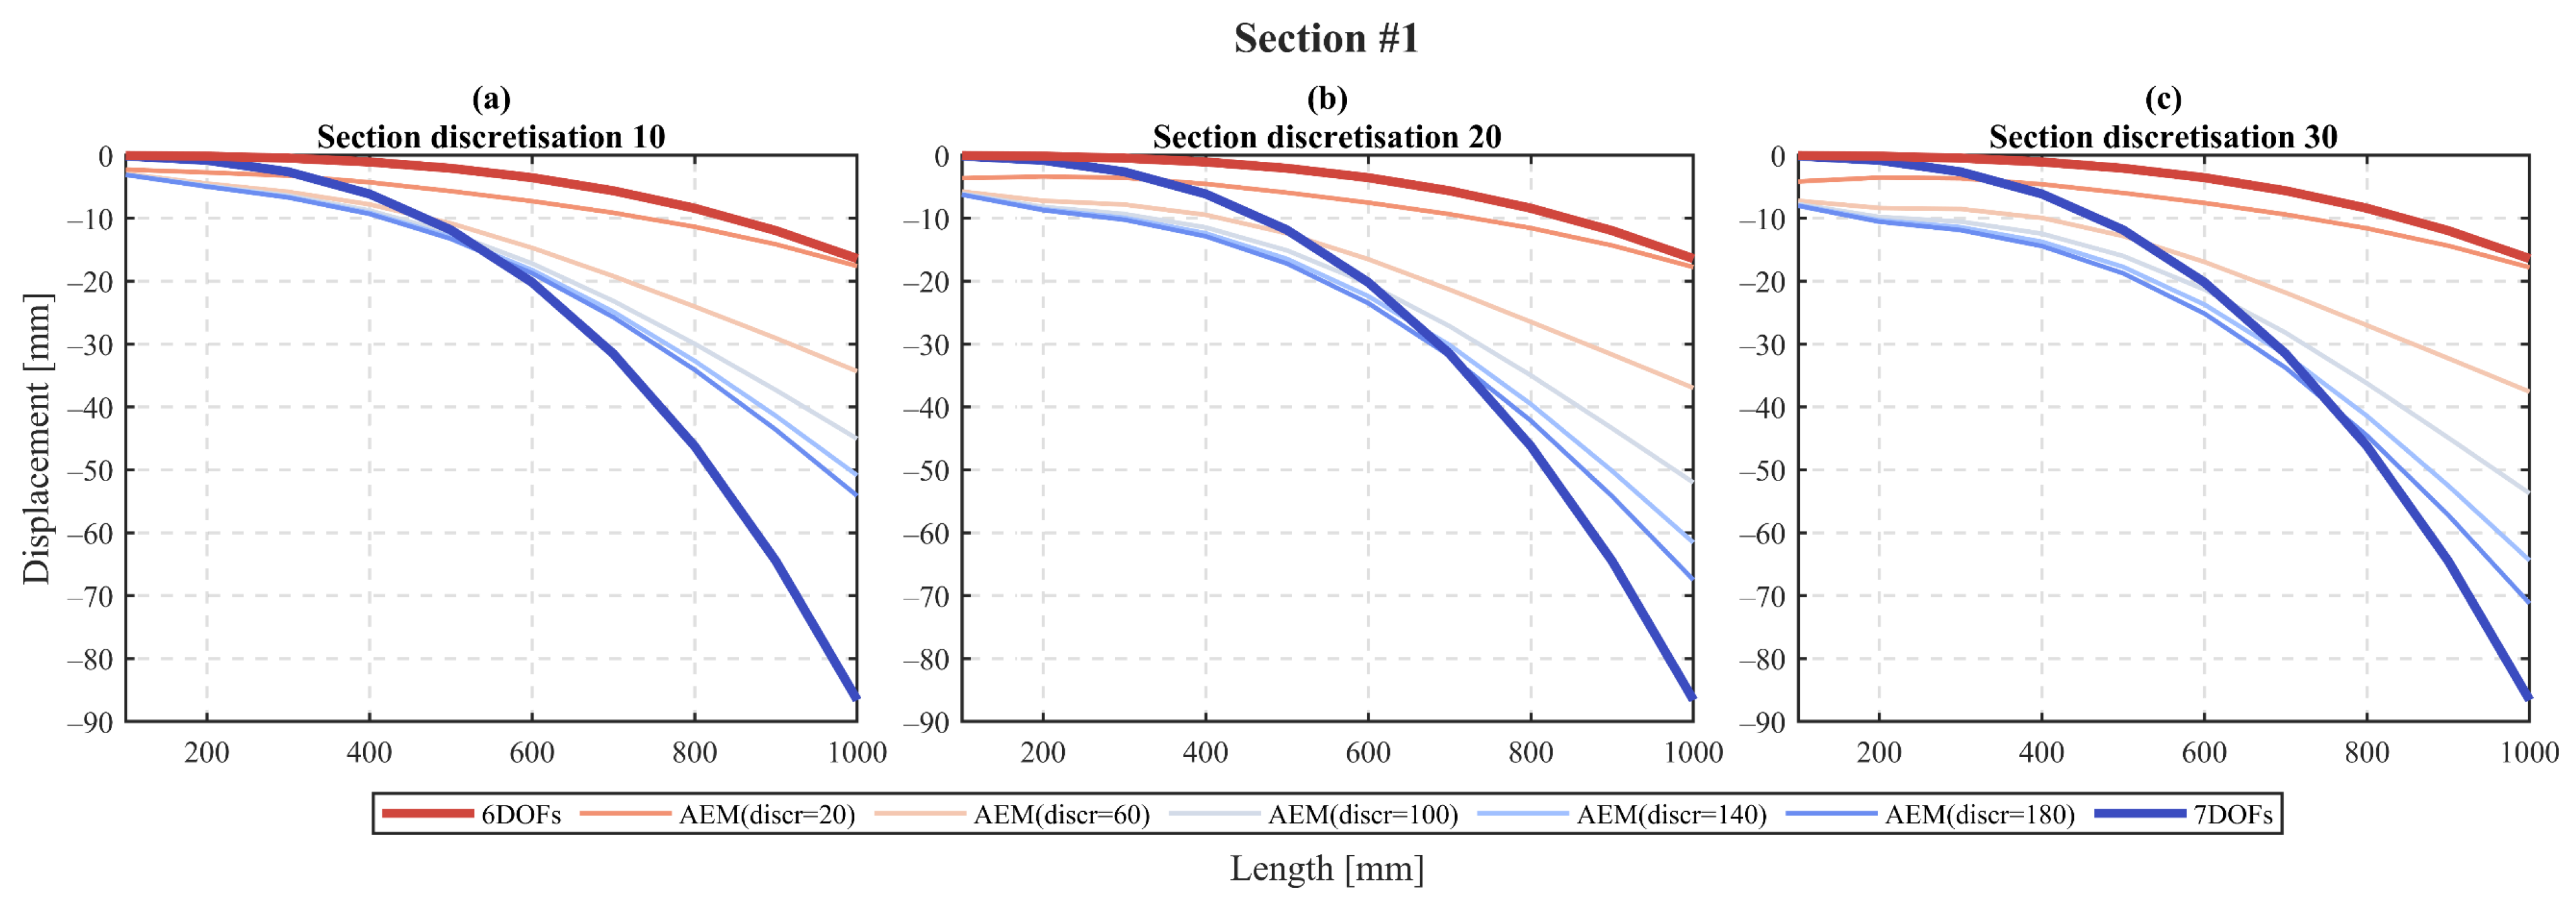
The set of sub-plots presented in Figure 4 shows the vertical displacement of Section #1 (100 × 80 × 2). The presented curves exemplify the obtained displacement when increasing the beam length, from 100 mm to 1000 mm, for the different formulations (6DOFs in thicker red, AEM in colour scale red-to-blue and 7DOFs in thicker blue) and for the different mesh longitudinal discretisation options for the AEM model (as illustrated in the legend).
In Figure 4a, the analysis outcomes are depicted for the section discretisation of 10 block elements for each section part (i.e., web and flanges). As can be seen, when a length of 100 mm is considered, for any longitudinal discretisation level, the AEM formulation provides higher results, i.e., −0.02 mm, −0.1 mm and −3.11 mm for the 6DOFs, 7DOFs and AEM (discr = 180), respectively. Contrastingly, when a length of 1000 mm is taken, the displacements are −16.42 mm, −86.57 mm and −54.14 mm for the 6DOFs, 7DOFs and AEM (discr = 180), showing a stiffer response of the AEM in comparison with the 7DOFs formulation.
Nevertheless, the beneficial effect of a higher longitudinal discretisation can be clearly appraised since the displacement increases from −17.60 mm for the AEM (discr = 20) to −54.14 mm in the case of AEM (discr = 180), both considering a length of 1000 mm. Similar considerations can be made for the counterparts with a section discretisation of 20 (Figure 4b) and 30 (Figure 4c) block elements. However, it should be noted that with a refined section discretisation, the outcomes are closer to the theoretical response (7DOFs) since the displacement values, for the 1000 mm length, are −67.51 mm and −71.25 mm for the section discretisation 20 and 30, respectively, for the AEM (discr = 180).
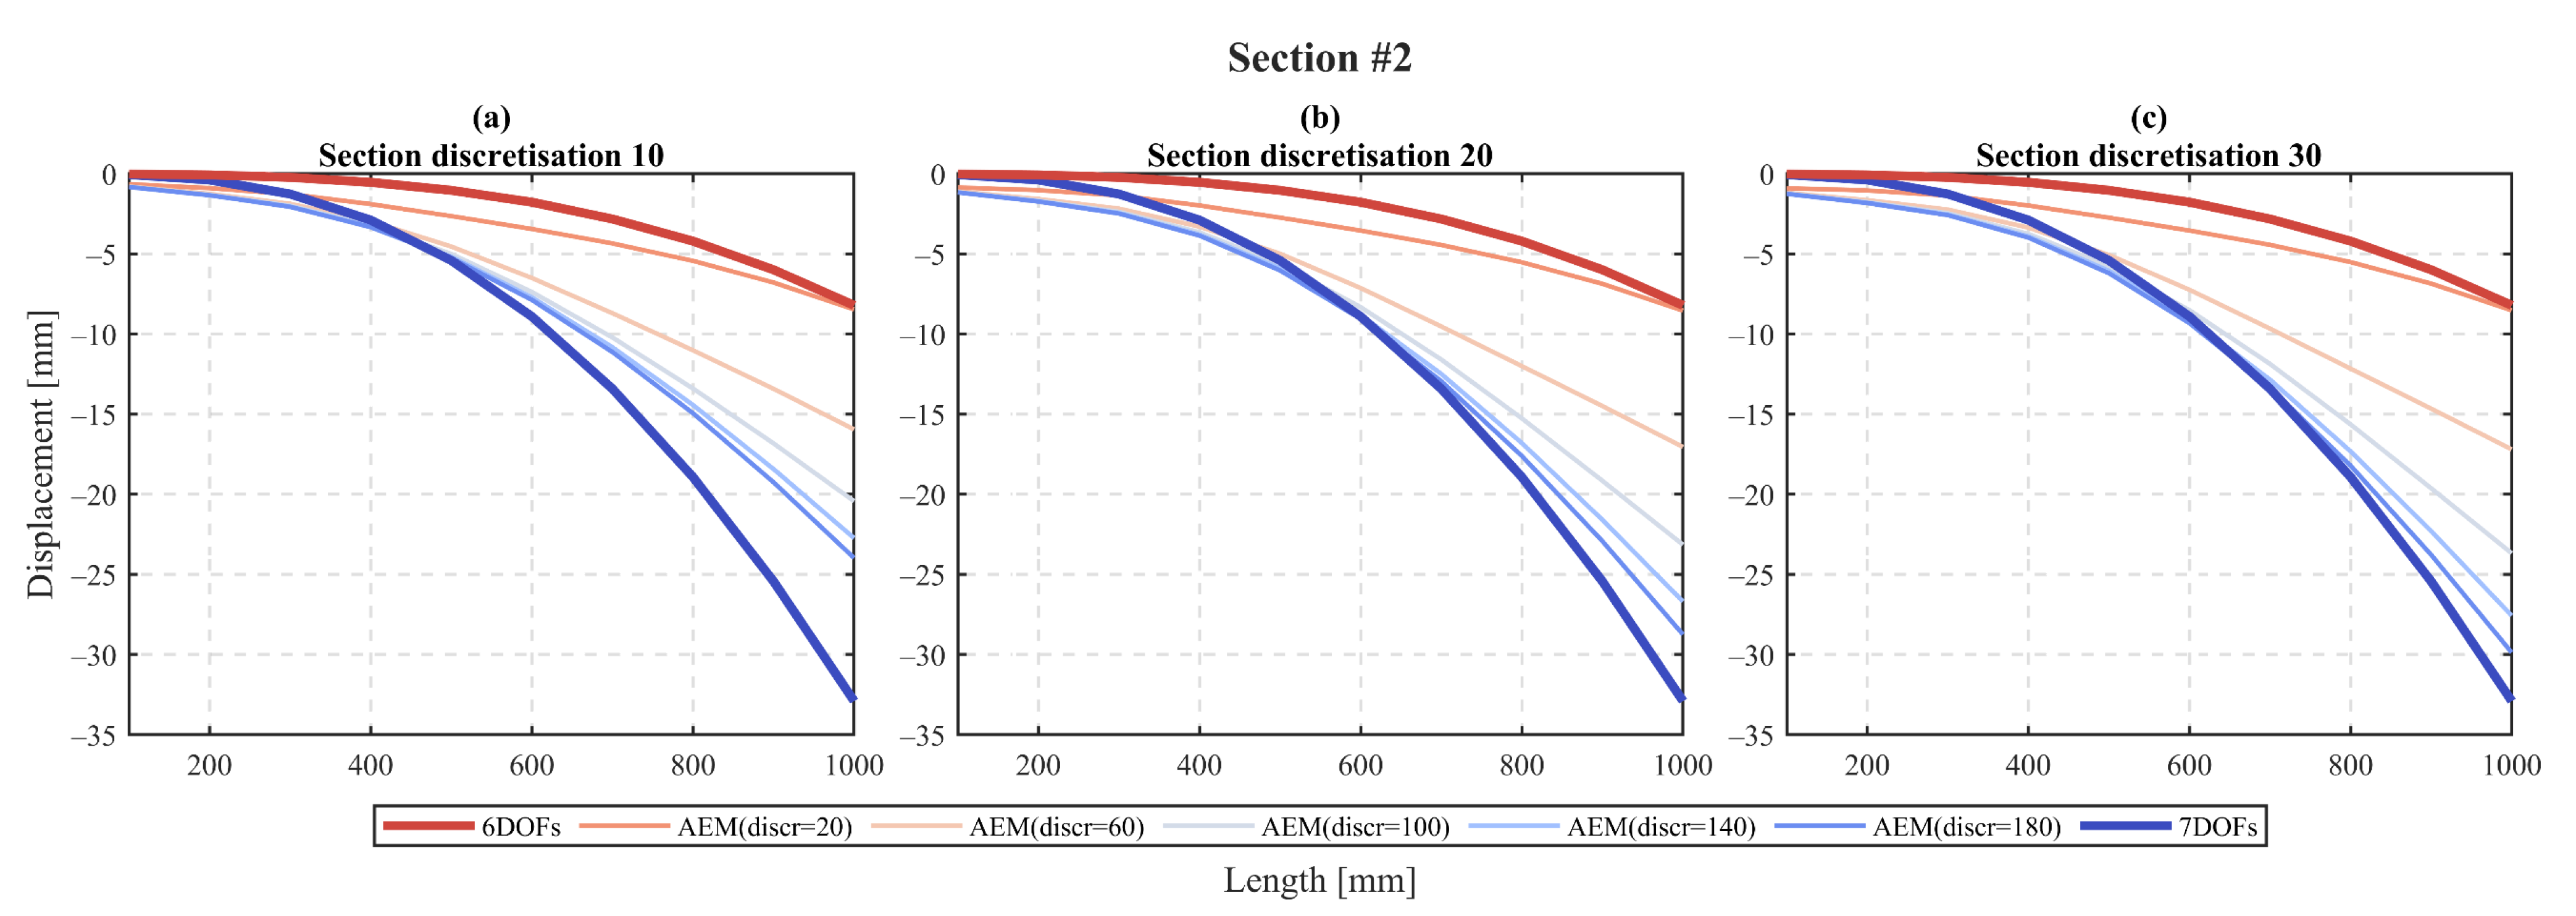
Concerning Section #2, the vertical displacement–length relation is reported in Figure 5. With respect to the former section, the displacements for lower lengths are highly reduced; also, the overall trend of the curve benefits from such a section thickness increment. In particular, the displacements at L = 100 mm with a longitudinal discretisation of 180 are −0.82 mm, −1.16 mm and −1.25 mm for the section discretisation 10, 20 and 30, respectively, while the 6 and 7DOFs formulations provide −0.01 mm and −0.05 mm. Considering the same comparison for a length L = 1000 mm, the displacements are −23.98 mm, −28.76 mm and −29.88 mm for the different section discretisation options, whereas the 6 and 7DOFs formulations result in −8.21 mm and −32.90 mm.
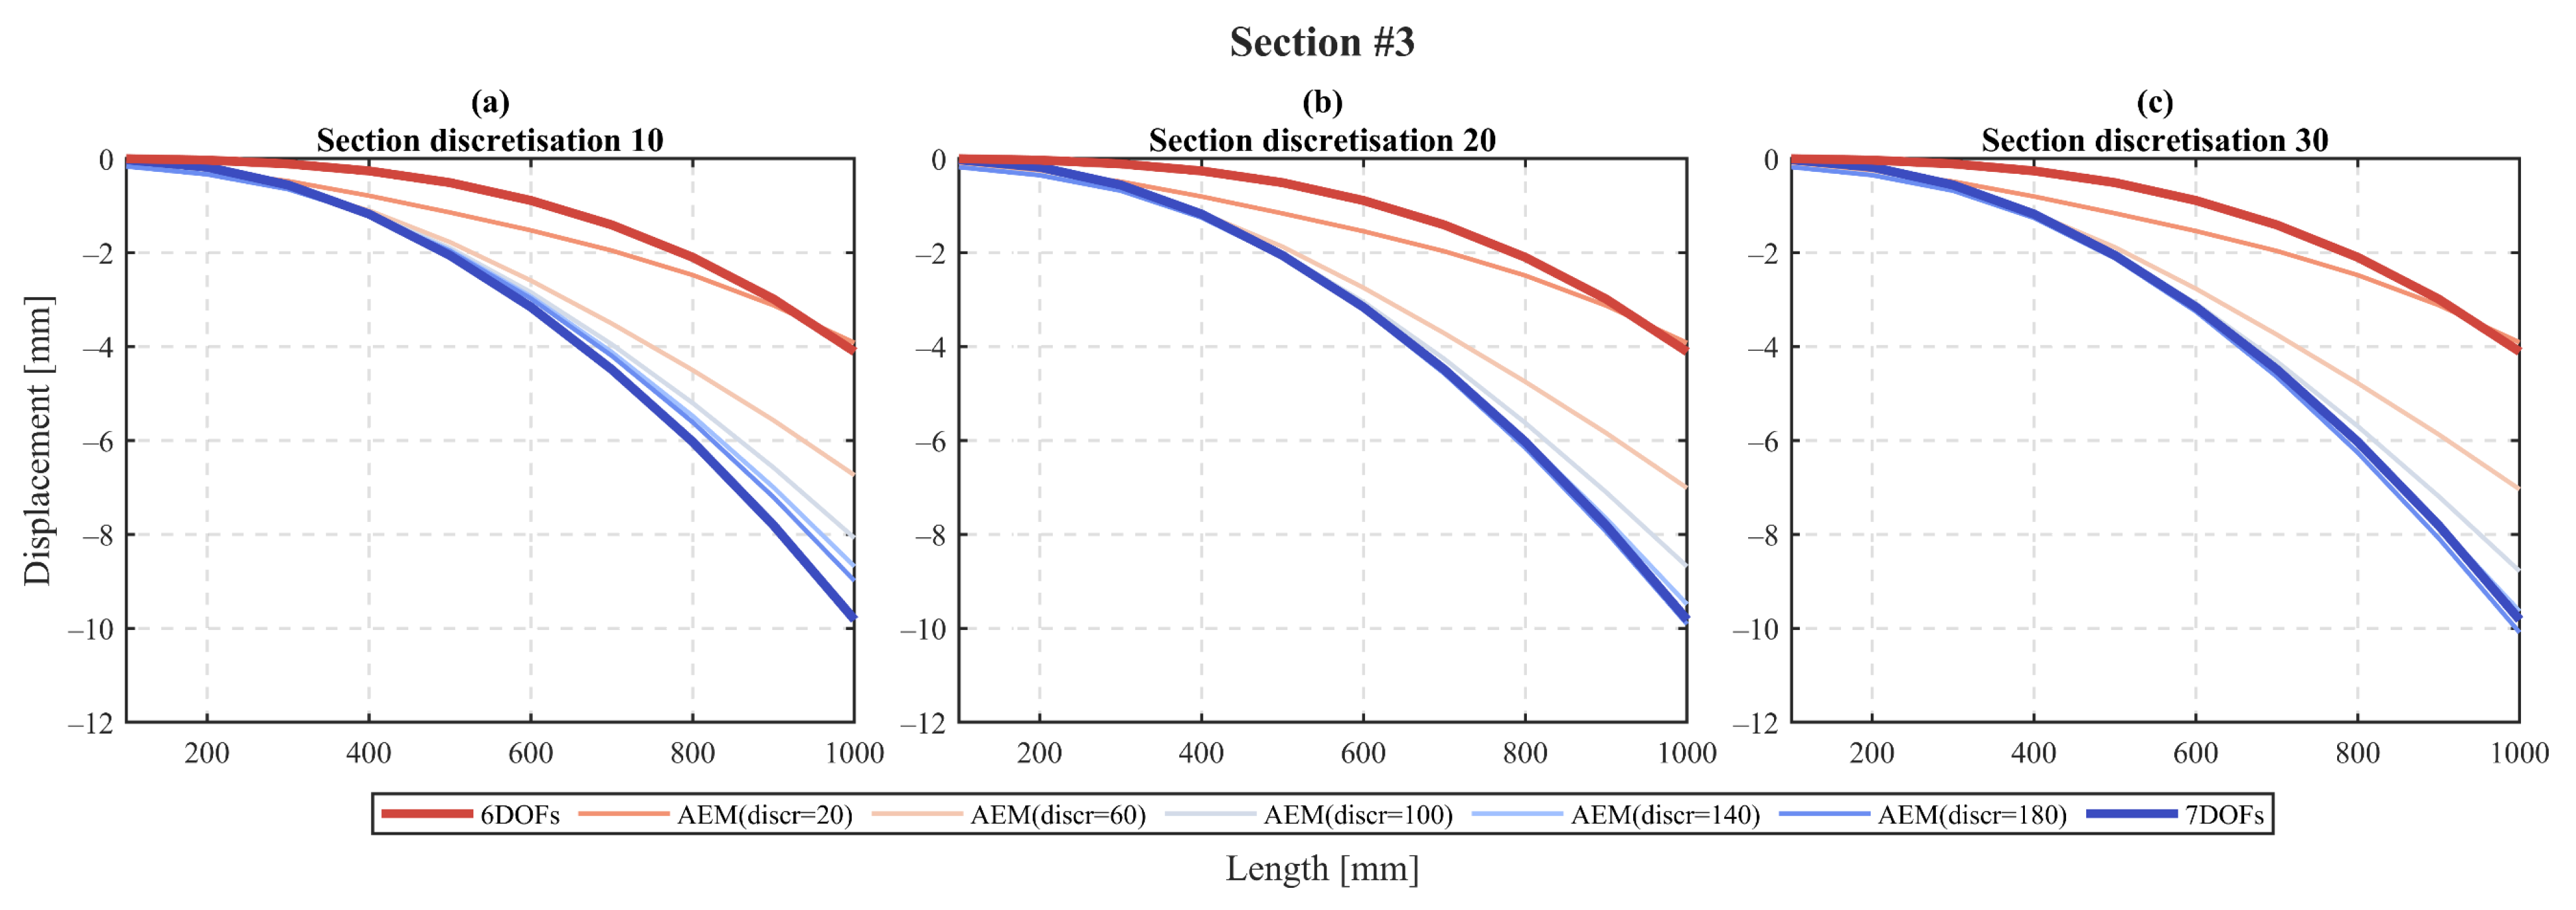
Finally, Section #3 shows an even closer match between the theoretical solution (7DOFs) and the AEM, mainly with the higher mesh discretisation refinement (Figure 6). For a longitudinal discretisation of 100 block elements and for all the section discretisation levels, the outcomes are very similar and tend to be satisfactory from a numerical validation point of view. It is worth noting that the initial displacements for the shorter length (L = 100 mm) are reduced to −0.16 mm, −0.18 mm and −0.18 mm for AEM (discr = 180) and all the section discretisation options, respectively, while 6DOFs and 7DOFs formulations provide 0 mm and −0.02 mm. Taking into account the larger length (L = 1000 mm), a comparison of the same kind leads to values of −8.99 mm, −9.91 mm and −10.09 mm for AEM and −4.11 mm and −9.82 mm for 6DOFs and 7DOFs.
For the sake of brevity, the displacement values for all the discretisation configurations and sections are reported in Table 2, only for the longer length (i.e., L = 1000 mm).
3.2. Normal Stress Distribution and Bimoment
The second key parameter under investigation is the normal stress developed in the fixed end of the cantilever beam and the resulting internal bimoment force. To do so, two different approaches were adopted distinguishing the cases of 7DOFs and the AEM framework. In the case of 7DOFs, the software provides the internal bimoment force acting at the restrained end of the cantilever. As a consequence, to also obtain the stresses acting at the various locations of the section, it is necessary to compute the sectorial coordinates of each selected section point. Then, Equation (3) was adopted:
where is the bimoment, is the warping constant, is the sectorial coordinate and is the normal stress. The pedix i denotes the ith point.
On the contrary, in the case of the AEM, the outputs provided by the C# code are the stresses acting at each spring. As such, the procedure works exactly in the opposite direction than the previous approach. Indeed, the bimoment is computed, summing up the stress contribution of each spring times the sectorial coordinate of each spring location since, from a theoretical point of view, the bimoment is computed following Equation (4).
where is the area of the section.
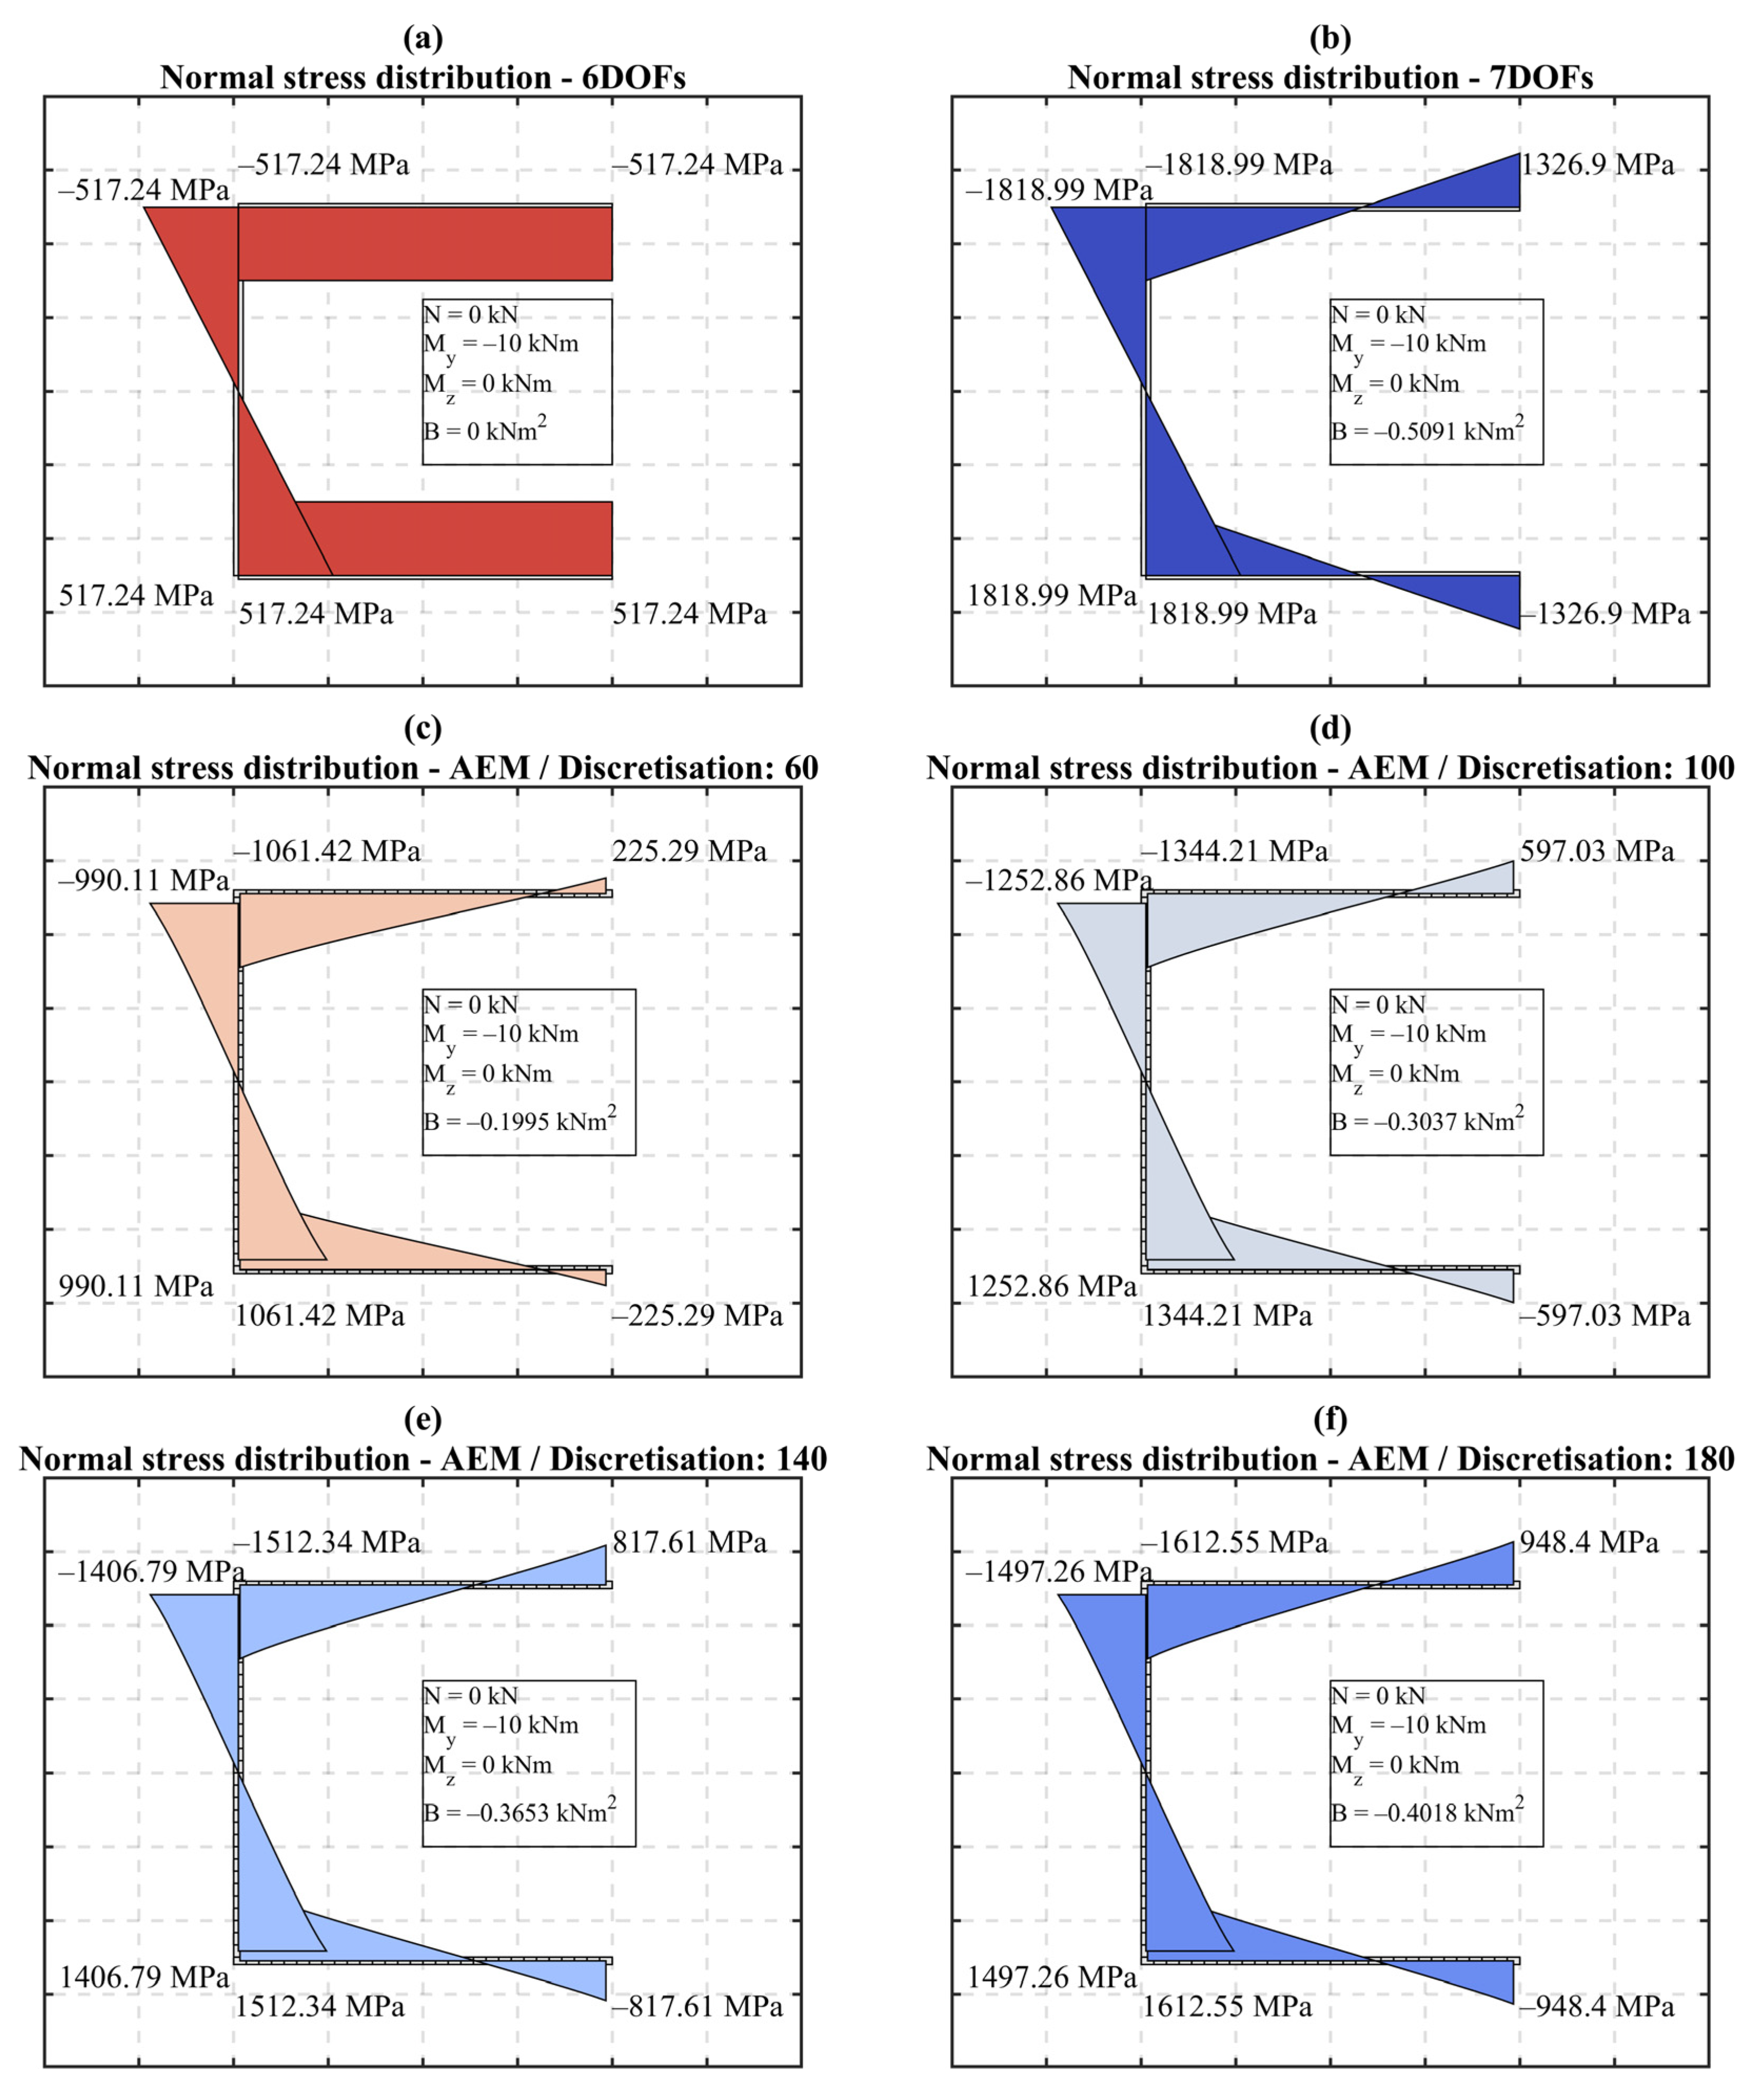
In the case of the 6DOFs formulation, the warping and, hence, the bimoment, cannot be computed; accordingly, the stress distribution is affected only by the developed flexural moment. It can be seen in Figure 7a that the stress distribution, for Section #1 and the 6DOFs case, is constant along the flanges, while it assumes a linear variation along the web, with peaks at the ends of the web and a null value in the middle. On the contrary, if the 7DOFs formulation is considered (Figure 7b), a linear variation can be appraised both along the flanges and the web. It can be noted also that the bimoment increases considerably the acting stresses since the maximum peaks, in absolute terms, are 517 MPa and 1819 MPa for the 6DOFs and 7DOFs formulations, respectively. Regarding the numerical simulation with the AEM, it can be pointed out that the stress distribution is well captured since in all the distribution cases (Figure 7c–f), a linear variation can be observed.
However, satisfactory results can be appreciated only in the case of a longitudinal discretisation consisting of 180 block elements; considering the absolute peak value, a stress value equal to 1613 MPa is computed, which should be compared with the 1819 MPa of the 7DOFs formulation. In any case, all the discretisation configurations of the AEM models lead to more accurate and conservative results if they are compared with a traditional 6DOFs formulation. Focusing on the internal forces (illustrated in Figure 7), the results in terms of the flexural moment are accurate for every discretisation configuration. Regarding the bimoment, instead, following the same considerations highlighted for the displacement and stress distributions, quite an accurate value can be observed only in the case of a longitudinal discretisation of 180 block elements (i.e., B = −0.4018 kNm2 and B = −0.5091 kNm2 for AEM and 7DOFs formulations, respectively). It is also worth mentioning that the percentagewise differences are up to 61% for the longitudinal discretisation of 60 blocks and about 21% for the longitudinal discretisation of 180 blocks.
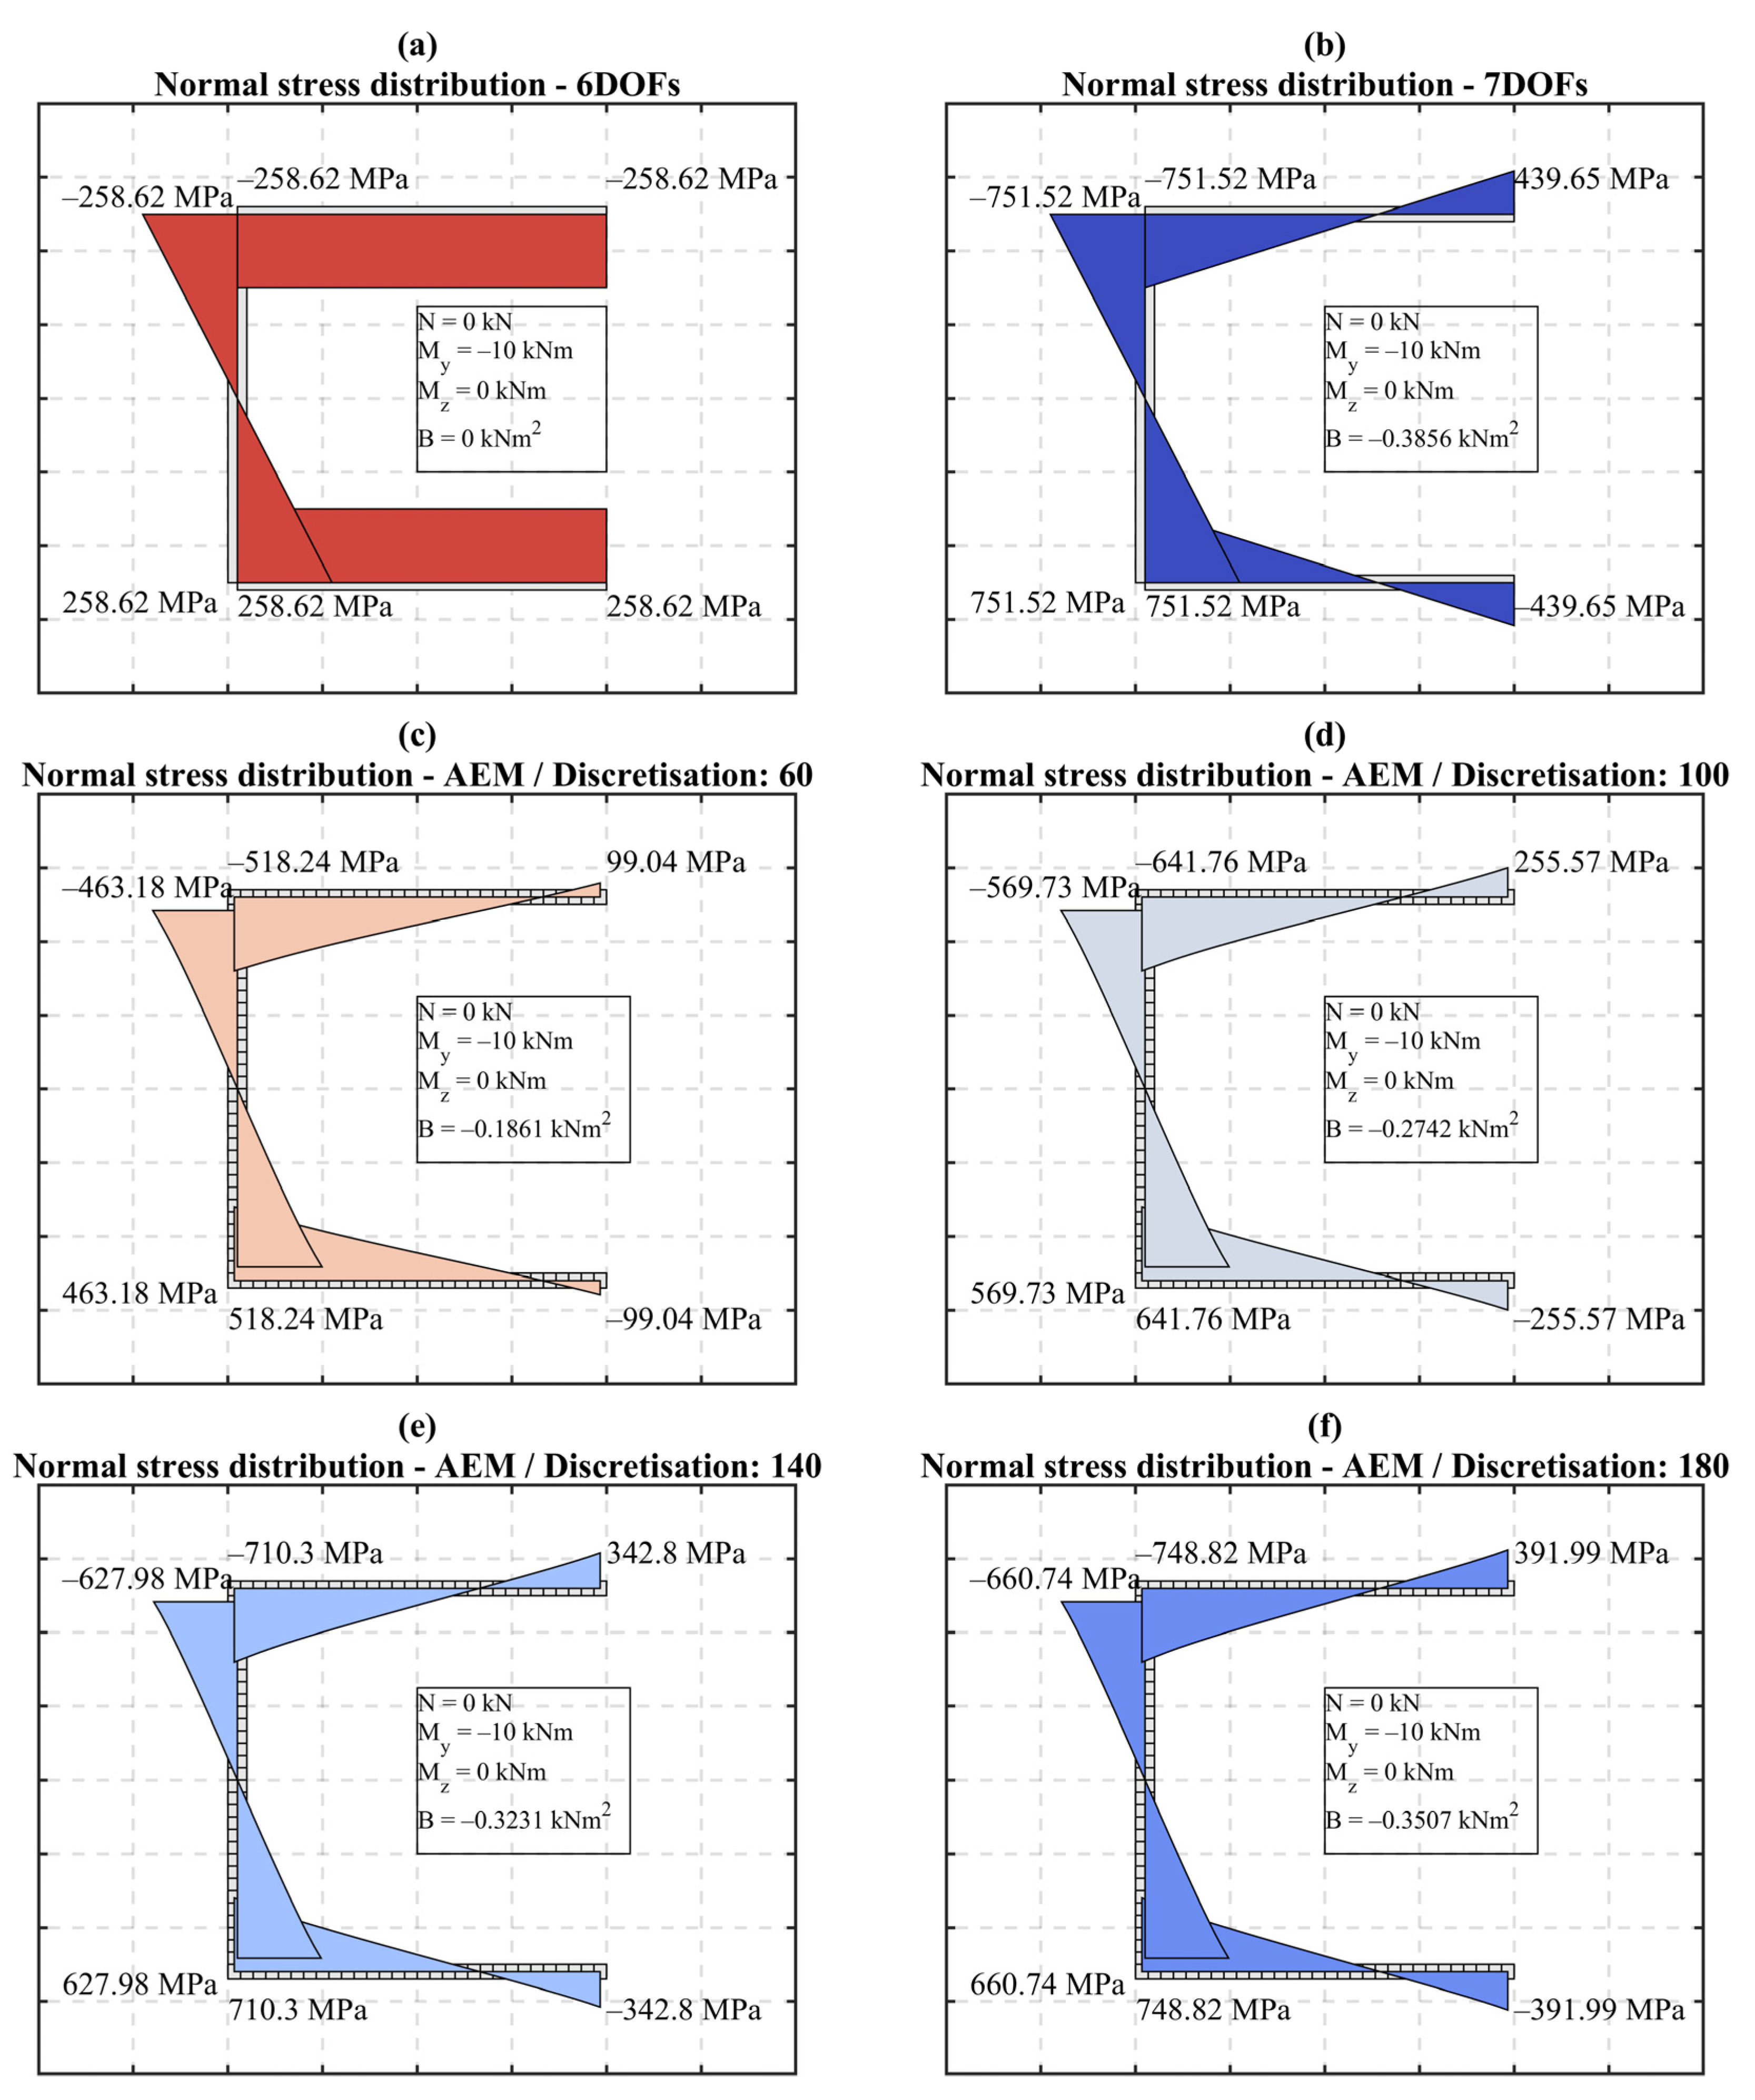
In the case of Section #2 and Section #3, the normal stress distributions are reported in Figure 8 and Figure 9.
Following the same method of interpreting the results, it can be noted that, overall, the AEM simulations and the 7DOFs formulation become closer. Indeed, the maximum absolute stress peak for Section #2 (discretisation 180, Figure 8f) is equal to 749 MPa, while for the theoretical solution, the stress is 752 MPa. The counterparts for Section #3 are 302 MPa (Figure 9f) and 271 MPa (Figure 9b). Additionally, in terms of the bimoment, the AEM is able to accurately capture the warping effects. Section #2 and Section #3 show a bimoment equal to −0.3856 kNm2 and −0.2222 kNm2, respectively; comparing such a result with the best results of the AEM, a very satisfactory agreement is obtained since the computed bimoment forces are −0.3507 kNm2 and −0.2341 kNm2.
4. Discussion of the Results
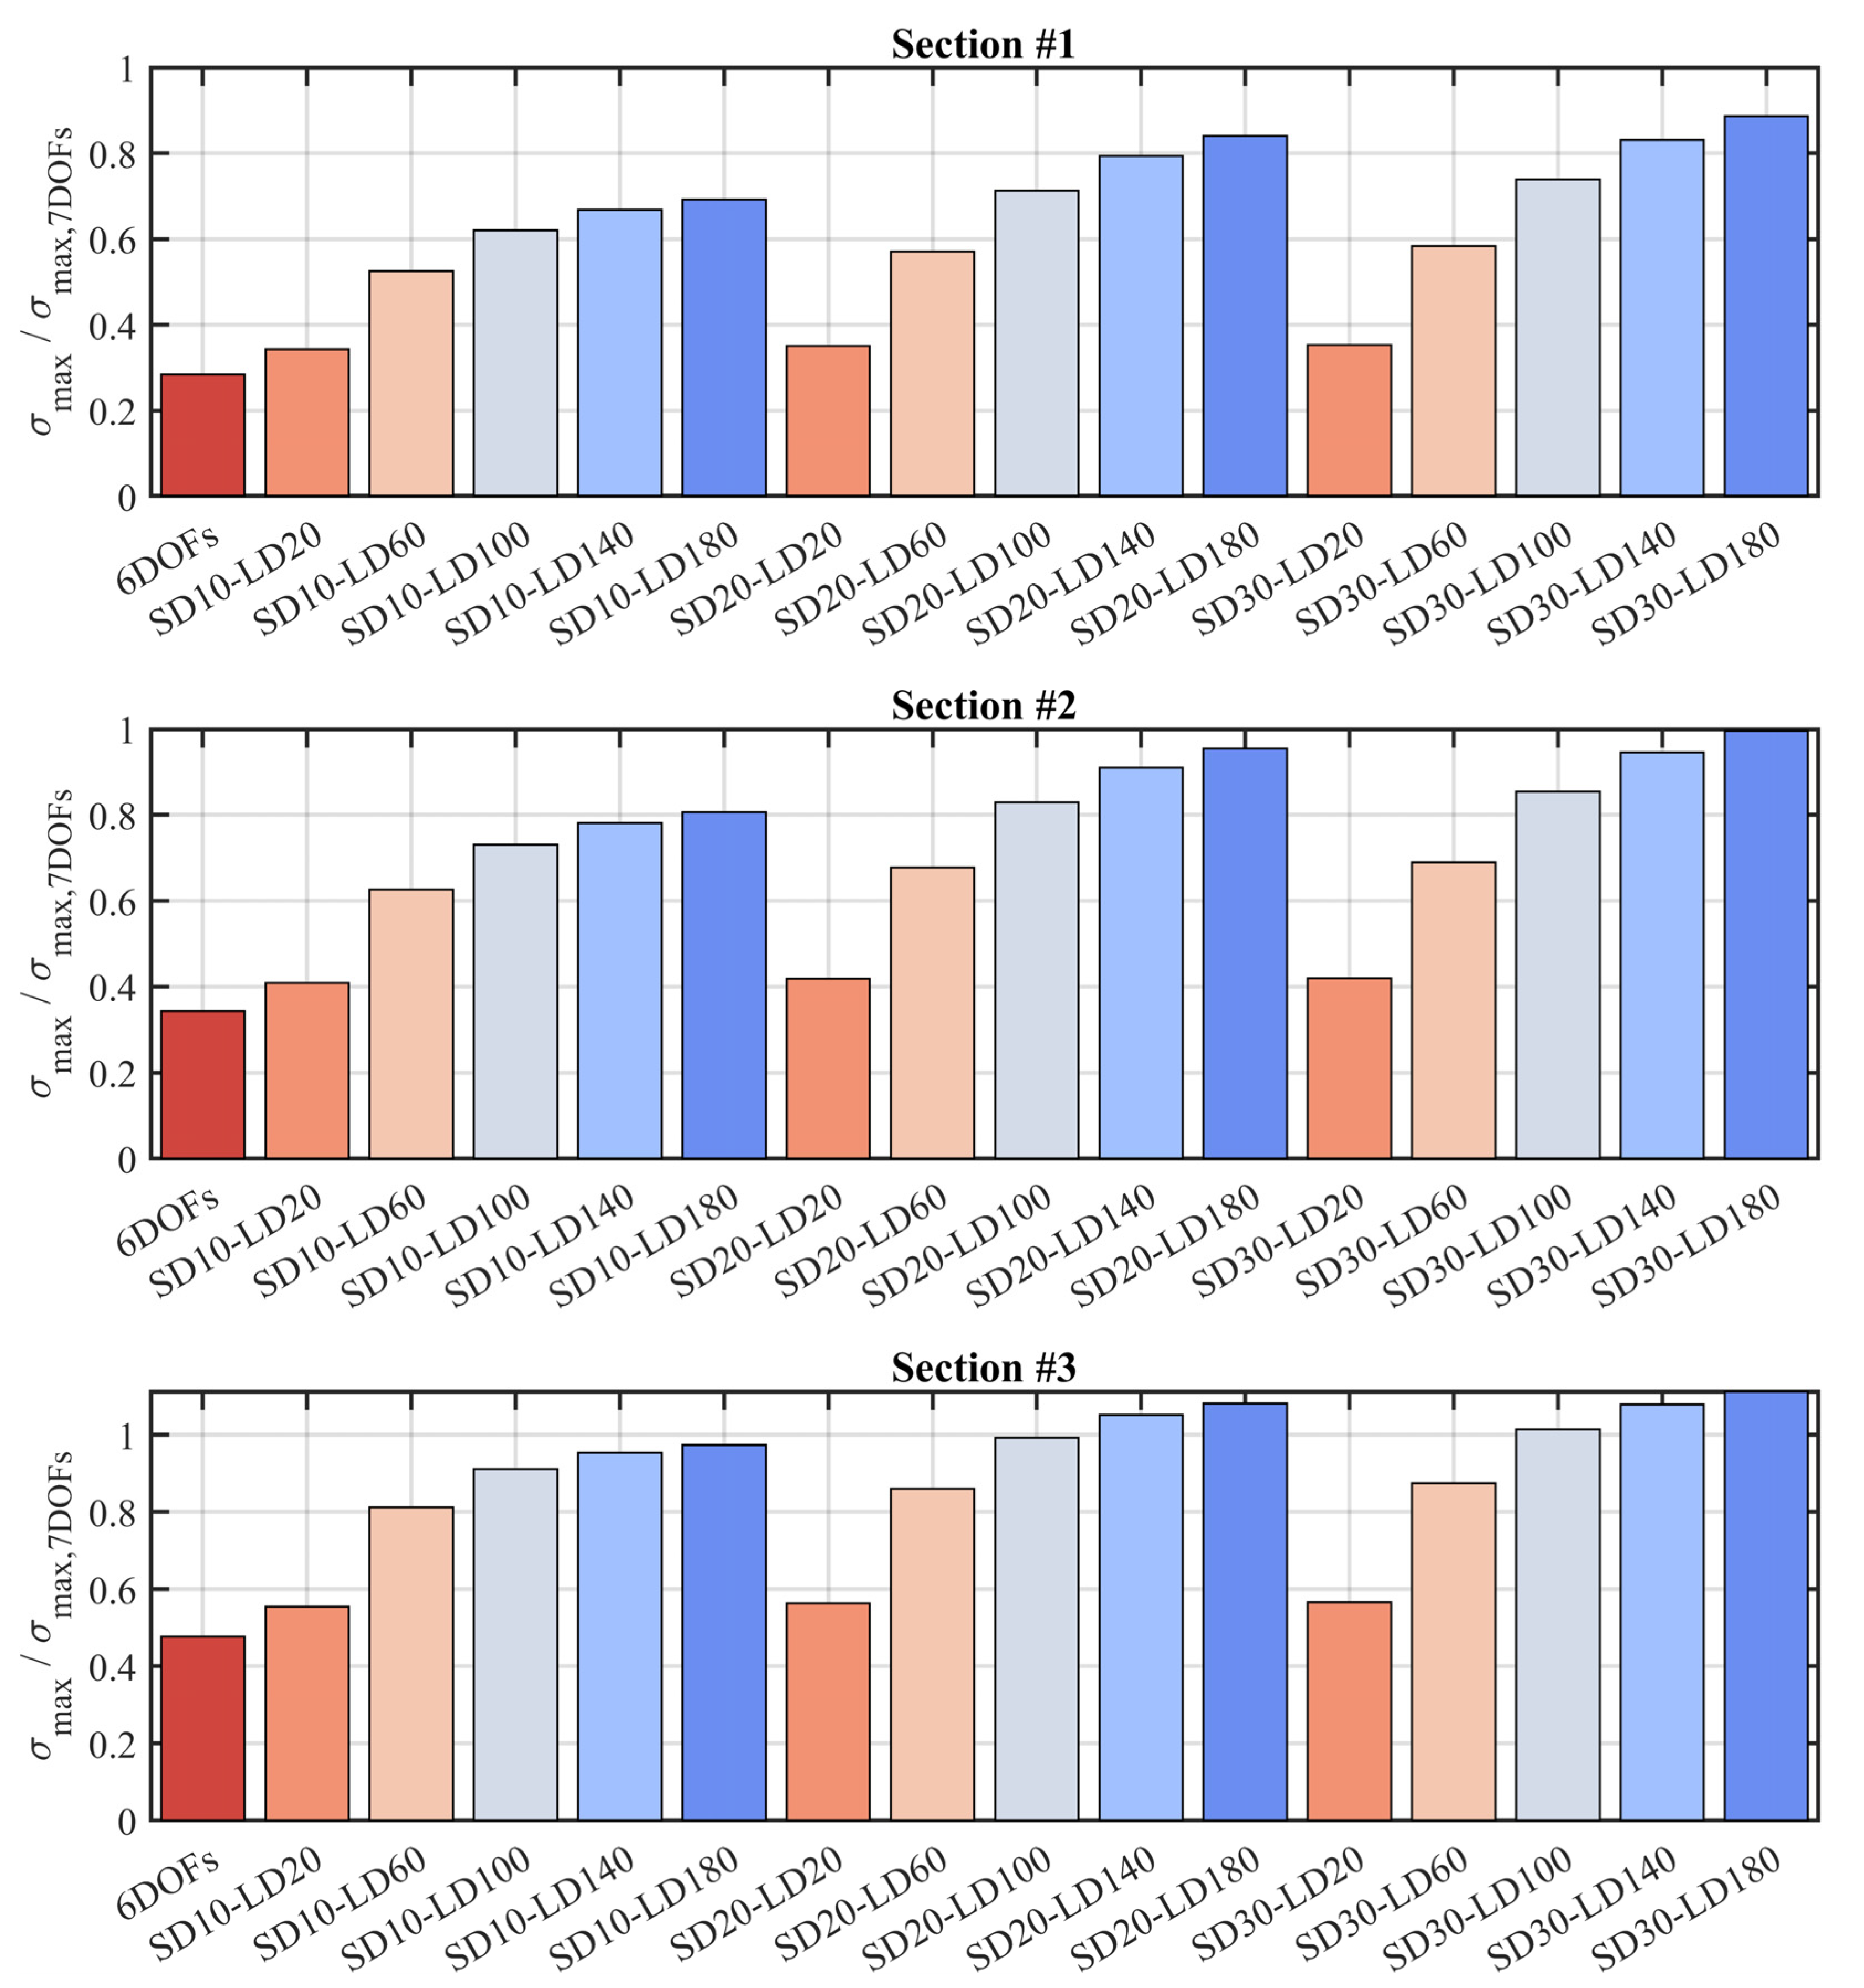
In common practice, the warping effects are often ignored because only a few commercial software can predict such a phenomenon. The AEM is a promising methodology that can help engineers and researchers to assess the response of complex structures, incorporating structure-specific behavioural aspects in the simulation. The results shown in the previous section enable a first evaluation of warping effects in the case that an AEM formulation is employed. As clearly shown in previous sections, and also herein summarised in Figure 10, the AEM can take into account the warping effects when a suitable discretisation, both in the longitudinal direction and at the section-level, is applied. Figure 10 depicts, for the case of 1000 mm of length, the stress peaks obtained with 6DOFs and AEM, both normalised to the stress peak derived from the 7DOFs formulation. As a general trend for these particular cases, satisfactory results are obtained when the section discretisation reaches at least 20 blocks, while the longitudinal one reaches 140 blocks. This consideration highlights the fact that an AEM formulation can be adopted if detailed models are developed. If not, similar, albeit always slightly better, the outcomes of traditional 6DOFs formulation are expected. In any case, the advantageous aspects of the AEM, e.g., the capability of simulating the post-collapse response, still remain, and users/analysts can certainly make use of all of those AEM-specific features.
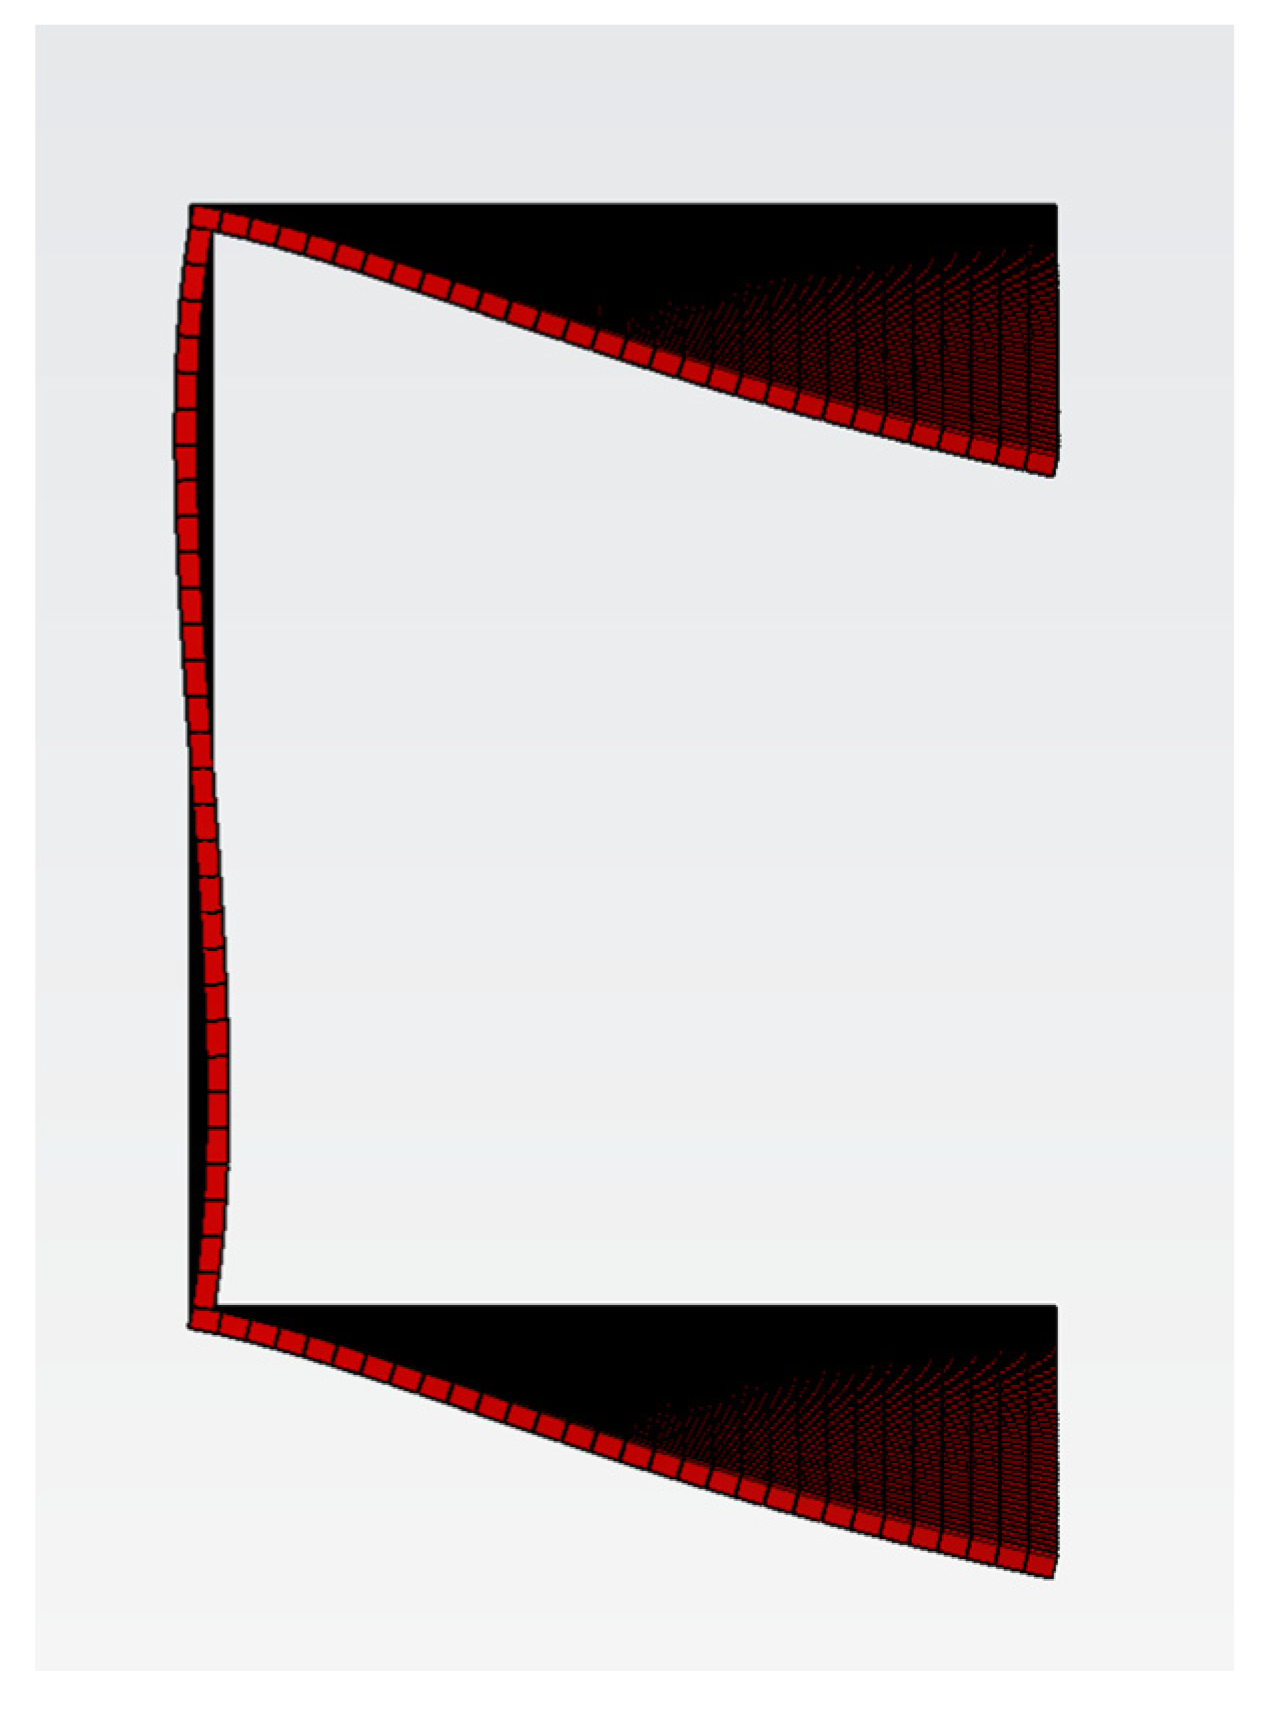
Moreover, it should be noted that, for example, if the case of Section #1 (Figure 4) is considered, a higher displacement is captured for any discretisation for the small-length cases. This particular phenomenon is represented in Figure 11 in which the case of Section #1 with a length of 100 mm is depicted. As can be seen therein, the increase in the displacement of the section centroid is due to the local deformation of the flanges of the C-section and, in fact, the local deformations cannot be simulated with 6DOFs or 7DOFs formulations. Such a phenomenon is more pronounced for Section #1 and tends to disappear for Sections #2 and #3, where the section thickness is increased. Clearly, the slenderness of the web and flanges plays a fundamental role; reducing the slenderness (i.e., increasing the thickness) leads to stiffer responses at the sectional level. This interesting aspect opens the possibility of adopting AEM for predicting distortional and local buckling modes of failure. However, further research is needed in this direction.
5. Conclusions
This study explored the capabilities of the Applied Element Method (AEM) in simulating the warping effects in thin-walled C-shaped steel sections. The AEM has been extensively validated for several structural typology and materials. However, no investigations have been conducted in the field of thin-walled sections, particularly concerning the warping effects. With the aim of contributing to this gap, an AEM-based program—through C# programming—was developed to conduct static analysis. A cantilever beam and a C-shaped section were selected as the case study. A parametric analysis was then performed, varying both the geometrical properties, i.e., the beam length and section thickness, and the discretisation configuration adopted in the AEM models. In order to excite the warping effects, i.e., the torsional rotation and the warping displacement, a shear load acting along the asymmetric axis was applied. For the purposes of comparison of the numerical efficiency, the displacement along the load direction, the bimoment and the normal stress distribution were selected as the key parameters. The results that were obtained enable the following concluding remarks to be made:
- -
- The AEM framework predicts the warping effects with sufficient accuracy if a suitable discretisation level (at least 20 and 140 blocks for the section and longitudinal discretisation, respectively) is adopted. This result suggests that if the scope of the analysis is only to capture warping effects, the FEM approach with 7DOFs is still the best option in terms of the results and computational onus. On the other hand, in the case of impact loads, blast loads or collapse analyses, only FEM, with explicit solvers, and AEM can be adopted. In addition, the AEM framework was proven to be satisfactorily accurate when simulating warping effects. Further investigations are needed to compare impact loads, blast loads and collapse analyses, adopting FEM with an explicit solver and AEM in order to assess the advantages of the two frameworks in terms of accuracy and computational effort;
- -
- Considering the academic and research environment, the AEM framework is currently adequate to analyse full steel storage pallet rack models; moreover, it permits to analyse also model portions and to replicate experimental tests and structure-specific behavioural aspects, such as beam-to-column connections, base–plate connections, pallet–structure interactions, upright holes and perforations influence, forklift hits, etc.;
- -
- Future work might include the modelling of distortional mechanisms and local buckling of thin-walled sections. Currently, these phenomena can be accurately captured adopting plate/solid elements in the case of a finite element method, or by using the strip method. The advantage of simulating all the peculiarities affecting thin-walled elements in a unique tool is, nevertheless, very useful for researchers and engineering practitioners.
Funding
This research received no external funding.
Institutional Review Board Statement
Not applicable.
Informed Consent Statement
Not applicable.
Data Availability Statement
The data presented in this study are available on request from the corresponding author.
Acknowledgments
The authors would like to thank the editor and the three anonymous reviewers who kindly reviewed the paper providing significant comments and suggestions.
Conflicts of Interest
The author declares no conflict of interest.
References
- Lourenço, P.B. Computations on historic masonry structures. Prog. Struct. Eng. Mater. 2002, 4, 301–319. [Google Scholar] [CrossRef]
- Malomo, D.; Pinho, R.J.S.M.; Penna, A. Using the applied element method for modelling calcium silicate brick masonry subjected to in-plane cyclic loading. Earthq. Eng. Struct. Dyn. 2018, 47, 1610–1630. [Google Scholar] [CrossRef]
- Meguro, K.; Tagel-Din, H.K. Applied element method for structural analysis: Theory and application for linear materials. J. Jpn. Soc. Civ. Eng. 2000, 2000, 31–45. [Google Scholar] [CrossRef] [Green Version]
- Tagel-Din, H.; Meguro, K. Applied element method for dynamic large deformation analysis of structures. J. Jpn Soc. Civ. Eng. 2000, 2000, 1–10. [Google Scholar] [CrossRef] [Green Version]
- Meguro, K.; Tagel-Din, H. Nonlinear simulation of RC structures using applied element method. J. Jpn Soc. Civ. Eng. 2001, 2000, 13–24. [Google Scholar] [CrossRef]
- Meguro, K.; Tagel-Din, H. Applied Element Simulation of RC Structures under Cyclic Loading. J. Struct. Eng. 2001, 127, 1295–1305. [Google Scholar] [CrossRef]
- Meguro, K.; Tagel-Din, H. Numerical Simulation of High-Rise Steel Buildings Using Improved Applied Element Method. In Proceedings of the 13th World Conference on Earthquake Engineering, Vancouver, BC, Canada, 1–6 August 2004. [Google Scholar]
- EL-Kholy, S.A.; Gomaa, M.S.; Akl, A.Y. Improved Applied Element Simulation of RC and Composite Structures Under Extreme Loading Conditions. Arab. J. Sci. Eng. 2012, 37, 921–933. [Google Scholar] [CrossRef]
- Christy, D.L.; Pillai, T.M.M.; Nagarajan, P. Thin plate element for applied element method. Structures 2019, 22, 1–12. [Google Scholar] [CrossRef]
- Christy, D.L.; Pillai, T.M.M.; Nagarajan, P. Analysis of Thin Plates Using Applied Element Method. Lect. Notes Civ. Eng. 2021, 83, 507–516. [Google Scholar] [CrossRef]
- Abdelaziz, M.M.; El-Ghazaly, H.A.; Gomaa, M.S. Improved Applied Element Model for Bonded Prestressed Concrete Structures. J. Struct. Eng. 2021, 147, 04020298. [Google Scholar] [CrossRef]
- Abdul-Latif, M.; Feng, Y.T. Modelling Damage Progressive Collapse of Frames Using A Gaussian Springs Based Applied Element Method. In Proceedings of the 6th European Conference on Computational Mechanic, Glasgow, UK, 11–15 June 2018. [Google Scholar]
- Malomo, D.; Pinho, R.; Penna, A. Numerical modelling of the out-of-plane response of full-scale brick masonry prototypes subjected to incremental dynamic shake-table tests. Eng. Struct. 2020, 209, 110298. [Google Scholar] [CrossRef]
- Malomo, D.; Pinho, R.; Penna, A. Simulating the shake table response of unreinforced masonry cavity wall structures tested to collapse or near-collapse conditions. Earthq. Spectra 2020, 36, 554–578. [Google Scholar] [CrossRef]
- Malomo, D.; Pinho, R.; Penna, A. Applied Element Modelling of the Dynamic Response of a Full-Scale Clay Brick Masonry Building Specimen with Flexible Diaphragms. Int. J. Archit. Herit. 2020. [Google Scholar] [CrossRef]
- Malomo, D.; Morandini, C.; Crowley, H.; Pinho, R.; Penna, A. Impact of ground floor openings percentage on the dynamic response of typical Dutch URM cavity wall structures. Bull. Earthq. Eng. 2021, 19, 409–429. [Google Scholar] [CrossRef]
- Karbassi, M.; Nollet, J. Performance-based seismic vulnerability evaluation of masonry buildings using applied element method in a nonlinear dynamic-based analytical procedure. Earthq. Spectra 2013, 29, 399–426. [Google Scholar] [CrossRef]
- Michel, C.; Karbassi, A.; Lestuzzi, P. Evaluation of the seismic retrofitting of an unreinforced masonry building using numerical modeling ambient vibration measurements. Eng. Struct. 2018, 158, 124–135. [Google Scholar] [CrossRef]
- Keys, R.A.; Clubley, S.K. Establishing a predictive method for blast induced masonry debris distribution using experimental numerical methods. Eng. Fail. Anal. 2017, 82, 82–91. [Google Scholar] [CrossRef] [Green Version]
- Kernicky, T.P.; Whelan, M.J.; Weggel, D.C.; Rice, C.D. Structural Identification and Damage Characterization of a Masonry Infill Wall in a Full-Scale Building Subjected to Internal Blast Load. J. Struct. Eng. 2015, 141, D4014013. [Google Scholar] [CrossRef]
- Alanani, M.; Ehab, M.; Salem, H. Progressive collapse assessment of precast prestressed reinforced concrete beams using applied element method. Case Stud. Constr. Mater. 2020, 13, e00457. [Google Scholar] [CrossRef]
- El-desoqi, M.; Ehab, M.; Salem, H. Progressive collapse assessment of precast reinforced concrete beams using applied element method. Case Stud. Constr. Mater. 2020, 13, e00456. [Google Scholar] [CrossRef]
- Marginean, I.; Dinu, F.; Dubina, D. Simulation of the dynamic response of steel moment frames following sudden column loss. Experimental calibration of the numerical model and application. Steel Constr. 2018, 11, 57–64. [Google Scholar] [CrossRef]
- Coffield, A.; Adeli, H. Irregular steel building structures subjected to blast loading. J. Civ. Eng. Manag. 2016, 22, 17–25. [Google Scholar] [CrossRef] [Green Version]
- Cismasiu, C.; Ramos, A.P.; Moldovan, I.D.; Ferreira, D.F. Applied element method simulation of experimental failure modes in RC shear walls. Comput. Concr. 2017, 19, 365–374. [Google Scholar] [CrossRef]
- Calvi, G.M.; Moratti, M.; O’Reilly, G.J.; Scattarreggia, N.; Monteiro, R.; Malomo, D.; Calvi, P.M.; Pinho, R. Once upon a Time in Italy: The Tale of the Morandi Bridge. Struct. Eng. Int. 2019, 29, 198–217. [Google Scholar] [CrossRef]
- Malomo, D.; Scattarreggia, N.; Orgnoni, A.; Pinho, R.; Moratti, M.; Calvi, G.M. Numerical Study on the Collapse of the Morandi Bridge. J. Perform. Constr. Facil. 2020, 34, 04020044. [Google Scholar] [CrossRef]
- Salem, H.; Mohssen, S.; Nishikiori, Y.; Hosoda, A. Numerical Collapse Analysis of Tsuyagawa Bridge Damaged by Tohoku Tsunami. J. Perform. Constr. Facil. 2016, 30, 04016065. [Google Scholar] [CrossRef]
- Dubina, D.; Marginean, I.; Dinu, F. Impact modelling for progressive collapse assessment of selective rack systems. Thin-Walled Struct. 2019, 143, 106201. [Google Scholar] [CrossRef]
- Bernuzzi, C.; Gabbianelli, G.; Gobetti, A.; Rosti, A. Beam design for steel storage racks. J. Constr. Steel Res. 2016, 116, 156–172. [Google Scholar] [CrossRef]
- Bernuzzi, C.; Gobetti, A.; Gabbianelli, G.; Simoncelli, M. Simplified approaches to design medium-rise unbraced steel storage pallet racks. I: Elastic buckling analysis. J. Struct. Eng. 2015, 141. [Google Scholar] [CrossRef]
- Bernuzzi, C.; Gobetti, A.; Gabbianelli, G.; Simoncelli, M. Simplified approaches to design medium-rise unbraced steel storage pallet racks. II: Fundamental period estimates. J. Struct. Eng. 2015, 141. [Google Scholar] [CrossRef]
- Montuori, R.; Gabbianelli, G.; Nastri, E.; Simoncelli, M. Rigid plastic analysis for the seismic performance evaluation of steel storage racks. Steel Compos. Struct. 2019, 32. [Google Scholar] [CrossRef]
- Simoncelli, M.; Tagliafierro, B.; Montuori, R. Recent development on the seismic devices for steel storage structures. Thin Walled Struct. 2020, 155, 106827. [Google Scholar] [CrossRef]
- Vlasov, V.Z. Thin-Walled Elastic Beams, 2nd ed.; National Technical Information Service: Springfield, VA, USA, 1984.
- Hartmann, D.; Breidt, M.; Stangenberg, F.; Höhler, S.; Schweizerhof, K.; Mattern, S.; Blankenhorn, G.; Möller, B.; Liebscher, M. Structural collapse simulation under consideration of uncertainty-Fundamental concept and results. Comput. Struct. 2008, 86, 21–22. [Google Scholar] [CrossRef]
- Khandelwal, K.; El-Tawil, S.; Sadek, F. Progressive collapse analysis of seismically designed steel braced frames. J. Constr. Steel Res. 2009, 65, 699–708. [Google Scholar] [CrossRef]
- Yanchao, Y.S.; Li, Z.X.; Hao, H. A new method for progressive collapse analysis of RC frames under blast loading. Eng. Struct. 2010, 32, 1691–1703. [Google Scholar] [CrossRef]
- Brunesi, E.; Nascimbene, R.; Pagani, M.; Beilic, D. Seismic Performance of Storage Steel Tanks during the May 2012 Emilia, Italy, Earthquakes. J. Perform. Constr. Facil. 2015, 29, 04014137. [Google Scholar] [CrossRef]
- Brunesi, E.; Nascimbene, R. Extreme response of reinforced concrete buildings through fiber force-based finite element analysis. Eng. Struct. 2014, 69, 206–215. [Google Scholar] [CrossRef]
- Ozsarac, V.; Brunesi, E.; Nascimbene, R. Earthquake-induced nonlinear sloshing response of above-ground steel tanks with damped or undamped floating roof. Soil Dyn. Earthq. Eng. 2021, 144, 106673. [Google Scholar] [CrossRef]
- Seismosoft. SeismoStruct 2021–A Computer Program for Static and Dynamic Nonlinear Analysis of Framed Structures. Pavia, 2021. Available online: https://seismosoft.com (accessed on 3 April 2021).
- EN 1993-1-1. Eurocode 3: Design of Steel Structures—Part 1-1: General Rules and Rules for Buildings; European Committee for Standardisation: Brussels, Belgium, 2014. [Google Scholar]
- Liu, S.W.; Gao, W.L.; Ziemian, R.D. Improved line-element formulations for the stability analysis of arbitrarily-shaped open-section beam-columns. Thin Walled Struct. 2019, 144, 106290. [Google Scholar] [CrossRef]
- Rinchen, G.J.; Hancock, K.; Rasmussen, J.R. Geometric and material nonlinear analysis of thin-walled members with arbitrary open cross-section. Thin Walled Struct. 2020, 153, 106783. [Google Scholar] [CrossRef]
- Gao, W.L.; Abdelrahman, A.H.A.; Liu, S.W.; Ziemian, R.D. Second-order dynamic time-history analysis of beam-columns with nonsymmetrical thin-walled steel sections. Thin Walled Struct. 2021, 160, 107367. [Google Scholar] [CrossRef]
- Bernuzzi, C.; di Gioia, A.; Gabbianelli, G.; Simoncelli, M. Pushover Analyses of Hand-Loaded Steel Storage Shelving Racks. J. Earthq. Eng. 2017, 21, 1256–1282. [Google Scholar] [CrossRef] [Green Version]
- Gabbianelli, G.; Kanyilmaz, A.; Bernuzzi, C.; Castiglioni, C.A. A combined experimental-numerical study on unbraced pallet rack under pushover loads. Ing. Sismica 2017, 34, 18–39. [Google Scholar]
- Liu, S.W.; Pekoz, T.; Gao, W.L.; Ziemian, R.D.; Crews, J. Frame analysis and design of industrial rack structures with perforated cold-formed steel columns. Thin-Walled Struct. 2021, 163, 107755. [Google Scholar] [CrossRef]
Figure 1.
Contact points, spring distribution, normal and shear stiffness connecting two elements.

Figure 2.
Selected C-shaped sections and their discretisation.

Figure 3.
Deformation of the beam element under shear force with the AEM model (longitudinal discretisation equal to 180 and transversal discretisation of 10). It can be noted the typical coupled flexural–torsional behaviour.
Figure 3.
Deformation of the beam element under shear force with the AEM model (longitudinal discretisation equal to 180 and transversal discretisation of 10). It can be noted the typical coupled flexural–torsional behaviour.

Figure 4.
Vertical displacement–length relation for Section #1 with the different discretisation configurations.
Figure 4.
Vertical displacement–length relation for Section #1 with the different discretisation configurations.

Figure 5.
Vertical displacement–length relation for Section #2 with the different discretisation configurations.
Figure 5.
Vertical displacement–length relation for Section #2 with the different discretisation configurations.

Figure 6.
Vertical displacement–length relation for Section #3 with the different discretisation configurations.
Figure 6.
Vertical displacement–length relation for Section #3 with the different discretisation configurations.

Figure 7.
Normal stress distribution for Section #1, with a length L = 1000 mm and a section discretisation of 30 blocks for each section part.
Figure 7.
Normal stress distribution for Section #1, with a length L = 1000 mm and a section discretisation of 30 blocks for each section part.

Figure 8.
Normal stress distribution for Section #2, with a length L = 1000 mm and a section discretisation of 30 blocks for each section part.
Figure 8.
Normal stress distribution for Section #2, with a length L = 1000 mm and a section discretisation of 30 blocks for each section part.

Figure 9.
Normal stress distribution for Section #3, with a length L = 1000 mm and a section discretisation of 30 blocks for each section part.
Figure 9.
Normal stress distribution for Section #3, with a length L = 1000 mm and a section discretisation of 30 blocks for each section part.

Figure 10.
Distribution of the normalised stress peaks to stress peaks based on the 7DOFs formulation. The results correspond to the case with a length of 1000 mm, varying, in the case of AEM, the section discretisation (SD10, SD20 and SD30) and longitudinal discretisation (LD20, LD60, LD100, LD140 and LD180).

Figure 11.
Local deformation of the flanges for Section #1, length = 100 mm, section discretisation 30 and longitudinal discretisation of 60.
Figure 11.
Local deformation of the flanges for Section #1, length = 100 mm, section discretisation 30 and longitudinal discretisation of 60.


Table 1.
Geometrical properties of the selected sections.
| Section #1 | Section #2 | Section #3 | |
|---|---|---|---|
| Height (mm) | 100 | 100 | 100 |
| Width (mm) | 80 | 80 | 80 |
| Thickness (mm) | 2 | 4 | 8 |
| Area (mm2) | 520 | 1040 | 2080 |
| Moment of Inertia, y (mm4) | 9,666,666.67 | 1,933,333.33 | 3,866,666.67 |
| Moment of Inertia, z (mm4) | 367,589.74 | 735,179.49 | 1,470,358.97 |
| Torsional inertia (mm4) | 693.33 | 5546.67 | 44,373.33 |
| Warping constant (mm6) | 647,356,321.84 | 1,294,712,643.68 | 2,589,425,287.36 |
| Shear centre, y (mm) | −57.72 | −57.72 | −57.72 |
Table 2.
Centroid vertical displacement (mm) for the three considered sections with different configurations and discretisation levels (L = 1000 mm).
Table 2.
Centroid vertical displacement (mm) for the three considered sections with different configurations and discretisation levels (L = 1000 mm).
| Section | Long. Discretisation | Section Discretisation | AEM | 6DOFs | 7DOFs |
|---|---|---|---|---|---|
| #1 | 20 | 10 | −17.60 | −16.42 | −86.57 |
| 60 | −34.34 | ||||
| 100 | −45.07 | ||||
| 140 | −50.89 | ||||
| 180 | −54.14 | ||||
| 20 | 20 | −17.76 | |||
| 60 | −36.98 | ||||
| 100 | −52.03 | ||||
| 140 | −61.58 | ||||
| 180 | −67.51 | ||||
| 20 | 30 | −17.81 | |||
| 60 | −37.58 | ||||
| 100 | −53.74 | ||||
| 140 | −64.41 | ||||
| 180 | −71.25 | ||||
| #2 | 20 | 10 | −8.46 | −8.21 | −32.90 |
| 60 | −15.95 | ||||
| 100 | −20.44 | ||||
| 140 | −22.74 | ||||
| 180 | −23.98 | ||||
| 20 | 20 | −8.54 | |||
| 60 | −17.05 | ||||
| 100 | −23.15 | ||||
| 140 | −26.70 | ||||
| 180 | −28.76 | ||||
| 20 | 30 | −8.52 | |||
| 60 | −17.20 | ||||
| 100 | −23.69 | ||||
| 140 | −27.58 | ||||
| 180 | −29.88 | ||||
| #3 | 20 | 10 | −3.92 | −4.11 | −9.82 |
| 60 | −6.74 | ||||
| 100 | −8.08 | ||||
| 140 | −8.69 | ||||
| 180 | −8.99 | ||||
| 20 | 20 | −3.92 | |||
| 60 | −7.02 | ||||
| 100 | −8.69 | ||||
| 140 | −9.49 | ||||
| 180 | −9.91 | ||||
| 20 | 30 | −3.91 | |||
| 60 | −7.04 | ||||
| 100 | −8.79 | ||||
| 140 | −9.64 | ||||
| 180 | −10.09 |
Publisher’s Note: MDPI stays neutral with regard to jurisdictional claims in published maps and institutional affiliations. |
© 2021 by the author. Licensee MDPI, Basel, Switzerland. This article is an open access article distributed under the terms and conditions of the Creative Commons Attribution (CC BY) license (https://creativecommons.org/licenses/by/4.0/).
Share and Cite
MDPI and ACS Style
Gabbianelli, G. Applied Element Modelling of Warping Effects in Thin-Walled C-Shaped Steel Sections. Buildings 2021, 11, 328. https://0-doi-org.brum.beds.ac.uk/10.3390/buildings11080328
AMA Style
Gabbianelli G. Applied Element Modelling of Warping Effects in Thin-Walled C-Shaped Steel Sections. Buildings. 2021; 11(8):328. https://0-doi-org.brum.beds.ac.uk/10.3390/buildings11080328
Chicago/Turabian StyleGabbianelli, Giammaria. 2021. "Applied Element Modelling of Warping Effects in Thin-Walled C-Shaped Steel Sections" Buildings 11, no. 8: 328. https://0-doi-org.brum.beds.ac.uk/10.3390/buildings11080328
Note that from the first issue of 2016, this journal uses article numbers instead of page numbers. See further details here.