Article

A New Configuration of Roof Photovoltaic System for Limited Area Applications—A Case Study in KSA

1
Electrical Power Engineering Department, Hijjawi Faculty for Engineering Technology, Yarmouk University, Irbid 21163, Jordan
2
Mechanical Engineering Department/Renewable Energy, The University of Jordan, Amman 11942, Jordan
3
Technology Utilities Trading Est, Riyadh 12274, Saudi Arabia
4
National Energy Works Company, Riyadh 11423, Saudi Arabia
5
Department of Energy Engineering, School of Natural Resources Engineering and Management, German Jordanian University, Amman 11180, Jordan
6
Mechatronics Engineering Department, German Jordanian University, Amman 11180, Jordan
7
Mechatronics Engineering Department, The University of Jordan, Amman 11942, Jordan
*
Author to whom correspondence should be addressed.
Submission received: 13 December 2021 / Revised: 13 January 2022 / Accepted: 15 January 2022 / Published: 19 January 2022

Abstract

:
Increased world energy demand necessitates looking for appropriate alternatives to oil and fossil fuel. Countries encourage institutions and households to create their own photovoltaic (PV) systems to reduce spending money in electricity sectors and address environmental issues. Due to high solar radiation in the Kingdom of Saudi Arabia (KSA), the government urges people and institutions to establish PV systems as the best promising renewable energy resource in the country. This paper presents an optimal and complete design of a 300 kW PV system installed in a limited rooftop area to feed the needs of the Ministry of Electricity building, which has a high energy consumption. The design has been suggested for two scenarios in terms of adjusting the orientation angles. The available rooftop area allowed to be used is insufficient if a tilt angle of 22o is used, suggested by the designer, so the tilt angle has been adjusted from 22o to 15o to accommodate the available area and meet the required demand with a minimum shading effect. The authors of this paper propose a modified scenario “third scenario” which accommodates the available area and provides more energy than the installed “second scenario”. The proposed panel distribution and the estimated energy for all scenarios are presented in the paper. The possibility of changing tilt angles and the extent of energy production variations are also discussed. Finally, a comparative study between measured and simulated energy is included. The results show that August has the lowest percentage error, with a value of 2.7%, while the highest percentage error was noticed in November.

1. Introduction

In the last few decades, there has been a trend toward using clean energy sources in the world. Those intermittent energy sources are environmentally friendly and economical throughout the years. Developing countries, in particular, are inclined to utilize such resources to meet their energy demand. KSA is one of the highest energy-producing countries in the Middle East, with approximately 63 GW, most of which depends on oil [1,2,3,4]. This fact is considered a serious challenge for the electricity sector in the kingdom. Consequently, officials and specialists are keen to look for alternatives to address this problem adequately. Therefore, the National Renewable Energy Program in Saudi Arabia has been established to develop and maximize the utilization of renewable energy resources and to become one of the main sources rather than depending entirely on oil.
Solar energy resources are considered the breakthrough that can highly overcome such power generation problems in most Middle East countries. Therefore, KSA is going toward increasing the use of solar energy to reduce the dependence on oil in producing energy. The average radiation in KSA ranges between 5 and 7 kWh/m2 [1,2,4,5,6,7,8]. This amount of solar radiation is relatively high compared to the neighboring countries [1,9,10,11]. To make the use of this free and clean energy possible, the KSA government issued legislation and laws that facilitate and assist the new installations and designs of solar energy systems on the roofs of residential and commercial buildings.
Designing a PV system requires knowledge about the solar radiation theory and its calculation. The determination of the peak sun hours, which refer to the amount of energy received by the panels or, in other words, how much energy is received during the day in a specific area, is one of the most important pieces of information needed to design a PV system [3,4]. Peak power or the kilowatt peak (kWp) of the power demand has to be calculated before determining the number of panels that have to be accommodated with the roof capacity [12].
Several research studies in the literature discussed the general assessment of solar radiation resources in Saudi Arabia and the vision of the kingdom for the upcoming decade. Network design, implementation, and data quality assurance are described in [1]. In addition, the authors analyze the first year of broadband solar resource measurements from a new monitoring network in Saudi Arabia developed by the King Abdullah City for Atomic and Renewable Energy (K.A.CARE). The analysis used 12 months (October 2013–September 2014) of data from 30 stations distributed across the country based on one-minute measurements of global horizontal irradiance (GHI), diffuse horizontal irradiance (DHI), direct normal irradiance (DNI), and related meteorological parameters. In [4], the authors provide a maiden attempt to investigate how much sustainability substance is in the 2030 Vision of Saudi Arabia. The Sustainable Society Index (SSI) has been employed to examine the 2030 Vision and understand the Kingdom’s commitment to building resilient, inclusive, and sustainable societies. The Vision and National Transformation Program (NTP) texts were matched against five broad measures and 22 submeasures. Both the 2030 Vision and the NTP align with the SSI measures in some respect. The goals and objectives reflect the aspirations and context of Saudi Arabia. The carbon emission is expected to be zero in 2060 in KSA, so it is expected to be reduced by 60% in 2030 [5]. Several projects are carried out throughout the country, and different studies are presented to introduce the system regulations and policies. According to [6,7,8,9,10], certain policies that promote the renewable energy sector and regulate the relations with electricity and grid connection sectors are subsidized in KSA. The net metering and feed-in tariff policies are employed to exchange the surplus energy with the electricity network in KSA.
For rooftop PV systems, net-metering was tested in 2017 and found to be the most suitable policy for small-scale PV systems. The applicability of using feed-in tariff (FiT) policy in KSA is reviewed in [11], in comparison with that implemented in USA and Germany. It is concluded that KSA has the ability to adopt and use this technique.
Specific case studies in KSA have also been discussed in the literature to achieve the vision of the kingdom in the sector of solar energy. The authors in [12] examine the best tilt angle for a solar panel to maximize the collected amount of solar irradiation. A daily global and diffuse solar radiation measured on a horizontal surface is considered in this research. The optimal angle for each month allows capturing the most solar energy for the Madinah site, KSA. The authors concluded that the annual optimal tilt angle is almost equal to the location’s latitude. In [13], a comprehensive analysis is presented in order to improve the solar energy performance of residential buildings in KSA by optimizing the building envelope elements. The elements included in energy cost and energy energy-saving analysis include the wall insulation, roof insulation, window area, window glazing, window shading, and thermal mass.
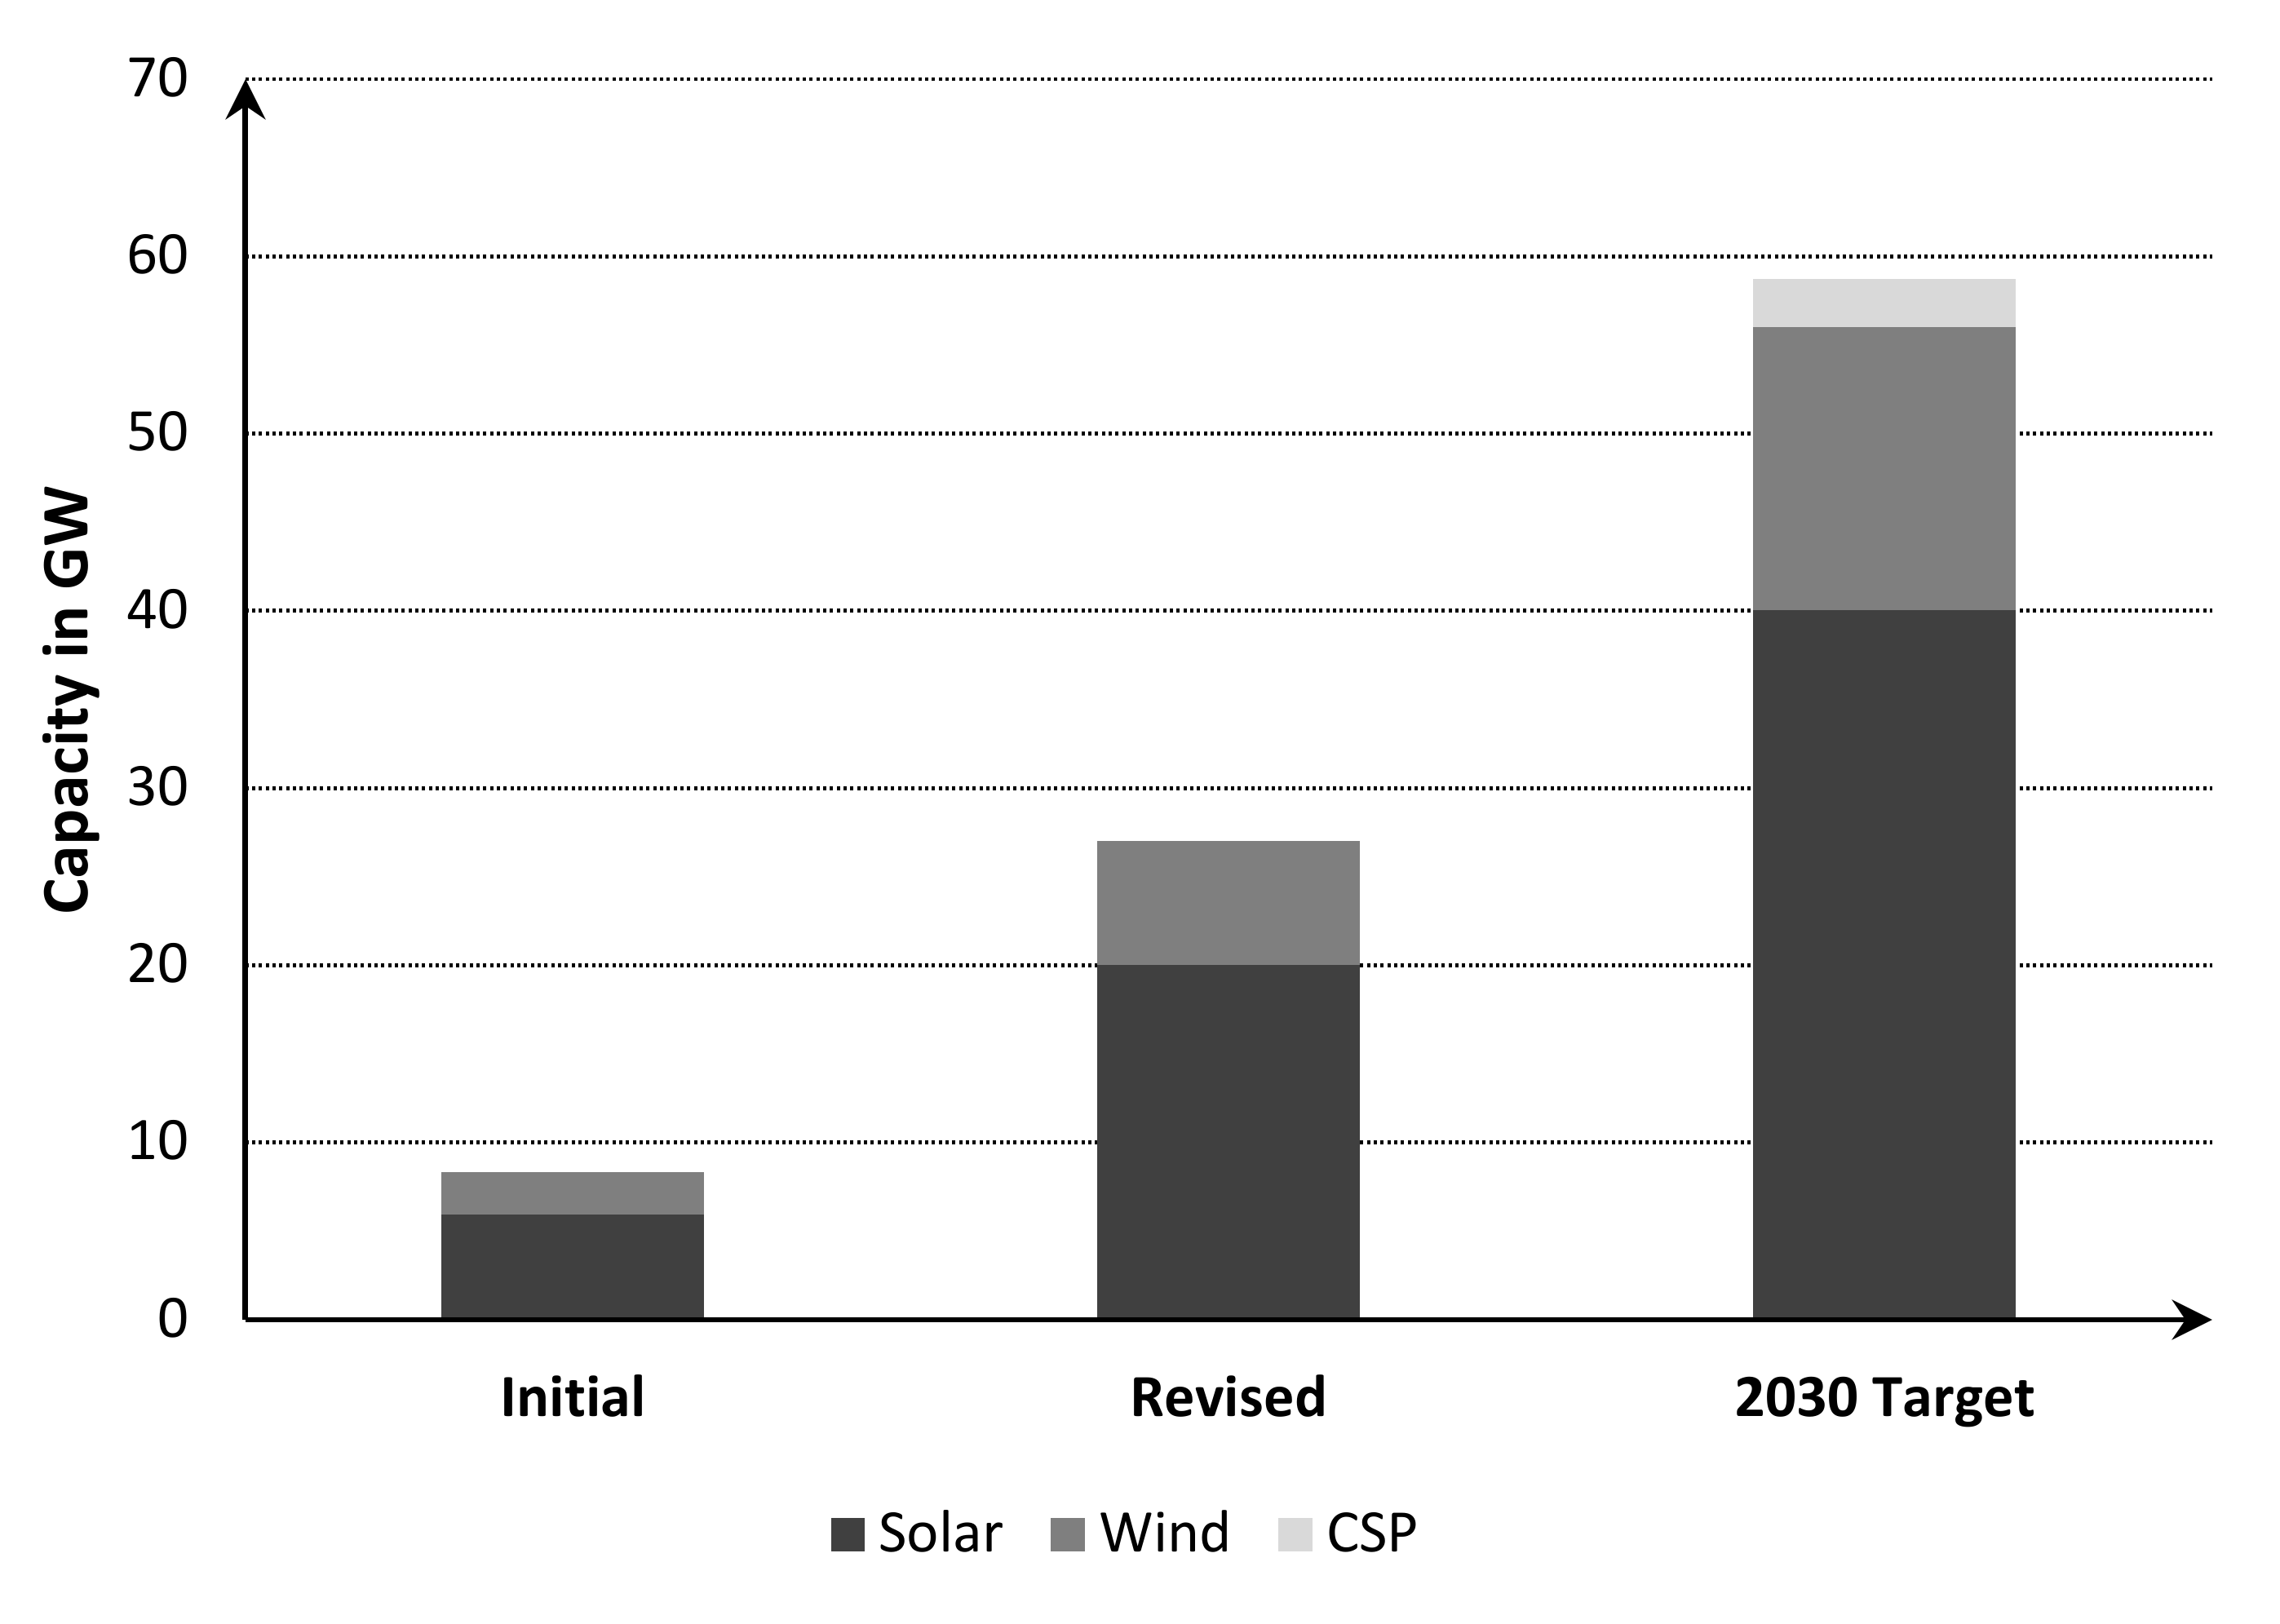
Figure 1 illustrates the anticipated progress towards increasing the energy produced by renewable energy resources. Overall, the targeted capacity by 2030 would cover 58.7 GW as stated by the kingdom vision [1,2,3]. The plan set an initial step of producing 9.5 GW of electrical energy, followed by producing 27 GW in the next five years. By maintaining efforts, the plan is expected to be realized, as previously presented, utilizing solar, wind, and CSP energy.
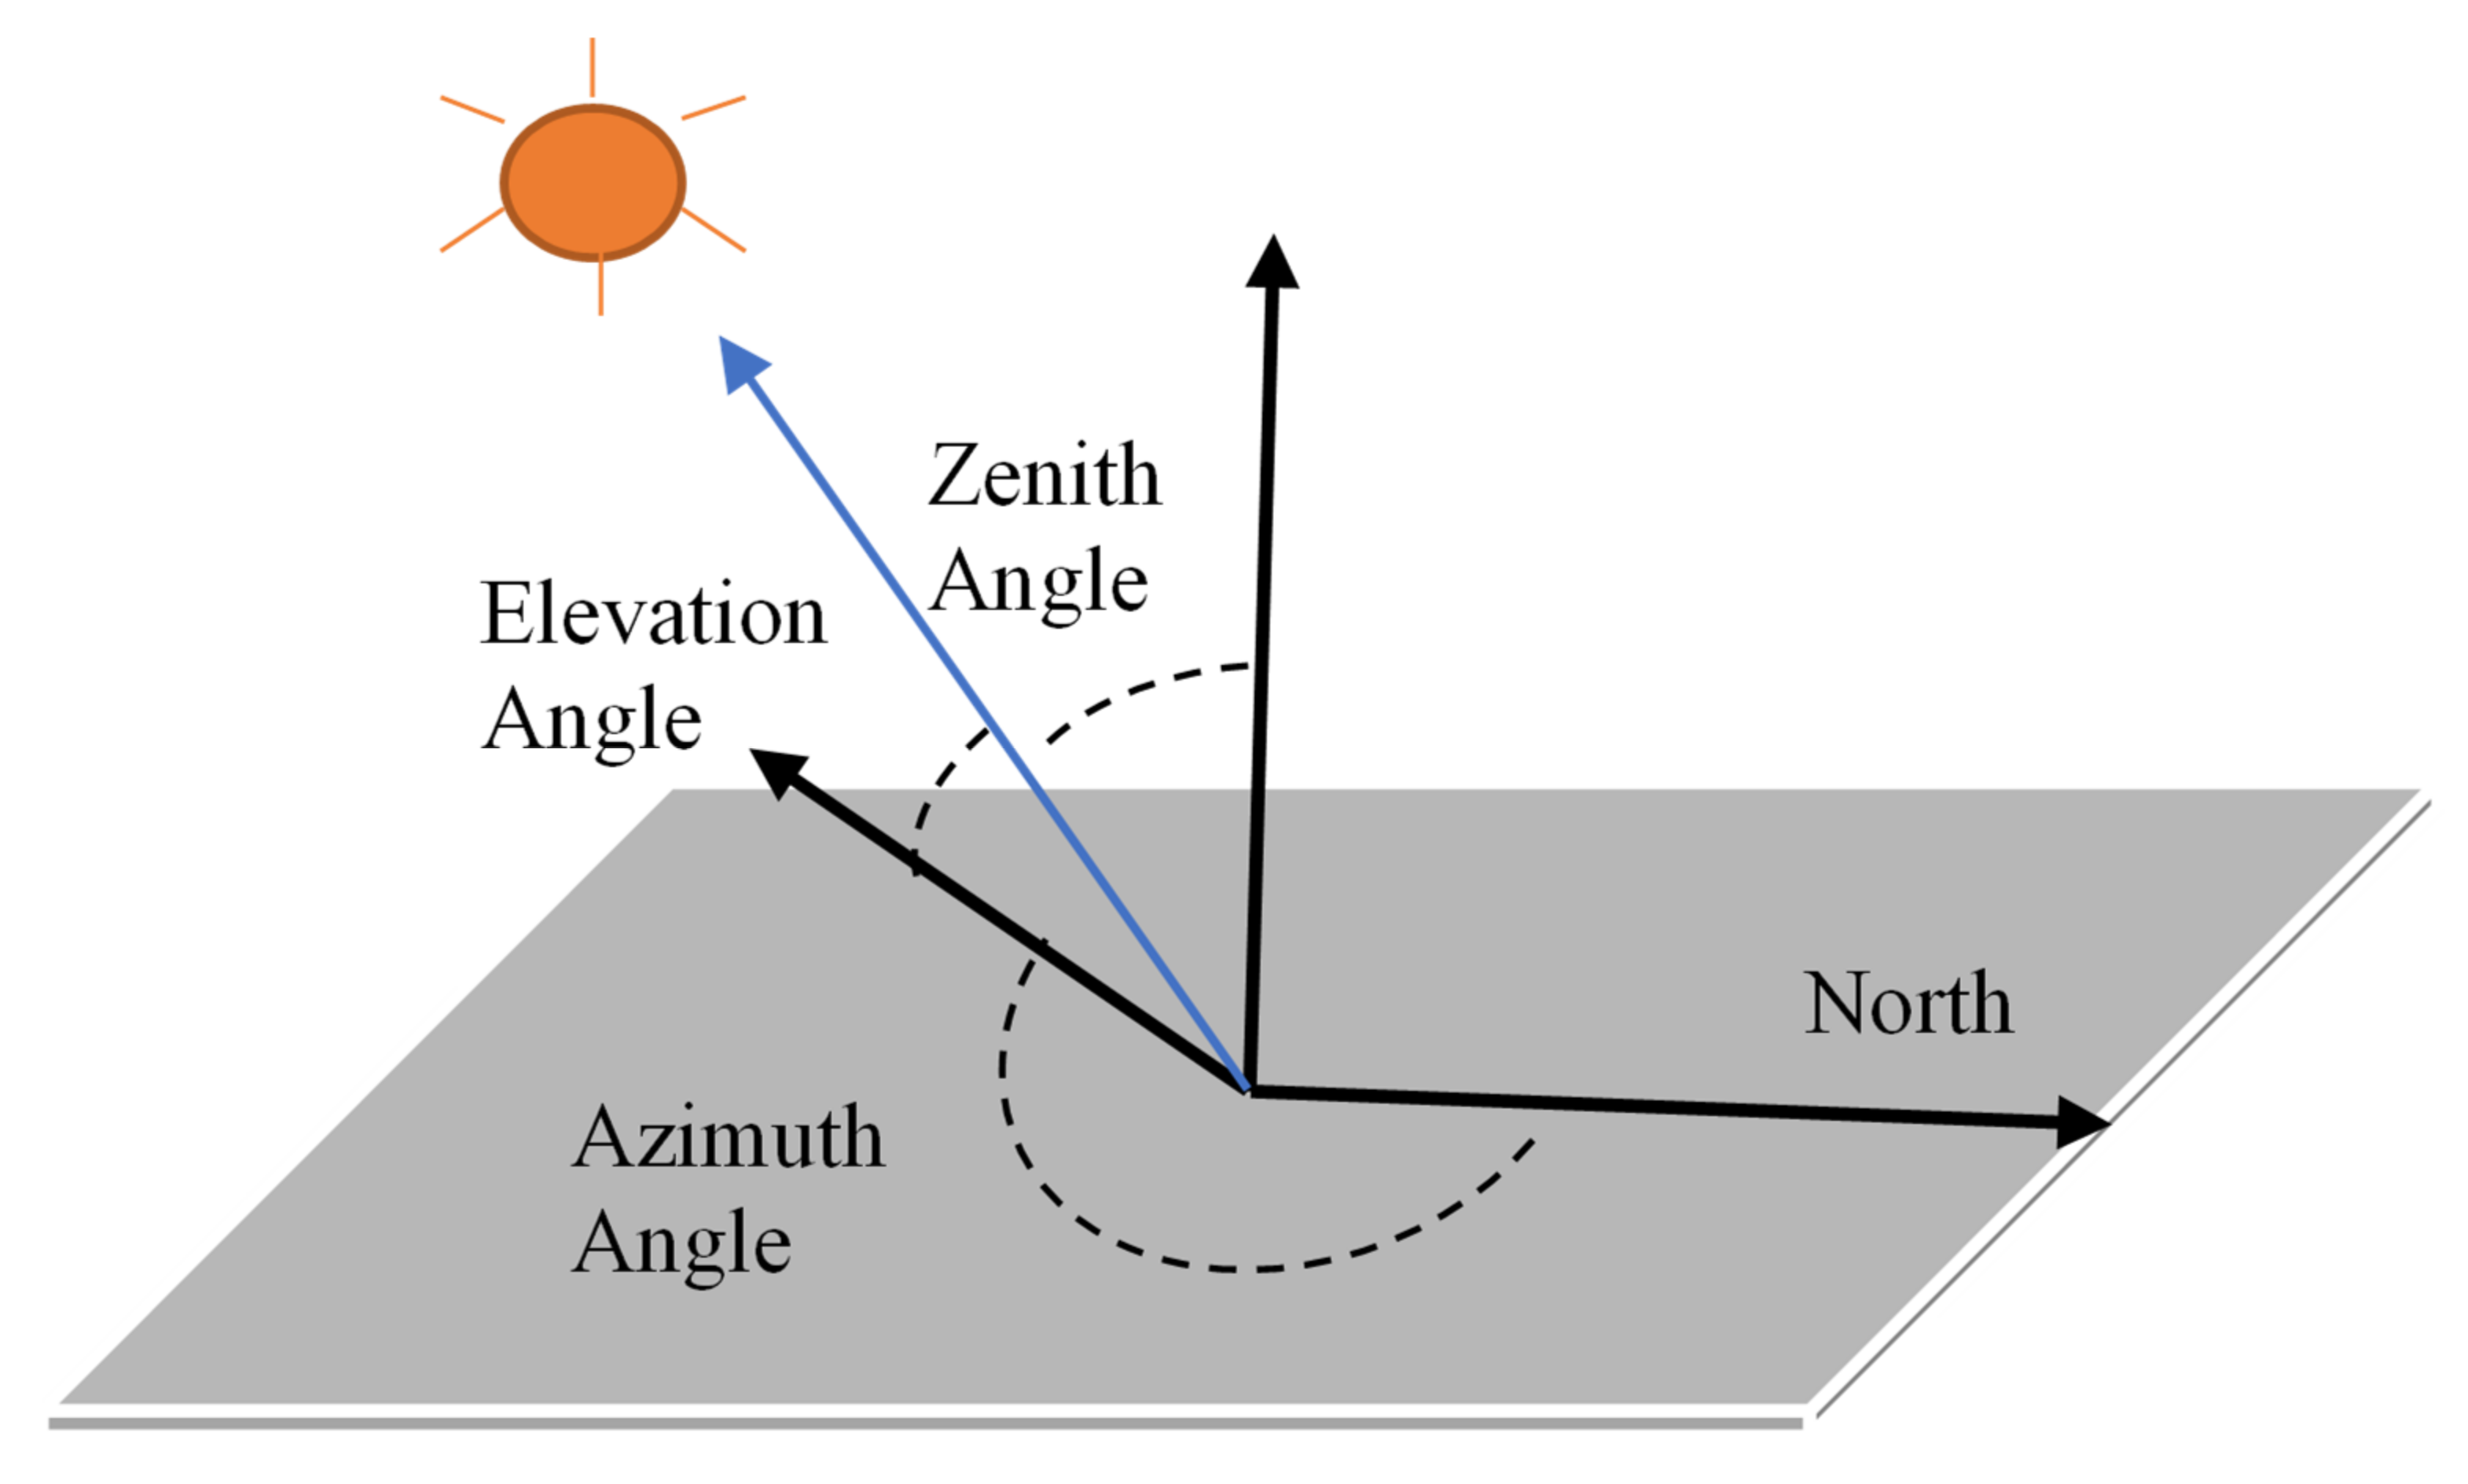
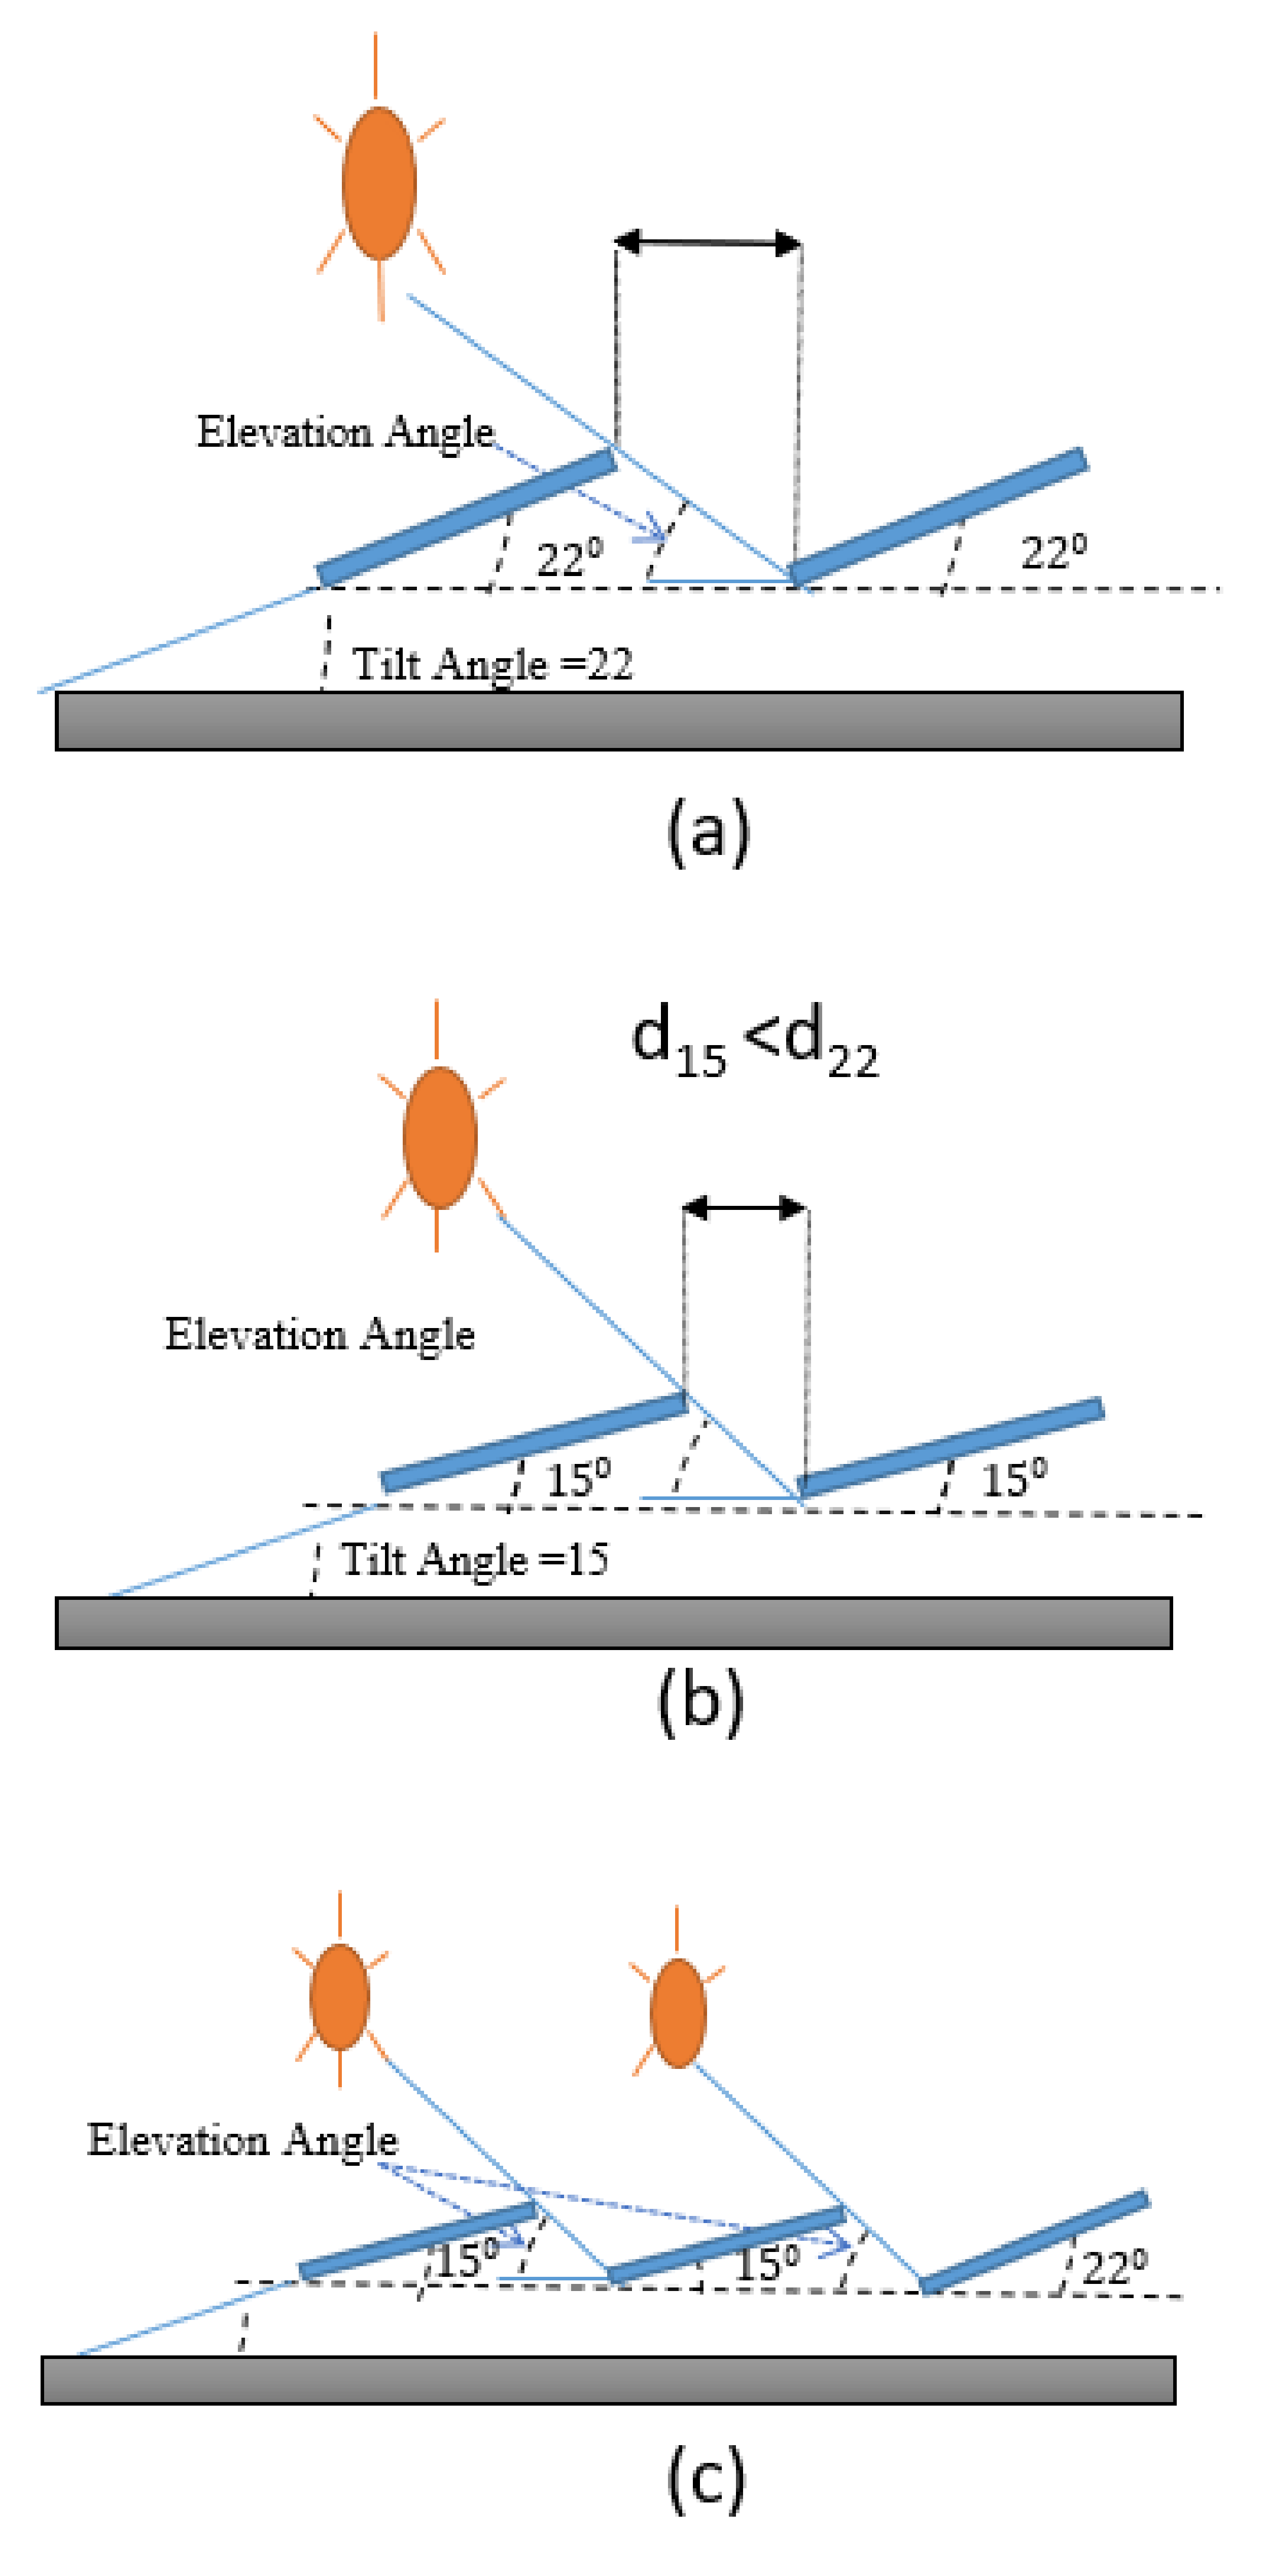
When installing the PV system over buildings’ roofs, one of the significant factors that should be considered is the sun path. The more solar panels exposed to the direct sun, the more energy is harvested. Each location in the world has a specific sun path and unique tilt, azimuth, and elevation angles [12]. Figure 2 represents the most significant angles that play an important role in PV system design.
The desired tilt angle varies according to the case study under test. The designers should ensure that the solar panels face the sunlight perpendicularly, as much as possible, since the solar panels produce the highest power when they face the sun directly. During the winter semester, the solar panels face the sun at a sharp angle. Therefore, the energy produced by the PV system is low compared to the energy produced during the summer semester. In the winter semester case, the operator should ensure harvesting large amounts of solar energy by choosing proper orientation angles. The optimum tilt angle in KSA is approximately equal to the site’s latitude under test [13,
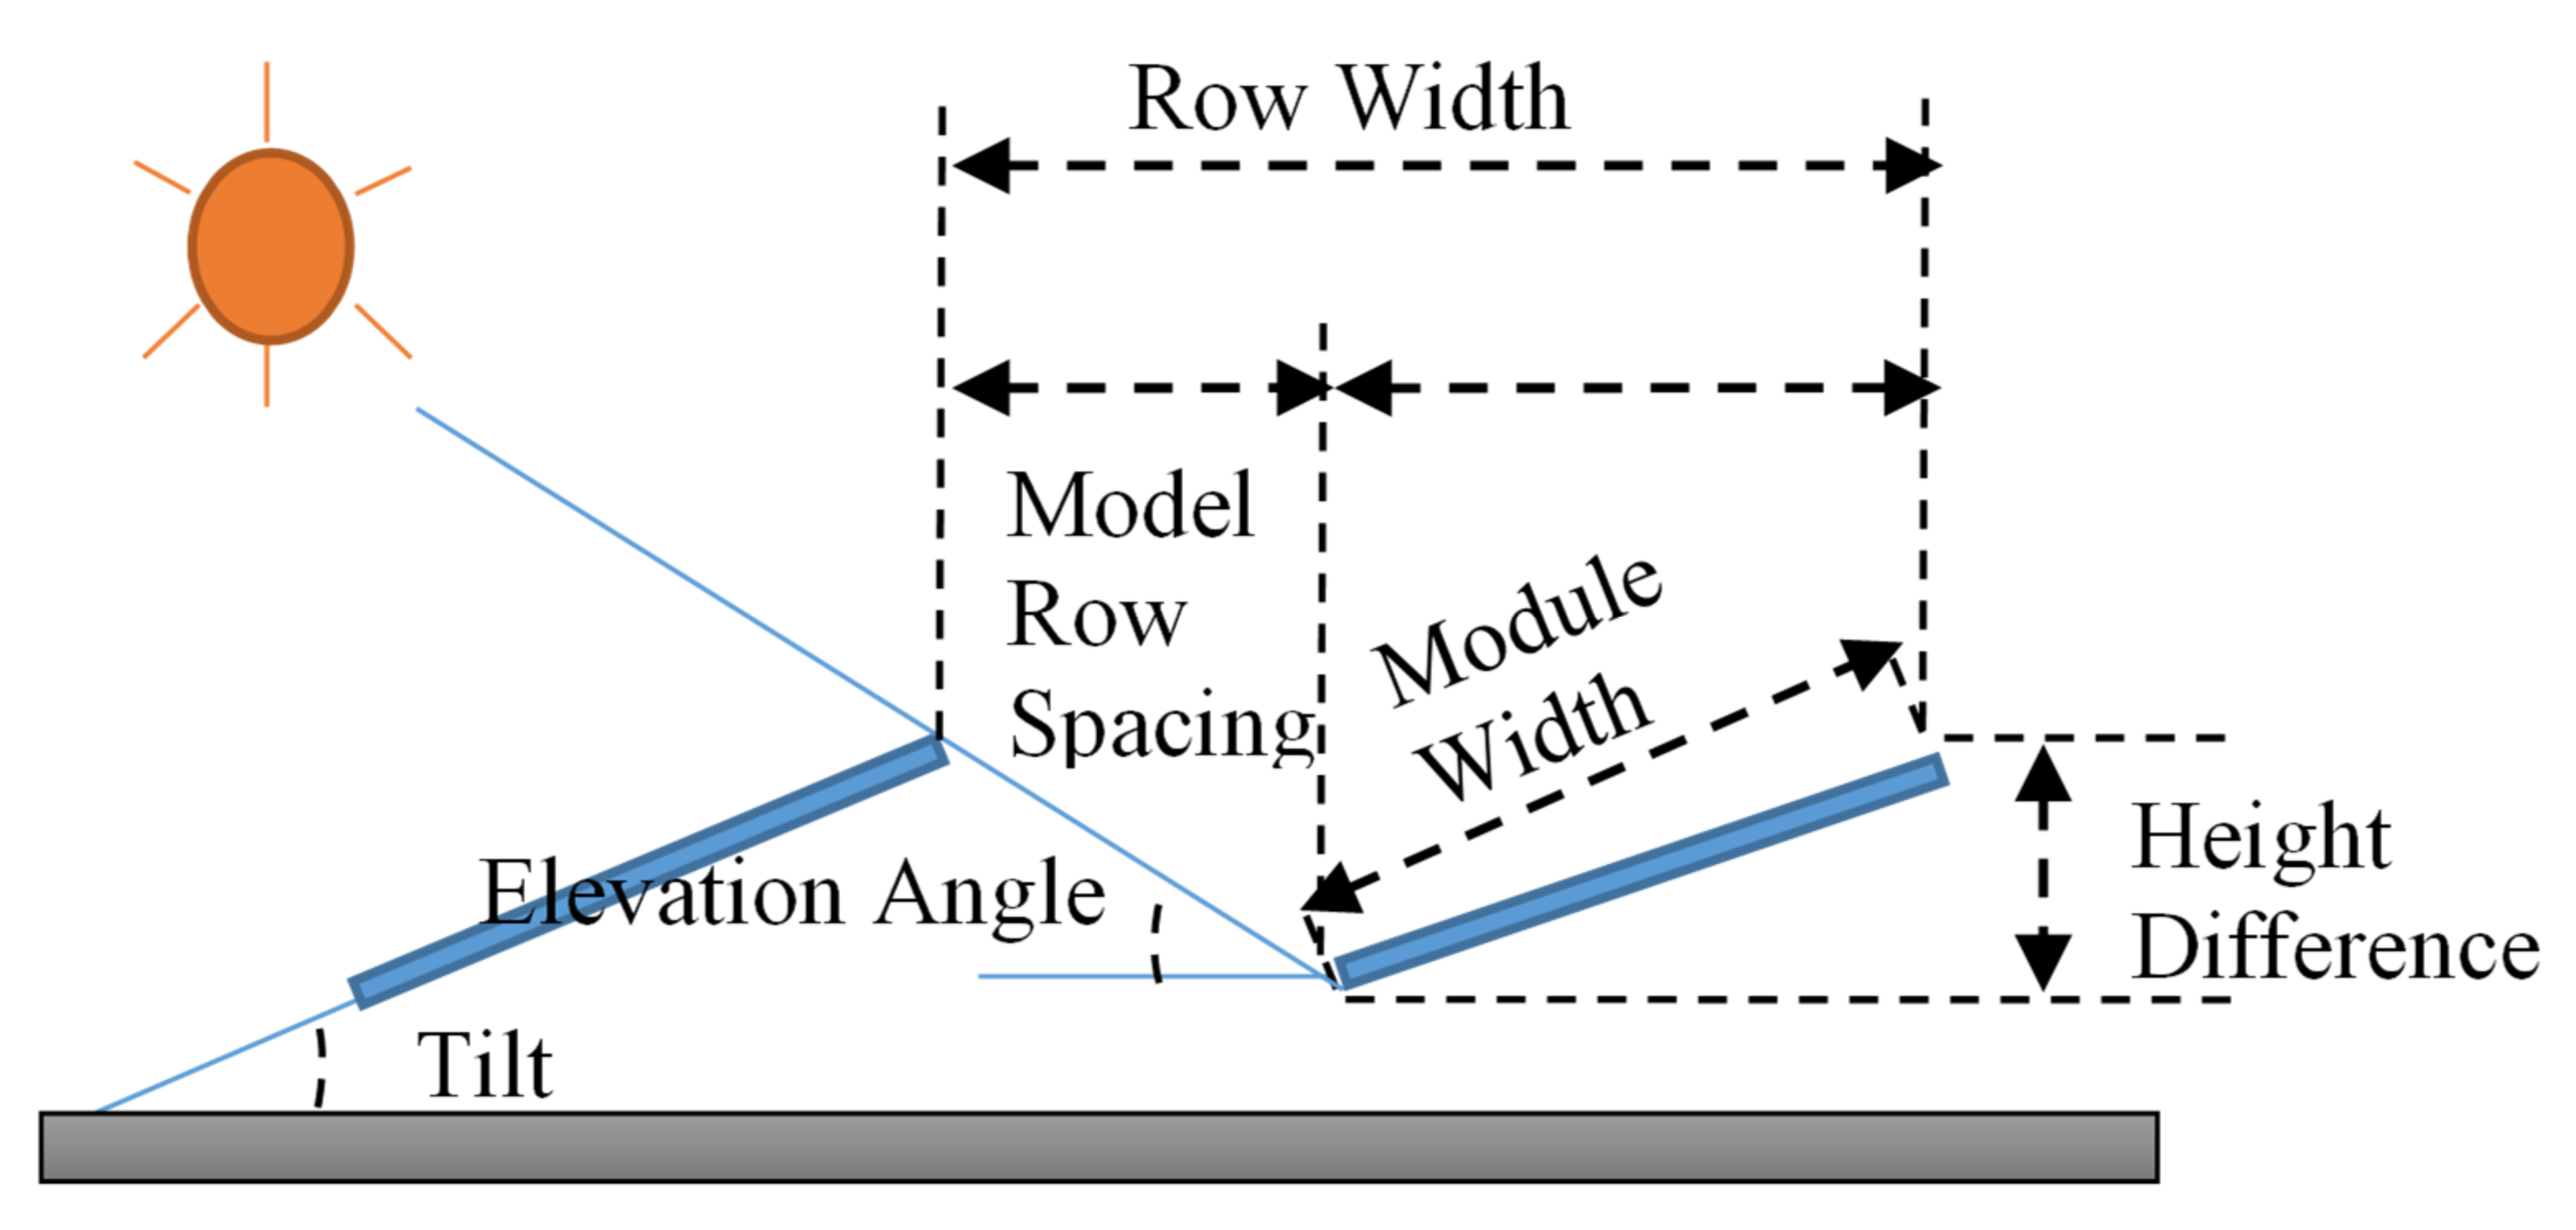
14]. In addition, the elevation angle significantly affects the proper method of installing the panels with the most suitable spacing between rows. This must be determined to avoid the possibility of energy reduction that panels cause for each other. 
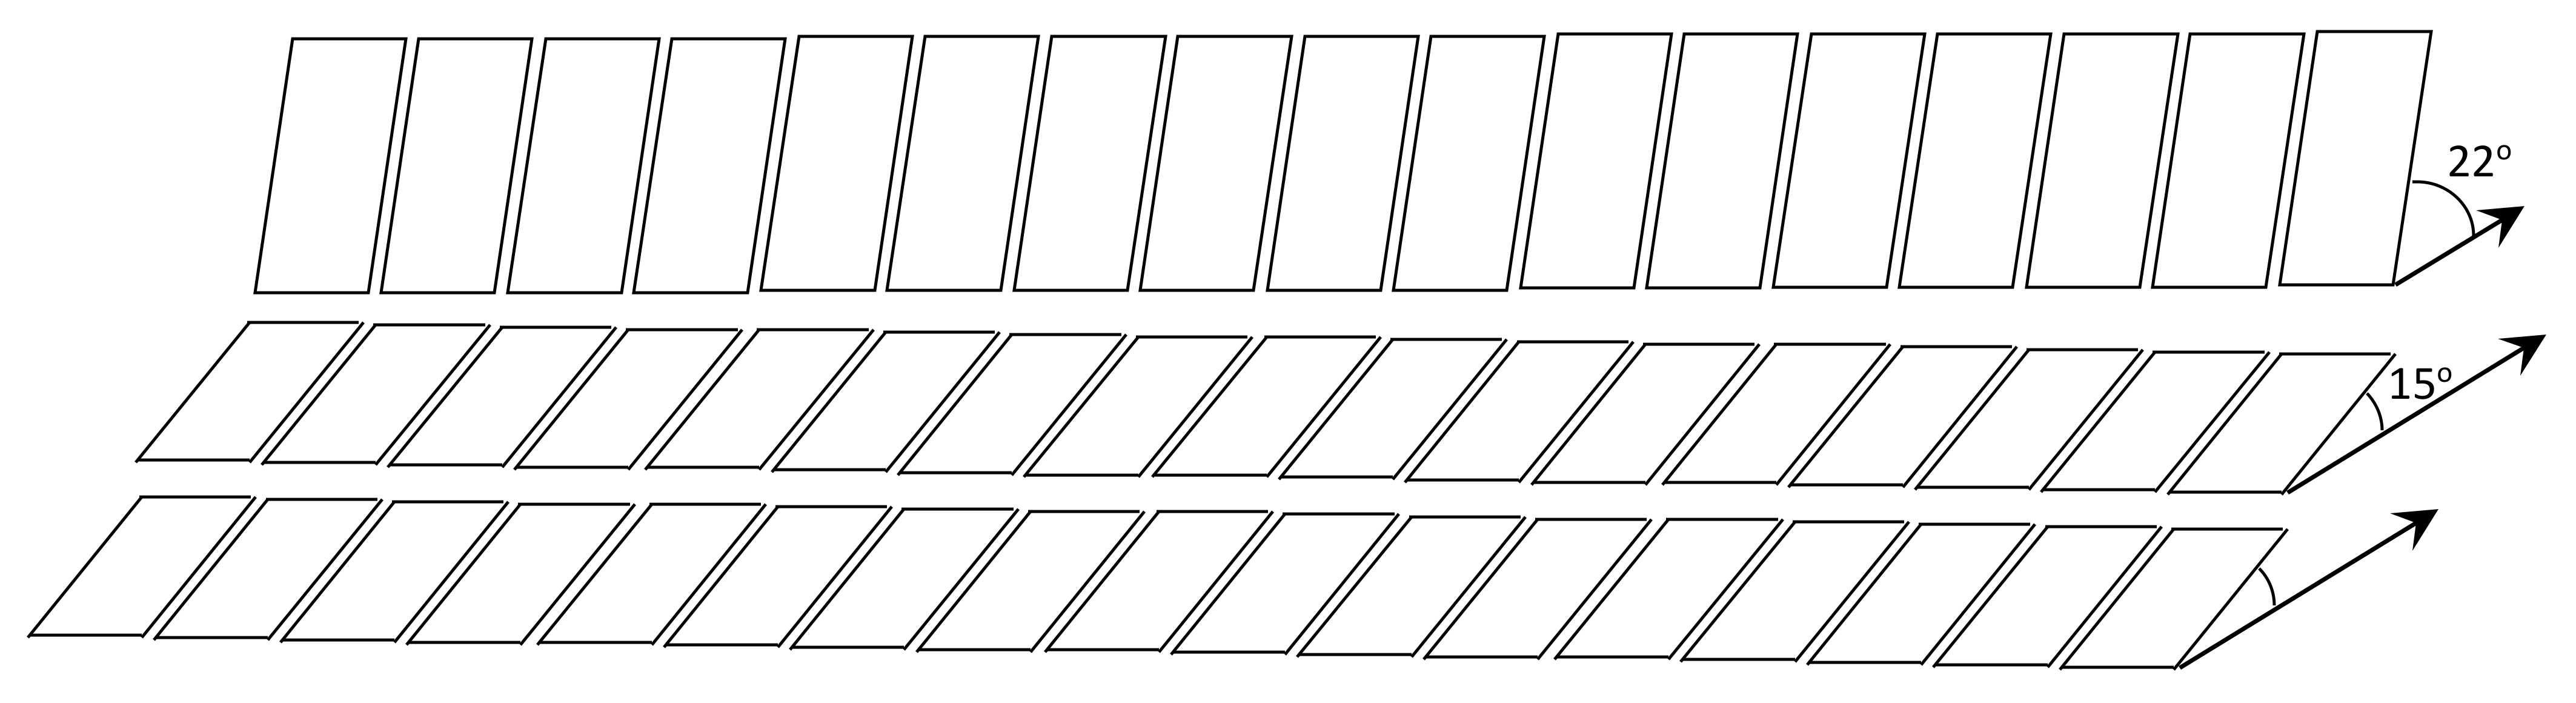
Figure 3 illustrates the relationship between elevation angle and spacing between rows in the PV system.
Several studies consider the performance of rooftop solar panels by assessing different design and simulation methodologies. The effect of rooftop obstacles and shadow can be determined using photovoltaic software to identify the azimuth and tilt angles [15]. One study assesses the impact of a building’s shading and analyzes the available rooftop area using hillshade analysis [16]. The study estimates the potential of a rooftop system when shaded area is excluded. PV systems in rooftops and facades and a shadow algorithm are developed in [17]. It is concluded that although facades receive lower solar radiation, they have a substantial impact on potential urban PV systems once they are utilized. Mangiante et al. in [18] carried out a comparison between rooftop solar arrays in terms of neighborhood orientation and tree shadows. These obstacles affect the solar energy potential. The height and age of the trees are found to have an effect as well.
Other research studies are conducted to investigate the available areas on the surface of the urban cities [19,20,21,22,23]. In [19], a review systematically presents the studies that consider estimating the rooftop area of the cities and the potential deployment of rooftop PV systems. A technical and geographical assessment of the rooftop area in urban cities using novel methodology is presented in [20]. A hierarchical methodology is employed for the estimation process, which encompasses three phases of estimation: physical, geographical, and technical potentials. Geometry calculations and irradiation analysis for tilted rooftop surfaces are performed in [21], including the use of image processing for shadow estimation algorithms in different sun positions. It has been found that in large urban cities, the appropriate analysis method needs three-dimensional data of the studied location.
Many articles focus on solar capacity assessment in rooftop systems in terms of sizing, installation angles, and the efficiency of photovoltaic systems [24,25,26,27,28]. The complete design of a grid-connected PV system is presented in [24,28]. Performance investigation and rooftop analysis are carried out in [26,27,28,29,30,31,32]. In [26], a financial and technical feasibility study is performed, which is applicable for only certain geographical locations and weather conditions. For evaluating system performance, the authors in [25] provide a photovoltaic plant design that operates with a seasonal tilt angle according to plant location. The tilt angle is set to be the same as the corresponding latitudinal value of the location to obtain the highest solar radiation. In [29], the rooftop area is assessed using the optimal tilt angle, and 60% of the area is found to be suitable for photovoltaic system implementation.
The research study in this paper aims to fill the gap by providing a comprehensive solar analysis to investigate the feasibility of establishing an on-grid PV system of 330 KW in KSA, exactly in Jeddah city, and introduce the proper building approach. The project is designed to feed the needs of the Ministry of Electricity building, which is a governmental complex with high energy-consuming appliances. The design aims to find the proper way to distribute the solar panels on the roof of the Ministry buildings. This task has been achieved by manipulating the tilt angle until obtaining the desired angle which enables the working staff to accommodate the available area with targeted production, considering that the shading must be avoided and reduced as much as possible.
The rest of the paper is organized as follows: 
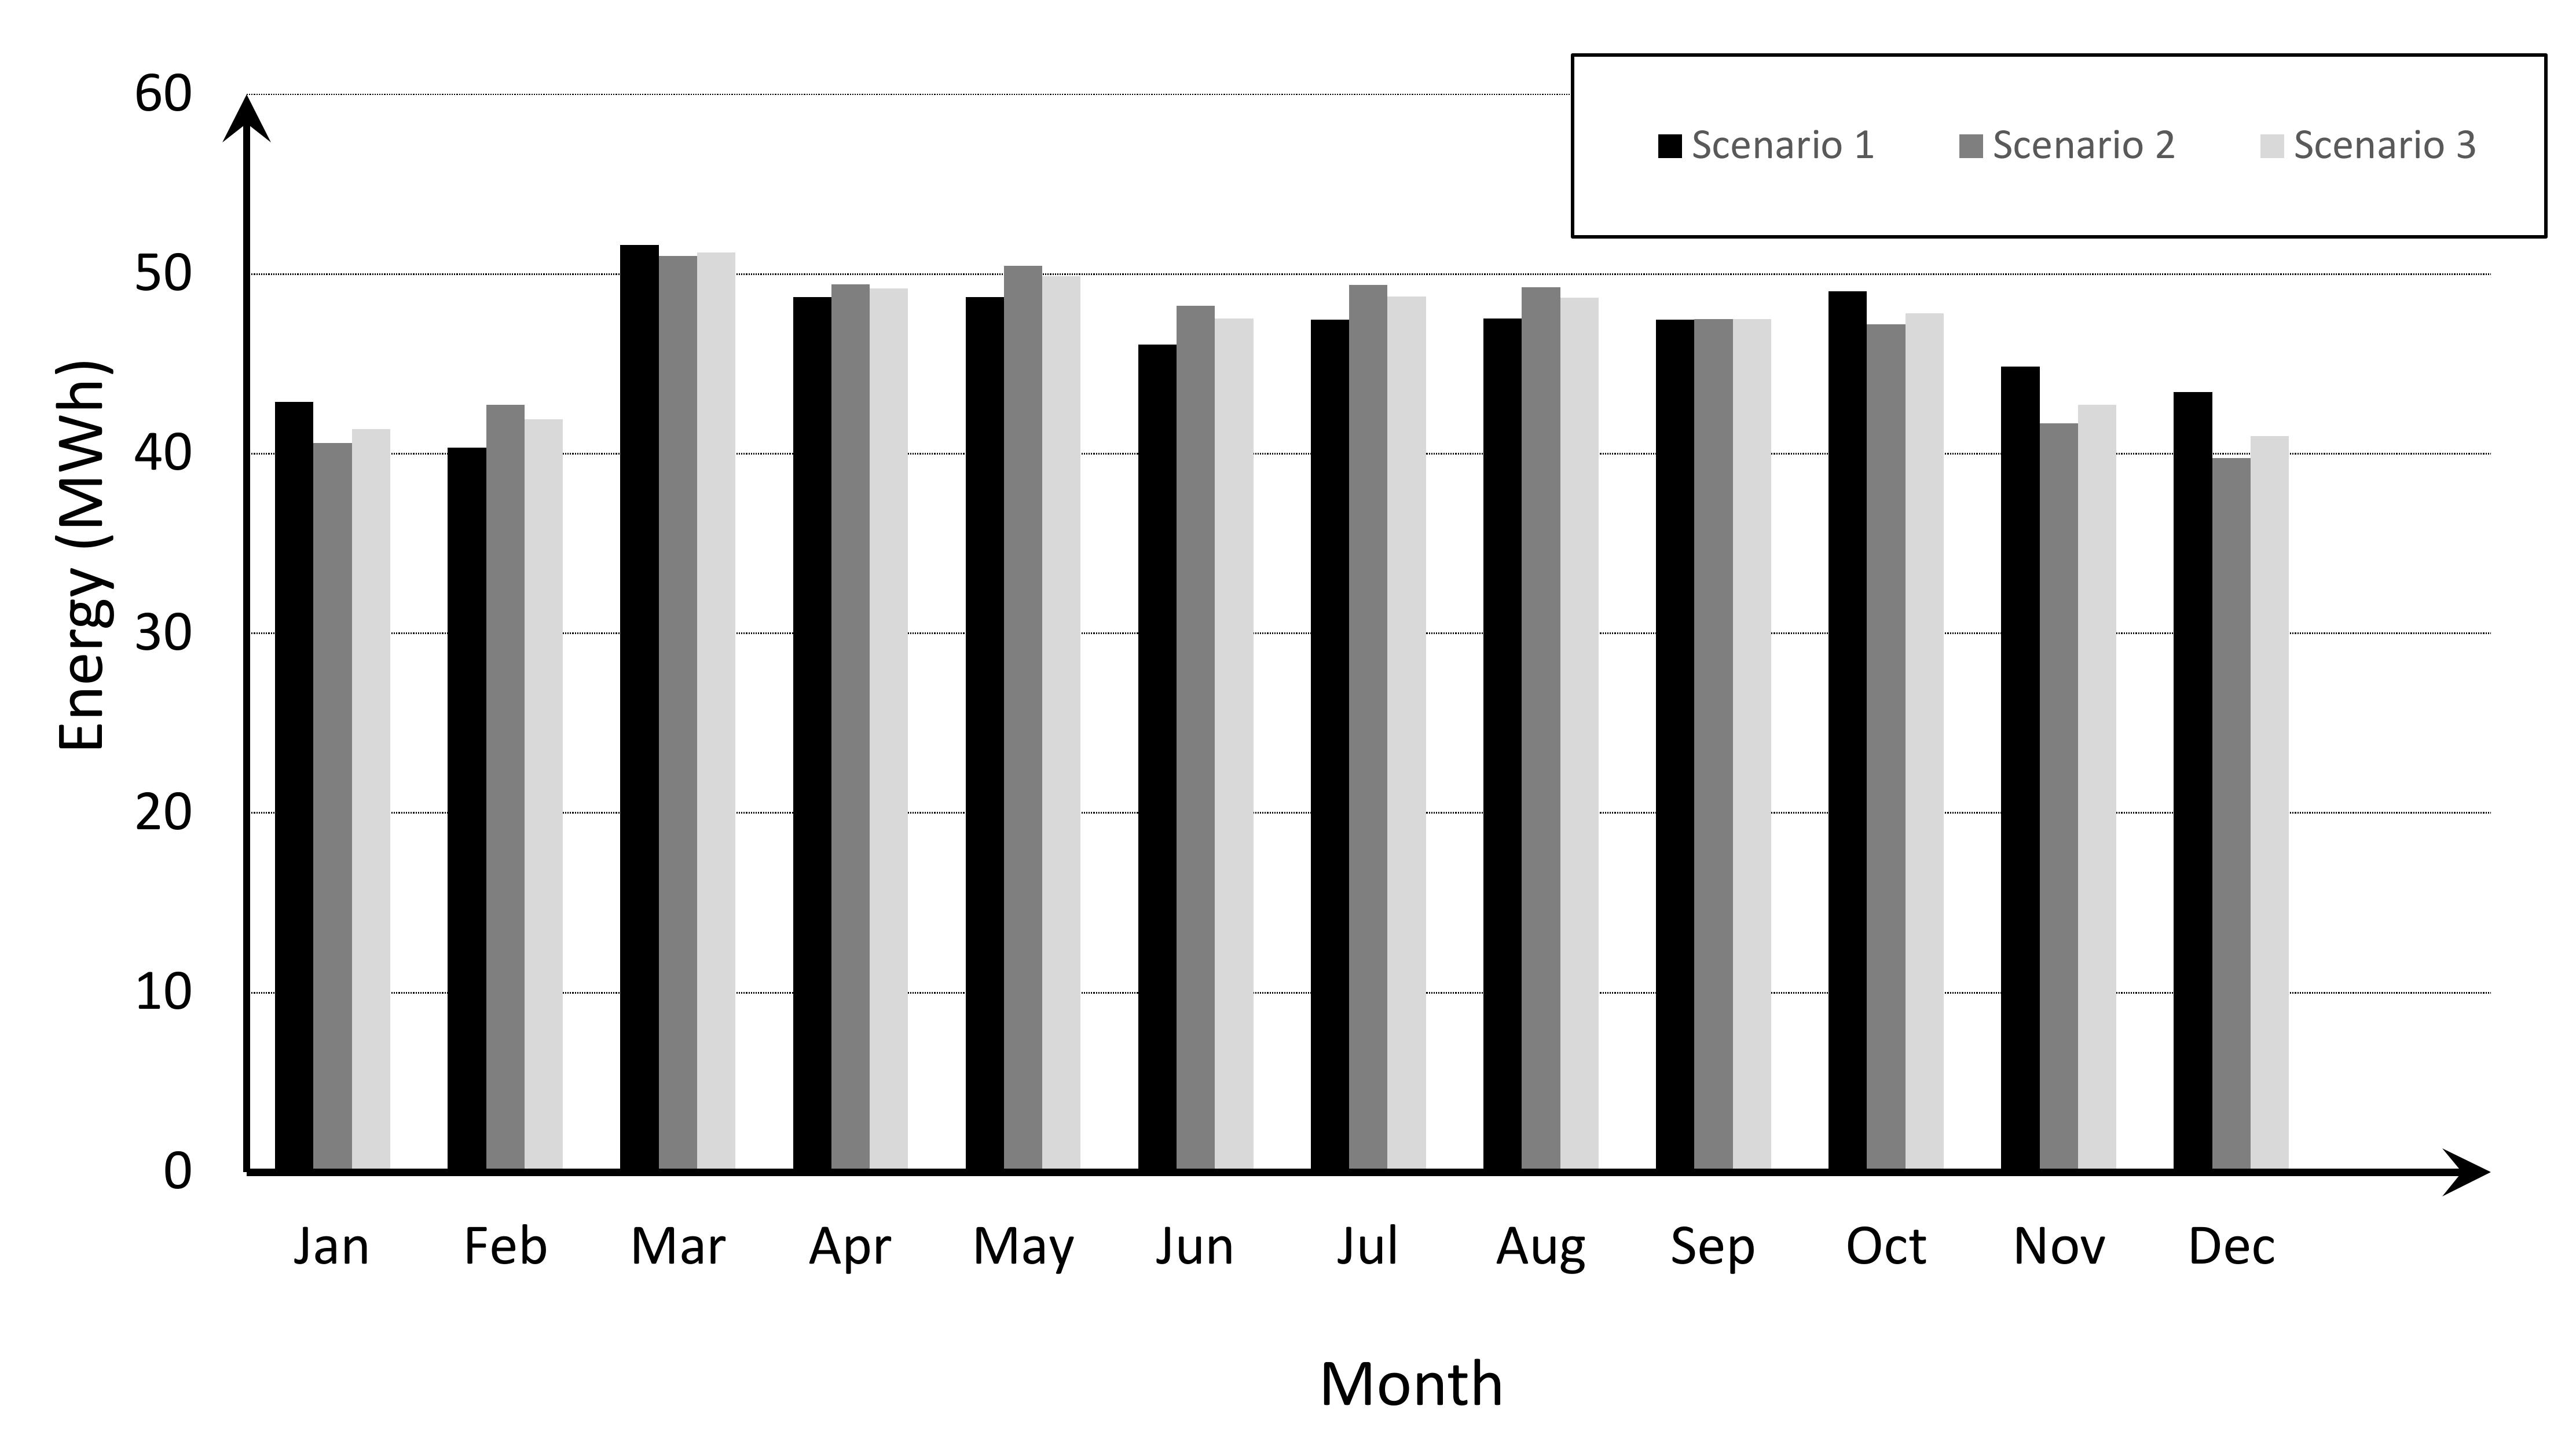
Section 2 describes the design methodology of the PV system under test; two different scenarios are suggested in this section. The energy production for both scenarios is presented and compared. Panel orientation is discussed in Section 3, in which different orientation angles are defined and presented. The single-line diagram of the entire system is also presented in this section. PVsol simulator is used to estimate the performance ratio of this study. The size of the PV system for the second scenario is introduced in Section 4. Finally, the number of needed PV panels and inverters and the appropriate approach of connections are discussed in this section, prior to the conclusion in Section 5.

2. Design Methodology

The goal of establishing this project is to reduce the electricity bill by utilizing the empty spaces in the roof of the buildings and identifying the adequate distribution of solar panels. Table 1 shows the monthly and annual energy consumption of the building. The sizing of the project depends on the capacity of the available spaces. PVsol software was used to investigate the most appropriate orientation of PV panels. The targeted building needs 333 KW, which is the desired capacity. It is a serious challenge to accommodate such demand with a limited area. Undoubtedly, it is required for the designer to identify the proper orientation of solar panels. By adjusting the tilt angles, two scenarios were at disposal. The first scenario requires the utilization of three roofs of Ministry buildings while the second one requires only two roofs, which is the allowed case.

2.1. First Scenario

As previously mentioned, the first scenario required the space of three roofs to install PV panels due to the proposed tilt angle. The first suggestion was to adjust the tilt angle to 22° to harvest solar energy as much as possible (see Figure 4). The advantage of this approach is that the system’s efficiency is more significant than those with lower tilt angles. The optimum tilt angle differs depending on the case study under consideration. Solar panels create the most power when they face the sun directly, so designers should make sure that the panels face the sun perpendicularly as much as feasible. In addition, large space is needed to meet the desired energy capacity at the optimum tilt angle of 22° (three complete roofs as previously mentioned), but only two complete roofs are available. Therefore, the second scenario is proposed by the designer to accommodate the limitations in the roof areas.

2.2. Second Scenario

To face the problem of being forbidden to use the entire area, one possible solution is to change the tilt angle to reduce shading and accommodate the area restriction with targeted capacity. This was done by decreasing the tilt angle to 15° rather than 22°. This will reduce the distance between the PV panels to prevent shading and consequently reduce the entire area of installation. Figure 5 presents the distribution of the PV panels on the available area using the second scenario in which the tilt angle is 15°. It is clear that the PV panels are installed over two complete roofs and three separate small, distributed roofs in which the total area is less than the first scenario area.

2.3. Third Scenario

An additional solution has been suggested by the authors to accommodate the limited area of the roof buildings. The solution is based on using the optimal tilt angle of 22° for the first string of the PV system and a tilt angle of 15° for the other strings. The advantage of using this configuration is that it provides more energy than the second scenario and accommodates the limited area of the roof building without shading. Figure 6 shows the authors’ proposed configuration, which can be used over buildings’ roofs where the area is limited. Figure 7 shows the relationship between elevation angle and spacing between rows for all scenarios. It is clear that the distance between rows is increased by increasing the tilt angle. Therefore, the first scenario has the maximum spacing between rows.

2.4. Estimating of Energy Production

This section presents the method of estimating the energy production of the PV systems by varying the tilt angle. In addition, a comparative study between the simulated energy output of the PV system and the measured ones is also presented in this section.
The energy produced by the PV system (E) depends on several parameters as suggested by [32]:
E = A × r × G R × P R
where:
  • A—Surface area.
  • r—Solar panel efficiency.
  • GR—Tilted surface mean solar radiation.
  • PR—Performance ratio.
The performance ratio used in this study is 0.798, according to the PVsol simulator for the system, while the average solar radiation for tilted surface, GR, is given by [33,34]:
G R = G D R B + D R D + G ρ R R
where G and D are ground and diffuse solar radiation in kWh/m2, respectively. The symbol ρ refers to the ground reflection, and the radiation coefficients RP, RD, and RR are given by [35,36,37,38,39]:
R P = cos L β cos δ cos ω s s + sin L β sin δ cos L cos δ   cos ω s s + sin L   sin δ
where L, β , and ω s s are location latitude, tilt angle, and hour angle, respectively. δ is the declination angle and can be given by:
δ = 23.45   sin 360 284 + n 365
where n is the number of days in the year. The reflected solar radiation RR is calculated as:
R R = 1 cos β 2
R D = 1 + cos β 2
By simulating and substituting the previous equations, the energy yield can be estimated for the intended location.
As mentioned before, the three scenarios would produce different amounts of energy even though the number of panels is the same. The energy production of the PV system varies during the year, in which the maximum energy production is in May and the lowest energy production is in December in both scenarios.
Figure 8 presents a comparison between the energy production for all scenarios. It can be noticed that the first scenario has the maximum energy production, followed by the third scenario. This is expected due to the higher tilt angle which exposes the panels to more solar energy than the second scenario. Furthermore, in the first and the third scenarios, the area of the panels exposed to the sunlight is greater than that in the second scenario. However, the second scenario has been installed by the designer due to the reasons mentioned before, while the third scenario is a new scenario suggested and presented in this paper.

3. System Configuration

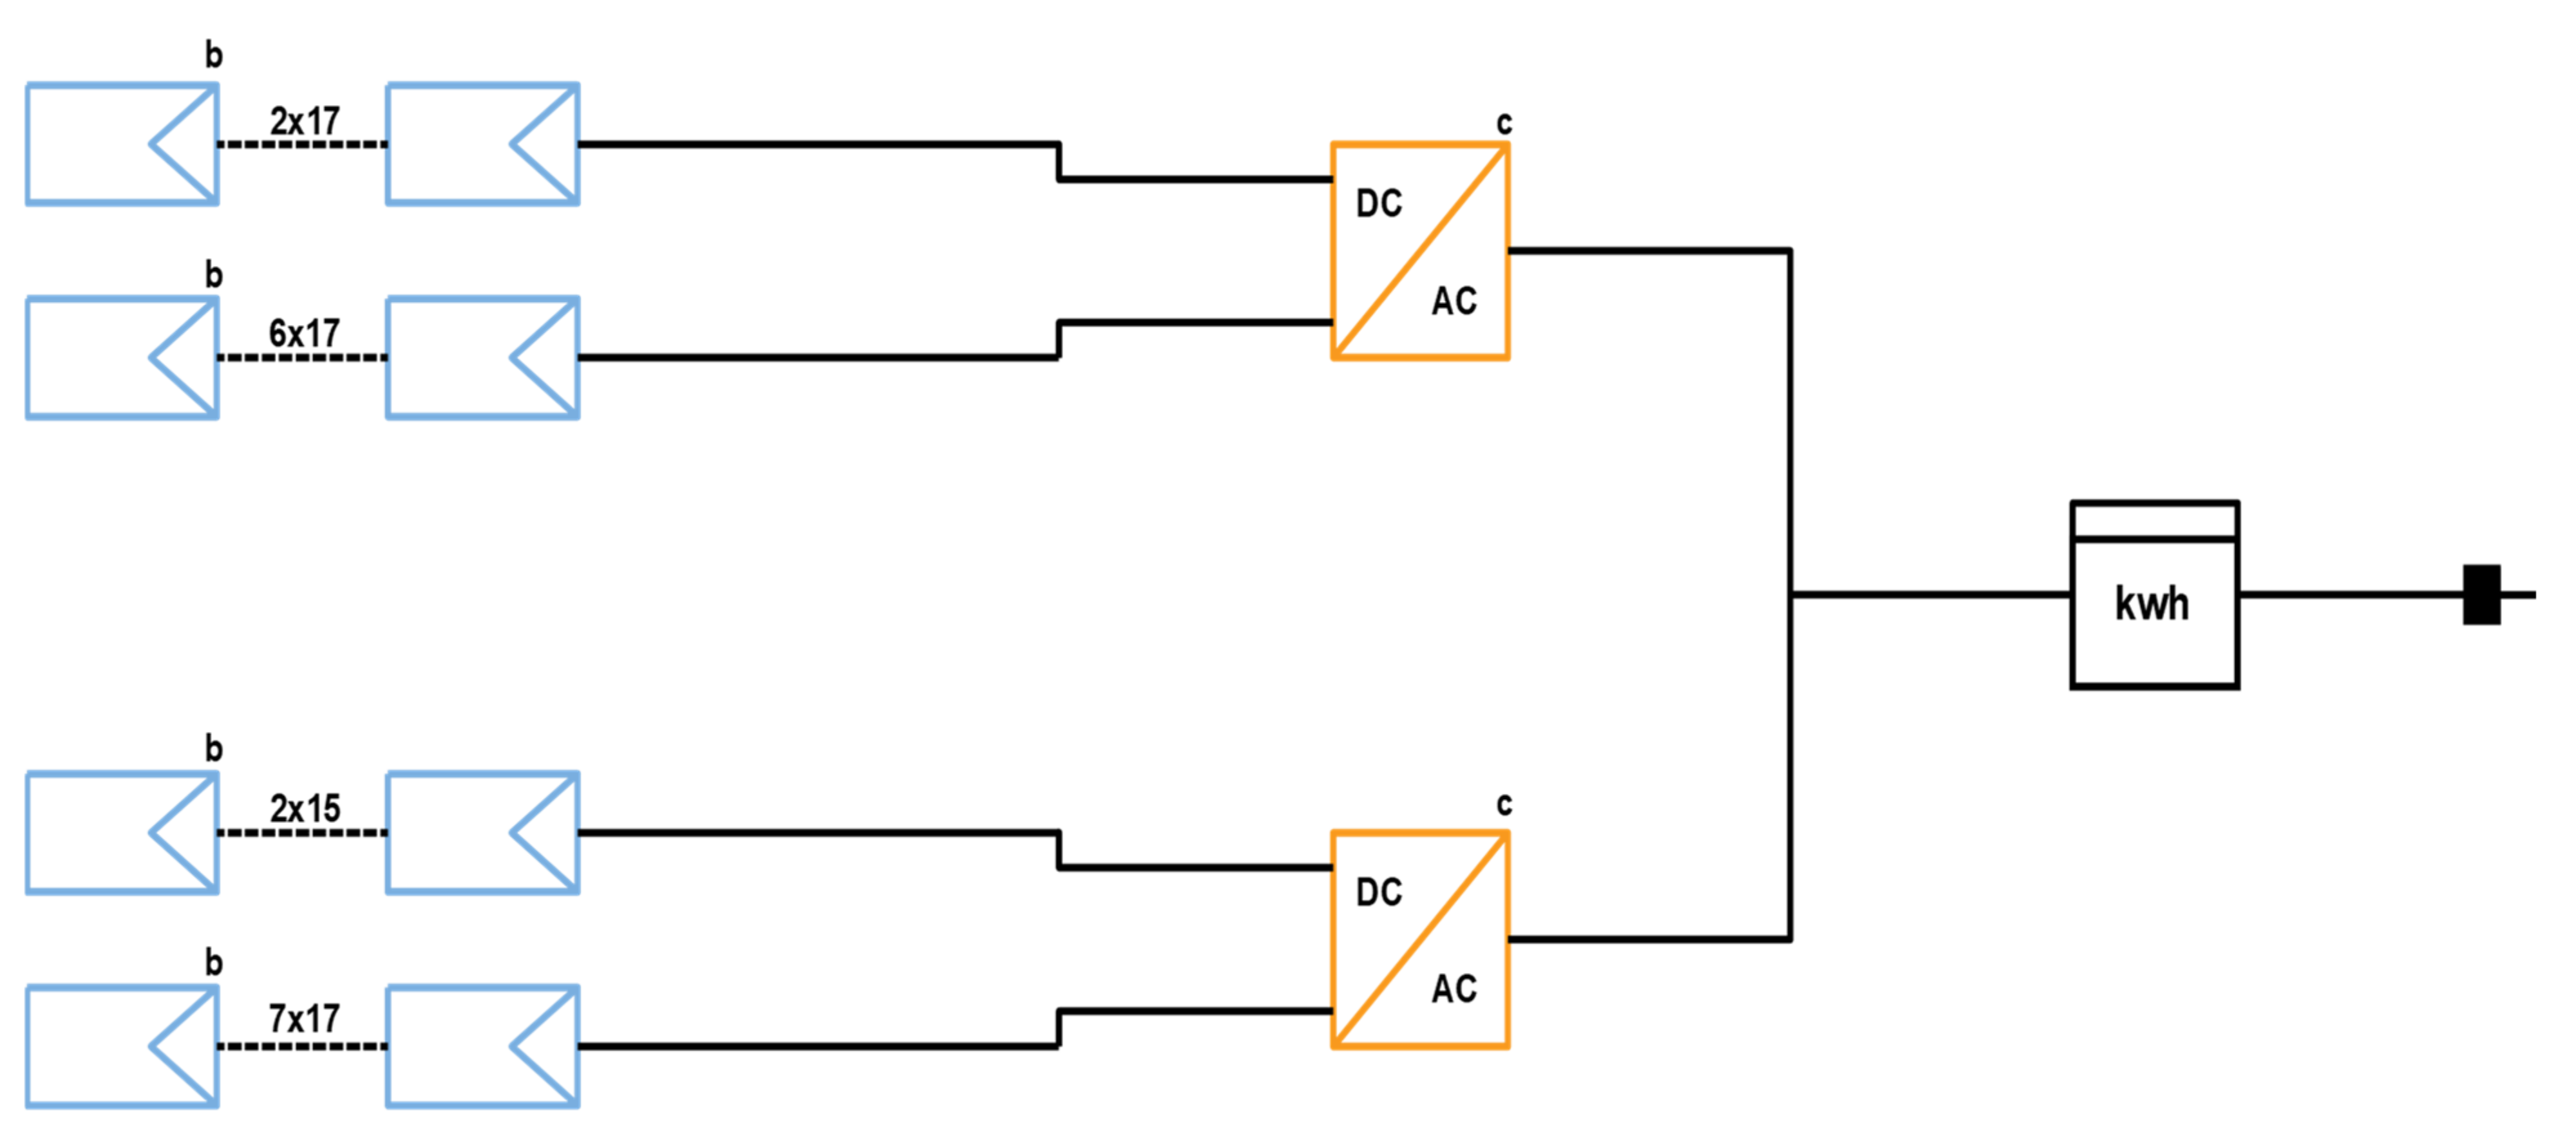
The connection diagram between the panels and the inverters is shown in Figure 8. The panels are connected in four main groups: 2 × 17, 6 × 17, 2 × 15, and 7 × 17. Each group has a specific number of strings, in which panels are connected in series.
Table 2 gives details about the selected tilt and elevation angles, the distances between the PV panels, and the total roof areas for all scenarios. Table 3 shows solar irradiance in kWh/m2 at different inclination angles.
In this section, the size of the PV system for the second scenario, which has been selected, is introduced. The number of needed PV panels and inverters and the appropriate approach of connections are discussed.
The required PV panels that met a demand of 300 kW are decided to be 790 modules of 380 W each. In addition, six inverters are needed to integrate the PV system with the grid [30,31]. The method of connecting the PV models with the inverters in the form of strings is shown in Figure 9. More details about the required system parameters and quantities are also shown in Table 4.
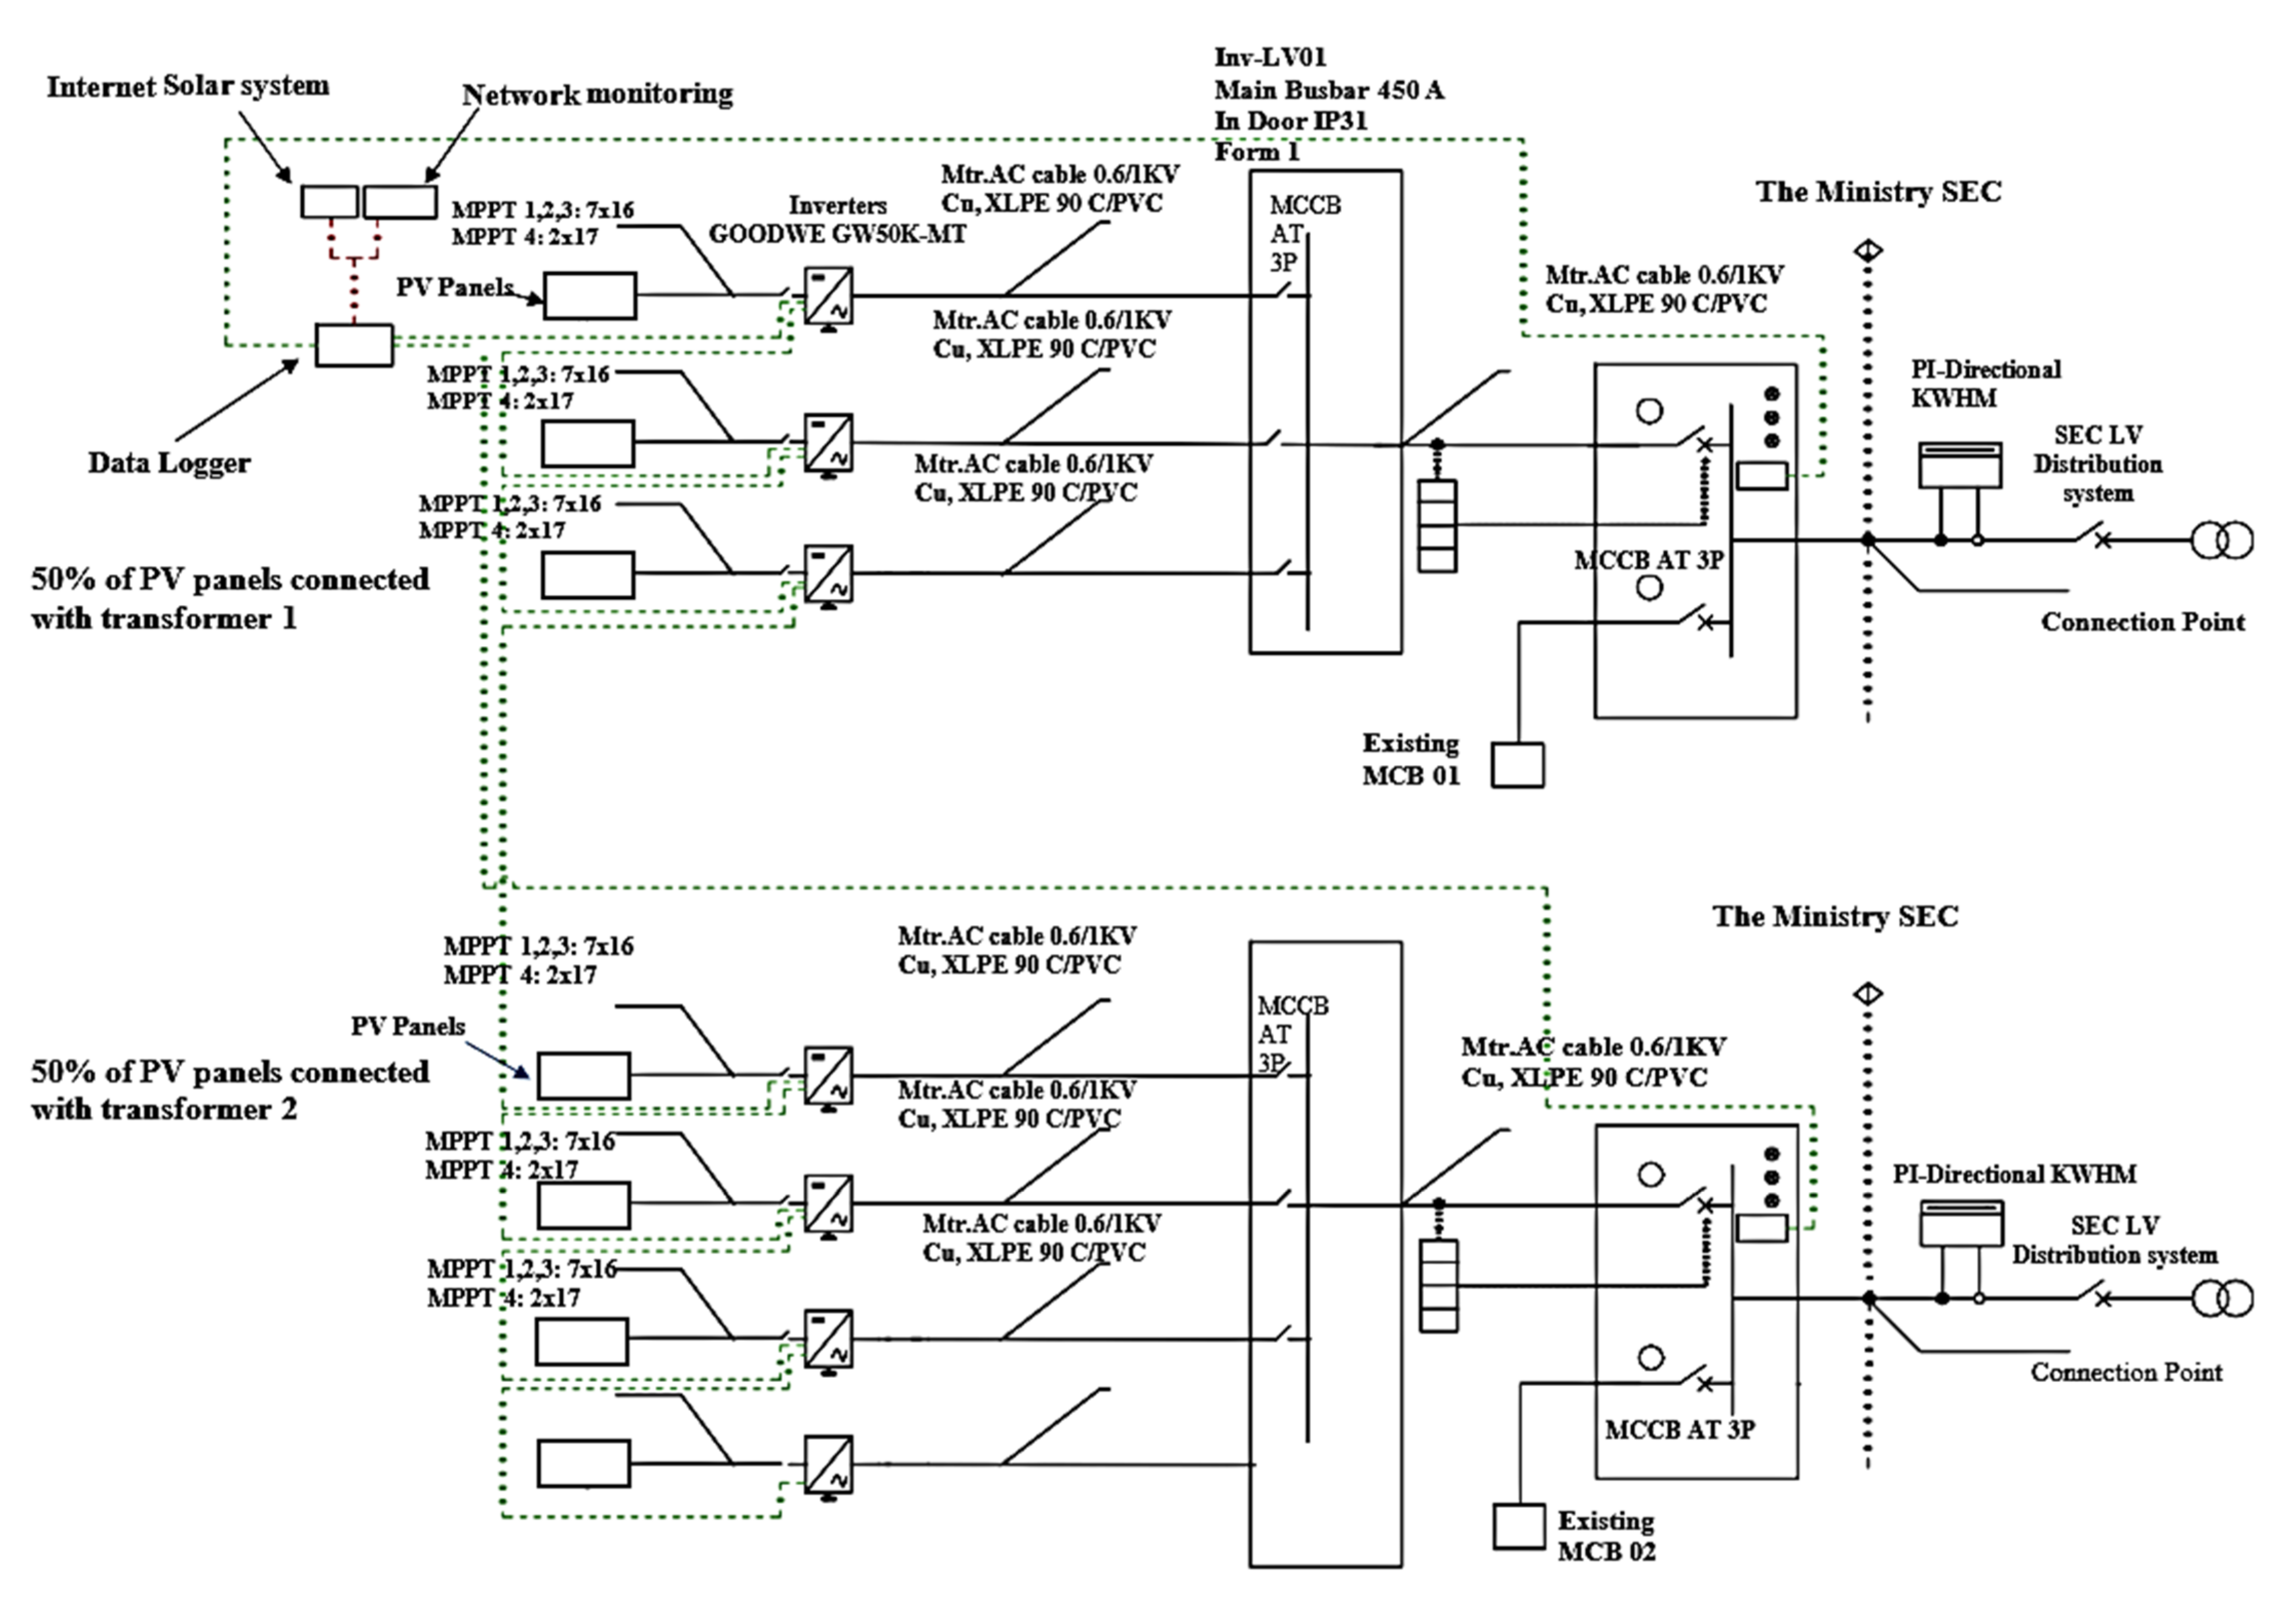
The single-line diagram (SLD), shown in Figure 10, was drawn and sized according to the Ministry of Electricity standards of grid integration for the distribution system of low and medium voltages. Moving in detail to the SLD, the number of the connected solar panels is 790 panels distributed in an area of 2118 m2. In addition, there are six inverters with a capacity of 50 kW each. The appropriate connection between these panels and inverters is to establish three groups of series panels, 15, 16, and 17, each group connected with one of the inverters’ MPPTs. This distribution is determined by the inverters’ voltage limits, which keep the voltage up to 950 volts.
Moreover, the SLD represents the sizing of cables and their cross-sectional areas (CSAs) that connect the panels with the inverters. PV cables and AC cables that connect inverters with the grid are also presented in this diagram. Their cross-sectional areas are 6 mm2 and 35 mm2, respectively. From the main bus bar to the grid, cables of 185 mm2 are used. A molded case circuit breaker (MCCB), with 122 A capacity, is connected between every inverter and the main bus bar. The main circuit breaker, which is established between the main bus bar and the low voltage grid, has a capacity of 500 A.

4. Comparison between Measured and Estimated Energy

Table 5 illustrates the estimated energy for the studied location considering the three different scenarios throughout the year. Nevertheless, the second scenario was established, and the measured energy for this scenario has been available since August 2019. Therefore, the comparison depends on the measured energy from August to December when the system was ready and successfully integrated with the grid. Table 6 gives information regarding the estimated average energy on a monthly basis. Generally, the estimated energy output is close to the measured output for the given period. The minimum value of the percentage error registered was in August, with a value of about 2.7%, while the maximum value appeared in November, about 18%.
There are several circumstances for reducing the energy production of the PV system and therefore reducing the efficiency of the PV system. For instance, excessive heat, especially in KSA, and other nonanticipated weather conditions decrease the energy production of the system [40,41,42,43,44,45,46].

5. Conclusions

This paper proposed a new PV configuration over the buildings’ roofs for limited-area applications. The proposed configuration is based on selecting an optimum tilt angle for the first string of the PV system that generates the largest amount of energy. The other strings of the PV system, in this configuration, can be selected to prevent shading in the limited-area roofs. The proposed new configuration was simulated and tested with other scenarios. The first scenario used the optimal tilt angle for the whole PV system, which generates the maximum amount of electric energy. However, this scenario can only be used if the roof’s area is not limited, which is not a critical case. Knowing that, in the case of a roof area restriction, it is more efficient to change the tilt angle of the PV panels than to obtain the shading of the PV panel, as the amount of energy produced varies insignificantly. Therefore, the second scenario, which was applied to accommodate the limited roof area, produces lower energy than the proposed configuration.
The proposed configuration can be used routinely over buildings’ roofs where the roof area is limited to produce a larger amount of energy. In addition, this configuration can be applied for small-capacity PV systems as well. Nevertheless, the area saved for such systems will be very small, since the saved area per module for each tilt angle is very small. The authors recommend using the new configuration where roof area is limited to increase the energy output of the whole PV system, although some regulations regarding PV system installations in some countries prevent the use of such a configuration over the roof of a building for aesthetic reasons.

Author Contributions

Conceptualization, A.A.-Q., M.A.-M., T.A.-A. and A.B.; methodology, A.A.-Q., M.A.-M., T.A.-A. and A.B.; software, T.A.-A. and A.B.; validation, A.A.-Q., M.A.-M.; formal analysis, A.A.-Q., M.A.-M., T.A.-A. and A.B.; investigation, A.A.-Q. and M.A.-M.; resources, T.A.-A. and A.B.; data curation, A.A.-Q. and M.A.-M.; writing—original draft preparation, M.A.-M.; writing—review and editing, A.A.-Q.; visualization, M.B., H.M. and A.M.; supervision, A.A.-Q., M.B., H.M. and A.M.; project administration, A.A.-Q.; funding acquisition, A.A.-Q., M.B., H.M. and A.M. All authors have read and agreed to the published version of the manuscript.

Funding

This research received no external funding.

Informed Consent Statement

Not applicable.

Data Availability Statement

The data presented in this study are available on request from the corresponding author.

Acknowledgments

The authors acknowledge Clean Environment Co. for implementing the project and providing the required information and data to prepare the theoretical study. They also acknowledge Yarmouk University, The University of Jordan, Trading Est Technology Utilities, National Energy Works Company and German Jordanian University for their support in this study.

Conflicts of Interest

The authors declare no conflict of interest.

References

  1. Zell, E.; Gasim, S.; Wilcox, S.; Katamoura, S.; Stoffel, T.; Shibli, H.; Engel-Cox, J.; Al Subie, M. Assessment of solar radiation resources in Saudi Arabia. Sol. Energy 2015, 119, 422–438. [Google Scholar] [CrossRef] [Green Version]
  2. Jurgenson, S.; Bayyari, F.M.; Parker, J. A comprehensive renewable energy program for Saudi Vision 2030. Renew. Energy Focus 2016, 17, 182–183. [Google Scholar] [CrossRef]
  3. Yamada, M. Vision 2030 and the Birth of Saudi Solar Energy; Middle East Institute: Singapore, 2016; p. 13. [Google Scholar]
  4. Alshuwaikhat, H.; Mohammed, I. Sustainability Matters in National Development Visions—Evidence from Saudi Arabia’s Vision for 2030. Sustainability 2017, 9, 408. [Google Scholar] [CrossRef] [Green Version]
  5. Heffron, R.J. Just Transitions Around the World. In Achieving a Just Transition to a Low-Carbon Economy; Palgrave Macmillan: Cham, Switzerland, 2021; pp. 87–124. [Google Scholar]
  6. Delbeke, J.; Lamas, R. Exploring Carbon Market Instruments for the Kingdom of Saudi Arabia (KSA); European University Institute: Fiesole, Italy, 2021. [Google Scholar]
  7. Mosly, I.; Makki, A.A. Current status and willingness to adopt renewable energy technologies in Saudi Arabia. Sustainability 2018, 10, 4269. [Google Scholar] [CrossRef] [Green Version]
  8. Mas’ud, A.A.; Wirba, A.V.; Alshammari, S.J.; Muhammad-Sukki, F.; Abdullahi, M.A.M.; Albarracín, R.; Hoq, M.Z. Solar energy potentials and benefits in the gulf cooperation council countries: A review of substantial issues. Energies 2018, 11, 372. [Google Scholar] [CrossRef] [Green Version]
  9. Dehwah, A.H.; Asif, M. Assessment of net energy contribution to buildings by rooftop photovoltaic systems in hot-humid climates. Renew. Energy 2019, 131, 1288–1299. [Google Scholar] [CrossRef]
  10. Ethraa Home Page. Net Metering and 4 Ways Saudi Arabia can implement it. Available online: https://www.ethraa-a.com/net-metering-and-4-ways-saudi-arabia-can-implement-it/ (accessed on 12 December 2021).
  11. Ko, W.; Al-Ammar, E.; Almahmeed, M. Development of Feed-in Tariff for PV in the Kingdom of Saudi Arabia. Energies 2019, 12, 2898. [Google Scholar] [CrossRef] [Green Version]
  12. Benghanem, M. Optimization of tilt angle for solar panel: Case study for Madinah, Saudi Arabia. Appl. Energy 2011, 88, 1427–1433. [Google Scholar] [CrossRef]
  13. Alaidroos, A.; Krarti, M. Optimal design of residential building envelope systems in the Kingdom of Saudi Arabia. Energy Build. 2015, 86, 104–117. [Google Scholar] [CrossRef]
  14. Gharakhani Siraki, A.; Pillay, P. Study of optimum tilt angles for solar panels in different latitudes for urban applications. Sol. Energy 2012, 86, 1920–1928. [Google Scholar] [CrossRef]
  15. Nguyen, H.T.; Pearce, J.M. Automated quantification of solar photovoltaic potential in cities Overview: A new method to determine a city’s solar electric potential by analysis of a distribution feeder given the solar exposure and orientation of rooftops. Int. Rev. Spat. Plan. Sustain. Dev. 2013, 1, 49–60. [Google Scholar] [CrossRef] [Green Version]
  16. Hong, T.; Lee, M.; Koo, C.; Jeong, K.; Kim, J. Development of a method for estimating the rooftop solar photovoltaic (PV) potential by analyzing the available rooftop area using Hillshade analysis. Appl. Energy 2017, 194, 320–332. [Google Scholar] [CrossRef]
  17. Redweik, P.; Catita, C.; Brito, M. Solar energy potential on roofs and facades in an urban landscape. Sol. Energy 2013, 97, 332–341. [Google Scholar] [CrossRef]
  18. Mangiante, M.J.; Whung, P.Y.; Zhou, L.; Porter, R.; Cepada, A.; Campirano, E., Jr.; Licon, D., Jr.; Lawrence, R.; Torres, M. Economic and technical assessment of rooftop solar photovoltaic potential in Brownsville, Texas, USA. Comput. Environ. Urban Syst. 2020, 80, 101450. [Google Scholar] [CrossRef]
  19. Byrne, J.; Taminiau, J.; Kurdgelashvili, L.; Kim, K.N. A review of the solar city concept and methods to assess rooftop solar electric potential, with an illustrative application to the city of Seoul. Renew. Sustain. Energy Rev. 2015, 41, 830–844. [Google Scholar] [CrossRef]
  20. Izquierdo, S.; Rodrigues, M.; Fueyo, N. A method for estimating the geographical distribution of the available roof surface area for large-scale photovoltaic energy-potential evaluations. Sol. Energy 2008, 82, 929–939. [Google Scholar] [CrossRef]
  21. Desthieux, G.; Carneiro, C.; Camponovo, R.; Ineichen, P.; Morello, E.; Boulmier, A.; Ellert, C. Solar energy potential assessment on rooftops and facades in large built environments based on lidar data, image processing, and cloud computing. methodological background, application, and validation in geneva (solar cadaster). Front. Built Environ. 2018, 4, 14. [Google Scholar] [CrossRef]
  22. Mainzer, K.; Killinger, S.; McKenna, R.; Fichtner, W. Assessment of rooftop photovoltaic potentials at the urban level using publicly available geodata and image recognition techniques. Sol. Energy 2017, 155, 561–573. [Google Scholar] [CrossRef] [Green Version]
  23. Singh, R.; Banerjee, R. Estimation of rooftop solar photovoltaic potential of a city. Sol. Energy 2015, 115, 589–602. [Google Scholar] [CrossRef]
  24. Berwal, A.K.; Kumar, S.; Kumari, N.; Kumar, V.; Haleem, A. Design and analysis of rooftop grid tied 50 kW capacity Solar Photovoltaic (SPV) power plant. Renew. Sustain. Energy Rev. 2017, 77, 1288–1299. [Google Scholar] [CrossRef]
  25. Kumar, B.S.; Sudhakar, K. Performance evaluation of 10 MW grid connected solar photovoltaic power plant in India. Energy Rep. 2015, 1, 184–192. [Google Scholar] [CrossRef] [Green Version]
  26. Khatib, T.; Ibrahim, I.A.; Mohamed, A. A review on sizing methodologies of photovoltaic array and storage battery in a standalone photovoltaic system. Energy Convers. Manag. 2016, 120, 430–448. [Google Scholar] [CrossRef]
  27. Kumar, A.; Andleeb, M.; Bakhsh, F.I. Design and Analysis of Solar PV Rooftop in Motihari. J. Phys. Conf. Ser. 2021, 1817, 12019. [Google Scholar] [CrossRef]
  28. Kadyan, H.; Berwal, A.K. Design of a 12 kWp grid connected roof top solar photovoltaic power plant on school building in the Rohtak District of Haryana. Int. J. Appl. Eng. Res. 2018, 13, 11354–11361. [Google Scholar]
  29. Mokhtara, C.; Negrou, B.; Settou, N.; Bouferrouk, A.; Yao, Y. Optimal design of grid-connected rooftop PV systems: An overview and a new approach with application to educational buildings in arid climates. Sustain. Energy Technol. Assess. 2021, 47, 101468. [Google Scholar] [CrossRef]
  30. Khatib, T.; Mohamed, A.; Sopian, K.; Mahmoud, M. A New Approach for Optimal Sizing of Standalone Photovoltaic Systems. Int. J. Photoenergy 2012, 2012, 391213. [Google Scholar] [CrossRef]
  31. Markvart, T.; Fragaki, A.; Ross, J.N. PV system sizing using observed time series of solar radiation. Sol. Energy 2006, 80, 46–50. [Google Scholar] [CrossRef] [Green Version]
  32. Wissem, Z.; Gueorgui, K.; Hédi, K. Modeling and technical–economic optimization of an autonomous photovoltaic system. Energy 2012, 37, 263–272. [Google Scholar] [CrossRef]
  33. Hay, J.E. Calculation of monthly mean solar radiation for horizontal and inclined surfaces. Sol. Energy 1979, 23, 301–307. [Google Scholar] [CrossRef]
  34. Jaber, S.; Hawa, A.A. Optimal design of PV system in passive residential building in Mediterranean climate. Jordan J. Mech. Ind. Eng. 2016, 10, 39–49. [Google Scholar]
  35. Duffie, J.A.; Beckman, W.A. Solar Engineering of Thermal Processes, 4th ed.; John Wiley & Sons: Hoboken, NJ, USA, 2013. [Google Scholar]
  36. Radaideh, A.; Bodoor, M.; Al-Quraan, A. Active and Reactive Power Control for Wind Turbines Based DFIG Using LQR Controller with Optimal Gain-Scheduling. J. Electr. Comput. Eng. 2021, 2021, 1218236. [Google Scholar] [CrossRef]
  37. Al-Mhairat, B.; Al-Quraan, A. Assessment of Wind Energy Resources in Jordan Using Different Optimization Techniques. Processes 2022, 10, 105. [Google Scholar] [CrossRef]
  38. Al-Quraan, A.; Al-Qaisi, M. Modelling, Design and Control of a Standalone Hybrid PV-Wind Micro-Grid System. Energies 2021, 14, 4849. [Google Scholar] [CrossRef]
  39. Yakup, M.A.b.H.M.; Malik, A.Q. Optimum tilt angle and orientation for solar collector in Brunei Durassalam. Renew. Energy 2001, 24, 223–234. [Google Scholar] [CrossRef]
  40. Amelia, A.R.; Irwan, Y.M.; Leow, W.Z.; Irwanto, M.; Safwati, I.; Zhafarina, M. Investigation of the effect temperature on photovoltaic (PV) panel output performance. Int. J. Adv. Sci. Eng. Inf. Technol. 2016, 6, 682–688. [Google Scholar]
  41. Dubey, S.; Sarvaiya, J.N.; Seshadri, B. Temperature Dependent Photovoltaic (PV) Efficiency and Its Effect on PV Production in the World—A Review. Energy Procedia 2013, 33, 311–321. [Google Scholar] [CrossRef] [Green Version]
  42. Al-Quraan, A.; Stathopoulos, T.; Pillay, P. Comparison of Wind Tunnel and on Site Measurements for Urban Wind Energy Estimation of Potential Yields. Elsevier J. Wind. Eng. Ind. Aerodyn. 2016, 158, 1–10. [Google Scholar] [CrossRef] [Green Version]
  43. Stathopoulos, T.; Alrawashdeh, H.; Al-Quraan, A.; Blocken, B.; Dilimulati, A.; Paraschivoiu, M.; Pillay, P. Urban Wind Energy: Some Views on Potential and Challenges. Elsevier J. Wind Eng. Ind. Aerodyn. 2018, 179, 146–157. [Google Scholar] [CrossRef]
  44. Al-Quraan, A.; Pillay, P.; Stathopoulos, T. Use of a Wind Tunnel for Urban Wind Power Estimation. In Proceedings of the IEEE Power & Energy Society General Meeting, Washington, DC, USA, 27–31 July 2014. [Google Scholar]
  45. Al-Quraan, A.; Alrawashdeh, H. Correlated Capacity Factor Strategy for Yield Maximization of Wind Turbine Energy. In Proceedings of the IEEE 5th International Conference on Renewable Energy Generation and Applications (ICREGA), Al-Ain, United Arab Emirates, 26–28 February 2018. [Google Scholar]
  46. Al-Quraan, A.; Stathopoulos, T.; Pillay, P. Estimation of Urban Wind Energy-Equiterre Building Case in Montreal. In Proceedings of the International Civil Engineering for Sustainability and Resilience Conference (CESARE’14), Irbid, Jordan, 24–27 April 2014. [Google Scholar]
Figure 1. The vision of renewable energy in KSA for 2030.
Buildings 12 00092 g001
Figure 2. The main angles in PV system design.
Buildings 12 00092 g002
Figure 3. Relationship between elevation angle and spacing between rows.
Buildings 12 00092 g003
Figure 4. Distribution of the panels in the first scenario.
Buildings 12 00092 g004
Figure 5. Distribution of the panels in the second scenario.
Buildings 12 00092 g005
Figure 6. The configuration of the third scenario.
Buildings 12 00092 g006
Figure 7. Relationship between elevation angle and spacing between rows: (a) Scenario 1, (b) Scenario 2, (c) Scenario 3.
Buildings 12 00092 g007
Figure 8. Energy production for all scenarios on a monthly basis.
Buildings 12 00092 g008
Figure 9. Connection diagram between the panels and the inverters.
Buildings 12 00092 g009
Figure 10. Single-line diagram of the entire system.
Buildings 12 00092 g010
Table 1. Monthly and annual energy consumption of the building.
MonthEnergy Consumption (kWh)
January952,500
February949,100
March942,000
April937,500
May932,500
June930,100
July928,100
August938,100
September939,300
October941,800
November942,500
December948,500
Annual energy (MWh)11,282
Table 2. Selected angles, distances, and the total roof areas for all scenarios.
Angles and Distances
Scenario 1Scenario 2Scenario 3
Tilt angle22°15°22° (First String)/15° (Others)
Elevation angle27°19.2°19.2°
Height difference (m)1.31.041.3 (First String)/1.04 (Others)
Model row spacing (m)1.731.421.42
Total roof area (m2)2267.81893.771893.77
Table 3. Solar irradiance in (kWh/m2) at different inclination angles.
MonthInclination Angle (degree)Solar irradiance (kWh/m2)
January60164
February60147
March30189
April30205
May10241
June10254
July10262
August10245
September30229
October30215
November60183
December60156
Total energy 2490
Table 4. Equipment sizing details.
CaseType or Quantity
PV pannel surface2118 m2
Dimensions of module2000 mm × 991 mm × 40 mm
Brand of PV modulesJASOLAR
Model numberJAM72S03-380/PR
Rated maximum power of PV module (W)380
Type of cellMono
Number of PV modules790
Brand of invertersChint
Model numberCPS SCA50KTL-DO/400
Rated AC output power (kW)50
Number of inverters6
Installation typeRooftop
Table 5. Monthly and annual estimated energy production of all scenarios in kWh.
Month22° Tilt Angle15° Tilt AngleConfiguration Proposed by the Author
January42,863.7240,586.6241,346.98
February43,120.1242,701.9241,905.32
March51,605.4250,982.1251,189.88
April48,698.6249,404.4249,169.15
May48,710.2250,453.5249,872.42
June46,055.8248,218.2247,497.42
July47,434.5249,388.1248,736.92
August47,504.2249,234.6248,657.95
September47,435.5247,469.22147,458.12
October49,030.3247,195.1247,806.98
November44,819.0241,655.7142,710.34
December43,419.1239,732.5140,961.58
Annual energy production560,696.64557,025.33557,313.06
Table 6. Comparison between estimated and measured energy output of the PV system in kWh, with percentage error calculations.
Estimated at 15° TiltMeasuredPercentage Error %
August49,234.6247,909.402.69
September47,469.22144,873.245.46
October47,195.1240,545.5914.10
November41,655.7133,842.2718.75
December39,732.5134,447.5013.30
January 202040,586.6235,971.3611.37
Publisher’s Note: MDPI stays neutral with regard to jurisdictional claims in published maps and institutional affiliations.

