
What Drives Construction Practitioners’ Acceptance of Intelligent Surveillance Systems? An Extended Technology Acceptance Model

School of Civil Engineering, Southeast University, Nanjing 211190, China
*
Author to whom correspondence should be addressed.
Buildings 2022, 12(2), 104; https://0-doi-org.brum.beds.ac.uk/10.3390/buildings12020104
Submission received: 13 December 2021
/
Revised: 13 January 2022
/
Accepted: 17 January 2022
/
Published: 23 January 2022
(This article belongs to the Collection Buildings, Infrastructure and SDGs 2030)
Abstract
:With the advent of intelligent construction, the intelligent surveillance system using computer vision technology has emerged as a prominent tool to identify unsafe behaviors on construction sites. At the same time, it is still viewed with suspicion by the construction industry, and its penetration rate remains low. To promote the successful implementation of the intelligent surveillance system, this study applied the technology acceptance model approach and developed an intelligent surveillance system acceptance model (ISSTAM) containing 12 variables from individual, organizational, environmental, and technical perspectives. Questionnaires were distributed to construction industry practitioners, 220 of whom provided valid data. Moreover, a structural equation model (SEM) was established for hypothesis testing. The research results suggest that job relevance, government action, training, and technical support positively and indirectly influence the use intention. Meanwhile, perceived usefulness, perceived ease of use, and cost savings directly and positively affect use intention, while privacy risk is verified to have a negative impact upon use intention. This study can help the government, organizations, and technology developers better apply the intelligent surveillance system to improve safety management levels.
1. Introduction
The risks in the construction industry have led to high mortality and accident rates during the construction process, and as a result, it is considered the most unsafe industry [1,2]. In China, 773 safety production accidents occurred in municipal and housing engineering in 2019, resulting in 904 deaths [3]. Meanwhile, the 2020 data in the United Kingdom released by the Health and Safety Executive (HSE) reported 61,000 nonfatal work injuries and 40 worker deaths in the past two years. In the past five years, 47% of fatalities resulted from falls from heights [4]. Additionally, the number of deaths in the construction industry in America reached 975 in 2017 [5]. These accidents severely negatively impact project costs, project progress, corporate reputation, and social benefits. Obviously, safety supervision is of utmost importance in the construction industry. Heinrich et al. [6] reported that injuries and deaths caused by unsafe behaviors of workers on construction sites accounted for 88% of all safety accidents. As a direct cause of accidents, workers’ unsafe behavior has become one of the major research subjects of safety management [7]. Therefore, a method that can effectively reduce the unsafe behaviors of workers and the incidence of safety accidents is urgently needed.
The supervision and identification of unsafe behaviors of workers on construction sites are mainly carried out by safety experts, which has significant limitations [7]. Based on traditional video surveillance, the intelligent surveillance system uses computer vision technology, which has changed the traditional management mode and improved safety management efficiency and quality. The intelligent surveillance system can automatically identify the unsafe behavior of workers through image or video recognition technology, realizing the comprehensive and real-time monitoring of each worker, which can protect the workforce and improve the quality and efficiency of safety management.
However, intelligent surveillance systems, which have been proven to have many benefits and high importance, are still viewed with suspicion by the industry. Problems such as cost and privacy have hampered the development of intelligent surveillance systems. In China, Jiangsu Province has taken the lead in applying information technology to safety management on smart construction sites, but only seven pilot projects used information technology for safety management in 2020 [8]. Seo et al. emphasized that the data collected by an intelligent surveillance system contains private information, which will have a negative impact on workers [9]. Ball argued that excessive monitoring of construction sites is harmful to workers [10]. Members of the European Parliament (MEPs) have opposed the widespread use of artificial intelligence because of privacy and dignity issues [11]. In addition, the complexity of computer vision technology makes it challenging to develop low-cost intelligent surveillance systems, which slows its adoption in developing countries [12]. Therefore, to ensure the acceptance and successful application of the intelligent surveillance system in the construction industry, it is essential to comprehensively investigate the factors that influence its acceptance.
Most of the existing research on intelligent surveillance systems focuses on the technical aspects, and no one has studied the factors affecting its acceptance. Therefore, to improve the application of intelligent surveillance systems, this study reviewed the current research progress of the intelligent surveillance system and the application of the technology acceptance model (TAM, Lansing, MI, USA). Subsequently, an intelligent surveillance system technology acceptance model (ISSTAM, Nanjing, China) was designed based on TAM, which was used to investigate workers and managers from personal, organizational, environmental, and technical dimensions to predict and explain the elements affecting the acceptance of intelligent surveillance systems among practitioners in the construction industry.
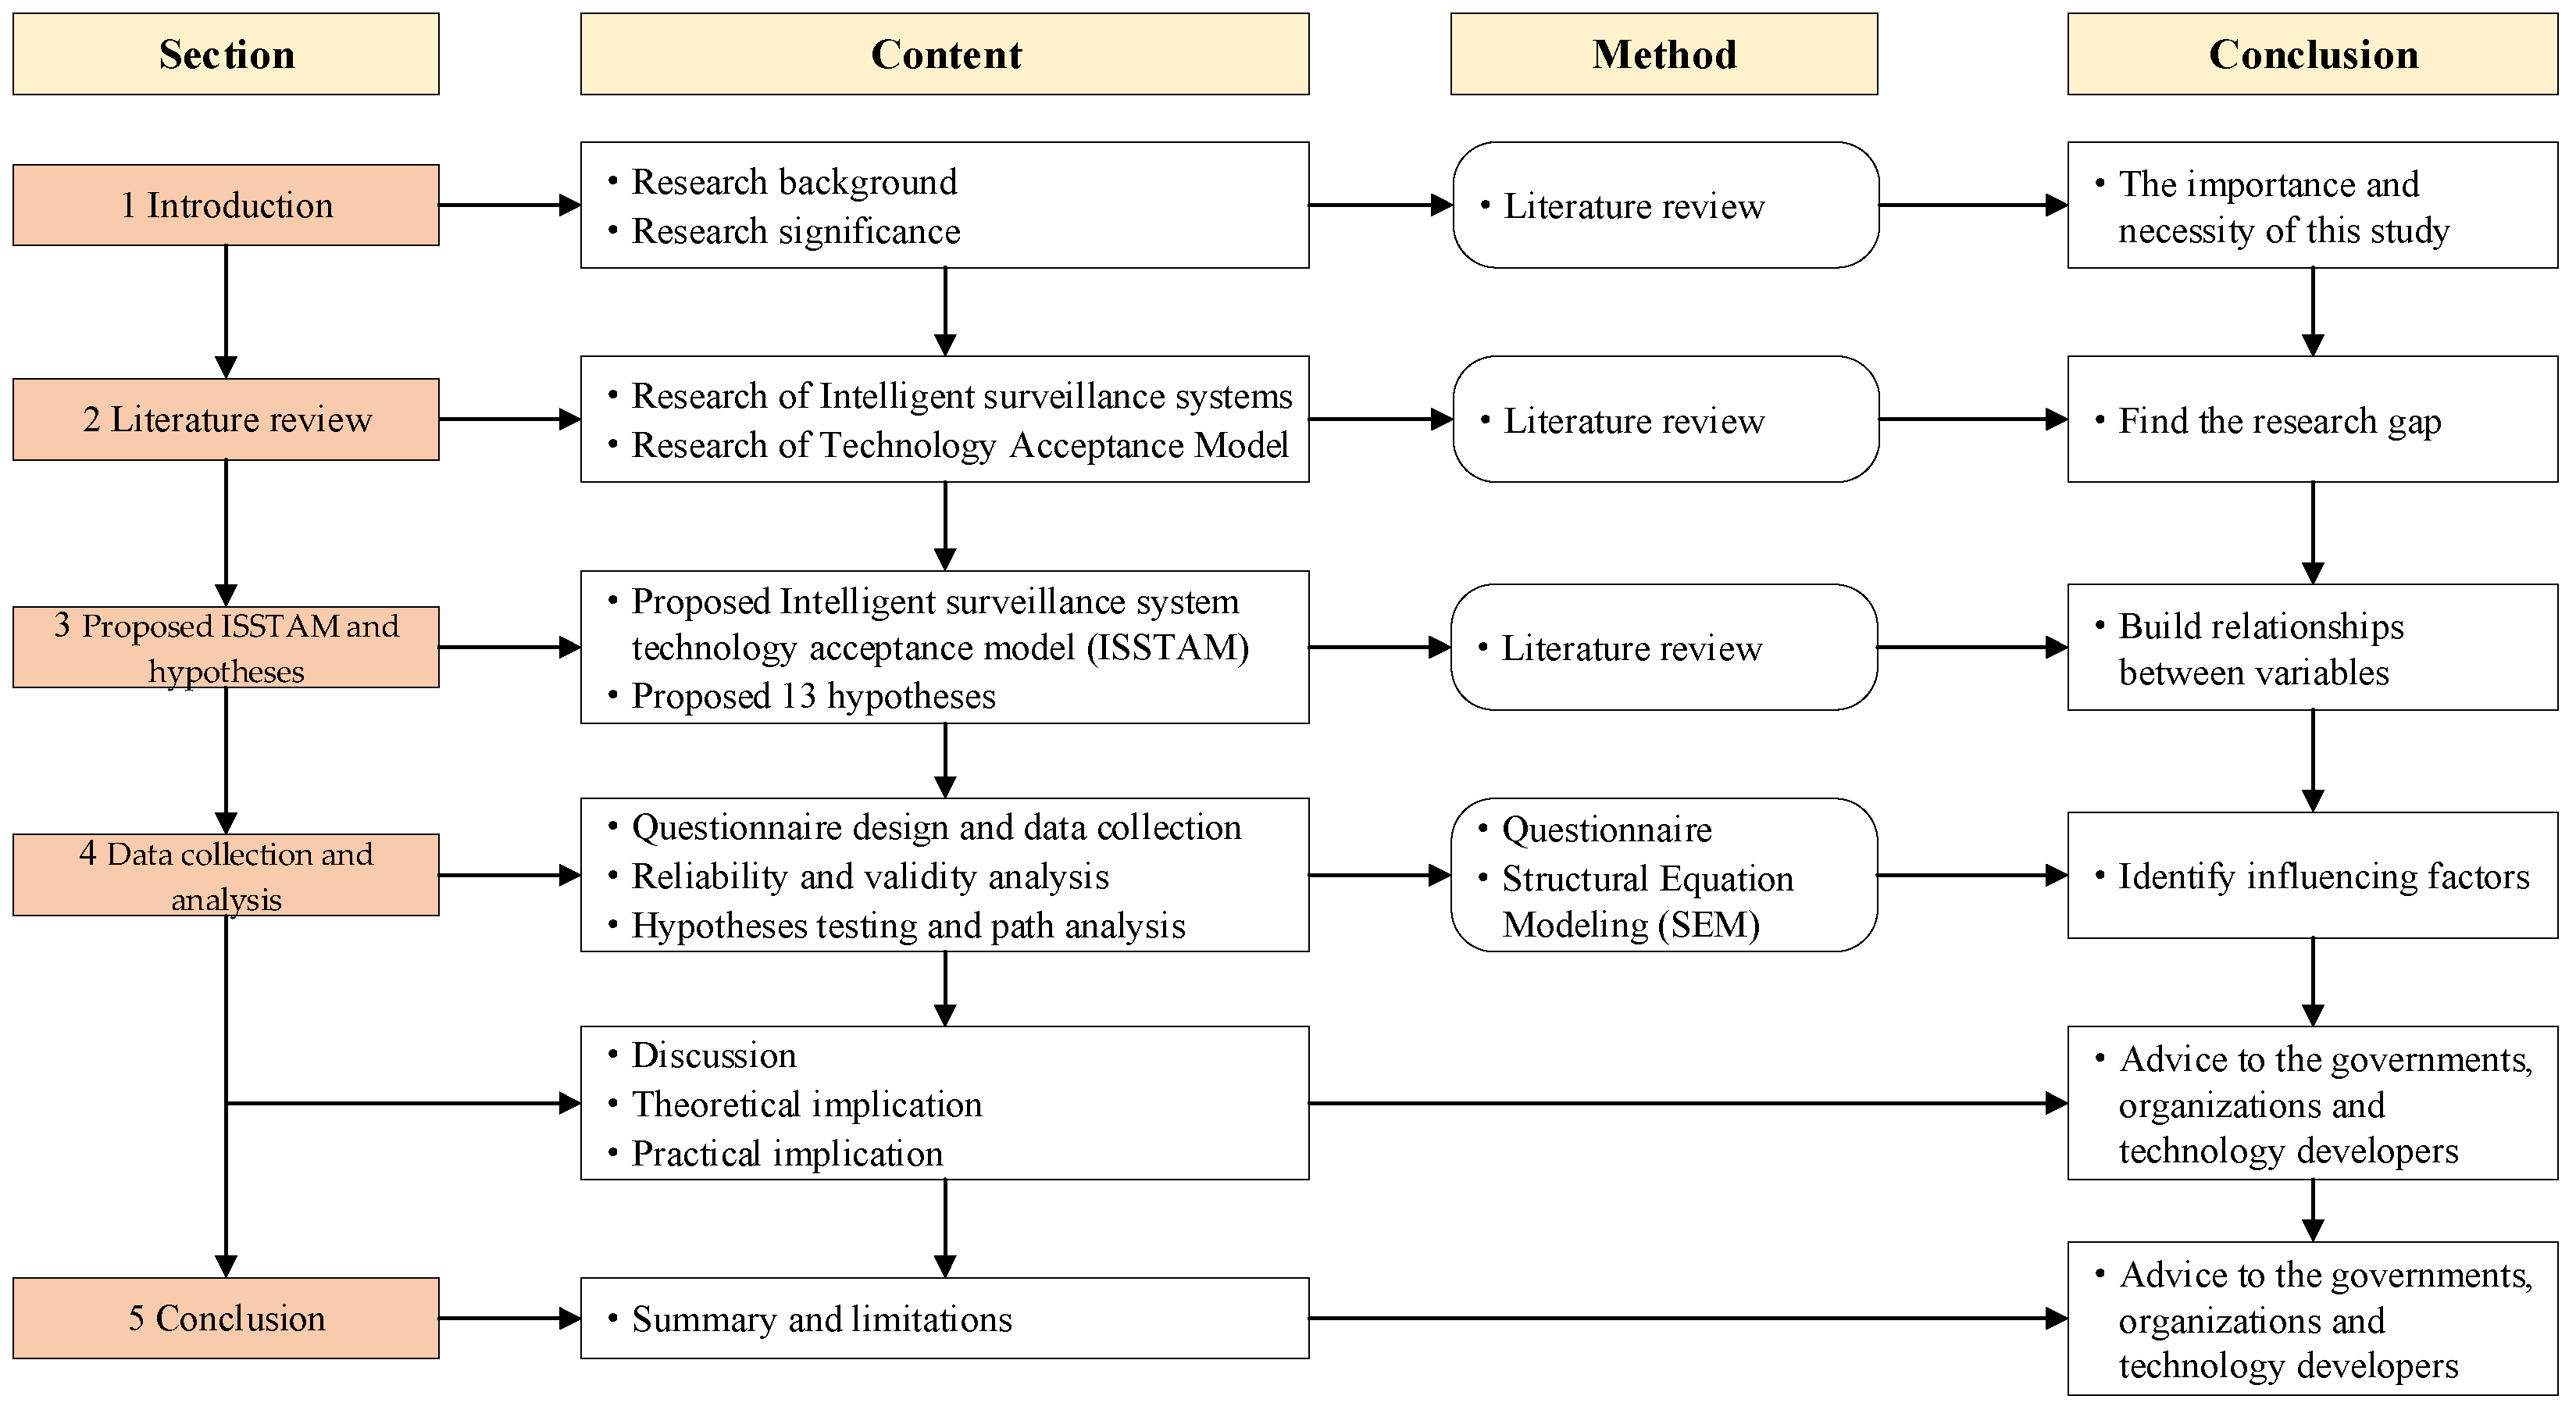
The structure of this study is shown in Figure 1. Section 1 is the introduction, which introduces the significance and necessity of this study. Past research is reviewed in Section 2. The intelligent surveillance system technology acceptance model and hypotheses are proposed in Section 3. Section 4 describes the data collection and validation process and discusses the findings. Finally, the conclusion and limitations are discussed in Section 5.
2. Literature Review
2.1. Intelligent Surveillance System for Construction Safety Management
In recent years, computer vision has been continuously developed and applied in the fields of object detection, object tracking, behavior recognition, and scene understanding, which provides a solid foundation for automatically extracting and identifying construction site information to capture on-site abnormalities and realize worker safety and health detection [13]. Many scholars have researched intelligent surveillance systems. Some studies were performed on safety management among workers to identify whether they wore personal protective equipment (PPE). Among them, most of the research has focused on identifying hardhats [14,15,16]. Meanwhile, Park and Brilakis [17] and Seong et al. [18] implemented research on the identification of safety vests to reduce the casualty rate on construction sites.
Additionally, recognition of worker behavior is another way for the intelligent surveillance system to realize automatic safety supervision. Han and Lee [19] proposed a framework to detect unsafe behaviors of workers using vision-based motion capture technology. Yu et al. [20] used an image-skeleton-based method to recognize workers’ dangerous behaviors in real time, and the feasibility was verified by identifying three types of dangerous behaviors. Konstantinou et al. [21] applied a tracking method based on computer vision for simultaneously tracking multiple workers, which achieved the purpose of adapting to the complexity of the construction site environment. As technical research becomes more in-depth, intelligent surveillance system technology will be perfected and mature, providing numerous benefits and potential.
2.2. Technology Acceptance Model
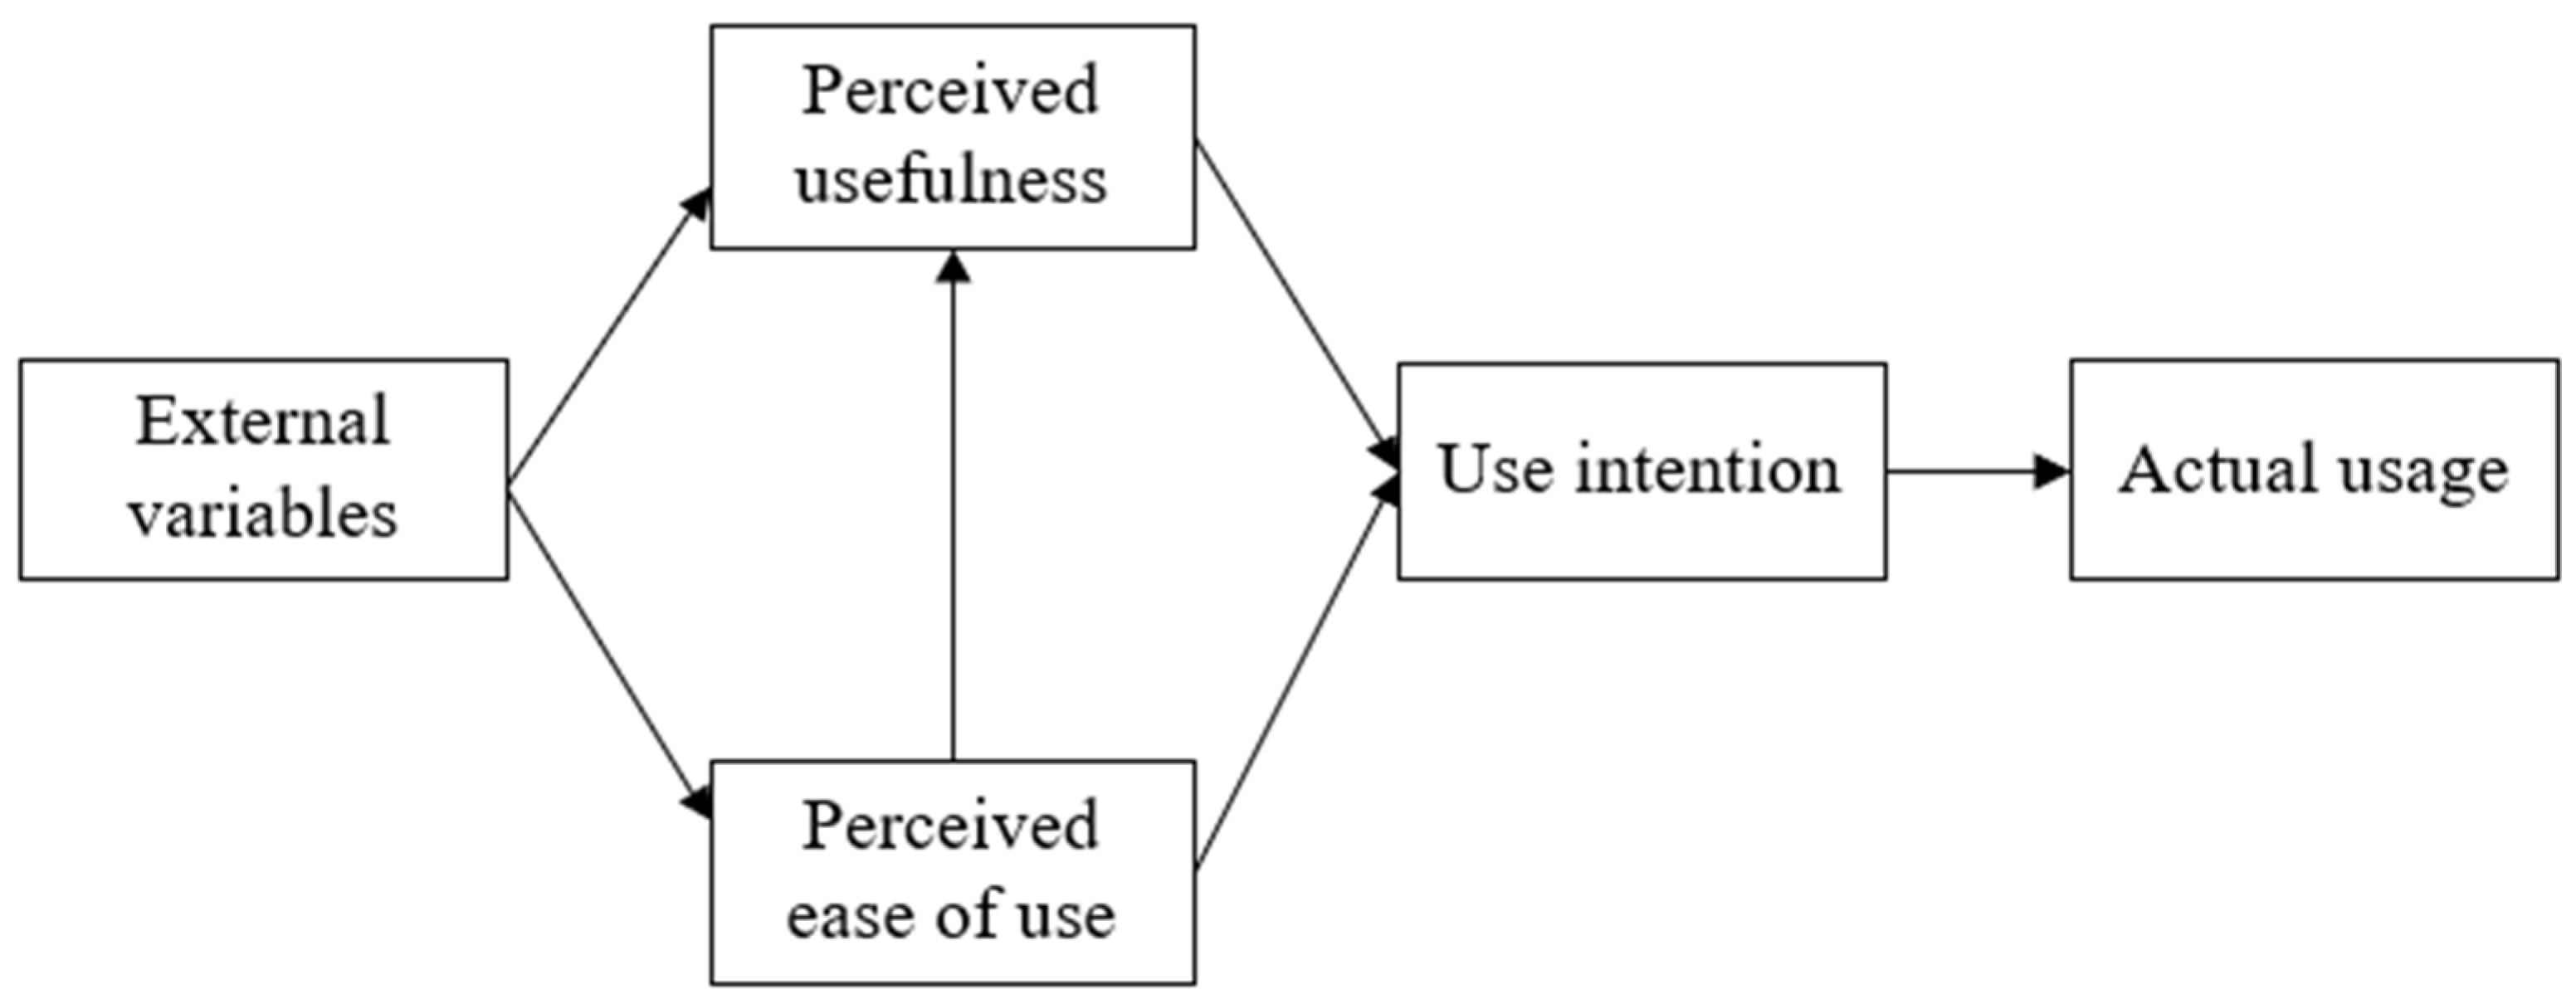
Davis [22] proposed the technology acceptance model (TAM), which is considered the most convincing method to understand and predict user acceptance, and it has been expanded and improved during the development process. Igbaria incorporated interorganizational and extra-organizational variables into TAM to explore the acceptance of computers by small firms [23]. Additionally, Venkatesh combined the social influence process with TAM and proposed TAM2, which determined specific external variables [24]. Figure 2 shows the core of these models, which presents the direct impact of external variables on perceived usefulness, as well as perceived ease of use. Furthermore, use intention is indirectly affected by external variables mediated by perceived usefulness (PU) and perceived ease of use (PEOU). Scholars in many fields have used TAM to understand the acceptance of emerging technologies, such as virtual reality [25], telehealth [26], and intelligent contracts [27].
As more intelligent devices have been used in the construction industry in recent years, many scholars have applied TAM to comprehend construction practitioners’ acceptance of IT. Son et al. [28] developed an extended TAM to explore the elements affecting the successful implementation of mobile computing devices and found that user satisfaction is a significant index of use intention. Another extended TAM named EITAM for the emerging information technology was built by Yang et al. [29] to explore the factors that promote the implementation of emerging IT among construction industry experts. Yuan et al. [30] developed a TOE-TAM composite model to research the acceptance of BIM among construction project owners from environmental, organizational, and technical aspects, affirming the crucial role of government policies and technical characteristics. Furthermore, Wong et al. [31] combined TAM with safety awareness and safety management practices to explain workers’ acceptance toward personal protective equipment (PPE).
2.3. Summary of the Review
After reviewing the previous research above, we conclude that intelligent surveillance systems have broad application prospects in the construction industry and play an essential role in construction site safety management. Therefore, it is vital to resolve the issue of the low adoption of intelligent surveillance systems in the construction industry. Although previous studies have provided many insights, there are still limitations.
First, most of the research on intelligent surveillance systems has focused on the technical level to improve the technology, but research on the acceptance of intelligent surveillance systems is still lacking. Additionally, although the technology acceptance model (TAM) has been widely adopted in the acceptance of information technology for safety management in the construction industry, the use of TAM to explore the acceptance of intelligent surveillance systems in the construction industry still constitutes a research gap.
Therefore, an extension of TAM was developed in this research to explain and predict the influential factors that affect the implementation of intelligent surveillance systems among construction practitioners.
3. Proposed ISSTAM and Hypotheses
3.1. Research Model
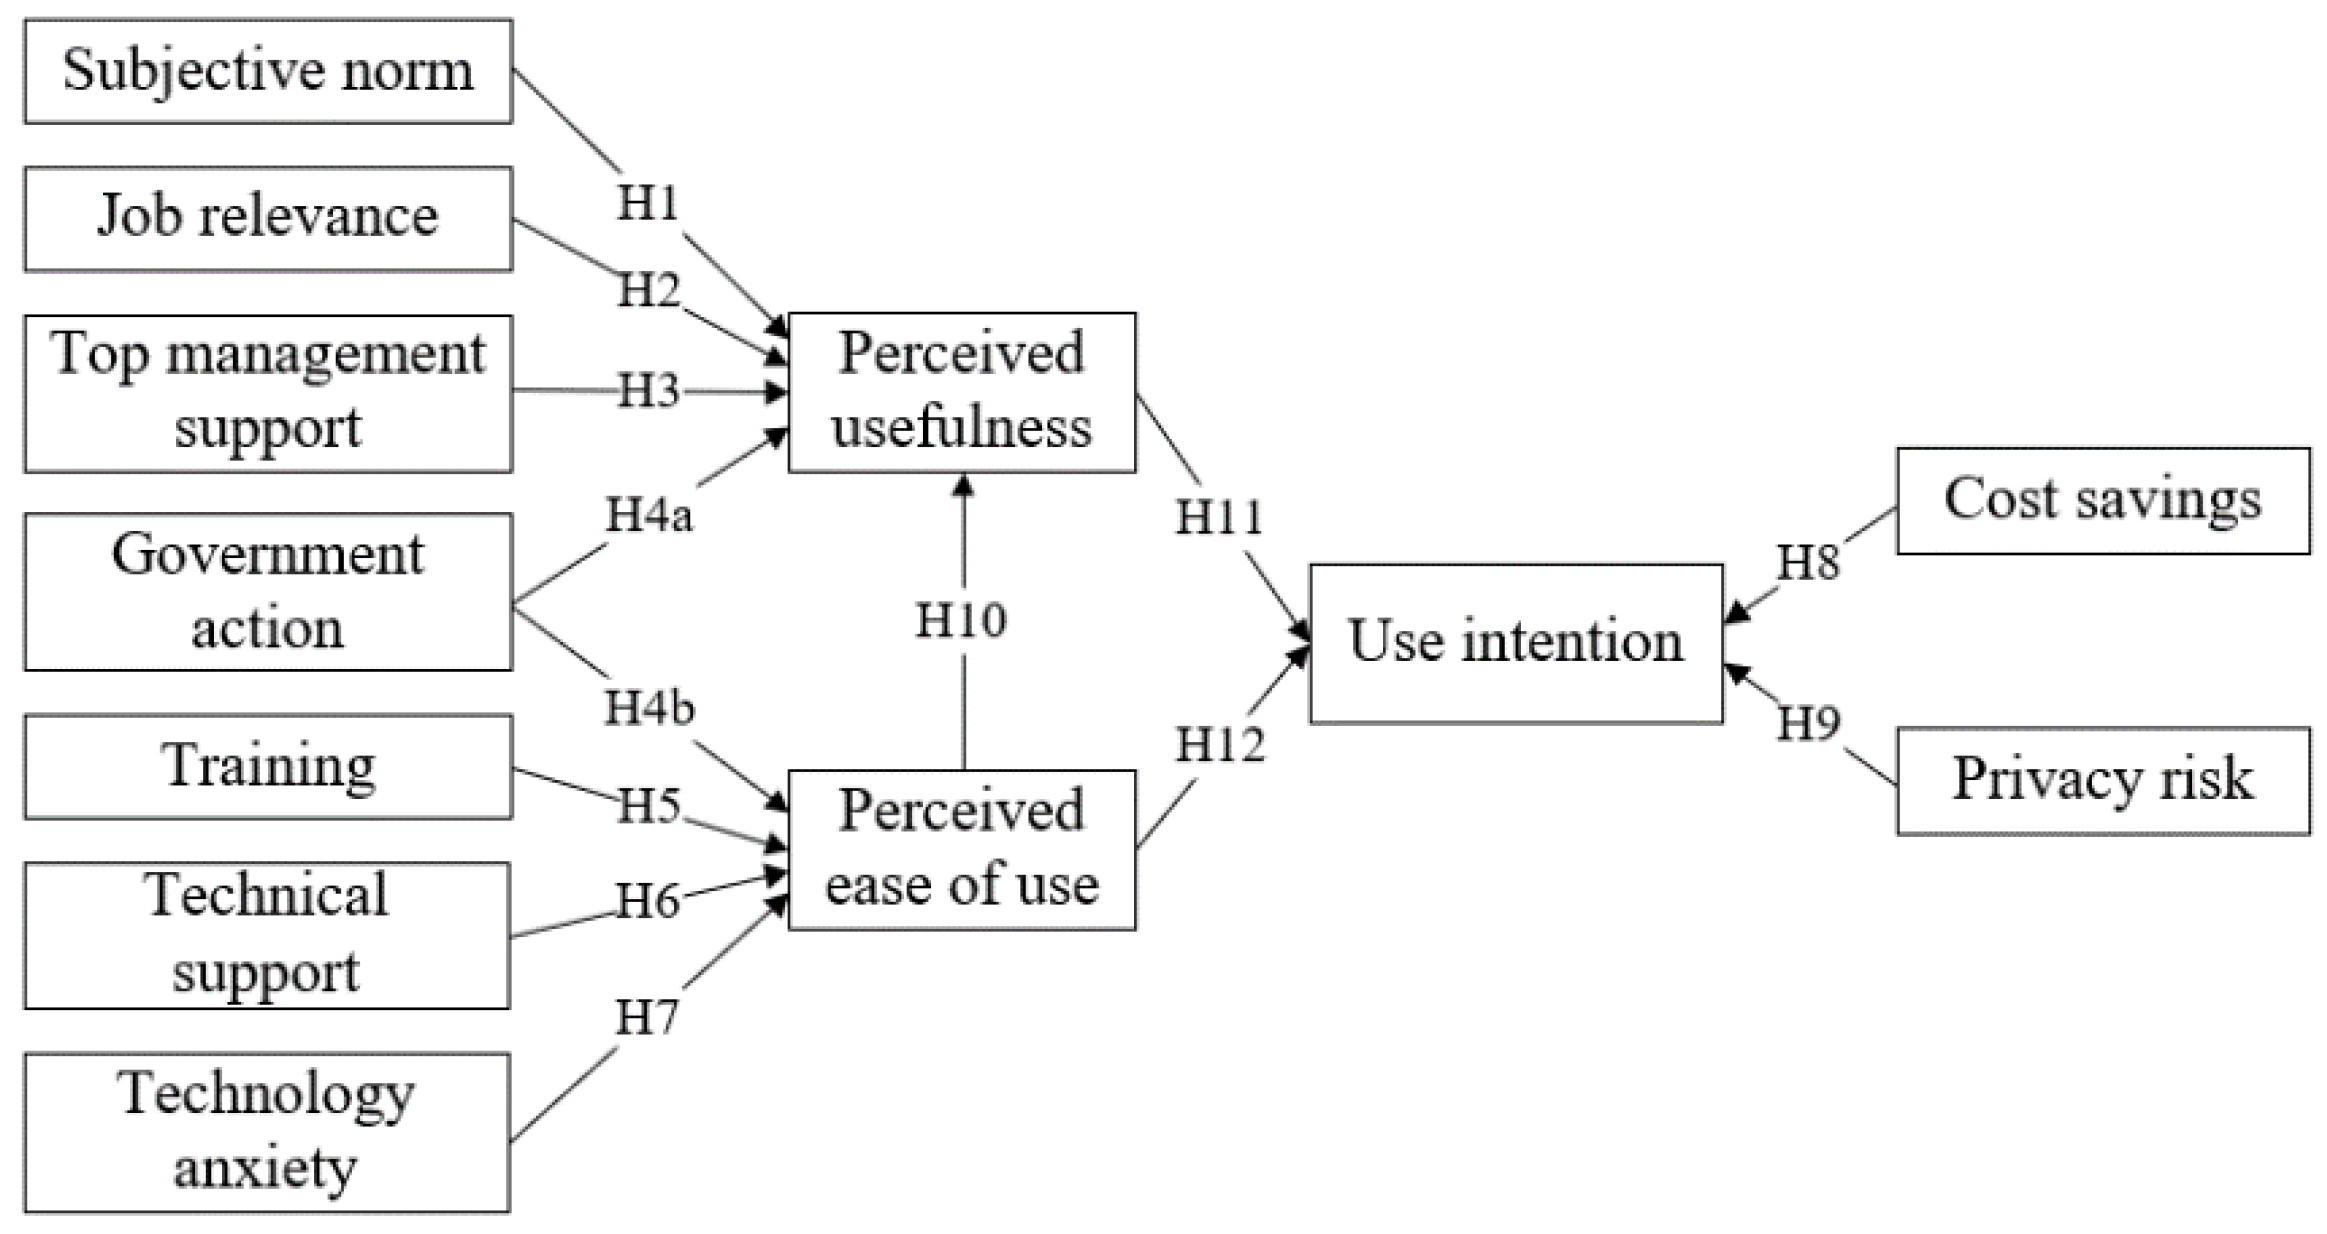
Based on the above discussion, an intelligent surveillance system technology acceptance model (ISSTAM), which is a modification of the TAM, is proposed in this section, and all abbreviation definitions are listed in Appendix B. The ISSTAM was derived from three essential variables and their relations in TAM: perceived usefulness (PU), perceived ease of use (PEOU), and use intention (UI). Based on a large number of related works and previously extended technology acceptance models, combined with the theory of social impact, computer anxiety, and innovation diffusion theory, and according to the characteristics of the construction industry and practical experience, nine external variables are integrated into ISSTAM. The external variables of ISSTAM were classified according to the Technology-Organization-Environment (TOE) framework [32] and previous research [33,34], including individual (technology anxiety, and job relevance), organizational (top management support, training, and cost savings), environmental (government action and subjective norm), and technical (technical support and privacy risk) issues, as shown in Figure 3. On the basis of ISSTAM, the following subsections put forward hypotheses about the correlation of variables in the research model.
3.2. Hypotheses of External Variables
To increase the penetration rate of intelligent surveillance systems in construction projects, it is necessary to investigate the individual, organizational, environmental, and technical levels to explore the main factors that significantly impact the user’s acceptance of intelligent surveillance systems. The external variables of ISSTAM include technology anxiety, job relevance (individual issue), top management support, training, cost savings (organizational issue), government action, subjective norm (environmental issue), technical support, and privacy risk (technical issue).
3.2.1. Subjective Norm
According to the diffusion of innovation theory [35], social forces and suggestions from others influence an individual’s decision to use an emerging information technology. Venkatesh and Davis [24] proposed TAM2, verifying that this variable positively impacts PU. Additionally, the path through which subjective norm positively affects perceived usefulness has been confirmed by many scholars [36,37], which leads to the following hypothesis:
Hypothesis 1 (H1).
Subjective norm (SN) has a significant positive effect on perceived usefulness.
3.2.2. Job Relevance
Venkatesh and Davis [24] introduced job relevance as an external variable to the TAM2 model based on TAM. The job relevance of new technology is expected to increase users’ beliefs of its usefulness and their use intention [28,38]. Previous scholars have concluded that job relevance has a positive relationship with perceived usefulness [24,28,39,40].
Hypothesis 2 (H2).
Job relevance (JR) has a significant positive effect on perceived usefulness.
3.2.3. Top Management Support
This variable was derived from social impact theory [41]. Top management is a crucial parameter for the individual’s intention to use information technology (IT) [42,43]. Igbaria, Zinatelli, Cragg, and Cavaye [23] discovered that various top management support methods could stimulate the individual’s potential to use a personal computer. Furthermore, previous empirical research has asserted that top management is highly related to perceived usefulness [28,39,44,45]. Thus, Hypothesis 3 is introduced:
Hypothesis 3 (H3).
Top management support (TMS) has a significant positive effect on perceived usefulness.
3.2.4. Government Action
The vital influence of government policies and guidance on the adoption of new IT in the construction industry was confirmed in previous investigations [46]. If the government can provide subsidies, it can also reduce the resistance of project owners to the application of new IT [30]. Therefore, according to the TOE framework [32], this study incorporated government action as an external environmental variable into TAM. Government action includes four aspects: policy, subsidy, law and regulation, and pilot projects. Yuan, Yang, and Xue [30] developed a TOE-TAM composite structure to confirm that government action has an essential impact on PU and PEOU. Another empirical study proved that government action is highly correlated with PU and PEOU [46].
Hypothesis 4a (H4a).
Government action (GA) has a significant positive effect on perceived usefulness.
Hypothesis 4b (H4b).
Government action (GA) has a significant positive effect on perceived ease of use.
3.2.5. Training
The definition of training is in-depth instruction related to the system, and it can be provided by external and internal sources [28]. Igbaria, Zinatelli, Cragg, and Cavaye [23] divided this variable into external training and internal training to explore the acceptance of personal computers by small firms and found that only external training could positively promote perceived ease of use. The hypothesis below is derived from the results of past research [28,39,47].
Hypothesis 5 (H5).
Training (T) has a significant positive effect on perceived ease of use.
3.2.6. Technical Support
Technical support related to trained personnel helps workers solve a particular technology problem [48]. Excellent organizational support, including technical support, can promote the acceptance of personal computers by improving attitudes [49]. Technical support in the form of training, guidance, and consultation can enable individuals to use technology correctly and improve work performance [23,50]. Some studies added technical support to the extension of TAM and found that it has an essential effect on PEOU [39,48,51].
Hypothesis 6 (H6).
Technical support (TS) has a significant positive effect on perceived ease of use.
3.2.7. Technology Anxiety
The theory of computer anxiety was proposed by Presno [52] and has been applied in the early phase of the adoption of other new technologies. Technology anxiety is expected to reduce the user’s belief of the benefits of technology, thereby affecting the use intention [53]. Technology adoption is negatively affected by technology anxiety [54]. Previous studies have indicated that technical anxiety is a significant negative factor hindering perceived ease of use [37,55,56].
Hypothesis 7 (H7).
Technical anxiety (TA) has a significant negative effect on perceived ease of use.
3.2.8. Cost Savings
The intelligent surveillance system is more expensive than traditional monitoring equipment, but it can protect the workforce, reduce safety incidents, and improve management efficiency, reducing project costs [57]. Cost savings can be defined as the potential of the technology to save project costs [58]. Research in the past reached the conclusion that high costs negatively influence use intention [58,59,60]. Additionally, Yang, Wang, and Sun [29] affirmed that expected benefits have an outstanding contribution to use intention. Thus, the following hypothesis on ISSTAM is developed:
Hypothesis 8 (H8).
Cost savings (CS) has a significant positive effect on use intention.
3.2.9. Privacy Risk
The intelligent surveillance system has certain privacy problems, which may inadvertently infringe on the privacy of individuals in the video [61]. If individuals have concerns about the risk to privacy posed by the technology, it will have a negative impact on their trust in technology [62]. Zhou [63] and Ambrose and Basu [64] added privacy as an external variable to the extension of TAM. Past empirical research supports the following hypothesis [65,66].
Hypothesis 9 (H9).
Privacy risk (PR) has a significant negative effect on use intention.
3.3. Hypotheses of Original TAM Variables
According to the purpose of this research, ISSTAM was developed based on TAM to understand the adoption of the intelligent surveillance system by construction industry practitioners. ISSTAM retained three variables and the relevant assumptions of perceived usefulness (PU), perceived ease of use (PEOU), and use intention (UI) in the original TAM. The definition of PU is the extent to which users believe that their job performance can be improved by using a certain technology, and the definition of PEOU is the extent of the effort that users assume is required to master a specific technology [22]. The TAM2 model proposed by Venkatesh and Davis [24] and TAM3 proposed by Venkatesh and Bala [55] explored the correlation between PU, PEOU, and UI. Additionally, many extensions of TAM presented in previous studies also tested hypotheses between these three variables. Thus, three hypotheses are adopted in this research:
Hypothesis 10 (H10).
Perceived ease of use has a significant positive effect on perceived usefulness.
Hypothesis 11 (H11).
Perceived usefulness has a significant positive effect on use intention.
Hypothesis 12 (H12).
Perceived ease of use has a significant positive effect on use intention.
4. Data Collection and Analysis
4.1. Questionnaire Design and Data Collection
This study used a three-part questionnaire to test 13 structures in ISSTAM. In the first part, the basic information of participants was collected. The second part introduced the meaning and function of the intelligent surveillance system and used diagrams to explain it in detail. The following aspects were considered: (1) When an organization chooses to use IT, workers are forced to use it passively [28], so they do not care about IT costs. (2) Managers are the main body of top management support variables. The third part of the questionnaire was designed and distributed to workers and managers, respectively. The questionnaire for workers includes 34 measurement items to measure 12 structures (excluding H11), while the questionnaire for managers includes 35 items to measure the remaining structure, excluding H6. These measurement items for each variable were extracted from past studies, and the wording was selected according to the condition of the intelligent surveillance system. Subsequently, interviews and surveys were conducted with experts and three construction industry practitioners, and the content of the questionnaire was revised to control the reliability and validity. A 5-point Likert scale was conducted to measure each statement, with 1 representing strongly disagree and 5 representing strongly agree. Appendix A lists all measurement items.
The questionnaire was distributed in mainland China, and answers were received from construction industry practitioners from 11 provinces. To ensure the validity of collected answers, the data should be filtered and removed according to the following principles: (1) the response time should not be less than one minute; (2) the answers to each question must not all be the same or have strong regularity.
The data of 52 workers and 168 managers complied with these criteria. Table 1 presents the interviewee’s demographics. There were 72.73% male respondents and 27.27% female respondents. The respondents were mainly young people, as 78.64% were 20–29 years old. This also meant that most respondents had limited work experience. In addition, highly educated respondents accounted for the majority. According to previous studies [67], in the model test of reliability and validity, missing values should be replaced by the average of the measurement items.
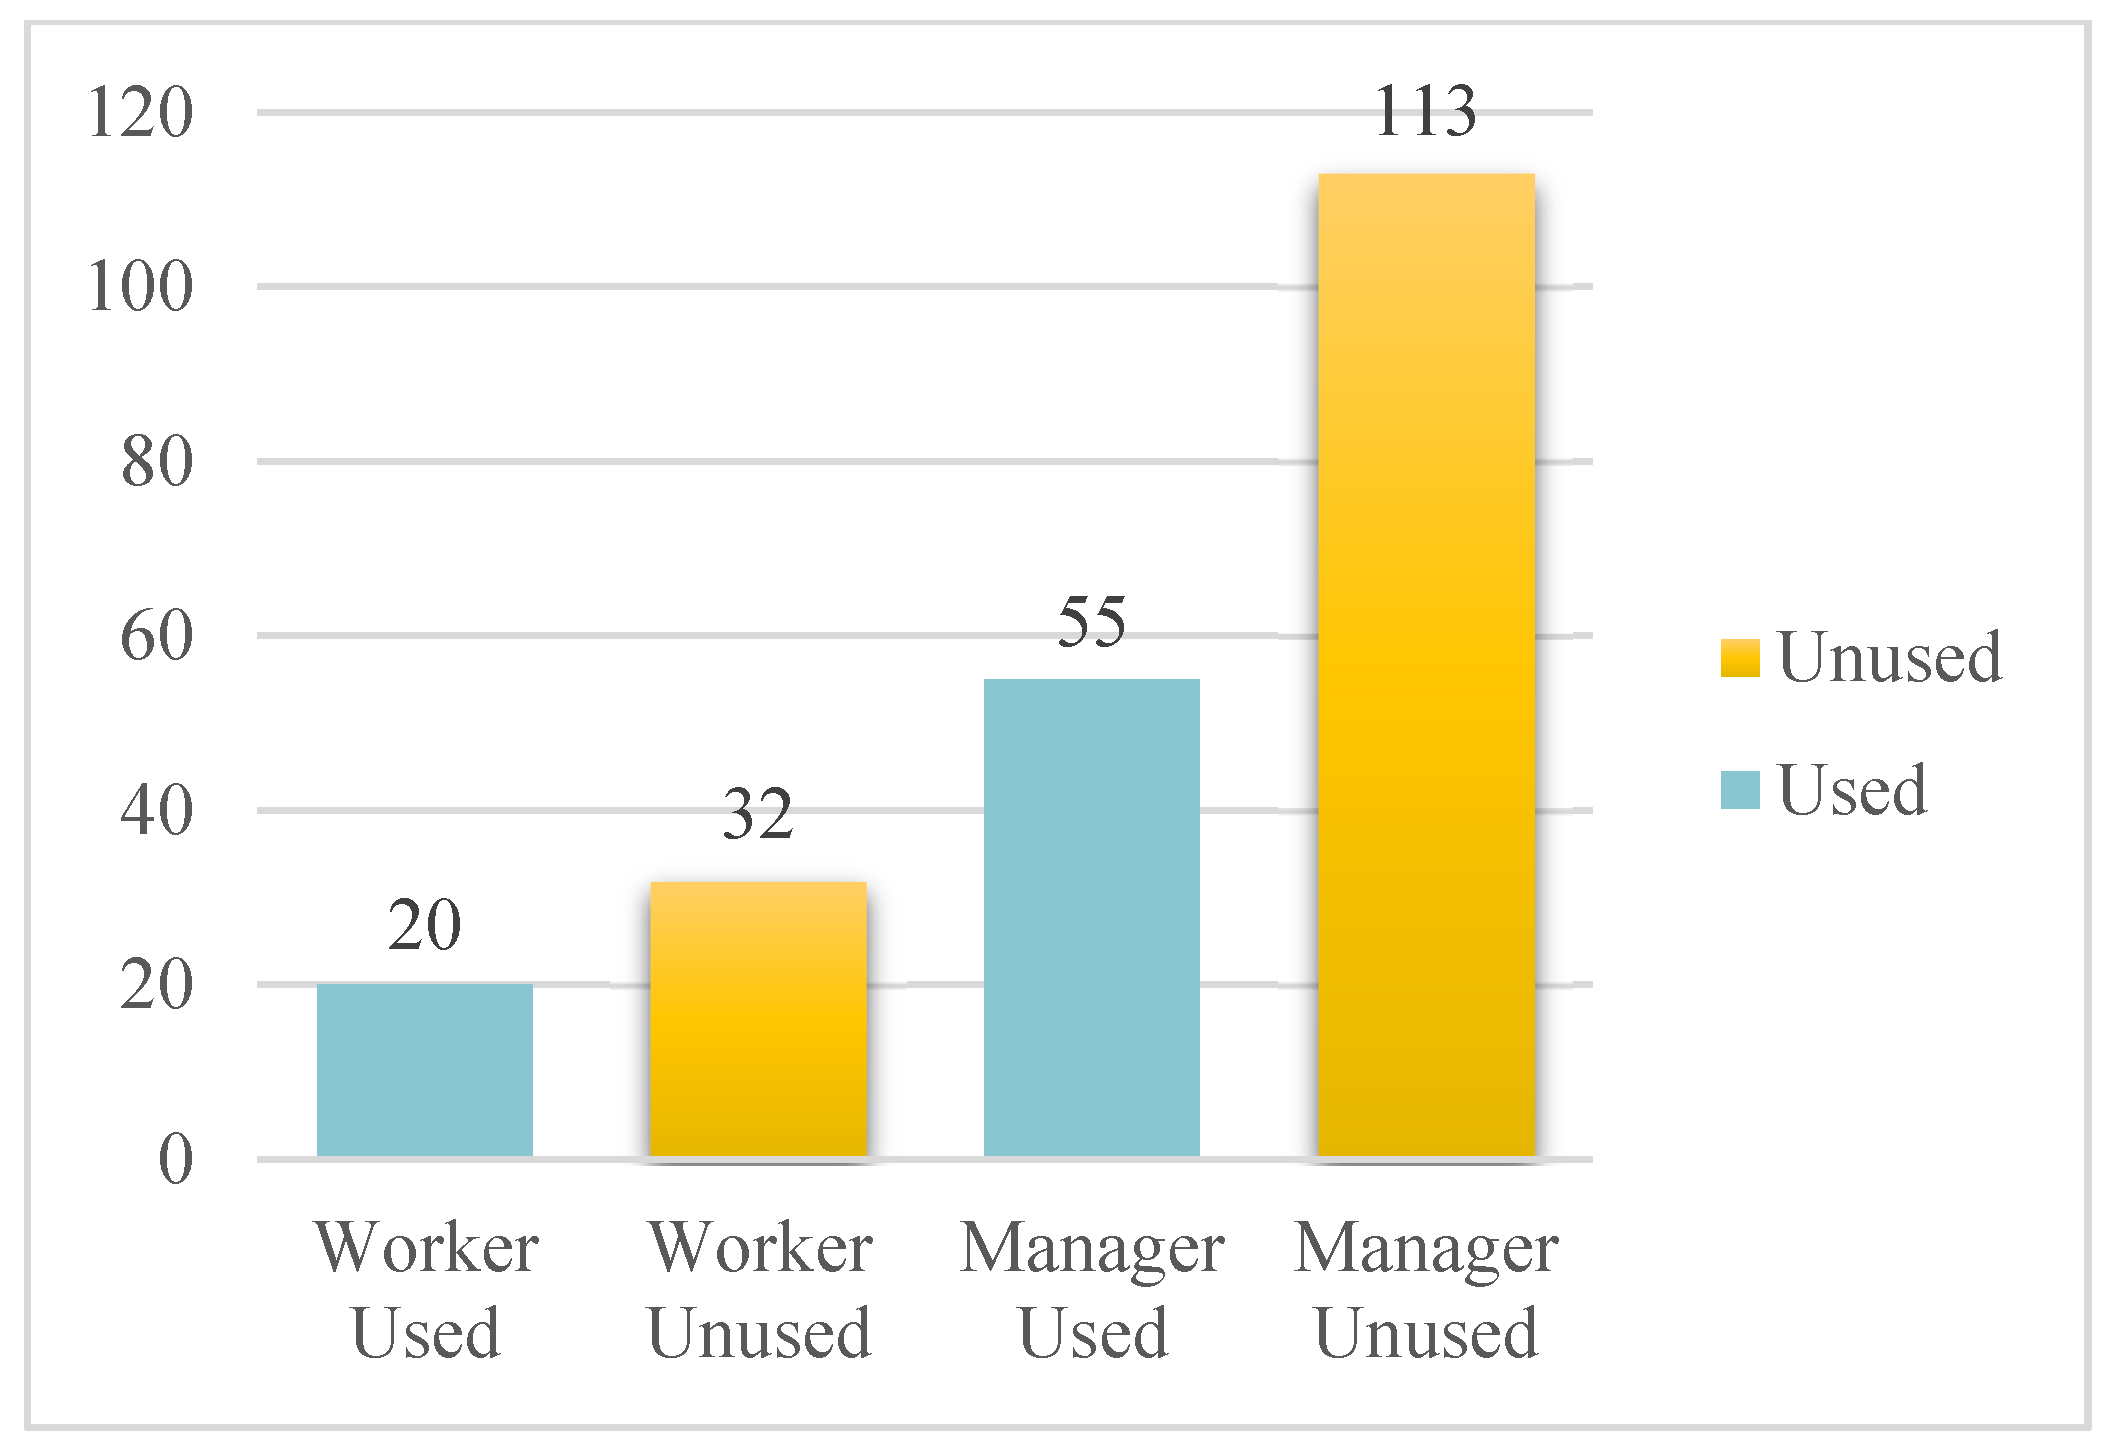
Meanwhile, an additional question was added to investigate the actual use of the intelligent surveillance system in the construction industry. The statistical results shown in Figure 4 demonstrate that the total number of people who have never used such systems is as high as 66% (presented by the yellow bar), highlighting the significance of studying the acceptance of the intelligent surveillance system.
4.2. Evaluation of ISSTAM
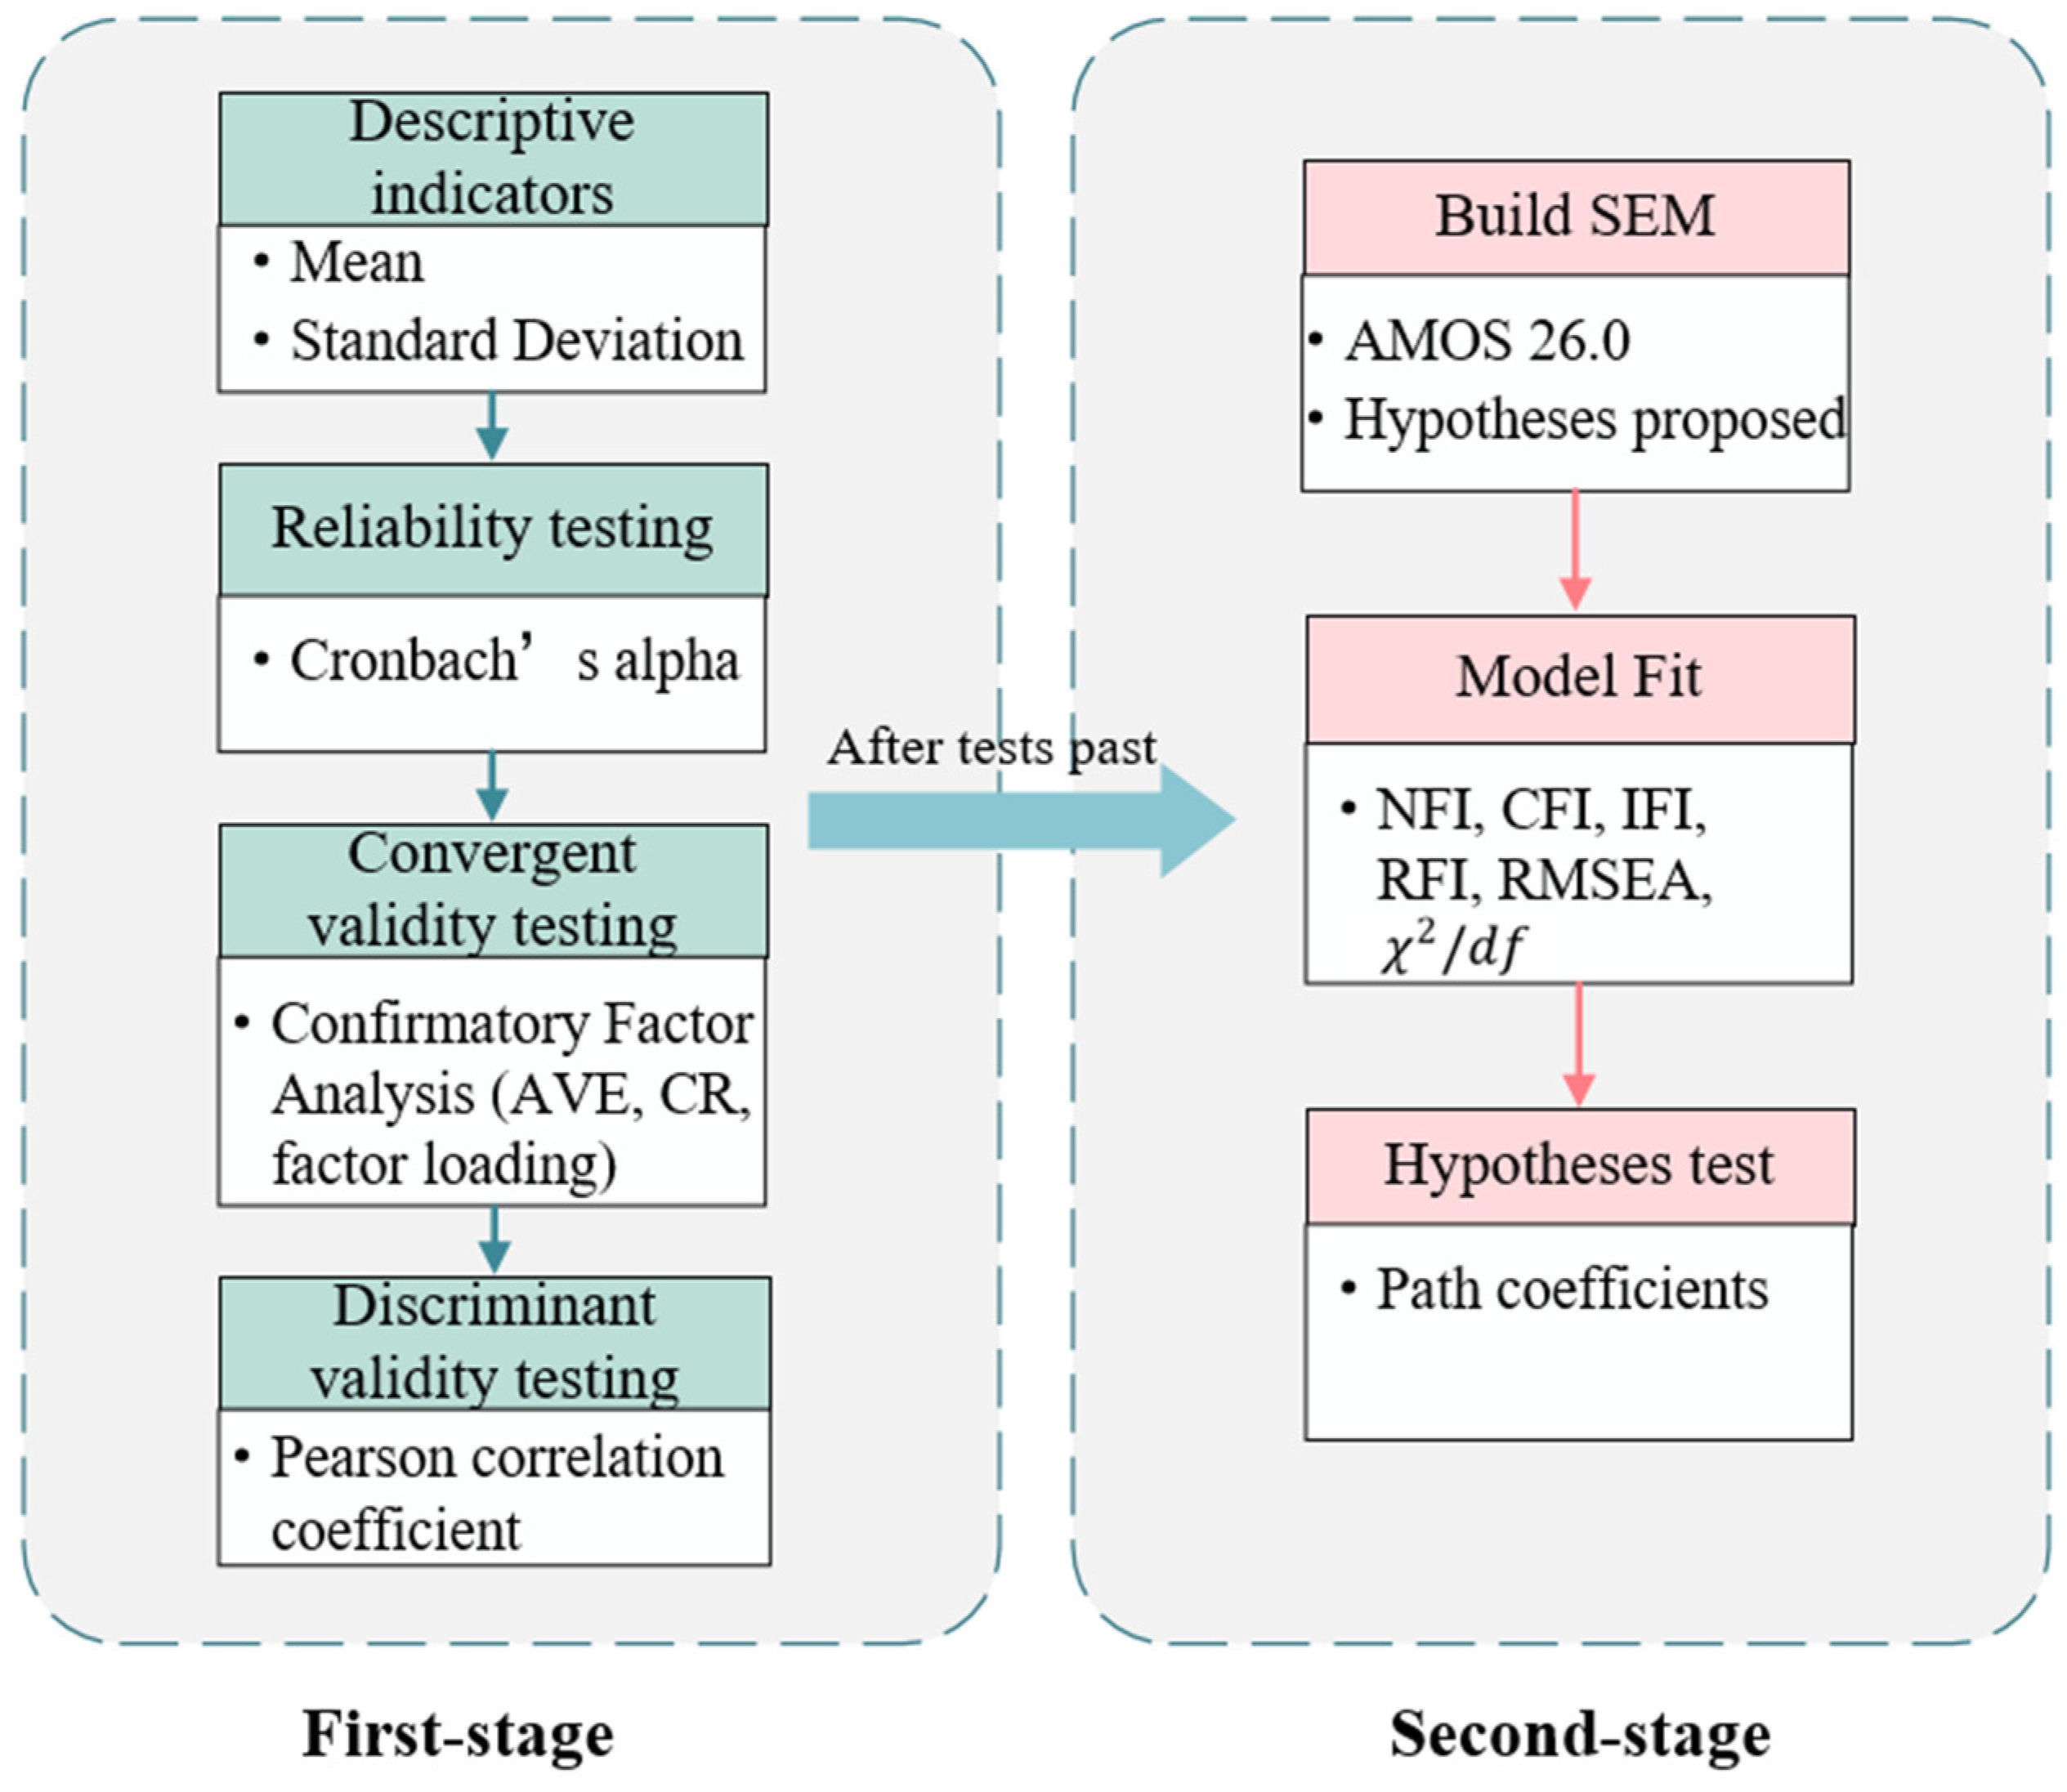
According to Anderson and Gerbing [68], a two-stage method was established for data analysis, as shown in Figure 5. The first stage is to test the reliability and validity of the collected data, which is the premise of constructing a structural equation model for path analysis. Firstly, the reliability was tested by Cronbach’s alpha coefficient, and then the Kaiser-Meyer-Olkin (KMO) and Bartlett’s test were used to verify whether confirmative factor analysis (CFA) was suitable for the validity test. Finally, this study used CFA to verify convergent and discriminant validity. The second stage was constructing a structural equation model (SEM) for hypothesis testing and path analysis. First, six indexes were used to test the goodness of fit of the constructed structural equation model. Hypothesis testing and path analysis can be performed when the test is passed. The analysis was completed using IBM SPSS Statistics 26.0 (International Business Machines Corporation, New York, NY, USA) and IBM SPSS AMOS 26.0 (International Business Machines Corporation, New York, NY, USA).
The data were obtained by a questionnaire survey. The score ranged from 1 (strongly disagree) to 5 (strongly agree) on each scale. The mean and standard deviation (SD) of each item in the ISSTAM proposed in this study are presented in Table 2. The mean of the four items of technical anxiety is lower than 3, indicating that most of the respondents disagree with the content of these four questions.
4.2.1. Reliability Testing
4.2.2. Convergent Validity Testing
The method to test whether a sample is suitable for CFA is the KMO and Bartlett’s test. The KMO should be above 0.7, and the significance probability of the Bartlett value should be less than 1%. The results are shown in Table 3, showing that KMO = 0.85 > 0.7 and the significance probability of the Bartlett value is sig. = 0.000 < 1%. Therefore, this research is suitable for CFA.
CFA was then applied to test the validity. Three indicators were adopted to measure convergent validity of ISSTAM: factor loading, composite reliability (CR), and average variance extracted (AVE). According to Bagozzi and Yi [70], the acceptable thresholds for these indicators are: factor loading > 0.5, CR > 0.7, and AVE > 0.5. Table 2 shows the results of the convergent validity test. All values meet the standard, indicating the high convergent validity of the structure.
4.2.3. Discriminant Validity Testing
When the indicators of a given construct in the model are not correlated with other constructs, it has discriminative validity [28]. The Pearson correlation coefficient matrix of each factor shown in Table 4 was used to measure the discriminant validity. In Table 4, the data in bold are the square root of AVE, and the remaining data are the correlation coefficients between the latent variables. The criterion is that the square root of the AVE of latent variables cannot be lower than the other correlation coefficients. Therefore, the proposed ISSTAM was highly efficient.
4.3. Analysis of the Structural Model
A structural equation model (SEM) was established in this study for path analysis. Model fitting and hypothesis testing were implemented in IBM SPSS Statistics 26.0 (International Business Machines Corporation, New York, NY, USA) and IBM SPSS AMOS 26.0 (International Business Machines Corporation, New York, NY, USA).
4.3.1. Model Fit
Xiong et al. [71] determined the standards for judging the quality of SEM. This research used , GFI (Goodness-of-Fit index), CFI (Comparative Fit index), TLI (Tucker-Lewis index), IFI (Incremental Fit index), and RMSEA (Root Mean Square Error of Approximation) as six indicators for testing the goodness of fit and acceptance level of ISSTAM. The test results of the six indicators of ISSTAM are shown in Table 5. Table 5 presents the criteria for each indicator and the measured values of this study. It can be seen that the six test results meet the criteria, so the proposed structural equation model is good.
4.3.2. Hypothesis Tests
The path analysis results used for ISSTAM hypothesis testing are presented in Table 6. In the fourth column of Table 6, p < 0.05 means that the hypothesis is true and that the effect between the two variables is significant. Path coefficient > 0 means a positive correlation between the two variables, and a larger value represents a more significant effect; path coefficient < 0 means that there is a negative correlation between variables, and a smaller value represents a more significant effect. The results show that under the criteria of p < 0.05, 9 of 13 paths (excluding H2, H3, and H7) were significant. Job relevance had a notable impact on PU (β = 0.191, p = 0.004), supporting H1. However, subjective norm (β = 0.035, p = 0.544) and top management support (β = 0.056, p = 0.340) were found to have an insignificant impact on PU, so H2 and H3 were rejected. Government action was verified to have a significant effect on PU (β = 0.468, p < 0.001) and PEOU (β = 0.518, p < 0.001); therefore, H4a and H4b were accepted. H5 and H6 predicted that training (β = 0.168, p = 0.010) and technical support (β = 0.146, p = 0.024) significantly and positively affect PEOU, which were supported. Technology anxiety (β = −0.029, p = 0.634) was found to have an insignificant negative effect on PEOU, so H7 was rejected. H8 predicted the positive effect of cost savings on UI (β = 0.195, p < 0.01) and was accepted, while H9 was that privacy risk (β = −0.181, p = 0.004) negatively influences UI, which was accepted in our research. Additionally, PEOU (β = 0.194, p = 0.014) positively affected PU, while PEOU (β = 0.484, p < 0.001) and PU (β = 0.263, p = 0.003) directly and significantly affected UI. H10, H11, and H12 were all supported.
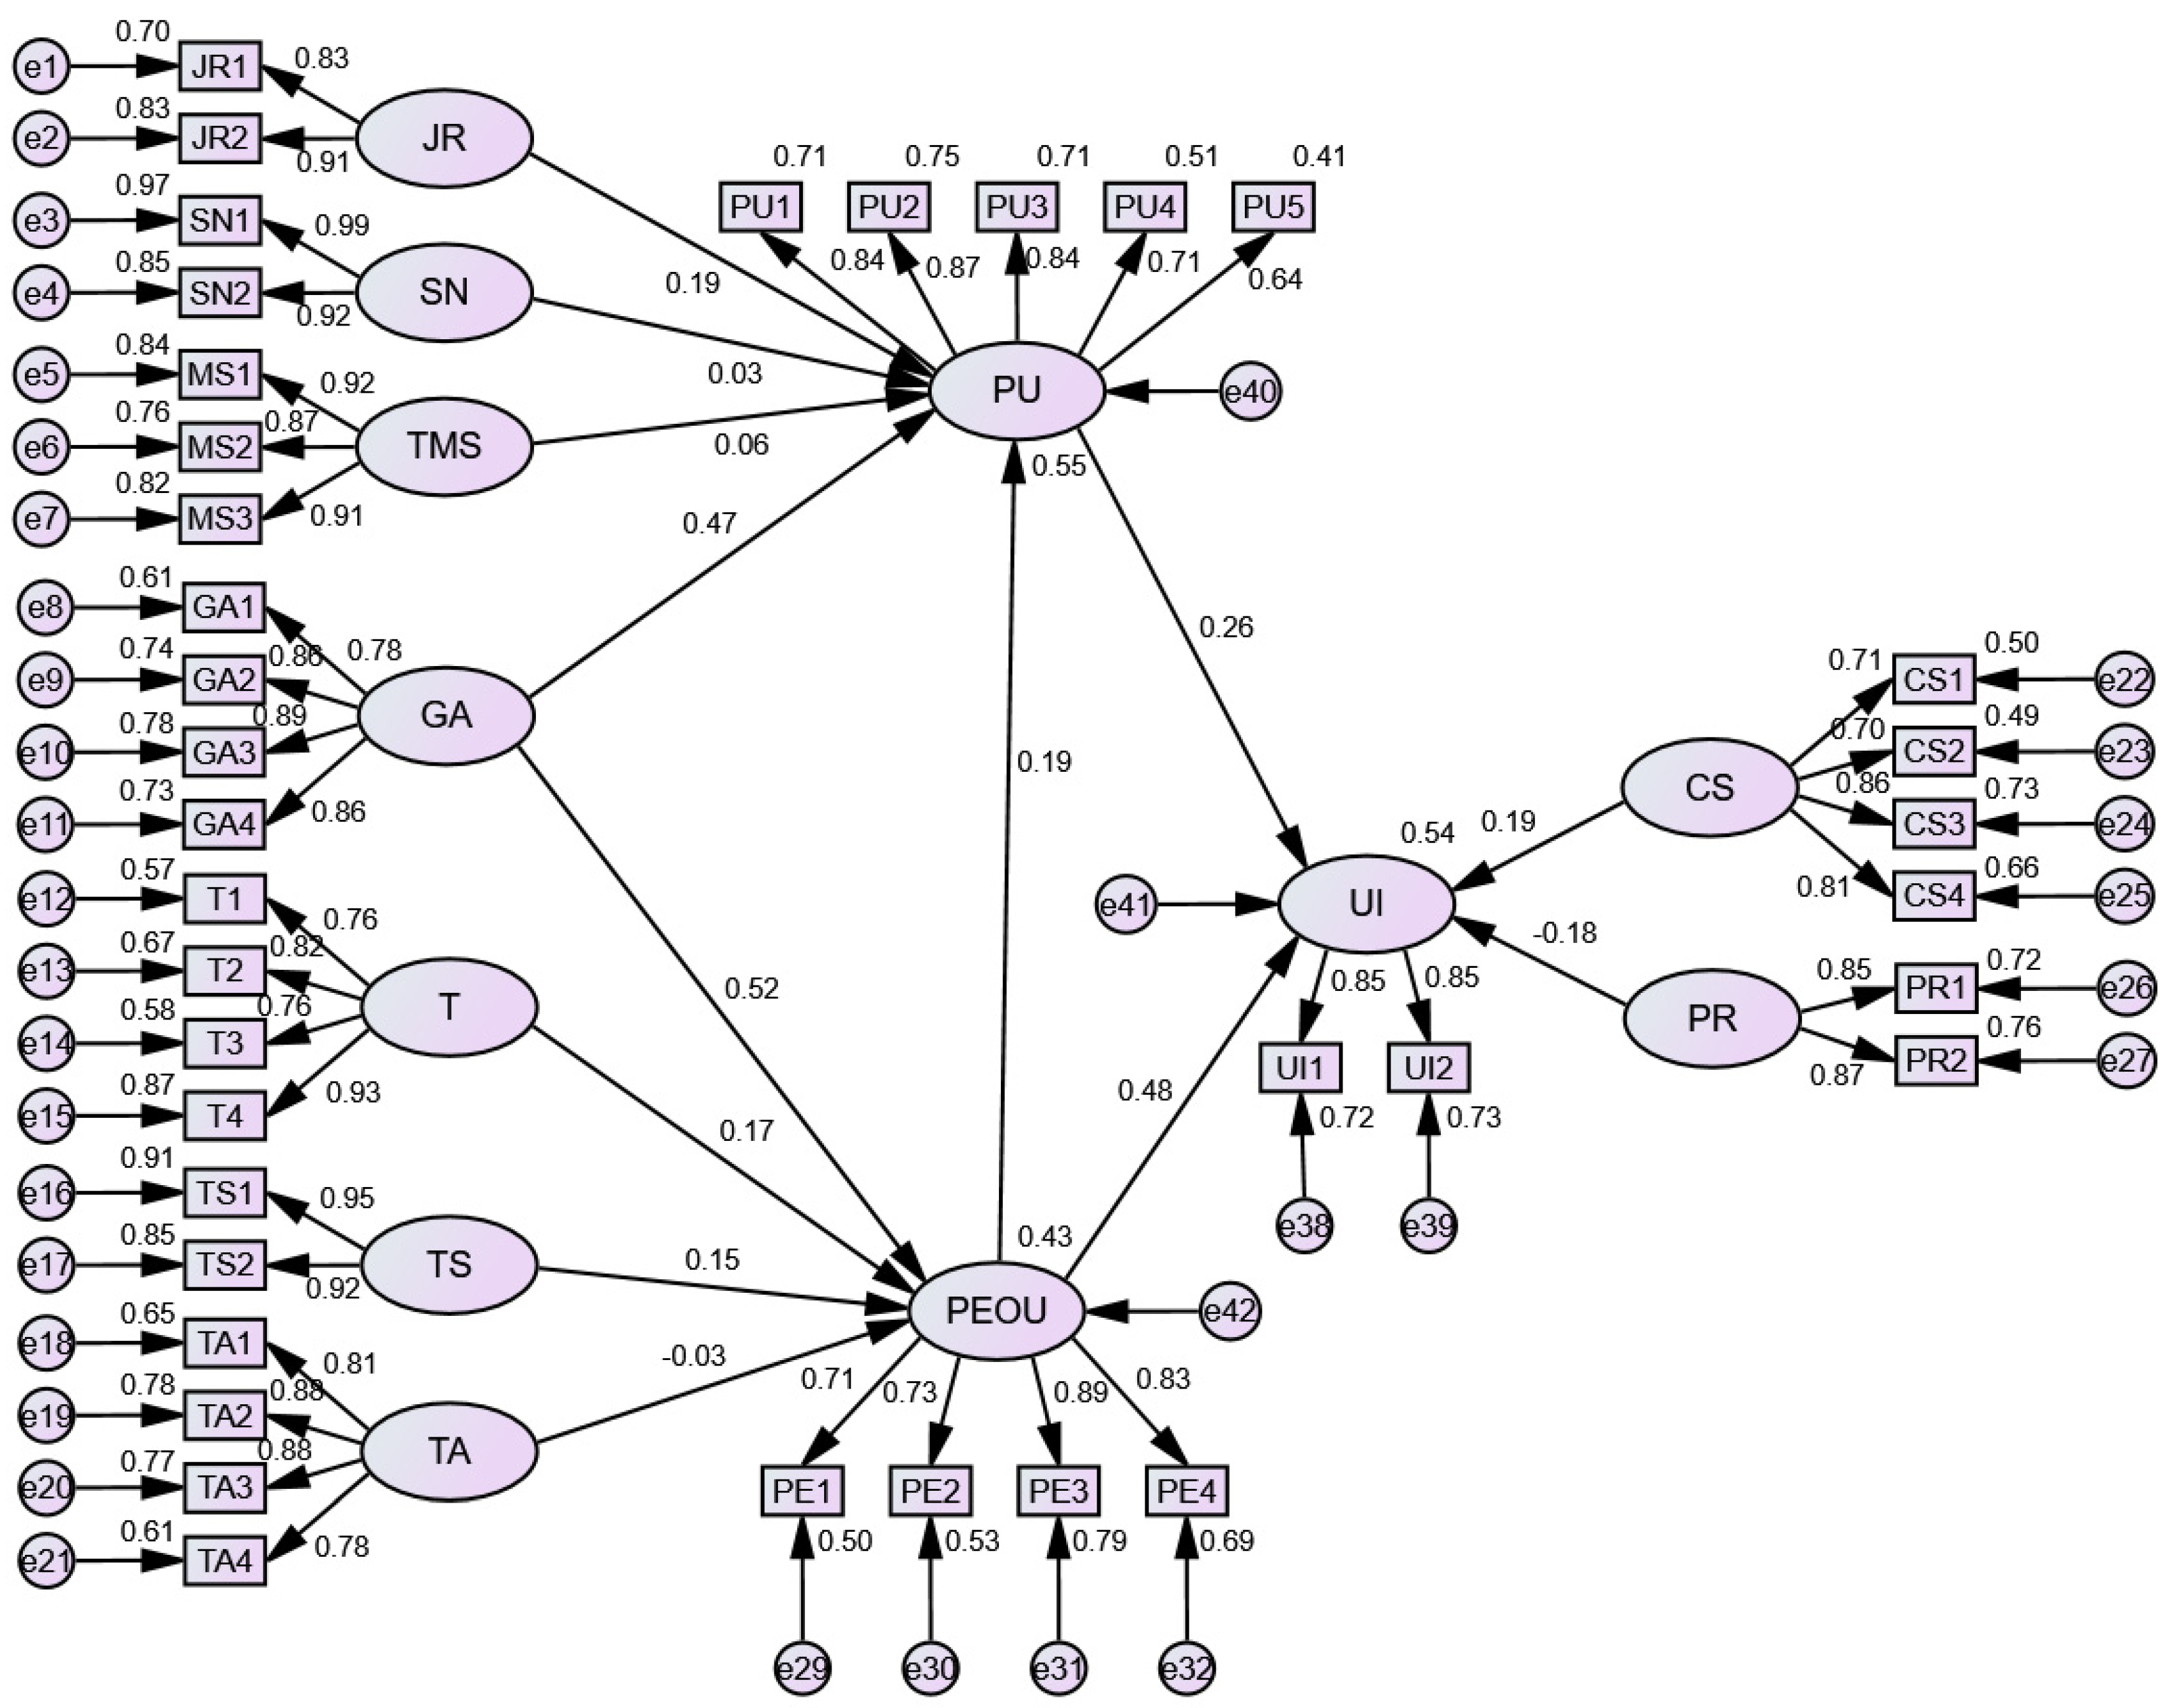
To acquire clear influence paths between latent variables, the standard path coefficients of ISSTAM were determined and are shown in Figure 6.
4.4. Discussion and Implication
4.4.1. Discussion
Unexpectedly, the research results show that H1 is not supported, implying that subjective norm has no significant effect on PU, contradicting previous studies’ conclusions [36,37]. This is probably because the majority of respondents were highly educated (more than 80%) and thus had strong safety awareness. Therefore, they tended to consciously and proactively adopt systems conducive to safety management. Moreover, the age structure of the respondents was relatively young. Young people think more independently and rationally, so their behavior is mainly guided by their rational thinking. This is consistent with the results of Gao et al. [72]. H2 is supported. Therefore, the positive effect of JR on PU is proven, which means that when the system is highly related to the profession of construction industry practitioners, the usefulness of the intelligent surveillance system can be perceived.
Additionally, H3 is rejected, showing that the effect of top management support on PU was also found to be insignificant. This is consistent with Yuan, Yang, and Xue [30]. This is probably due to the amount of top management support and resource input not meeting workers’ needs. Additionally, according to the research of Eisenberger et al. [73], the supportive behavior of top managers not being perceived by workers is another probable cause. The results support H4a and H4b, and their path coefficients are the largest. Therefore, government action can be seen as the most critical factor affecting the acceptance of intelligent surveillance systems. Previous research has confirmed the key role of government actions during the implementation of Building Information Management (BIM) [30,46]. Similar conclusions were also obtained in this study. Formulating policies and laws, government subsidies, and pilot projects are principal methods of government action, aiding to encourage owners to adopt intelligent surveillance systems. Additionally, the positive effects of training and technical support on PEOU were also confirmed, supporting H5 and H6. According to the research results of Igbaria, Zinatelli, Cragg, and Cavaye [23], if managers can provide regular training on the use of intelligent surveillance systems and technical developers can solve users’ difficulties in a timely manner, users will improve their PEOU toward the technology, thereby promoting the adoption of the intelligent surveillance system.
However, H7 was found to be unsubstantiated. This finding is contrary to previous research and indicates that technical anxiety has no significant negative impact on PEOU. This may be because the hypothesis is unreasonable or that cognition of these factors is low at the early stages of emerging technology, as Davis mentioned when proposing TAM [29]. At the same time, cost savings directly and positively affected UI, confirming H8. The intelligent surveillance system can protect the workforce, improve management efficiency, reduce safety risks, and reduce costs. Furthermore, compared to other smart devices for security management, its cost is lower, and it is more in line with the organization’s expected benefits, so the use intention of intelligent surveillance systems is improved [57]. Additionally, it is worth noting that privacy risk negatively influenced use intention, supporting H9. The lower the user’s concern about system privacy, the more inclined to use it. This is coherent with Rese, Ganster, and Baier [66]. Distrust of the system is negatively related to concerns about privacy [62].
Finally, H10, H11, and H12 are supported, which is consistent with the findings of TAM2 and TAM3 [74]. This shows that PU and PEOU act as a bridge between external variables and UI and positively influence UI. Greater use intention is gained as the construction industry practitioners’ beliefs that the system is valuable and easy to control increase [28]. Ensuring the intelligent surveillance system’s usefulness and ease of use is a vital prerequisite for its adoption by organizations. Additionally, the positive impact of PEOU on PU is the same as in previous studies, demonstrating that when users recognize the simplicity of the system, they regard it as more useful. The easy operation of the system is an influential guarantee for its successful popularization.
4.4.2. Theoretical Implications
This study verified that the use intention of construction practitioners is directly affected by their beliefs and found six external variables that directly (CS and PR) or indirectly (JR, GA, T, and TS) affect use intention. The results provide insights for practitioners in the construction industry who aim to use the intelligent surveillance system and enhance the penetration rate of intelligent surveillance systems on construction sites.
Firstly, the previous TAM and extended models have been commonly applied in the construction industry. However, past research has primarily focused on technology such as BIM or mobile IT, and research gaps on the acceptance of intelligent surveillance systems exist. Therefore, we developed ISSTAM for the development of intelligent surveillance systems, which is an innovative approach. We constructed an extended model that conformed to the logical content of the technology acceptance model and formed a clear interpretation of the influential elements for the adoption of intelligent surveillance systems in the initial stage of its development.
Secondly, most previous studies focused on one group of respondents or conducted unified surveys without distinguishing between different groups of people. In this study, considering the different concerns between workers and managers regarding the adoption of intelligent surveillance systems, the workers and managers were investigated separately to collect data more scientifically and realize a multidimensional and broader survey of construction industry practitioners.
Thirdly, ISSTAM considers market economy laws, incorporating factors such as policies, technology, system value, and environment, which cannot be ignored in the initial development of the intelligent surveillance system. At the same time, taking the owner’s investment mechanism into account, cost savings was integrated into the external variables for a more comprehensive analysis.
Finally, this research expanded TAM and classified the factors and elements that influence intelligent surveillance systems’ implementation in the construction field from four dimensions: individual, organizational, technical, and environmental. A structural equation model was established for path analysis and hypothesis testing, revealing the intrinsic motivation and mechanism of the adoption behavior of the intelligent surveillance system in the construction industry and providing deeper insights for the successful popularization of the intelligent surveillance system.
4.4.3. Practical Implications
Our research verified six external variables from four dimensions (individual (job relevance), organization (training and cost savings), environment (government action), and technology (technical support and privacy risk)) that affect the acceptance of intelligent surveillance systems, aiming to provide a reference value for organizations, governments, and technology developers.
For the organization, workers’ acceptance must be considered when using new technologies. The intelligent surveillance system is closely related to safety management. Therefore, managers should emphasize the importance of safety in the construction process to improve workers’ perception of job relevance. In addition, if managers can organize regular and valuable training, it will positively influence workers’ beliefs about ease of use, thereby increasing their use intention. At the same time, managers, as supervisors, must fully protect the privacy of the supervised individuals in using the intelligent surveillance system to prevent workers from resisting its adoption.
Our research discovered that the government is the most important subject in promoting the adoption of intelligent surveillance systems. Formulating policies related to the use of intelligent surveillance systems can improve practitioners’ perception of usefulness and ease of use. At the same time, privacy-related laws can effectively eliminate users’ concerns about the privacy risks of intelligent surveillance systems and increase their use intention. In addition, government subsidies enable owners to reduce the cost of using intelligent surveillance systems, which is an important factor affecting owners’ use intention. Using the intelligent surveillance system for safety management in a pilot project can show owners the ease of use and usefulness of the system and indirectly promote their use intention.
For technology developers, it is vital to continuously optimize the technology and improve the recognition accuracy, solving the privacy problem at the source. Considering that a high percentage of construction workers are older and less educated, the system’s ease of use is an influential factor that affects their use intention. Therefore, technology developers should design an intelligent surveillance system that is simple and easy to master. Finally, technical support plays a crucial role in influencing the perceived ease of use. This highlights that companies that develop intelligent surveillance systems should also focus on product after-sales and provide timely technical support to solve user problems.
5. Conclusions
Despite the many benefits of intelligent surveillance systems, they are still hindered by real-world factors and are still viewed with suspicion by the construction industry. Among construction industry practitioners, 66% had never used such equipment, indicating intelligent surveillance systems’ current low adoption rate. This study is the first to apply TAM to the acceptance of intelligent surveillance systems. More importantly, this study validates the important factors hindering and promoting the acceptance of intelligent surveillance systems.
To explore the factors that affect the successful implementation of intelligent surveillance systems among construction practitioners, this research constructed an extension of TAM to discover the decisive elements increasing practitioners’ use intention, perceived usefulness, and perceived ease of use from different dimensions (individual, organization, environment, and technology). This research is the first comprehensive investigation of the acceptance of intelligent surveillance systems, explaining the intrinsic motivation and mechanism of action for practitioners in the construction industry to adopt intelligent surveillance systems.
The research findings provide many insights for promoting the successful implementation of intelligent surveillance systems. Government action is the most significant factor influencing practitioners’ beliefs of usefulness (path coefficient = 0.468) and ease of use (path coefficient = 0.518). Moreover, combining the results of this research and the actual situation, the negative effect of privacy risk cannot be ignored, which may cause resistance to the adoption of the surveillance system. Furthermore, the positive effects of training and technical support on PEOU were confirmed, and job relevance and cost savings made a significant contribution to PU. Additionally, the effect paths and internal mechanisms between variables were also proved. PU and PEOU have a significant mediation effect between external variables and UI. Furthermore, PU was positively affected by PEOU. However, subjective norm (p = 0.544 > 0.05) and top management support (p = 0.340 > 0.05) had no positive effects on PU, and technical anxiety (p = 0.634 > 0.05) was also found to have no significant negative effects on PEOU. The research results will help construction industry practitioners to have a clearer understanding of the essential elements that affect the implementation of intelligent surveillance systems and guide organizations, governments, and technology developers to formulate strategies to promote the adoption of intelligent surveillance systems more effectively.
However, this study also has limitations. Firstly, the respondents have limited experience in using intelligent surveillance systems. The intelligent surveillance system has only been adopted in the construction field in recent years, so actual applications are still limited. Most practitioners have insufficient work experience in using an intelligent surveillance system. Secondly, the data in this study only came from China, so extensive research is needed in the future to verify the universality of ISSTAM in the construction industry in different countries. When this research was carried out, the intelligent surveillance system was still not mature or popular, so attempts were made to conduct more extensive and comprehensive research at four levels. Therefore, in the future, when more construction industry practitioners have used the intelligent surveillance system, the research can be more focused. For example, the research can be conducted only from the workers’ perspective, focusing on their psychology and active use intention rather than being forced to use the technology. At the same time, based on the results of this study, irrelevant variables can be removed, and new variables can be added in combination with the real-world situation in the future.
Author Contributions
Funding acquisition, Y.L.; methodology, Y.L.; writing—original draft, Y.L.; software, Y.D.; investigation, Y.D. All authors have read and agreed to the published version of the manuscript.
Funding
This research was funded by the National Social Science Foundation of China (Grant No.19BGL238).
Informed Consent Statement
Not applicable.
Data Availability Statement
Some or all data and models that support the findings of this study are available from the corresponding author by request.
Acknowledgments
This research was funded by the National Social Science Foundation of China (Grant No. 19BGL238). Gratitude is expressed to those who offered suggestions to this paper. Sincere gratitude and respect are expressed to all reviewers.
Conflicts of Interest
The authors declare no conflict of interest.
Appendix A. List of Measurement Items for Each Variable

| Variable | Item | Reference | |
|---|---|---|---|
| Job relevance | JR1 | Usage of ISS is closely related to my daily work. | [24,28,55] |
| JR2 | Usage of ISS is very important to my work. | ||
| Subjective norm | SN1 | People who are important to me think I should use ISS. | [24,28,72] |
| SN2 | People who influence my behavior think I should use ISS. | ||
| Top management support | MS1 | Top management encouraged me to use ISS. | [28,37] |
| MS2 | Top management understands the benefits of ISS. | ||
| MS3 | Top management recognizes my efforts in using ISS. | ||
| Cost savings | CS1 | The price of ISS is reasonable. | [59] |
| CS2 | The cost of ISS would not become a financial burden. | ||
| CS3 | ISS is cheaper than other safety supervision equipment. | [53] | |
| CS4 | ISS has lower maintenance costs than other safety regulations. | ||
| Training | T1 | After training, my understanding of ISS has been greatly improved. | [28] |
| T2 | After training, I am confident in using ISS. | ||
| T3 | The training content is comprehensive and the training time is long enough. | ||
| T4 | There are experienced and knowledgeable trainers to help me understand and use ISS. | ||
| Technical support | TS1 | When I encounter difficulties in using ISS, it is easy to contact technicians and get help. | [28,37] |
| TS2 | When I encounter difficulties in using ISS, technicians can provide effective help. | ||
| Technology anxiety | TA1 | I feel nervous in the face of new technology. | [53,54,72] |
| TA2 | I am worried that it is difficult to learn new technology. | ||
| TA3 | I am reluctant to use new technology because I am worried about making big mistakes. | ||
| TA4 | When using a new technology, I worry that it might be broken in some way. | ||
| Privacy risk | PR1 | I am worried that my privacy will be threatened. | [62] |
| PR2 | I am worried that the video captured by surveillance would be abused. | ||
| Government action | GA1 | Government issues relevant guidance or compulsory policies. | [30,46] |
| GA2 | Government grants subsidies or bonuses. | ||
| GA3 | Government promulgates relevant laws and regulations. | ||
| GA4 | Government launches a pilot project using ISS. | ||
| Perceived usefulness | PU1 | Using ISS can increase the speed of work. | [24,28,72] |
| PU2 | Using ISS can improve the quality of work. | ||
| PU3 | Compared with other equipment, more work can be done with ISS. | ||
| PU4 | Using ISS can improve safety of work. | [75] | |
| PU5 | Using ISS can increase safety awareness. | ||
| Perceived ease of use | PE1 | Using ISS would be easy for me. | [24,28,75] |
| PE2 | Using ISS would not consume a lot of my energy. | ||
| PE3 | ISS is very easy to control for me. | ||
| PE4 | I clearly know how to use ISS. | ||
| Use intention | UI1 | Assuming I have access to the system, I intend to use it. | [24] |
| UI2 | Given that I have access to the system, I predict that I would use it. | ||
Note: ISS refers to intelligent surveillance system.
Appendix B. List of Abbreviations
| Abbreviation | Definition |
| HSE | Health and Safety Executive |
| MEPs | Members of the European Parliament |
| TAM | Technology acceptance model |
| ISSTAM | Intelligent surveillance system technology acceptance model |
| PPE | Personal protective equipment |
| IT | Information technology |
| TOE | Technology–organization–environment |
| PU | Perceived usefulness |
| PEOU | Perceived ease of use |
| UI | Use intention |
| SN | Subjective norm |
| JB | Job relevance |
| TMS | Top management support |
| GA | Government action |
| T | Training |
| TS | Technical support |
| TA | Technology anxiety |
| CS | Cost savings |
| PR | Privacy risk |
| CFA | Confirmatory factor analysis |
| CR | Composite reliability |
| AVE | Average variance extracted |
| SEM | Structural equation model |
References
- Kang, Y.; Siddiqui, S.; Suk Sung, J.; Chi, S.; Kim, C. Trends of Fall Accidents in the U.S. Construction Industry. J. Constr. Eng. Manag. 2017, 143, 04017043. [Google Scholar] [CrossRef]
- Zhang, L.; Chen, H.; Li, H.; Wu, X.; Skibniewski, M.J. Perceiving interactions and dynamics of safety leadership in construction projects. Saf. Sci. 2018, 106, 66–78. [Google Scholar] [CrossRef]
- Ministry of Housing and Urban-Rural Department of the People’s Republic of China. Notification of Production Safety Accidents in Housing and Municipal Engineering. Available online: http://www.mohurd.gov.cn/wjfb/202006/t20200624_246031.html (accessed on 19 June 2020).
- Health and Safety Executive. Construction Statistics in Great Britain. 2020. Available online: https://www.hse.gov.uk/statistics/industry/index.htm (accessed on 4 November 2020).
- U.S. Bureau of Labor Statistics. Construction:NAICS 23. Available online: https://www.bls.gov/iag/tgs/iag23.htm (accessed on 18 January 2019).
- Heinrich, H.W.; Petersen, D.; Roos, N.R.; Brown, J.; Hazlett, S. Industrial Accident Prevention: A Safety Management Approach, 5th ed.; McGraw-Hill: New York, NY, USA, 1980. [Google Scholar]
- Guo, S.; Xiong, C.; Gong, P. A real-time control approach based on intelligent video surveillance for violations by construction workers. J. Civ. Eng. Manag. 2018, 24, 67–78. [Google Scholar] [CrossRef] [Green Version]
- Ministry of Housing and Urban-Rural Department of the People’s Republic of China. Jiangsu Construction Upgraded “Smart Site” Pilot Project. Available online: http://www.mohurd.gov.cn/xinwen/dfxx/202006/20200624_246018.html (accessed on 24 June 2020).
- Seo, J.; Han, S.; Lee, S.; Kim, H. Computer vision techniques for construction safety and health monitoring. Adv. Eng. Inform. 2015, 29, 239–251. [Google Scholar] [CrossRef]
- Ball, K. Workplace surveillance: An overview. Labor History 2010, 51, 87–106. [Google Scholar] [CrossRef]
- Summary, A. Summary: Use of Artificial Intelligence by the Police: MEPs Oppose Mass Surveillance. Available online: https://ai-summary.com/summary-use-of-artificial-intelligence-by-the-police-meps-oppose-mass-surveillan/ (accessed on 7 October 2021).
- Mathur, G.; Bundele, M. Research on Intelligent Video Surveillance techniques for suspicious activity detection critical review. In Proceedings of the 2016 International Conference on Recent Advances and Innovations in Engineering (ICRAIE), Jaipur, India, 23–25 December 2016; pp. 1–8. [Google Scholar]
- Zhang, M.; Shi, R.; Yang, Z. A critical review of vision-based occupational health and safety monitoring of construction site workers. Saf. Sci. 2020, 126, 104658. [Google Scholar] [CrossRef]
- Fang, Q.; Li, H.; Luo, X.; Ding, L.; Luo, H.; Rose, T.M.; An, W. Detecting non-hardhat-use by a deep learning method from far-field surveillance videos. Autom. Constr. 2018, 85, 1–9. [Google Scholar] [CrossRef]
- Mneymneh Bahaa, E.; Abbas, M.; Khoury, H. Vision-Based Framework for Intelligent Monitoring of Hardhat Wearing on Construction Sites. J. Comput. Civil. Eng. 2019, 33, 04018066. [Google Scholar] [CrossRef]
- Wu, J.; Cai, N.; Chen, W.; Wang, H.; Wang, G. Automatic detection of hardhats worn by construction personnel: A deep learning approach and benchmark dataset. Autom. Constr. 2019, 106, 102894. [Google Scholar] [CrossRef]
- Park, M.-W.; Brilakis, I. Construction worker detection in video frames for initializing vision trackers. Autom. Constr. 2012, 28, 15–25. [Google Scholar] [CrossRef]
- Seong, H.; Son, H.; Kim, C. A Comparative Study of Machine Learning Classification for Color-based Safety Vest Detection on Construction-Site Images. KSCE J. Civ. Eng. 2018, 22, 4254–4262. [Google Scholar] [CrossRef]
- Han, S.; Lee, S. A vision-based motion capture and recognition framework for behavior-based safety management. Autom. Constr. 2013, 35, 131–141. [Google Scholar] [CrossRef]
- Yu, Y.; Guo, H.; Ding, Q.; Li, H.; Skitmore, M. An experimental study of real-time identification of construction workers’ unsafe behaviors. Autom. Constr. 2017, 82, 193–206. [Google Scholar] [CrossRef] [Green Version]
- Konstantinou, E.; Lasenby, J.; Brilakis, I. Adaptive computer vision-based 2D tracking of workers in complex environments. Autom. Constr. 2019, 103, 168–184. [Google Scholar] [CrossRef]
- Davis, F.D. Perceived Usefulness, Perceived Ease of Use, and User Acceptance of Information Technology. MIS Q. 1989, 13, 319–340. [Google Scholar] [CrossRef] [Green Version]
- Igbaria, M.; Zinatelli, N.; Cragg, P.; Cavaye, A.L.M. Personal Computing Acceptance Factors in Small Firms: A Structural Equation Model. MIS Q. 1997, 21, 279–305. [Google Scholar] [CrossRef]
- Venkatesh, V.; Davis, F.D. A Theoretical Extension of the Technology Acceptance Model: Four Longitudinal Field Studies. Manag. Sci. 2000, 46, 186–204. [Google Scholar] [CrossRef] [Green Version]
- Manis, K.T.; Choi, D. The virtual reality hardware acceptance model (VR-HAM): Extending and individuating the technology acceptance model (TAM) for virtual reality hardware. J. Bus. Res. 2019, 100, 503–513. [Google Scholar] [CrossRef]
- An, M.H.; You, S.C.; Park, R.W.; Lee, S. Using an Extended Technology Acceptance Model to Understand the Factors Influencing Telehealth Utilization After Flattening the COVID-19 Curve in South Korea: Cross-sectional Survey Study. JMIR Med. Inform. 2021, 9, e25435. [Google Scholar] [CrossRef]
- McNamara, A.J.; Sepasgozar, S.M.E. Developing a theoretical framework for intelligent contract acceptance. Constr. Innov. 2020, 20, 421–445. [Google Scholar] [CrossRef]
- Son, H.; Park, Y.; Kim, C.; Chou, J.-S. Toward an understanding of construction professionals’ acceptance of mobile computing devices in South Korea: An extension of the technology acceptance model. Autom. Constr. 2012, 28, 82–90. [Google Scholar] [CrossRef]
- Yang, Z.; Wang, Y.; Sun, C. Emerging Information Technology Acceptance Model for the Development of Smart Construction System. J. Civ. Eng. Manag. 2018, 24, 457–468. [Google Scholar] [CrossRef]
- Yuan, H.; Yang, Y.; Xue, X. Promoting Owners’ BIM Adoption Behaviors to Achieve Sustainable Project Management. Sustainability 2019, 11, 3905. [Google Scholar] [CrossRef] [Green Version]
- Wong, T.K.M.; Man, S.S.; Chan, A.H.S. Exploring the acceptance of PPE by construction workers: An extension of the technology acceptance model with safety management practices and safety consciousness. Saf. Sci. 2021, 139, 105239. [Google Scholar] [CrossRef]
- Tornatzky, L.G.; Fleischer, M.; Chakrabarti, A.K. The processes of Technological Innovation; D.C. Heath & Company: Lexington, MA, USA, 1990. [Google Scholar]
- Nnaji, C.; Gambatese, J.; Karakhan, A.; Eseonu, C. Influential safety technology adoption predictors in construction. Eng. Constr. Archit. Manag. 2019, 26, 2655–2681. [Google Scholar] [CrossRef]
- Roberts, R.; Flin, R. Unlocking the Potential: Understanding the Psychological Factors That Influence Technology Adoption in the Upstream Oil and Gas Industry. SPE J. 2020, 25, 515–528. [Google Scholar] [CrossRef]
- Rogers, E.M. Diffusion of Innovations, 5th ed.; Free Press: New York, NY, USA, 2003. [Google Scholar]
- Chen, J.-H.; Ha, N.T.T.; Tai, H.-W.; Chang, C.-A. The Willingness to Adopt the Internet of Things (Iot) Conception in Taiwan’s Construction Industry. J. Civ. Eng. Manag. 2020, 26, 534–550. [Google Scholar] [CrossRef]
- Park, Y.; Son, H.; Kim, C. Investigating the determinants of construction professionals’ acceptance of web-based training: An extension of the technology acceptance model. Autom. Constr. 2012, 22, 377–386. [Google Scholar] [CrossRef]
- Elshafey, A.; Saar, C.C.; Aminudin, E.B.; Gheisari, M.; Usmani, A. Technology acceptance model for Augmented Reality and Building Information Modeling integration in the construction industry. J. Inf. Technol. Constr. 2020, 25, 161–172. [Google Scholar] [CrossRef] [Green Version]
- Wismantoro, Y.; Himawan, H.; Widiyatmoko, K. Measuring the Interest of Smartphone Usage by Using Technology Acceptance Model Approach. J. Asian Finance Econ. Bus. 2020, 7, 613–620. [Google Scholar] [CrossRef]
- Pérez Pérez, M.; Martínez Sánchez, A.; de Luis Carnicer, P.; José Vela Jiménez, M. A technology acceptance model of innovation adoption: The case of teleworking. Eur. J. Innov. Manag. 2004, 7, 280–291. [Google Scholar] [CrossRef]
- Latane, B. The psychology of social impact. Am. Psychol. 1981, 36, 343–356. [Google Scholar] [CrossRef]
- Lucas, H.C. Empirical Evidence for a Descriptive Model of Implementation. MIS Q. 1978, 2, 27–42. [Google Scholar] [CrossRef]
- Igbaria, M. An examination of the factors contributing to microcomputer technology acceptance. Acc. Manag. Inf. Technol. 1994, 4, 205–224. [Google Scholar] [CrossRef]
- Hasan, A.; Ahn, S.; Rameezdeen, R.; Baroudi, B. Investigation into post-adoption usage of mobile ICTs in Australian construction projects. Eng. Constr. Archit. Manag. 2019, 28, 351–371. [Google Scholar] [CrossRef]
- Lewis, W.; Agarwal, R.; Sambamurthy, V. Sources of Influence on Beliefs about Information Technology Use: An Empirical Study of Knowledge Workers. MIS Q. 2003, 27, 657–678. [Google Scholar] [CrossRef] [Green Version]
- Zhang, R.; Tang, Y.; Wang, L.; Wang, Z.; Zhang, J. Factors Influencing BIM Adoption for Construction Enterprises in China. Adv. Civ. Eng. 2020, 2020, 1–15. [Google Scholar] [CrossRef]
- Dolores Gallego, M.; Bueno, S.; José Racero, F.; Noyes, J. Open source software: The effects of training on acceptance. Comput. Hum. Behav. 2015, 49, 390–399. [Google Scholar] [CrossRef]
- Sánchez, R.A.; Hueros, A.D. Motivational factors that influence the acceptance of Moodle using TAM. Comput. Hum. Behav. 2010, 26, 1632–1640. [Google Scholar] [CrossRef] [Green Version]
- Igbaria, M. End-user computing effectiveness: A structural equation model. Omega 1990, 18, 637–652. [Google Scholar] [CrossRef]
- Ardiansah, M.N.; Chariri, A.; Rahardja, S.; Udin, U. The effect of electronic payments security on e-commerce consumer perception: An extended model of technology acceptance. Manag. Sci. Lett. 2020, 10, 1473–1480. [Google Scholar] [CrossRef]
- Servidio, R.; Cronin, M. PerLE: An “Open Source”, ELearning Moodle-Based, Platform. A Study of University Undergraduates’ Acceptance. Behav. Sci. 2018, 8, 63. [Google Scholar] [CrossRef] [PubMed] [Green Version]
- Presno, C. Taking the Byte Out of Internet Anxiety: Instructional Techniques That Reduce Computer/Internet Anxiety in the Classroom. J. Educ. Comput. Res. 1998, 18, 147–161. [Google Scholar] [CrossRef]
- Hohenberger, C.; Spörrle, M.; Welpe, I.M. Not fearless, but self-enhanced: The effects of anxiety on the willingness to use autonomous cars depend on individual levels of self-enhancement. Technol. Forecast. Soc. Change 2017, 116, 40–52. [Google Scholar] [CrossRef]
- Gelbrich, K.; Sattler, B. Anxiety, crowding, and time pressure in public self-service technology acceptance. J. Serv. Mark. 2014, 28, 82–94. [Google Scholar] [CrossRef]
- Venkatesh, V.; Bala, H. Technology Acceptance Model 3 and a Research Agenda on Interventions. Decis. Sci. 2008, 39, 273–315. [Google Scholar] [CrossRef] [Green Version]
- Hackbarth, G.; Grover, V.; Yi, M.Y. Computer playfulness and anxiety: Positive and negative mediators of the system experience effect on perceived ease of use. Inf. Manag. 2003, 40, 221–232. [Google Scholar] [CrossRef]
- Okpala, I.; Nnaji, C.; Karakhan, A.A. Utilizing Emerging Technologies for Construction Safety Risk Mitigation. Pract. Period. Struct. Des. Constr. 2020, 25, 04020002. [Google Scholar] [CrossRef]
- Nnaji, C.; Gambatese, J.; Karakhan, A.; Osei-Kyei, R. Development and Application of Safety Technology Adoption Decision-Making Tool. J. Constr. Eng. Manag. 2020, 146, 04020028. [Google Scholar] [CrossRef]
- Kim, K.J.; Shin, D.-H. An acceptance model for smart watches. Internet Res. 2015, 25, 527–541. [Google Scholar] [CrossRef]
- Sun, Y.; Wang, N.; Guo, X.; Peng, J. Understanding the acceptance of mobile health services: A comparison and integration of alternative models. J. Electron. Commer. Res. 2013, 14, 183–200. [Google Scholar]
- Kim, J.; Lee, D.; Park, N. CCTV-RFID enabled multifactor authentication model for secure differential level video access control. Multimed. Tools Appl. 2020, 79, 23461–23481. [Google Scholar] [CrossRef]
- Sharif, A.; Soroya, S.H.; Ahmad, S.; Mahmood, K. Antecedents of Self-Disclosure on Social Networking Sites (SNSs): A Study of Facebook Users. Sustainability 2021, 13, 1220. [Google Scholar] [CrossRef]
- Zhou, T. The impact of privacy concern on user adoption of location—Based services. Ind. Manag. Data Syst. 2011, 111, 212–226. [Google Scholar] [CrossRef]
- Ambrose, P.; Basu, C. Interpreting the Impact of Perceived Privacy and Security Concerns in Patients’ Use of Online Health Information Systems. J. Inf. Priv. Secur. 2012, 8, 38–50. [Google Scholar] [CrossRef]
- Albashrawi, M.; Motiwalla, L. Privacy and Personalization in Continued Usage Intention of Mobile Banking: An Integrative Perspective. Inf. Syst. Front. 2017, 21, 1031–1043. [Google Scholar] [CrossRef]
- Rese, A.; Ganster, L.; Baier, D. Chatbots in retailers’ customer communication: How to measure their acceptance? J. Retail. Consum. Serv. 2020, 56, 102176. [Google Scholar] [CrossRef]
- He, C.; McCabe, B.; Jia, G.; Sun, J. Effects of Safety Climate and Safety Behavior on Safety Outcomes between Supervisors and Construction Workers. J. Constr. Eng. Manag. 2020, 146, 04019092. [Google Scholar] [CrossRef]
- Anderson, J.C.; Gerbing, D.W. Structural equation modeling in practice: A review and recommended two-step approach. Psychol. Bull. 1988, 103, 411–423. [Google Scholar] [CrossRef]
- DeVellis, R.F. Scale Development: Theory and Applications; Sage Publications, Inc.: Thousand Oaks, CA, USA, 1991. [Google Scholar]
- Bagozzi, R.P.; Yi, Y. On the evaluation of structural equation models. J. Acad. Mark. Sci. 1988, 16, 74–94. [Google Scholar] [CrossRef]
- Xiong, B.; Skitmore, M.; Xia, B. A critical review of structural equation modeling applications in construction research. Autom. Constr. 2015, 49, 59–70. [Google Scholar] [CrossRef] [Green Version]
- Gao, L.; Wang, S.; Li, J.; Li, H. Application of the extended theory of planned behavior to understand individual’s energy saving behavior in workplaces. Resour. Conserv. Recycl. 2017, 127, 107–113. [Google Scholar] [CrossRef]
- Eisenberger, R.; Fasolo, P.; Davis-LaMastro, V. Perceived organizational support and employee diligence, commitment, and innovation. J. Appl. Psychol. 1990, 75, 51–59. [Google Scholar] [CrossRef]
- Venkatesh, V.; Morris, M.G.; Davis, G.B.; Davis, F.D. User Acceptance of Information Technology: Toward a Unified View. MIS Q. 2003, 27, 425–478. [Google Scholar] [CrossRef] [Green Version]
- Choi, B.; Hwang, S.; Lee, S. What drives construction workers’ acceptance of wearable technologies in the workplace? Indoor localization and wearable health devices for occupational safety and health. Autom. Constr. 2017, 84, 31–41. [Google Scholar] [CrossRef]
Figure 1.
Research framework.

Figure 2.
Technology acceptance model.

Figure 3.
Proposed ISSTAM.

Figure 4.
Statistics on the actual use of the intelligent surveillance system.

Figure 5.
Data analysis process and verification indicators.

Figure 6.
Standard path coefficients of ISSTAM. (Note: JR = job relevance; SN = subjective norm; TMS = top management support; T = training; TS = technical support; TA = technology anxiety; CS = cost savings; PR = privacy risk; GA = government action; PU = perceived usefulness; PEOU = perceived ease of use; UI = use intention.)

Table 1.
Demographic characteristics of the respondents.
| Characteristic | Category | Frequency | Percentage |
|---|---|---|---|
| Gender | Male | 160 | 72.73% |
| Female | 60 | 27.27% | |
| Age | 20–29 | 173 | 78.64% |
| 30–39 | 26 | 11.82% | |
| 40–49 | 13 | 5.91% | |
| ≥50 | 8 | 3.64% | |
| Education | ≤High school | 11 | 5.00% |
| Junior college | 19 | 8.64% | |
| Undergraduate | 172 | 78.18% | |
| ≥Postgraduate | 18 | 8.18% | |
| Job experience | 0–5 years | 177 | 80.45% |
| 5–10 years | 24 | 10.91% | |
| 11–15 years | 8 | 3.64% | |
| ≥16 years | 11 | 5.00% | |
| Position | Worker | 52 | 23.64% |
| Security manager | 6 | 2.73% | |
| Construction engineer | 23 | 10.45% | |
| Cost engineer | 37 | 16.82% | |
| Project manager | 8 | 3.64% | |
| Top management | 11 | 5.00% | |
| Construction design institute | 10 | 4.55% | |
| Other managers | 73 | 33.18% |
Table 2.
Reliability and validity analysis results.
| Variable | Item | Mean (SD) | Factor Loading | AVE | CR | Cronbach’s Alpha |
|---|---|---|---|---|---|---|
| Job relevance | JR1 | 3.755 (1.13) | 0.834 | 0.765 | 0.866 | 0.864 |
| JR2 | 3.659 (1.17) | 0.913 | ||||
| Subjective norm | SN1 | 4.095 (0.93) | 0.985 | 0.910 | 0.953 | 0.952 |
| SN2 | 4.082 (0.93) | 0.922 | ||||
| Top management support | MS1 | 3.923 (0.94) | 0.916 | 0.807 | 0.926 | 0.926 |
| MS2 | 3.865 (0.96) | 0.872 | ||||
| MS3 | 3.731 (0.96) | 0.907 | ||||
| Cost savings | CS1 | 3.690 (0.96) | 0.710 | 0.596 | 0.854 | 0.855 |
| CS2 | 3.607 (0.96) | 0.701 | ||||
| CS3 | 3.625 (0.99) | 0.855 | ||||
| CS4 | 3.494 (0.93) | 0.811 | ||||
| Training | T1 | 3.909 (0.92) | 0.757 | 0.673 | 0.891 | 0.895 |
| T2 | 3.900 (0.92) | 0.817 | ||||
| T3 | 3.891 (0.93) | 0.764 | ||||
| T4 | 3.977 (0.89) | 0.932 | ||||
| Technical support | TS1 | 4.009 (0.90) | 0.952 | 0.878 | 0.935 | 0.935 |
| TS2 | 4.077 (0.91) | 0.922 | ||||
| Technology anxiety | TA1 | 2.950 (1.16) | 0.809 | 0.704 | 0.905 | 0.903 |
| TA2 | 2.786 (1.21) | 0.880 | ||||
| TA3 | 2.727 (1.19) | 0.880 | ||||
| TA4 | 2.927 (1.19) | 0.782 | ||||
| Privacy risk | PR1 | 3.323 (1.08) | 0.850 | 0.742 | 0.852 | 0.851 |
| PR2 | 3.509 (1.12) | 0.873 | ||||
| Government action | GA1 | 3.841 (0.97) | 0.782 | 0.719 | 0.911 | 0.909 |
| GA2 | 3.964 (0.99) | 0.863 | ||||
| GA3 | 4.077 (0.92) | 0.885 | ||||
| GA4 | 3.914 (0.95) | 0.857 | ||||
| Perceived usefulness | PU1 | 3.977 (0.95) | 0.841 | 0.616 | 0.888 | 0.886 |
| PU2 | 4.064 (0.90) | 0.866 | ||||
| PU3 | 3.923 (0.94) | 0.841 | ||||
| PU4 | 4.018 (0.92) | 0.711 | ||||
| PU5 | 3.859 (0.93) | 0.642 | ||||
| Perceived ease of use | PE1 | 3.850 (0.86) | 0.709 | 0.629 | 0.870 | 0.863 |
| PE2 | 3.555 (0.94) | 0.727 | ||||
| PE3 | 3.655 (0.92) | 0.890 | ||||
| PE4 | 3.668 (0.91) | 0.831 | ||||
| Use intention | UI1 | 3.773 (0.95) | 0.846 | 0.723 | 0.840 | 0.847 |
| UI2 | 3.750 (0.91) | 0.855 |
Table 3.
KMO and Bartlett’s test.
| Item | Value | |
|---|---|---|
| KMO measure of sampling adequacy | 0.85 | |
| Bartlett’s test of sphericity | Approx. chi-square | 6303.605 |
| df | 703 | |
| Sig. | 0.000 | |
Table 4.
Pearson correlation coefficients.
| JR | SN | TMS | T | TS | TA | CS | PR | GA | PU | PEOU | UI | |
|---|---|---|---|---|---|---|---|---|---|---|---|---|
| JR | 0.874 | |||||||||||
| SN | 0.257 | 0.954 | ||||||||||
| TMS | 0.309 | 0.184 | 0.899 | |||||||||
| T | 0.275 | 0.810 | 0.213 | 0.820 | ||||||||
| TS | 0.450 | 0.373 | 0.232 | 0.261 | 0.937 | |||||||
| TA | 0.225 | 0.098 | 0.120 | 0.116 | 0.083 | 0.839 | ||||||
| CS | 0.369 | 0.393 | −0.005 | 0.39 | 0.385 | 0.219 | 0.772 | |||||
| PR | 0.149 | 0.066 | −0.036 | 0.112 | 0.266 | 0.437 | 0.219 | 0.862 | ||||
| GA | 0.441 | 0.364 | 0.248 | 0.333 | 0.337 | 0.209 | 0.327 | 0.217 | 0.848 | |||
| PU | 0.489 | 0.280 | 0.275 | 0.340 | 0.321 | 0.172 | 0.292 | 0.161 | 0.695 | 0.785 | ||
| PEOU | 0.334 | 0.325 | 0.195 | 0.362 | 0.372 | 0.111 | 0.285 | 0.157 | 0.617 | 0.569 | 0.793 | |
| UI | 0.335 | 0.295 | 0.172 | 0.291 | 0.322 | 0.062 | 0.370 | −0.021 | 0.506 | 0.566 | 0.660 | 0.851 |
Note: JR = job relevance; SN = subjective norm; TMS = top management support; T = training; TS = technical support; TA = technology anxiety; CS = cost savings; PR = privacy risk; GA = government action; PU = perceived usefulness; PEOU = perceived ease of use; UI = use intention.
Table 5.
Goodness of fit of ISSTAM.
| Model Fitness | GFI | CFI | TLI | IFI | RMSEA | |
|---|---|---|---|---|---|---|
| Criteria | <3 | >0.80 | >0.90 | >0.90 | >0.90 | <0.08 |
| Fitness | 1.698 | 0.810 | 0.928 | 0.918 | 0.929 | 0.056 |
Note: = 1045.986; df = 616.
Table 6.
Tests of hypotheses.
| Hypothesis | Path | Path Coefficients | p | Result |
|---|---|---|---|---|
| H1 | PU ← JR | 0.191 | 0.004 | Accepted |
| H2 | PU ← SN | 0.035 | 0.544 | Not accepted |
| H3 | PU ← TMS | 0.056 | 0.340 | Not accepted |
| H4a | PU ← GA | 0.468 | *** | Accepted |
| H4b | PEOU ← GA | 0.518 | *** | Accepted |
| H5 | PEOU ← T | 0.168 | 0.010 | Accepted |
| H6 | PEOU ← TS | 0.146 | 0.024 | Accepted |
| H7 | PEOU ← TA | −0.029 | 0.634 | Not accepted |
| H8 | UI ← CS | 0.195 | 0.004 | Accepted |
| H9 | UI ← PR | −0.181 | 0.006 | Accepted |
| H10 | PU ← PEOU | 0.194 | 0.014 | Accepted |
| H11 | UI ← PEOU | 0.484 | *** | Accepted |
| H12 | UI ← PU | 0.263 | 0.003 | Accepted |
Note: *** represents p < 0.001. PU = perceived usefulness; PEOU = perceived ease of use; UI = use intention; JR = job relevance; SN = subjective norm; TMS = top management support; GA = government action; T = training; TS = technical support; TA = technology anxiety; CS = cost savings; PR = privacy risk.
Publisher’s Note: MDPI stays neutral with regard to jurisdictional claims in published maps and institutional affiliations. |
© 2022 by the authors. Licensee MDPI, Basel, Switzerland. This article is an open access article distributed under the terms and conditions of the Creative Commons Attribution (CC BY) license (https://creativecommons.org/licenses/by/4.0/).
Share and Cite
MDPI and ACS Style
Lu, Y.; Deng, Y. What Drives Construction Practitioners’ Acceptance of Intelligent Surveillance Systems? An Extended Technology Acceptance Model. Buildings 2022, 12, 104. https://0-doi-org.brum.beds.ac.uk/10.3390/buildings12020104
AMA Style
Lu Y, Deng Y. What Drives Construction Practitioners’ Acceptance of Intelligent Surveillance Systems? An Extended Technology Acceptance Model. Buildings. 2022; 12(2):104. https://0-doi-org.brum.beds.ac.uk/10.3390/buildings12020104
Chicago/Turabian StyleLu, Ying, and Yunxuan Deng. 2022. "What Drives Construction Practitioners’ Acceptance of Intelligent Surveillance Systems? An Extended Technology Acceptance Model" Buildings 12, no. 2: 104. https://0-doi-org.brum.beds.ac.uk/10.3390/buildings12020104
Note that from the first issue of 2016, this journal uses article numbers instead of page numbers. See further details here.