
Zero-Carbon Communities: Research Hotspots, Evolution, and Prospects


1
School of Architecture, South China University of Technology, Wushan Road, 381, Guangzhou 510898, China
2
Faculty of Engineering, Erasmus Mundus Joint Master SMACCs, University of Mons, Rue d’ Havre, 88, 7000 Mons, Belgium
3
Faculty of Architecture and Urban Planning, University of Mons, Rue d’ Havre, 88, 7000 Mons, Belgium
*
Author to whom correspondence should be addressed.
Buildings 2022, 12(5), 674; https://0-doi-org.brum.beds.ac.uk/10.3390/buildings12050674
Submission received: 23 April 2022
/
Revised: 15 May 2022
/
Accepted: 17 May 2022
/
Published: 18 May 2022
(This article belongs to the Special Issue ZEMCH—Zero Energy Mass Custom Home International Research 2021)
Abstract
:Global warming is a worldwide concern, with buildings generating more than 40% of the annual global CO2 emissions. A commonly accepted system of global standards for zero-carbon buildings and communities has not yet been established. In this research, the development history, hotspots, and trends at the urban scale with theoretical and data support are summarized based on the Web of Science (WoS) Core Collection. The review contains works from 1997 to 2022. A total of 19,014 papers were collected, with an overall increasing trend in the number of articles with specific keywords. The scope of the research is broad, covering the environment, sciences, ecology, chemistry, material science, physics, meteorology, atmospheric sciences, and so on. The hotspots in the low-carbon community (LCC) and zero-carbon community (ZCC) involve a wide range of disciplines, and collaborative research between related disciplines should be strengthened to propose practical solutions for the development of zero-carbon cities. The establishment of the ZCC mainly focuses on a zero-carbon-emission construction and zero-carbon operations. This research found approaches such as the choices of building construction and material, a waste recycling system, a regenerating energy system, transportation, and an examination of the community composition to realize the ZCC. In the literature it is presented that the difficulties in the construction of the ZCC are due to the lack of research in practice, operation, and subsequent maintenance. Moreover, other scholars can deepen the research on the hotspots of ZCC.
1. Introduction
Zero-carbon communities (ZCCs) have been established to respond to the challenges of climate change by proposing to reach a level of zero-carbon emissions in communities through technology and system design [1,2]. The world reached a consensus under the Paris Agreement in 2015 to limit the temperature rise to 1.5 °C above preindustrial levels [3] with global engagement to promote ZCC construction activities and develop a green economy [4]. Of the total carbon emissions, building operations are responsible for 28% annually, while the production and construction of materials are responsible for an additional 11% [5].
More than 120 countries worldwide had set carbon neutrality targets by 2020 and are actively addressing this issue [6]. In fact, cities consume more than 70% of the world’s energy, and over 60% of greenhouse gas emissions (GHG) come from cities [7]. As a topic of rising interest in urban planning and environmental science, the relationship between climate change and carbon emissions, the connotation of low-carbon cities, spatial structures, development strategies, specific practices, etc., have been discussed as they relate to low-carbon cities [8,9]. As systems that affect carbon levels are the main components of cities, communities still need further research on the development of ZCCs under the guidance of the low-carbon city theory [10]. For this state, the application of low-carbon technology in ZCCs should be identified. The establishment of the ecological system, the formulation of low-carbon policies, and community management systems are all needed to develop the process from the community level to the city level [11]. Furthermore, these policies are expected to realize the development of an LCC into a zero-carbon city.
Horizon Europe will invest approximately €350 million in research and innovation actions linked to its mission (e.g., mobility, energy, urban planning) in the period of 2021–2023 [12]. In 2010, the U.K. launched the Low Carbon Communities Challenge (LCCC), an experimental project for LCCs [13] aiming at the operability and adaptability of established energy and carbon reduction policies. Moreover, specific methods of low-carbon technologies and low-carbon tools provide technical and empirical support for subsequent policy formulation and low-carbon development. Countries worldwide have built several successful LCCs as an essential means to address climate change, which have essential guidance and practical significance for the development of ZCCs [14,15].
Currently, the COVID-19 pandemic has reduced the scope and frequency of human activities, effectively reducing energy consumption and GHG [16]. However, many countries have proposed a roadmap for the post-pandemic energy transition [17]. The green building evaluation system is an essential part of ZCCs [18]. Many countries have already established green building evaluation systems, such as the US Green Building Evaluation System (LEED), the BREEAM, the Japanese CASBEE, and the French Green Building Evaluation System (HQE) [19,20,21].
The Paris Agreement, a global climate change agreement signed by 178 parties worldwide in 2015, is a unified arrangement for global action to address climate change starting in 2020 [22]. In December 2019, the European Commission released the European Green Deal to make Europe the world’s first carbon-neutral continent by 2050 by transitioning to clean energy and a circular economy to organize global climate change and promote stable and sustainable economic development in Europe [23,24]. Moreover, China released the National Plan to Climate Change (2014–2020) and the U.K. published the Climate Change Act. The details of these documents are shown in Table 1 [25,26,27,28].
In the research of LCCs, we explored the theory and practice of the built LCC shown in Table 2 [29,30]. The Hammarby Community is an important project that was completed for the evaluation of the ZCC. It is based on the circular economy and its design includes recycling waste, using high technology building materials, the purification of land and water sources, recycling from sewage systems, creating green transportation systems, and energy management [31]. Four forms of construction have been explored: a community based on geographical space, a community based on occupational space, a community based on living space, and a community based on virtual space of opportunity [32]. The construction of the LCC system includes four aspects: skillful, organizational, institutional, and cultural, and the construction of LCCs and ZCCs needs to propose corresponding countermeasures in the social, economic, and cultural context [33].
LCCs and ZCCs are important initiatives to mitigate the climate change crisis [34]. This research examines the changes in the theoretical development of LCCs and ZCCs in the mainstream. The concept and practice, as well as the future development direction, are mainly in 3 aspects. The first aspect is the review of the global evolution of LCCs and ZCCs. The second aspect is the future research trends from the research on the hotspots of LCCs. Moreover, the third aspect is the burst keyword and digital image analysis on the transformation of LCCs and the realization of ZCC research.
The current planning strategies for low-carbon cities are (1) using “mitigation” and “adaptation” as the main strategies to address climate change and (2) making the construction of low-carbon cities a core strategy for the future development of cities.
Until now, there have been evaluation systems for green buildings, but since the concept of the ZCC was created, no standard ZCC evaluation system has been found to be the solution for achieving peak carbon emissions and carbon neutrality, which was mentioned in the Paris Agreement in 2016. For ZCCs, there is a gap in a completed evaluation system, and many details of the regulation and definition need complementation. Therefore, by analyzing the trend of LCCs, the essential elements and the keywords for ZCCs are identified, while CiteSpace analyzes the trends, phases, and other areas of ZCCs. This research proposed future optimization for ZCCs, directions for further expansion, ideas for analytical and holistic frameworks, and the basis and clues for ZCC research, which will guide planning and design practice. Based on this research, we can determine the hotspots of ZCCs and the subjects and keywords with potential for research and development.
The paper is structured accordingly: the first part introduces the data source and the research methodology. The second part analyzes relevant policies and completed ZCC cases. Then, a review of LCCs and ZCCs based on the number of papers published, research journals, the distribution of publishing regional cooperation, publishing author cooperation, and the research institution cooperation is presented. After that, analysis of the most influential categories in the research field listing the highly cited articles and cited references is made. To obtain the research hotspots and strategies, a keyword analysis is performed, and finally, the results of the hotspots, evolution, and prospects in the field are discussed.
2. Data Sources and Research Methods
2.1. Data Sources
In this research, the first step is to build a unified database for analysis by selecting reference journal articles that are a reliable source of knowledge. WoS Core Collection is an internationally recognized authoritative database. Moreover, the database has the most representative frontier, and thorough knowledge and concepts for international research [35]. The search was limited by creating a search string to make this research more scientific [36].
The second step was to use appropriate keywords to select articles from journals for paper selection. The research topic is zero net carbon emissions in a highly energy-efficient community that produces on-site or procures enough carbon-free renewable energy to meet the energy consumption for the community’s operations annually [37]. Therefore, we chose LCC and ZCC as the keywords to search in the WoS Core Collection. This research selected “topic” as the search type to retrieve the title, abstract, author, and keywords from the WoS Core Collection. The U.K. academic circles first proposed a “low-carbon economy” in 2003, when countries started to raise concerns about carbon emissions. They started performing research on low-carbon buildings and low-carbon cities, so the start period of the data collection is set to 1997 [38].
2.2. Research Methods
CiteSpace is a knowledge mapping software for visualizing information analysis based on the Java platform, presenting the structure, laws, and distribution of scientific knowledge through visual analysis [39]. The obtained visual graphs are also called “knowledge graphs” or “bibliometric graphs”. Keyword co-occurrence analysis is an effective tool for analyzing the keywords provided by the authors in the dataset [40]. Using CiteSpace 5.8R3, 20,813 articles that contain 19,276 articles, 544 proceedings papers, and 994 reviews were obtained, and 2 duplicates and 1799 discarded articles were processed, resulting in 19,014 valid articles. The process removed 2 duplicates and 1799 articles that were incomplete or did not meet the software computing standards [41]. Visualization was performed by analyzing the keywords, topics, authors, and institutions of 19,014 valid publications related to the LCC and ZCC. The progress of research on the ZCC was discussed by analyzing the scientific map.
In this research, the relationship graphs of different domains obtained through CiteSpace span the period from 1997 to 2022, since the first paper talking about LCC was published in 1997 [42,43]. Through CiteSpace analysis, LCCs and ZCCs began in 1997, and it is an essential topic to research before climate change becomes severe. In addition, in 1997, many keywords with high citation frequency appeared and have been influencing the research until now. The time slice was set to the civil year, and the rest were the default settings. The subject information, such as keywords, topics, authors, and institutions, were extracted and analyzed. The potential relationships between the subject information can be visualized through the knowledge base map. The software can also show the development trend of ZCCs and LCCs from 1997 to 2021 by calculating relevant information and revealing the field’s development status.
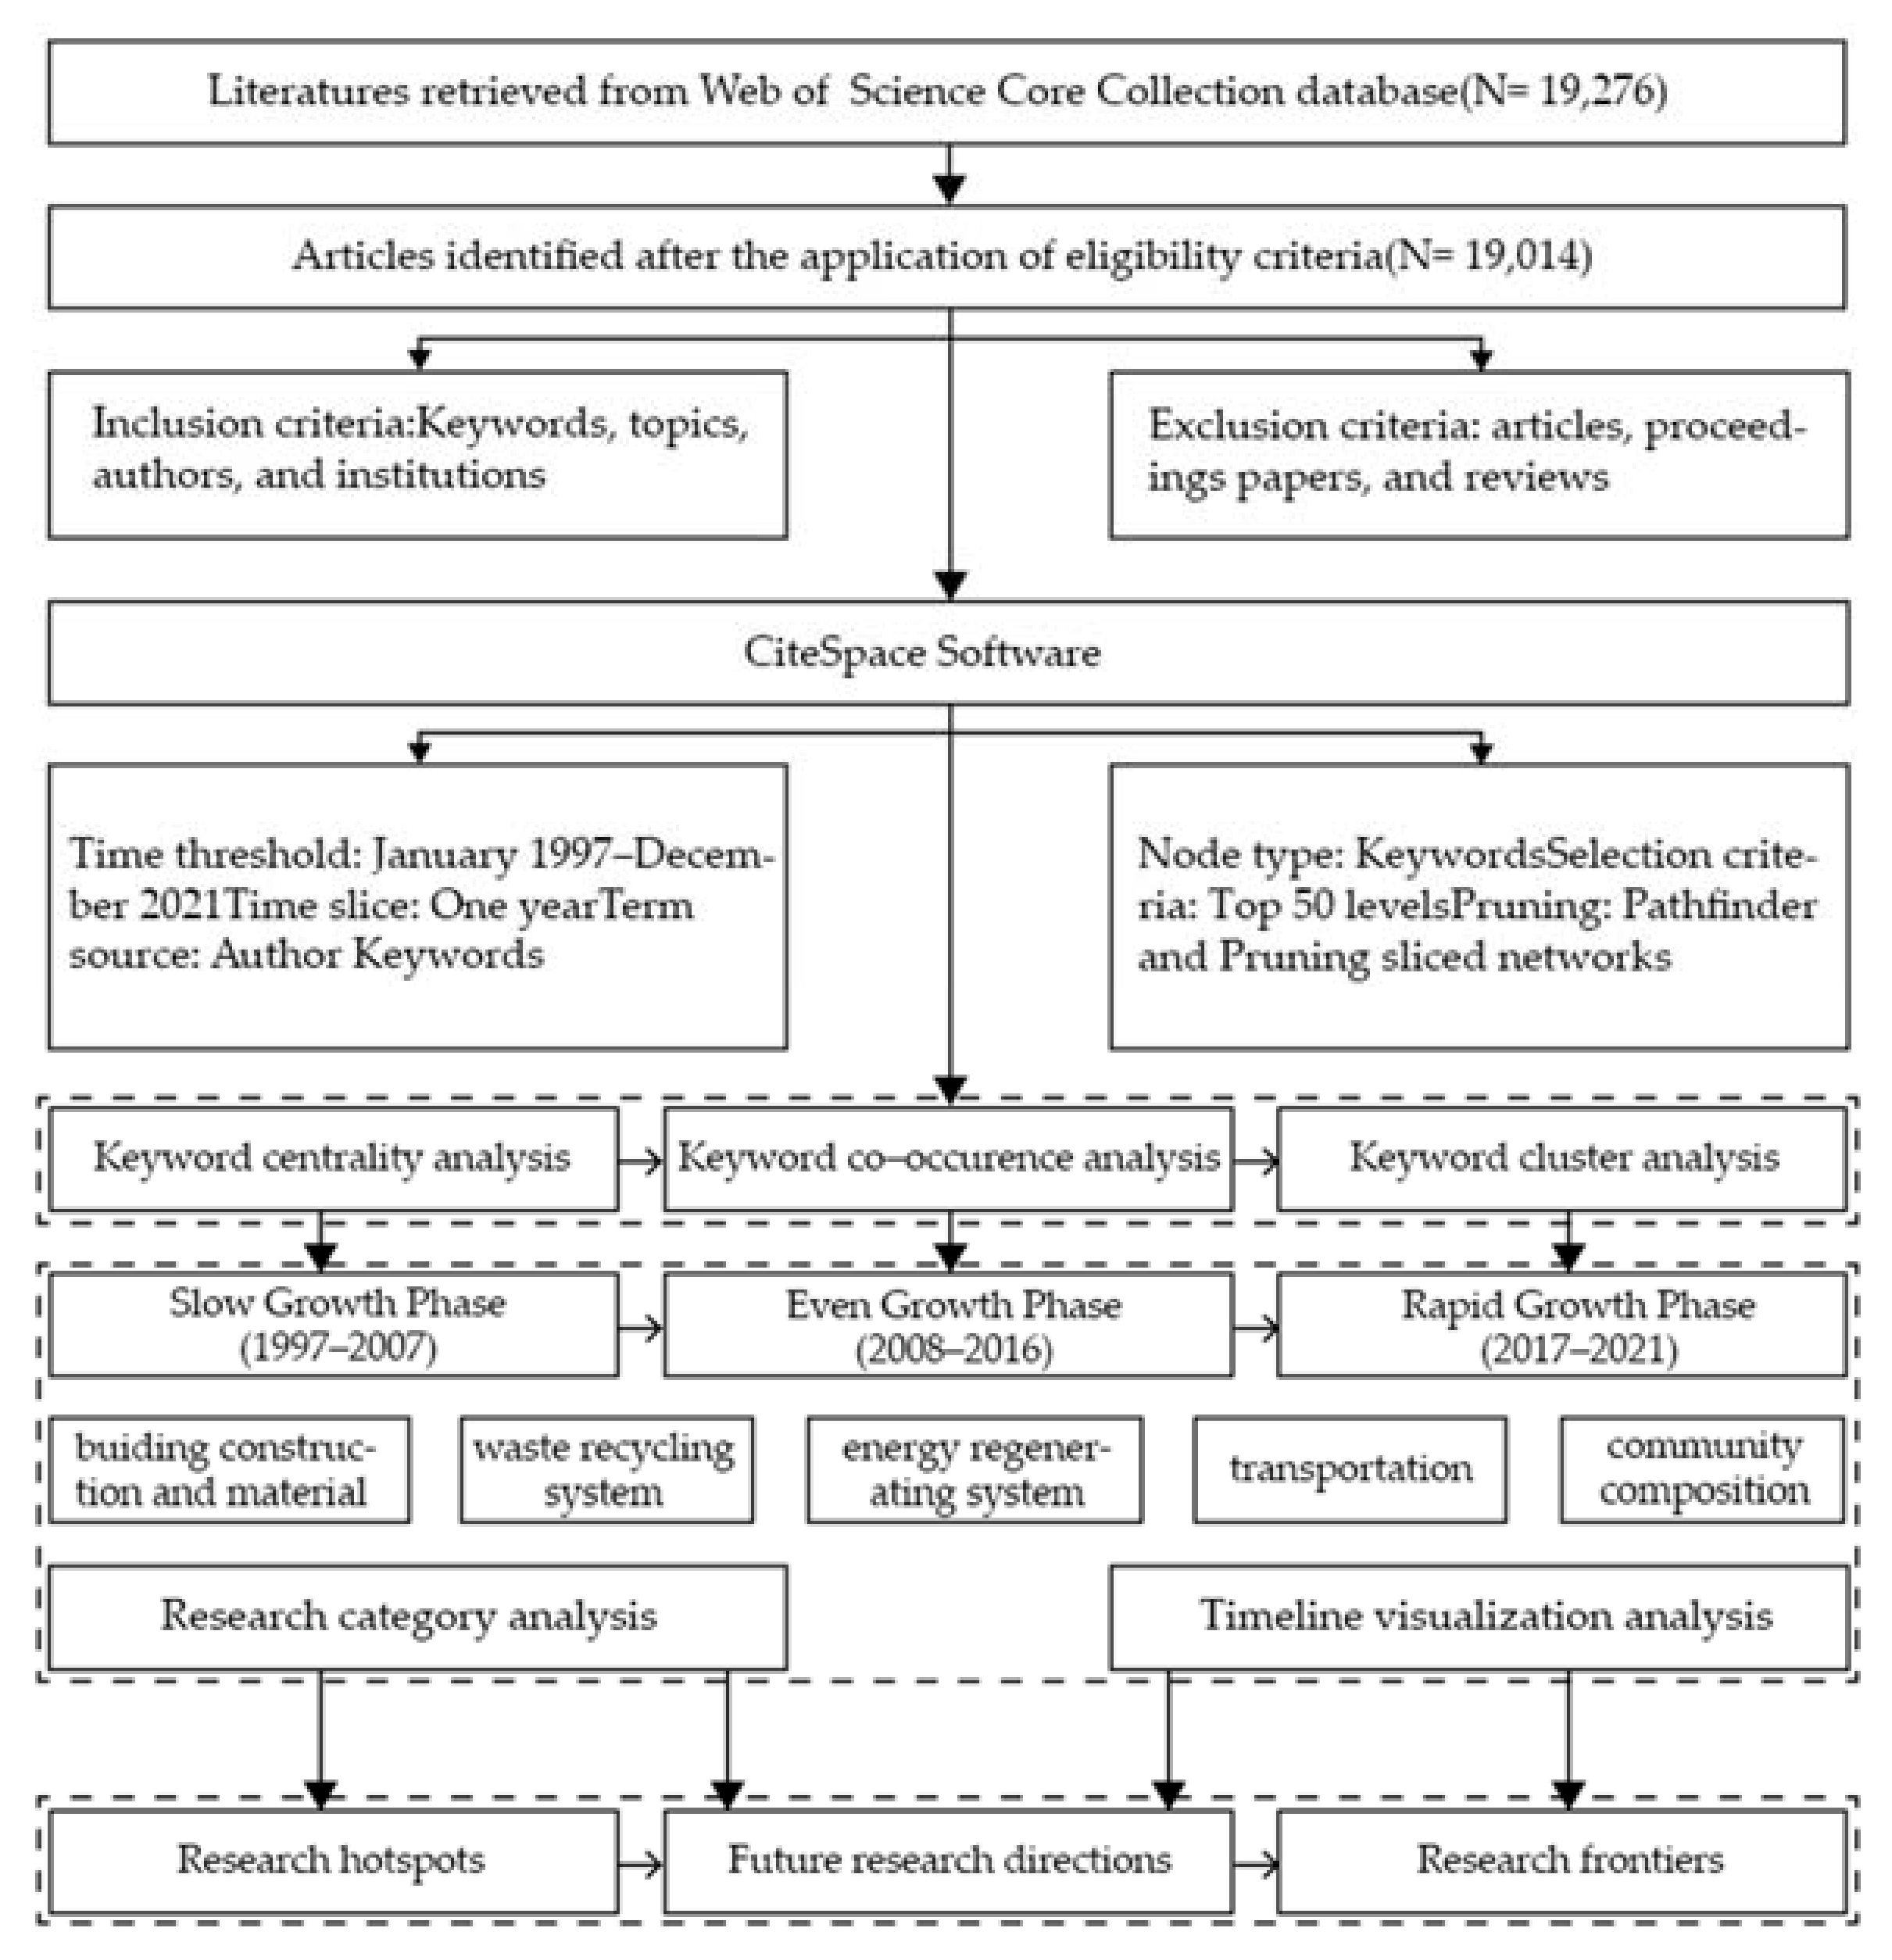
The core method of ZCCs is to build a community system with zero energy consumption [44]. The search was conducted for the topics “zero-carbon community” and “low-carbon community”, for any period where operation date was 22 March 2022. The keywords in the WoS Core Collection are selected as a raw source of the type of Article, Proceeding Paper, and Review. The records were exported as complete records of plain text file content and cited references. Then, CiteSpace 5.8R3 software was imported for calculation, analysis, and further procedures, and the ZCC research design is shown in Figure 1.
3. Results
3.1. Results by Data Collection
3.1.1. Number of Publications
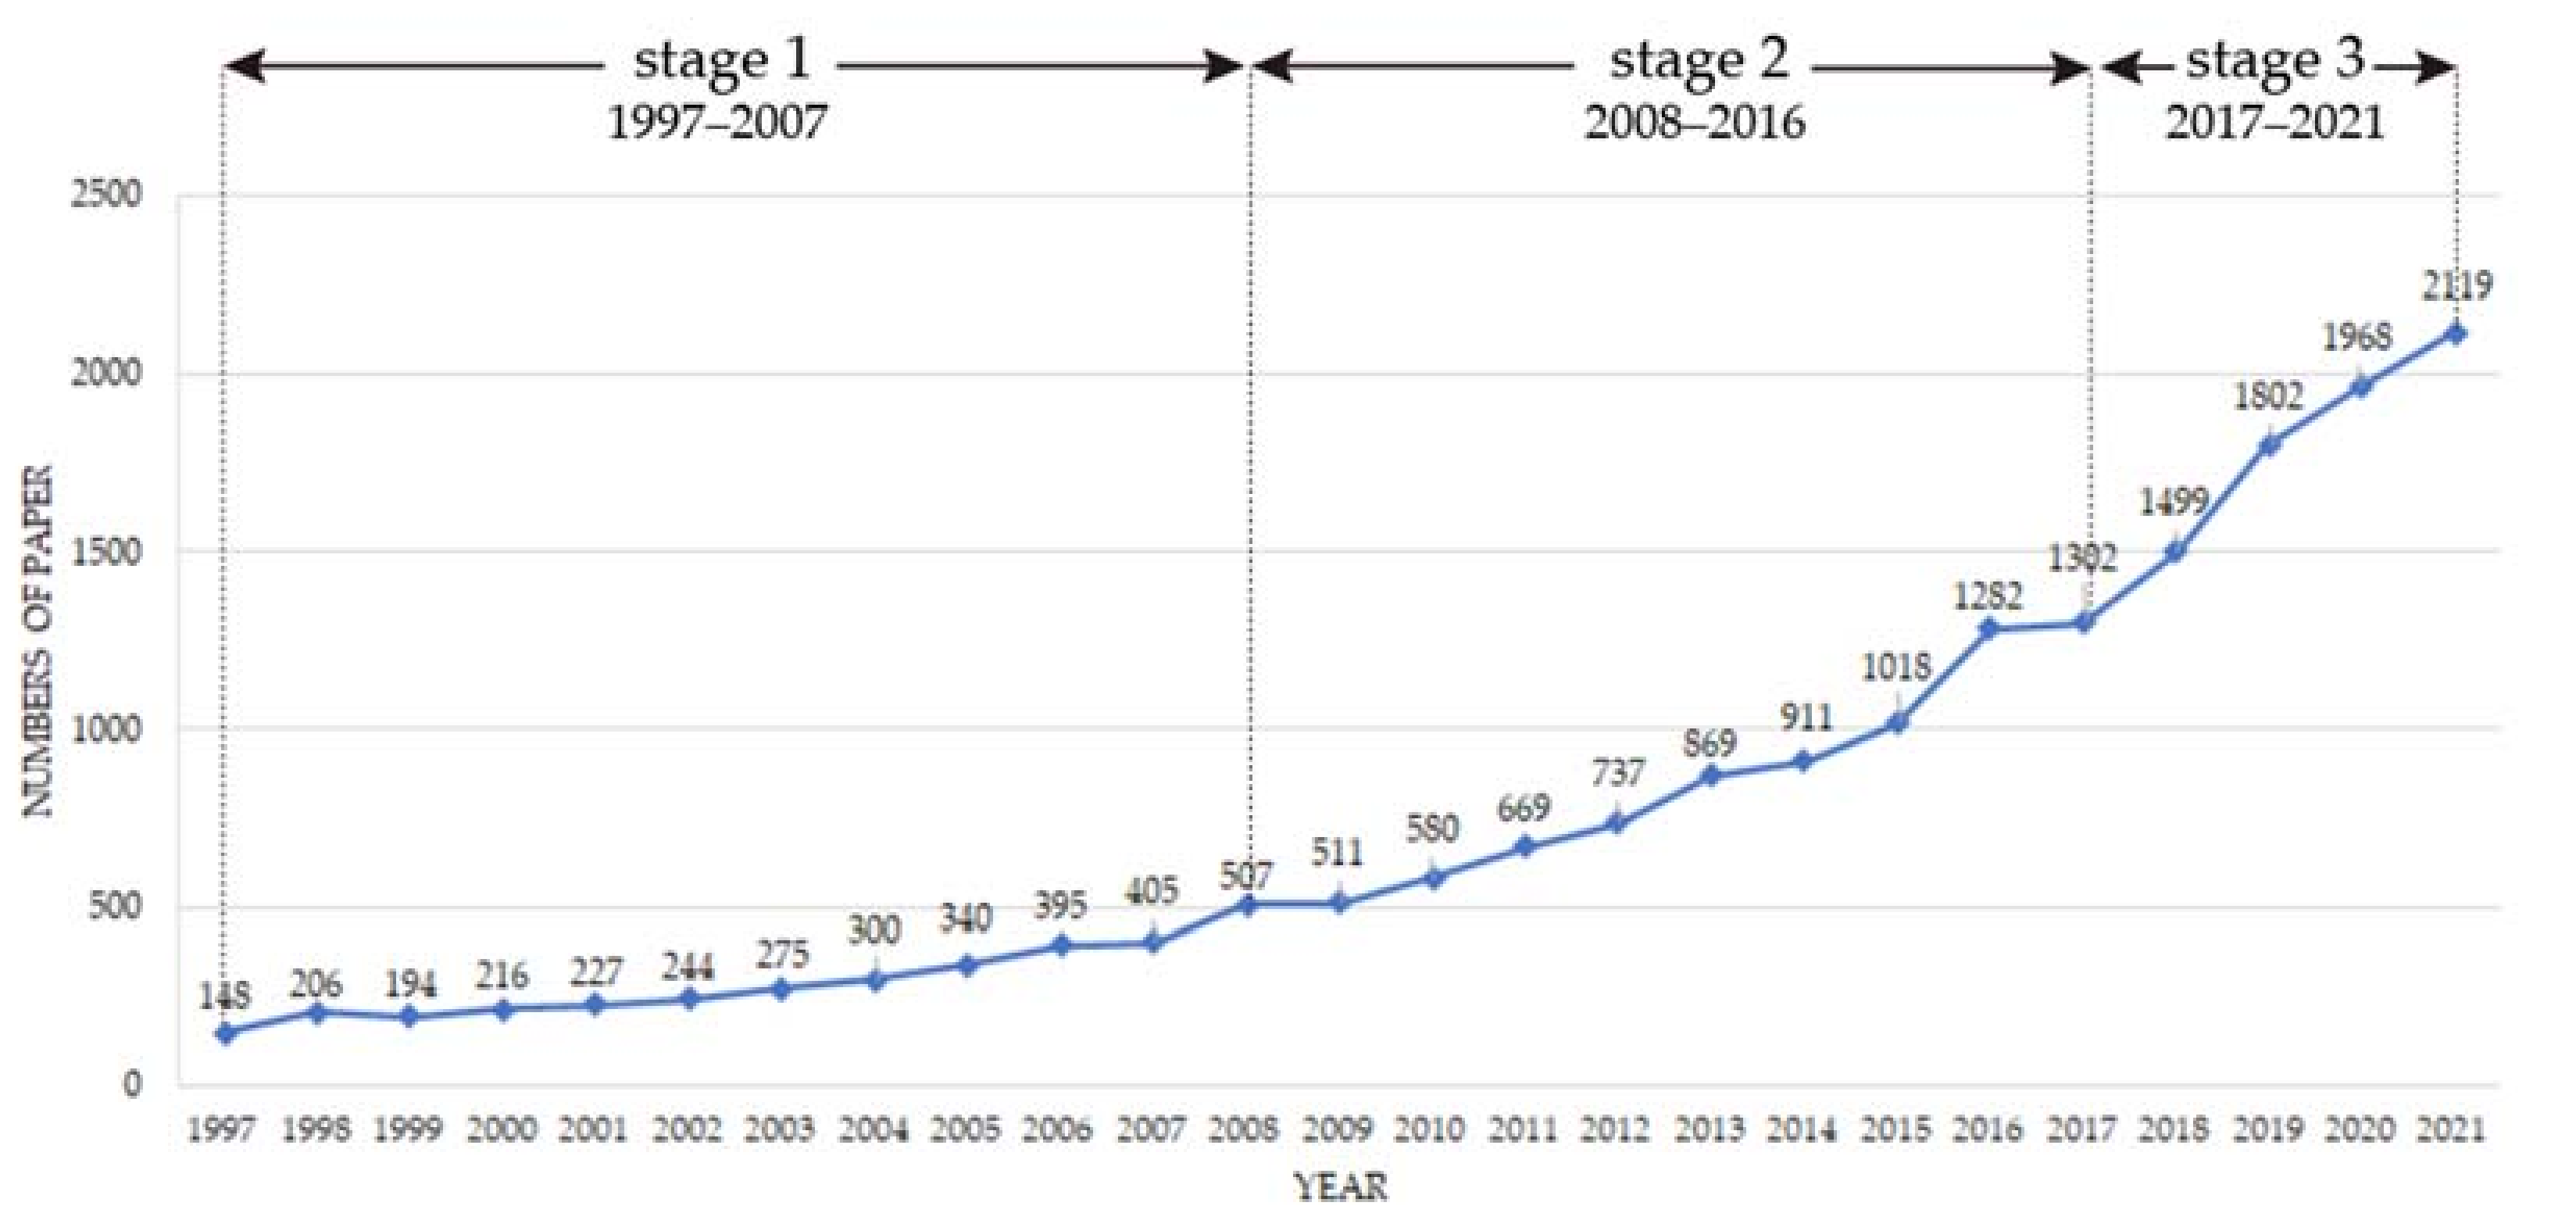
According to the WoS Core Collection data, at the time node of raw data source acquisition, the three countries with the highest number of published LCC and ZCC research papers were the United States (5751), China (4563), and Germany (2054), followed by the U.K. (1519), Australia (1306), Canada (1278), France (1276), Spain (1112), Italy (619), and the Netherlands (540). Between 1997 and 2021, the research on the zero-carbon community went through three stages: slow growth (1997–2007), even growth (2008–2016), and rapid growth (2017–2021), as shown in Figure 2.
The change in the numbers of publications is an essential indicator of the evolution in the research field. By using CiteSpace, we removed duplicate articles. A total of 20,813 articles about the ZCC field were obtained, as well as the distribution of the number of articles issued per year. The analysis found that research on ZCCs and LCCs went through three phases of slow growth, steady growth, and then rapid growth from 1997–2022.
- The period from 1997–2006 was a period of slow growth in the number of publications, as the concept of the low-carbon economy and low-carbon buildings and standard measurement methods for them were still under development.
- 2007–2016: The theoretical foundation was completed, a large amount of research literature emerged, and a period of steady growth began.
- Attention rose rapidly from 2016–2021, especially in 2016, when the world reached a landmark consensus through the Paris Agreement, with 1.282 annual publications and research entering a rapid growth phase.
With the increase of global concern on climate change issues, the field areas of ZCCs and LCCs have attracted rising scientific interest from international scholars, and higher requirements are put forward to develop the ZCC. ZCC research will rapidly develop into a mature field.
3.1.2. Major Journals Analysis
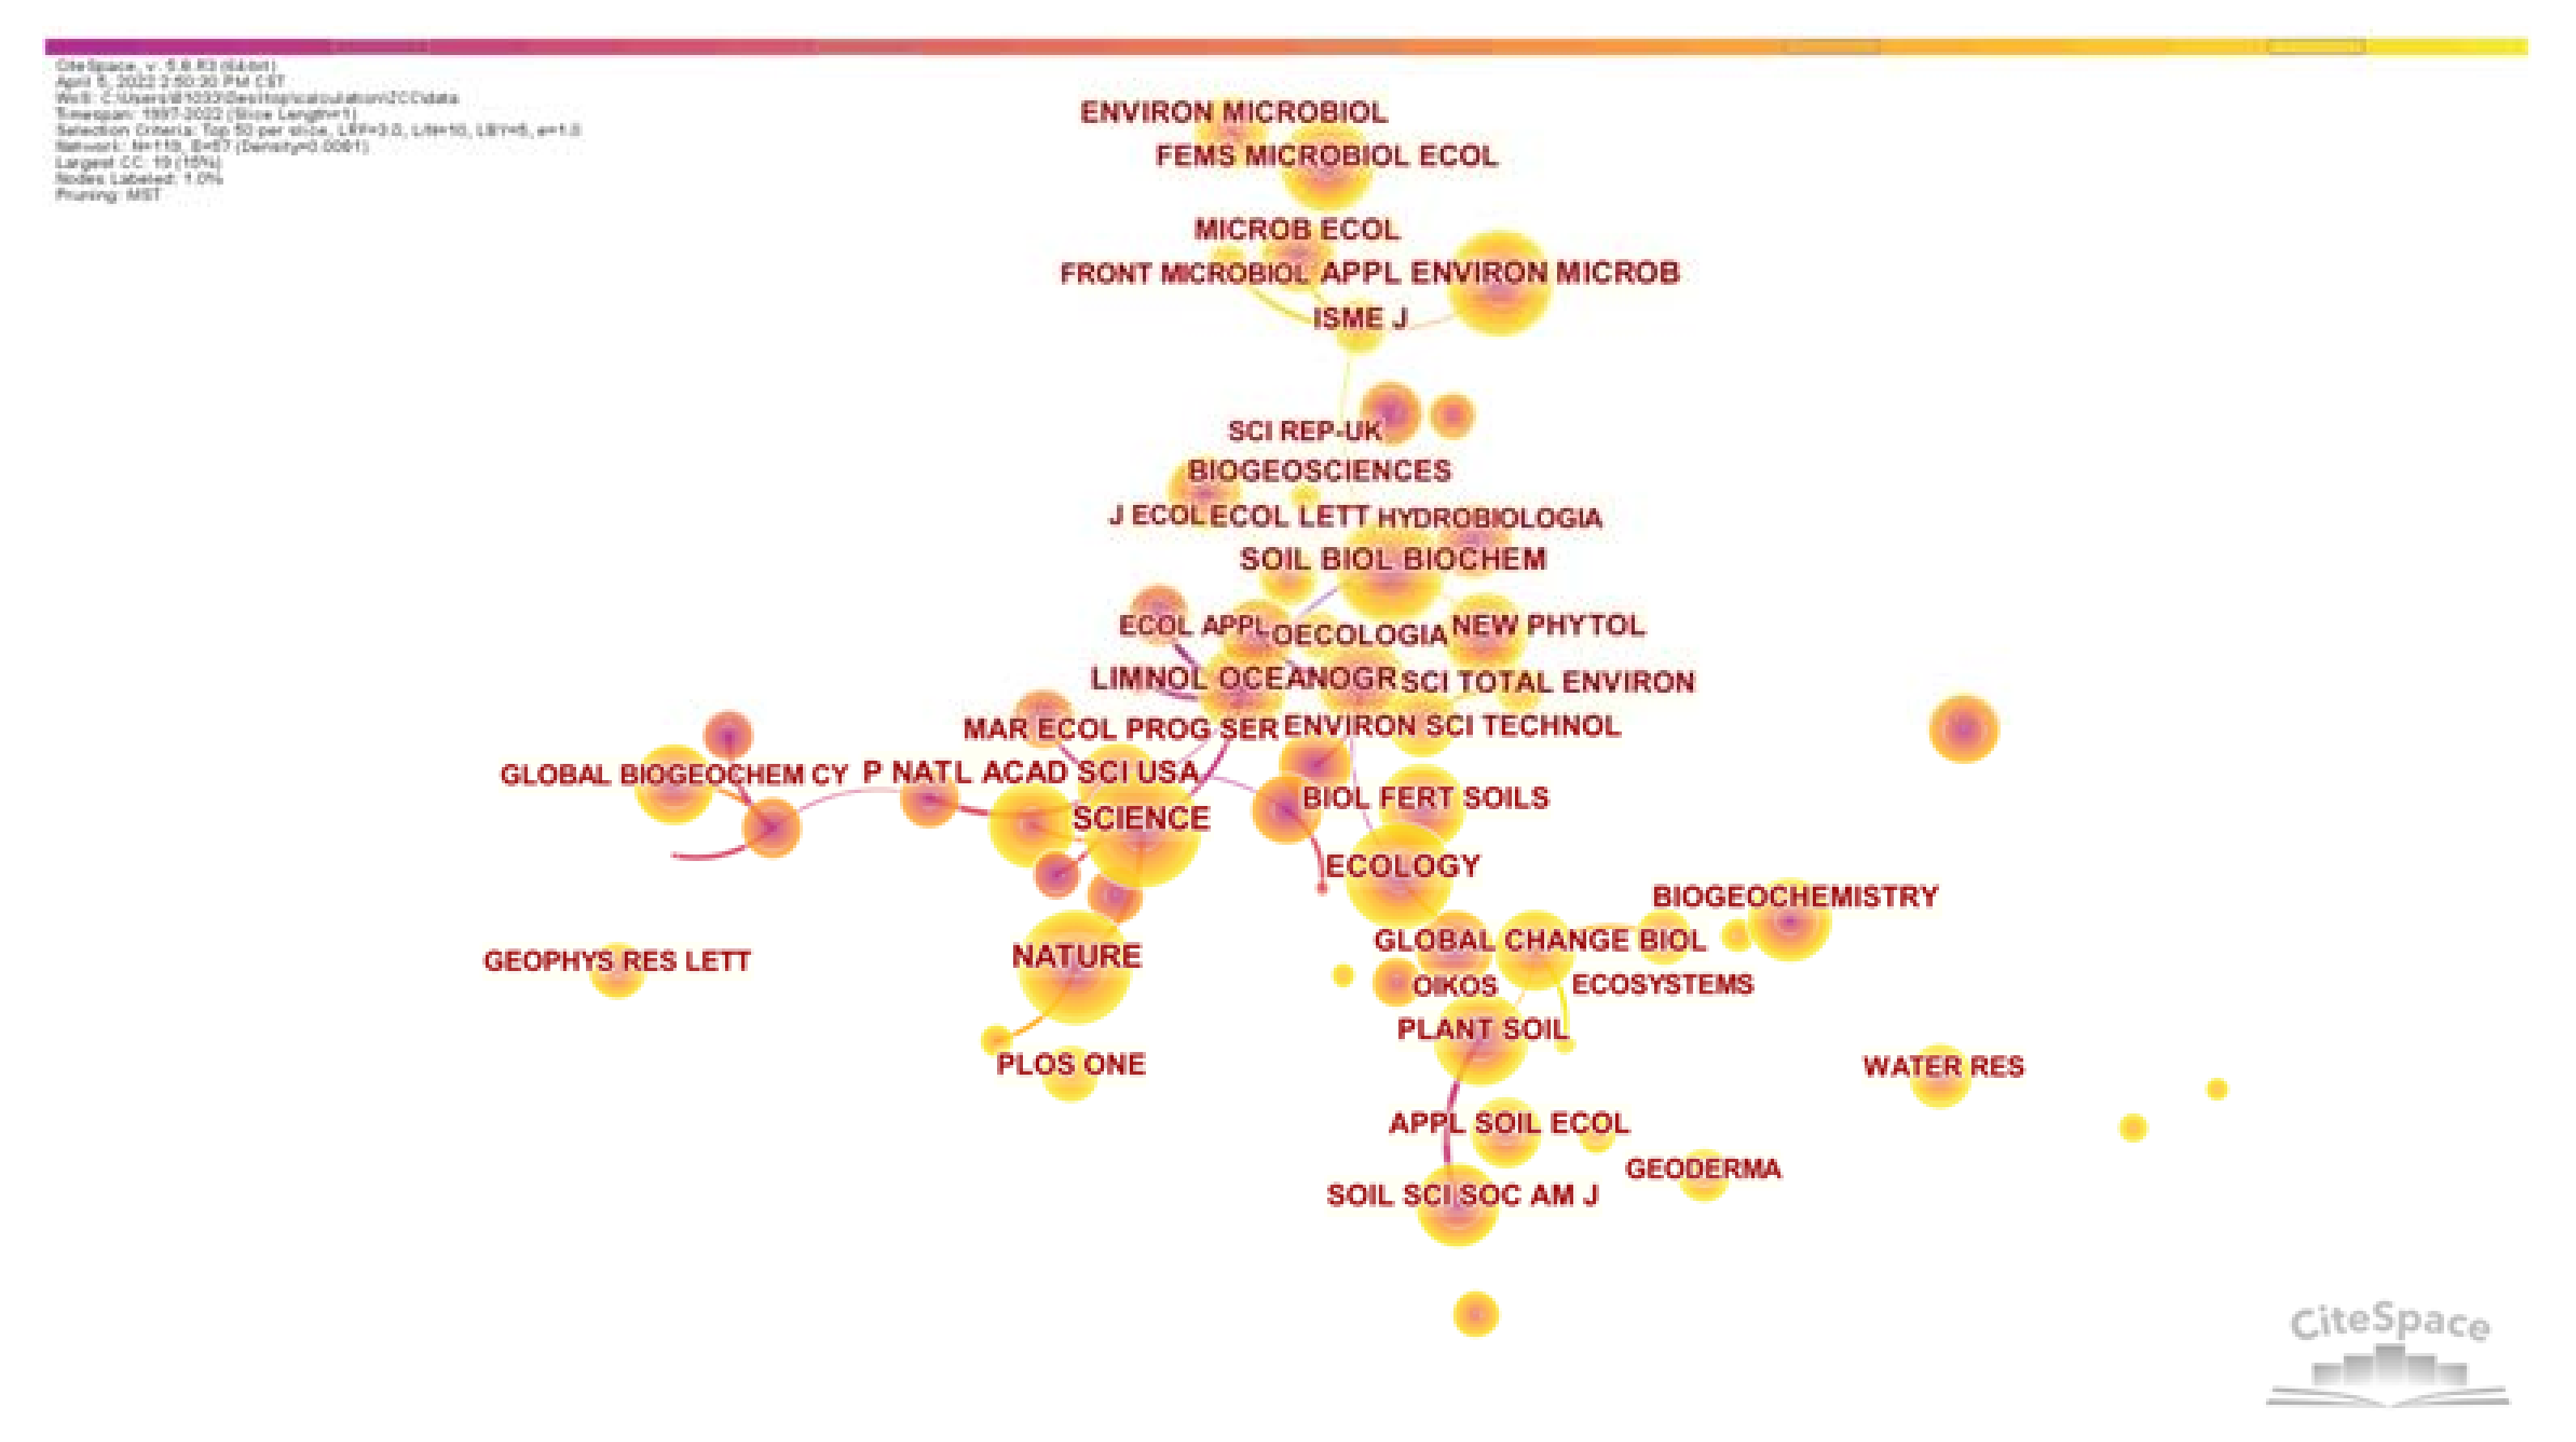
The node type was set to the cited journal, and the time slice was set to 1 year to generate a map of cocited journals [45]. In the CiteSpace analysis, the number of nodes in the distribution of journals is 1967, the connection value is 17,114, and the density is 0.0081. The top five journals cited in order of the number of applications are Nature, Science, Applied and Environmental Microbiology, Ecology, and Soil Biology & Biochemistry, all of which have more than 6000 applications. The top four most academically influential journals, according to centrality rankings, are the Journal of Cleaner Production (0.05), Science of The Total Environment (0.04), Environmental Science & Technology (0.04), and Chemical Reviews (0.04). The top ten journals mainly focus on natural sciences, environmental microbiology, ecology, biology, oceanography, and the environment. These subjects are the field’s main research directions, and more details are shown in Table 3. The results shown in Figure 3 demonstrate that the establishment of the ZCC can significantly impact global climate change and indirectly affect the fields of ecology, biology, and the ocean.
3.1.3. Major Regions Analysis
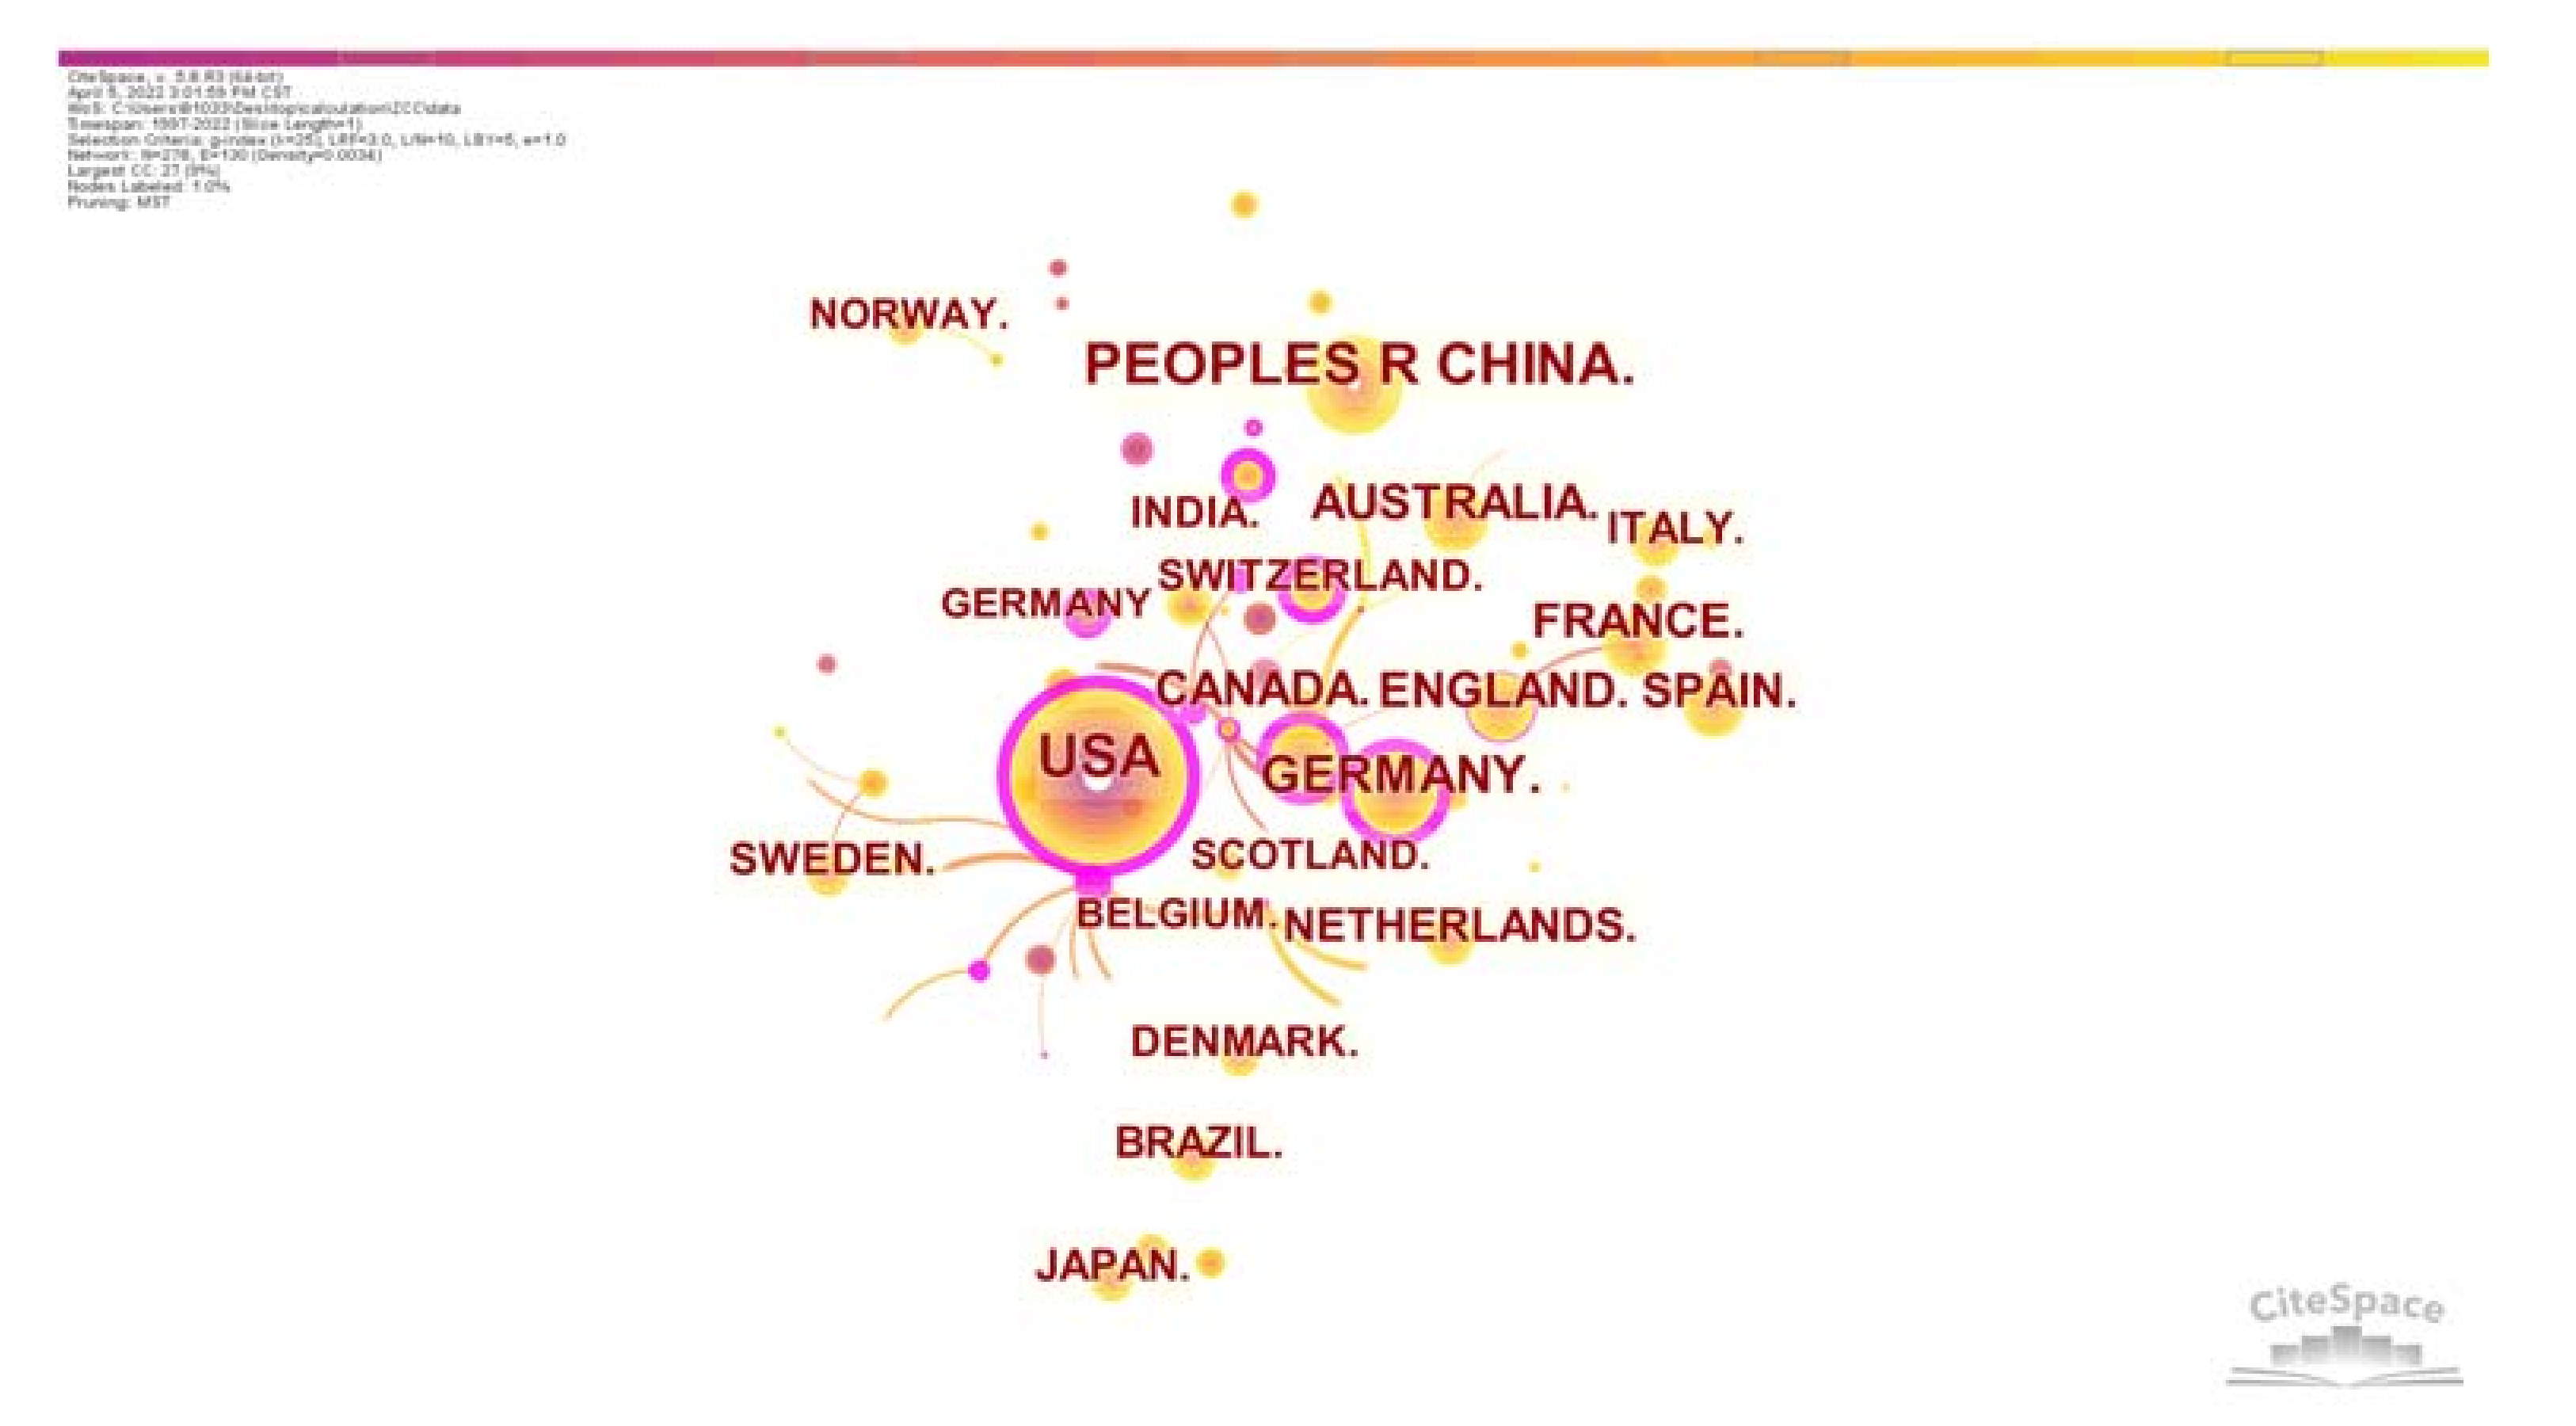
The analysis of the regional cooperation distribution of publications can reflect the publication results, the cooperation and cross-citation relationship between major countries in this research area, and the importance and influence of the country in the ZCC [46]. CiteSpace analyzes the regional cooperation distribution of postings in the ZCC domain. We found that the regional cooperation distribution of postings contains 278 nodes, 130 connections, and a density of 0.0034. The primary posting region mapping is shown in Figure 4. From 1997 to 2022, U.S. institutions published 5741 articles, Chinese institutions published 4180 articles, and German institutions published 1569 articles. As shown in Figure 4, the U.S. is the leading country that contributed to the field of ZCC, and it has the most cooperation and cross-citation with other countries with a centrality of 1.03. More details about the contributing countries are shown in Table 4. Canada has close cooperation with Germany, China, the U.K., Australia, France, Spain, Italy, and the Netherlands by close cooperation between them. The lack of cooperation between Germany, Canada, and other countries with a large number of publications suggests that there is great potential for developing international cooperation networks for the globalization of research on ZCCs as a global issue. By 2020, the countries with the most carbon emissions were China, the USA, India, Russia, Japan, Iran, and Germany [47]. Therefore, to solve the global carbon emission problem, the United States, China, and Germany have performed much research for this purpose and published many papers in the field of ZCCs.
3.1.4. Authors’ Cooperation Distribution Analysis
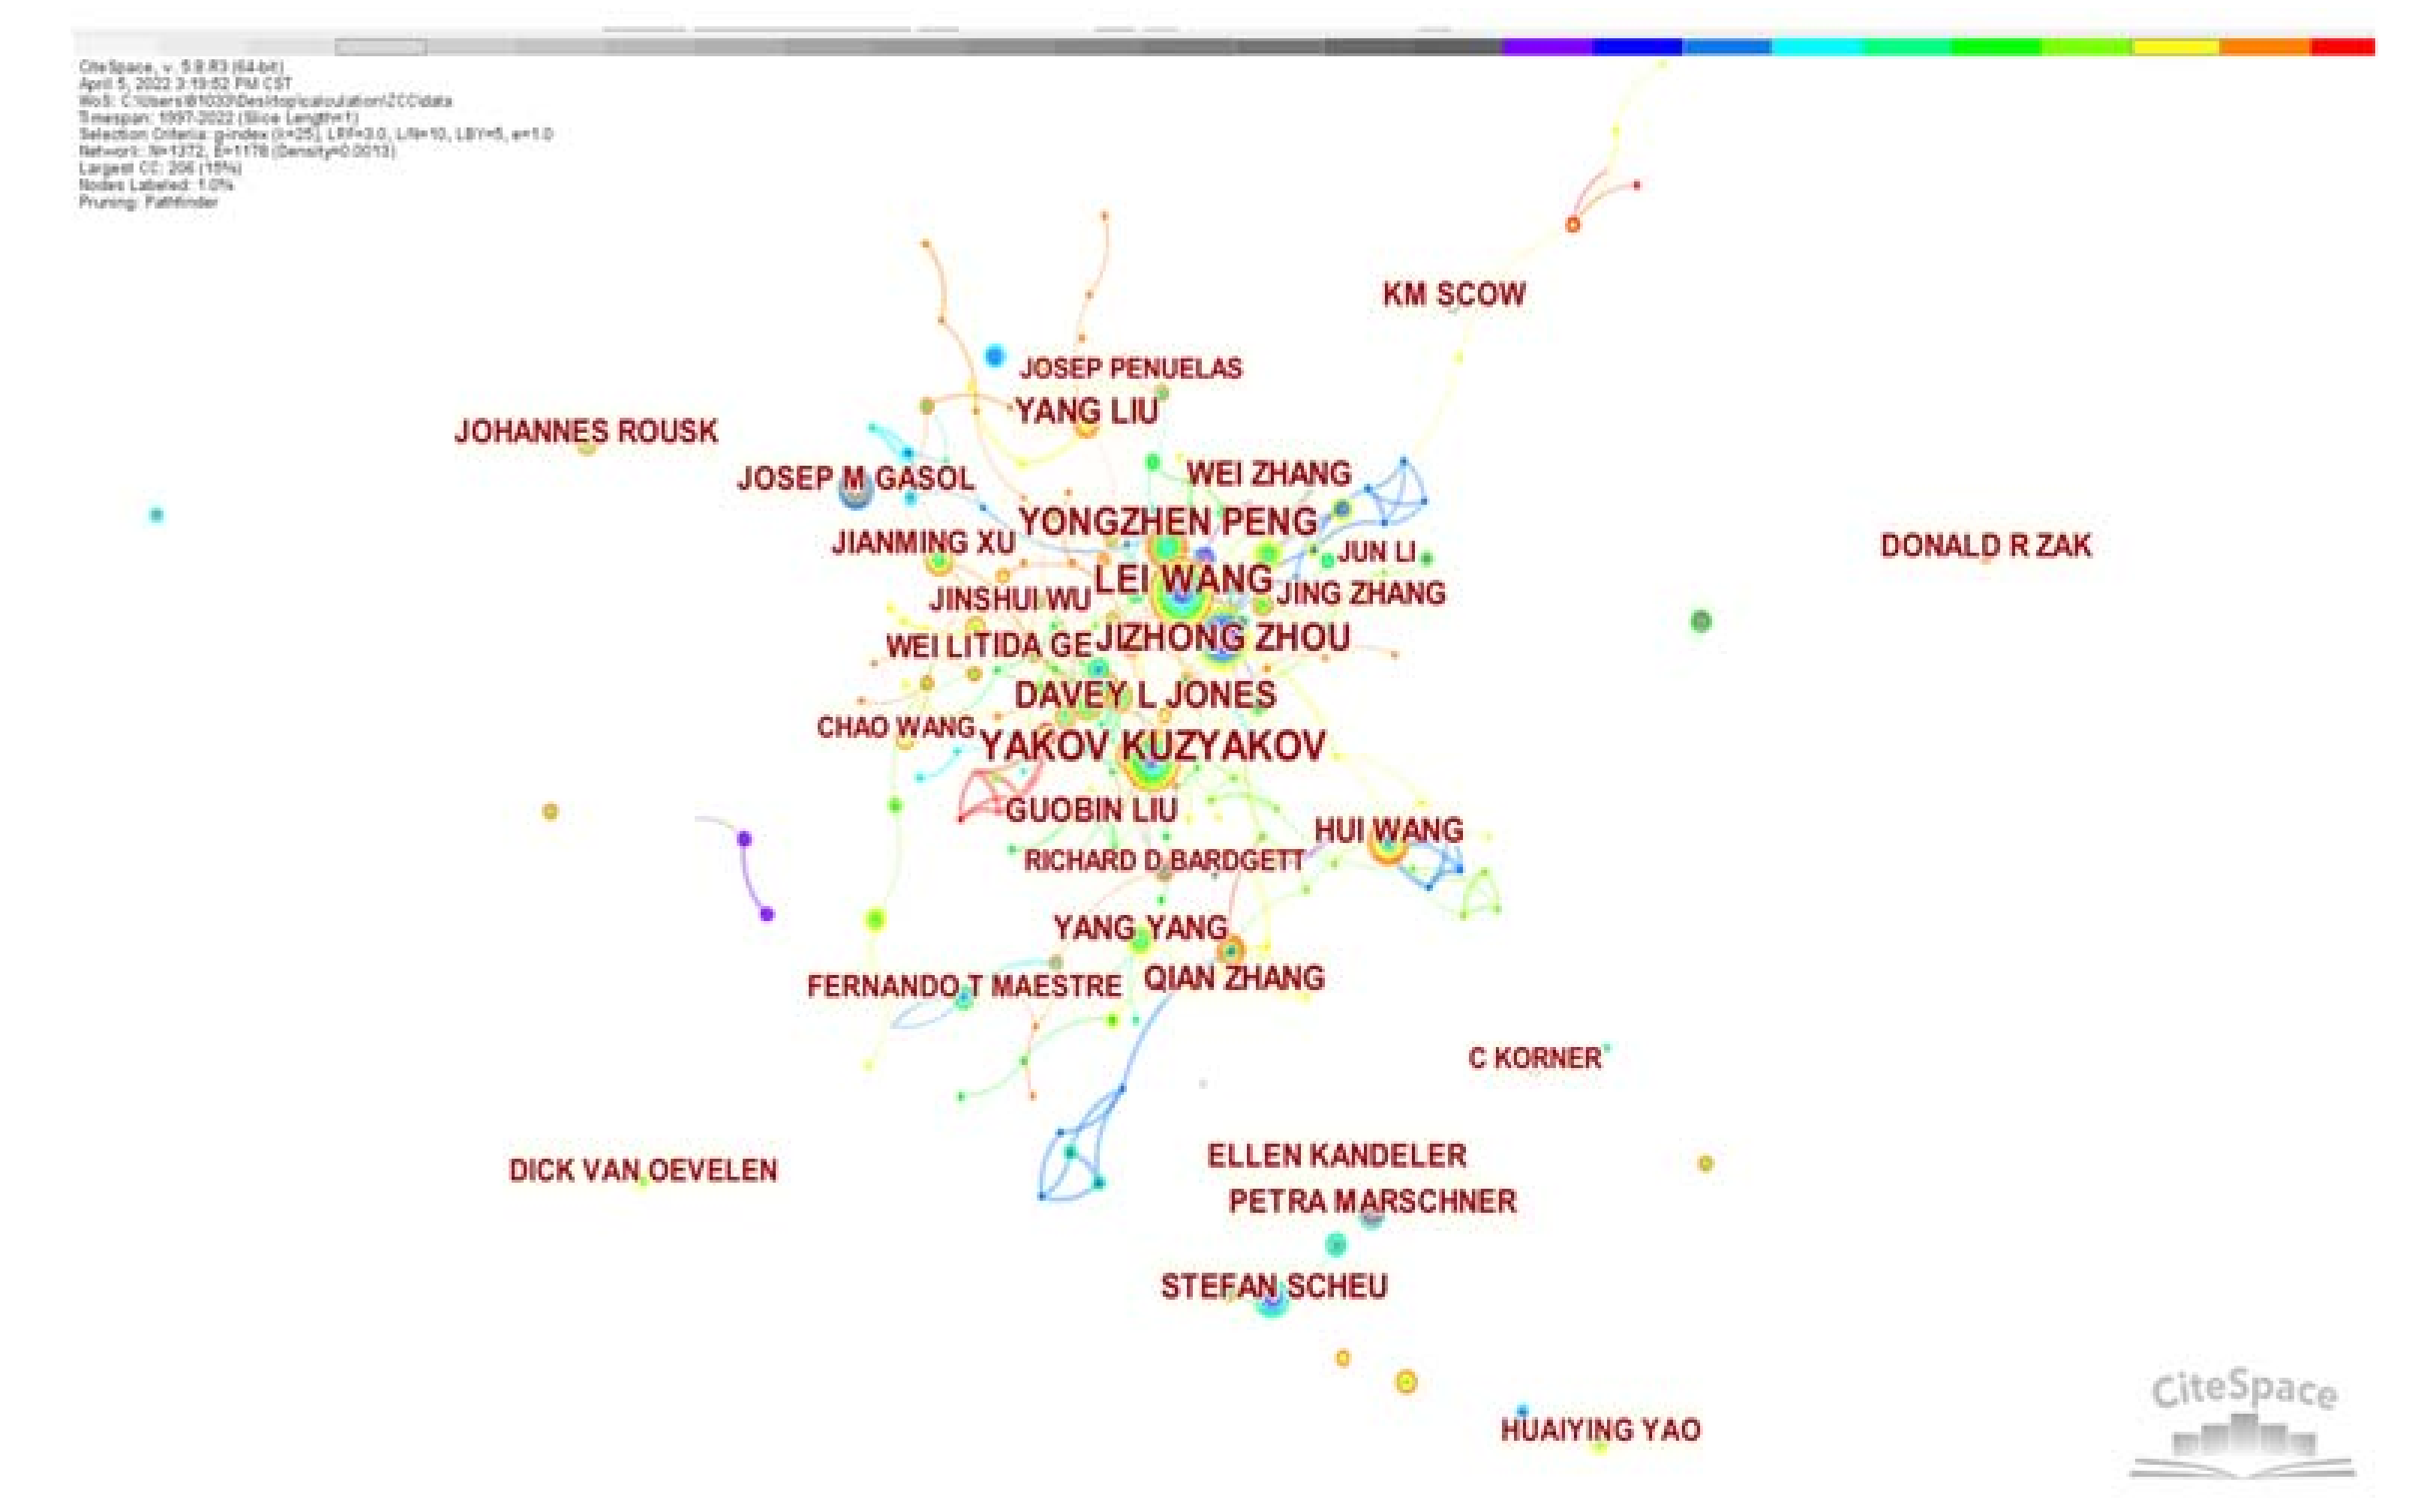
Collaborative authorship analysis identifies the core figures in the research field and the collaboration and cross-citation relationships between researchers [48]. A collaborative group of scholars can be analyzed to uncover the team effect of academic research [49]. The ZCC-related data were gathered and imported into CiteSpace. The author collaboration network graph contained 1372 nodes, 1178 connections, and a density of 0.0013, and the knowledge graphs of the primary authors and their institutions are shown in Figure 5. As seen from Table 5, the dominant authors are Yakov Kuzyakov (44), Lei Wang (34), Jizhong Zhou (33), and Yong hen Peng (30). Researchers studying ZCC are mainly from China and Germany. Two of the top 10 authors, in terms of the number of publications, are from the same research institution, Georg August University of Göttingen, indicating that the research institution has more research in the field of ZCC. Among the top 10 posting researchers, Yakov Kuzyakov from the Georg August University of Göttingen and Jizhong Zhou from the University of Oklahoma had the most significant paper centrality of 0.02. Their papers are most influential in the field of ZCCs. As shown in Figure 5, the distribution of authors is fragmented. There is a lack of collaboration among researchers in the ZCC field and a lack of academic research teams with core leadership.
3.1.5. Distribution of Contributing Institutions
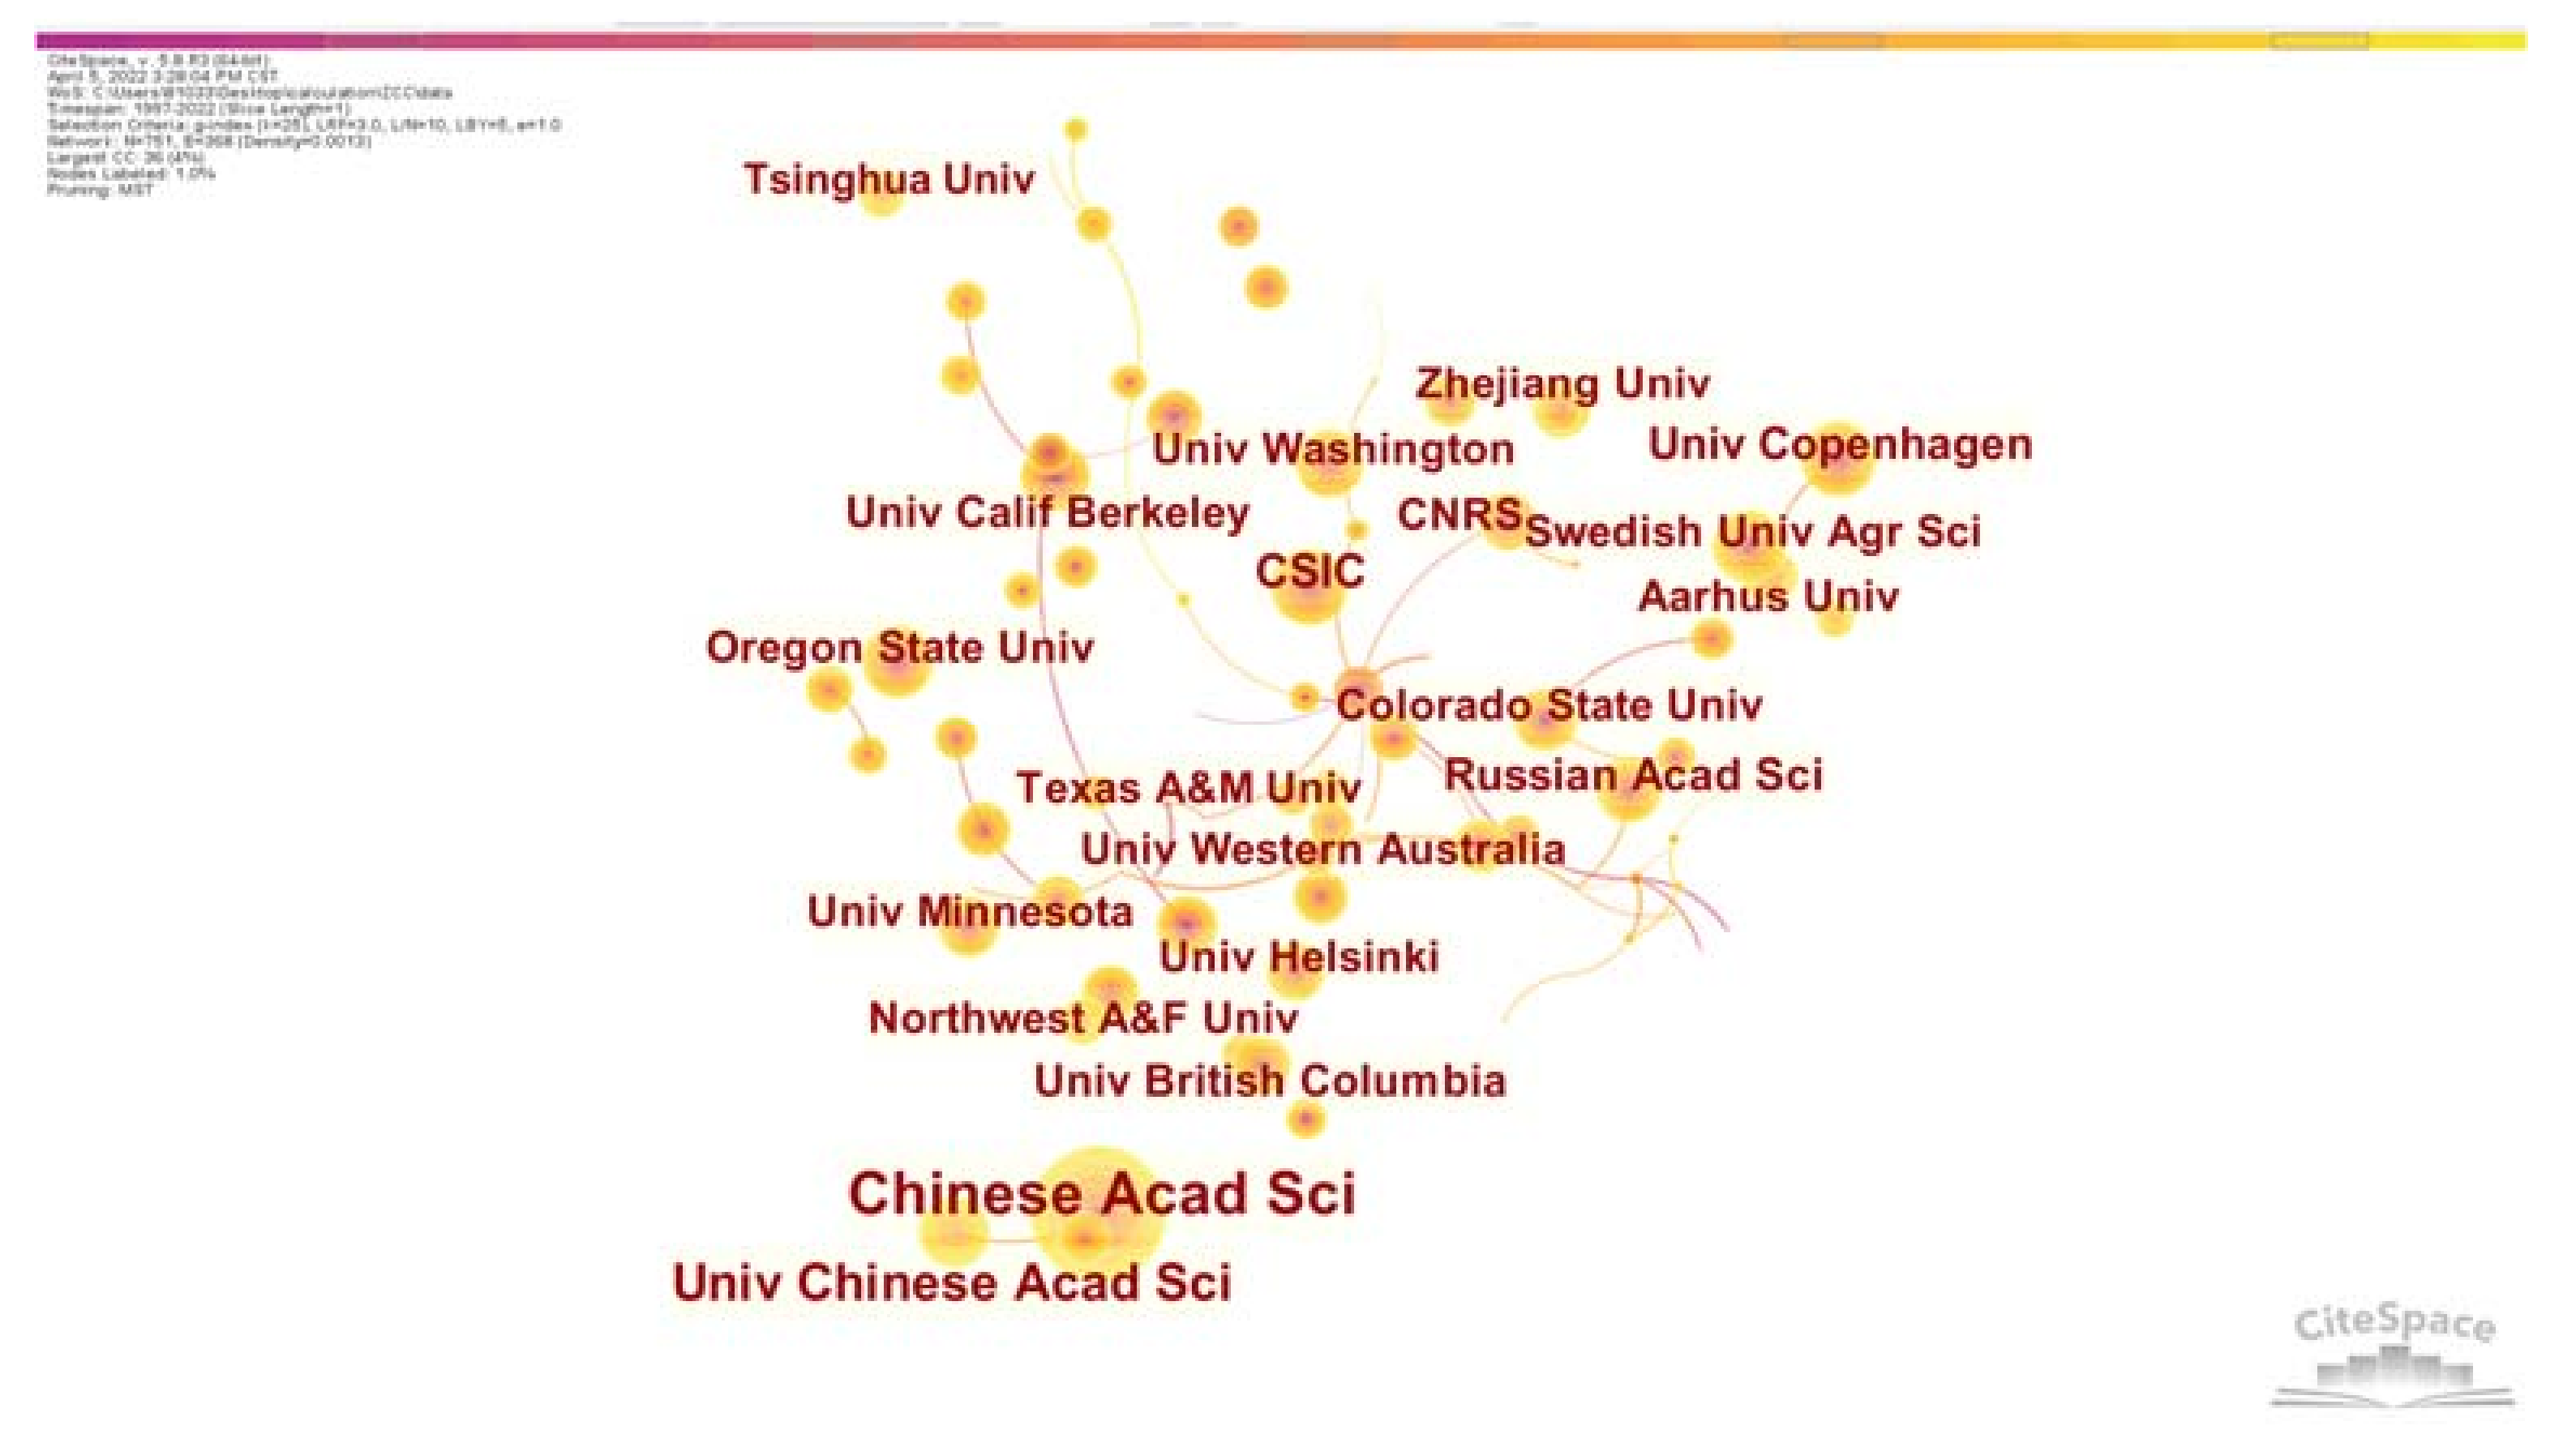
The analysis of the distribution of collaboration among research institutions provides insight into the academic support and recognition of the field, thus facilitating collaboration among institutions [50]. The core institutions in the ZCC domain were analyzed using CiteSpace, and a knowledge graph containing 751 nodes and 368 links with a density of 0.0013 was obtained. The knowledge graph of the core institutions is shown in Figure 6. Among the top 10 publishers from 1997–2022, the Chinese Academy of Sciences was first in terms of the number of articles (1317); the University of the Chinese Academy of Sciences was second in terms of the number of articles (491), and Consejo Superior de Investigaciones Científicas was third in terms of the number of articles (230). Among the top 10 institutions in the research institution collaboration centrality ranking, the Chinese Academy of Sciences ranked first (0.1). The French National Center for Scientific Research and Univ Paris 06 Center both ranked second (0.04). To a certain extent, the degree of centrality reflects the influence of the institution’s publications. As seen in Table 6, the volume and centrality rankings are not all the same, indicating that there are research institutions that publish many articles, but the quality of the articles is not high, and the influence is not significant. As shown in Figure 6 and Table 6, there is closer cooperation between research institutes, companies, and universities worldwide.
3.2. Research Fields
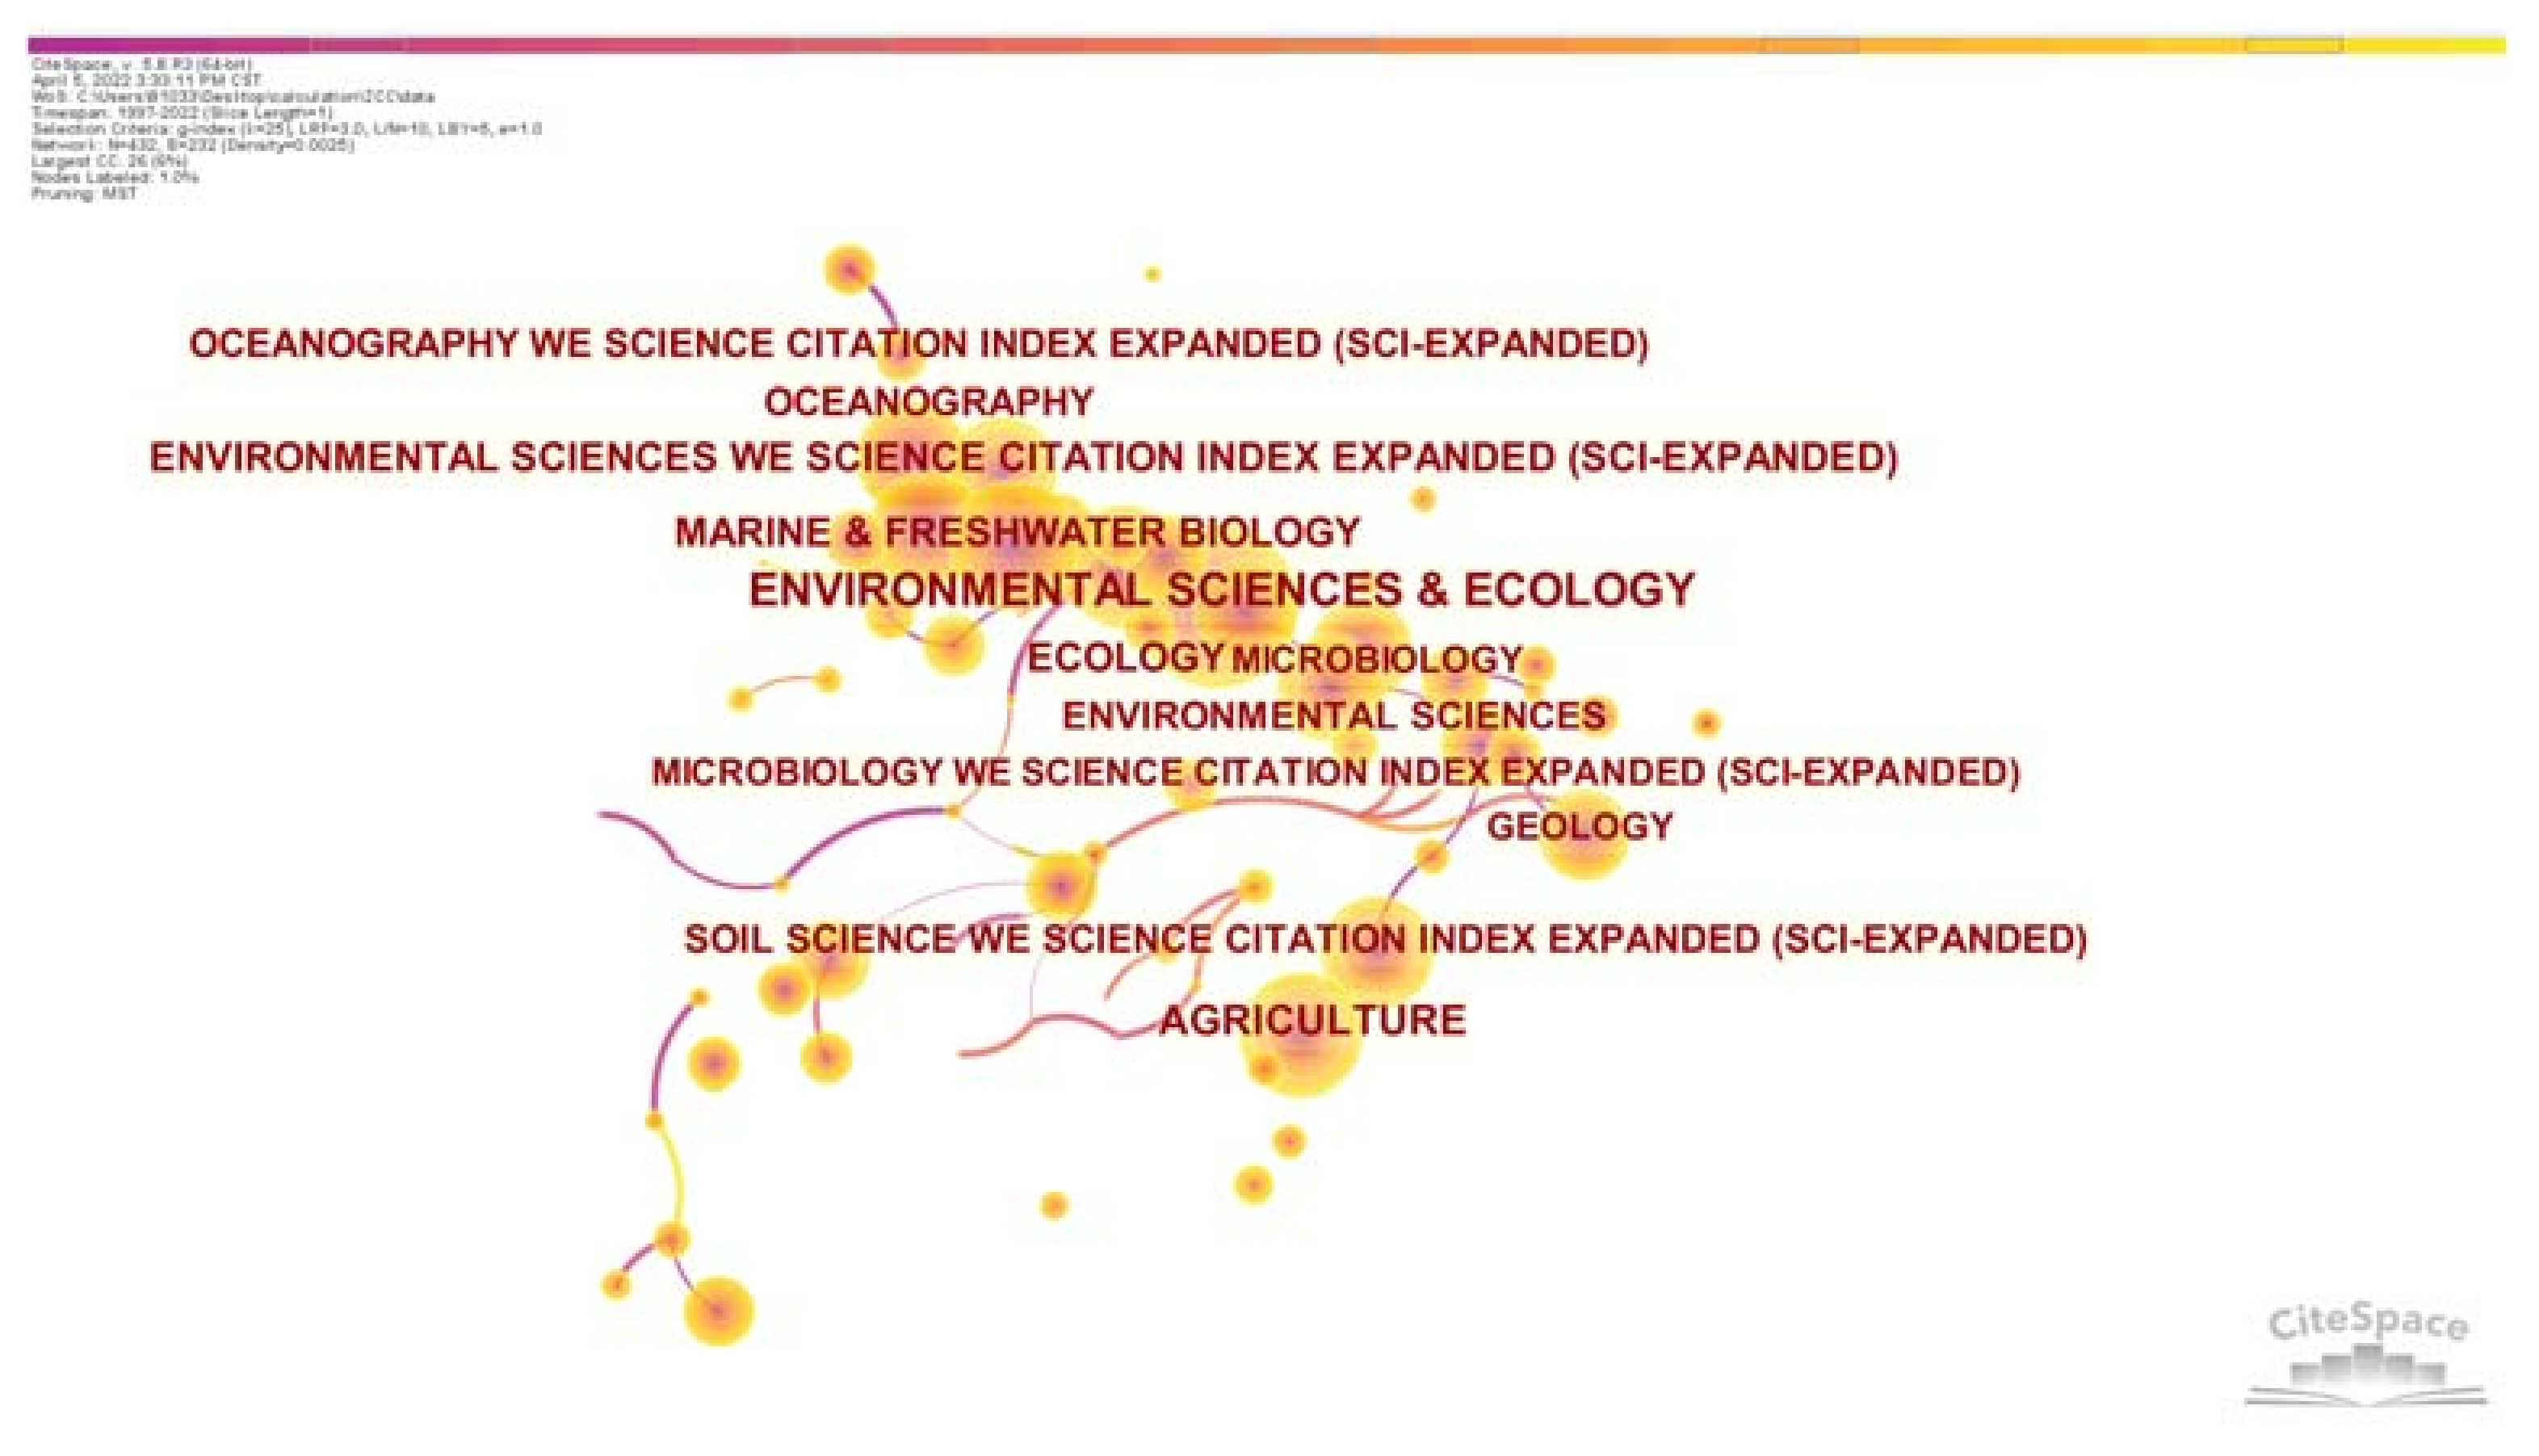
Setting the node type to category and the time slice to one year produced a collaborative relationship graph of disciplinary categories [51]. In the CiteSpace analysis, there are 432 nodes conducted by the relevant research and 232 lines resulting from collaborations. The centrality indicates the influence of the categories. The most influential category is the Conference Proceeding Citation Index—Science (CPCI-S), with a centrality of 0.24. The second most influential category is Engineering, with a centrality of 0.21. Science Citation Index Expanded (SCI-Expanded) has a centrality of 0.21; Biochemistry and Molecular Biology has a centrality of 0.12; Environmental Science and Ecology has a centrality of 0.1, etc. The centeredness of the subjects is more significant than 0.1. Table 7 lists the top 10 categories of disciplines with the best academic impact based on centrality.
In the analysis options, the size of each node represents the frequency of occurrence. While the outer purple border represents intercentricity, a thicker border means a higher intercentricity and more academic influence on that node; the line between nodes represents connection, and a thicker border means a stronger academic connection. As shown in Figure 7, the top disciplines in this research area in several publications are Environmental Sciences and Ecology, Agriculture, Marine and Freshwater Biology, and Environmental Sciences. The more influential disciplines are engineering, for which chemistry, biochemistry, molecular biology, public, environmental and occupational health, environmental science and ecology, environmental studies, material science, computer science, and agriculture form strong ties. This indicates that research in the field of ZCCs is interdisciplinary, and that engineering and environmental sciences are important research disciplines that play an essential role in the field.
Highly Cited Articles
In the WoS Core Collection, by searching for both LCC and ZCC keywords, we selected highly cited papers, sorted by citations: highest first, sorted by cited times to obtain Table 8. The most cited article is “Thermal properties of graphene and nanostructured carbon materials” (cited 4079 times, 43.841 Impact Factor); the second most cited article is “Bounding the role of black carbon in the climate system: A scientific assessment” (cited 3189 times, 4.261 Impact Factor); the third most cited article is “Global fire emissions and the contribution of deforestation, savanna, forest, agricultural, and peat fires” (1997–2009, cited 1821 times, 6.133 Impact Factor). Their research areas are Chemistry, Material Science, Physics, Meteorology and Atmospheric Sciences, and Environmental Sciences and Ecology. Other article titles and details are in Table 8. From the analysis of the highly cited articles, it can be obtained that the research fields of LCCs and ZCCs are more widely involved, indicating that the design strategies for LCCs and ZCCs need to consider the cooperation among various disciplines in an integrated manner. In the LCC and ZCC fields, articles with high citation counts do not necessarily have the highest impact factor, indicating no direct correlation between the number of citations and the impact of an article. A high number of citations but a low impact factor indicates that the article is more influential than the journal itself. Highly cited articles indicate the level of disciplinary activity within the LCC and ZCC fields, and the most active disciplines and research directions can be identified through high citations. By observing the relationship between the number of years of publication and the number of citations, we can identify the hot research directions at the present stage or in the future.
3.3. Research Hotspots and Research Strategies
3.3.1. Keyword Co-Occurrence Network
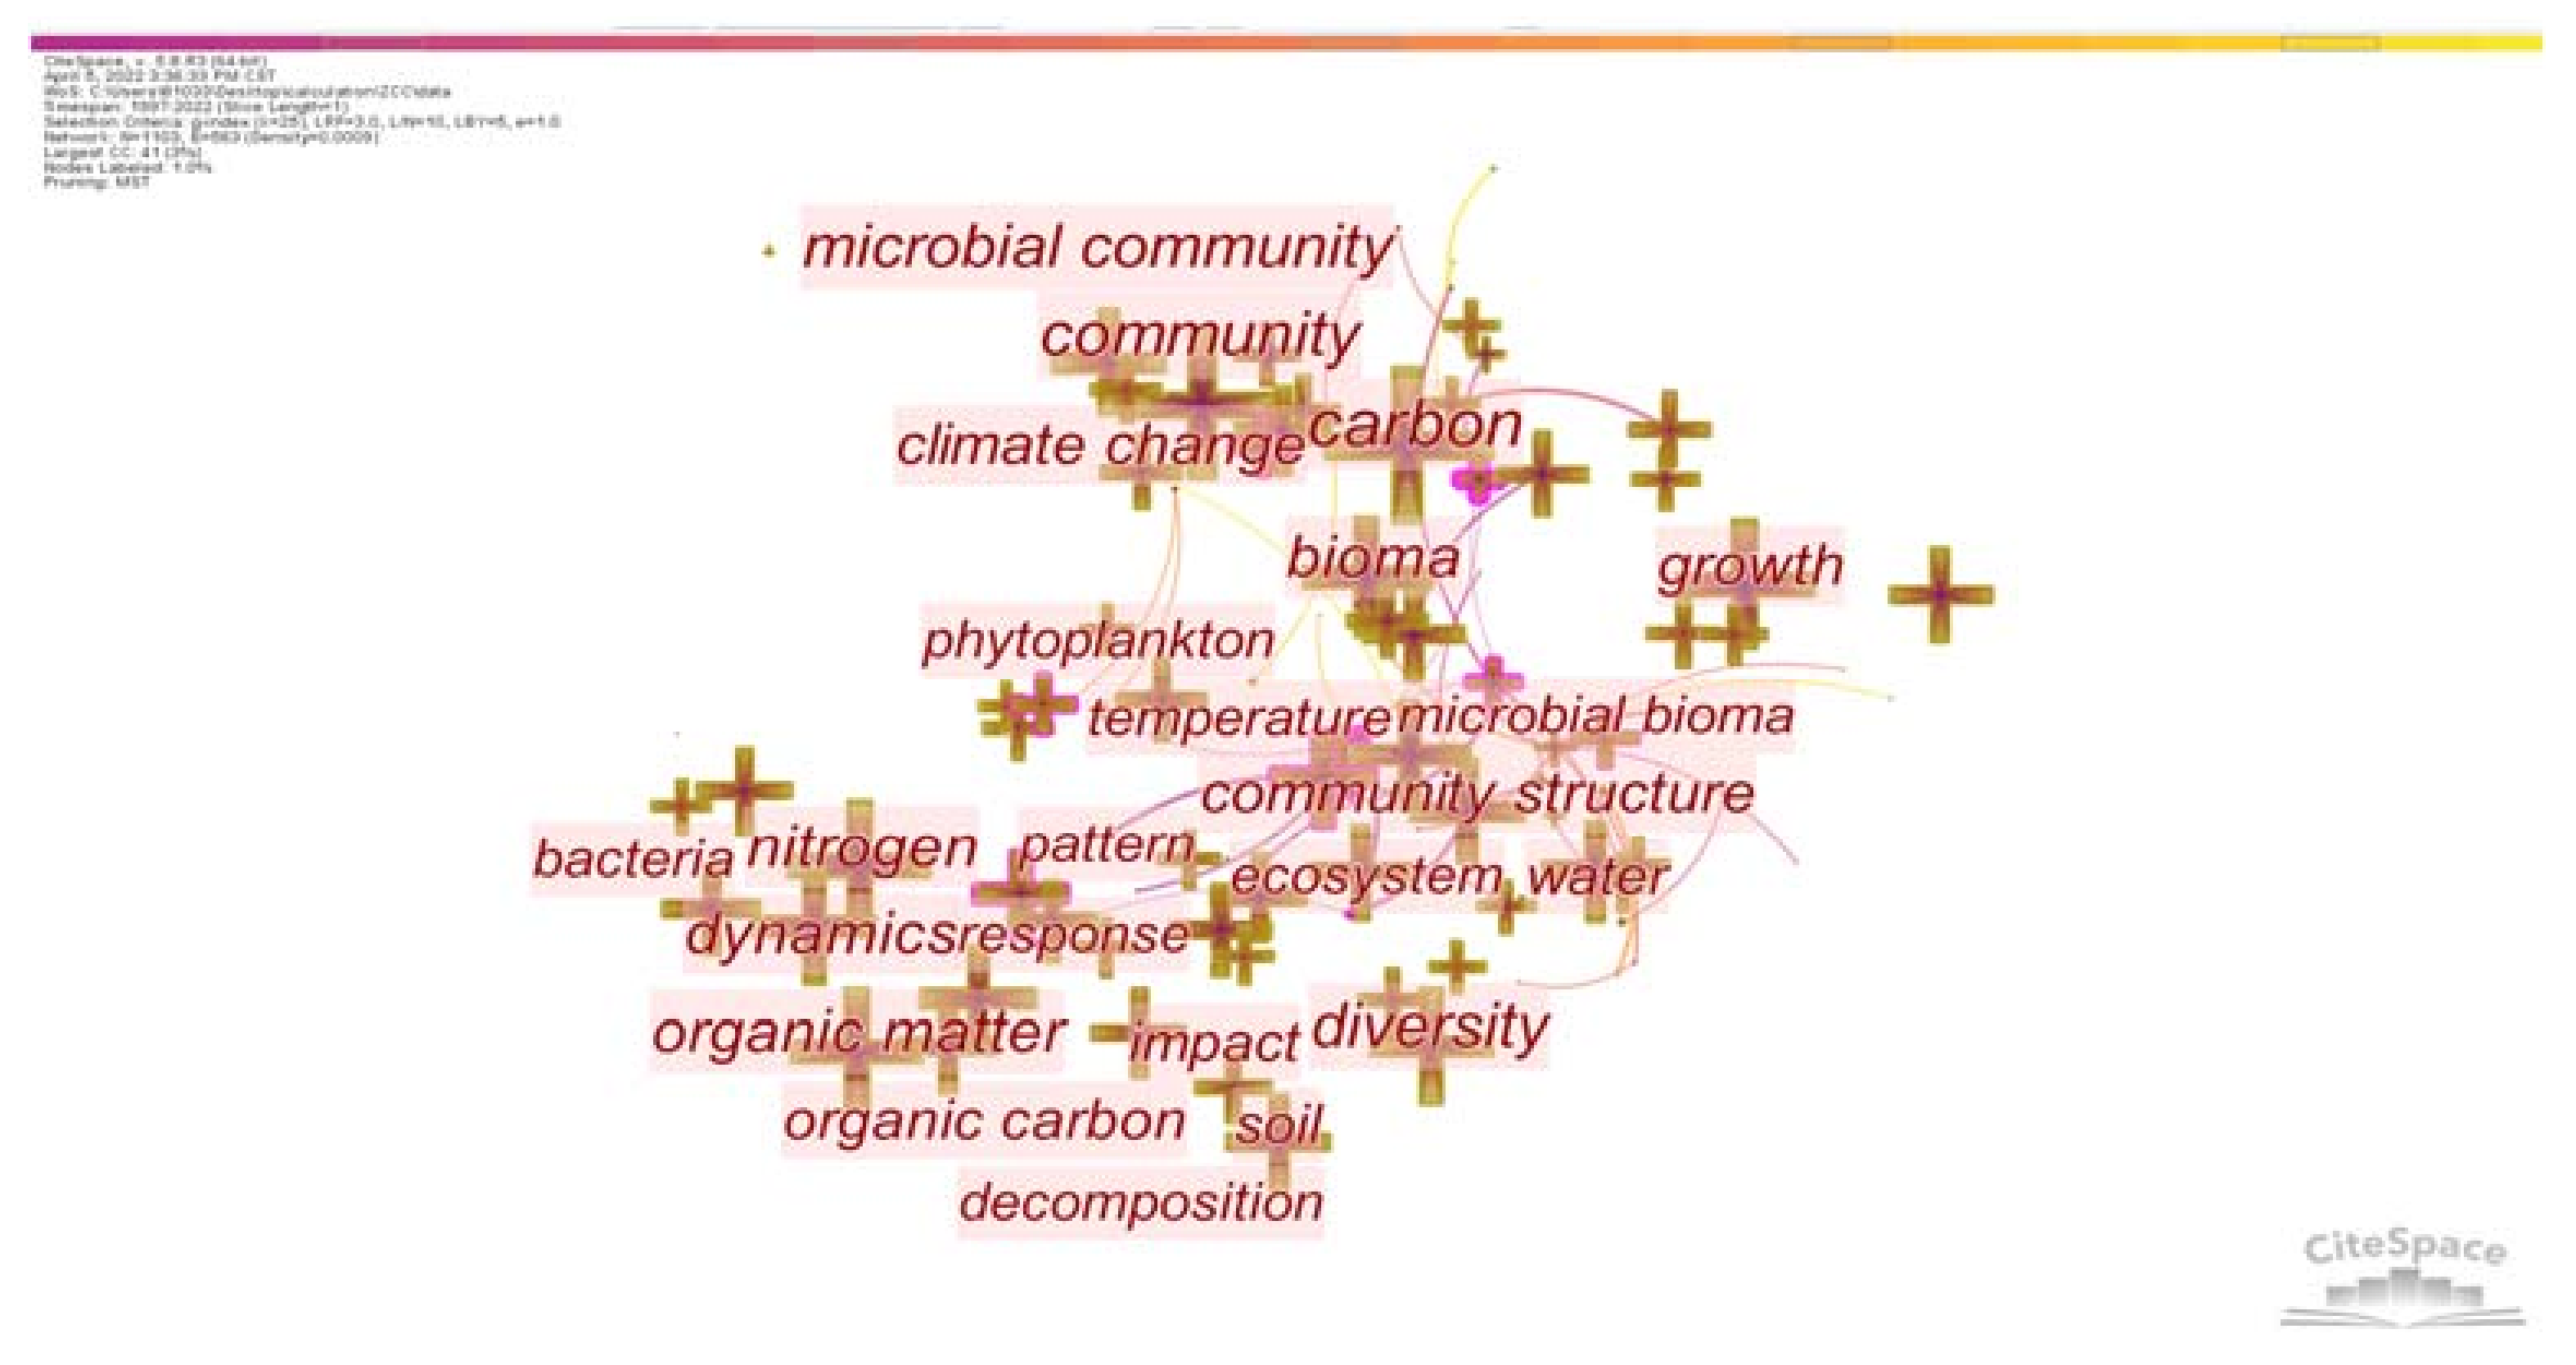
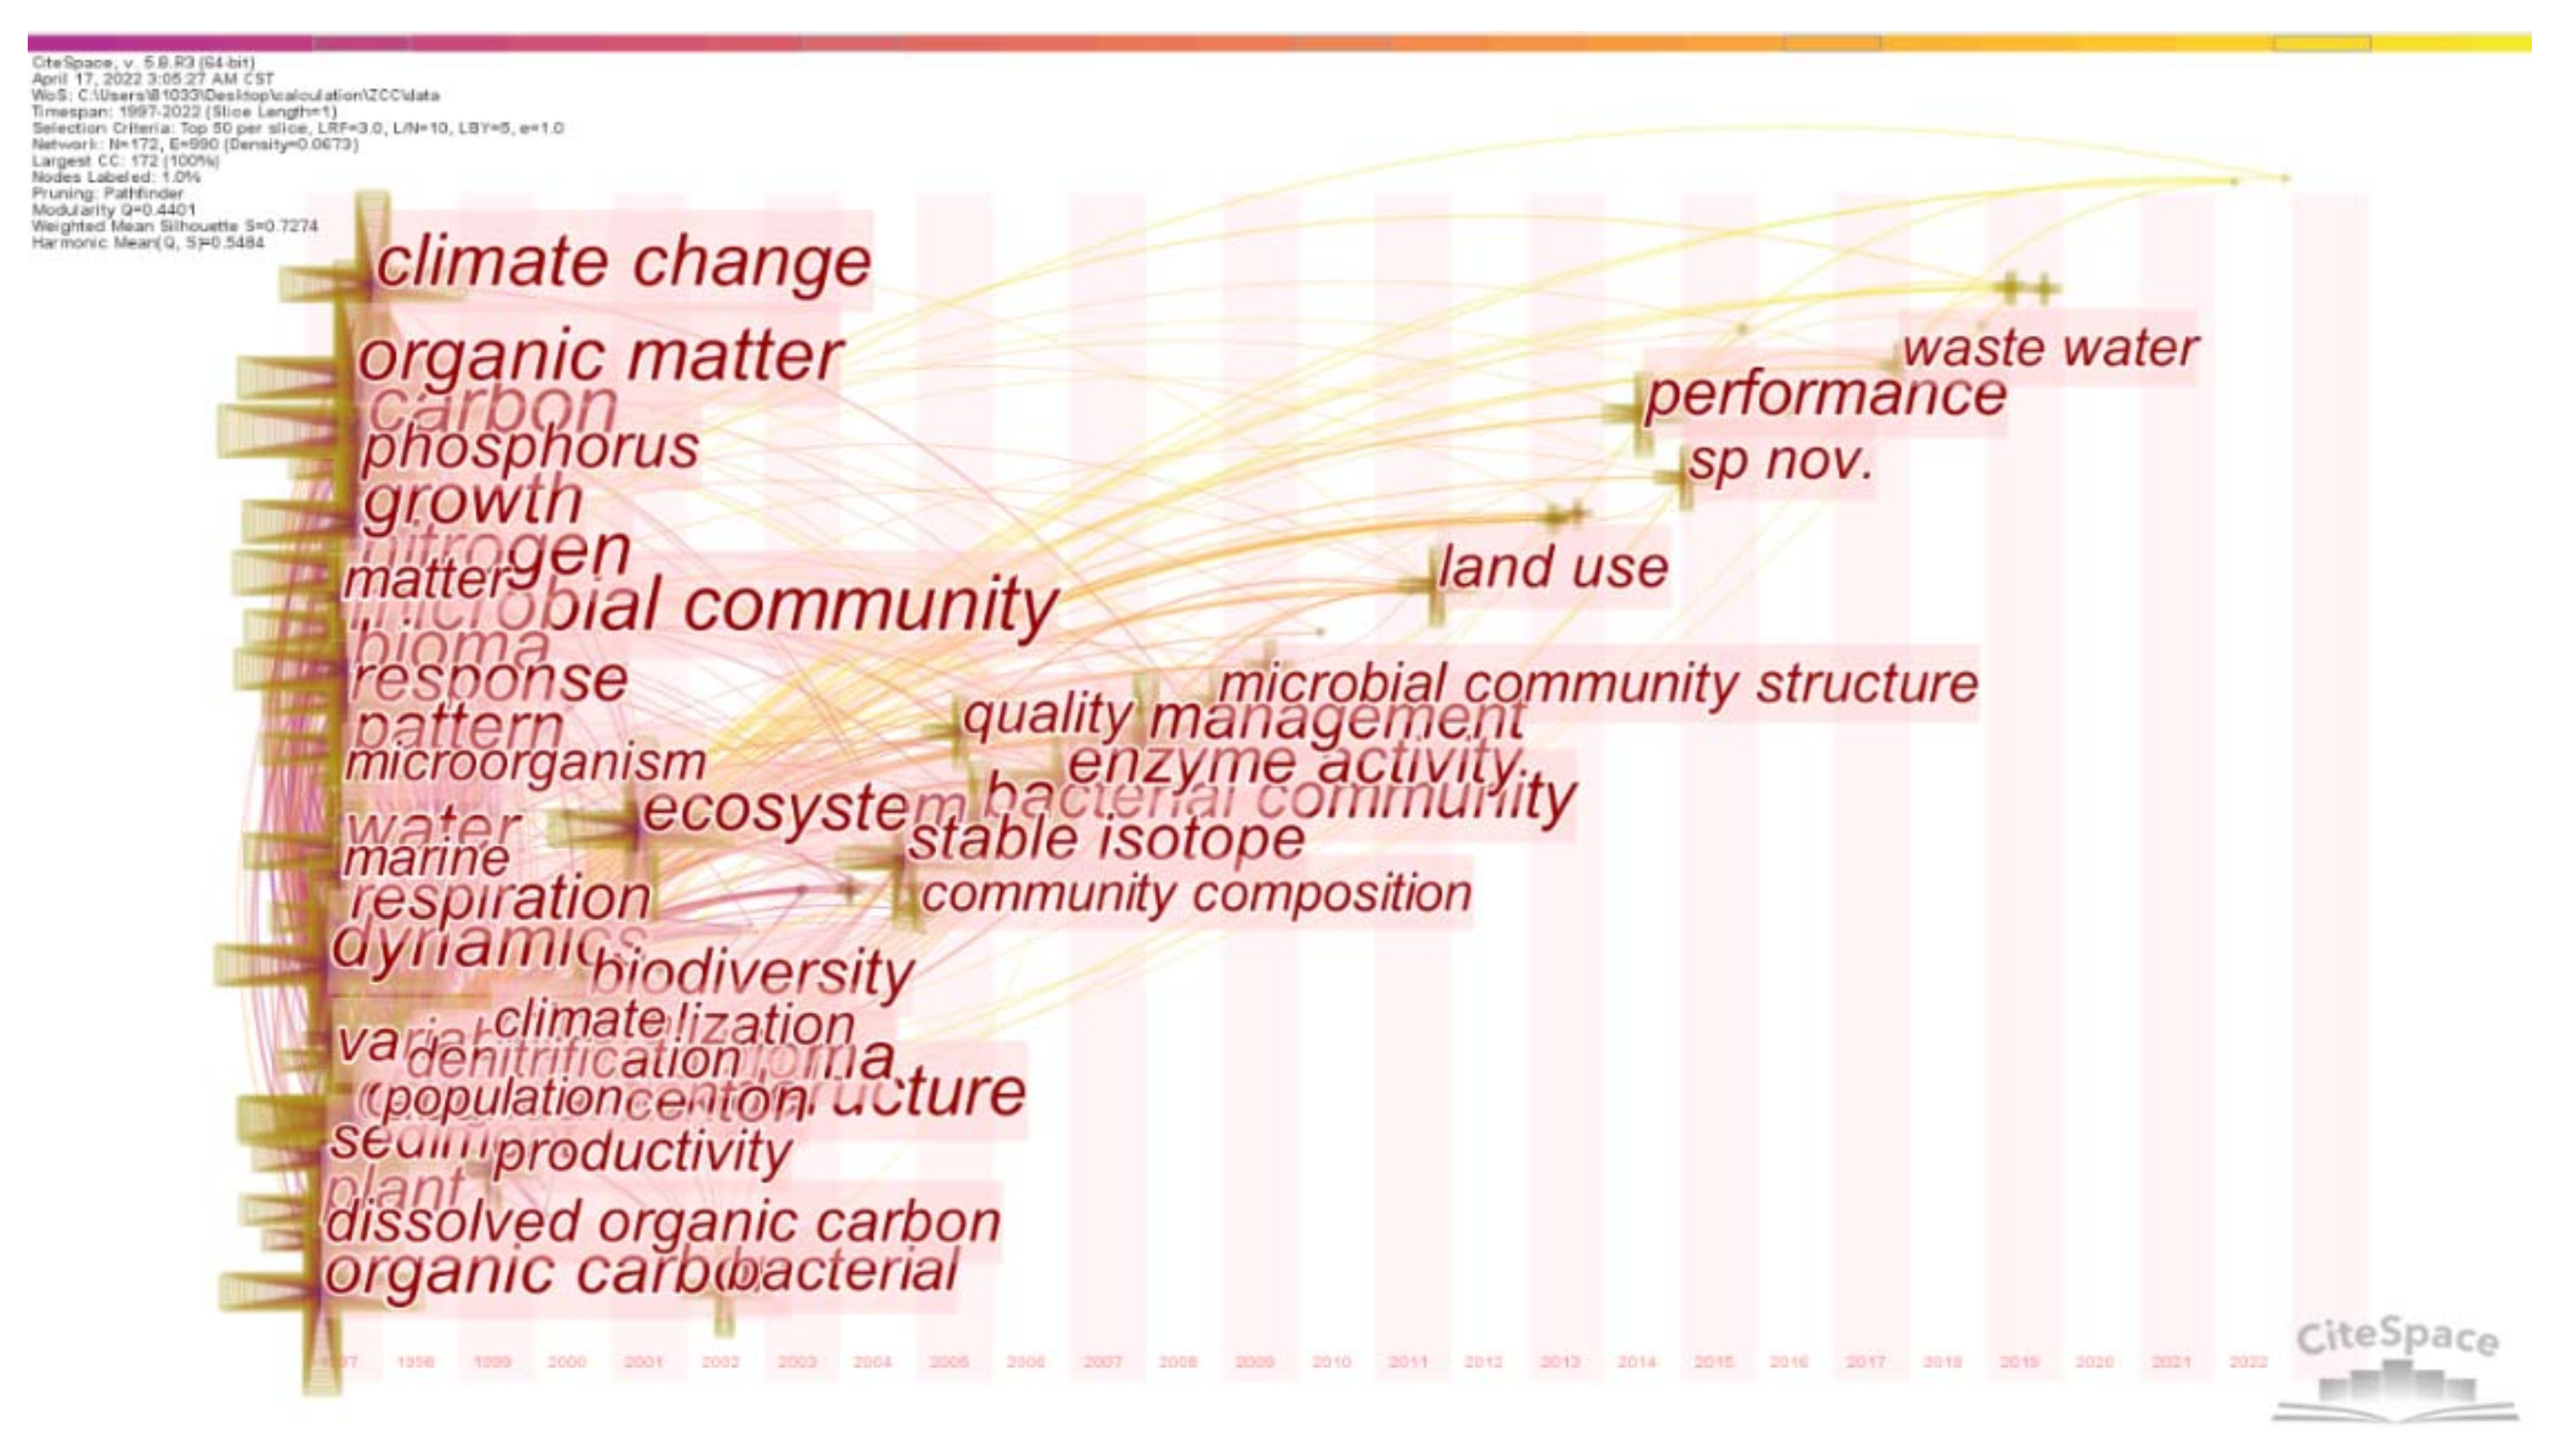
Keywords can reveal the main directions of the article’s content and its core ideas, and detect the co-occurrence frequency and emergence of keywords in the related literature in LCC and ZCC research [52]. It can visually present the research hotspots, research trends, and knowledge structure in LCCs and ZCCs. The data of 19,014 documents were imported into CiteSpace software. Using the keyword path calculation method in the software, the keywords’ co-occurrence frequency and centrality were calculated, and the keyword knowledge map was drawn. The database period was set as 1997–2022, with 1 year as the time slice and keywords as the network nodes, and the top 50 highly cited keywords in each time slice were selected to generate LCC and ZCC research keyword co-occurrence profiles (see Figure 8). A total of 1103 nodes and 563 links appeared, with a network density of 0.0009, in which larger nodes indicate the more frequent occurrence of keywords, more links indicate more co-occurrence of two keywords, and thicker links indicate a stronger connection. The top 5 essential keywords for every 5 years from 1997 to 2022 were extracted according to word frequency ranking statistics, as shown in Table 9. The statistical results show that the keywords carbon, community, diversity, microbial community, and nitrogen appear frequently and at the same time at the beginning of the LCC and ZCC studies, and are the core themes of the LCC and ZCC studies.
3.3.2. Keyword Co-Occurrence Timezone Analysis
The CiteSpace time zone map can visually reflect the frontiers of research fields and their derivative relationships at different times and thus make judgments about future developments [53]. Keywords with high emergence are words with a high-frequency change rate in a certain period, which can help to reveal research hotspots and reflect research frontiers and trends [54]. In this research, we filtered keywords according to their emergence and frequency (Table 10), analyzed LCC and ZCC research hotspots by keyword co-occurrence, and revealed the development trend. The timeline map of LCC and ZCC research from 1997 to 2022 was obtained (Figure 9). Through the analysis of high-frequency words, it was found that the keywords of LCC and ZCC research cover a wide range, and there are apparent differences in the research focus and hot topics at different stages. In general, it can be divided into the following three stages:
- Rapid development stage (1997–2007): This phase is the initial phase of LCC and ZCC research, which focuses on carbon, community, diversity, microbial community, etc. The causes of global climate change during the rapid development of Western societies were explored. After the U.K. proposed a low-carbon economy in 2003, research on LCC and ZCC has received global attention. This phase is a study of global climate change and carbon emissions.
- Slow growth stage (2008–2016): At this stage, the study of LCC and ZCC gradually attracted attention. The studies at this stage mainly focused on management, land use, microbial community structure, litter decomposition, etc. The main research at this stage was directed toward LCC- and ZCC-related derivative areas. This research phase has moved toward carbon emissions and measures to reduce them.
- Fluctuant rising stage (2017–present): With globalization and the introduction of the concept of zero net carbon by the United Nations and the continuing Conference of the Parties, research on LCCs and ZCCs has received greater attention. This research phase focused on carbon sequestration, nitrogen removal, wastewater treatment, etc. This phase gave a significant boost to the process of development from LCCs to ZCCs.

Table 10.
The top 7 high-frequency keywords of papers published on the ZCC every five years during 1997–2022.
Table 10.
The top 7 high-frequency keywords of papers published on the ZCC every five years during 1997–2022.
| No. | Freq | Centrality | Year | Keywords |
|---|---|---|---|---|
| 1997–2001 | ||||
| 1 | 3626 | 0.09 | 1997 | Carbon |
| 2 | 2497 | 0.1 | 1997 | Community |
| 3 | 2035 | 0.09 | 1997 | Diversity |
| 4 | 1828 | 0.08 | 1997 | Microbial community |
| 5 | 1802 | 0.06 | 1997 | Nitrogen |
| 6 | 1562 | 0.05 | 1997 | Organic matter |
| 7 | 1433 | 0.04 | 1997 | Dynamics |
| 2002–2006 | ||||
| 1 | 599 | 0.01 | 2005 | Bacterial community |
| 2 | 583 | 0.01 | 2006 | Enzyme activity |
| 3 | 499 | 0 | 2004 | Stable isotope |
| 4 | 281 | 0.01 | 2004 | Quality |
| 5 | 167 | 0 | 2004 | Community composition |
| 6 | 107 | 0 | 2006 | Dissolved organic matter |
| 7 | 69 | 0 | 2003 | 16s ribosomal RNA |
| 2007–2011 | ||||
| 1 | 554 | 0.01 | 2007 | Management |
| 2 | 355 | 0 | 2011 | Land use |
| 3 | 236 | 0 | 2008 | Microbial community structure |
| 4 | 144 | 0.01 | 2009 | Litter decomposition |
| 5 | 33 | 0 | 2007 | Availability |
| 6 | 15 | 0 | 2010 | Soil carbon |
| 7 | 13 | 0 | 2011 | Rhizosphere |
| 2012–2017 | ||||
| 1 | 514 | 0.01 | 2014 | Performance |
| 2 | 262 | 0 | 2014 | Species nova |
| 3 | 113 | 0 | 2013 | Emission |
| 4 | 106 | 0 | 2016 | Carbon sequestration |
| 5 | 89 | 0 | 2013 | Ocean acidification |
| 6 | 77 | 0 | 2013 | Oxidation |
| 7 | 58 | 0 | 2013 | Activated sludge |
| 2017–2022 | ||||
| 1 | 206 | 0 | 2017 | Waste water |
| 2 | 163 | 0 | 2019 | Nitrogen removal |
| 3 | 150 | 0 | 2019 | Removal |
| 4 | 35 | 0 | 2017 | Mechanism |
| 5 | 33 | 0 | 2018 | Waste water treatment |
| 6 | 10 | 0 | 2022 | Anaerobic digestion |
| 7 | 9 | 0 | 2022 | pH |
Figure 9.
Annual variations of co-occurring keywords of the papers on ZCC during 1997–2022.

3.3.3. Keyword Clustering Analysis
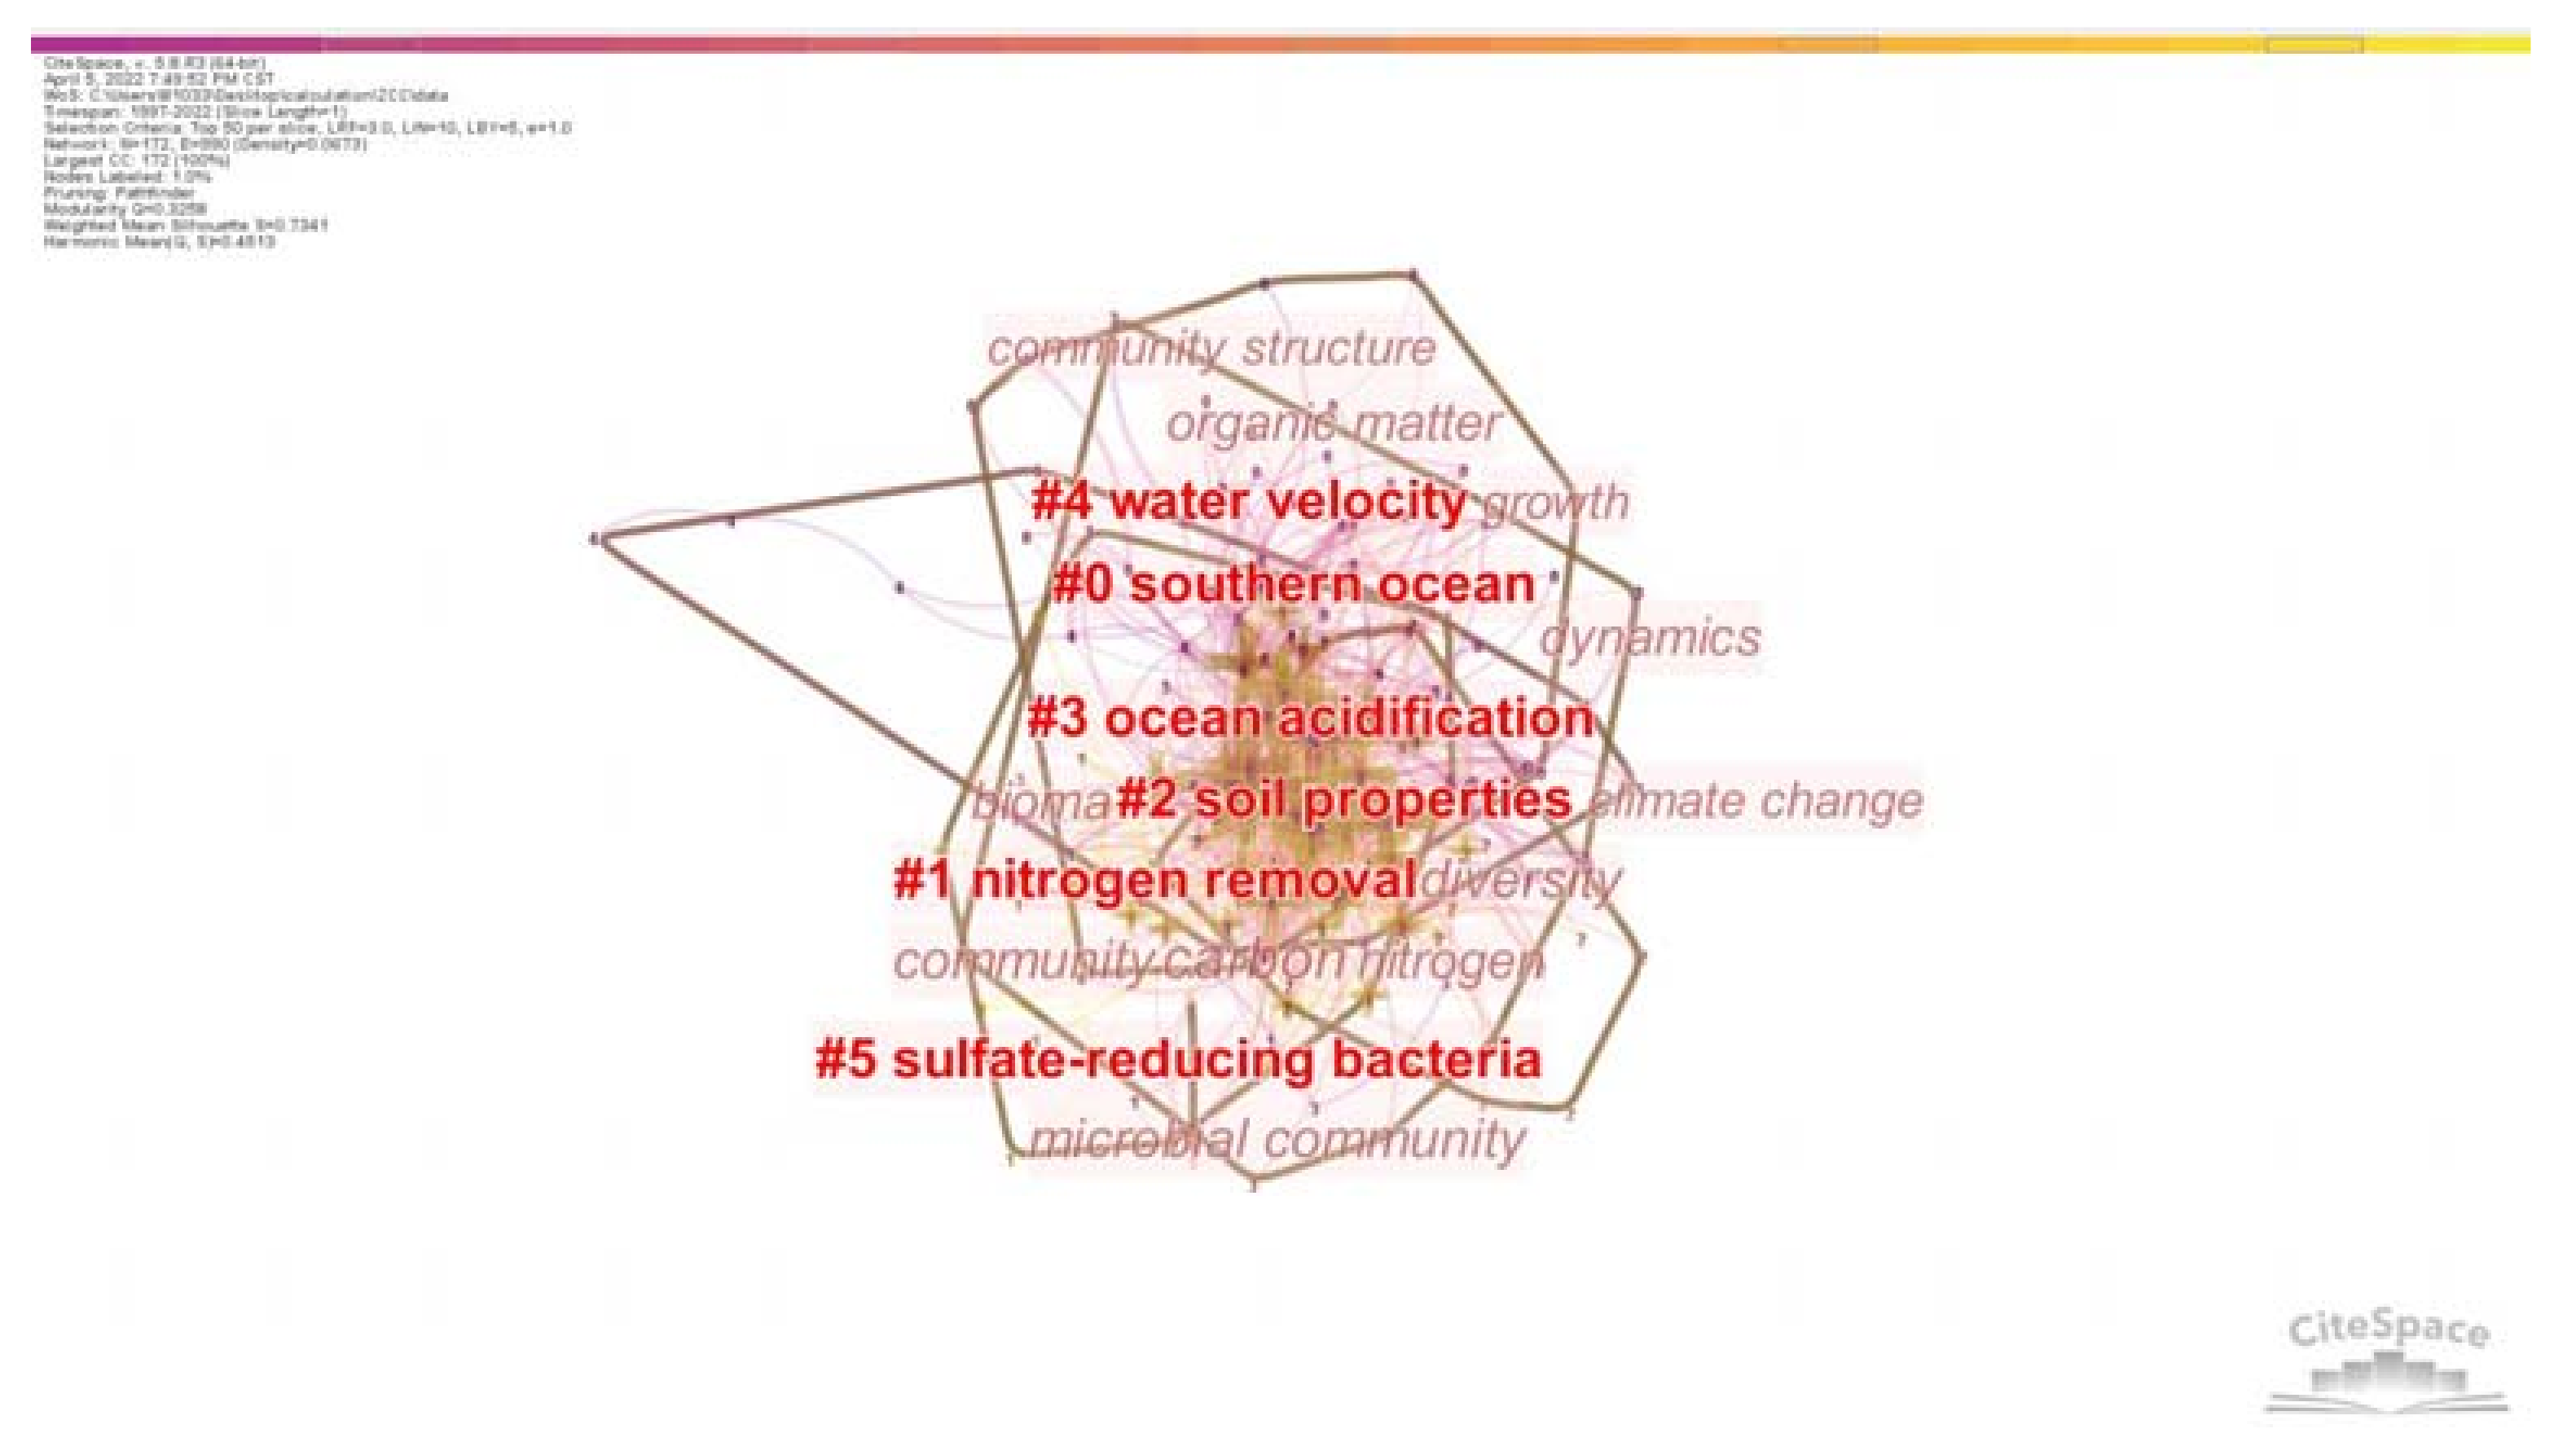
In this research, keyword knowledge graphs are clustered and analyzed to explore the research themes and evolutionary trends of LCC and ZCC development in different periods. The time slice is from 1997 to 2022. The 50 most cited articles were selected per slice. After running the analysis in CiteSpace, we obtained the map shown in Figure 10. The clustering function was performed as the labeling source, and the log-likelihood ratio was used as the method [55]. The results returned 4 knowledge clusters, and two of them are major clusters based on cocitation cluster information. Modularity Q is a value ranging from 0–1, and values close to 1 reveal closer relationships and connections within clusters. The values of the mean silhouette should be between −1 and 1. Values close to 1 indicate that articles within a cluster are highly consistent or similar in terms of content [55]. Figure 10 and Table 11 show that the Modularity Q value is 0.2507 and the Mean Silhouette is 0.6781. In the 4 primary clusters, the silhouette values are greater than 0.4. This indicates a medium-quality cluster analysis of hospitality knowledge mapping. There are three different types of calculations of the cluster. They are LSI, LLR, and MI. The LLR has the most realistic calculation to obtain better results. Therefore, we chose the LLR result as our main definition of each cluster.
Specifically, from Table 11, the cluster ranked first was organic carbon (#0). This knowledge cluster contains studies on the Southern Ocean, the food web structure, benthic communities, carbon flow, and stable carbon. This cluster contained 52 articles, mostly published in approximately 1998. The silhouette value of the cluster was 0.707. The second-largest cluster (#1) contains 34 articles with a silhouette value of 0.694. This knowledge cluster contains studies on nitrogen removal, sequencing batch reactors, bacterial communities, microbial fuel cells, and microbial community analysis. The third-largest cluster (#2) contains 33 articles with a silhouette value of 0.797. This knowledge cluster contains studies on soil properties, carbon sources, nitrogen removal, elevated atmospheric CO2, and biological activity. The fourth-largest cluster (#3) contains 29 articles with a silhouette value of 0.768. This knowledge cluster contains studies on ocean acidification, elevated CO2, elevated atmospheric CO2, elevated temperature, and ecosystem functioning. The fifth-largest cluster (#4) contains 22 articles with a silhouette value of 0.698. This knowledge cluster contains studies on water velocity, microbial communities, Lake Erie, Thau Lagoon, and benthic fauna. The sixth-largest cluster (#5) contains 2 articles with a silhouette value of 0.937. This knowledge cluster contains studies on sulfate-reducing bacteria, aerobic organic carbon mineralization, oxygen-saturated photic zones, soil microbial community responses, and organic carbon substrates.
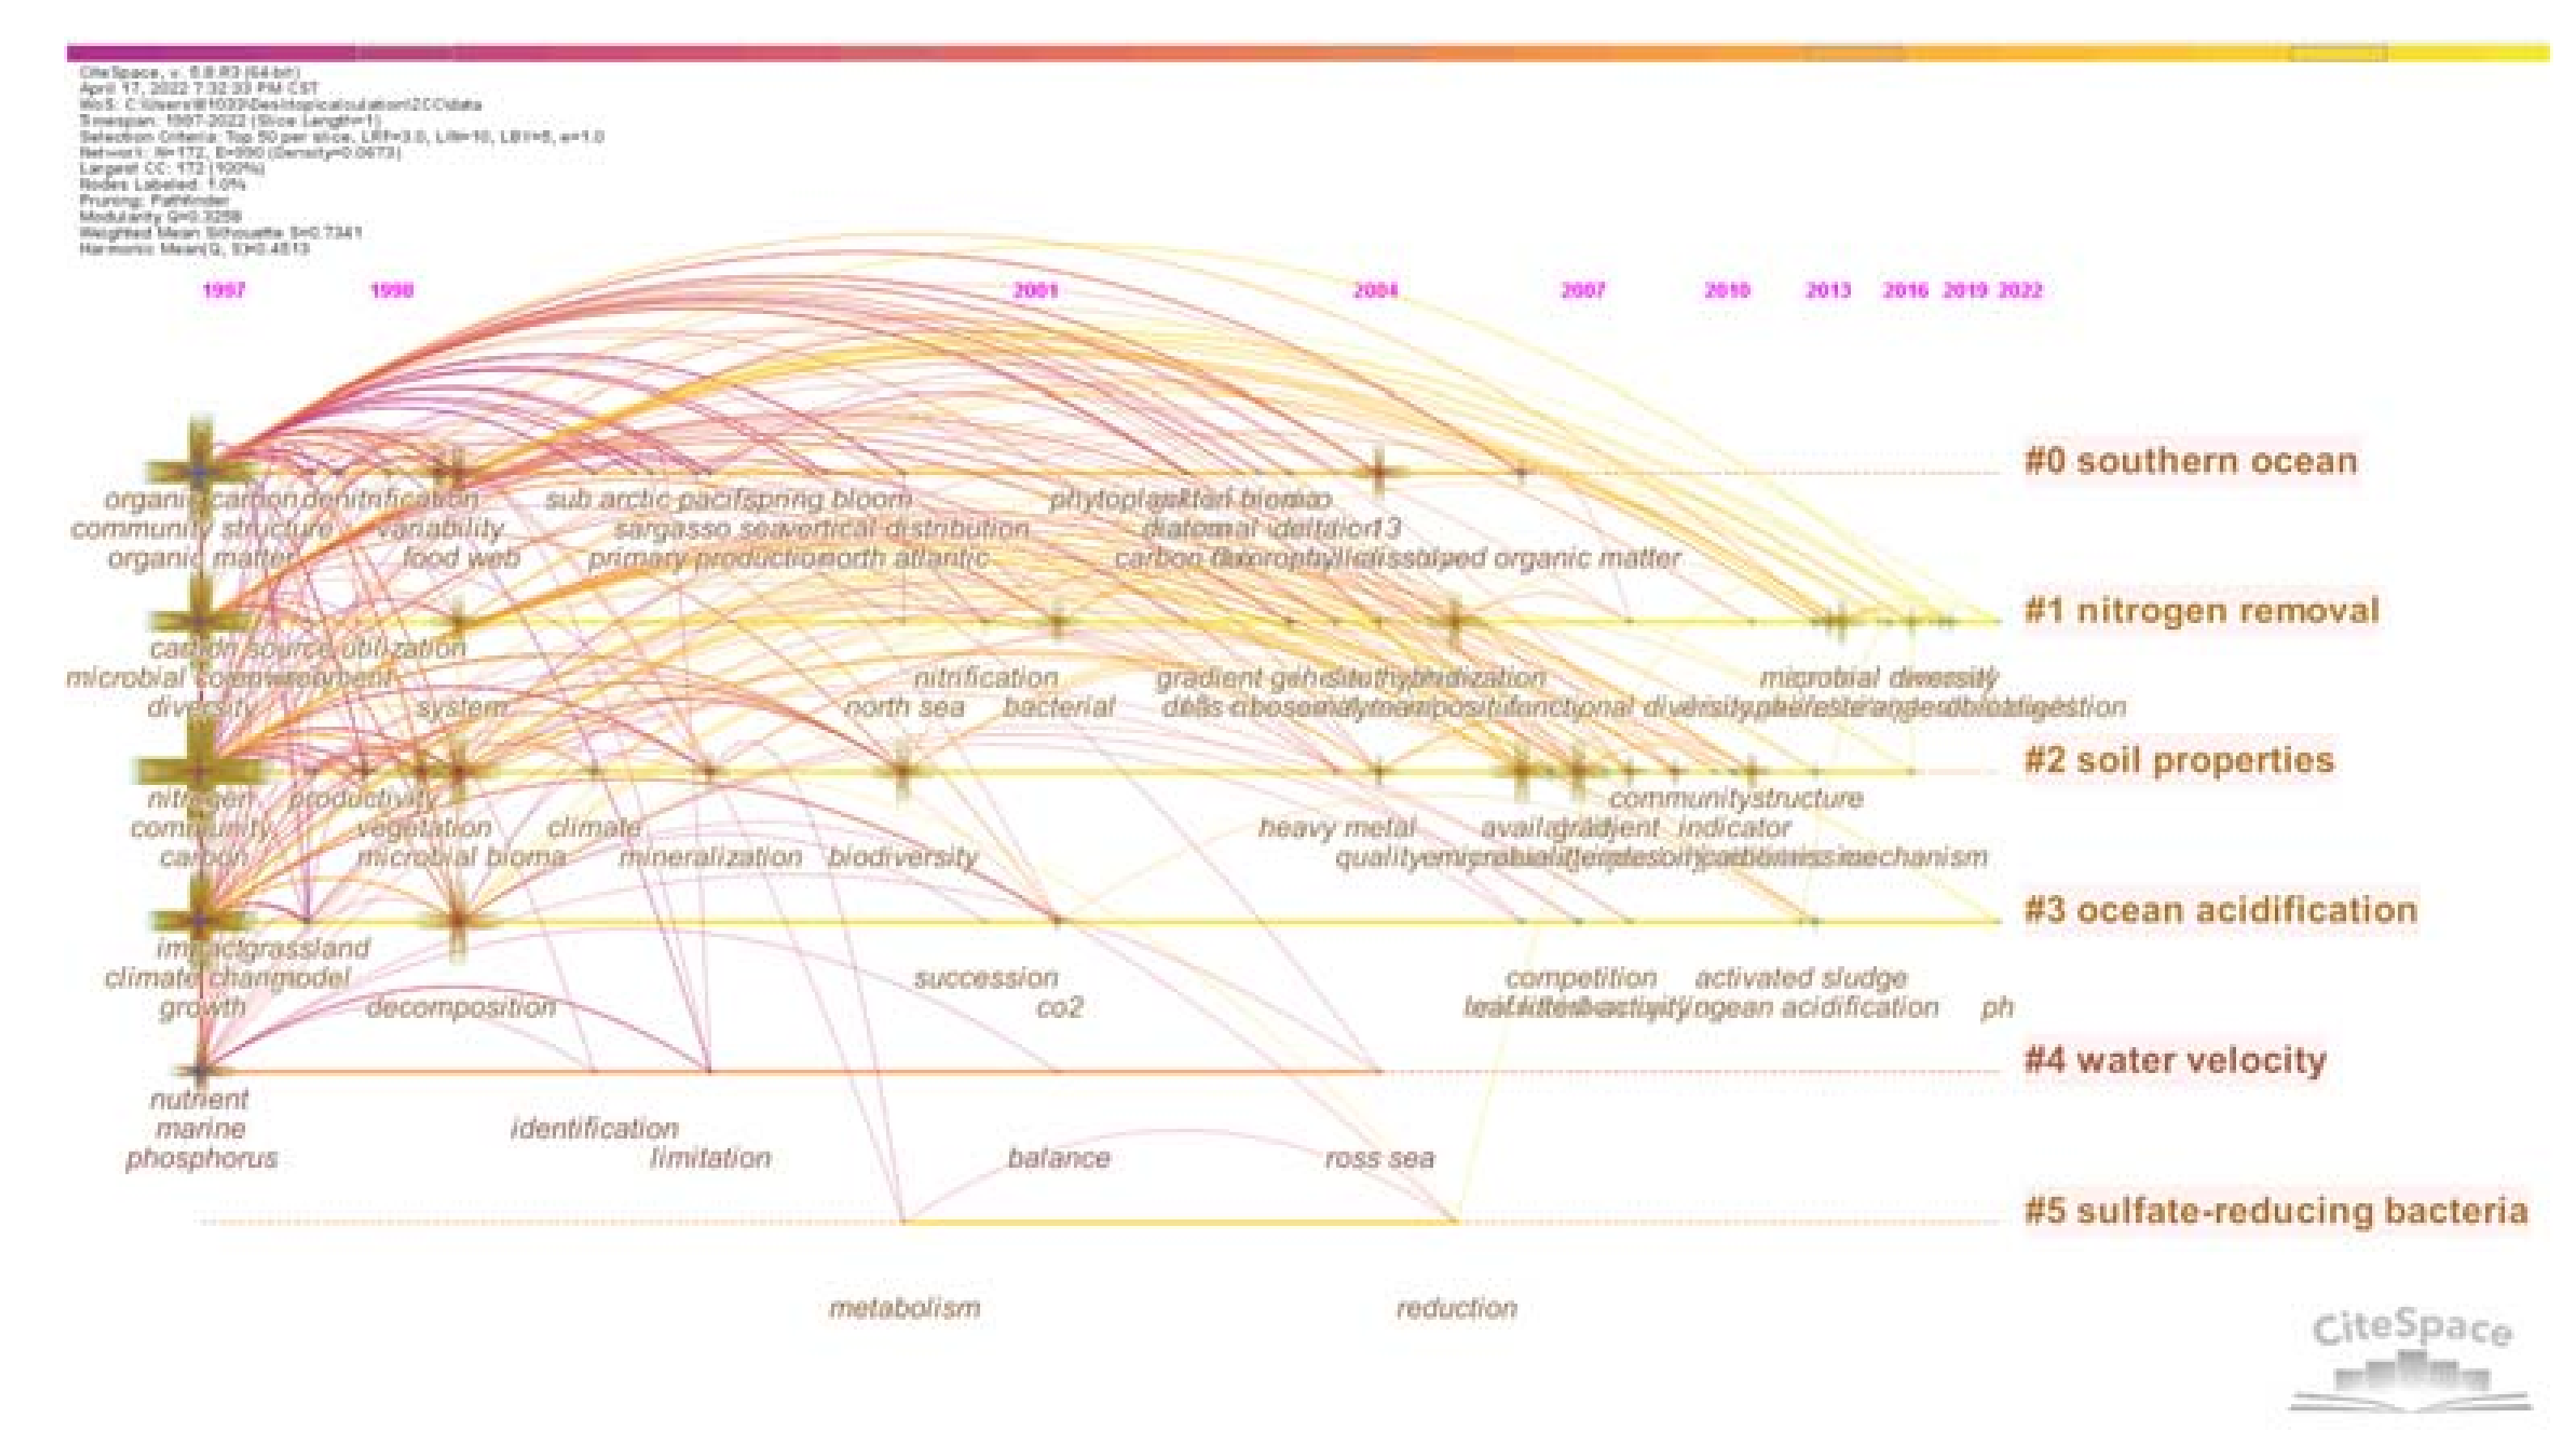
3.3.4. Research Clustering Timeline
To understand the origin, historical development, and current status of LCC and ZCC clusters, and identify the key literature in the knowledge evolution process, we performed a visual timeline analysis of cited references’ cocitation clusters (Figure 11). This research performs a cluster analysis of keyword knowledge graphs to explore the research themes and evolutionary trends in different LCC and ZCC development periods. The formed class clusters are clustered around high-frequency headwords, and the timeline mapping consisting of the top 5 key class clusters is intercepted, as shown in Figure 11. These class clusters are organic carbon, nitrogen removal, elevated CO2, and ocean acidification. A comprehensive study of urban form, land use, and the transportation system is required at the stage of urban master planning, and the differences in function, development intensity, architecture, and spatial form in different areas are addressed. Planning and design measures are proposed to reduce carbon emissions and increase carbon sinks in each region’s detailed planning and urban design.
At the regional planning level, the focus should be on building “megacities” using the “mobile space” of highways, high-speed railroads, and telecommunication cables. We can use a metropolitan spatial structure to design polycentric and compact cities [56]. Moreover, we can organize functional urban areas with a new functional division of labor to avoid the duplicative functional zoning of urban space. At the master plan level, the overall morphological composition of the city, land use pattern, integrated transportation system pattern, infrastructure construction, and carbon sequestration measures should be considered [57]. Targeted studies should be conducted in city areas with detailed planning and urban design. The city area should concentrate on functions according to the urban form. Functions other than the land use and transportation system should be determined by the master plan. Furthermore, specific planning countermeasures to reduce carbon emissions should be proposed [58]. The current research on the spatial structure of low-carbon cities mainly focuses on two aspects:
- The significance of the urban spatial structure to construct low-carbon cities.
- Exploration of a reasonable low-carbon urban spatial structure.
3.3.5. Research Trends Analysis
The keyword emergence degree can be used to explore words with high-frequency changes in a certain period from a large number of subject words, thereby reflecting the change in hot research topics during that period [59]. Burst words represent the phenomenon in which the keywords to be investigated transition in a short period. Identifying burst words can detect words with a high-frequency change rate in a certain period from a large number of subject words by investigating word frequency, emphasizing sudden change [60]. Burst term detection in CiteSpace was used to detect the emergent keywords in the LCC and ZCC research from 1997 to 2022, and 25 emergent words were detected (Table 12). Table 12 shows that at different stages, there are apparent differences in research focus and hot topic areas. Before 2003, there were relatively few studies on LCC, mainly focusing on analyzing plants, photosynthesis, growth, respiration, population, dissolved organic carbon, the ocean, phosphorus, and variability. Since 2003, the direction of LCC and ZCC research has become more diverse, the frequency of hot topics has increased, and more attention has been given to the research on complex issues caused by LCCs and ZCCs. From 2003 to 2016, research topics such as ecosystems, carbon dioxide, vegetation, and temperature received more attention. From 2017 to 2020, more attention was given to the impact of ZCCs and the effect of globalization on LCCs and ZCCs. Among them, bacterial community, management, and enzyme activity factors and their impact on achieving zero-carbon have become hot topics.
4. Discussion
In this research, we analyze the core WoS data of LCCs and ZCCs to determine the number of publications, the type and scope of their journals, the distribution of regional cooperation, author cooperation, and research institution cooperation in this field. The analysis provides the level of research activity, the cooperation between the main research regions and institutions, and the related authors. The analysis of the research areas enables us to draw out changes in the research areas and shifts in the direction of research during the development of LCCs and ZCCs. The keyword co-occurrence network and co-occurrence time partition can be obtained from the hotspots that have received attention during the development of LCCs and ZCCs. The keywords in this field are too fragmented, multidisciplinary, and not very relevant to each other. Analysis of keyword clustering analysis and the clustering timeline can provide the hot directions of active research in the field of LCCs and ZCCs, which can effectively categorize LCC and ZCC research directions and analyze and predict research trends. Nevertheless, when analyzing the categorization, the difference between categories is not obvious, and it is difficult to define the difference and connection between disciplines.
In the research trend’s analysis, we can determine that there are many bursts, such as sediment, sea, marine sediment, zooplankton, and so on, that are not so closely connected to the construction of ZCCs. These findings inspired us to develop research on ZCCs in biological, chemical, and technological approaches.
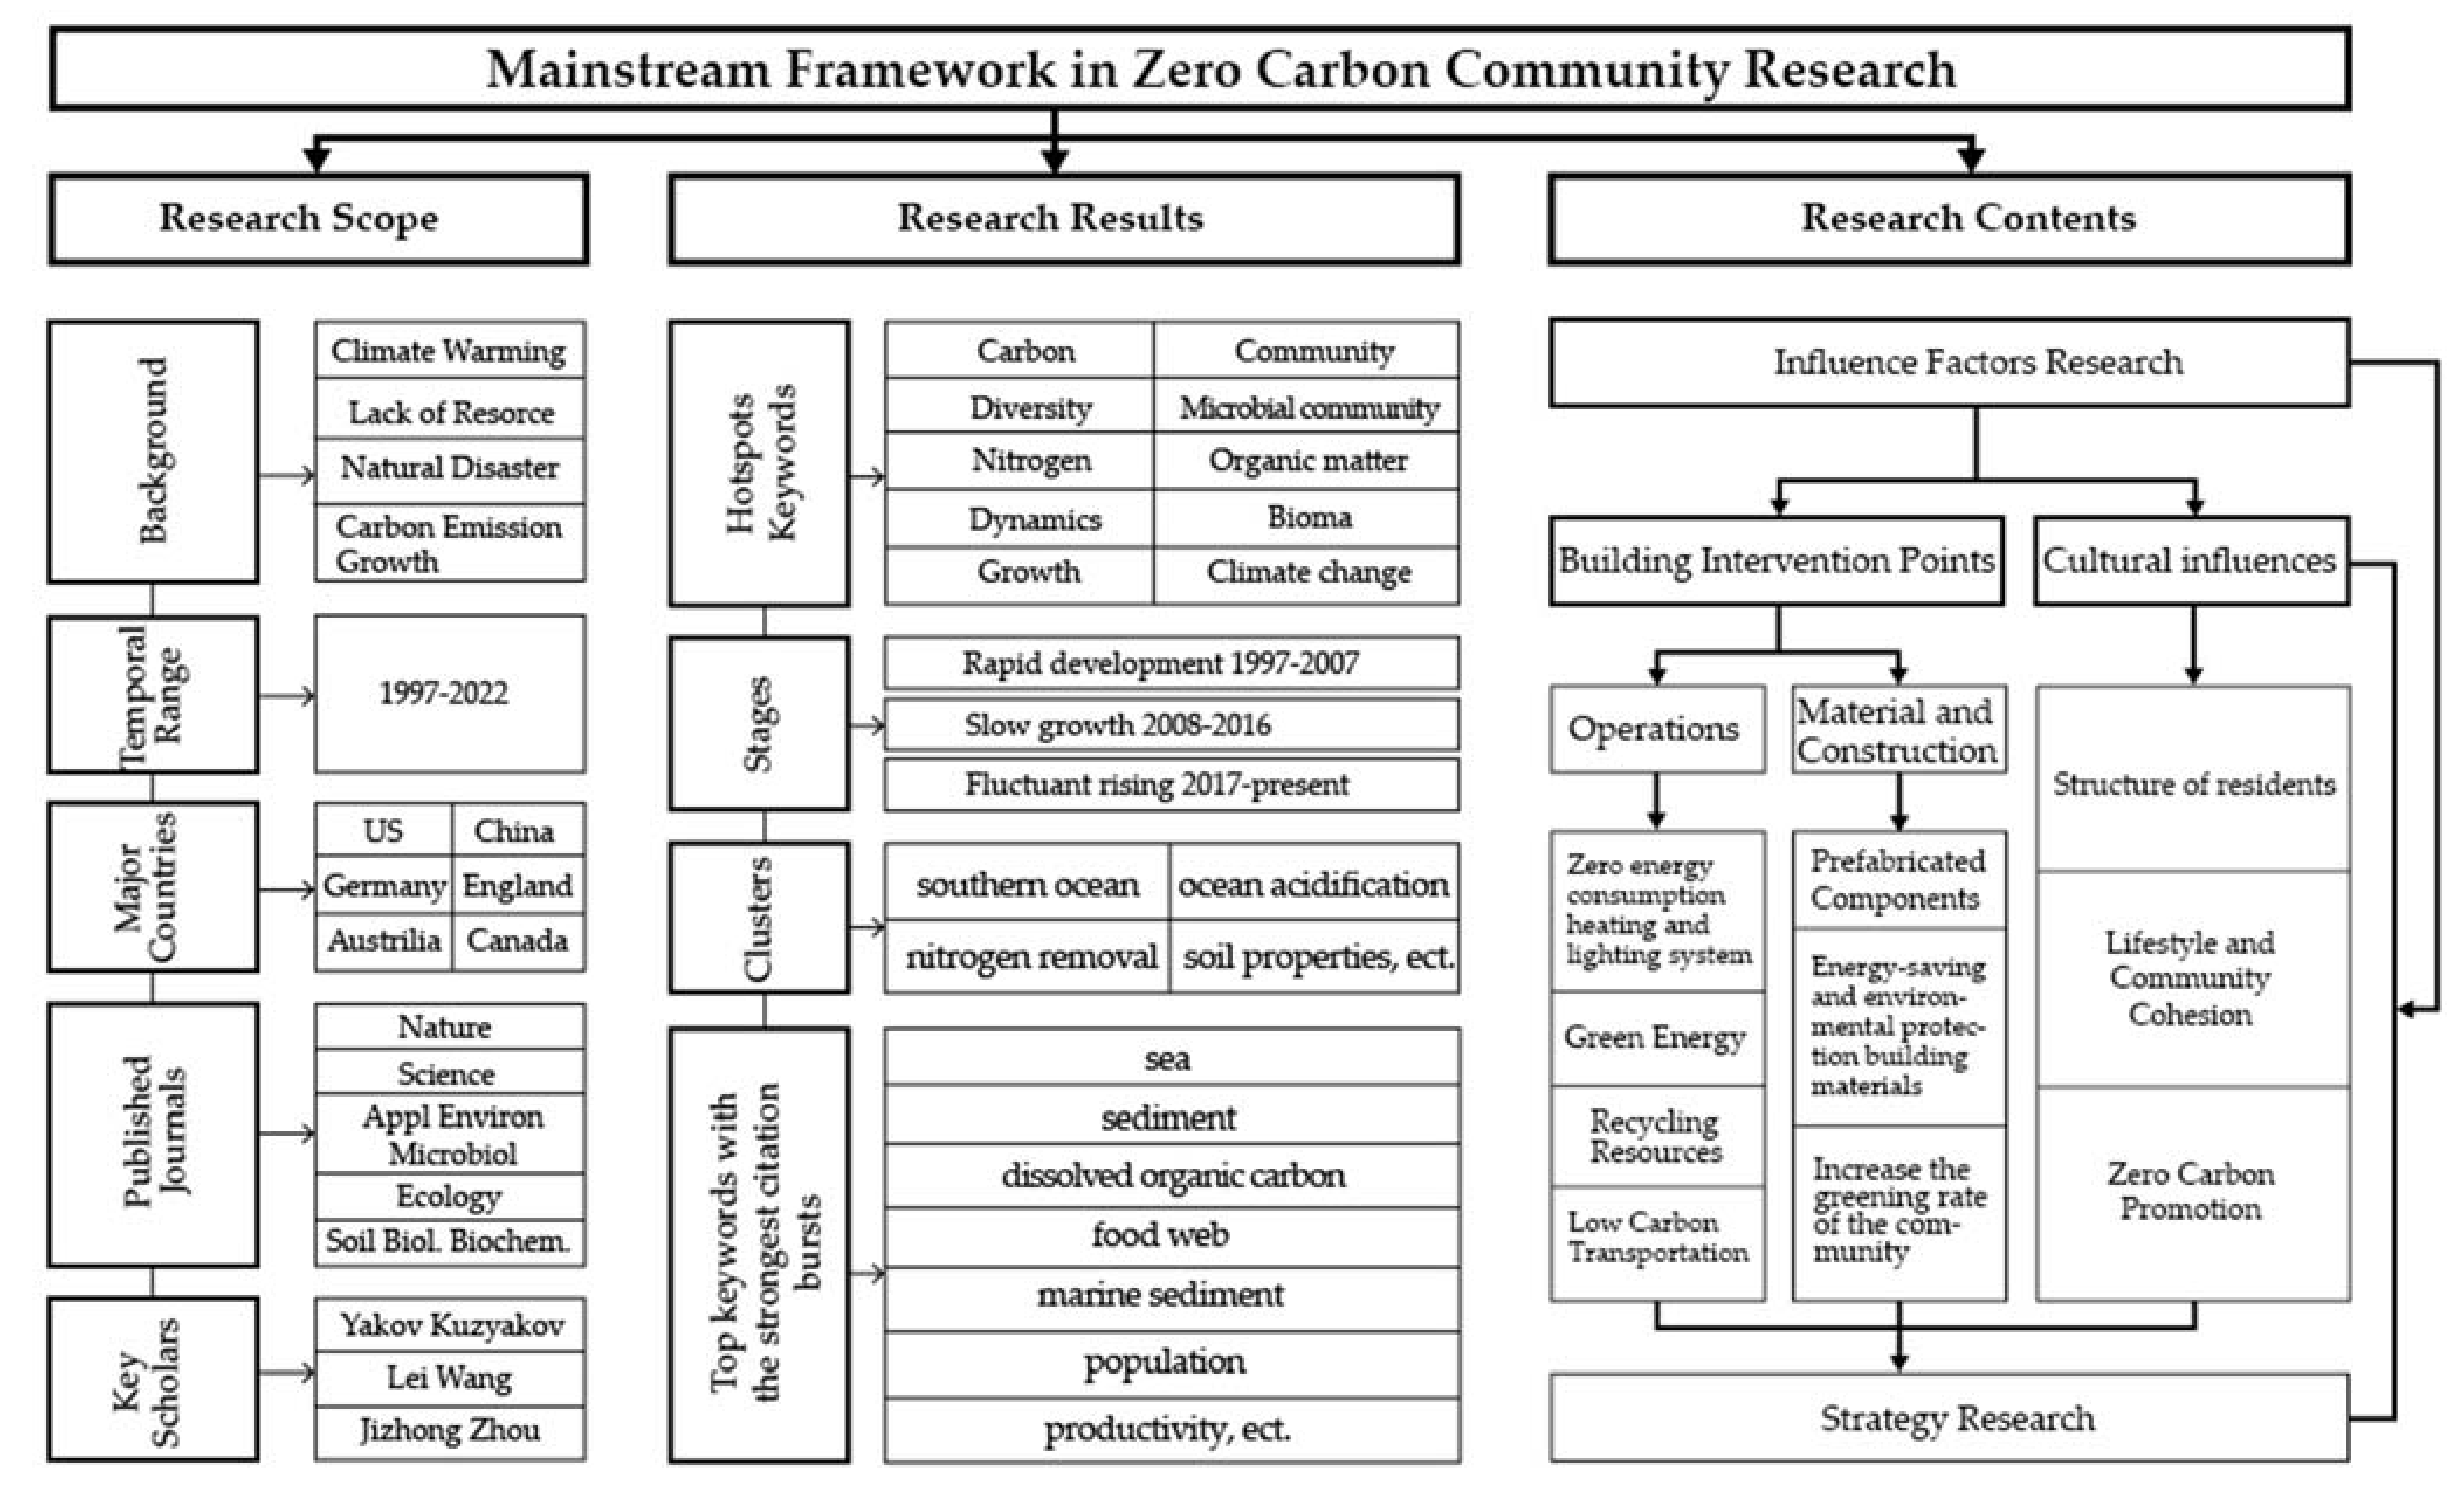
ZCCs are achieved by addressing carbon emissions from the building construction process and building materials, reducing carbon emissions from building operations, and raising awareness of ZCCs among community users, as shown in Figure 12. During the process of building communities, we can take strategies, such as prefabricated components, energy savings, and environmental protection building materials, and increase the greening rate of the community. During the operation of the community, it is possible to take the zero energy consumption heating and lighting system, green energy, recycling resources, and low-carbon transportation as zero-carbon strategies. By changing the structure of residents, lifestyle and community cohesion, and zero-carbon promotion, ZCCs can be achieved.
In this research, a common feature of the spatial structure of low-carbon cities is a multicore urban spatial structure with a reasonable density in combination with public transport corridors, but a reasonable urban density cannot be quantified. How do systems building and managing public transport and reducing the reliance on private cars play an essential role in limiting carbon emissions in urban transport, and how can transport management strategies play a role? How can urban planning increase the priority of public transport, nonmotorized transport, and walking? How can the close interaction between places be guaranteed while reducing dependence on small cars? How can an urban public transport system that is compatible with the city’s spatial structure and functional layout be built? These are all questions that need to be explored. Many countries and regions worldwide are designing LCCs and ZCCs for urban communities and monolithic buildings. However, most LCCs and ZCCs are still at the level of pilot projects, publicity, and theoretical research. They are still a long way from being promoted and popularized on a large scale. Concerning the diffusion and innovation of low-carbon technologies, the use of new energy sources and the diffusion and use of renewable technologies are conducive to the construction of low-carbon cities. The implementation mechanism of low-carbon city construction and its implementation, operation, and subsequent maintenance still need to be explored. In addition, there are still many issues to be studied in terms of management and implementation procedures.
In this paper, the WoS core database was selected for its research methodology. Other databases, such as CNYK, were not considered, and consequently, the data richness will be somewhat lacking. In addition, the terms LCC and ZCC are used as keywords to find articles in which the main subject of study is a community. Nevertheless, the main subject of most of the indexed articles are low-carbon buildings, zero-carbon buildings, low-carbon cities, and zero-carbon cities. The LCC and ZCC are extensions of the building and are local to the city, so there may be uncertainty in the scope of the study. According to the research on LCCs and ZCCs, with the progress of science and the needs of society, LCCs will gradually be transformed into ZCCs, and research will be carried out to achieve the research direction of zero net carbon, as proposed in COP27.
5. Conclusions
By using CiteSpace to analyze a large amount of the literature in the WoS core database, the author composes the dynamic changes in the development of green building and urban design from the perspective of LCCs and ZCCs. The overall results of the analysis show that the LCC and ZCC construction practices and policy effectiveness evaluation methods are becoming clearer and focusing on more specific green building technology tools and urban design strategies at a larger level.
In terms of research progress, the research heat in the LCC and ZCC fields is increasing year by year, and the journals are distributed across a wide range of disciplinary types. The major regional cooperation distribution of publications formed different groups between countries and not-so-close cooperation between groups, but there is still room for deeper cooperation. There are inextricable ties between the authors of the publications and their institutions and closer ties between scholars, suggesting close cooperation between scholars and their institutions in today’s globalized development. In terms of hot keywords, the research within the field of LCCs and ZCCs is more extensive, and there is still a high level of research fervor for the buzzwords that began to appear in 1997. In terms of development hotspots, LCCs and ZCCs, as one of the focuses of global climate change research, are in an essential position in the strategy to address global climate change, including the development of national low-carbon growth plans, low-carbon city construction under the leadership of information technology, and low-carbon city construction under new energy technologies. As a hot issue in urban design research, low-carbon cities have been discussed in terms of the relationship between climate change and carbon emissions, the connotation of low-carbon cities, spatial structures, development strategies, specific practices, etc. The conclusions formed are essential for guiding the construction of low-carbon cities. Low-carbon cities consist of LCCs. The study of LCCs and further exploration of ZCCs can help propose practical solutions to the development of the definition of ZCCs and the regulations for the public.
Author Contributions
J.Z. developed the research topic; Y.Z. prepared the writing—original draft; J.Z. and S.K. were responsible for the writing—review and editing. All the authors contributed to reviewing the paper. All authors have read and agreed to the published version of the manuscript.
Funding
This research received no external funding.
Institutional Review Board Statement
Not applicable.
Informed Consent Statement
Not applicable.
Data Availability Statement
Not applicable.
Conflicts of Interest
The authors declare no conflict of interest.
Nomenclature
| Acronyms | Original |
| BREEAM | Introduction to the Building Research Establishment Environmental Assessment Method |
| CASBEE | Comprehensive Assessment System for Building Environmental Efficiency |
| GHG | Greenhouse gas emissions |
| HQE | High Quality Environment |
| LCC | Low-carbon community |
| LCCC | Low Carbon Communities Challenge |
| LEED | Leadership in Energy and Environmental Design |
| WoS | Web of Science |
| ZCC | Zero-carbon community |
References
- Condon, P.M.; Cavens, D.; Miller, N. Urban Planning Tools for Climate Change Mitigation; Lincoln Institute of Land Policy: Cambridge, MA, USA, 2009. [Google Scholar]
- Ostrom, E. A polycentric approach for coping with climate change. Ann. Econ. Financ. 2014, 15, 97–134. [Google Scholar]
- Rogelj, J.; Luderer, G.; Pietzcker, R.C.; Kriegler, E.; Schaeffer, M.; Krey, V.; Riahi, K. Energy system transformations for limiting end-of-century warming to below 1.5 C. Nat. Clim. Chang. 2015, 5, 519–527. [Google Scholar] [CrossRef]
- Ahmed, N.; Abdel-Hamid, M.; Abd El-Razik, M.M.; El-Dash, K.M. Impact of sustainable design in the construction sector on climate change. Ain Shams Eng. J. 2021, 12, 1375–1383. [Google Scholar] [CrossRef]
- Zhou, N.; Levine, M.D.; Price, L. Overview of current energy-efficiency policies in China. Energy Policy 2010, 38, 6439–6452. [Google Scholar] [CrossRef]
- Verkerk, P.; Hassegawa, M.; Van Brusselen, J.; Cramm, M.; Chen, X.; Imparato Maximo, Y.; Koç, M. Forest Products in the Global Bioeconomy: Enabling Substitution by Wood-Based Products and Contributing to the Sustainable Development Goals; Food & Agriculture Org.: Rome, Italy, 2021. [Google Scholar]
- Bulkeley, H. Cities and Climate Change; Routledge: London, UK, 2013. [Google Scholar]
- Xia, C.; Li, Y.; Ye, Y.; Shi, Z.; Liu, J. Decomposed driving factors of carbon emissions and scenario analyses of low-carbon transformation in 2020 and 2030 for Zhejiang Province. Energies 2017, 10, 1747. [Google Scholar] [CrossRef] [Green Version]
- Geels, F.W. A socio-technical analysis of low-carbon transitions: Introducing the multi-level perspective into transport studies. J. Transp. Geogr. 2012, 24, 471–482. [Google Scholar] [CrossRef]
- Jonas, A.E.; Gibbs, D.; While, A. The new urban politics as a politics of carbon control. Urban Stud. 2011, 48, 2537–2554. [Google Scholar] [CrossRef]
- Abubakar, I.R.; Bununu, Y.A. Low carbon city: Strategies and case studies. Sustain. Cities Communities 2020, 366–376. [Google Scholar] [CrossRef]
- Davies, J.; Dolci, F.; Klassek-Bajorek, D.; Ortiz Cebolla, R.; Weidner, E. Current Status of Chemical Energy Storage Technologies; Publications Office of the European Union: Luxembourg, 2020. [Google Scholar]
- Caprotti, F. Eco-Cities and the Transition to Low Carbon Economies; Springer: Berlin/Heidelberg, Germany, 2014. [Google Scholar]
- Lv, Y.; Bi, J.; Yan, J. State-of-the-art in low carbon community. Int. J. Energy Clean Environ. 2018, 19, 175–200. [Google Scholar] [CrossRef]
- Rydin, Y. Governing for Sustainable Urban Development; Routledge: London, UK, 2012. [Google Scholar]
- Powers, A. A Literature Survey and Qualitative Analysis on Work-from-Home Research before and during the COVID-19 Pandemic; University of California: Irvine, CA, USA, 2021. [Google Scholar]
- Tian, J.; Yu, L.; Xue, R.; Zhuang, S.; Shan, Y. Global low-carbon energy transition in the post-COVID-19 era. Appl. Energy 2022, 307, 118205. [Google Scholar] [CrossRef]
- Zhang, Y.; Wang, J.; Hu, F.; Wang, Y. Comparison of evaluation standards for green building in China, Britain, United States. Renew. Sustain. Energy Rev. 2017, 68, 262–271. [Google Scholar] [CrossRef]
- Ding, Z.; Fan, Z.; Tam, V.W.; Bian, Y.; Li, S.; Illankoon, I.C.S.; Moon, S. Green building evaluation system implementation. Build. Environ. 2018, 133, 32–40. [Google Scholar] [CrossRef]
- Cheng, W.; Sodagar, B.; Sun, F. Comparative analysis of environmental performance of an office building using BREEAM and GBL. Urban Regen. Sustain. 2017, 172–184. [Google Scholar] [CrossRef] [Green Version]
- Cordero, A.S.; Melgar, S.G.; Márquez, J.M.A. Green building rating systems and the new framework level(s): A critical review of sustainability certification within Europe. Energies 2019, 13, 66. [Google Scholar] [CrossRef] [Green Version]
- Bodansky, D.; Brunnée, J.; Rajamani, L. International Climate Change Law; Oxford University Press: Oxford, UK, 2017. [Google Scholar]
- González, C.I.; Núñez, S. Markets, financial institutions and central banks in the face of climate change: Challenges and opportunities. Banco Esp. Occas. Pap. 2021, 2621. [Google Scholar]
- Abdullah, H.; Robles, E.S. Urban Mobility after COVID-19. Long-Term Strateg. Sustain. Mobil. Transit. Eur. Cities 2021, 82, 64–66. [Google Scholar]
- Agreement, P. Paris agreement. In Proceedings of the Report of the Conference of the Parties to the United Nations Framework Convention on Climate Change (21st Session, 2015: Paris), Paris, France, 30 November–13 December 2015. [Google Scholar]
- Haines, A.; Scheelbeek, P. European Green Deal: A major opportunity for health improvement. Lancet 2020, 395, 1327–1329. [Google Scholar] [CrossRef]
- Zhou, Z. China Launches New Urbanisation Plan (2014–2020). East Asian Policy 2014, 6, 5–19. [Google Scholar] [CrossRef] [Green Version]
- Lockwood, M. The political sustainability of climate policy: The case of the UK Climate Change Act. Glob. Environ. Chang. 2013, 23, 1339–1348. [Google Scholar] [CrossRef] [Green Version]
- Chance, T. Towards sustainable residential communities; the Beddington Zero Energy Development (BedZED) and beyond. Environ. Urban. 2009, 21, 527–544. [Google Scholar] [CrossRef]
- Beveridge, R.; Ridgway, M.; Kern, K.; Stroia, C.; Fujiwara, N.; Dupas, S.; Sterzel, T. Leading mid-sized EU cities in post-carbon transitions: Towards a preliminary typology. Sustainability 2015, 7, 1–20. [Google Scholar] [CrossRef]
- Pandis Iverot, S.; Brandt, N. The development of a sustainable urban district in Hammarby Sjöstad, Stockholm, Sweden? Environ. Dev. Sustain. 2011, 13, 1043–1064. [Google Scholar] [CrossRef]
- Power, A.; Smyth, K. Heritage, health and place: The legacies of local community-based heritage conservation on social wellbeing. Health Place 2016, 39, 160–167. [Google Scholar] [CrossRef] [PubMed] [Green Version]
- Zhang, L.; Li, Q.; Zhou, J. Critical factors of low-carbon building development in China’s urban area. J. Clean. Prod. 2017, 142, 3075–3082. [Google Scholar] [CrossRef]
- Sheppard, S.R.; Shaw, A.; Flanders, D.; Burch, S.; Wiek, A.; Carmichael, J.; Robinson, J.; Cohen, S. Future visioning of local climate change: A framework for community engagement and planning with scenarios and visualisation. Futures 2011, 43, 400–412. [Google Scholar] [CrossRef]
- Yang, Y.; Meng, G. A bibliometric analysis of comparative research on the evolution of international and Chinese ecological footprint research hotspots and frontiers since 2000. Ecol. Indic. 2019, 102, 650–665. [Google Scholar] [CrossRef]
- Birkle, C.; Pendlebury, D.A.; Schnell, J.; Adams, J. Web of Science as a data source for research on scientific and scholarly activity. Quant. Sci. Stud. 2020, 1, 363–376. [Google Scholar] [CrossRef]
- Jäger-Waldau, A. PV Status Report 2019; Publications Office of the European Union: Luxembourg, Luxembourg, 2019. [Google Scholar]
- Dou, X. The essence, feature and role of low carbon economy. Environ. Dev. Sustain. 2015, 17, 123–136. [Google Scholar] [CrossRef]
- Zhang, J.; Cenci, J.; Becue, V.; Koutra, S.; Ioakimidis, C.S. Recent Evolution of Research on Industrial Heritage in Western Europe and China Based on Bibliometric Analysis. Sustainability 2020, 12, 5348. [Google Scholar] [CrossRef]
- Li, H.; An, H.; Wang, Y.; Huang, J.; Gao, X. Evolutionary features of academic articles co-keyword network and keywords co-occurrence network: Based on two-mode affiliation network. Phys. A Stat. Mech. Its Appl. 2016, 450, 657–669. [Google Scholar] [CrossRef]
- Wu, C.; Cenci, J.; Wang, W.; Zhang, J. Resilient City: Characterization, Challenges and Outlooks. Buildings 2022, 12, 516. [Google Scholar] [CrossRef]
- Flanagan, L.B.; Cook, C.S.; Ehleringer, J.R. Unusually low carbon isotope ratios in plants from hanging gardens in southern Utah. Oecologia 1997, 111, 481–489. [Google Scholar] [CrossRef] [PubMed]
- Energy-Efficient, I.W.G.o.; Technologies, L.-C. Scenarios of US Carbon Reductions: Potential Impacts of Energy Technologies by 2010 and Beyond; Office of Energy Efficiency and Renewable Energy, US Department of Energy: Washington, DC, USA, 1997.
- Voss, K.; Musall, E. Net zero energy buildings. In Net Zero Energy Buildings; Detail: München, Germany, 2012. [Google Scholar]
- Xie, P. Study of international anticancer research trends via co-word and document co-citation visualization analysis. Scientometrics 2015, 105, 611–622. [Google Scholar] [CrossRef]
- Ding, X.; Yang, Z. Knowledge mapping of platform research: A visual analysis using VOSviewer and CiteSpace. Electron. Commer. Res. 2020, 1, 1–23. [Google Scholar] [CrossRef]
- Nejat, P.; Jomehzadeh, F.; Taheri, M.M.; Gohari, M.; Majid, M.Z.A. A global review of energy consumption, CO2 emissions and policy in the residential sector (with an overview of the top ten CO2 emitting countries). Renew. Sustain. Energy Rev. 2015, 43, 843–862. [Google Scholar] [CrossRef]
- Li, J.; Goerlandt, F.; Reniers, G. An overview of scientometric mapping for the safety science community: Methods, tools, and framework. Saf. Sci. 2021, 134, 105093. [Google Scholar] [CrossRef]
- Su, X.; Li, X.; Kang, Y. A bibliometric analysis of research on intangible cultural heritage using CiteSpace. Sage Open 2019, 9, 2158244019840119. [Google Scholar] [CrossRef] [Green Version]
- Cui, Y.; Mou, J.; Liu, Y. Knowledge mapping of social commerce research: A visual analysis using CiteSpace. Electron. Commer. Res. 2018, 18, 837–868. [Google Scholar] [CrossRef]
- Qi, S.; Hua, F.; Zhou, Z.; Shek, D.T. Trends of positive youth development publications (1995–2020): A scientometric review. Appl. Res. Qual. Life 2020, 17, 421–446. [Google Scholar] [CrossRef]
- Wang, W.; Lu, C. Visualization analysis of big data research based on Citespace. Soft Comput. 2020, 24, 8173–8186. [Google Scholar] [CrossRef]
- Liu, H.; Chen, H.; Hong, R.; Liu, H.; You, W. Mapping knowledge structure and research trends of emergency evacuation studies. Saf. Sci. 2020, 121, 348–361. [Google Scholar] [CrossRef]
- Xie, H.; Zhang, Y.; Zeng, X.; He, Y. Sustainable land use and management research: A scientometric review. Landsc. Ecol. 2020, 35, 2381–2411. [Google Scholar] [CrossRef]
- Li, X.; Ma, E.; Qu, H. Knowledge mapping of hospitality research—A visual analysis using CiteSpace. Int. J. Hosp. Manag. 2017, 60, 77–93. [Google Scholar] [CrossRef]
- Vasanen, A. Functional polycentricity: Examining metropolitan spatial structure through the connectivity of urban sub-centres. Urban Stud. 2012, 49, 3627–3644. [Google Scholar] [CrossRef]
- Salat, S.; Ollivier, G. Transforming the urban space through transit-oriented development. World Bank: Washington, DC, USA, 2017. [Google Scholar]
- Zhao, X.; Ma, X.; Chen, B.; Shang, Y.; Song, M. Challenges toward carbon neutrality in China: Strategies and countermeasures. Resour. Conserv. Recycl. 2022, 176, 105959. [Google Scholar] [CrossRef]
- Long, H.; Zhang, Y.; Ma, L.; Tu, S. Land use transitions: Progress, challenges and prospects. Land 2021, 10, 903. [Google Scholar] [CrossRef]
- Zhao, R.; Wu, D.; Patti, S. A bibliometric analysis of carbon labeling schemes in the Period 2007–2019. Energies 2020, 13, 4233. [Google Scholar] [CrossRef]
Figure 1.
Outline of ZCC research design.

Figure 2.
Distribution of annual publication outputs in the ZCC field from 1997 to 2022.

Figure 3.
Knowledge map of co-journals of papers published on ZCC from 1997–2022.

Figure 4.
Knowledge map of cooperative countries in the research on the ZCC during 1997–2022.

Figure 5.
Knowledge map of co-authors of papers published on ZCC from 1997–2022.

Figure 6.
Knowledge map of cooperative institutions in the research on ZCC during 1997–2022.

Figure 7.
Co-occurrence network of research subjects.

Figure 8.
Clustering map of keywords of the papers on ZCC during 1997–2022.

Figure 10.
Cocitation network and clusters of the papers on ZCC during 1997–2022.

Figure 11.
Timeline map of ZCC research from 1997–2022.

Figure 12.
Mainstream framework in ZCC research.

Table 1.
Policies of climate change in different countries.
| Country/Publication Organization | Name | Released Time | Goals |
|---|---|---|---|
| United Nations | The Paris Agreement | 4 November 2016 | The long-term goal is to limit the increase in global average temperature to less than 2 °C compared to the preindustrial period and to work toward limiting the temperature increase to less than 1.5 °C |
| European Union | The European Green Deal | 11 December 2019 | No net GHG emissions by 2050. Economic growth decoupled from resource use. In addition to it will include all countries and all peoples. |
| China | National Plan to Climate Change (2014–2020) | 25 November 2014 | To draw on the experience of the construction of international carbon emissions trading markets, combined with China’s national conditions, and gradually establish China’s carbon emissions trading market. |
| U.K. | Climate Change Act | 16 October 2008 | The Act would mandate an 80% cut overall in six greenhouse gases by 2050. |
Table 2.
Research of Existing LCC Projects.
| Country | Name | Features |
|---|---|---|
| U.K. | Beddington Community | World’s first eco-village with renewable energy that realized the concept of zero-carbon emission. |
| Germany | Vauban Community | High spatial quality of street spaces and zero-carbon emissions. |
| Sweden | Hammarby Community | Low energy consumption, high levels of recycling, and in harmony with the natural environment, focusing on public participation. |
| Sweden | Växjö Community | Biomass energy center, low-carbon building. |
| Netherlands | Ecologia Community | First eco-energy demonstration district in the Netherlands with low-carbon buildings. |
| Denmark | Sun & Wind Community | Residents build on their initiative, using solar and wind energy. |
Table 3.
Major research journals in the field of LCC and ZCC from 1997–2022.
| No. | Freq | Centrality | Cited Journals | First Cited Year |
|---|---|---|---|---|
| 1 | 8771 | 0.06 | Nature | 1997 |
| 2 | 8167 | 0.13 | Science | 1997 |
| 3 | 7244 | 0.93 | Applied and Environmental Microbiology | 1997 |
| 4 | 6183 | 0.39 | Ecology | 1997 |
| 5 | 6112 | 1.16 | Soil Biology & Biochemistry | 1997 |
| 6 | 5921 | 0 | Proceedings of the National Academy of Sciences of the United States of America | 1998 |
| 7 | 5453 | 0.85 | Limnology and Oceanography | 1997 |
| 8 | 4717 | 0.54 | Global Change Biology | 1997 |
| 9 | 4703 | 0 | PLOS One | 2009 |
| 10 | 4608 | 0.13 | FEMS Microbiology Ecology | 1997 |
Table 4.
List of contributing countries and number of records contributed.
| Rank | Country | Numbers of Articles | Centrality | Year of First Publication |
|---|---|---|---|---|
| 1 | US | 5741 | 1.03 | 1997 |
| 2 | China | 4180 | 0.01 | 2006 |
| 3 | Germany | 1569 | 0.06 | 2005 |
| 4 | England | 1123 | 0.07 | 1997 |
| 5 | Australia | 1111 | 0.03 | 2004 |
| 6 | Canada | 1085 | 0.03 | 2000 |
| 7 | France | 880 | 0.08 | 2005 |
| 8 | Spain | 805 | 0.05 | 2007 |
| 9 | Netherlands | 564 | 0.04 | 2005 |
| 10 | Italy | 539 | 0.02 | 2002 |
Table 5.
Top 10 productive authors in the ZCC field during 1997–2022.
| Rank | Publication | Centrality | Year | Author | Institution | Country |
|---|---|---|---|---|---|---|
| 1 | 44 | 0.02 | 2013 | Yakov Kuzyakov | Georg August University of Göttingen | Germany |
| 2 | 34 | 0 | 2012 | Lei Wang | Technische Universität Dresden | Germany |
| 3 | 33 | 0.02 | 2009 | Jizhong Zhou | University of Oklahoma | U.S. |
| 4 | 30 | 0 | 2016 | Yongzhen Peng | Beijing University of Technology | China |
| 5 | 23 | 0.01 | 2011 | Davey L Jones | Murdoch University | Australia |
| 6 | 21 | 0.01 | 2020 | Yang Liu | National University of Singapore | Portugal |
| 7 | 20 | 0 | 2017 | Wei Zhang | Guangzhou University | China |
| 7 | 20 | 0 | 2015 | Hui Wang | National Institute of Clean-and-Low-Carbon Energy | China |
| 8 | 18 | 0 | 2013 | Stefan Scheu | Georg August University of Göttingen | Germany |
| 8 | 18 | 0 | 2017 | Tida Ge | The Chinese Academy of Sciences | China |
| 8 | 18 | 0 | 2017 | Yang | South China University of Technology | China |
| 9 | 17 | 0 | 2015 | Qian Zhang | Queen’s University | Canada |
| 9 | 17 | 0 | 2016 | Guobin Liu | Chinese Academy of Sciences and Ministry of Water Resources | China |
| 10 | 16 | 0 | 2017 | Jinshui Wu | The Chinese Academy of Sciences | China |
| 10 | 16 | 0 | 2011 | Petra Marschner | University of Adelaide | Australia |
| 10 | 16 | 0 | 2006 | Josep M Gasol | Institut de Ciències del Mar | Spain |
Table 6.
Contributing institutions by frequency and centrality.
| Rank | Freq | Year | Institution | Rank | Centrality | Year | Institution |
|---|---|---|---|---|---|---|---|
| 1 | 1317 | 2002 | Chinese Academy of Sciences | 1 | 0.1 | 2002 | Chinese Academy of Sciences |
| 2 | 491 | 2013 | University of the Chinese Academy of Sciences | 2 | 0.04 | 2001 | The French National Center for Scientific Research |
| 3 | 230 | 1998 | Consejo Superior de Investigaciones Científicas | 3 | 0.04 | 1998 | Univ Paris 06 |
| 4 | 196 | 1998 | Univ Copenhagen | 4 | 0.03 | 1998 | Consejo Superior de Investigaciones Científicas |
| 5 | 192 | 1999 | Russian Acad Sci | 5 | 0.03 | 1998 | Univ Copenhagen |
| 6 | 173 | 2000 | Univ Washington | 6 | 0.03 | 2000 | Univ Washington |
| 7 | 172 | 1998 | Swedish Univ Agr Sci | 7 | 0.03 | 1998 | Univ Calif Berkeley |
| 8 | 168 | 1999 | Aarhus Univ | 8 | 0.03 | 1998 | Univ Calif Davis |
| 9 | 166 | 1998 | Oregon State Univ | 9 | 0.03 | 1999 | Univ Helsinki |
| 10 | 161 | 2002 | US Geol Survey | 10 | 0.03 | 1998 | Texas A&M Univ |
Table 7.
List of the most influential categories.
| No. | Freq | Centrality | Year | WoS Categories |
|---|---|---|---|---|
| 1 | 716 | 0.51 | 2001 | Social Science Citation Index |
| 2 | 327 | 0.24 | 1997 | Conference Proceeding Citation Index—Science |
| 3 | 1360 | 0.21 | 1997 | Engineering |
| 4 | 98 | 0.21 | 1997 | Science Citation Index Expanded |
| 5 | 440 | 0.15 | 2000 | Chemistry |
| 6 | 179 | 0.12 | 1997 | Biochemistry and Molecular Biology |
| 6 | 139 | 0.12 | 2002 | Public, Environmental and Occupational Health |
| 7 | 8180 | 0.1 | 1997 | Environmental Science and Ecology |
| 8 | 114 | 0.08 | 2004 | Environmental Studies |
| 9 | 184 | 0.07 | 1998 | Materials Science |
| 9 | 19 | 0.07 | 2007 | Computer Science |
| 10 | 3031 | 0.06 | 1997 | Agriculture |
| 10 | 1170 | 0.06 | 1997 | Science and Technology—Other Topics |
| s10 | 127 | 0.06 | 2002 | Business and Economics |
Table 8.
Highly cited references on ZCCs.
| No | Article Title | Times Cited | Impact Factor | Publication Year | Research Areas |
|---|---|---|---|---|---|
| 1 | Thermal properties of graphene and nanostructured carbon materials | 4079 | 43.841 | 2011 | Chemistry; Material Science; Physics |
| 2 | Bounding the role of black carbon in the climate system: A scientific assessment | 3189 | 4.261 | 2013 | Meteorology and Atmospheric Sciences |
| 3 | Global fire emissions and the contribution of deforestation, savanna, forest, agricultural, and peat fires (1997–2009) | 1821 | 6.133 | 2010 | Environmental Sciences and Ecology; Meteorology and Atmospheric Sciences |
| 4 | Thermal conductivity of carbon nanotubes and their polymer nanocomposites: A review | 1647 | 29.19 | 2011 | Polymer Science |
| 5 | Community structure and metabolism through reconstruction of microbial genomes from the environment | 1562 | 49.962 | 2004 | Science and Technology—Other Topics |
| 6 | Gap filling strategies for defensible annual sums of net ecosystem exchange | 1492 | 5.734 | 2001 | Agriculture; Forestry; Meteorology and Atmospheric Sciences |
| 7 | Defining the core Arabidopsis thaliana root microbiome | 1420 | 49.962 | 2012 | Science and Technology—Other Topics |
| 8 | The Community Earth System Model. A Framework for Collaborative Research | 1402 | 8.766 | 2013 | Meteorology and Atmospheric Sciences |
| 9 | Nutritional constraints in terrestrial and freshwater food webs | 1357 | 49.962 | 2000 | Science and Technology—Other Topics |
| 10 | Potential mechanisms for achieving agricultural benefits from biochar application to temperate soils: a review | 1342 | 4.192 | 2010 | Agriculture; Plant Sciences |
| 11 | Three Genomes from the Phylum Acidobacteria Provide Insight into the Lifestyles of These Microorganisms in Soils | 1222 | 4.792 | 2009 | Biotechnology and Applied Microbiology; Microbiology |
| 12 | Variations in microbial community composition through two soil depth profiles | 1203 | 7.609 | 2003 | Agriculture |
| 13 | Vegetation and soil respiration: Correlations and controls | 1120 | 4.825 | 2000 | Environmental Sciences and Ecology; Geology |
| 14 | Long-term air pollution exposure and cardio-respiratory mortality: a review | 1068 | 5.984 | 2013 | Environmental Sciences and Ecology; Public, Environmental and Occupational Health |
| 15 | Parameterization Improvements and Functional and Structural Advances in Version 4 of the Community Land Model | 1015 | 6.66 | 2011 | Meteorology and Atmospheric Sciences |
| 16 | Assessing agricultural risks of climate change in the 21st century in a global gridded crop model intercomparison | 994 | 11.205 | 2014 | Science and Technology—Other Topics |
| 17 | Impacts of carbon and flooding on soil microbial communities: Phospholipid fatty acid profiles and substrate utilization patterns | 986 | 4.552 | 1998 | Environmental Sciences and Ecology; Marine and Freshwater Biology; Microbiology |
| 18 | Akkermansia muciniphila gen. nov., sp nov., a human intestinal mucin-degrading bacterium | 985 | 2.747 | 2004 | Microbiology |
| 19 | Volcanic carbon dioxide vents show ecosystem effects of ocean acidification | 978 | 49.962 | 2008 | Science and Technology—Other Topics |
| 20 | Indoor air quality and health | 959 | 4.798 | 1999 | Environmental Sciences and Ecology; Meteorology and Atmospheric Sciences |
Table 9.
List of keyword co-occurrence.
| No. | Freq | Centrality | Year | Keyword |
|---|---|---|---|---|
| 1 | 3626 | 0.09 | 1997 | Carbon |
| 2 | 2497 | 0.1 | 1997 | Community |
| 3 | 2035 | 0.09 | 1997 | Diversity |
| 4 | 1828 | 0.08 | 1997 | Microbial community |
| 5 | 1802 | 0.06 | 1997 | Nitrogen |
| 6 | 1562 | 0.05 | 1997 | Organic matter |
| 7 | 1433 | 0.04 | 1997 | Dynamics |
| 8 | 1327 | 0.05 | 1997 | Bioma |
| 9 | 1261 | 0.11 | 1997 | Growth |
| 10 | 1223 | 0.03 | 1997 | Climate change |
Table 11.
List of cited clusters and number of records contributed.
| ClusterID | Size | Silhouette | Year | Label (LLR) |
|---|---|---|---|---|
| 0 | 52 | 0.707 | 1998 | Southern Ocean (30,802.41, 0.0001); food web structure (28,797.34, 0.0001); benthic communities (28,726.63, 0.0001); carbon flow (23,325.53, 0.0001); stable carbon (20,392.16, 0.0001) |
| 1 | 34 | 0.694 | 2005 | nitrogen removal (39,937.44, 0.0001); sequencing batch reactor (33,988.04, 0.0001); bacterial community (33,695.03, 0.0001); microbial fuel cell (33,663.47, 0.0001); microbial community analysis (31,675.99, 0.0001) |
| 2 | 33 | 0.797 | 2002 | soil properties (23,136.05, 0.0001); carbon source (22,352.02, 0.0001); nitrogen removal (21,101.67, 0.0001); elevated atmospheric co2 (19,767.66, 0.0001); biological activity (19,318.24, 0.0001) |
| 3 | 29 | 0.768 | 2000 | ocean acidification (67,925.27, 0.0001); elevated co2 (63,428.34, 0.0001); elevated atmospheric co2 (35,115.82, 0.0001); elevated temperature (26,007.4, 0.0001); ecosystem functioning (17,841.17, 0.0001) |
| 4 | 22 | 0.698 | 1997 | water velocity (3415.31, 0.0001); microbial communities (2973.5, 0.0001); lake erie (2748.74, 0.0001); thau lagoon (2618.75, 0.0001); benthic fauna (2526.38, 0.0001) |
| 5 | 2 | 0.973 | 2002 | sulfate-reducing bacteria (605.8, 0.0001); aerobic organic carbon mineralization (330.26, 0.0001); oxygen-saturated photic zone (330.26, 0.0001); soil microbial community responses (311.92, 0.0001); organic carbon substrate (311.92, 0.0001) |
Table 12.
Top 25 keywords with the strongest citation bursts during 1997–2022.
| Keywords | Year | Strength | Begin | End | 1997–2022 |
|---|---|---|---|---|---|
| dissolved organic carbon | 1997 | 49.56 | 1999 | 2015 | ▂▂▃▃▃▃▃▃▃▃▃▃▃▃▃▃▃▃▃▂▂▂▂▂▂▂ |
| sediment | 1997 | 30.82 | 1997 | 2012 | ▃▃▃▃▃▃▃▃▃▃▃▃▃▃▃▃▂▂▂▂▂▂▂▂▂▂ |
| sea | 1997 | 46.56 | 1997 | 2011 | ▃▃▃▃▃▃▃▃▃▃▃▃▃▃▃▂▂▂▂▂▂▂▂▂▂▂ |
| food web | 1997 | 36.56 | 1998 | 2012 | ▂▃▃▃▃▃▃▃▃▃▃▃▃▃▃▃▂▂▂▂▂▂▂▂▂▂ |
| marine sediment | 1997 | 38.37 | 1997 | 2010 | ▃▃▃▃▃▃▃▃▃▃▃▃▃▃▂▂▂▂▂▂▂▂▂▂▂▂ |
| population | 1997 | 50.05 | 1997 | 2009 | ▃▃▃▃▃▃▃▃▃▃▃▃▃▂▂▂▂▂▂▂▂▂▂▂▂▂ |
| nutrient | 1997 | 33.26 | 2001 | 2010 | ▂▂▂▂▃▃▃▃▃▃▃▃▃▃▂▂▂▂▂▂▂▂▂▂▂▂ |
| zooplankton | 1997 | 24.66 | 1997 | 2006 | ▃▃▃▃▃▃▃▃▃▃▂▂▂▂▂▂▂▂▂▂▂▂▂▂▂▂ |
| phytoplankton | 1997 | 54.48 | 1997 | 2005 | ▃▃▃▃▃▃▃▃▃▂▂▂▂▂▂▂▂▂▂▂▂▂▂▂▂▂ |
| rate | 1997 | 33 | 2000 | 2008 | ▂▂▂▃▃▃▃▃▃▃▃▃▂▂▂▂▂▂▂▂▂▂▂▂▂▂ |
| growth rate | 1997 | 31.97 | 1997 | 2005 | ▃▃▃▃▃▃▃▃▃▂▂▂▂▂▂▂▂▂▂▂▂▂▂▂▂▂ |
| marine phytoplankton | 1997 | 28.35 | 1997 | 2004 | ▃▃▃▃▃▃▃▃▂▂▂▂▂▂▂▂▂▂▂▂▂▂▂▂▂▂ |
| species nova | 1997 | 41.88 | 2014 | 2020 | ▂▂▂▂▂▂▂▂▂▂▂▂▂▂▂▂▂▃▃▃▃▃▃▃▂▂ |
| productivity | 1997 | 28.42 | 2012 | 2017 | ▂▂▂▂▂▂▂▂▂▂▂▂▂▂▂▃▃▃▃▃▃▂▂▂▂▂ |
| performance | 1997 | 64.61 | 2018 | 2022 | ▂▂▂▂▂▂▂▂▂▂▂▂▂▂▂▂▂▂▂▂▂▃▃▃▃▃ |
| denitrification | 1997 | 54.25 | 2018 | 2022 | ▂▂▂▂▂▂▂▂▂▂▂▂▂▂▂▂▂▂▂▂▂▃▃▃▃▃ |
| bacterial community | 1997 | 30.13 | 2018 | 2022 | ▂▂▂▂▂▂▂▂▂▂▂▂▂▂▂▂▂▂▂▂▂▃▃▃▃▃ |
| fatty acid | 1997 | 24.91 | 2006 | 2010 | ▂▂▂▂▂▂▂▂▂▃▃▃▃▃▂▂▂▂▂▂▂▂▂▂▂▂ |
| nitrogen removal | 1997 | 61.9 | 2019 | 2022 | ▂▂▂▂▂▂▂▂▂▂▂▂▂▂▂▂▂▂▂▂▂▂▃▃▃▃ |
| waste water | 1997 | 60.2 | 2019 | 2022 | ▂▂▂▂▂▂▂▂▂▂▂▂▂▂▂▂▂▂▂▂▂▂▃▃▃▃ |
| removal | 1997 | 56.94 | 2019 | 2022 | ▂▂▂▂▂▂▂▂▂▂▂▂▂▂▂▂▂▂▂▂▂▂▃▃▃▃ |
| community composition | 1997 | 38.53 | 2018 | 2020 | ▂▂▂▂▂▂▂▂▂▂▂▂▂▂▂▂▂▂▂▂▂▃▃▃▂▂ |
| litter decomposition | 1997 | 31.8 | 2016 | 2018 | ▂▂▂▂▂▂▂▂▂▂▂▂▂▂▂▂▂▂▂▃▃▃▂▂▂▂ |
| ocean acidification | 1997 | 29.98 | 2013 | 2015 | ▂▂▂▂▂▂▂▂▂▂▂▂▂▂▂▂▃▃▃▂▂▂▂▂▂▂ |
| nitrogen mineralization | 1997 | 23.25 | 2009 | 2011 | ▂▂▂▂▂▂▂▂▂▂▂▂▃▃▃▂▂▂▂▂▂▂▂▂▂▂ |
Publisher’s Note: MDPI stays neutral with regard to jurisdictional claims in published maps and institutional affiliations. |
© 2022 by the authors. Licensee MDPI, Basel, Switzerland. This article is an open access article distributed under the terms and conditions of the Creative Commons Attribution (CC BY) license (https://creativecommons.org/licenses/by/4.0/).
Share and Cite
MDPI and ACS Style
Zhu, Y.; Koutra, S.; Zhang, J. Zero-Carbon Communities: Research Hotspots, Evolution, and Prospects. Buildings 2022, 12, 674. https://0-doi-org.brum.beds.ac.uk/10.3390/buildings12050674
AMA Style
Zhu Y, Koutra S, Zhang J. Zero-Carbon Communities: Research Hotspots, Evolution, and Prospects. Buildings. 2022; 12(5):674. https://0-doi-org.brum.beds.ac.uk/10.3390/buildings12050674
Chicago/Turabian StyleZhu, Yunxi, Sesil Koutra, and Jiazhen Zhang. 2022. "Zero-Carbon Communities: Research Hotspots, Evolution, and Prospects" Buildings 12, no. 5: 674. https://0-doi-org.brum.beds.ac.uk/10.3390/buildings12050674
Note that from the first issue of 2016, this journal uses article numbers instead of page numbers. See further details here.