Article

Atom Probe Tomography (APT) Characterization of Organics Occluded in Single Calcite Crystals: Implications for Biomineralization Studies

1
Department of Geological Sciences, The University of Alabama, Tuscaloosa AL 35487, USA
2
Department of Applied Biological Chemistry, Graduate School of Agricultural and Life Sciences, The University of Tokyo, Tokyo 113-8657, Japan
*
Author to whom correspondence should be addressed.
Submission received: 1 July 2019 / Revised: 8 August 2019 / Accepted: 9 August 2019 / Published: 22 August 2019

Abstract

:
Occlusion of organic components in synthetic calcite crystals has been recently used as a model to understand the role of intra-crystalline organics in biominerals. However, the characterization of the distribution of both types of organics inside these calcite crystals is very challenging. Here, we discuss the potential of using the technique of atom probe tomography (APT) for such characterization, focusing on the analysis of chitin incorporation in single crystals. Additionally, APT has at least the same spatial resolution as TEM tomography, yet with the advantage of obtaining quantitative chemical data. Results show that chitin, either after degradation with yatalase or in the form of nanofibers, forms discrete clusters (2 to 5 nm) in association to water and hydronium molecules, rather than forming a 3D network inside crystals. Overall findings indicate that APT can be an ideal technique to characterize intra-crystalline organic components in abiogenic and biogenic carbonates to further advance our understanding of biomineralization.

1. Introduction

Biomineralization is quite unique and different to inorganic mineralization, mainly because biominerals are composites of mineral and organic phases [1]. The organic content of biominerals is very variable (0.1–>50 wt %) and it depends on the formation, type, and functionality of each biomineralized structure. Focusing on biominerals produced by invertebrates, in particular those with carbonate composition, two main organic components have been described: an inter-crystalline fraction present in-between structural units (i.e., prisms); and an intra-crystalline fraction, inside the mineralized structure (i.e., a prism or nacre tablet). The analysis of the intra-crystalline fraction has been traditionally difficult because of the (sub-) nanometric size of individual components [2]. Recently, synthetic carbonate systems, especially single calcite crystals, have been used to study the incorporation of organic components (i.e., peptide or polysaccharides) and their effect on the formation of crystal defects, mechanical properties, and the incorporation of chemical impurities (e.g., [3,4,5,6]). However, the characterization of the distribution of such organics inside crystals is very challenging. Transmission electron microscopy (TEM) tomography has proven to be a robust technique for this purpose (e.g., [7]), but the available information is limited to partial visualization of organic components without quantitative chemical data. More recently, confocal microscopy, in conjunction with fluorescent-labelled organics, has been also used [5], yet with similar issues to those related to TEM tomography.
Atom probe tomography (APT) is a technique that can provide the same 3D spatial resolution as TEM tomography in addition to chemical information at atomic scale. The expedience of APT in the study of organics occluded in biominerals has been shown for the analysis of chiton teeth [8] and bioapatite in bone and enamel (e.g., [9,10]). In these studies, the presence and distribution of organic components (e.g., fibers) was detected using the density of carbon atoms; however, this would not be possible if the mineral matrix is carbon-based, as in the case of a carbonate. We demonstrated that APT could be used successfully for the analysis of inorganic carbonates [11], yet the application of the technique to carbonate biominerals proves to be more challenging [12]. The aim of this contribution is, therefore, to discuss the potential use of APT, including details on optimal sample preparation and analysis conditions, for the characterization of organics occluded in carbonates. Specifically, we aim to analyze the incorporation of chitin, in the form of nanofibers and after degradation in solution by yatalase, in single calcite crystals.

2. Materials and Methods
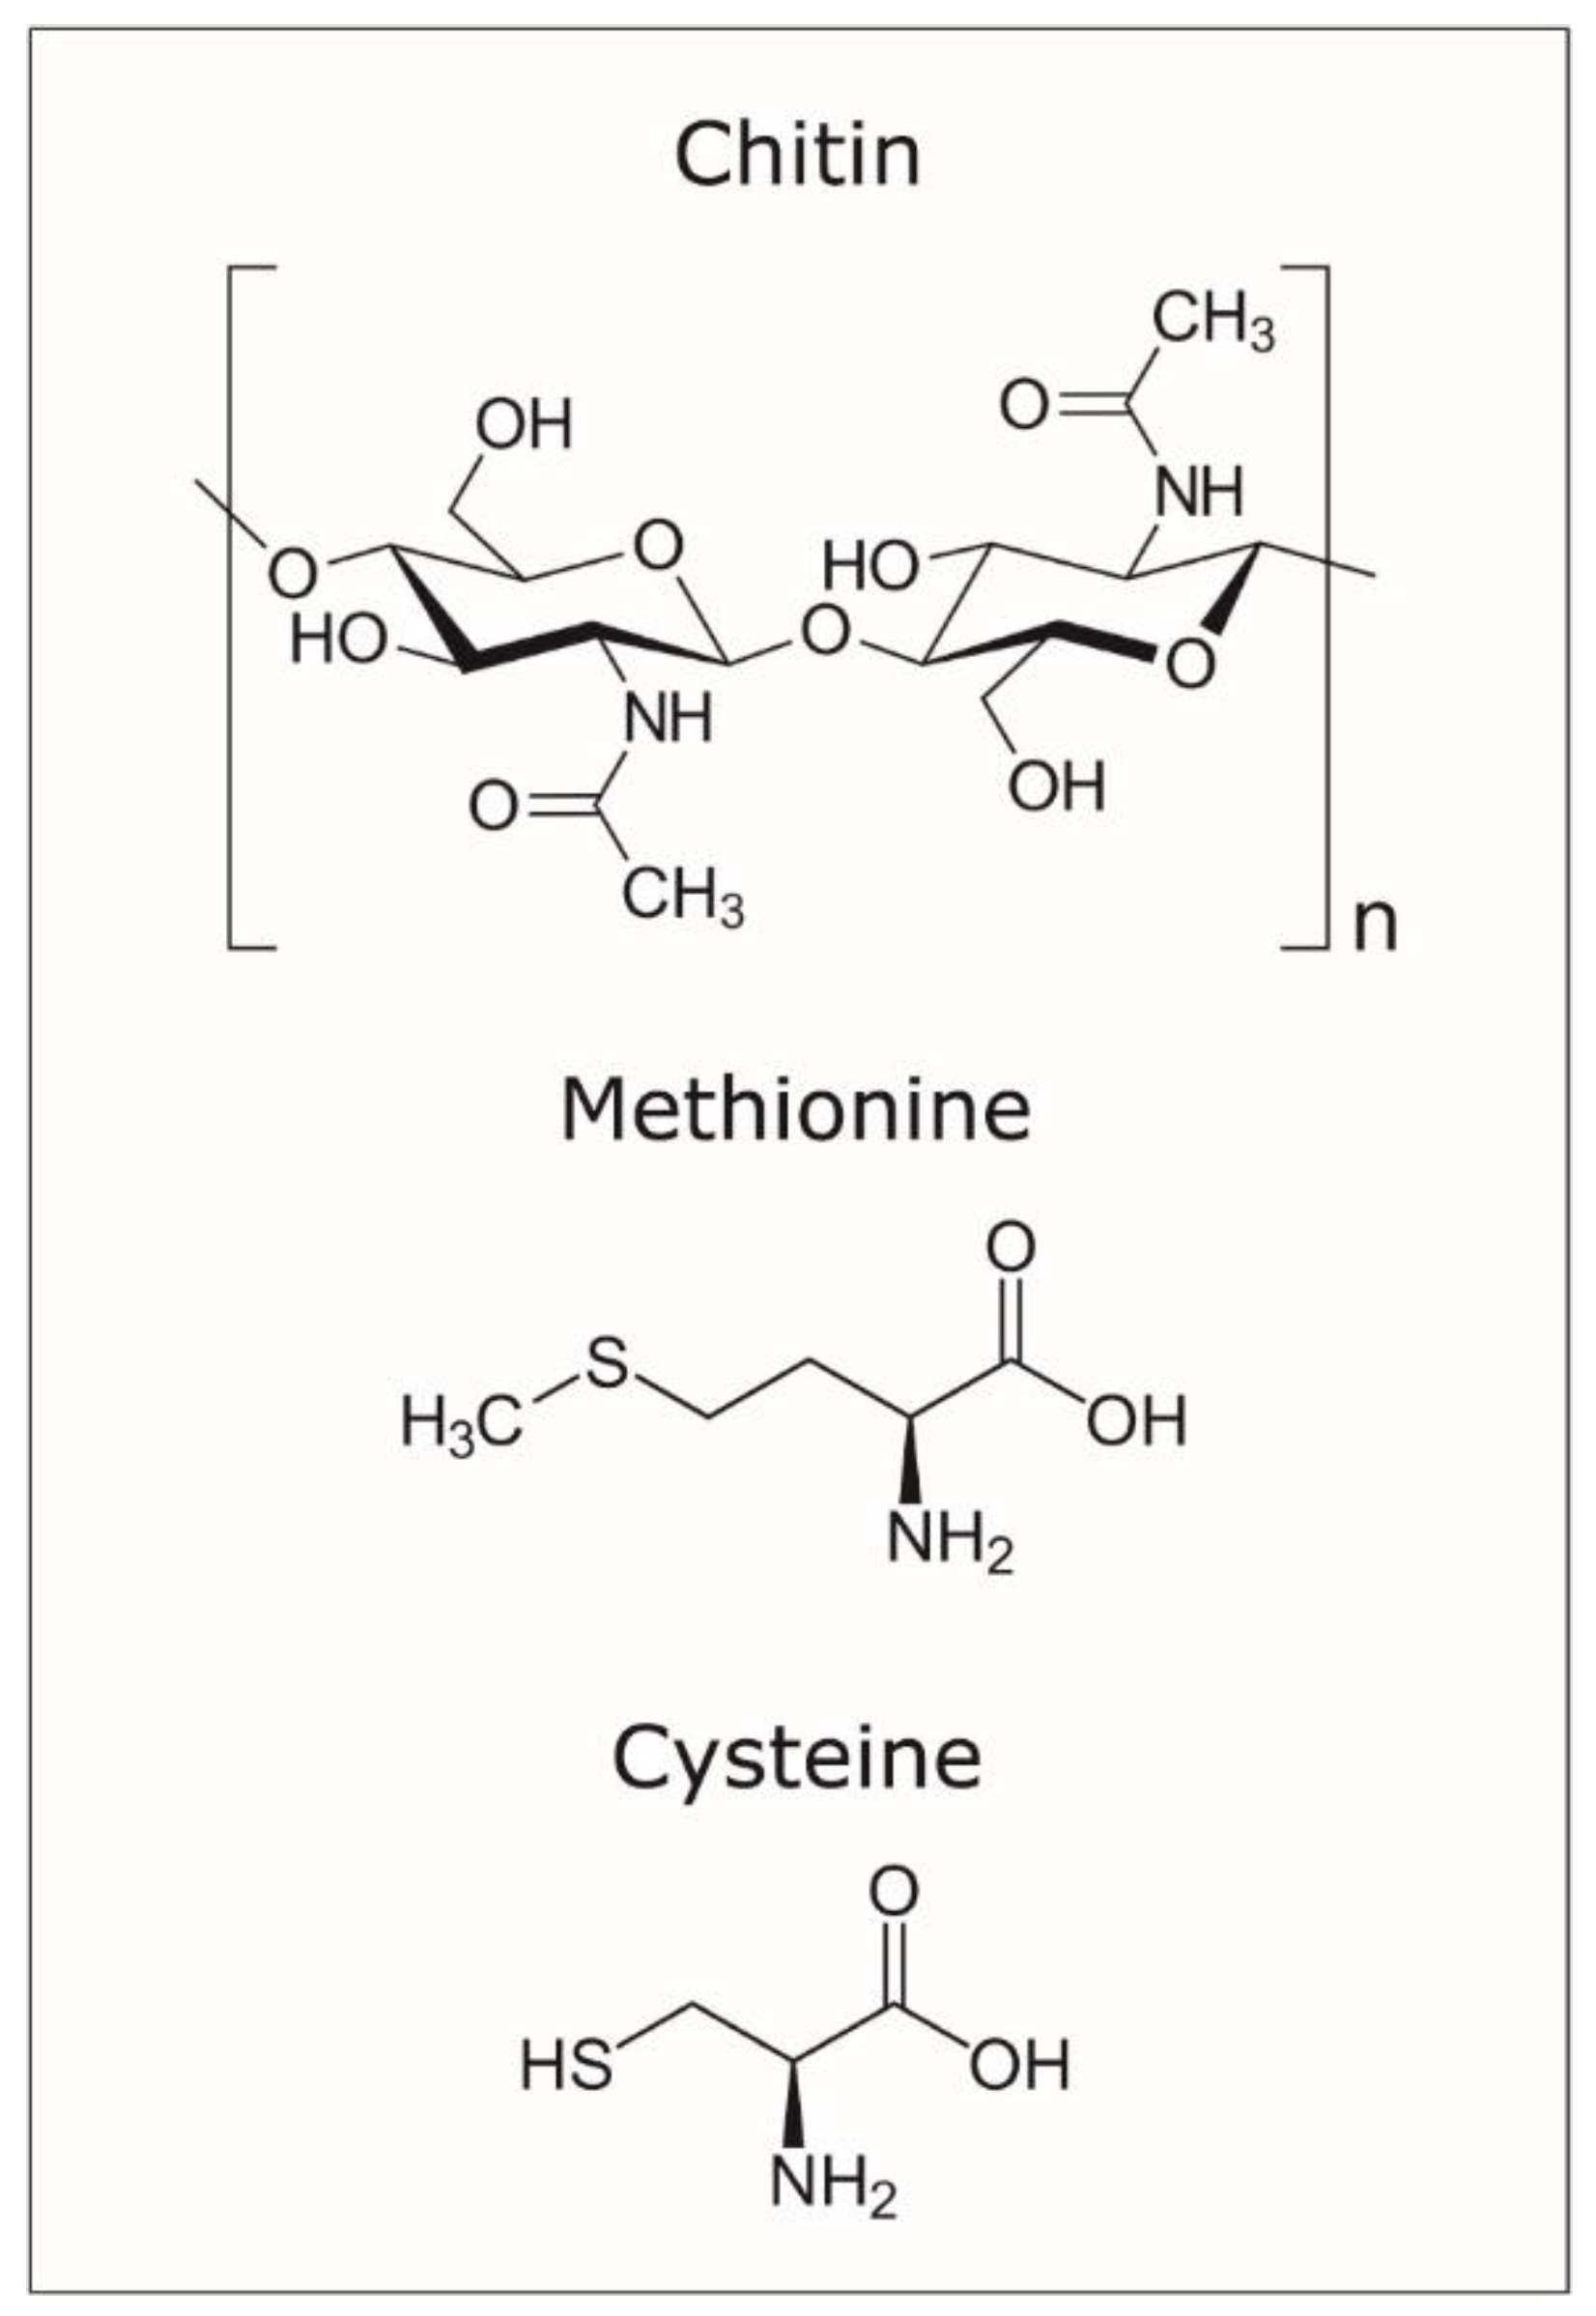
2.1. Materials

Single calcite crystals were grown in the presence of chitin hydrogel and chitin nanofibers [6] (Figure 1a). For the calcite precipitation in chitin hydrogel, the hydrogel was prepared as follows [6]: 2 mg of chitin (nacalai) was added to 100 mL of methanol saturated with calcium chloride dehydrate (Kanto Chemical, Tokyo, Japan), and stirred for several hours. Two liters of 10 mM calcium chloride solution was added to the chitin solution under vigorous stirring, then the precipitated chitin hydrogel was washed 3 times with a 10 mM calcium chloride solution to remove the methanol.
The prepared chitin hydrogel was treated with yatalase (an enzyme complex containing chitinase and chitobiase activities from Corynebacterium sp. OZ-21; TaKaRa). Yatalase was added to this chitin hydrogel in various concentrations and stirred for 24 h. After the reaction, the chitin hydrogel was filtered and washed with 10 mM calcium chloride to remove yatalase. The washed chitin hydrogel was spread on a plate (33.5 mm × 33.5 mm). This plate was put into desiccator filled with the gas of 5 g of ammonium carbonate (Kanto Chemical), followed by the calcium carbonate crystallization in the chitin hydrogel for 24 h. Chitin hydrogel was then dissolved with 50% sodium hypochlorite to collect the calcium carbonate crystals. For the crystallization of calcite using the chitin nanofiber, the procedure was as follows [6]: 1.1% (w/v) chitin nanofiber in 0.5% acetic acid solution was prepared and the resulting chitin nanofiber solution was neutralized with a solution of 1 M NaOH, 10 mM calcium chlorite. Calcium carbonate was then crystallized in the chitin nanofiber solution using the same method described above.
The previous study showed that length and thickness of chitin fiber affected the formation of calcite crystals [6]. Yatalase, which is a commercially available chitinase, was used to make thin chitin nanofiber in vitro. The treatment of yatalse decreased the thickness of chitin fiber and induced the defects of calcite crystal. Four types of crystals were available for study, with chitin dissolved at different concentrations of yatalase (0 mg/mL (Figure 1b), 0.12 mg/mL (Figure 1c), and 1.2 mg/mL (Figure 1c)) and chitin nanofibers (Figure 1e).

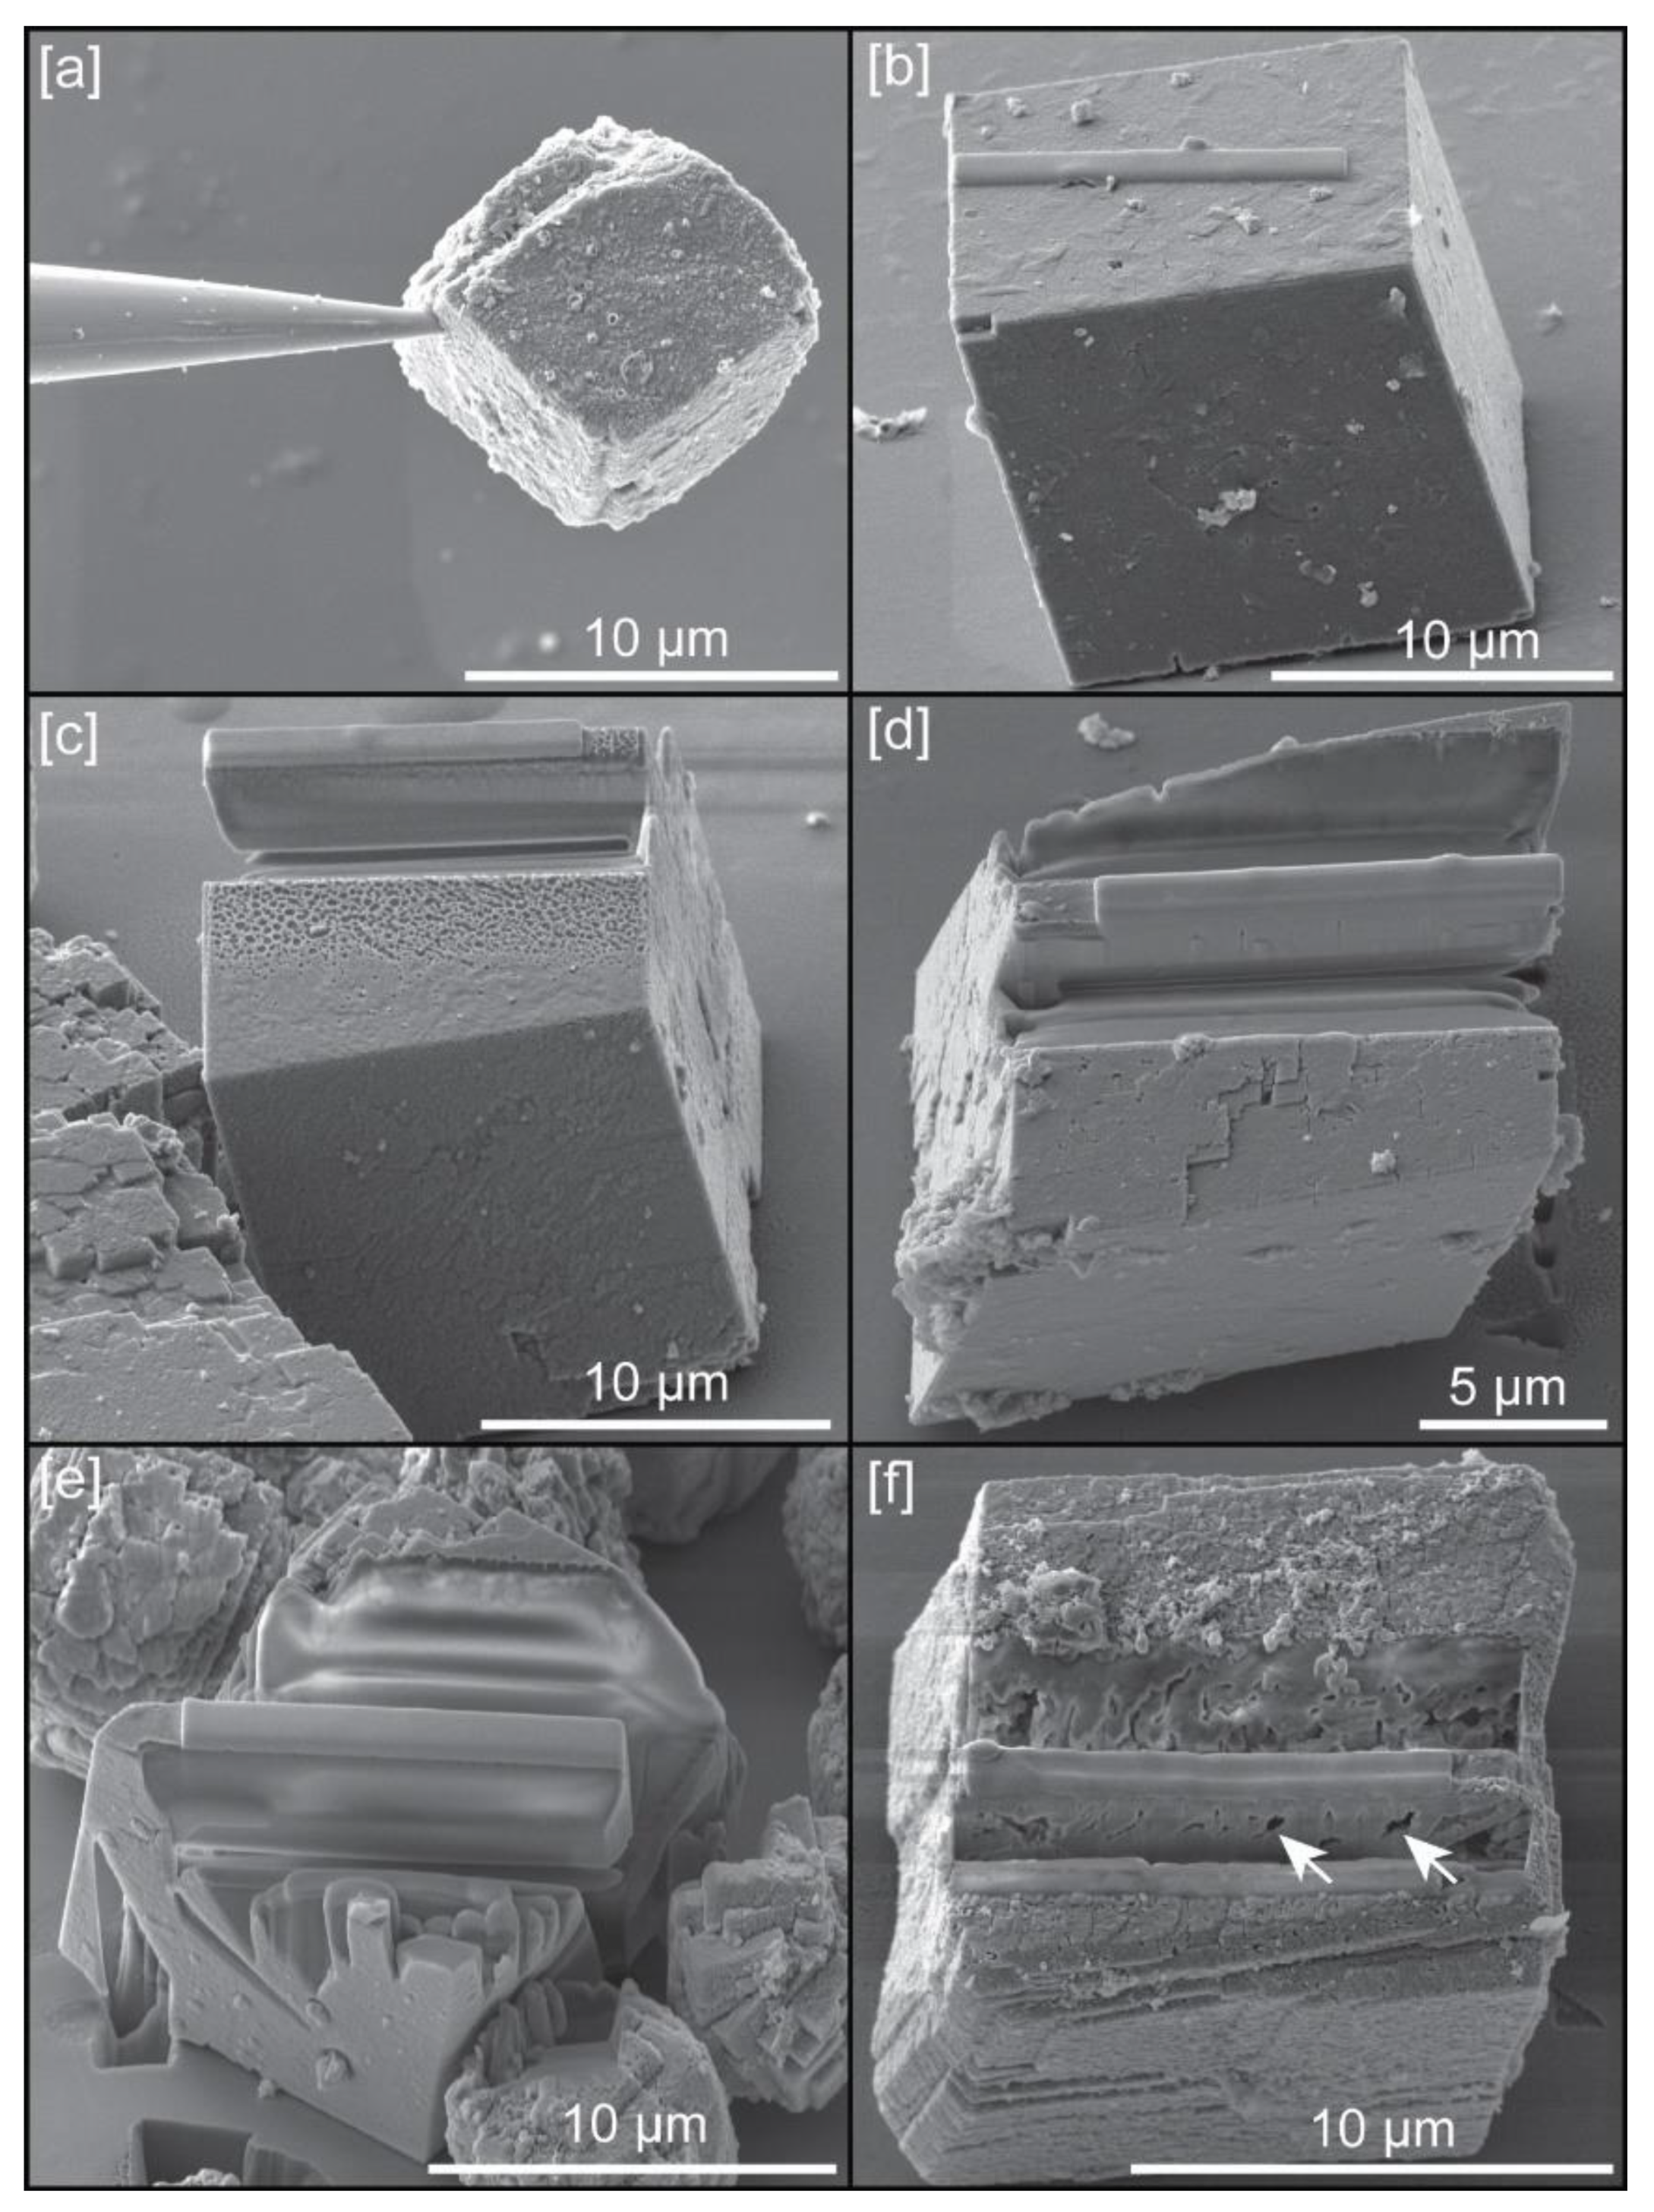
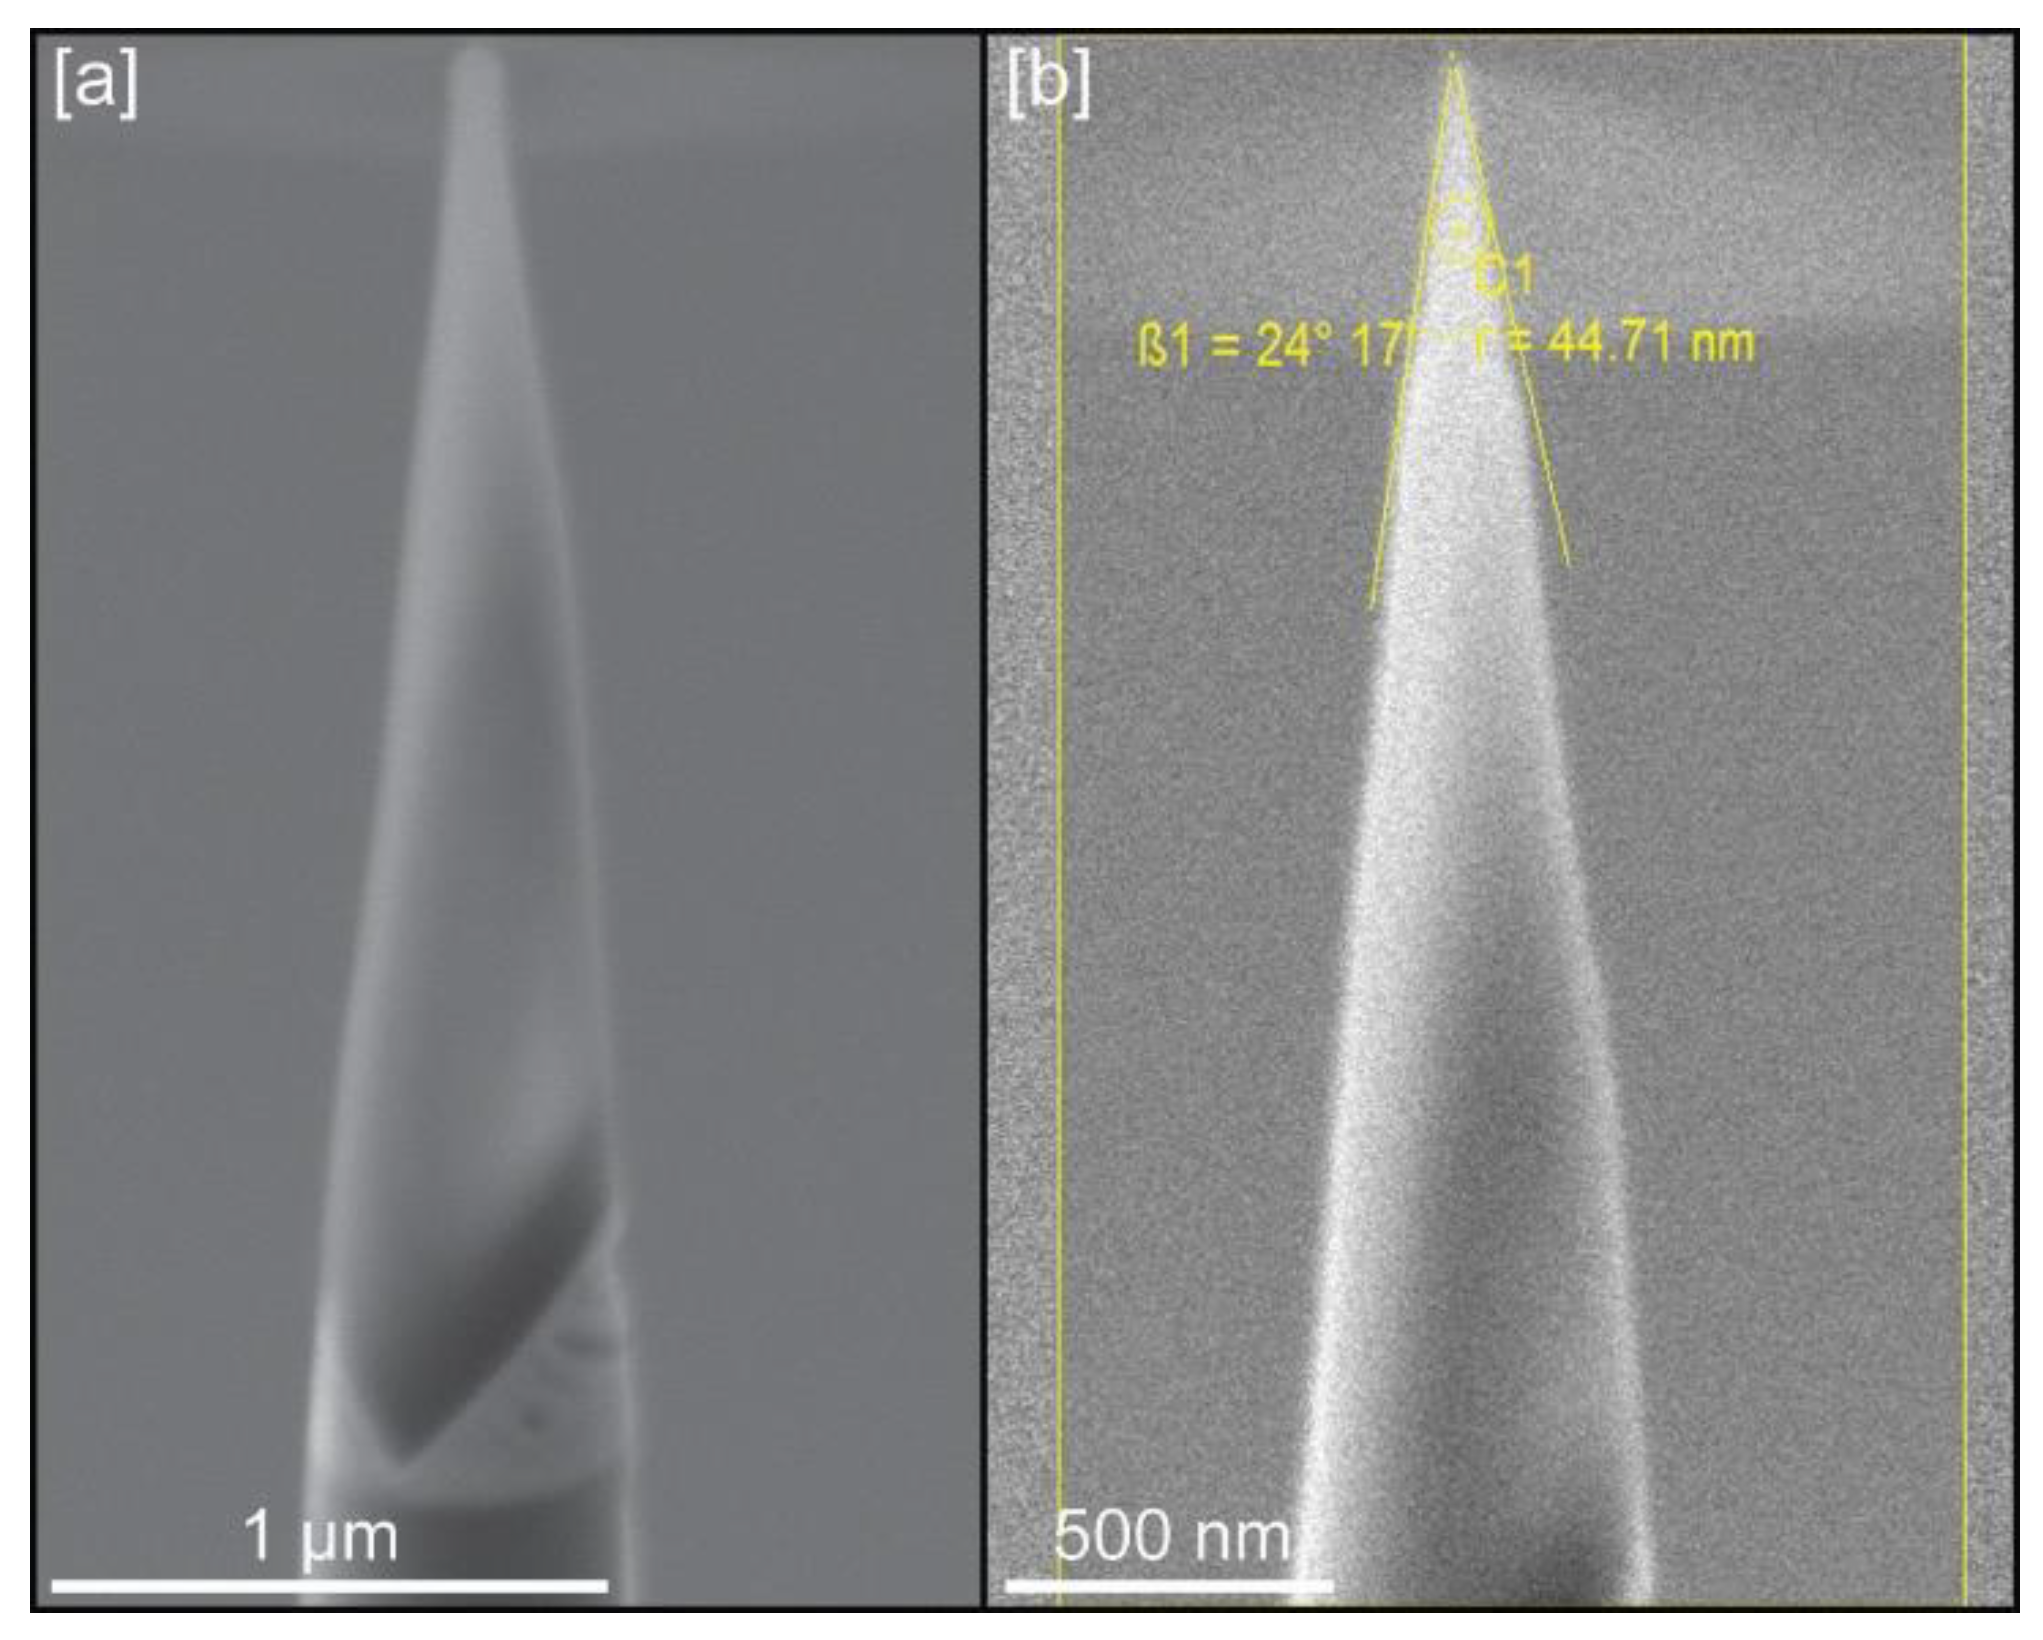
2.2. Sample Preparation

Powder with scalcite crystals, grown in solution, were spread on a silicon wafer surface, without any preferential orientation or distribution, in order to choose single crystals for APT sample preparation (Figure 1a). Focused ion beam (FIB) work for this preparation was carried out with a dual beam scanning electron microscope TESCAN LYRA XMU (Kohoutovice, Czech Republic), housed at the Central Analytical Facility (CAF) of the University of Alabama. Initially, due to the small size of crystals, we attempted to do a lift-out of single crystals, using both electrostatic forces and adhesion by Pt using the GIS, with the nanomanipulator (Figure 2a) and deposit them on the silicon posts present in the conventional microarray plate used for Local Electrode Atom Probe (LEAP) analysis. However, this approach did not yield good results as tips could not be manufactured with the ideal geometries (see Figure 3) and/or fractured easily during LEAP runs. Instead, we chose preparing tip samples using a FIB-based lift-out protocol adapted from Reference [13]. Because a specific crystallographic orientation could influence the quality of samples, all tips were extracted perpendicular to cleavage planes of calcite (Figure 2c–f). Microwedges (≤10 μm in length) of material, below a rectangle of Pt deposited (Ga+ ion beam at 30 kV and 7 pA) on the Cu coated surface of the crystal (Figure 2b), were cut using the ion beam (30 kV, 1 nA) on the three sides, and then welded to an in situ nanomanipulator (SmarAct) using FIB-deposited Pt before cutting the final edge free.
Cuts on crystals grown with chitin, with the presence or absence of yatalase, provided perfectly polished, continues surfaces (Figure 2c–e). Calcite crystals grown in the presence of chitin nanofibers produced many intra-crystalline voids and subsequently, the wedges did not present uniform surfaces that could be further prepared for analysis in most cases (Figure 2f). From microwedges, 1–2 μm wide segments were cut from each wedge and sequentially affixed with Pt to the tops of Si posts of a microtip array coupon purchased from CAMECA Scientific Instruments, Inc. Each tip was shaped and sharpened using annular milling patterns of increasingly smaller inner and outer diameters (Figure 3). Initially, the milling was performed at 30 kV to produce the specimen geometry necessary for APT. Final milling was performed at an accelerating voltage of 5 kV in order to reduce Ga+ implantation and obtain a consistent tip-to-tip shape.

2.3. LEAP Work and Data Analysis

APT analyses were conducted using a local electrode atom probe LEAP 5000 XS (CAMECA GmbH, Gennevilliers Cedex, France) equipped with a pico-second 355 nm UV laser and nominal flight path of 100 mm from CAMECA Instruments (CAMECA GmbH, Gennevilliers Cedex, France), also housed at the CAF of the University of Alabama. LEAP running parameters can be found in Table 1. APT data were reconstructed using the Integrated Visualization and Analysis Software (IVAS, version 3.8, Gennevilliers Cedex, France) from CAMECA Instruments, Inc. Preliminary reconstructions were completed by manually fitting the time-of-flight mass spectrum iteratively using the voltage and bowl fitting parameters within the IVAS platform, and peak ranges were defined as the entire visible peak or adjusted manually when large thermal tails were present. The three-dimensional reconstructions of APT data were performed using the “shank” tip profile method to determine the reconstructed radius as a function of analyzed depth.

3. Results and Discussion

3.1. Sample Quality and LEAP Analysis
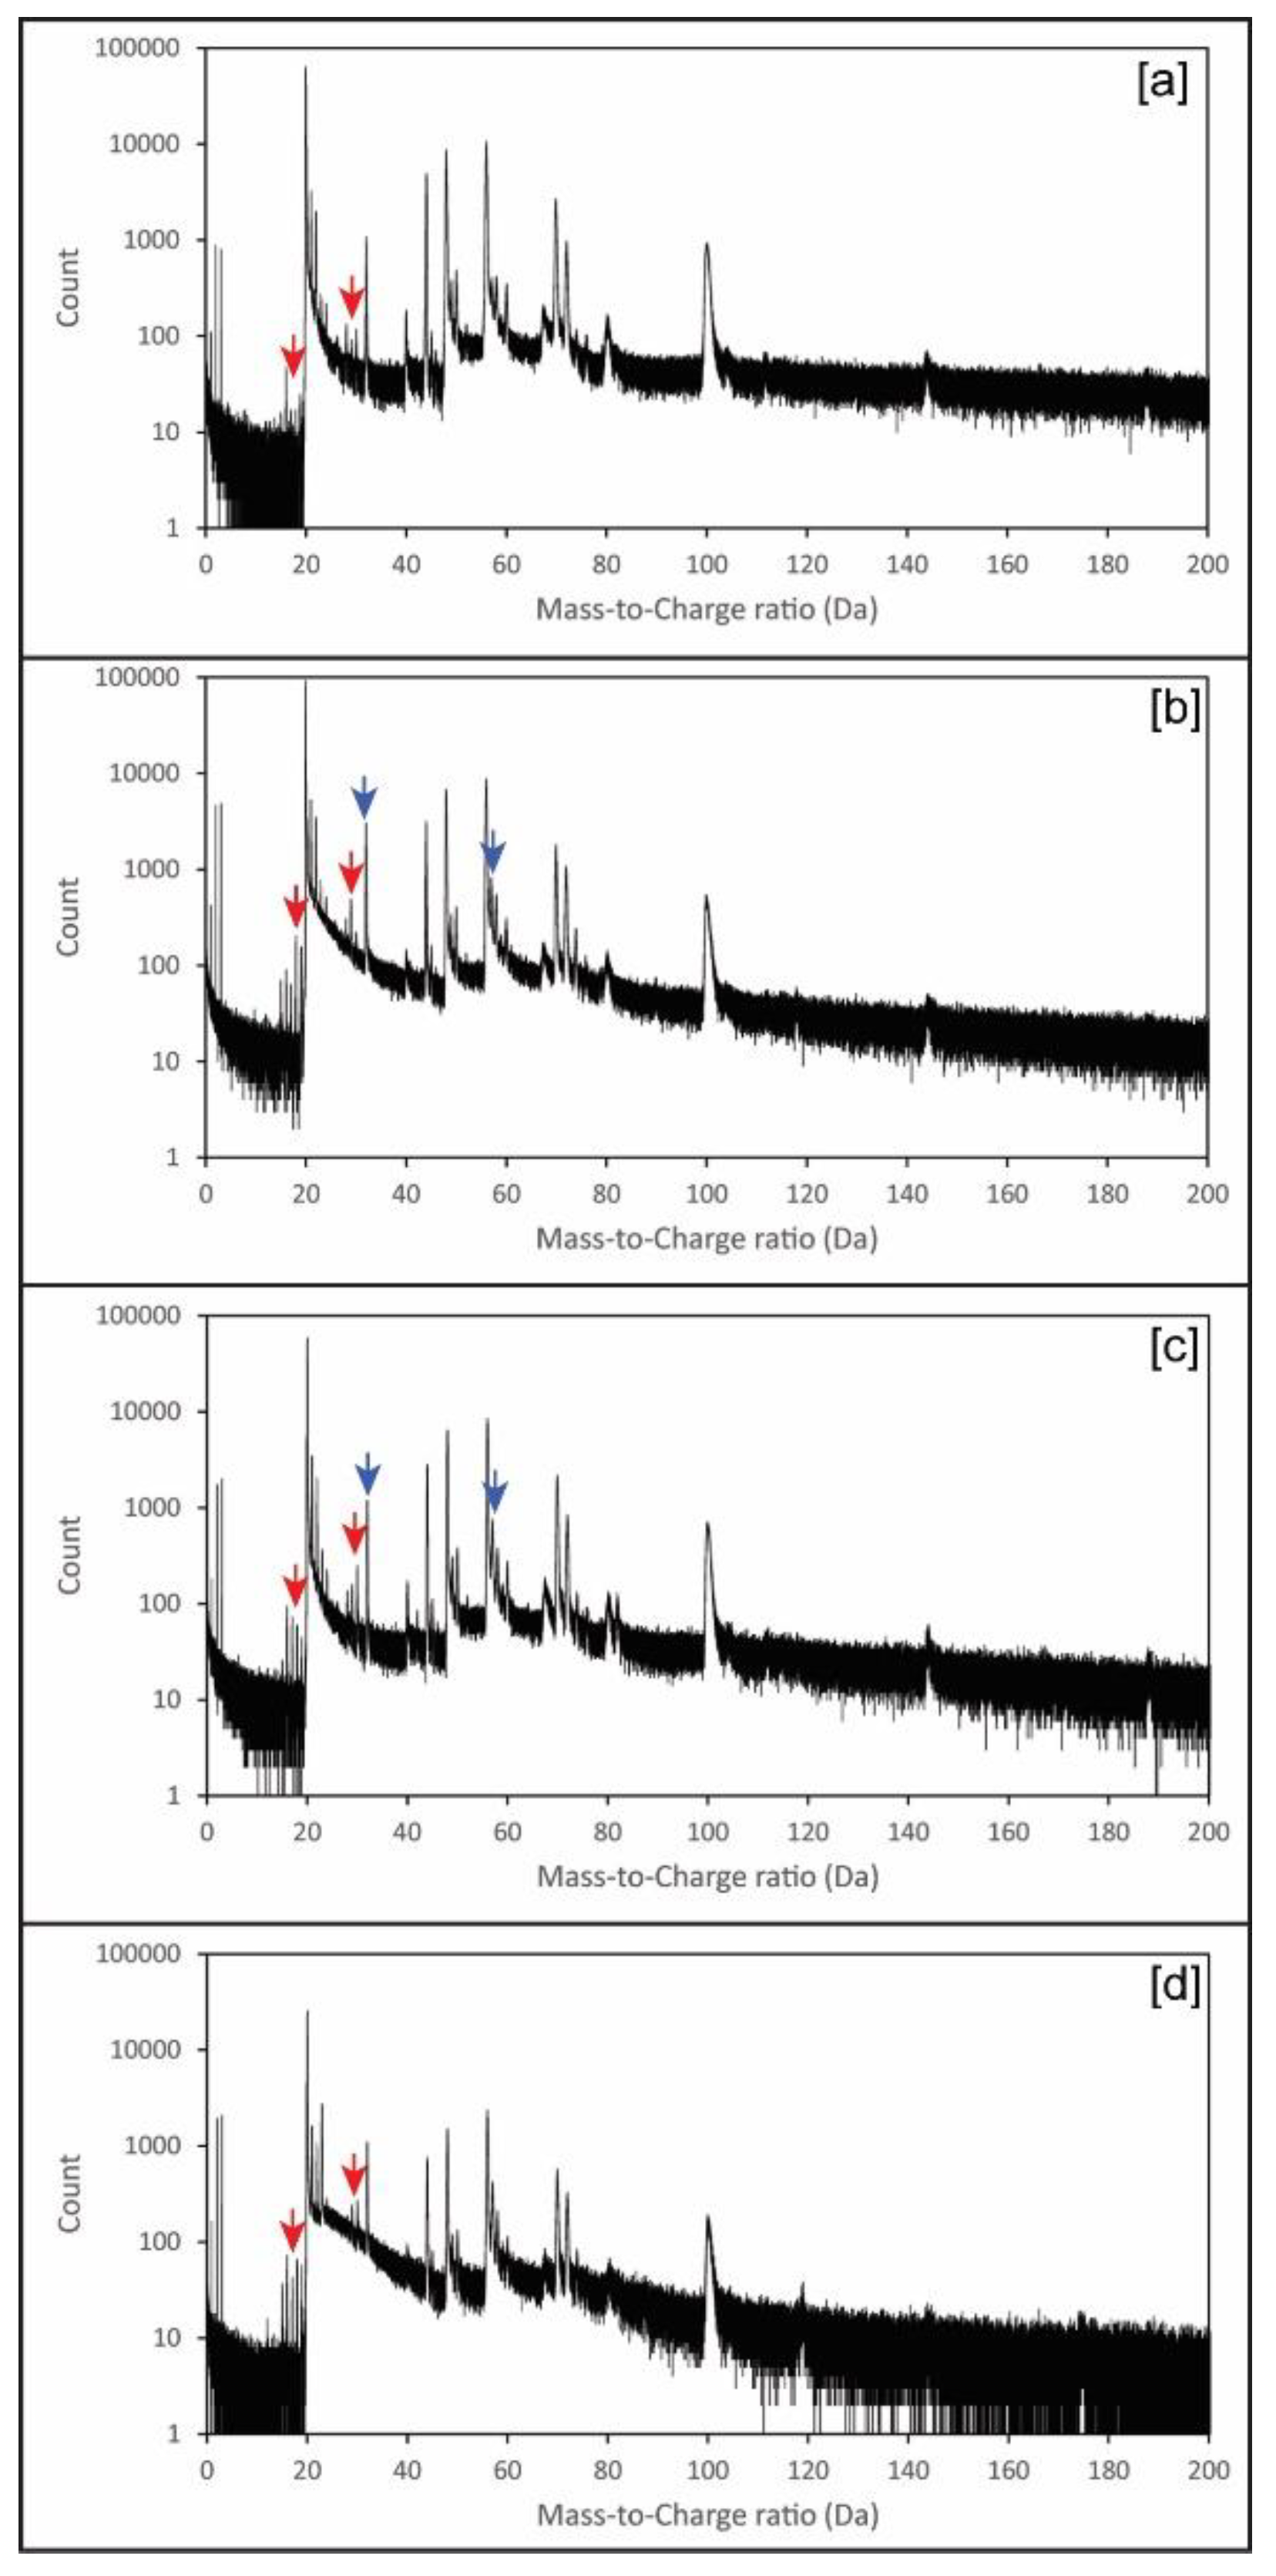
All prepared calcite crystals presented cleavage surfaces from which tip samples could be extracted, even with distorted surface geometries (Figure 1d–e). However, wedges cut from samples grown in the presence of chitin nanofibers were very fragile, with numerous voids (Figure 2f), and data could only be extracted from one crystal. For the rest of calcite crystals grown with chitin, with or without yatalase, 15 tips (5 tips per crystal) were extracted and analyzed in the LEAP instrument. Despite this number of tips, only nine provided meaningful data (Table 1) with the rest failing during analysis. Tip geometries that provided best APT results were those with a radius between 30–45 nm and a shank angle close to 30°. The ideal conditions for successful LEAP runs (average of ~35 million ions) require the use of low detection rates (0.2%–0.3%) to avoid tip fracturing, while the rest of parameters were similar to those used for other geological and materials science samples (see Table 1).

3.2. APT Data

Chemical spectra were similar to those previously reported for inorganic calcite [11], although with a higher degree of complexity (Figure 4). To detect the presence of chitin embedded in the calcite mass spectrum, we compared the mass spectra of those tips extracted from calcite crystals grown in the presence of chitin, but without adding yatalase (Figure 4 and Table 2), with that of pure abiogenic calcite [11]. This approach revealed the presence of 21 “mass peaks” characteristic of chitin (Table 2), whereas peaks associated to sulphur are uniquely linked to yatalase in the analysis of crystals grown in its presence at different concentrations (Table 2).
A challenging aspect of using atom probe tomography for the analysis of geological materials is the complexity of mass spectra and the possibility of peak overlaps [14]. Such complexity is effectively multiplied if organic species are analyzed in conjunction with minerals [9,10,12].
For the efficient use of APT to detect organics occluded in calcite crystals, it is essential to understand the bonding of organic macromolecules and the weakness points for potential “breakage” during field evaporation. Chitin has a relatively simple configuration (Figure 5), yet the use of yatalase for the degradation of chitin to facilitate occlusion in calcite complicates the understanding of mass spectra (Figure 4). Yatalase also can contain sulphur from both methionine and cysteine (Figure 5). This is particularly important to detect the presence of sulphur associate to organics and then linked to the yatalase. The challenge is associated to the interpretation of the contribution of oxygen and sulphur to peak at mass 32 (Figure 4 and Table 2 and Tables S1–S4); in the analysis of pure calcite, the peak at mass 32 has been previously interpreted as O2 [11]. However, the new version of the IVAS software for the analysis of APT data allows decomposing the contribution of different ions/molecules to a single peak, if sufficient auxiliary peaks (i.e., isotopes) are present, and the comparison of these values to those of the bulk chemistry without decomposition (Table S1). Therefore, the amount of detected total sulphur is less than 0.1 atomic % with the lowest concentration of yatalase (0.12 mg/mL−1), meanwhile increases to ~0.13 atomic % in those crystals grown with yatalase at a concentration of 1.2 mg/mL−1. The possibility of discerning the amount of sulphur associated to organics using APT is of importance for the future analysis of biogenic biominerals, as most biogenic carbonates contain inter- and intra-crystalline organics enriched in sulphated polysaccharides [15].
Independently of providing bulk chemistry data of samples, a unique and powerful characteristic of APT is the possibility of a 3D reconstruction of the distribution of chemical components. This allows the 3D visualization of organic components inside the calcite crystals. For calcite samples grown with chitin, either with or without yatalase degradation, we selected the peaks corresponding to chitin (COH and COH2) with the highest abundance, based on the chemical spectra (Figure 4), for the 3D mapping of the chitin distribution (Figure 6 and Figure S5 in Supplementary Materials). Chitin fragments are distributed within the calcite crystal forming discrete clusters (2 to 5 nm) that are more abundant with higher concentration of yatalase at 1.2 mg/mL (Figure 6c,d). Within these clusters, water and hydronium molecules are found in association, potentially reflecting the original hydration of organic components and posterior dissociation after field evaporation during LEAP analyses. In the case of the calcite crystal grown in the presence of chitin nanofibers, chitin is also present in discrete clusters of high abundance within the crystal (Figure 7). However, clusters coalesce and form a linear feature (along Z axis) in association with a higher concentration of Na. This could be related to a specific nucleation mechanism of carbonates with organics in the presence of sodium [16]. However, we do not have conclusive data about the potential role of sodium as sufficient concentration for a partial 3D reconstruction was only found in one tip. Overall, the 3D reconstructions show that chitin occluded with calcite formed a discrete clustering similar to intra-crystalline organics in prisms of Atrina pectinata, whereas for chitin nanofibers in presence of sodium linear structures could be formed similarly to organics in prims of Pinctada fucata [17].

4. Conclusions

Results presented herein demonstrate that APT can be an ideal technique to characterize intra-crystalline organic components in synthetic carbonate crystals, and potentially those present in biogenic carbonate structures. For single calcite crystals, the traditional FIB-based lift-out protocol has to be used for sample preparation, but a larger number of tips have to be manufactured because of a high proportion of tip failure. Because of the brittle and non-conductive nature of calcite and the presence of organics, low evaporation (detection) rates are necessary during LEAP runs, but the laser pulse rate and laser energies can be similar to those previously employed for the analysis of geological and biomineral samples. Preliminary data reconstructions confirm that APT has at least the same spatial resolution as TEM tomography, yet with the advantage of obtaining additional, quantitative chemical data in a three-dimensional context. Overall, APT can be an ideal technique to further advance our knowledge of biomineralization.

Supplementary Materials

The following are available online at https://0-www-mdpi-com.brum.beds.ac.uk/2311-5629/5/3/50/s1, Figures S1–S5, Table S1 and Videos V1–V3.

Author Contributions

Work conceptualization, A.P.-H. and M.S.; sample preparation and analysis, C.C., F.L., and H.K.; writing—original draft preparation, A.P.-H.; writing—review and editing, A.P.-H., C.C., M.S., and H.K.; work supervision, A.P.-H. and M.S.; funding acquisition, A.P.-H.

Funding

This research was funded by the U.S. National Science Foundation (NSF), grant number EAR-1647012, to A.P-H.

Acknowledgments

Authors are grateful for the help of two anonymous reviewers to improve the final quality of the manuscript, and the editorial work by Leah Chen and Cherry Hou. Authors acknowledge help by Rich L. Martens (UA CAF) for assistance with FIB-SEM and LEAP work.

Conflicts of Interest

The authors declare no conflict of interest.

References

  1. Lowenstam, H.A.; Weiner, S. On Biomineralization; Weiner, S., Ed.; Oxford University Press: New York, NY, USA, 1989; p. 324. [Google Scholar]
  2. Pérez-Huerta, A.; Coronado, I.; Hegna, T.A. Understanding biomineralization in the fossil record. Earth-Sci. Rev. 2018, 179, 95–122. [Google Scholar] [CrossRef]
  3. Stephenson, A.E.; DeYoreo, J.J.; Wu, L.; Wu, K.J.; Hoyer, J.; Dove, P.M. Peptides enhance magnesium incorporation in calcite: insights into origins of vital effects. Science 2008, 322, 724–727. [Google Scholar] [CrossRef] [PubMed]
  4. Kim, Y.-Y.; Carloni, J.D.; Demarchi, B.; Sparks, D.; Reid, D.G.; Kunitake, M.E.; Tang, C.C.; Duer, M.L.; Freeman, C.L.; Pokroy, B.; et al. Tuning hardness in calcite by incorporation of amino acids. Nat. Mater. 2016, 15, 903–910. [Google Scholar] [CrossRef] [PubMed] [Green Version]
  5. Green, D.C.; Ihli, J.; Thornton, P.D.; Holden, M.A.; Marzec, B.; Kim, Y.Y.; Kulak, A.N.; Levenstein, M.A.; Tang, C.; Lynch, C.; et al. 3D visualization of additive occlusion and tunable full-spectrum fluorescence in calcite. Nat. Comm. 2016, 7, 13524. [Google Scholar] [CrossRef] [PubMed]
  6. Kintsu, H.; Okumura, T.; Negishi, L.; Ifuku, S.; Kogure, T.; Sakuda, S.; Suzuki, M. Crystal defects induced by chitin and chitinolytic enzymes in the prismatic layer of Pinctada Fucata. Biochem. Biophys. Res. Comm. 2017, 489, 89–95. [Google Scholar] [CrossRef] [PubMed]
  7. Li, H.; Xin, H.L.; Muller, D.A.; Estroff, L.A. Visualizing the 3D structure of calcite single crystals grown in agarose hydrogels. Science 2009, 326, 1244–1247. [Google Scholar] [CrossRef] [PubMed]
  8. Gordon, L.M.; Joester, D. Nanoscale chemical tomography of buried organic-inorganic interfaces in the chiton tooth. Nature 2011, 469, 194–197. [Google Scholar] [CrossRef] [PubMed]
  9. Gordon, L.M.; Tran, L.; Joester, D. Atom probe tomography of apatites and bone-type mineralized tissues. ACS Nano 2012, 6, 10667–10675. [Google Scholar] [CrossRef] [PubMed]
  10. Gordon, L.M.; Cohen, M.J.; MacRenaris, K.W.; Pasteris, J.D.; Seda, T.; Joester, D. Amorphous intergranular phases control the properties of rodent tooth enamel. Science 2015, 347, 746–750. [Google Scholar] [CrossRef] [PubMed] [Green Version]
  11. Pérez-Huerta, A.; Laiginhas, F.; Reinhard, D.A.; Prosa, T.J.; Martens, R.L. Atom probe tomography (APT) of carbonate minerals. Micron 2016, 80, 83–89. [Google Scholar] [CrossRef] [PubMed]
  12. Pérez-Huerta, A.; Laiginhas, F. Preliminary data on the nanoscale chemical characterization of the inter-crystalline organic matrix of a calcium carbonate biomineral. Minerals 2018, 8, 223. [Google Scholar] [CrossRef]
  13. Thompson, K.; Lawrence, D.; Larson, D.J.; Olson, J.D.; Kelly, T.F.; Gorman, B. In situ site-specific specimen preparation for atom probe tomography. Ultramicroscopy 2007, 107, 131–139. [Google Scholar] [CrossRef] [PubMed]
  14. Saxey, D.W.; Moser, D.E.; Piazolo, S.; Reddy, S.M.; Valley, J.W. Atomic worlds: Current state and future atom probe tomography in geosciences. Scripta Mater 2018, 148, 115–121. [Google Scholar] [CrossRef]
  15. Cuif, J.-P.; Dauphin, Y.; Sorauf, J.E. Biominerals and Fossils Through Time; Cuif, J.-P., Dauphin, Y., Sorauf, J.E., Eds.; Cambridge University Press: England, UK, 2011; p. 490. [Google Scholar]
  16. Branson, O.; Bonnin, E.A.; Perea, D.E.; Spero, H.J.; Zhu, Z.; Winters, M.; Hönisch, B.; Russell, A.D.; Fehrenbacher, J.S.; Gagnon, A.C. Nanometer-scale chemistry of calcite biomineralization template: Implications for skeletal composition and nucleation. PNAS 2016, 113, 12934–12939. [Google Scholar] [CrossRef] [PubMed]
  17. Okumura, T.; Suzuki, M.; Nagasawa, H.; Kogure, T. Microstructural variation of biogenic calcite with intracrystalline organic macromolecules. Cryst. Growth Des. 2012, 12, 224–230. [Google Scholar] [CrossRef]
Figure 1. Calcite crystals used in this study: (a) General view of crystals deposited on the surface of a silicon wafer; (b) Example of crystal grown with chitin hydrogel (c) Example of crystal grown with chitin at 0.12 mg/mL concentration of yatalase; (d) Example of crystal grown with chitin at 1.2 mg/mL concentration of yatalase; (e) Example of crystal grown with chitin nanofibers.
Carbon 05 00050 g001
Figure 2. Example of sample preparation: (a) Calcite crystal lifted-out from the silicon wafer with nanomanipulator using electrostatic forces; (b) Example of Pt rectangle deposited on the (104) plane of calcite; (c) Example of wedge cut from a crystal grown with chitin hydrogel; (d) Example of wedge cut from a crystal grown with chitin at 0.12 mg/mL concentration of yatalase; (e) Example of wedge cut from a crystal grown with chitin at 1.2 mg/mL concentration of yatalase; (f) Example of crystal grown with chitin nanofibers; white arrows indicate voids in the wedge.
Carbon 05 00050 g002
Figure 3. Example of tips for LEAP analysis: (a) Tip geometry after initial sharpening; (b) Tip geometry and dimensions (radius and shank angle) after final cleaning at 5 kV.
Carbon 05 00050 g003
Figure 4. Example of representative APT mass spectra: (a) Calcite and chitin hydrogel; (b) Calcite and chitin at 0.12 mg/mL concentration of yatalase; (c) Calcite and chitin at 1.2 mg/mL concentration of yatalase; (d) Calcite and chitin nanofibers (Note: Red and blue arrows indicate some representative peaks indicative of chitin and yatalase, respectively; more details in Table 2). Detailed mass spectra with high resolution of peaks, identified in Table 2, can be found in Supplementary Figures S1–S4.
Carbon 05 00050 g004
Figure 5. Molecular configuration of chitin, methionine, and cysteine.
Carbon 05 00050 g005
Figure 6. Example of APT 3D tip reconstructions: (a) Calcite tip with occluded chitin fragments at 0.12 mg/mL concentration of yatalase; (b) Calcite tip with occluded chitin fragments at 1.2 mg/mL concentration of yatalase; (c) Orthogonal projection view (along Z axis) of a slice of the tip within the blue box in (a); (d) Orthogonal projection view (along Z axis) of a slice of the tip within the blue box in (b). Notes: Dimensions, along Z and Y axes, are in nm; red dots correspond to Ca atoms; chitin fragments recognized by COH+ COH2+, and associated water (H2O) and hydronium (H3O) molecules.
Carbon 05 00050 g006
Figure 7. APT 3D tip reconstructions for calcite grown with chitin nanofibers: (a) Calcite tip with occluded chitin fragments and the presence of sodium; (b) Orthogonal projection view (along Z axis) of a slice of the tip showing the location of maxium (red color) Na concentration; (c) Same orthogonal projection in (b) with the superposition of those molecules (COH, H2O, and H3O) corresponding to chitin. Notes: Dimensions, along Z and X axes, are in nm; chitin fragments recognized by CO, COH, COH2, and associated water (H2O) and hydronium (H3O) molecules.
Carbon 05 00050 g007
Table 1. LEAP running parameters.
Specimen153616201592161916701560161816431644
Sample DescriptionYatalase 0 mg·mL−1Yatalase 0.12 mg·mL−2Yatalase 1.2 mg·mL−1Chitin Nanofiber
Instrument ModelLEAP 5000 XR
Instrument settings
Laser pulse energy (pJ)505050505050505050
Pulse frequency (kHz)200200200200200200200200200
Target detection rate (%)0.20.20.30.30.30.20.20.30.3
Set point temperature (K)404040404040404040
Chamber pressure (Torr)7.3 × 10−114.2 × 10−118.8 × 10−117.7 × 10−117.0 × 10−117.0 × 10−116.2 × 10−115.6 × 10−115.7 × 10⁻¹¹
Data summary
Analysis softwareIVAS 3.8.0
Total ions:480246483563625760000006454728073584752943304847751271982481539023041842
Sigle (%)83.680.681.882.379.583.383.178.880.7
Multiple (%)15.718.417.51719.81616.120.318.4
Partial (%)0.710.70.80.80.80.80.80.9
Reconstructed ions:29411910303853243101717829660280258073142178907022083942947745111404208
Ranged (%)60.338.459.660.940.965.463.358.353.8
Unranged (%)39.761.640.439.159.134.636.741.746.2
Mass calib. (peaks/interp.)Lin. Method
(M/∆M) for 40Ca++ 198.2261.4298.6241.6223.4152.670.4158.4220.4
(M/∆M10)c99.2122.4126.6116.4105.768.84275.1105.3
Background (ppm/ns)197.238.136836.429.489.922.7
Recontruction
Final speciment stateFracturedFracturedFracturedFracturedFracturedFracturedFracturedFracturedFractured
Pre-/post-analysis imagingSEM/n.aSEM/n.aSEM/n.aSEM/n.aSEM/n.aSEM/n.aSEM/n.aSEM/n.aSEM/n.a
Radius evolution model“shank”“shank”“shank”“shank”“shank”“shank”“shank”“shank”“shank”
Avg. atomic volume (nm3)0.04350.04350.04350.04350.04350.04350.04350.04350.0435
Vinitial; Vfinal (V)4300;57001300;44001800;54003600;53001300;47001600;52004200;60003900;50004200;5400
Table 2. Mass-to-charge ratio peak identification.
Specimen153616201592161916701560161816431644
Sample DescriptionYatalase 0 mg·mL−1Yatalase 0.12 mg·mL−2Yatalase 1.2 mg·mL−1Chitin nanofiber
m/zIon type
12*C+n.d.C+C+n.d.C+n.d.C+C+
14n.d.n.d.n.d.n.d.n.d.N+N+N+n.d.
15*NH+NH+NH+NH+NH+NH+NH+NH+NH+
16O+O+O+O+O+O+O+O+O+
17OH+OH+OH+OH+OH+OH+OH+OH+OH+
18H2O+H2O+H2O+H2O+H2O+H2O+H2O+H2O+H2O+
19H3O+H3O+H3O+H3O+H3O+H3O+H3O+H3O+H3O+
20Ca2+Ca2+Ca2+Ca2+Ca2+Ca2+Ca2+Ca2+Ca2+
21Ca2+Ca2+Ca2+Ca2+Ca2+Ca2+Ca2+Ca2+Ca2+
21.5Ca2+Ca2+Ca2+Ca2+Ca2+Ca2+Ca2+Ca2+Ca2+
22Ca2+Ca2+Ca2+Ca2+Ca2+Ca2+Ca2+Ca2+Ca2+
23Na+Na+Na+Na+Na+Na+Na+Na+Na+
24Ca2+Ca2+Ca2+Ca2+Ca2+Ca2+Ca2+Ca2+Ca2+
25*n.d.n.d.C2H+C2H+n.d.C2H+C2H+n.d.n.d.
26*C2H2+n.d.n.d.C2H2+n.d.C2H2+C2H2+n.d.n.d.
28*CO+CO+CO+CO+CO+CO+CO+CO+CO+
29*COH+COH+COH+COH+COH+COH+COH+COH+COH+
30*COH2+COH2+COH2+COH2+COH2+COH2+COH2+COH2+COH2+
31n.d.n.d.P+P+n.d.P+P+n.d.n.d.
32O2+O2+O2+O2+O2+O2+O2+O2+O2+
33n.d.n.d.S+S+n.d.S+S+O2+O2+
34n.d.n.d.S+S+n.d.S+S+n.d.n.d.
38n.d.n.d.n.d.n.d.n.d.n.d.C2N+n.d.n.d.
40*C2O+C2O+C2O+C2O+C2O+C2O+C2O+C2O+C2O+
41*n.d.n.d.C2OH+n.d.n.d.n.d.C2OH+n.d.n.d.
42*C2OH2+C2OH2+C2OH2+C2OH2+n.d.C2OH2+C2OH2+n.d.C2OH2+
43*n.d.n.d.n.d.HCNO+n.d.HCNO+HCNO+n.d.HCNO+
44CO2+CO2+CO2+CO2+CO2+CO2+CO2+CO2+CO2+
45CO2+CO2+CO2+CO2+CO2+CO2+CO2+CO2+CO2+
46CO2+n.d.CO2+CO2+n.d.CO2+CO2+CO2+CO2+
48Ca2O2+Ca2O2+Ca2O2+Ca2O2+Ca2O2+Ca2O2+Ca2O2+Ca2O2+Ca2O2+
49Ca2O2+Ca2O2+Ca2O2+Ca2O2+Ca2O2+Ca2O2+Ca2O2+Ca2O2+Ca2O2+
49.5Ca2O2+n.d.Ca2O2+Ca2O2+n.d.Ca2O2+Ca2O2+Ca2O2+Ca2O2+
50Ca2O2+Ca2O2+Ca2O2+Ca2O2+Ca2O2+Ca2O2+Ca2O2+Ca2O2+Ca2O2+
51Ca2O2+n.d.Ca2O2+Ca2O2+n.d.n.d.n.d.n.d.n.d.
52Ca2O2+Ca2O2+Ca2O2+Ca2O2+Ca2O2+Ca2O2+Ca2O2+n.d.Ca2O2+
56CaO+CaO+CaO+CaO+CaO+CaO+CaO+CaO+CaO+
57CaO+CaO+CaO+CaO+CaO+CaO+CaO+CaO+CaO+
58CaO+CaO+CaO+CaO+CaO+CaO+CaO+CaO+CaO+
59CaO+CaO+CaO+CaO+CaO+CaO+CaO+CaO+CaO+
60CaO+CaO+CaO+CaO+CaO+CaO+CaO+CaO+CaO+
61*n.d.C2O2H5+C2O2H5+C2O2H5+n.d.C2O2H5+C2O2H5+C2O2H5+C2O2H5+
62n.d.n.d.C2SH4C2SH5n.d.n.d.n.d.n.d.n.d.
64*C4O+n.d.C4O+C4O+n.d.C4O+C4O+n.d.n.d.
68*C3O2+C3O2+C3O2+C3O2+C3O2+C3O2+C3O2+C3O2+C3O2+
70Ca2CO32+Ca2CO32+Ca2CO32+Ca2CO32+Ca2CO32+Ca2CO32+Ca2CO32+Ca2CO32+Ca2CO32+
71Ca2CO32+Ca2CO32+Ca2CO32+Ca2CO32+Ca2CO32+Ca2CO32+Ca2CO32+Ca2CO32+Ca2CO32+
72CaO2+CaO2+CaO2+CaO2+CaO2+CaO2+CaO2+CaO2+CaO2+
74CaO2+CaO2+CaO2+CaO2+CaO2+CaO2+CaO2+CaO2+CaO2+
75n.d.CaO2+CaO2+CaO2+CaO2+CaO2+CaO2+CaO2+CaO2+
76CaO2+CaO2+CaO2+CaO2+CaO2+CaO2+CaO2+CaO2+CaO2+
79*n.d.C4NOH+C4NOH+C4NOH+C4NOH+C4NOH+C4NOH+n.d.C4NOH+
80*C4O2+C4O2+C4O2+C4O2+C4O2+C4O2+C4O2+C4O2+C4O2+
82*C4O2H2+C4O2H2+C4O2H2n.d.n.d.C4O2H2+C4O2H2+n.d.C4O2H2+
87.5*n.d.n.d.n.d.n.d.n.d.n.d.n.d.n.d.C6H9N052+
90*n.d.C3H6O3+C3H6O3+C3H6O3+n.d.n.d.C3H6O3+n.d.n.d.
92*n.d.n.d.n.d.n.d.n.d.n.d.C5O2+n.d.n.d.
100CaCO3+CaCO3+CaCO3+CaCO3+CaCO3+CaCO3+CaCO3+CaCO3+CaCO3+
104CaCO3+CaCO3+CaCO3+CaCO3+CaCO3+CaCO3+CaCO3+n.d.CaCO3+
112Ca2O2+Ca2O2+Ca2O2+Ca2O2+n.d.Ca2O2+n.d.n.d.n.d.
113*n.d.n.d.n.d.n.d.n.d.n.d.C6O2H9n.d.n.d.
118*n.d.C4NO3H8+C4NO3H8+C4NO3H8+n.d.C4NO3H8+n.d.n.d.C4NO3H8+
119*n.d.n.d.C4NO3H9+n.d.n.d.n.d.n.d.n.d.C4NO3H9+
120n.d.n.d.n.d.n.d.n.d.n.d.C3O2NSH6+n.d.n.d.
144Ca2O4+Ca2O4+Ca2O4+Ca2O4+Ca2O4+Ca2O4+Ca2O4+Ca2O4+Ca2O4+
175n.d.n.d.n.d.n.d.n.d.n.d.n.d.n.d.C6H9N05+
188Ca2CO6+Ca2CO6+Ca2CO6+Ca2CO6+Ca2CO6+Ca2CO6+Ca2CO6+n.d.Ca2CO6+
*Peaks of the chitin; Peaks of the Yatalase.

