Facile Synthesis of Water-Soluble, Highly-Fluorescent Graphene Quantum Dots from Graphene Oxide Reduction for Efficient Cell Labelling

Immagina Biotechnology.srl, Via Sommarive 18, 38123, Trento, Italy
*
Author to whom correspondence should be addressed.
C 2019, 5(4), 77; https://0-doi-org.brum.beds.ac.uk/10.3390/c5040077
Submission received: 15 October 2019
/
Revised: 18 November 2019
/
Accepted: 19 November 2019
/
Published: 22 November 2019
(This article belongs to the Special Issue Carbon Nanostructures for Biological Applications)
Abstract
:In this work, we report a simple, one-step, green procedure to fabricate strong blue and yellow photoluminescent graphene quantum dots (GQDs) as by-product of the synthesis of mesoporous graphene hydrogel (GHs). The graphene hydrogel was obtained by chemical reduction of graphene oxide using ascorbic acid at mild temperature. As a consequence of the network formation, small fluorescent GQDs can be isolated from the residual solvent, purified from the by-products and finally concentrated to produce GQDs. The GQDs chemistry and morphology were characterized by X-ray Photoelectron Spectroscopy (XPS) and Transmission Electron Microscopy (TEM). The GQDs mean diameter was about 5–10 nm and they exhibited an intense luminescence in the visible range with an excitation wavelength-dependent fluorescence. Our experiments showed that GQDs were easily internalized in living cells and furthermore, such internalization did not adversely affect cell viability.

1. Introduction
The optical properties of carbon nanostructures have attracted great interest from the scientific community in the last years [1,2,3,4,5,6,7]. The possible applications of these nanostructures in biophotonics have focused the attention of the scientific community on the fluorescent carbon nanoparticles. The discovery of the carbon nanostructures visible photoluminescence has opened the way to the investigation of their electronic properties. The mechanism of the photoluminescence is still controversial nowadays, but the visible photoluminescence seems to come from the presence of discrete states near the Fermi level [8,9]. From the first paper presented by Riggs [10] different synthesis techniques have been developed to obtain carbon nanostructures with outstanding optical activity. These include bottom-up approaches such as chemical reduction of carbon compounds as well as top-down methods, such as laser ablation and solvothermal carbonization [11,12,13,14]. These systems are not affected by photobleaching as the organic dyes. Moreover, they are less toxic than semiconductor quantum dots. Recently, Graphene Quantum Dots (GQDs), a particular class of fluorescent carbon became field of interest for the scientific community. These nanographenes are typically prepared from oxidation of various carbon sources such as graphite oxide and carbon fibers [15,16]. For examples, Tang et al. [17] obtained photoluminescent GQDs from oxidation of GO. Zao et al. isolated GQDs from KO2-assisted hydrothermal cutting of graphene oxide [18]. In this paper we report the isolation of photoluminescent GQDs obtained as by-product of porous graphene structures synthesized by mild reduction with ascorbic acid. The isolated GQDs possess a photoluminescence quantum yield of about 5.3% in water. Thanks to their stability and biocompatibility, the GQDs were tested as fluorescence markers in in-vitro cell imaging.
2. Materials and Methods
2.1. Materials
Graphene oxide solution was purchased from Graphenea. Inc (Spain). Ascorbic Acid and other chemical reagent and solvents were purchased from Sigma Aldrich (St. Louis, MO, USA) otherwise differently indicated.
2.2. Synthesis of GO Hydrogel and Isolation of GQDs
4 mg/mL of GO were mixed with five weight excess of ascorbic acid. The suspension was kept at 60 °C for 6 h without stirring. Then, the graphene hydrogel (GH) was removed and the water phase was collected. The sample was centrifuged at 13000 rpm for 30 min to remove the residual rGO. GQDs were purified by overnight dialysis with 5 L Milli-Q water using a 5kDa cut-off membrane.
2.3. Cell Treatment
HeLa cells were grown to 80% of confluence and incubated with GQDs (10 µg/mL, 1h). Cells were washed thrice with cold PBS and then fixed with 4% formaldehyde in PBS for 15 min on a coverslip and permeabilized with ice cold methanol for 10 min at −20 °C. Finally, after washing thrice with PBS, the slides were mounted with Prolong Gold Intifada (Invitrogen, Waltham, MA, USA) and analyzed using a fluorescence microscope.
2.4. Characterizations
The morphologies of the purified GQDs were characterized by TEM with a Hitachi H-800 microscope at 200 kV. The X-ray Photoelectron Spectroscopy (XPS) analysis was performed using a Kratos Axis DLD Ultra (Manchester, UK). The survey spectrum was acquired in the BE energy range between 1200–0 eV using a passing energy of 160 eV. The individual core lines were acquired at high resolution by setting the analyzer passing energy at 20 eV and the energy step at 0.05 eV. The spectra were analyzed using homemade software based on the R platform [19]. Peak fitting was performed using linear background subtraction and Gaussian components. UV-Vis absorption spectra were acquired by a UV-Vis spectrophotometer (Model-JASCO V-670, Cremella, Italia) in a wavelength range of 270–700 nm. Photoluminescence spectra were acquired using a Xe lamp as an excitation source coupled to a single grating monochromatorin a spectral range extending from 420 to 500 nm.
Cell images were collected by a fluorescent microscope (LeicaDM6000CS, Wetzlar, Germany). Cells nuclei were stained with DAPI.
3. Results and Discussions
3.1. Synthesis and Optical Characterization of GQDs
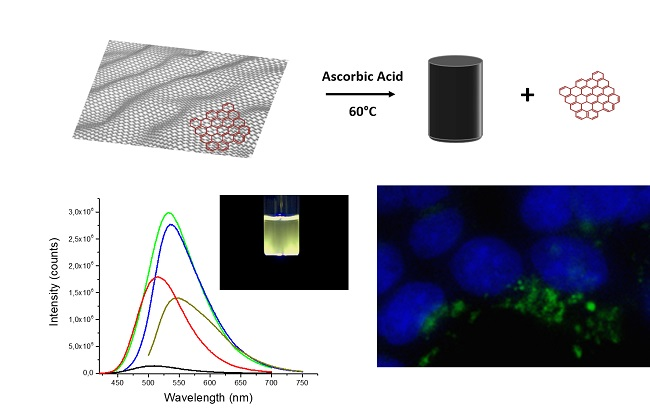
Figure 1A shows the synthesis scheme of the GQDs formation. The chemical reduction of graphene oxide by ascorbic acid in the absence of mechanical agitation causes the formation of a graphene hydrogel derived from the assembly of graphene oxide induced by π–π stacking between individual sheets [20]. During the reduction process, the water fraction enriches in fluorescent graphene quantum dots. The fluorescent fraction was purified from the by-products by overnight dialysis versus Milli-Q water. Our hypothesis about the formation of GQDs during the reduction of the GO is that ascorbic acid could cause the fragmentation of the GO sheets. GO typically have a high number of defects on the basal plane. The reduction of edge functional groups could lead to the detachment of small graphene crystals from the sheets. These nanostructures have a high number of oxygen-containing functional groups resulting in a greater solubility in water, causing their enrichment in aqueous phase.
The purified GQDs were characterized by UV-Vis and photoluminescence spectroscopy. GQDs revealed an absorption peak at about 400 nm (Figure 1B), similar to those reported for other similar systems [18]. The main absorbance peak can be attributed to π–π* transitions of conjugated sp2 carbons in graphene. The component at about 380–420 nm may be attributed to n–p* transitions of C–O [21]. GQDs revealed an intense photoluminescence (PL) emission in the visible range. The position of the maximum of the fluorescence peak depends on the excitation wavelength. Peak shifts of about 60 nm were measured for excitation from 420 to 500 nm, with a concomitant change in PL intensity (Figure 1C).
This excitation-dependent PL behavior is similar to that reported in the literature for carbon-based fluorescent dots [1,2,3,4,5,6,7,22] and may be a consequence of the broad distribution of the orbital energy of the defect states. The PL quantum yield of the GQDs calculated using quinine sulphate as a reference (QY = 0.54) was about 0.053. This value is similar to that reported in literature for luminescent graphene carbon dots [22,23], but much lower respect to the nitrogen doped GQDs synthesized recently by Qu et al. [24].
3.2. Chemical and Morphological Characterization of GQDs
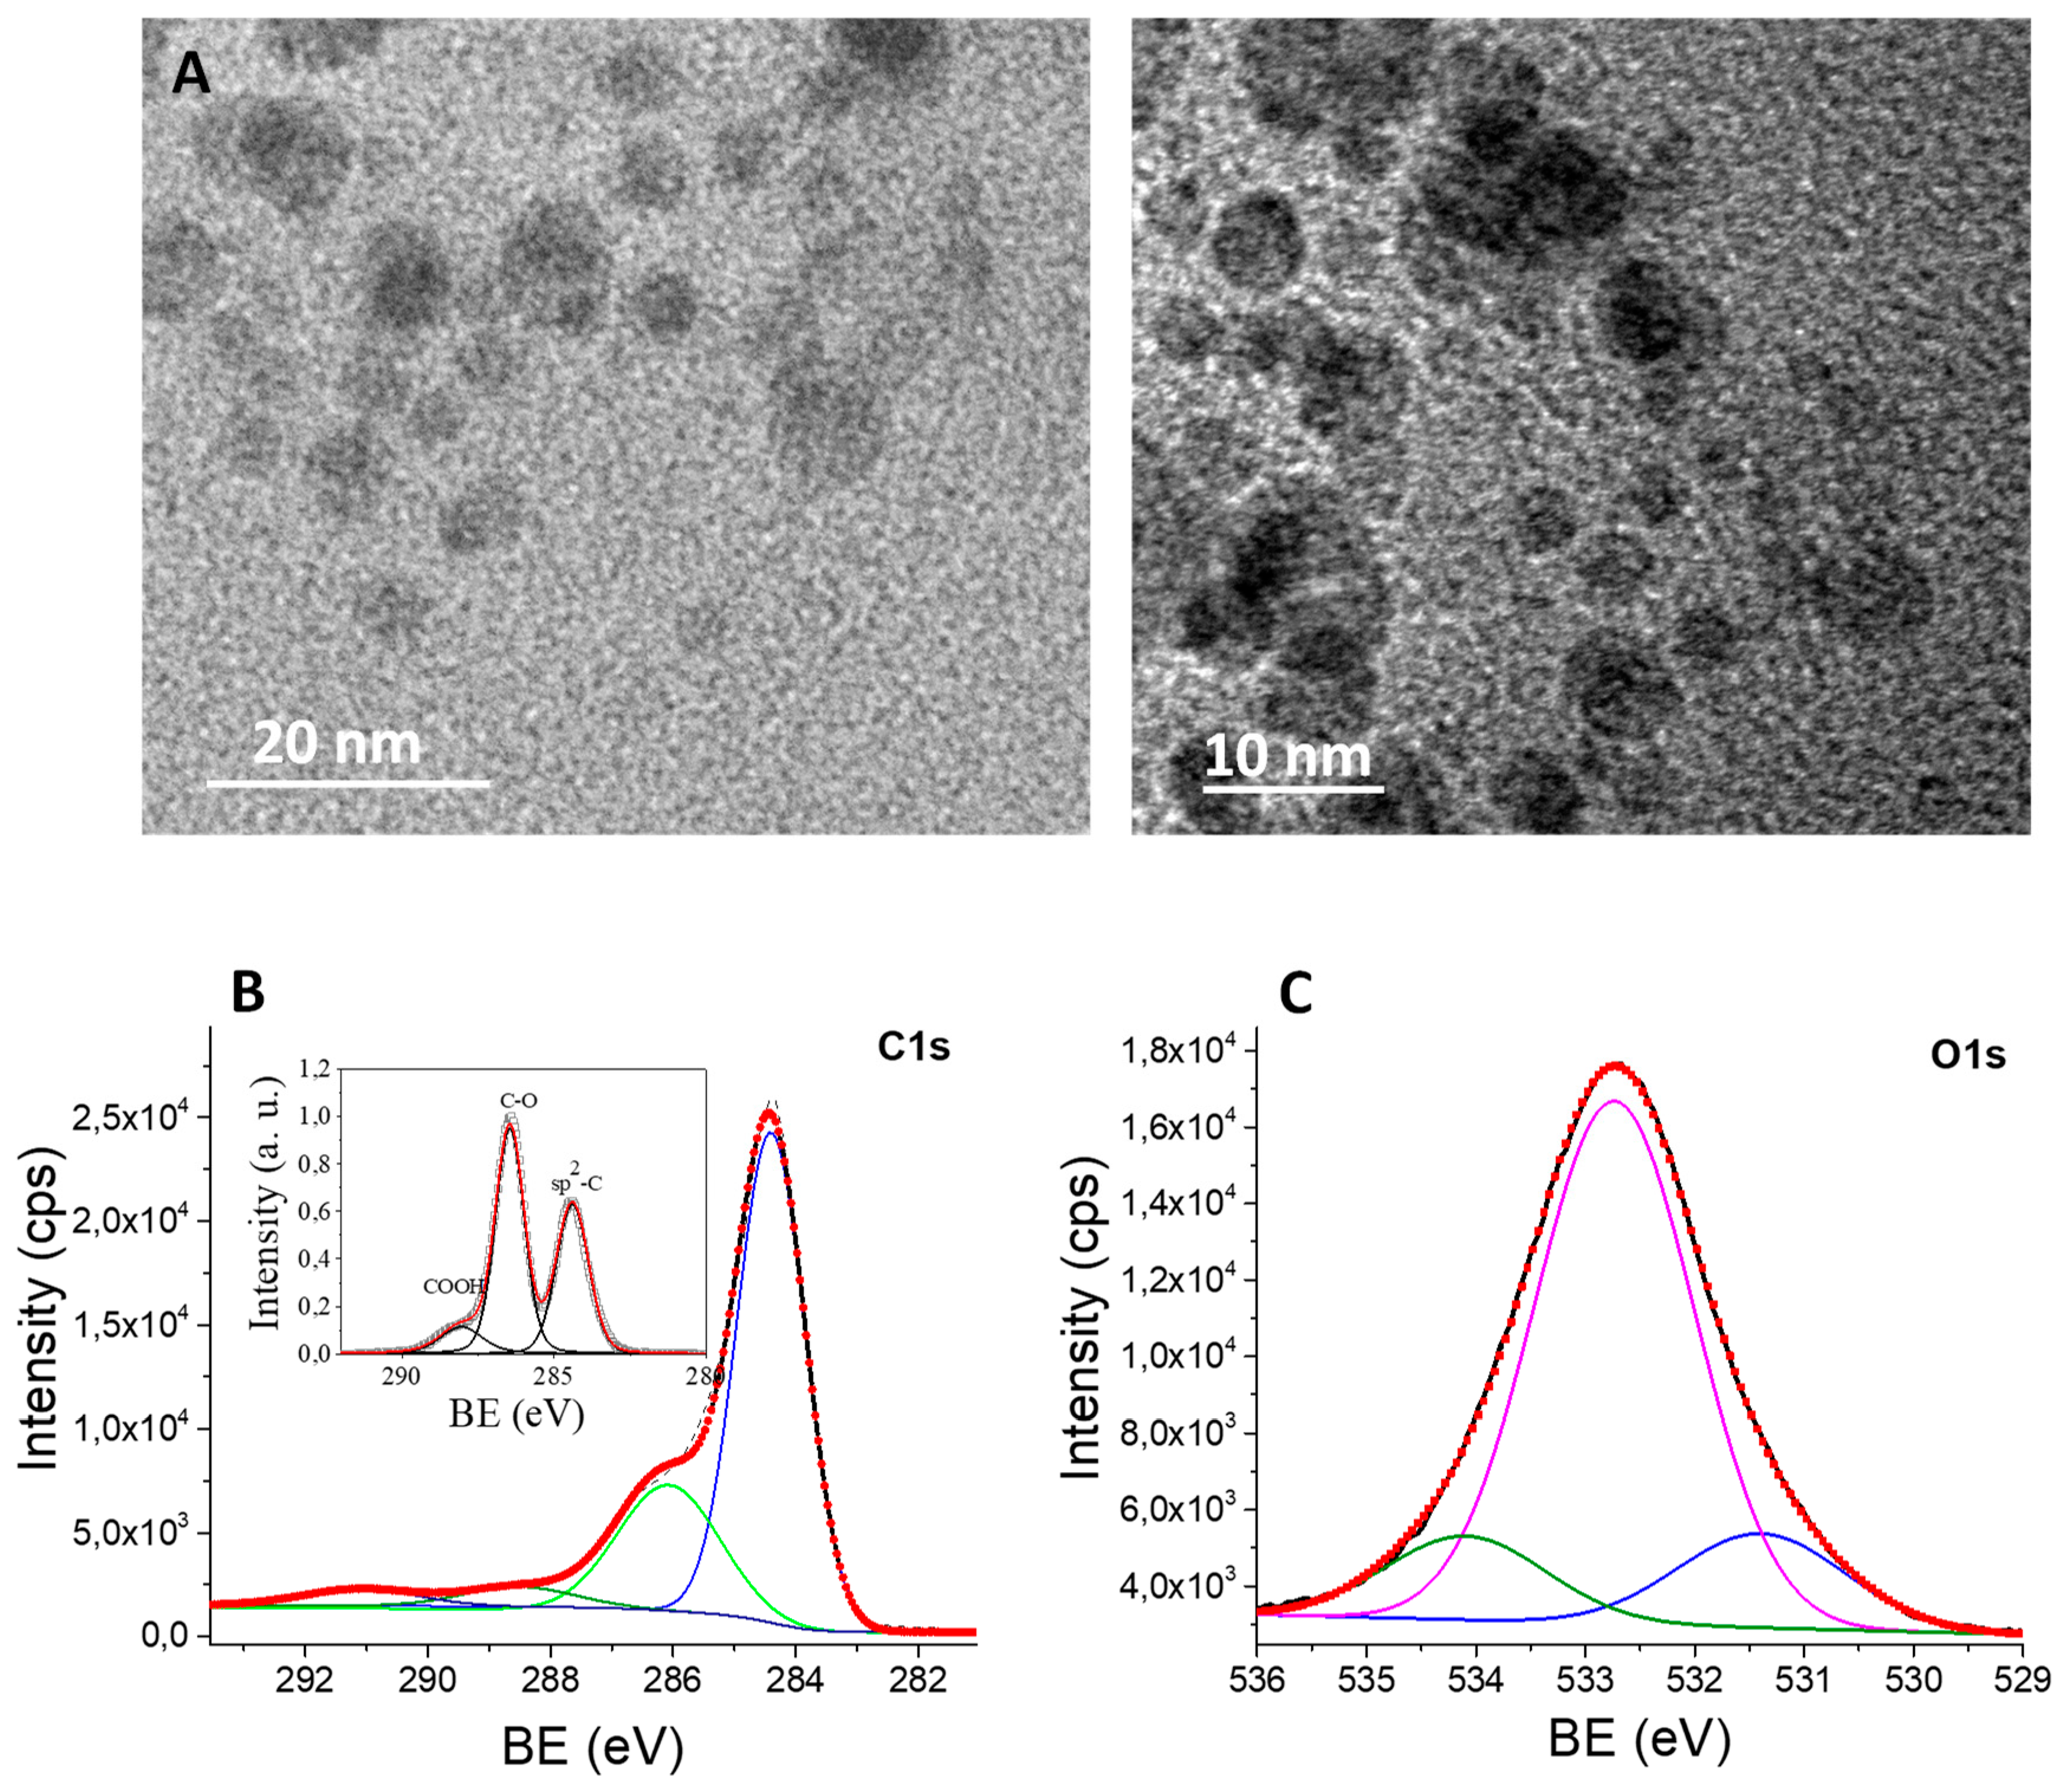
Figure 2A reports the TEM analysis of the GQDs. The average dimension calculated by TEM is about 5–10 nm. The GQDs are likely to be composed by multilayered graphene fragments formed during the ascorbic acid reduction. The dimensions of the GQDs are very similar to that reported by other groups in literature [23,24]. The GQDs were analyzed by X-ray photoelectron spectroscopy (XPS) to obtain qualitative and quantitative information on the chemical composition of the constitutive elements, as reported in Figure 2B,C and Table 1. GQDs C1s spectrum was composed by peaks at about 284.4, 286.3 and 288.8 eV assigned to the sp2-C, C-O and COOH bonds, respectively (Figure 2B). The O1s core line was fitted with three peaks. The peaks at about 531.4 and 534.1 eV were associated to COOH oxygen, while the principal peak at 532.4 was attributed to the C-OH bond. As reported in the inset of Figure 2B, the C1s of the GO revealed a much higher content of oxidized carbons respect to GQDs.
This is a consequence of the reduction of the GQDs by the ascorbic acid during the graphene hydrogel formation. The estimated C/O ratio for the GQDs obtained from the XPS analysis was 5.28, much higher than that of the GO used for the synthesis (1.47) [20]. The lower content of oxygen-containing groups in the GQDs compare to the GO is the main responsible for their photoluminescence properties. The higher content of sp2 carbons in the GQDs induces the modulation of the density of states near the Fermi level. The excitation of the defect states creates an exciton that recombines with the emission of photons with different energies [25].
3.3. Biological Imaging with GQDs
To investigate the behavior of the GQDs in cell environment, HeLa cells were incubated with purified GQDs for 1 h. The localization of the nanodots inside the cells was checked by fluorescence microscopy. GQDs fluorescence was collected from 500 to 600 nm with an excitation wavelength of 488 nm near the maximum of the GQDs excitation spectrum. DAPI photoluminescence was collected from 400 to 500 nm with an excitation wavelength of 340 nm.
In Figure 3A–C, the fluorescence microscopy images of HeLa cells incubated with GQDs are reported. The emission of the GQDs appeared as isolated spots distributed near the cell nuclei. In Figure 3E, the plot of the cross-section PL line of the two channels (green and blue) of Figure 3D is reported. The green spectrum is associated to the GQDs PL, while the blue line is associated to the DAPI fluorescence. Fluorescence microscopy results showed that the dots were mainly localized in the perinuclear region of the cells. This supports the hypothesis that in the first stage of the endocytic process, the dots are localized into intracellular endosomes, confirming an efficient internalization of the GQDs inside living cell. In conclusion, GQDs isolated from the synthesis of mesoporous graphene hydrogel present a strong photoluminescence in the visible. The synthesis is easy and does not require organic solvents or expensive equipment. In Table 2, a summary of recent GQDs produced by both bottom-up and top-down approaches is reported. The characteristics of our GQDs are very similar to those reported for GQDs obtained with different synthesis techniques.
4. Conclusions
Nano-graphene quantum dots were efficiently isolated by ascorbic acid reduction of graphene oxide at mild temperature. The process for the isolation of the GQDs is low-cost, green and highly reproducible. The resulting GQDs exhibited a mean diameter of 5–10 nm. The isolated GQDs revealed a strong photoluminescence in the visible range with a quantum yield of 5.3% and typical excitation-dependent PL emission. The GQDs have demonstrated the ability to penetrate the external cellular membrane and localize near the perinuclear region in HeLa cells. GQDs possess reduced toxicity compared with luminescent semiconductor nanocrystals. Compared to organic dyes, carbon nanostructures show a better photoluminescence stability. Thanks to their intense PL, GQDs can be of significant interest for applications in biological imaging.
Author Contributions
Data curation, A.D.P.; project administration, L.M.
Funding
This research received no external funding.
Acknowledgments
We thank the Laboratory of Biomolecular Sequence and Structure Analysis for Health (LaBSSAH) for the technical support. We also want to thank Giorgio Speranza for useful discussions.
Conflicts of Interest
The authors declare no conflict of interest. Luca Minati and Alessia Del Piano are employees of Immagina Biotechnology srl. The founding sponsors had no role in the design of the study; in the collection, analyses, or interpretation of data; in the writing of the manuscript, and in the decision to publish the results.
References
- Koutsioukis, A.; Belessi, V.; Georgakilas, V. Fluorescent Carbon Dots Ink for Gravure Printing. C 2019, 5, 12. [Google Scholar] [CrossRef]
- Kasouni, A.; Chatzimitakos, T.; Stalikas, C. Bioimaging Applications of Carbon Nanodots: A Review. C J. Carbon Res. 2019, 5, 19. [Google Scholar] [CrossRef]
- Baker, S.; Baker, G. Luminescent carbon nanodots: Emergent nanolights. Angew. Chem. Int. Ed. 2010, 49, 6726–6744. [Google Scholar] [CrossRef] [PubMed]
- Wang, R.; Lu, K.; Tang, Z.; Xu, Y. Recent progress in carbon quantum dots: Synthesis, properties and applications in photocatalysis. J. Mater. Chem. A 2017, 5, 3717–3734. [Google Scholar] [CrossRef]
- Wang, Y.; Hu, A. Carbon quantum dots: Synthesis, properties and applications. J. Mater. Chem. C 2014, 2, 6921–6939. [Google Scholar] [CrossRef]
- Sharma, V.; Tiwari, P.; Mobin, S. Sustainable carbon-dots: Recent advances in green carbon dots for sensing and bioimaging. J. Mater. Chem. B 2017, 5, 8904–8924. [Google Scholar] [CrossRef]
- Su, X.; Xu, Y.; Che, Y.; Liao, X.; Jiang, Y. A type of novel fluorescent magnetic carbon quantum dots for cells imaging and detection. J. Biomed. Mater. Res. Part A 2015, 103, 3956–3964. [Google Scholar] [CrossRef]
- Sun, Z.; Li, X.; Wu, Y.; Wei, C.; Zeng, X. Origin of green luminescence in carbon quantum dots: Specific emission bands originate from oxidized carbon groups. New J. Chem. 2018, 42, 4603–4611. [Google Scholar] [CrossRef]
- Liu, M.L.; Chen, B.B.; Li, C.M.; Huang, C.Z. Carbon dots: Synthesis, formation mechanism, fluorescence origin and sensing applications. Green Chem. 2019, 21, 449–471. [Google Scholar] [CrossRef]
- Riggs, J.E.; Guo, Z.L.; Carroll, D.; Sun, Y.P. Strong Luminescence of Solubilized Carbon Nanotubes. J. Am. Chem. Soc. 2000, 122, 5879–5880. [Google Scholar] [CrossRef]
- Chen, B.; Li, F.; Li, S.; Weng, W.; Guo, H.; Guo, T.; Zhang, X.; Chen, Y.; Huang, T.; Hong, X.; et al. Large scale synthesis of photoluminescent carbon nanodots and their application for bioimaging. Nanoscale 2013, 5, 1967–1971. [Google Scholar] [CrossRef] [PubMed]
- Qu, K.; Wang, J.; Ren, J.; Qu, X. Carbon Dots Prepared by Hydrothermal Treatment of Dopamine as an Effective Fluorescent Sensing Platform for the Label-Free Detection of Iron(III) Ions and Dopamine. Chem. A Eur. J. 2013, 19, 7243–7249. [Google Scholar] [CrossRef] [PubMed]
- Liu, C.; Zhang, P.; Tian, F.; Li, W.; Li, F.; Liu, W. One-step synthesis of surface passivated carbon nanodots by microwave assisted pyrolysis for enhanced multicolor photoluminescence and bioimaging. J. Mater. Chem. 2011, 21, 13163–13167. [Google Scholar] [CrossRef]
- Yang, S.T.; Cao, L.; Luo, P.G.; Lu, F.; Wang, X.; Wang, H.; Meziani, M.J.; Liu, Y.; Qi, G.; Sun, Y.P. Carbon Dots for Optical Imaging in vivo. J. Am. Chem. Soc. 2009, 131, 11308–11309. [Google Scholar] [CrossRef] [PubMed]
- Liu, H.; Ye, T.; Mao, C. Fluorescent Carbon Nanoparticles Derived from Candle Soot. Angew. Chem. Int. Ed. 2007, 46, 6473–6475. [Google Scholar] [CrossRef] [PubMed]
- Peng, J.; Gao, W.; Gupta, B.K.; Liu, Z.; Romero-Aburto, R.; Ge, L.; Song, L.; Alemany, L.B.; Zhan, X.; Gao, G.; et al. Graphene quantum dots derived from carbon fibers. Nano Lett. 2012, 12, 844–849. [Google Scholar] [CrossRef]
- Tang, D.; Liu, J.; Yan, X.; Kang, L. The graphene oxide derived graphene quantum dots with different photoluminescence properties and peroxidase-like catalytic activity. RSC Adv. 2016, 6, 50609–50617. [Google Scholar] [CrossRef]
- Zhao, Y.; Wu, X.; Sun, S.; Ma, L.; Zhang, L.; Lin, H. A facile and high-efficient approach to yellow emissive graphene quantum dots from graphene oxide. Carbon 2017, 124, 342–347. [Google Scholar] [CrossRef]
- Speranza, G.; Canteri, R. RxpsG a new open project for Photoelectron and Electron Spectroscopy data processing. SoftwareX 2019, 46, 100282. [Google Scholar] [CrossRef]
- Minati, L.; Aguey-Zinsou, K.F.; Micheli, V.; Speranza, G. Palladium nanoparticle functionalized graphene xerogel for catalytic dye reduction. Dalton Trans. 2018, 47, 14573–14579. [Google Scholar] [CrossRef] [PubMed]
- Bergeret, C.; Cousseau, J.; Fernandez, V.J.; Mevellec, Y.; Lefrant, S.J. Spectroscopic Evidence of Carbon Nanotubes’ Metallic Character Loss Induced by Covalent Functionalization via Nitric Acid Purification. J. Phys. Chem. C 2008, 11, 16411–16416. [Google Scholar] [CrossRef]
- Minati, L.; Torrengo, S.; Maniglio, D.; Migliaresi, C.; Speranza, G. Luminescent graphene quantum dots from oxidized multi-walled carbon nanotubes. Mater. Chem. Phys. 2012, 137, 12–16. [Google Scholar] [CrossRef]
- Shinde, D.B.; Pillai, V.K. Electrochemical Preparation of Luminescent Graphene Quantum Dots from Multiwalled Carbon Nanotubes. Chem. A Eur. J. 2012, 18, 12522–12528. [Google Scholar] [CrossRef]
- Qu, D.; Zheng, M.; Zhang, L.; Zhao, H.; Xie, Z.; Jing, X.; Haddad, R.E.; Fan, H.; Sun, Z. Formation mechanism and optimization of highly luminescent N-doped graphene quantum dots. Sci. Rep. 2014, 4, 5294. [Google Scholar] [CrossRef] [PubMed]
- Minati, L.; Speranza, G.; Bernagozzi, I.; Torrengo, S.; Chiasera, A.; Ferrari, M. Luminescent short thiol-functionalized multi-wall carbon nanotubes. Diam. Relat. Mater. 2011, 20, 1046–1049. [Google Scholar] [CrossRef]
- Shen, J.; Zhu, Y.; Chen, C.; Yang, X.; Li, C. Facile preparation and upconversion luminescence of graphene quantum dots. Chem. Commun. 2011, 47, 2580–2582. [Google Scholar] [CrossRef]
- Pan, D.; Zhang, J.; Li, Z.; Wu, M. Hydrothermal Route for Cutting Graphene Sheets into Blue-Luminescent Graphene Quantum Dots. Adv. Mater. 2010, 22, 734–738. [Google Scholar] [CrossRef]
- Dong, Y.; Shao, J.; Chen, C.; Li, H.; Wang, R.; Chi, Y.; Lin, X.; Chen, G. Blue luminescent graphene quantum dots and graphene oxide prepared by tuning the carbonization degree of citric acid. Carbon 2012, 12, 4738–4743. [Google Scholar] [CrossRef]
- Guo, Z.; Cai, B.; Cao, Q.; Su, Y.; Li, M.; Hu, J.; Yang, Z.; Zhang, Y. Facile synthesis of amine-functionalized graphene quantum dots with highly pH-sensitive photoluminescence. Fullerenes Nanotub. Carbon Nanostruct. 2017, 25, 704–709. [Google Scholar] [CrossRef]
- Wu, X.; Tian, F.; Wang, W.; Chen, J.; Wu, M.; Zhao, J.X. Fabrication of highly fluorescent graphene quantum dots using L-glutamic acid for in vitro/in vivo imaging and sensing. J. Mater. Chem. C 2013, 31, 4676–4684. [Google Scholar] [CrossRef]
- Huang, Z.; Shen, Y.; Li, Y.; Zheng, W.; Xue, Y.; Qin, C.; Zhang, B.; Hao, J.; Feng, W. Facile synthesis of analogous graphene quantum dots with sp2 hybridized carbon atom dominant structures and their photovoltaic application. Nanoscale 2014, 6, 13043–13052. [Google Scholar] [CrossRef] [PubMed]
- Guin, J.P.; Guin, S.K.; Debnath, T.; Ghosh, H.N. Chemically clean single-step oxido-reductive synthesis of green luminescent graphene quantum dots as impending electrocatalyst. Carbon 2016, 109, 517–528. [Google Scholar] [CrossRef]
- Yeh, T.F.; Chen, S.J.; Teng, H. Synergistic effect of oxygen and nitrogen functionalities for graphene-based quantum dots used in photocatalytic H2 production from water decomposition. Nano Energy 2015, 12, 476–485. [Google Scholar] [CrossRef]
- Luk, C.M.; Chen, B.L.; Teng, K.S.; Tang, L.B.; Lau, S.P. Optically and electrically tunable graphene quantum dot–polyaniline composite films. J. Mater. Chem. C 2014, 2, 4526–4532. [Google Scholar] [CrossRef]
Figure 1.
(A) Synthesis scheme of the isolation of GQDs from graphene hydrogel. (B) Absorption spectrum of GQDs in water. Inset: PL of GQDs excited at 450 nm. (C) PL spectra obtained using excitation wavelengths from 420 to 500 with a 20 nm step.
Figure 1.
(A) Synthesis scheme of the isolation of GQDs from graphene hydrogel. (B) Absorption spectrum of GQDs in water. Inset: PL of GQDs excited at 450 nm. (C) PL spectra obtained using excitation wavelengths from 420 to 500 with a 20 nm step.

Figure 2.
(A) TEM images of GQDs. C1s (B) and O1s (C) core line X-ray photoelectron spectroscopy of GQDs. Inset: XPS C1s of GO.
Figure 2.
(A) TEM images of GQDs. C1s (B) and O1s (C) core line X-ray photoelectron spectroscopy of GQDs. Inset: XPS C1s of GO.

Figure 3.
Fluorescent microscopy analysis of HeLa cell incubated with GQDs. (A) DAPI. (B) GQDs. (C) Merge. (E) Cross section plot for the DAPI and GQDs channels in the line reported in (D).
Figure 3.
Fluorescent microscopy analysis of HeLa cell incubated with GQDs. (A) DAPI. (B) GQDs. (C) Merge. (E) Cross section plot for the DAPI and GQDs channels in the line reported in (D).


Table 1.
Quantification results and bonds assignment of GQDs.
| Component | BE (eV) | Conc. at. % | Bond |
|---|---|---|---|
| C1s1 | 288.8 | 2.3 | COOH |
| C1s2 | 286.3 | 12.8 | C–OH, C–O–C |
| C1s3 | 284.4 | 69 | sp2C |
| O1s1 | 534.1 | 2.1 | COOH |
| O1s2 | 532.4 | 11.3 | C–OH, C–O–C |
| O1s3 | 531.4 | 2.5 | COOH |
Table 2.
A brief summary of the synthesis, morphologies and applications of GQDs.
| Synthesis | Source | Dimension | QY | Applications | Ref. |
|---|---|---|---|---|---|
| Carbonization | sucrose | 1.8 nm | 21% | Cell imaging | [11] |
| Hydrothermal | Dopamine | 3.8 nm | - | Detection of Iron(III) Ions | [12] |
| Acid oxidation | GO | 3–4 nm | - | peroxidase-like catalytic activity | [17] |
| Hydrazine reduction | GO | 10–20 nm | 7.4% | Blue emitting GQDs | [26] |
| Hydrothermal | GO | 12 nm | 6,9% | Blue emitting GQDs | [27] |
| Hydrothermal | Citric acid | 6–12 nm | 9% | Blue emitting GQDs | [28] |
| Hydrothermal | 1,5-dinitronaphthalene | 1.5 nm | - | Green-yellow emitting GQDs | [29] |
| Hydrothermal | L-glutamic acid | 5 nm | 54.5% | NIR emitting GQDs | [30] |
| Microwave assisted hydrothermal | glucose | 4 nm | 5.2% | Green-red emitting GQDs | [31] |
| Liquid exfoliation | GO | 3 nm | 0.9% | Green emitting GQDs | [32] |
| Liquid exfoliation | GO | 5 nm | 12.8% | photocatalytic H2 production | [33] |
| Nanolithography | Graphene | 10 nm | - | Molecular-scale electronics | [34] |
© 2019 by the authors. Licensee MDPI, Basel, Switzerland. This article is an open access article distributed under the terms and conditions of the Creative Commons Attribution (CC BY) license (http://creativecommons.org/licenses/by/4.0/).
Share and Cite
MDPI and ACS Style
Minati, L.; Del Piano, A. Facile Synthesis of Water-Soluble, Highly-Fluorescent Graphene Quantum Dots from Graphene Oxide Reduction for Efficient Cell Labelling. C 2019, 5, 77. https://0-doi-org.brum.beds.ac.uk/10.3390/c5040077
AMA Style
Minati L, Del Piano A. Facile Synthesis of Water-Soluble, Highly-Fluorescent Graphene Quantum Dots from Graphene Oxide Reduction for Efficient Cell Labelling. C. 2019; 5(4):77. https://0-doi-org.brum.beds.ac.uk/10.3390/c5040077
Chicago/Turabian StyleMinati, Luca, and Alessia Del Piano. 2019. "Facile Synthesis of Water-Soluble, Highly-Fluorescent Graphene Quantum Dots from Graphene Oxide Reduction for Efficient Cell Labelling" C 5, no. 4: 77. https://0-doi-org.brum.beds.ac.uk/10.3390/c5040077
Note that from the first issue of 2016, this journal uses article numbers instead of page numbers. See further details here.