Article

Characterization of Molecular Spacer-Functionalized Nanostructured Carbons for Electrical Energy Storage Supercapacitor Materials

1
Department of Chemistry, University of North Carolina at Charlotte, Charlotte, NC 28223, USA
2
Chair of Physical and Colloid Chemistry, Southern Federal University, Rostov-on-Don, Rostov Oblast 344006, Russia
*
Author to whom correspondence should be addressed.
Submission received: 28 August 2020 / Revised: 18 October 2020 / Accepted: 19 October 2020 / Published: 23 October 2020
(This article belongs to the Collection Feature Papers in the Science and Engineering of Carbons)

Abstract

:
The use of molecular spacers between Carbon Nanotubes (CNTs) has been shown to increase the ion-accessible surface area for use in supercapacitor materials. Maintaining porosity and electrical conductivity is important for maximizing capacitance, energy storage, and power. Two reported novel coordination complexes have shown exceptional Faradaic charge transfer and binding capabilities to prevent CNT aggregation. Dispersion stability measurements show less aggregation of HiPco Single Walled CNTs (SWCNTs) compared to other chirality and multilayered nanotubes. Cu2FcOH binds weakly to CNTs compared +2Zn2 and +2Ru2 due to Columbic electrostatic interactions, which is favorable because it does not collapse the electrical double layer as strongly as +2Zn2 or +2Ru2. Adsorption isotherms and a full characterization (1H NMR, ATR FT-IR, UV-Vis, CV) of these novel complexes are presented. Electrical characterization using CV, charge discharge, and electrochemical impedance spectroscopy and the supercapacitor performance of functionalized thin film electrodes are presented as a function of spacer properties and nanostructured carbon tube diameter. This study uses rigid, earth-abundant coordination complexes that bind to and intercalate between SWCNTs. These functionalized nanostructured carbons are then used to make electrodes for electrical double layer supercapacitors. A complete description of the synthesis, characterization, and processing of these materials is described.

Graphical Abstract

1. Introduction

Supercapacitors have the ability to store and discharge electrical energy quickly and efficiently with minimal degradation over long life cycles [1]. These characteristics make them ideal for consumer and potential grid-scale applications [2]. However, supercapacitors lack high energy density compared to advanced battery technology [3,4]. The energy density of supercapacitors can be improved by incorporating hybrid nanostructured carbon materials [5].
Nanoscale materials have intrinsically larger surface area to volume ratios and therefore possess a higher specific surface area (SSA) [5]. Carbon nanotubes (CNTs) have high electrical conductivity and high SSA on which charges can be stored, making them viable supercapacitors materials [6]. However, CNTs in films and devices will aggregate and reduce their ion-accessible SSA [6]. Recently, the addition of aromatic amines or triethanolamine to nanostructured carbon has been shown to enhance capacitance performance [7,8,9] by increasing spacing between graphene oxide layers, reducing aggregation, and increasing the ion-accessible surface area.
We have previously shown that molecular spacers can increase dispersion stability and capacitance [7,10]. The molecular spacers increase ion transport between CNTs as well as ion-accessible SSA. In this paper we compare our previous ruthenium-based and zinc-based spacers with more sustainable earth-abundant divalent, dinuclear copper coordination complexes used as molecular spacers in CNT electrodes. These new molecular spacers possess extended conjugation and redox active ligands, which can facilitate electron transport between adjacent CNTs and act as fast faradaic charge storage sites. The spacers bind to the CNTs via π-π stacking from aromaticity on the nanotube sidewall and the bridging ligand between the metal centers in these molecular spacers. Additionally, electrostatic interactions between the negative zeta potential on dispersed CNT surfaces and the positively charged spacer contribute to the adsorbate’s binding strength. Mismatches between CNT curvature and steric effects on the spacers decrease the binding strength between the complex and the tube’s surface.
CNTs as electrode materials in electrical double-layer supercapacitors perform well due to their high SSA and electrical conductivity. Molecular spacers were intercalated into the film structure as illustrated in Figure 1. Mononuclear and multinuclear coordination complexes were used as molecular spacers in CNT dispersions. These spacers maintain SSA during deposition of the CNT electrodes and increase the electron transfer and ion adsorption onto their surfaces, thereby enhancing the energy storage capabilities of these nanostructured carbon materials. Long-range interactions (LRI) between those ionic species and CNTs were studied [10]. Dispersion stability and aggregation kinetics were measured for a variety of CNTs with all of the molecular spacers. Furthermore, solvents affect the stability of CNTs and the LRI of these tubes with the molecular spacers. Two common non-aqueous dispersing solvents N,N-dimethylformamide (DMF) and N-methyl-2-pyrrolidinone (NMP), were studied. Different mixtures of the solvents were examined, and the dispersion stability of CNTs was measured and showed high stability in mixtures of both DMF and NMP [7].
Several metal coordination complexes, +2Ru2, +2Zn2, +2Cu2FcOH, and Cu2FcOH (see Section 2.1 for definition of molecular spacers), were adsorbed to various chirality single-walled carbon nanotubes as molecular spacers. When molecular spacers intercalate between CNTs, they work as a barrier and a bridge between tubes, preventing aggregation, increasing the ion-accessible SSA, and maintaining good electrical conductivity, making them ideal supercapacitor materials. Dispersion stability measurements were conducted to determine the stability of CNTs in DMF using these coordination complexes as coagulants. The coagulants were added to the single-walled carbon nanotube (SWCNT), few-walled carbon nanotube (FWCNTs), or multi-walled carbon nanotube (MWCNT) dispersions. The complexes have different charges, nuclearity, and π-π stacking interactions with the various classes of CNTs. For example, the +2Zn2 complex binds stronger to SWCNTs due to electrostatics and π-π stacking but decreases CNT stability due to a more rapid collapse of the electric double layer (EDL). A full characterization of the molecular spacers was conducted to access potential applications in energy storage devices. These data are presented below.
A fundamental understanding of how molecular spacers interact with CNTs will be discussed. Specifically, we explored the role that tube curvature played in the adsorption kinetics and binding strength of molecular spacers to the nanostructured carbon tubes. In Figure 2, we illustrate the +2Zn2 complex bound to the surface of various CNTs with increasing larger radii of curvature. In these computational models, the C atoms of the CNTs were fixed and the coordination complex’s geometry was optimized using DFT (PBE functional) theory.

2. Experimental Section

2.1. Carbon Nanotube Dispersion and Spacer Solutions

Carbon nanotube dispersions were made by adding 0.5 mg CNTs (Grade P CNT, 0.8–1.2 nm diameter, 100-1000 nm length; Lot # P0276) to 30 mL N,N-dimethylformamide (DMF) (Fisher, Spectranalyzed (Waltham, MA, US)) or NMP. The solution was tip sonicated at 10 W (root mean squared power) (RMS) for 30 min using a Fisher Scientific Sonic Dismembrator 100). The solution was ultra-centrifuged at 20,000 g for 20 min to remove any bundled or aggregated tubes. The supernatant was collected, and the concentration of the stable dispersion was measured by NIR spectroscopy (CARY 5000 UV-Vis-NIR spectrometer).
Sodium bromide (NaBr) was used as purchased ((Fisher, Lot #067787)) and dried in a vacuum oven overnight. The molecular spacers were used as synthesized and dried in a vacuum oven overnight. Stock solutions of NaBr and molecular spacers were used for all experiments in this study. NaBr was dissolved in DMF or NMP and then used as a coagulant of the CNT dispersion. The coordination complexes were used as synthesized and were dried in a vacuum oven. Stock solutions of NaBr, the dinuclear copper coordination complex, biscopper [4-tert-butyl-2,6-diformylphenol bis-ferrocenoylhydrazone chloride] (Cu2FcOH) [11], biscopper [4-tert-butyl-2,6-diformylphenol bis-ferrocenoylhydrazone hydroxide]-(NO3)2 (+2Cu2FcOH), [11] dinuclear zinc coordination complex 4-(tert-butyl)-2,6-bis((2-(phthalazin-1-yl)hydrazono)methyl)phenol (m2-methoxo) dizinc(II)-acetate (+2Zn2) [7,11], and ruthenium coordination complex, [Cl(2,2′;6′,2′’-terpyridine)Ru(tetrapyrido- [3,2-α:2′,3′ -c:3′’,2′’-h:2′’,3′’-j]phenazine)Ru(2,2′;6′,2′’-terpyridine)Cl]- (PF6)2 (+2Ru2) [7,12] were made by dissolving the spacer in DMF or NMP, (2.1 mg–18.6 mg). The molecular structures of these compounds are illustrated in Figures S1–S3 in the Supplementary Materials (SM).

2.2. Dispersion Stability Measurements

NaBr was used as a coagulant to increase the ionic strength of the dispersion, lowering the EDL repulsive potential, and increasing the aggregation kinetics of the CNTs. Molecular spacers were adsorbed onto the surface of CNTs by adding varying concentrations (0–1200 µM) of coagulant to the stable CNT dispersion, followed by incubation for 48 h in the dark at room temperature. The samples were then centrifuged at 10,000 g RCF for 10 min to remove the aggregated tubes. Using a Cary 5000 UV-Vis-NIR spectrometer (Agilent, Santa Clara, CA, US), the concentrations of CNTs remaining in the supernatant were measured (wavelength determined by CNT absorption) and normalized to a control of pristine CNT dispersion. The aggregation data were fitted to a Maxwell–Boltzmann distribution described by electrical double layer (EDL) repulsion, and the dispersion stability was determined by Xo where 50% of the SWCNTs were still dispersed [13].

2.3. Adsorption Isotherm Measurements

Molecular spacers were adsorbed onto the surface of CNTs by adding varying concentrations of coagulant to a stable dispersion and left to incubate in the dark at room temperature for 2 h. The samples were filtered using a 13 mm, 0.2 µm pore size polypropylene membrane (Sterlitech Corp). CNTs cannot pass through these membranes, while any unbound molecular spacer does. This is the most effective method for separating functionalized tubes from the unbound molecular spacers. Using a Cary 5000 UV-Vis-NIR spectrometer, the concentrations of molecular spacer remaining in the supernatant were measured. The mass of spacer left in the supernatant was subtracted from the initial mass to calculate the mass of spacers adsorbed to the nanostructured carbon. Control studies were carried out to account for non-specific binding of the molecular spacers to the filter membranes and apparatus.

2.4. Zeta Potential and Hydrodynamic Radius DLS Measurements

Using a Malvern instrument (Malvern, UK) and Zetasizer software, zeta potential measurements were conducted on a dilute dispersion of FWCNTs and compared to the other zeta potential values obtained for SWCNTs of chirality 6,5 (Signis® SG65), single-walled CNTs of chirality 7,6 (Signis® SG76), and high-pressure carbon monoxide (HiPco) tubes.

2.5. Molecular Spacer Characterization

2.5.1. 1H NMR (JEOL 500 MHz)

A +2Zn2 sample was created using 3 mg of solid dissolved in 0.75 mL deuterated DMSO (+0.05% v/v TMS). A Cu2FcOH sample was created using 3 mg of solid dissolved in 0.75 mL deuterated DMSO (+0.05% v/v TMS). The solutions were left overnight to fully dissolve and equilibrate. A JEOL ECX 500 MHz spectrometer with 4096 scans and relaxation delay of 12 s was used. Scan axis was measured from −1–13 ppm. Peaks were integrated referenced to tBu. For the +2Zn2: 8.56 s (2H, CH=Narom.), 8.24 s (8H, CHarom.), 7.73 s (2H, CHarom.), 7.41 s (2H, NH), 1.84 s (2H, CH=N), 1.29 s (9H, CH). For Cu2FcOH: 5.49 s (4H, aromatic), 4.24 s (8H, C5H5), 3.18 d (10H, C5H5), 1.02 s (9H, CH). +2Cu2FcOH: 1.24 s (9H, tBu), 3.17 d (10H, C5H5), 4.09 q (4H, aromatic meta-C5H4). Spectra are shown in Figures S1 and S17–S19 in the Electronic Supplemental Materials.

2.5.2. ATR FT-IR

Solid samples of +2Zn2 and Cu2FcOH were placed on the diamond plate of a Perkin Elmer Spectrum 100 ATR FT-IR (Waltham, MA, US) and measured from 4000–600 cm−1 using 16 scans with a resolution of 4 cm−1. IR vibrational bond frequencies (ν, cm−1) of +2Zn2 and Cu2FcOH were measured. For +2Zn2: 3227 (NH), 1590 (C=N), 1395 (CHarom.), 1228 (CO). The NH bonds exhibit a slight broad peak while the other peaks are sharp. For Cu2FcOH: 3175 (NH), 1623 (C=O), 1596 (C=N), 504, 489 (Cp–Fe) [11]. For +2Cu2FcOH: Vibrations at 3341 (mostly likely a blend of –O–H and –N–H), 1616 (–C=O), 1550 (–C=N), and 1475 (aromatic –C=C) cm−1 show all of functional groups in the spacers. IR spectra of several molecular spacers are shown in Figures S6–S10 in the Supplementary Materials.

2.5.3. UV-Vis-NIR Spectroscopy

A Cary 5000 UV-Vis-NIR spectrometer was used to measure optical transitions of +2Zn2, +2Cu2FcOH, and Cu2FcOH in DMF. UV-Vis absorption was recorded from 300–800 nm with a spectral bandwidth of 1.0 nm. Quartz cuvettes with a path length of 10 mm were used. UV-Vis spectra and molar extinction coefficients for all of the spacers are shown in Figure 3.

2.5.4. Cyclic Voltammetry

A stock solution of 500 mM tetrabutylammonium tetrafluoroborate (TBATFB) was prepared in dry Ar(g) sparged DMF. +2Zn2 and Cu2FcOH in DMF had a concentration of 2.47 mM and 2.62 mM, respectively. The concentration of the +2Cu2FcOH was 112.3 µM. All samples were in a supporting electrolyte of 100 mM TBATFB in DMF. About 1.25 mL of the sample solution was placed in a quartz electrochemical cell and bubbled with argon gas for 10 min. A Ag/AgNO3 reference electrode (+0.5512 V vs. NHE) and Au honeycomb working and auxiliary electrode were placed into the cell and allowed to equilibrate for 5 min to reach quiescence. Using a Zahner Zennium electrochemical workstation (Kansas City, MO, US)), the samples were tested using a cathodic sweep from 0 to 1.3 V and back for four cycles at 200 samples per cycle with a slew rate of 100 mV s−1. The anodic sweep for +2Zn2 was measured from−2.5 V to 0 V, while that for Cu2FcOH was measured from −2.0 to 0 V.

2.6. EDL Capacitor Characterization

An SWCNT dispersion of known concentration was filtered through a 0.2 µm pore size, 13 mm diameter polytetrafluorethylene (PTFE) membrane filter (Sterlitech Corp). While keeping the film saturated with solvent, a drop of DMF was placed on the ITO glass electrode to help the transfer of SWCNTs from the membrane to the glass. The CNT film was placed on the conductive ITO side of the glass substrate. Three small sheets of lint-free cloth were placed on top of the membrane filter. Glass slides covered both sides of the electrode and were clamped together using two clamps located on both sides of the membrane filter. The entire setup was placed in a vacuum oven overnight at 100 °C, 20 in. Hg to remove the solvent. The membrane filter was peeled off to transfer SWCNTs to the ITO-coated glass. By measuring the total area of CNTs, the transferred area of CNTs was calculated. To account for missing or damaged SWCNTs on the membrane filter, ImageJ, photo-editing software, was used to determine the area of the transferred film, which was then converted to mass of the active material. Before use, each electrode was soaked in 100 mM TBATFB in DMF for at least two hours, allowing ion penetration. No change in capacitance was measured after further incubation of ~48 h.
A fresh sample of 100 mM TBATFB in DMF was pipetted into a quartz electrochemical cell and then sparged with argon gas for 10 min. The fabricated SWCNT/ITO working electrode, Ag/AgNO3 reference electrode (+0.5512 V vs. NHE), and polished platinum wire counter electrode were placed into the cell for 5 min prior to testing to reach quiescence. Using a Zahner Zennium electrochemical workstation, cyclic voltammetry was measured using a sweep range from −0.5–1 V for four cycles at 200 samples per cycle at slew rates of 500 and 100 mV s−1. Galvanostatic charge–discharge was measured from 0 to 1 V using currents of 500, 100, 50, and 20 μA. Electrochemical impedance spectroscopy was used at 0 and 1.0 V at an amplitude of 5 mV. An oscillating voltage was applied to the cell where the sinusoidal current was measured as a function of frequency. These data are shown in Figure S12A,B of the Electronic Supplementary Materials. The impedance measured at 1 V for pristine CNTs films was 250 ± 50 Ω and for the +2Cu2FcOH functionalized films, 420 ± 30 Ω. Increased impedance is consistent with less electrical contact between the CNTs due to the presence of the molecular spacers.

3. Results and Discussion

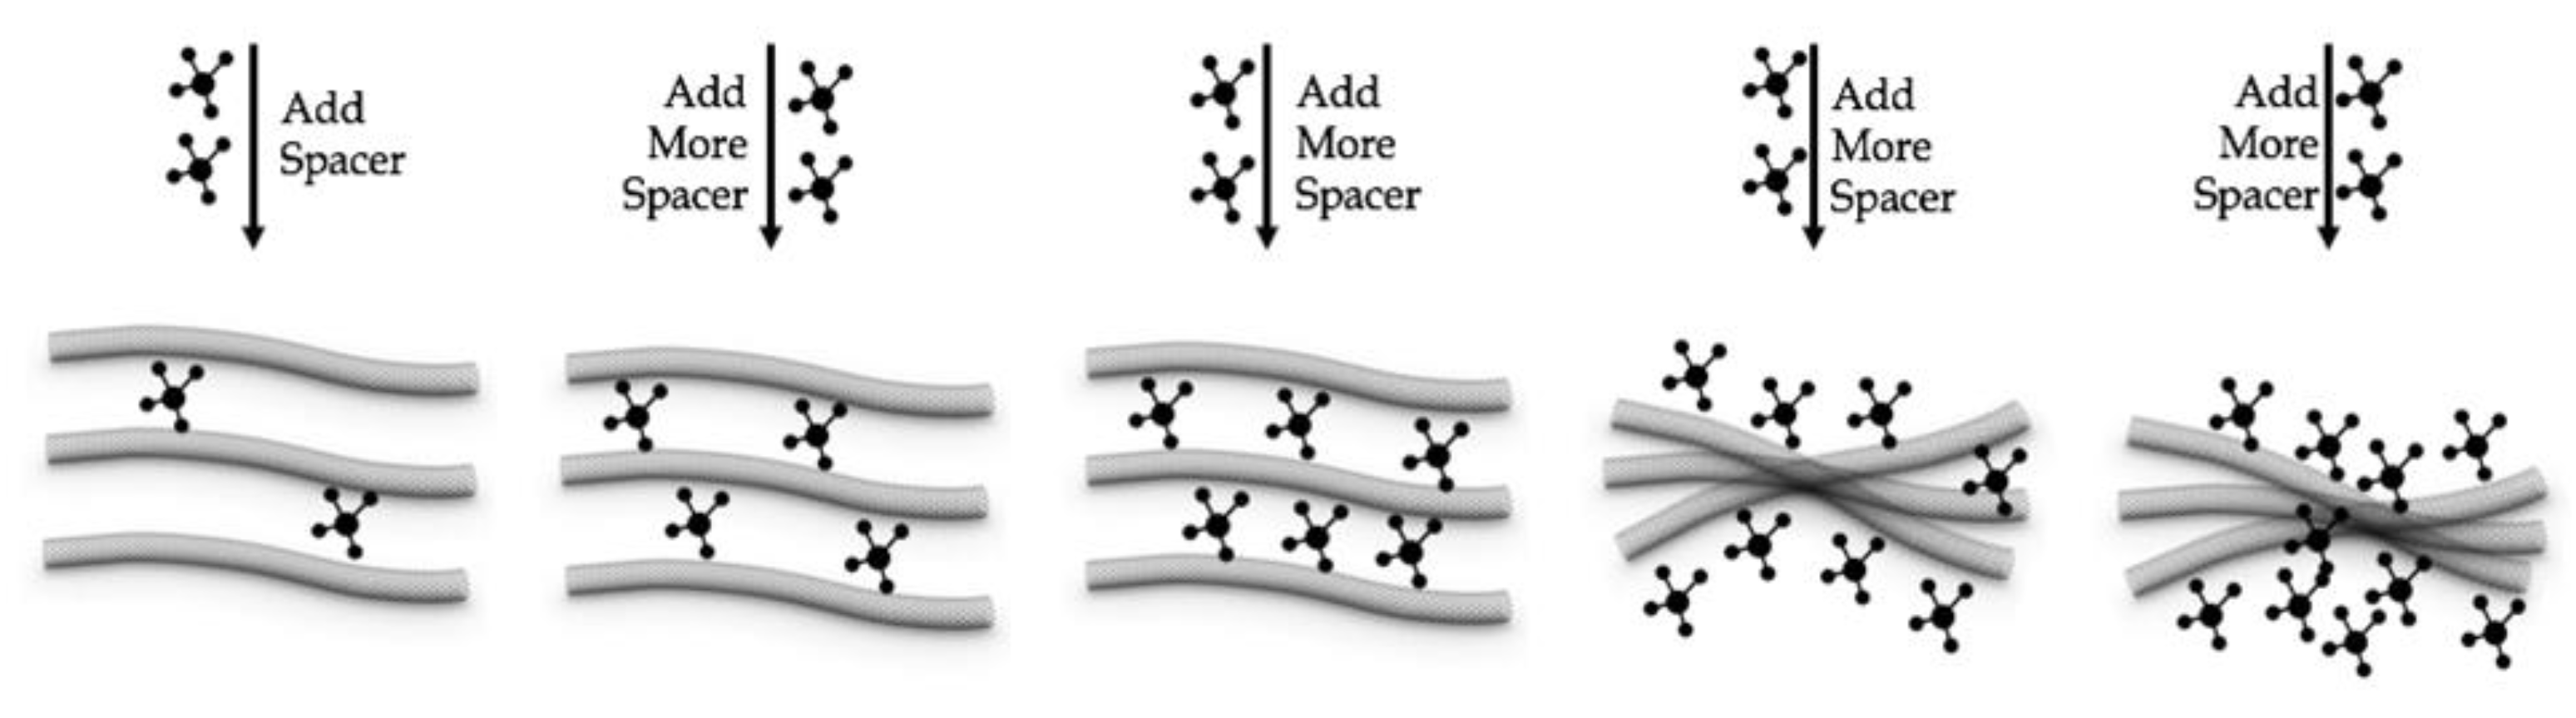
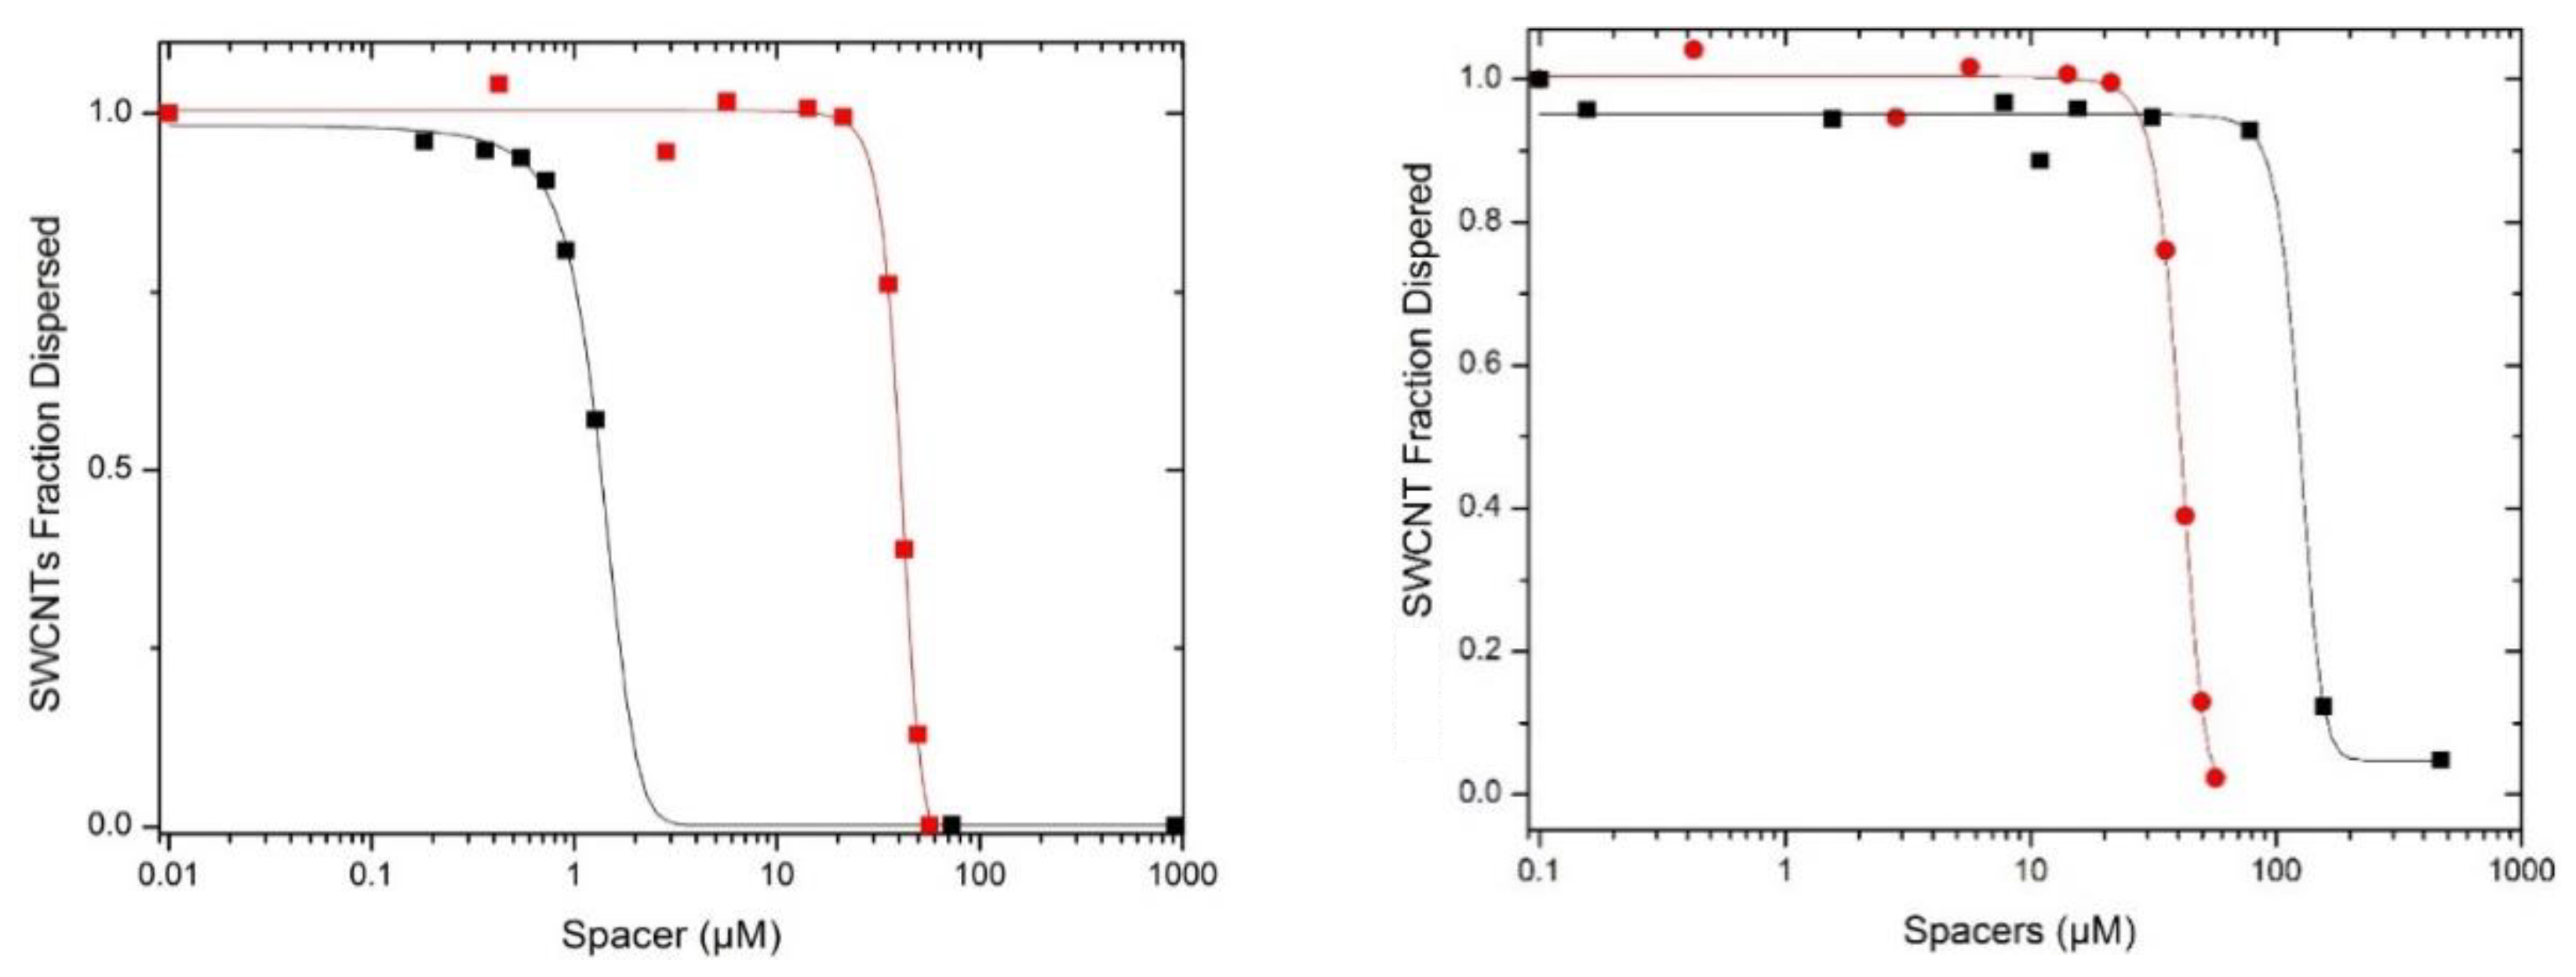
3.1. Dispersion Stability Measurements—Molecular Spacers on HiPco SWCNTs

In previous work, we showed that the presence of multinuclear molecular spacers affects the stability of the tube-tube repulsive barrier [10]. Changing the nuclearity, the charge, and concentration of the spacers controls the onset of aggregation. We measured the dispersion stability (Xo), which is the concentration of the coagulant at which half of the dispersed tubes aggregated. This concept is illustrated in Figure 4, and these data are shown in Figure 5. Dispersion stability measurements were conducted to determine the stability of CNTs in DMF using different concentrations of the +2Ru2, +2Zn2, +2Cu2FcOH, and Cu2FcOH complexes. The dispersed CNTs were measured as the concentration of spacer was increased. The dispersion stability of +2Zn2 in HiPco tubes was Xo = 40.6 ± 0.6 μM, which is much smaller than that measured for the Cu2FcOH spacer at 125 ± 10 μM. The complexes have different charges, nuclearity, and π-π stacking interactions with the SWCNTs. Cu2FcOH is a neutral complex and does not dissociate in DMF, which reduces the ionic strength, and therefore does not collapse the electrical double layer. As a result, CNTs are more stable with Cu2FcOH compared to the electrostatic collapse of the EDL from the strong electrolyte +2Cu2FcOH and the weak electrolyte +2Zn2. This increased dispersion stability leads to significantly higher loading of the electroactive complexes onto the SWCNTs, which may increase their utility as supercapacitor materials. These data are listed in Table 1.

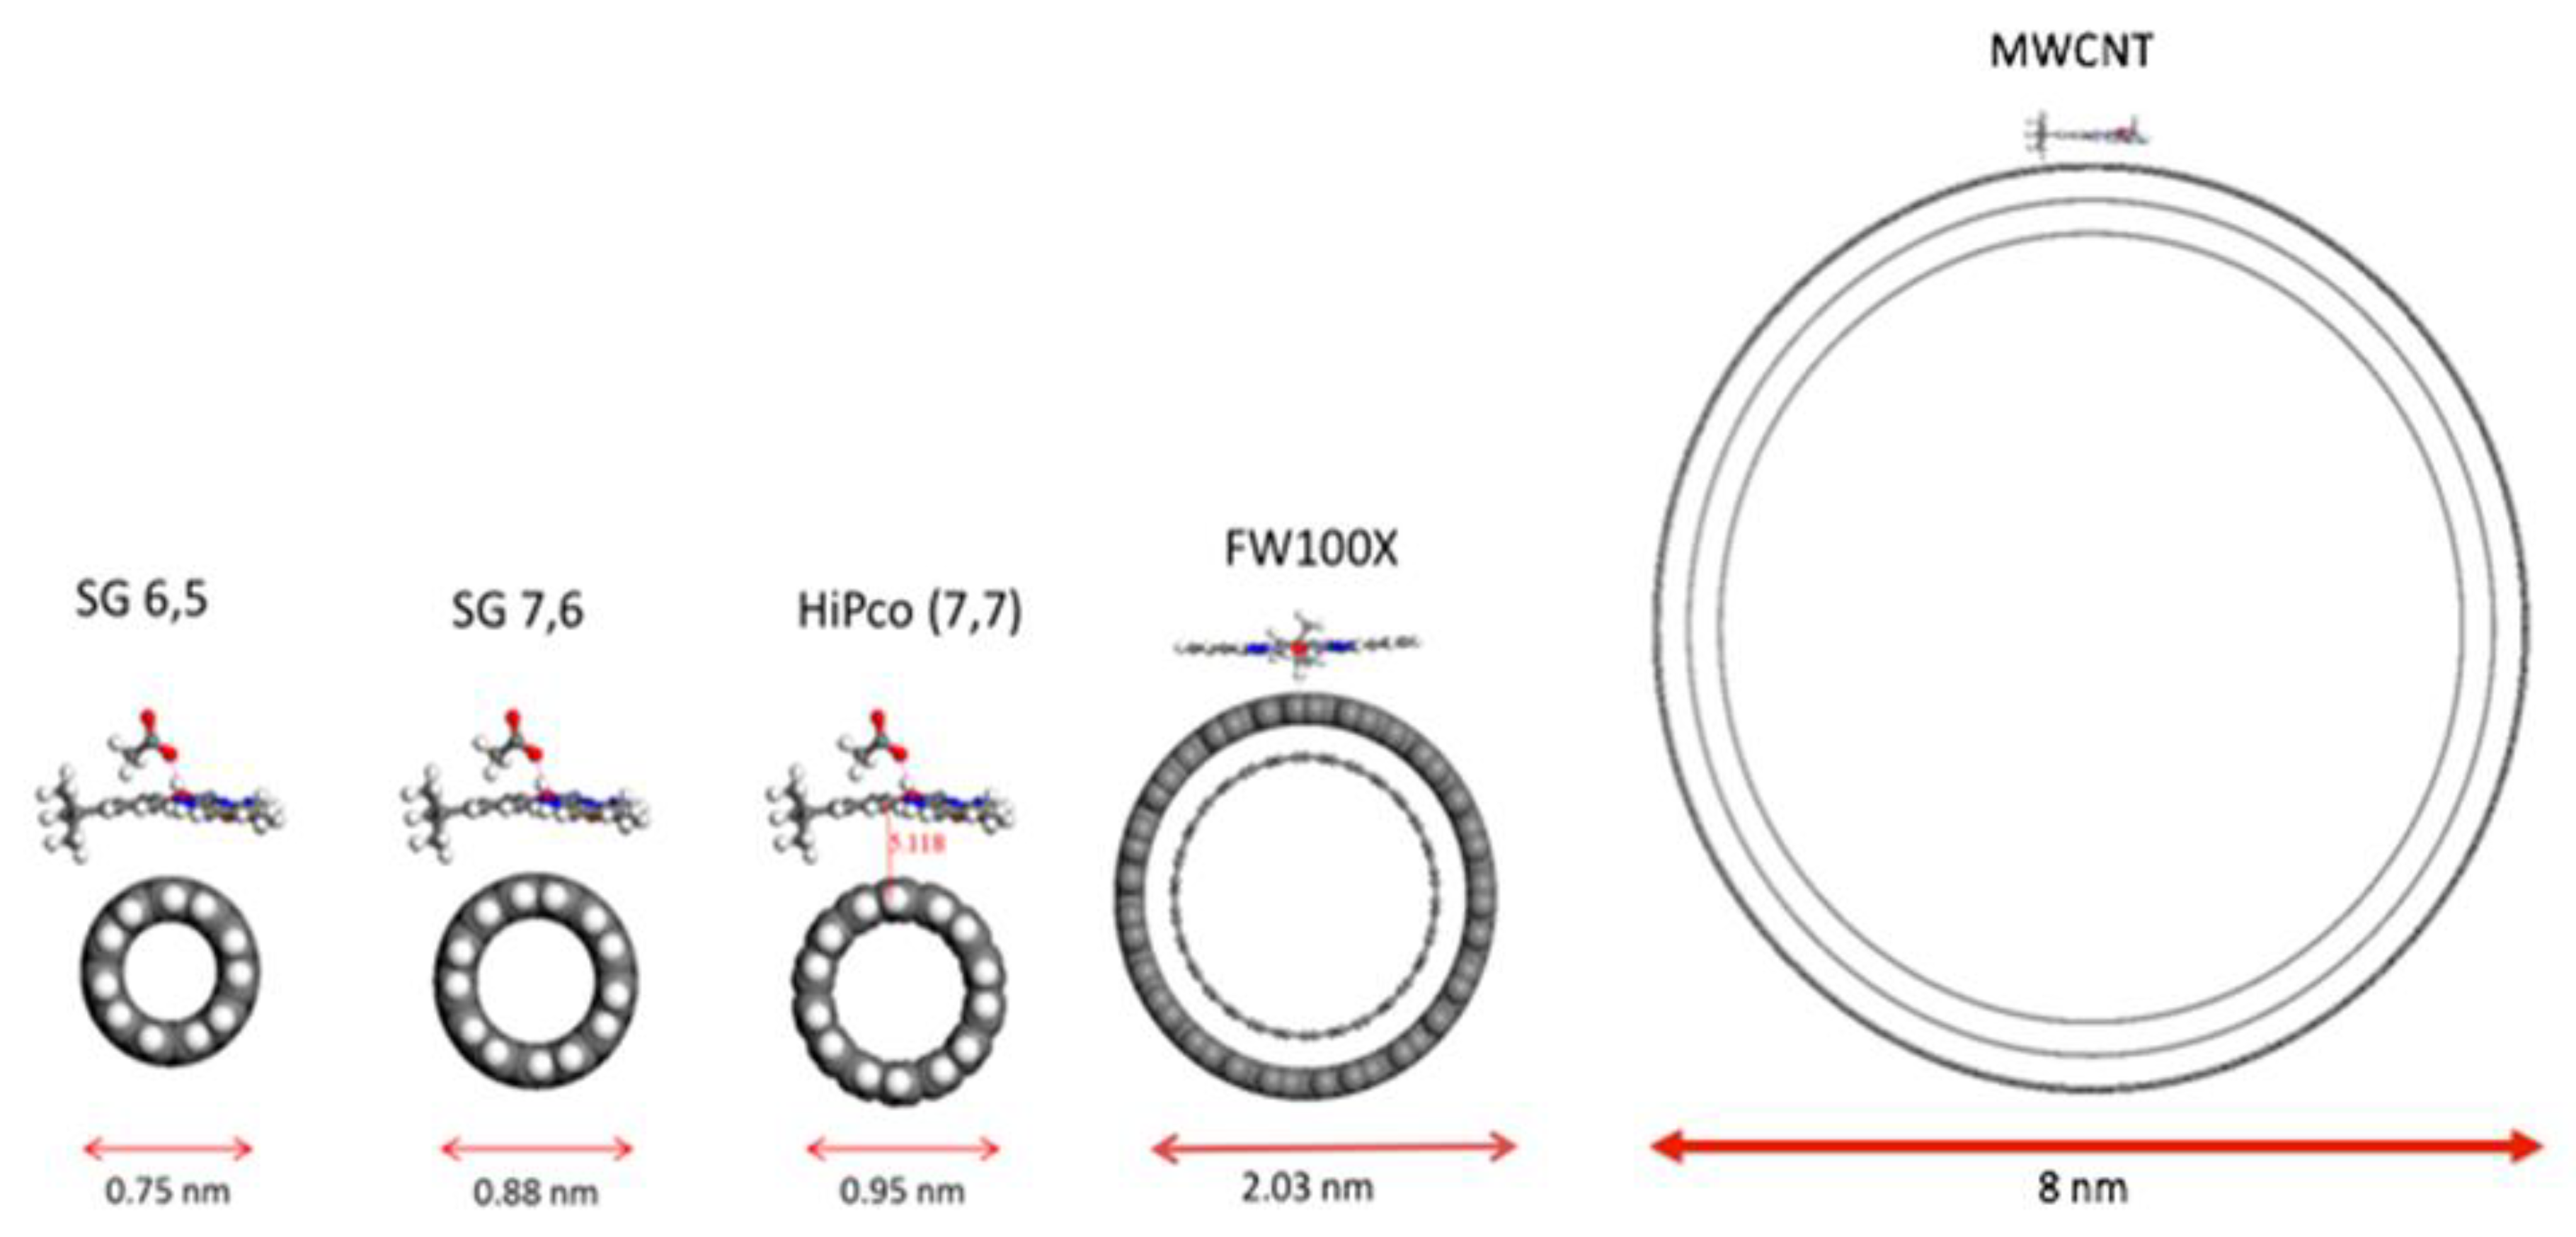
3.2. Dispersion Stability Measurements: +2Ru2, +2Zn2, and Cu2FcOH on Various CNTs

Dispersion stability measurements were conducted to determine the effects on the stability of the tube diameter–radii of the curvature. Since the +2Zn2 hydrazone is positively charged and the surface of a SWCNT has a partial negative charge, the two materials will interact electrostatically, which effectively collapses the EDL of individual SWCNTs. We measured the dispersion stability of five different sized and chirality carbon nanotubes against these complexes. These data are summarized in Table 2. The strong electrolyte +2Ru2 is fully dissociated from its PF6 counter ions and therefore has the strongest effect on the dispersions. The weak electrolyte, +2Zn2, behaves as if it stays associated with one of its acetate ions, so its net charge is significantly less than +2 [7]. The measured data suggest that the larger diameter tubes are more stable against the +2Zn2 complex. This could be explained if the larger tubes had a larger zeta potential, but they do not, as shown in Table 2. It is interesting that the neutral complex Cu2FcOH does not show a significant tube diameter effect.

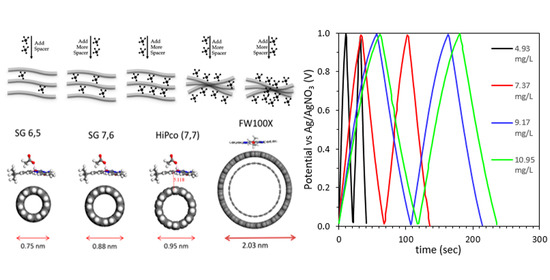
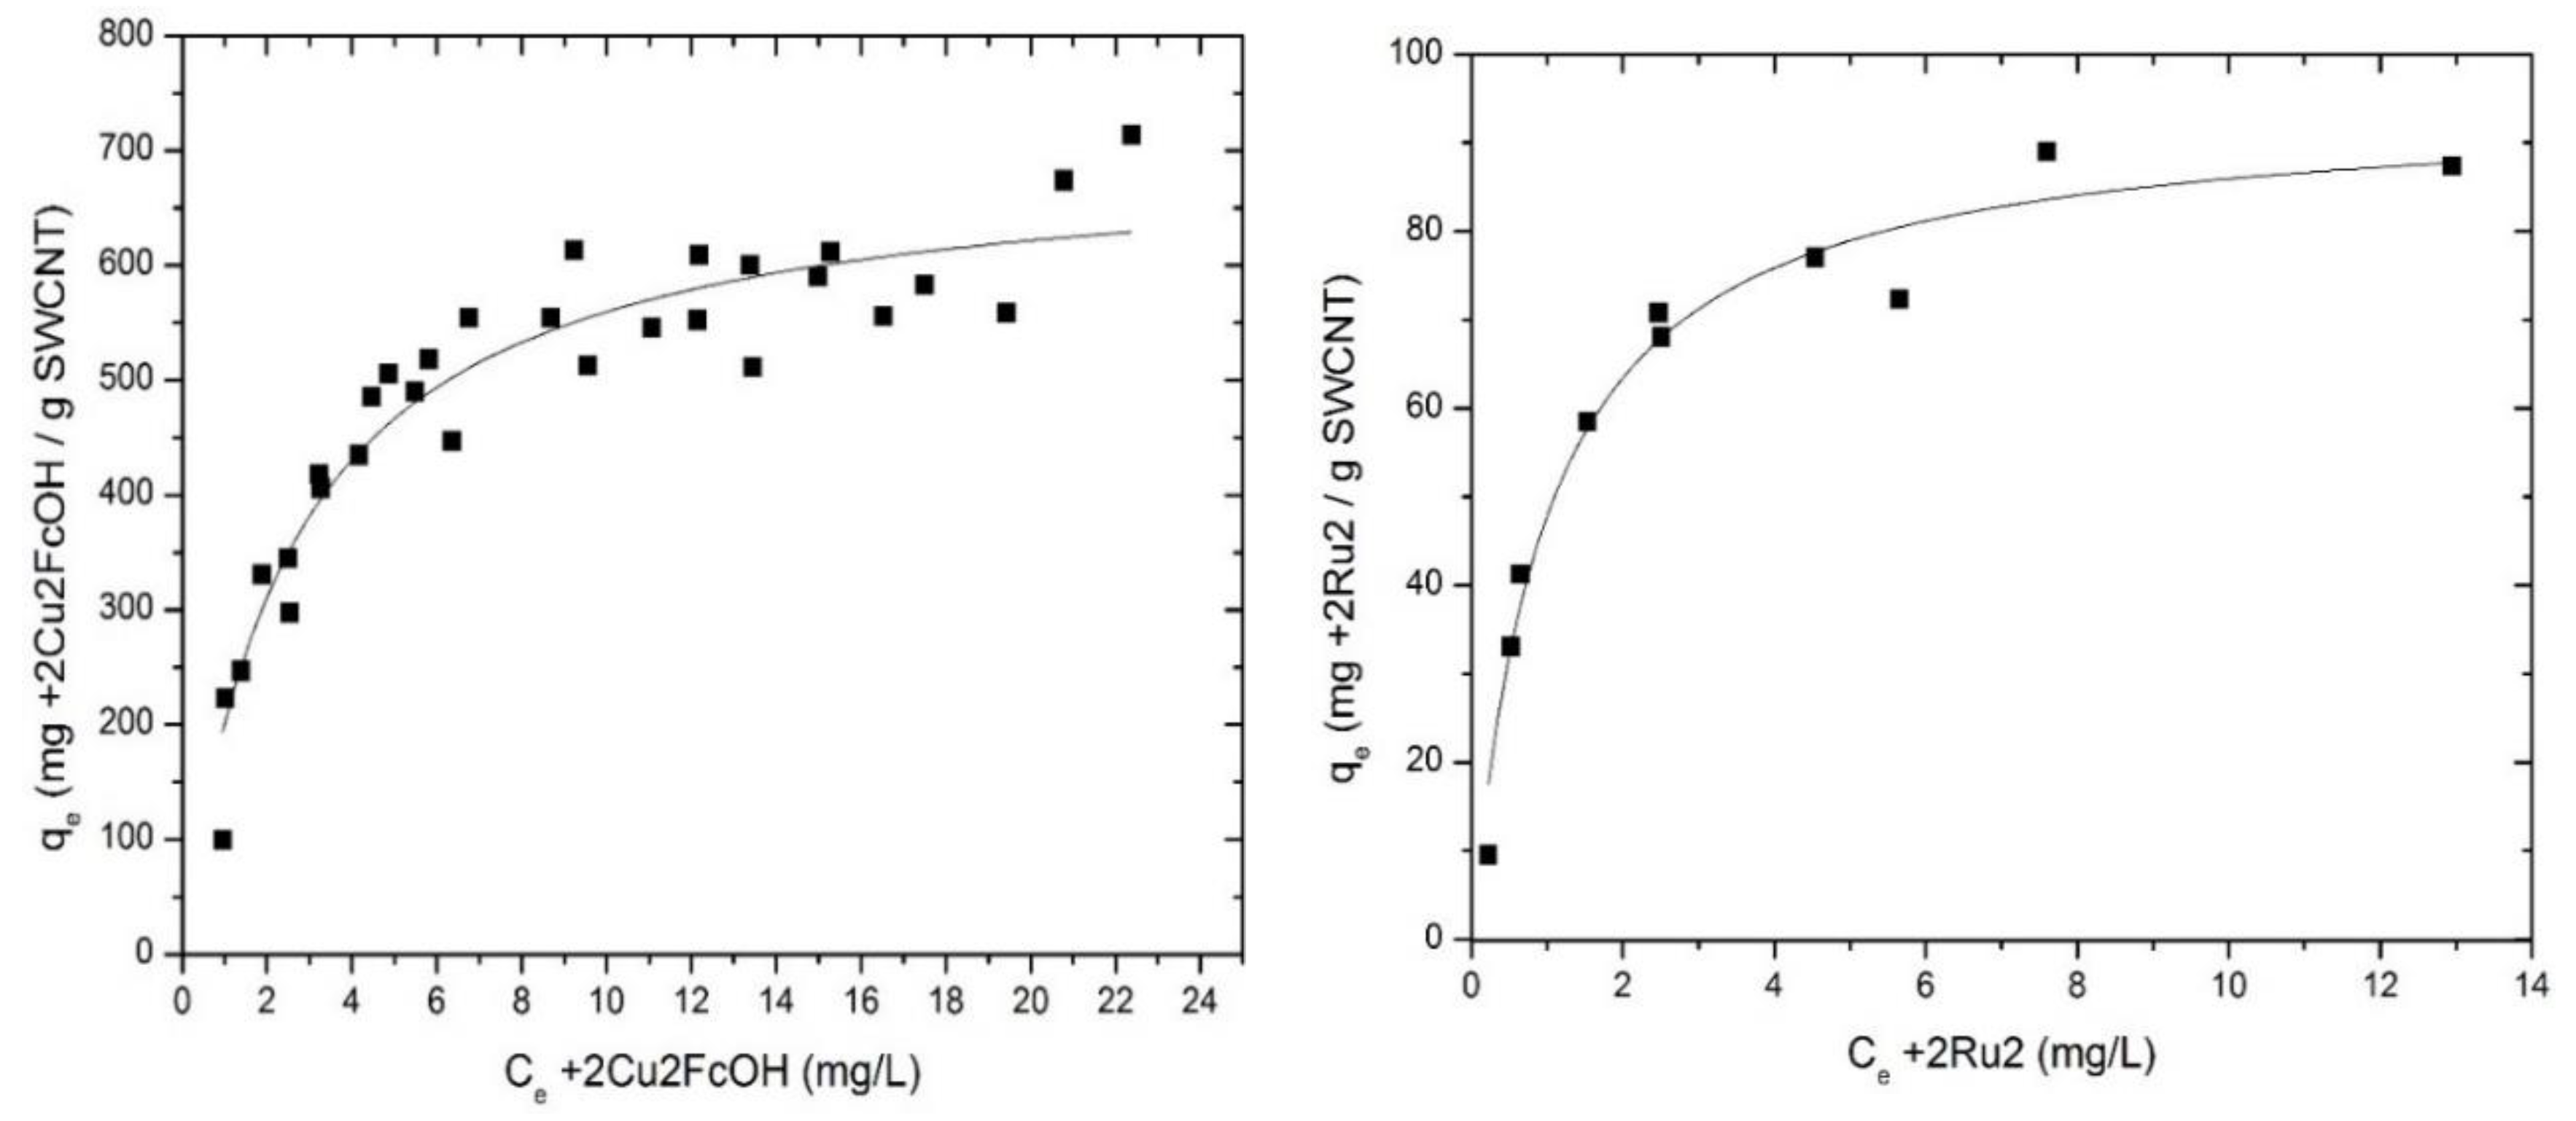
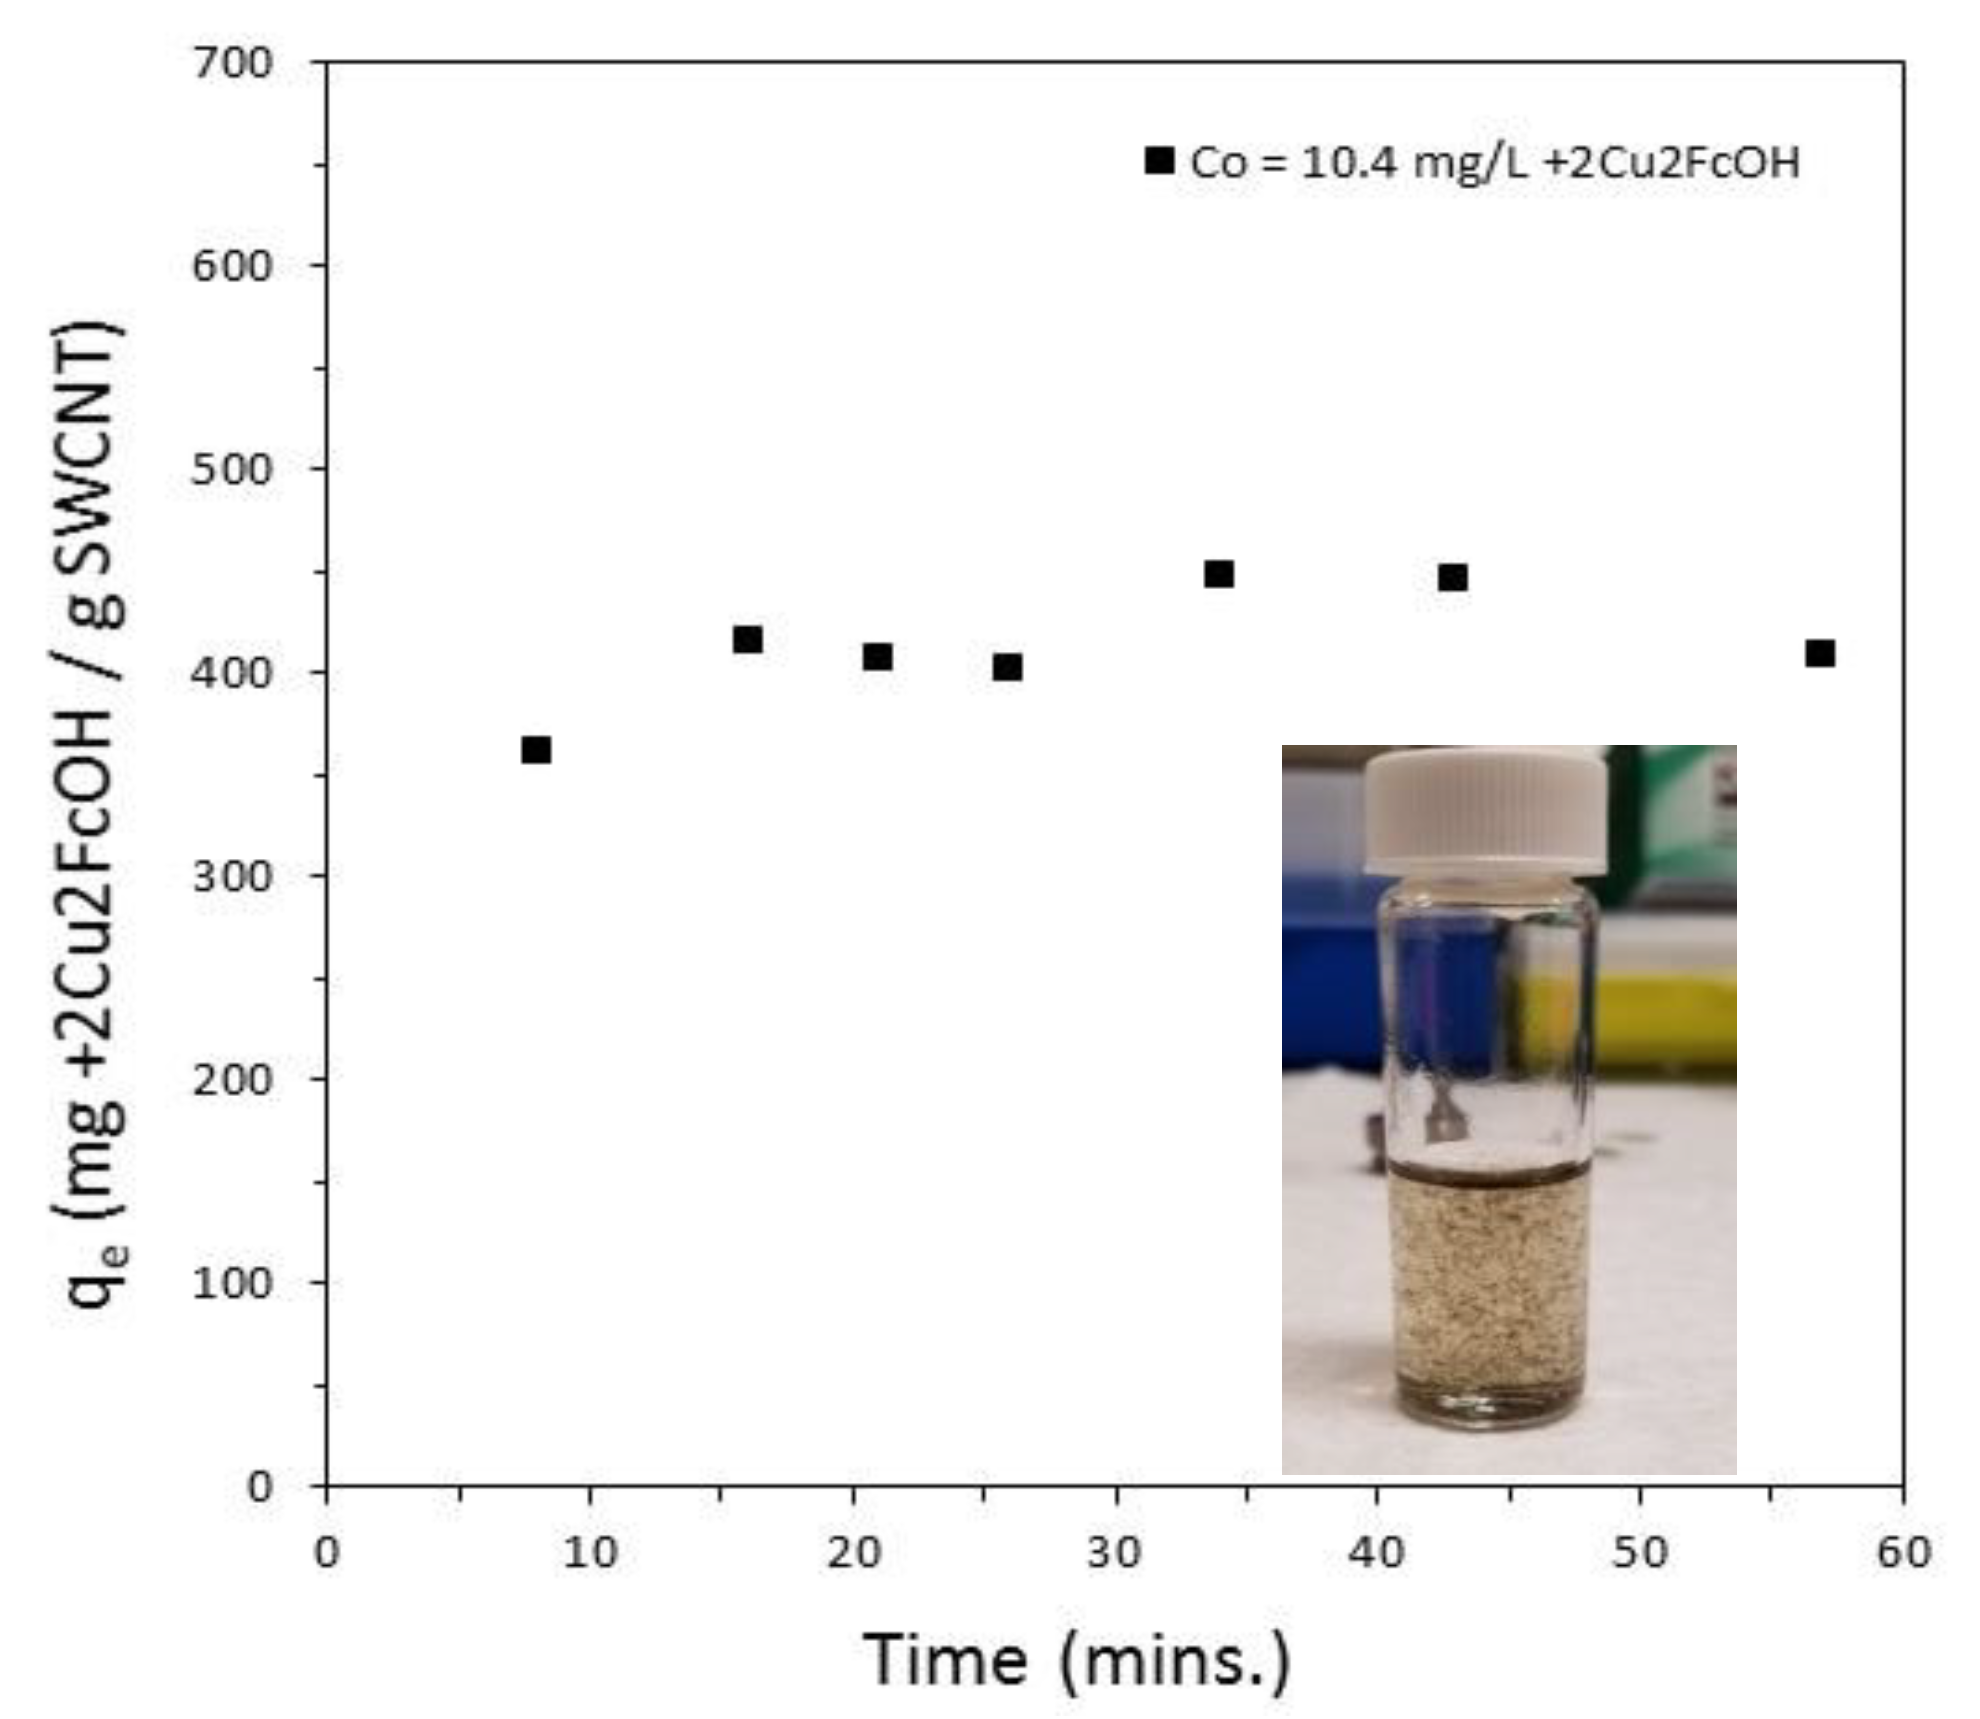
3.3. Adsorption Isotherms

To maximize the SSA of an EDL supercapacitor film, the molecular spacers need to bind strongly to the CNTs, at high enough concentration, but before inducing aggregation. Strong binding is often associated with a large charge density on the coagulant, while a higher charge state (+2, +1, neutral) also leads to lower dispersion stabilities as predicted by DLVO theory [14,15,16]. To test our hypothesis, adsorption isotherm measurements were conducted for the +2Ru2, +2Zn2, and +2Cu2FcOH molecular spacers. These data were described by either the Brunauer–Emmett–Teller (BET) adsorption model or the Langmuir adsorption model as determined by an Akaike information criterion (AIC) for the statistically preferred model. The dependent variable, qe, represents equilibrium bound adsorbate in mg adsorbate per g adsorbent, while qm is the maximum adsorbate loading of one monolayer. Ks is the equilibrium binding constant of the surface interaction of the adsorbate with the CNT surface. Typical binding data are shown in Figure 6 (left) where data from +2Cu2FcOH adsorption onto HiPco tubes are fit to a Langmuir adsorption isotherm. The binding parameters were extracted from the Langmuir model as: qm = 699.0 ± 10 mg L−1 with a binding strength Ks of 0.40 ± 0.05 L mg−1. It seems that there may be adsorption of a second layer near qe > 21 mg L−1, but the dispersion aggregated at the higher concentrations needed to be statistically conclusive. Binding data of +2Ru2 to HiPco were also fit to a Langmuir model and are shown in Figure 6 (right) where qm was measured to be 94 ± 4 mg L−1 with a binding strength of 3.5 ± 0.6 L mg−1. Data from our studies of +2Zn2 adsorbed onto HiPco tubes fit to a Langmuir isotherm result in qm = 947 ± 24 mg L−1 with a binding strength Ks of 0.67 ± 0.09 L mg−1 [7]. The stronger binding of the +2Ru2 complex results in aggregation of the dispersion and reduction of the SSA available for molecular spacer adsorption. As the binding strength goes down for the other two complexes, the maximum amount of adsorbate goes up. In addition to binding strength, the binding kinetics of the complexes to SWCNTs was explored. Several samples of HiPco dispersion were sonicated, and then an aliquot of +2Cu2FcOH was added so that all samples had an initial concentration of the complex equal to 10.4 mg/L (equivalent to qe = 470 mg g−1, with an equilibrium concentration Ce of 5.7 mg L−1), which is greater than the dispersion stability concentration. The binding reached equilibrium within 15 min as shown in Figure 7.

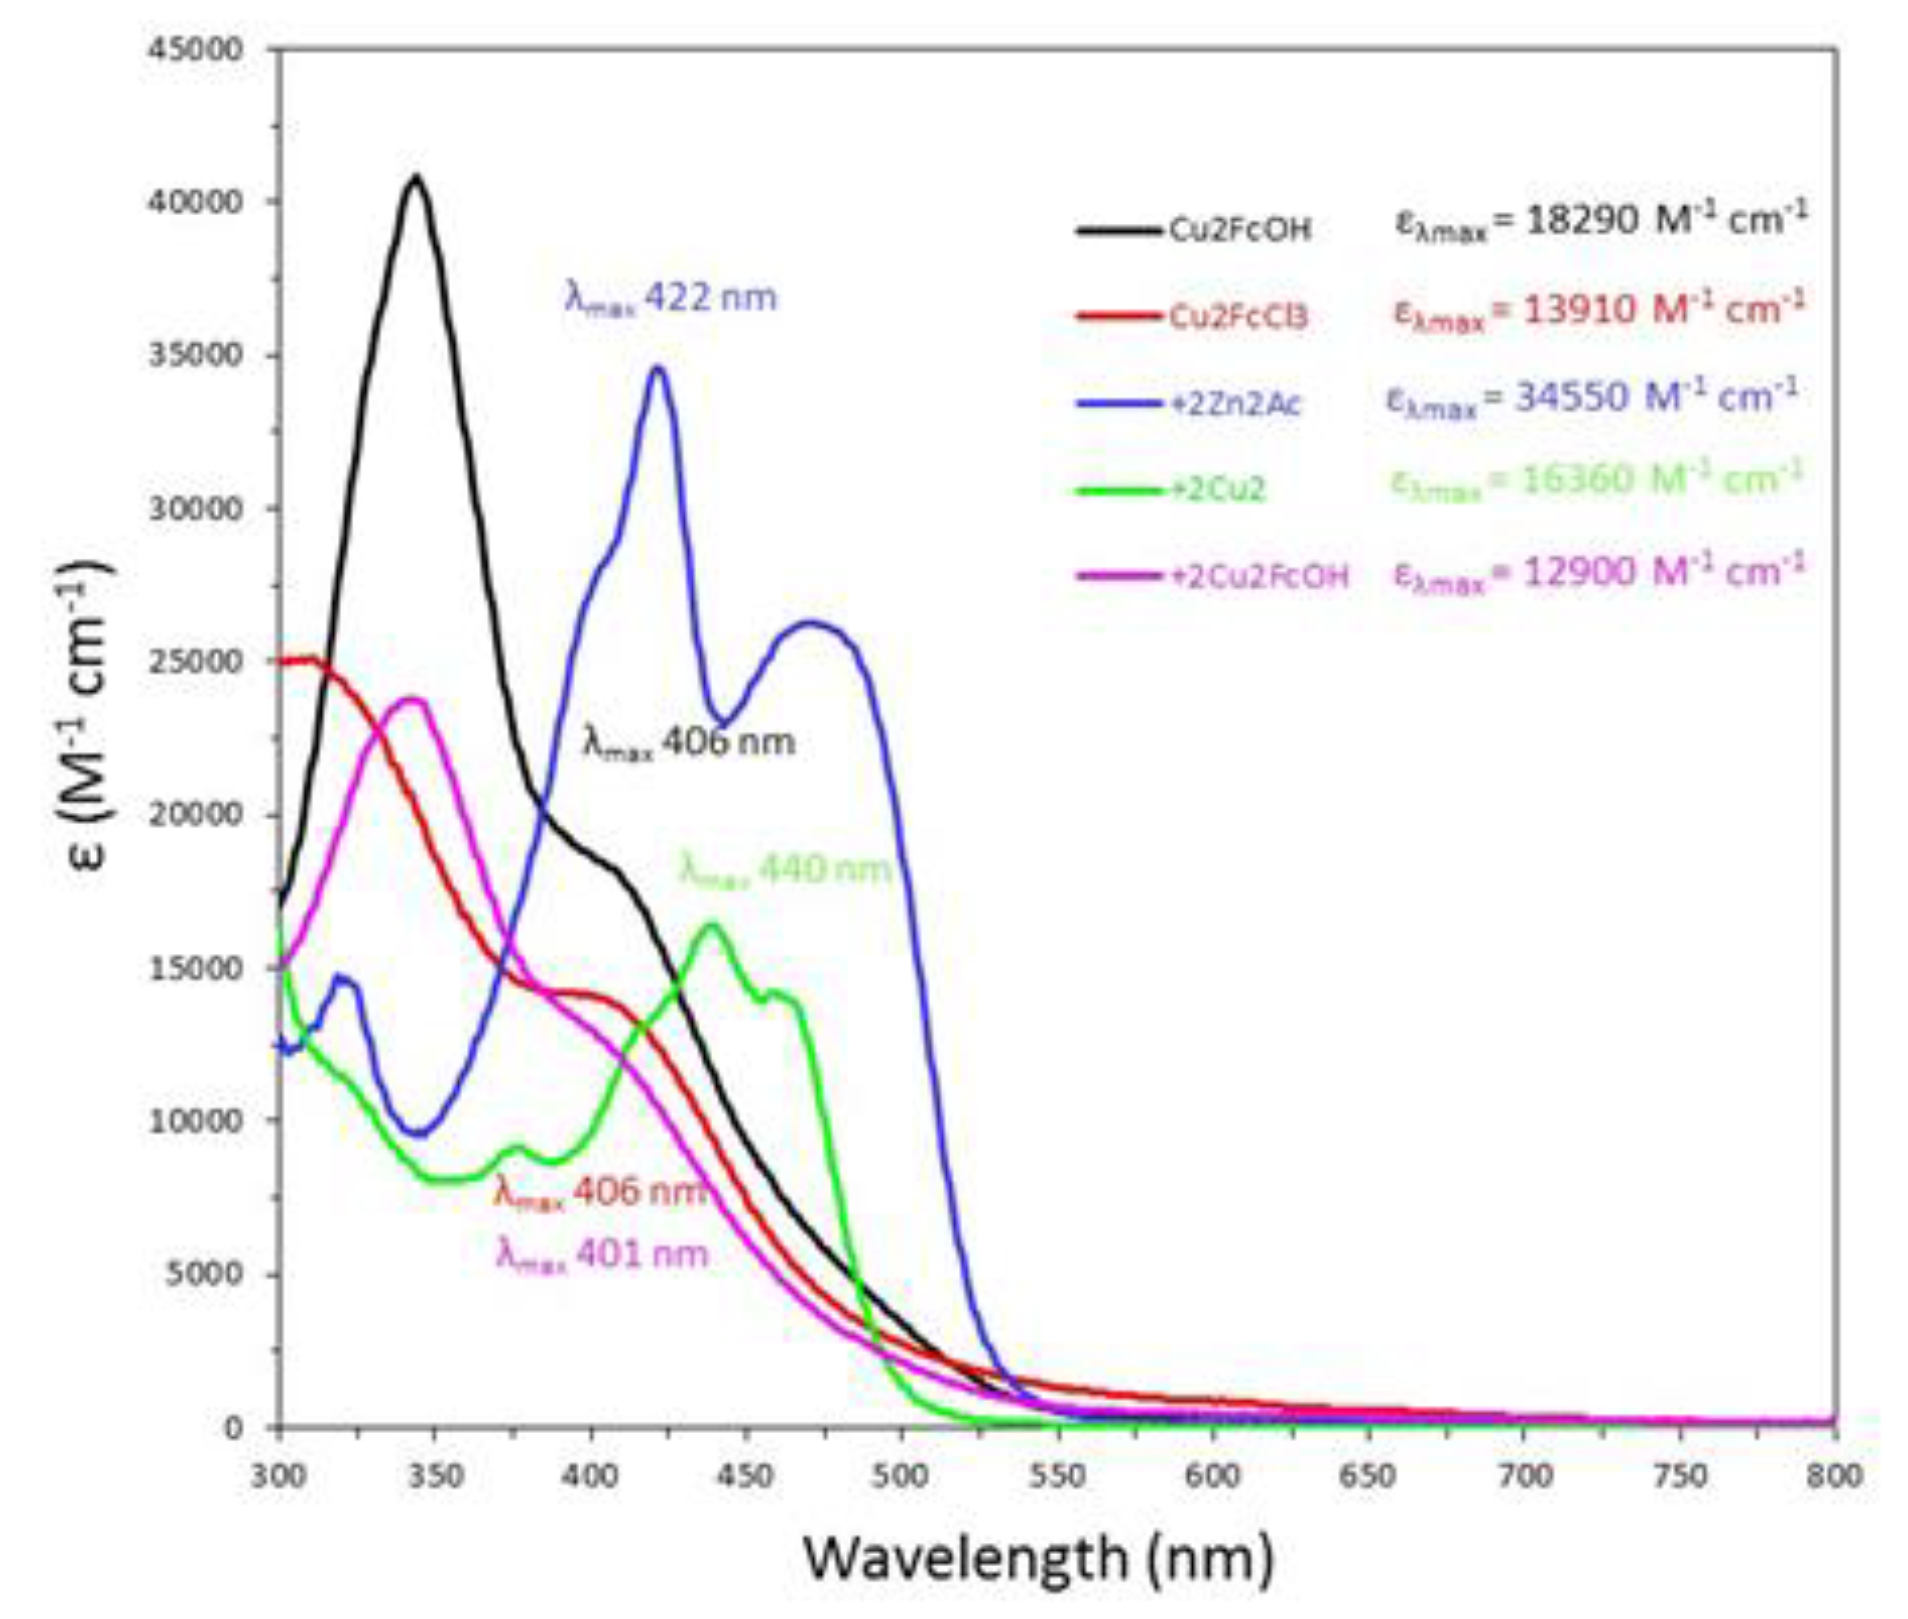
3.4. UV-Vis-NIR Spectroscopy

Optically active absorptions, shown in Figure 3, of +2Zn2 around 420 nm (ε = 38,700 M−1 cm−1) and 470 nm (ε = 15,720 M−1 cm−1) are consistent with ion to ligand charge transfer (ILCT) transitions, while the absorption around 320 nm (ε = 8,580 M−1 cm−1) is most likely π to π* transitions based off of preliminary density functional theory (DFT) calculations [7]. The Cu2FcOH coordination complex has two ferrocene moieties that absorb light around 415 nm (ε = 18,290 M−1 cm−1). Less delocalization of electrons in the ferrocene moieties is a possible explanation of the shifting absorption band of ferrocene typically seen around 450 nm [17]. UV absorptions around 344 nm (ε = 40,810 M−1 cm−1) are also consistent with π to π* electron transfer [7]. These strong absorption bands show ideal charge transfer through the molecular spacers.

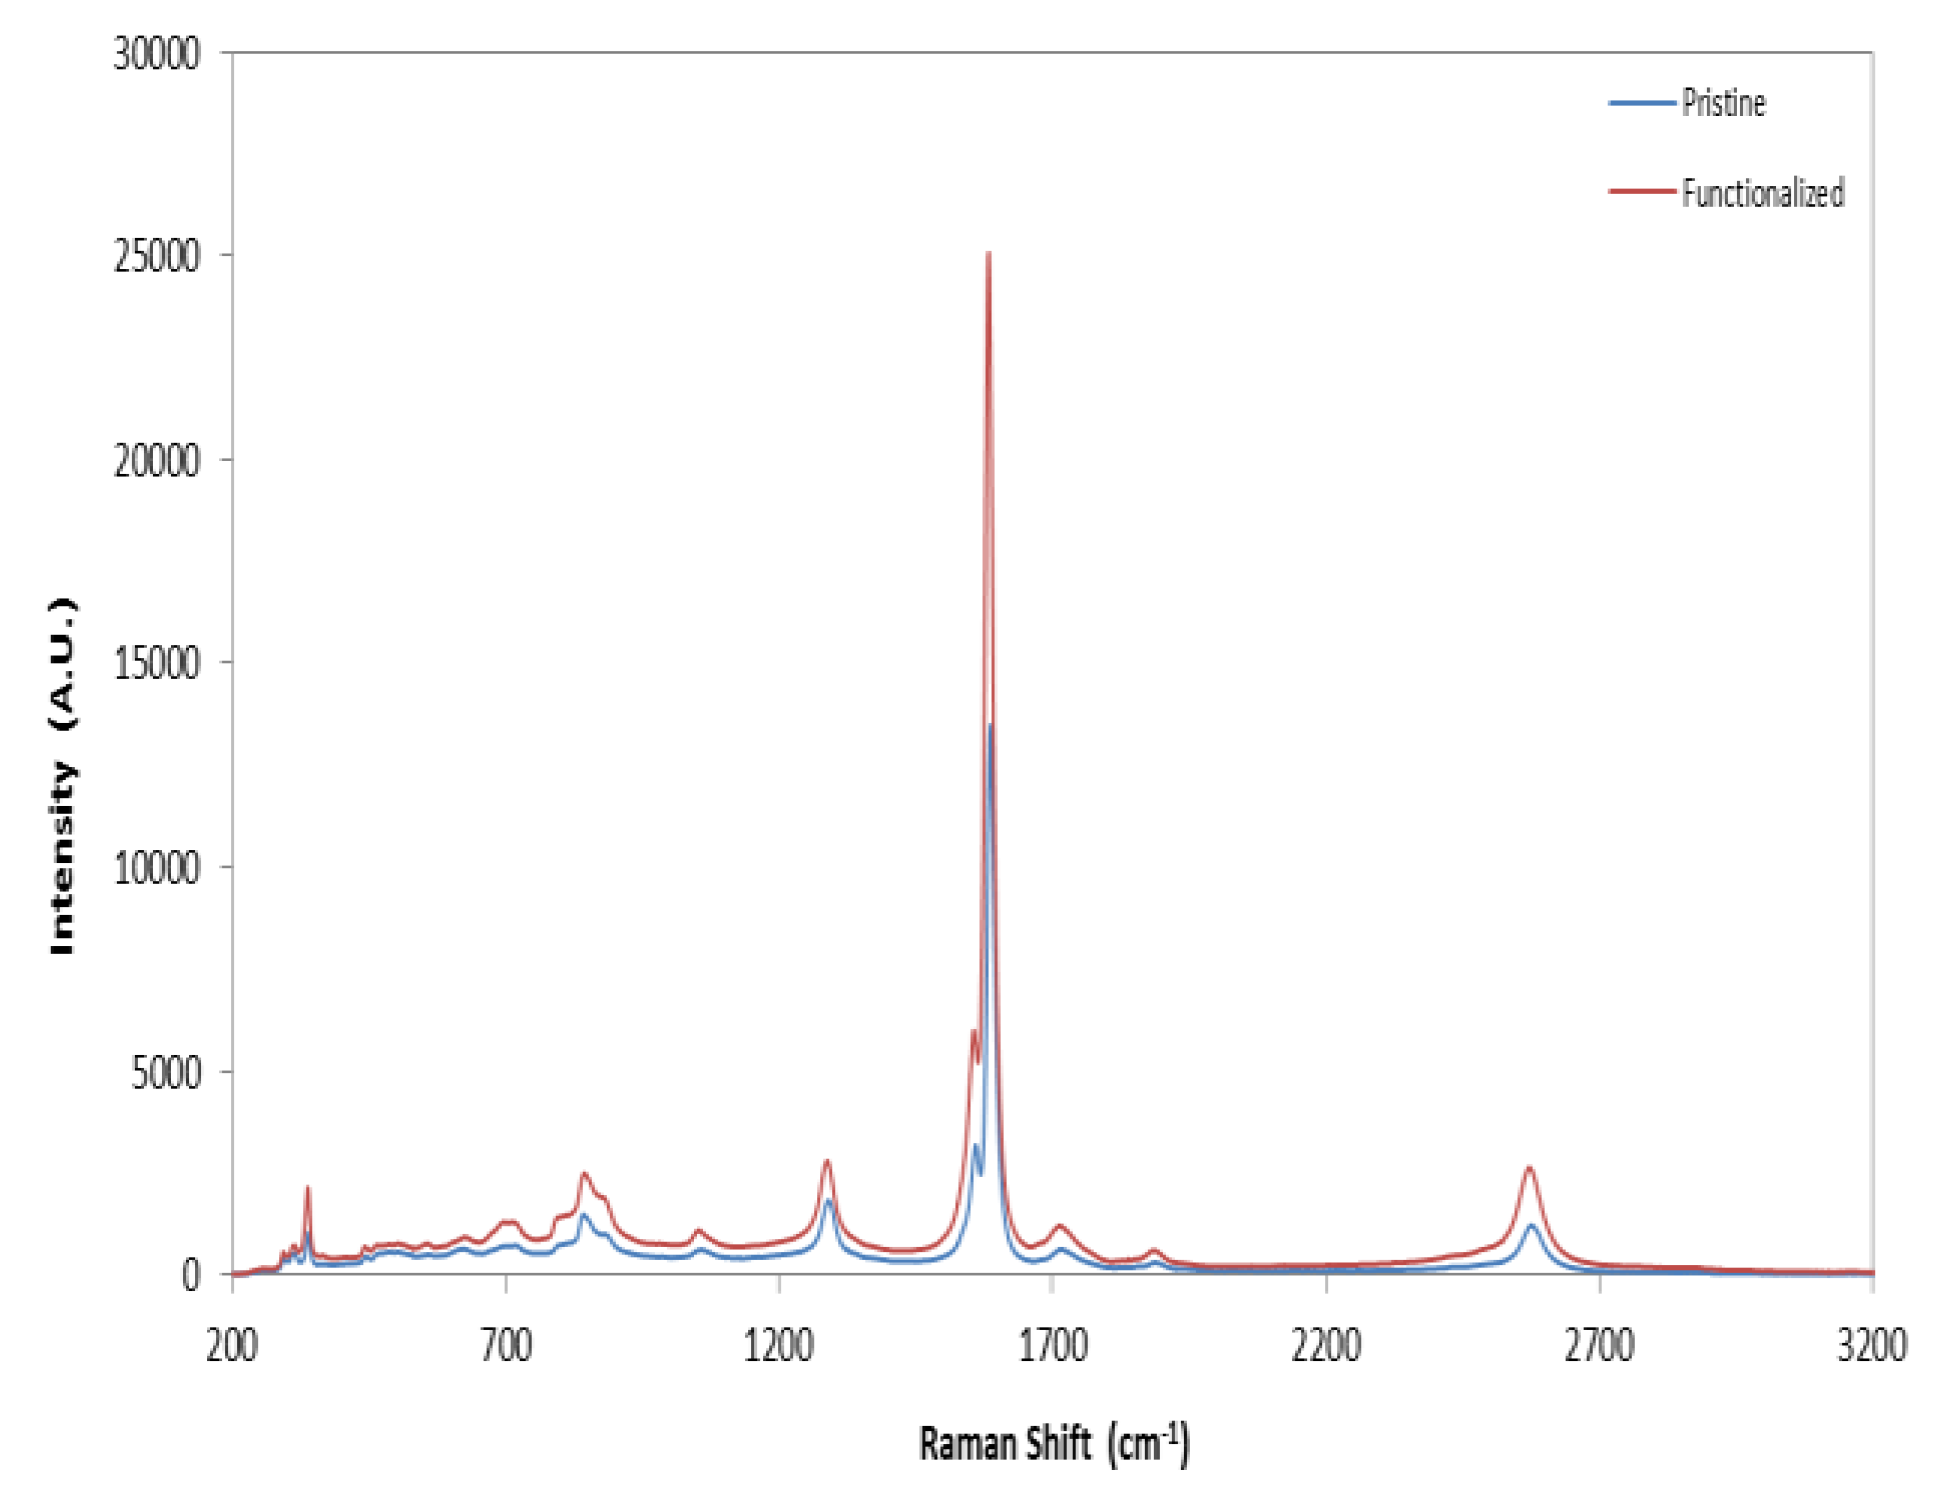
3.5. Raman Spectroscopy

Raman spectroscopy of SWCNTs is well known to provide important material characterization information including the diameter of the tubes, the ratio of sp2 to sp3 hybridized carbon that makes up the specific material, as well as information about whether the tubes are metallic, semi-conducting, or a mixture of both. Common to all SWCNTs are scattering bands such as the radial breathing modes, the diamondoid band (D-band), and graphitic band (G-Band) as shown in Figure 8. Small changes in the Raman shift of these characteristic bands can be due to differences in surface charges on the SWCNTs, doping, and induced strain caused by adsorption or docking of molecules to the SWCNT surfaces [18,19].
Data in Table 3 summarize the Raman downshifted peaks after the +2Zn2 complex was bound to HiPco tubes. These small but significant downshifts are indicative of strong electronic or mechanical interactions between the complex and the tubes. Under the same conditions we do not see any shift in Raman modes when the +2Zn2 complex is bound to the smaller diameter SG65 SWCNTs. HiPco tubes are comprised of 1/3 metallic and 2/3 semiconducting tubes while SG65 samples are >95% semiconducting. Future studies will interrogate the LRI between charge transfer complexes such as +2Zn2 and different chirality SWCNTs.

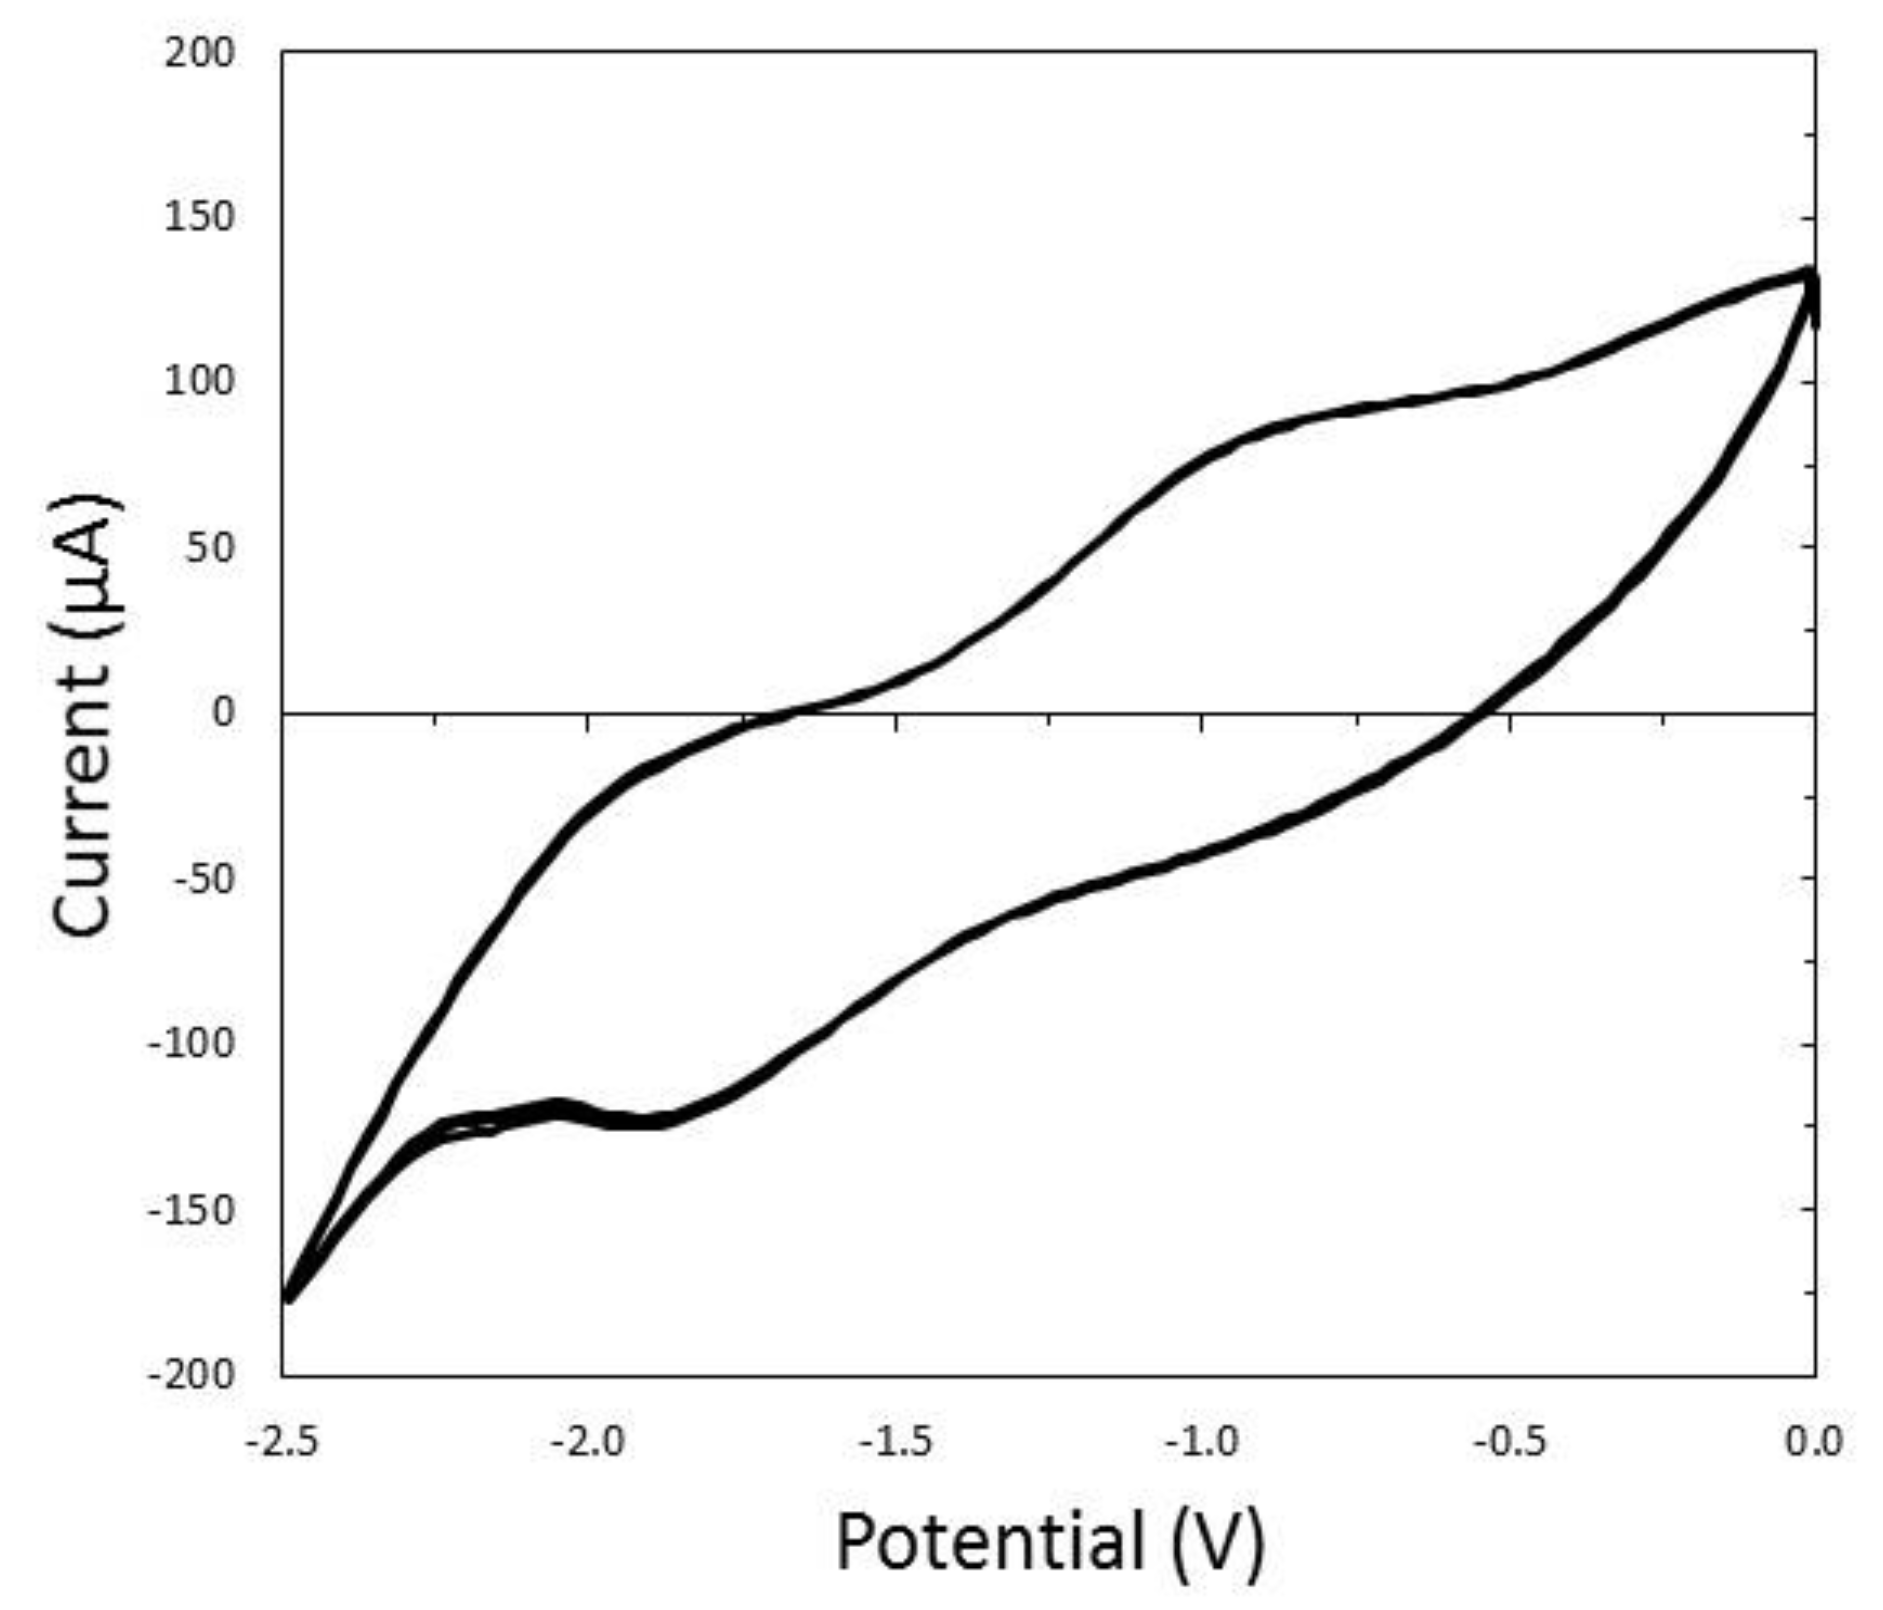
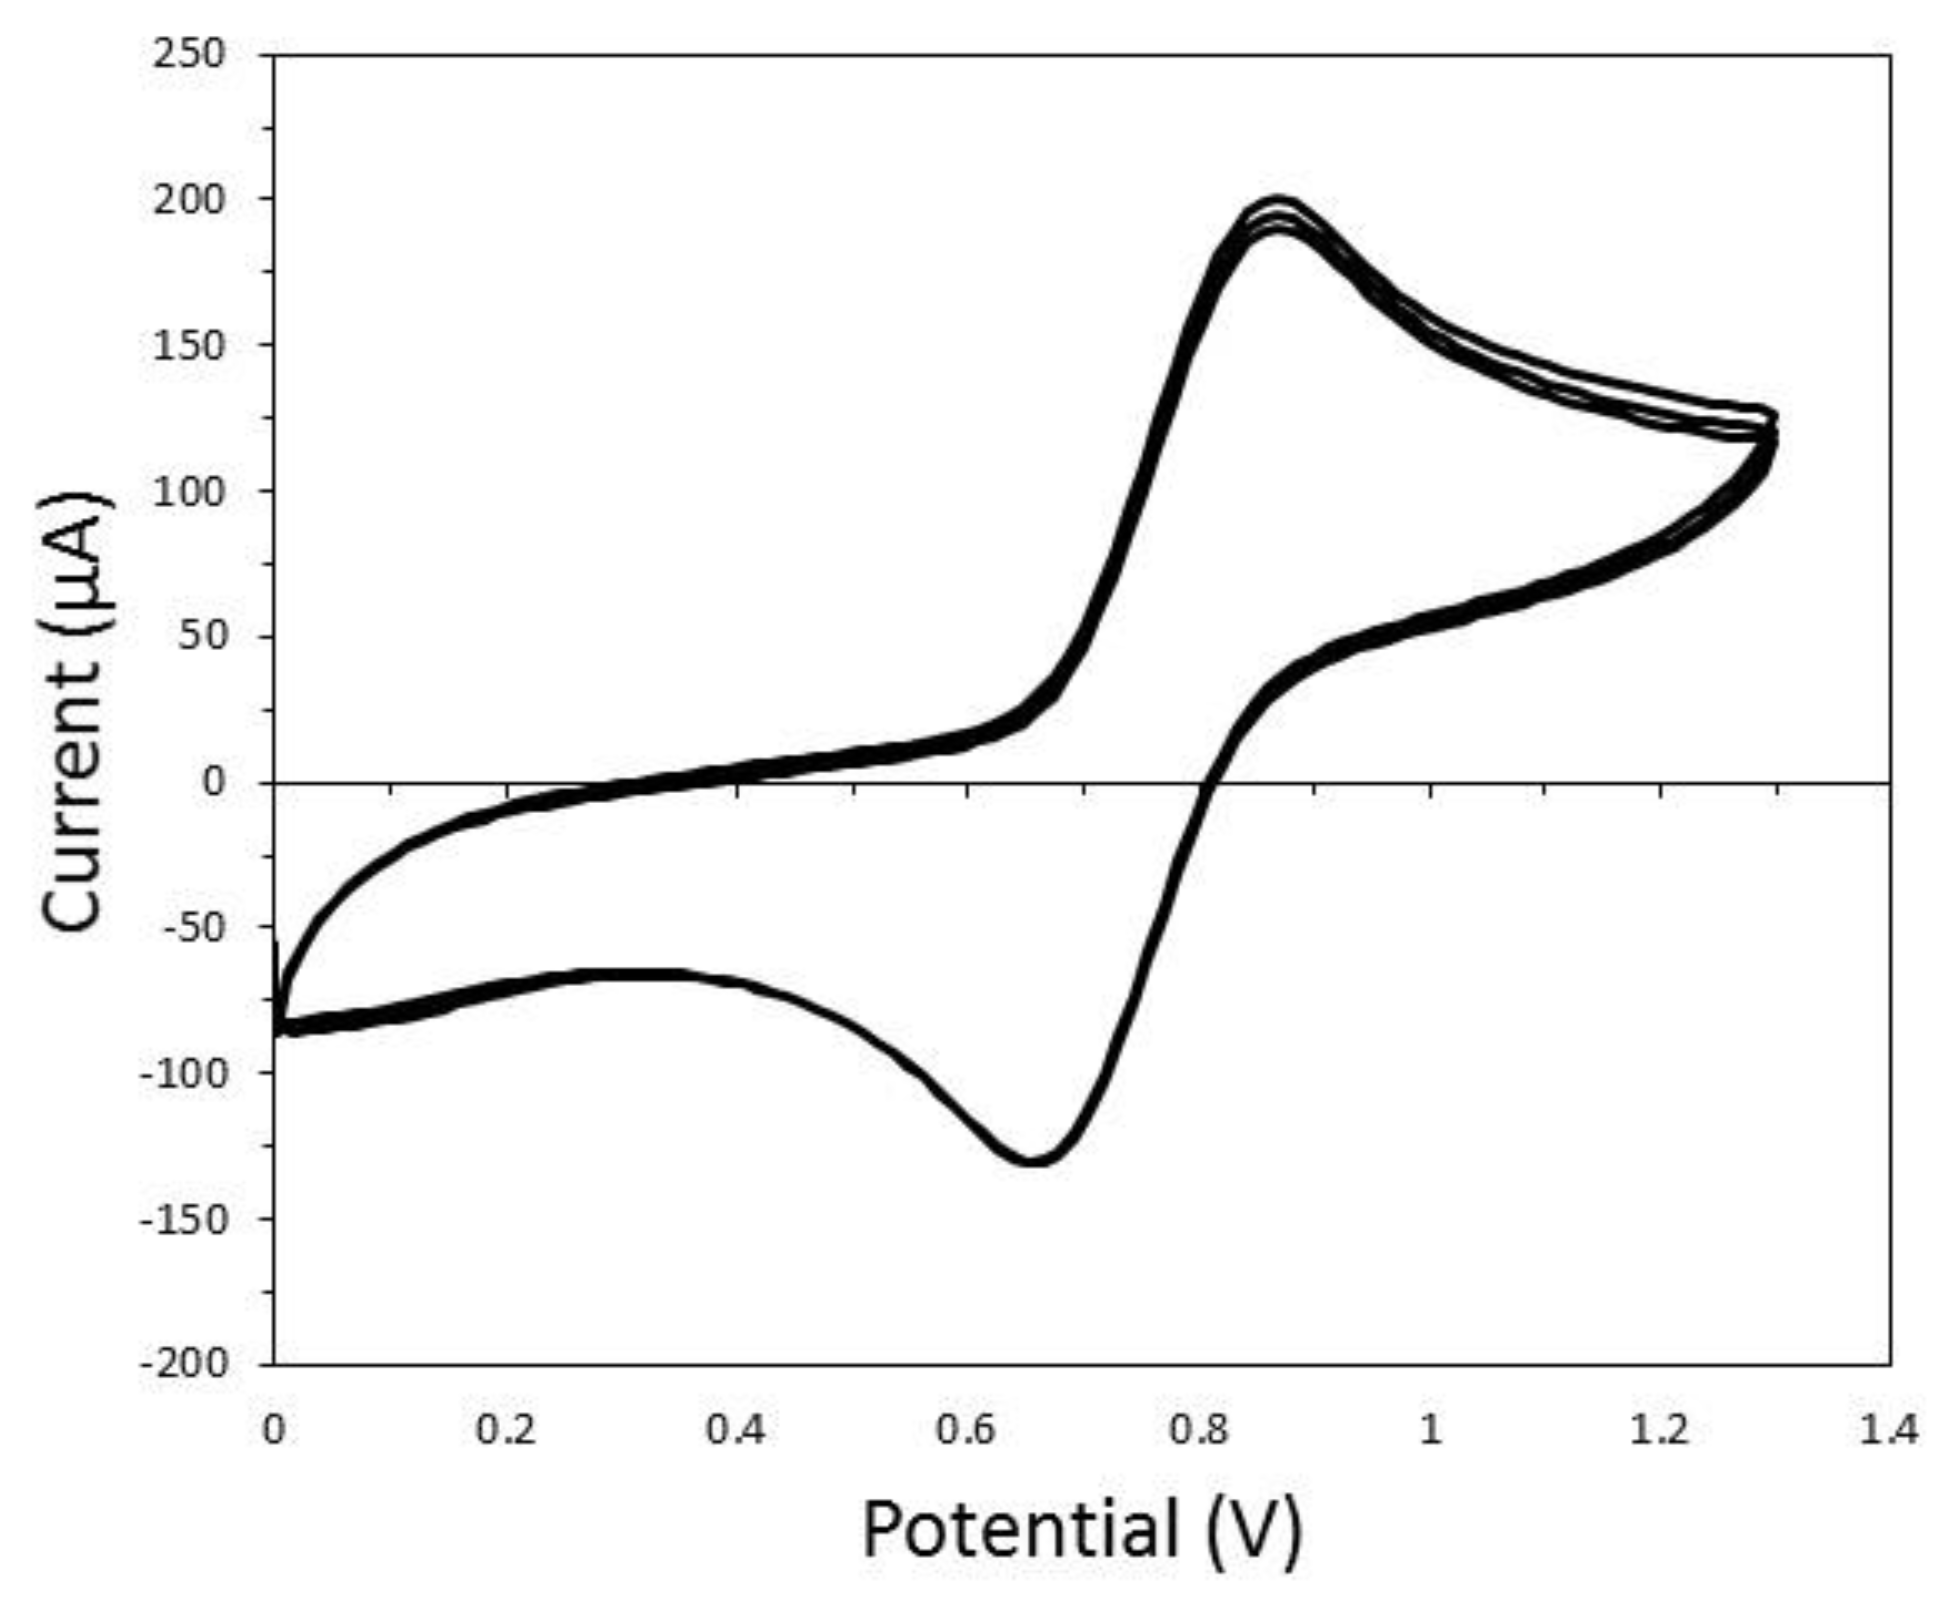
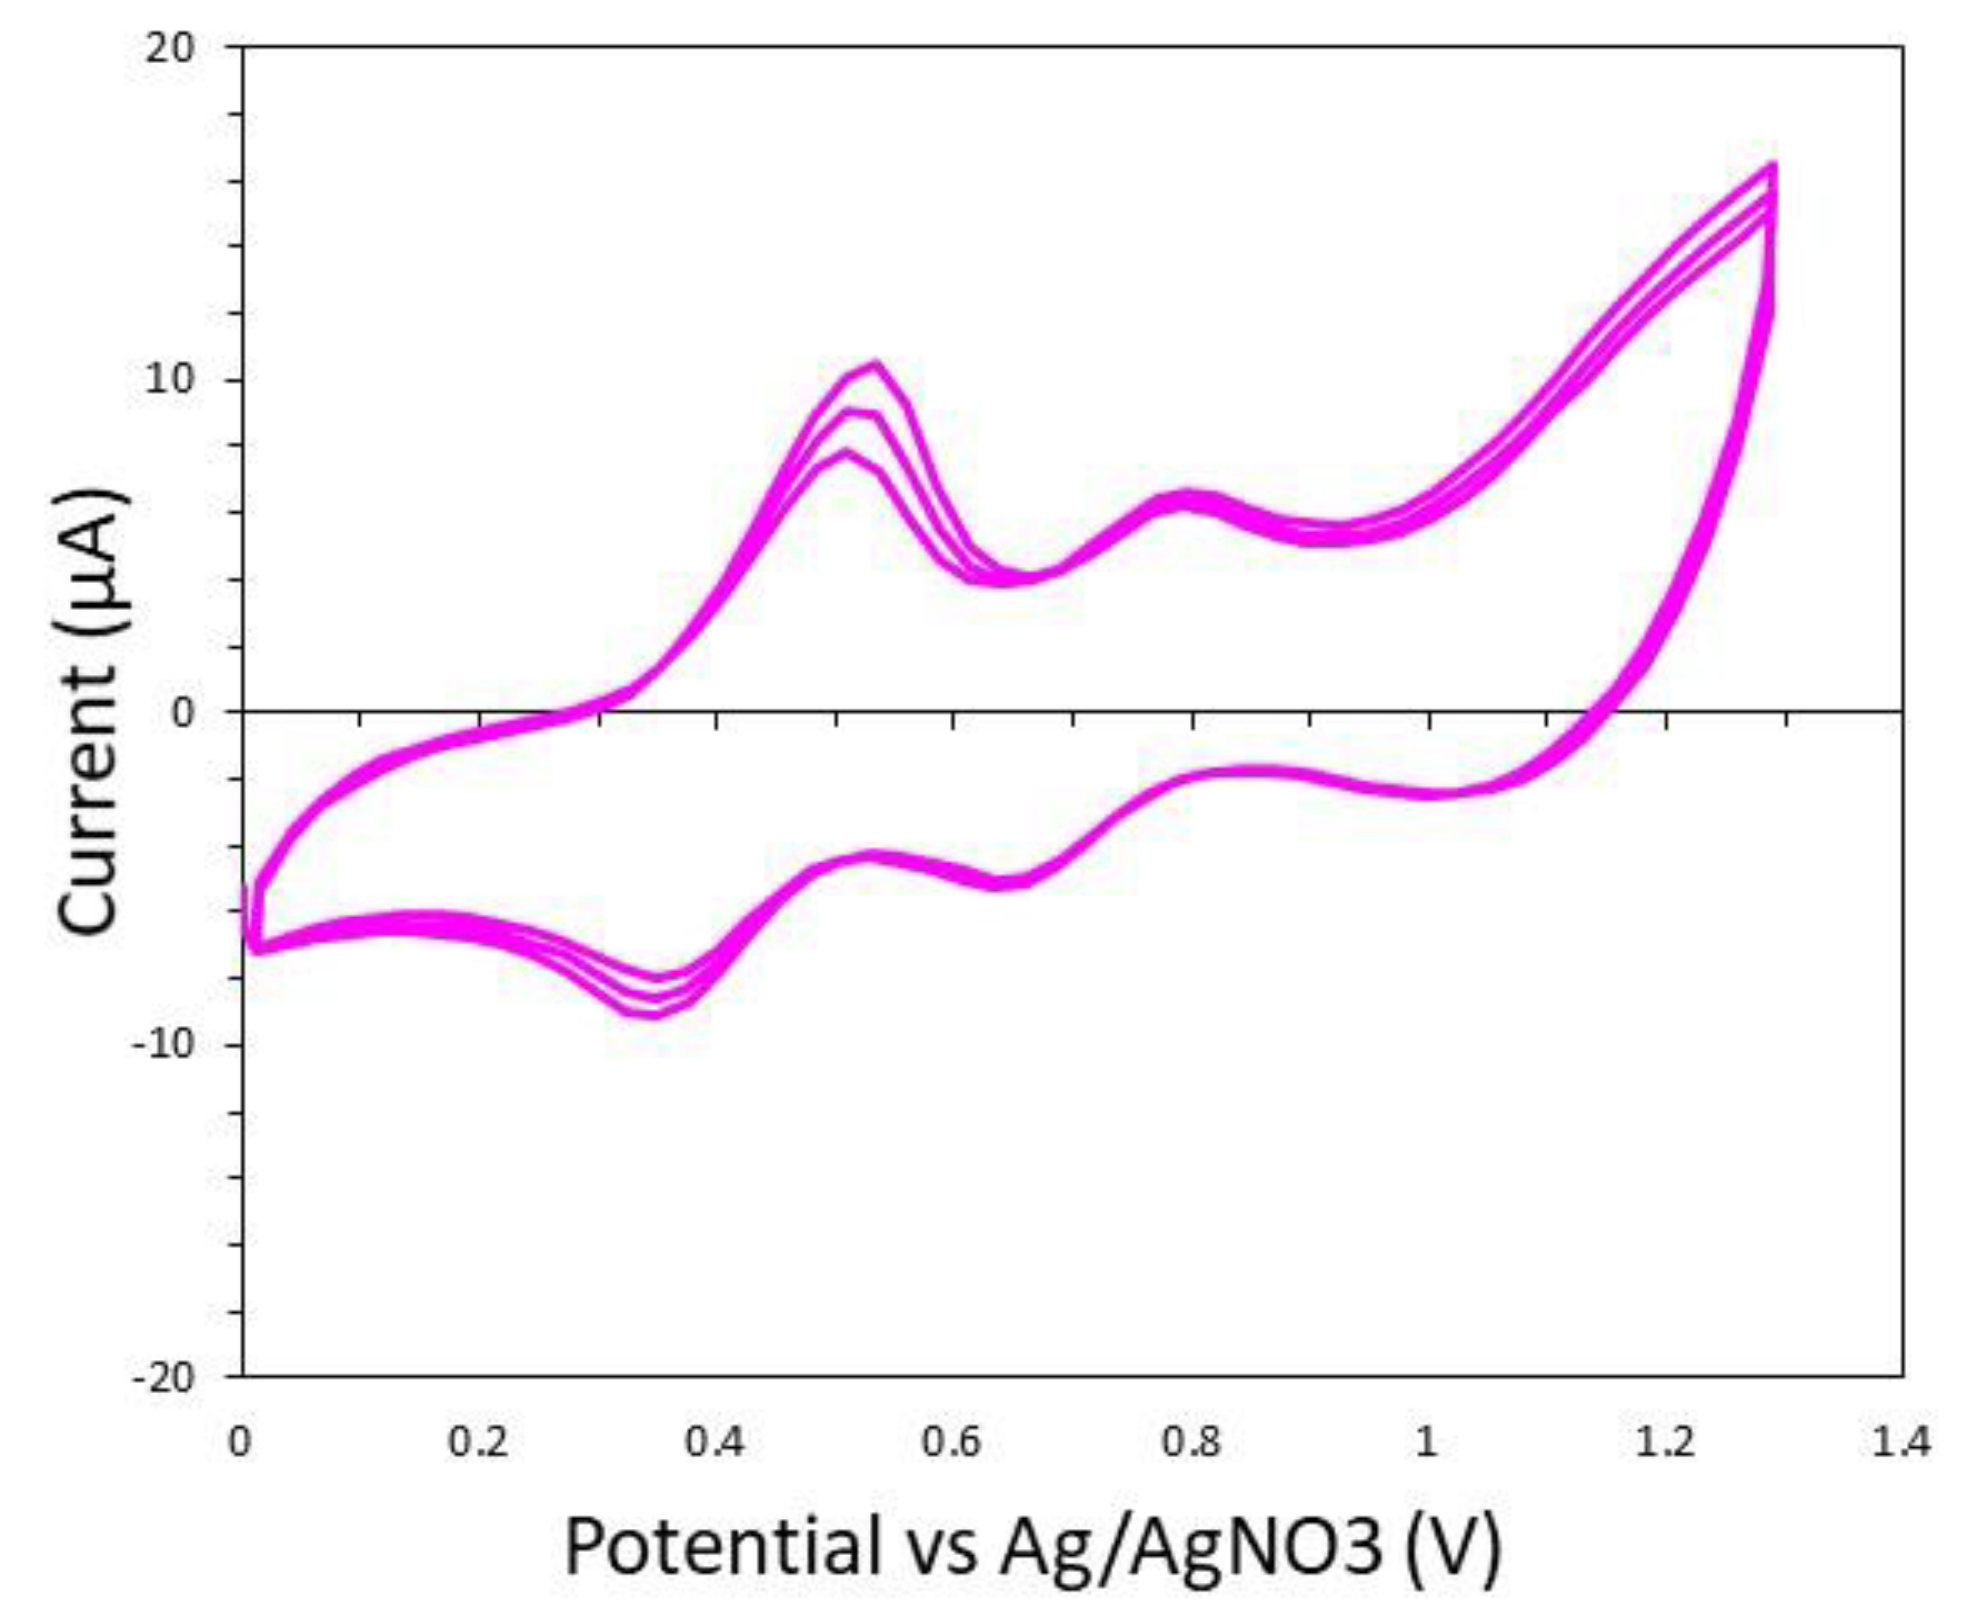
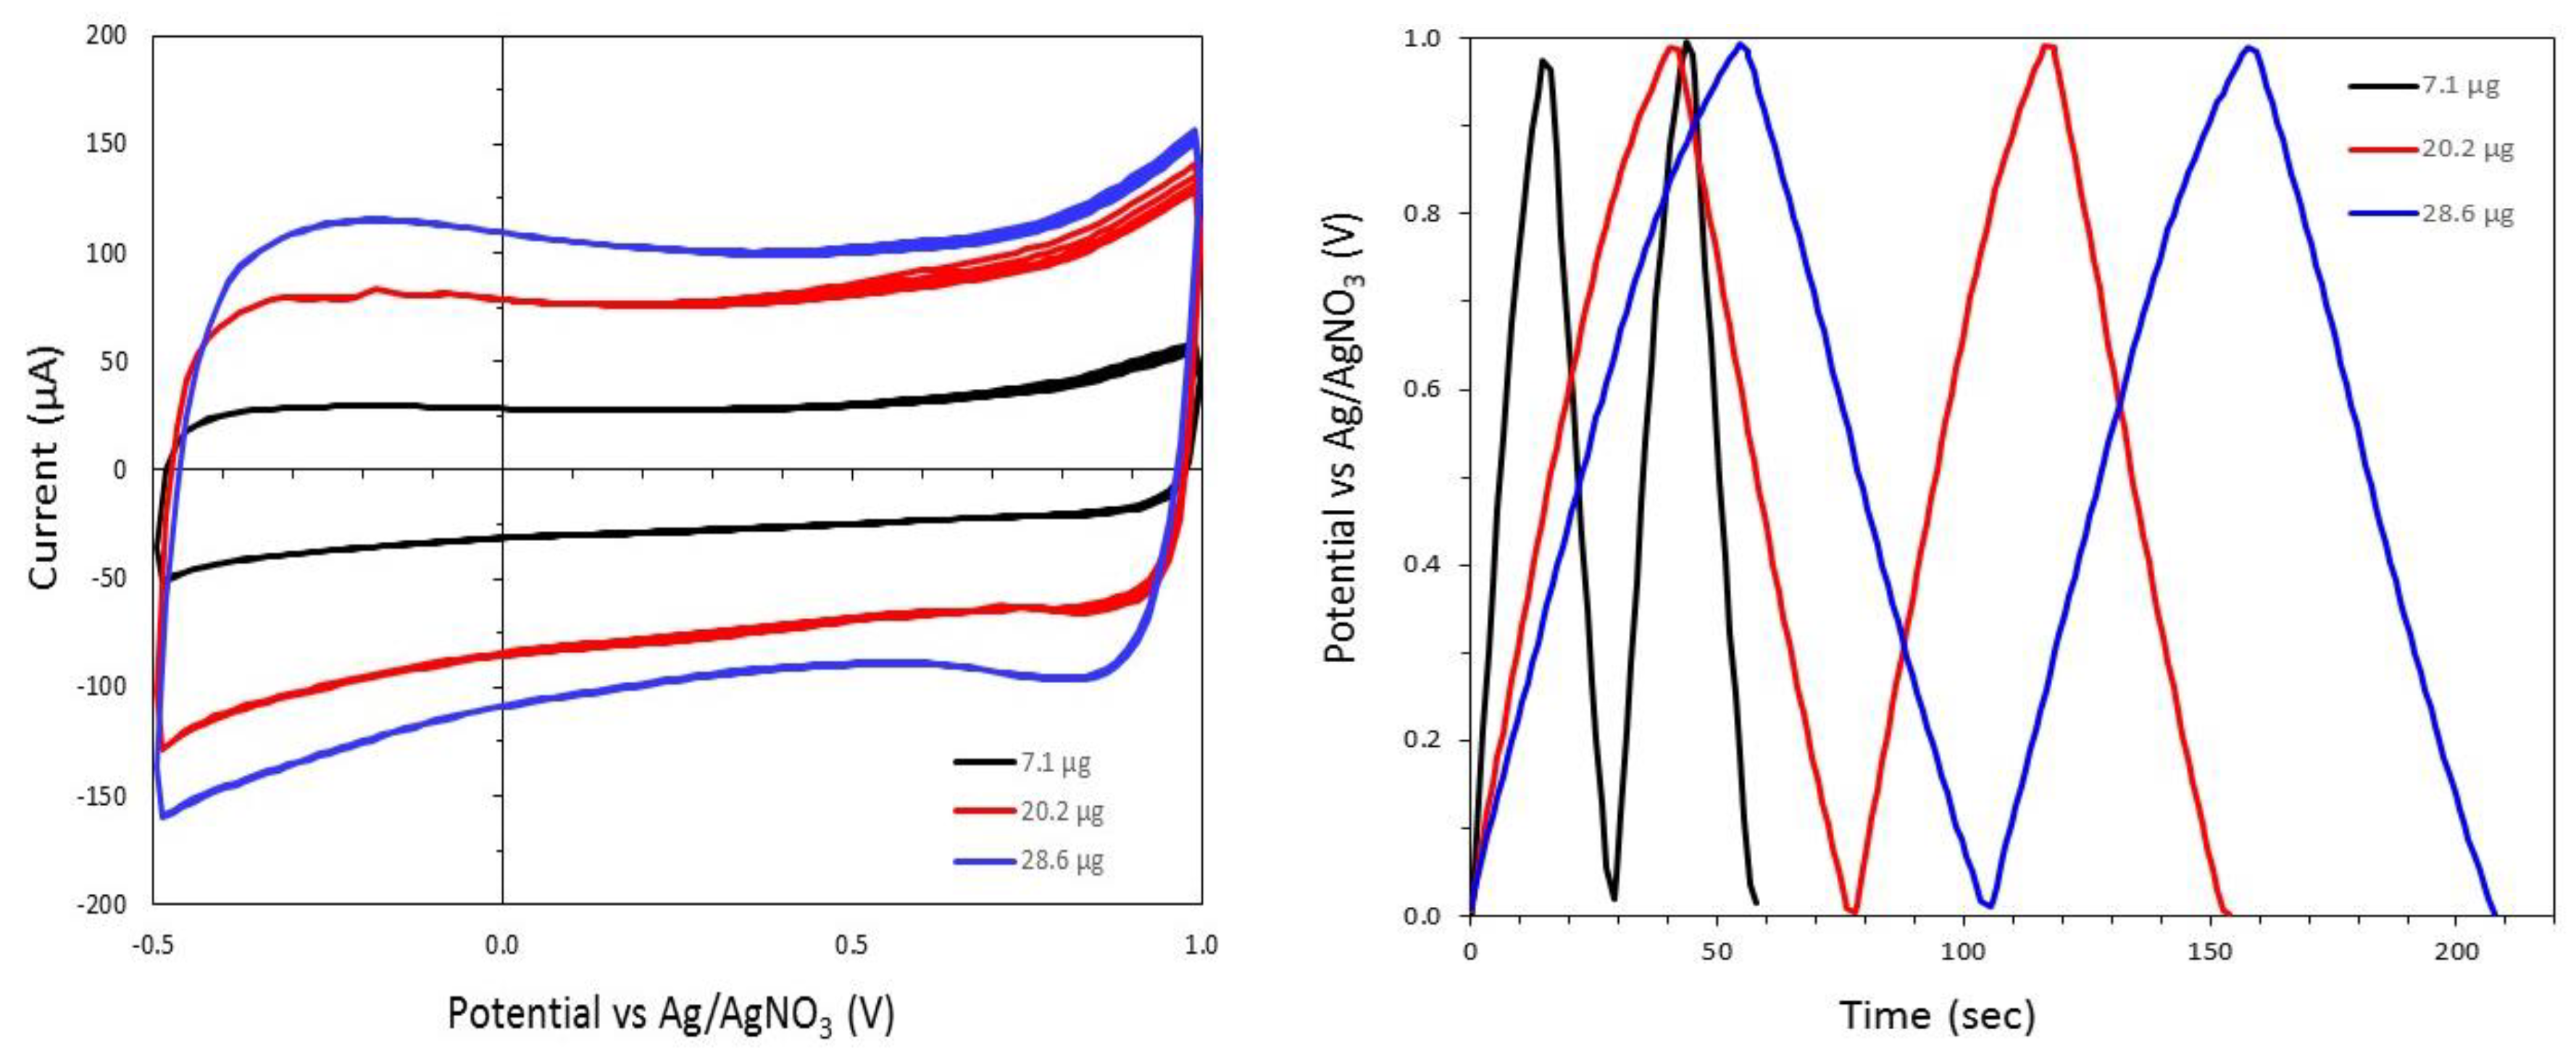
3.6. Cyclic Voltammetry

Cyclic voltammetry was used to determine the redox activity of molecular spacers in solution. The +2Zn2 complex did not show a reduction of the zinc metal center to zinc (I) following an anodic sweep shown in Figure 9. Conversely, Cu2FcOH showed a strong oxidation (Figure 10) at 0.88 V for the cathodic sweep and at 0.67 V in the reduction cycle. The cathodic sweep demonstrates reversible electron transfer centered on the ferrocene moieties. On the anodic sweep, two small reduction peaks were not assigned. In Figure 11, we show CV data for the +2Cu2FcOH spacer. The ferrocene moieties are electrochemically accessible, and an additional faradaic response at +0.429 V is observed. The only chemical difference between the Cu2FcOH and +2Cu2FcOH molecular spacers measured in Figure 10 and Figure 11, respectively, is that the N in the +2Cu2FcOH complex’s hydrazone ligands is protonated. Unfortunately, this site does not seem to be as electrochemically stable as the ferrocene moiety, and its redox couple lies at a lower potential, so it cannot store as much energy. Electrochemically active molecular spacers within CNTs pseudocapacitors should possess facile electron transfer reactions that are reversible for long-lived cyclability. Not only should the spacers separate CNTs to prevent aggregation, but they also need to be electronically conductive to promote fast ion transfer. We have shown that the fast faradaic electron transfer into the molecular spacer’s ligands is reversible and accessible within the electrochemical window of DMF and propylene carbonate.

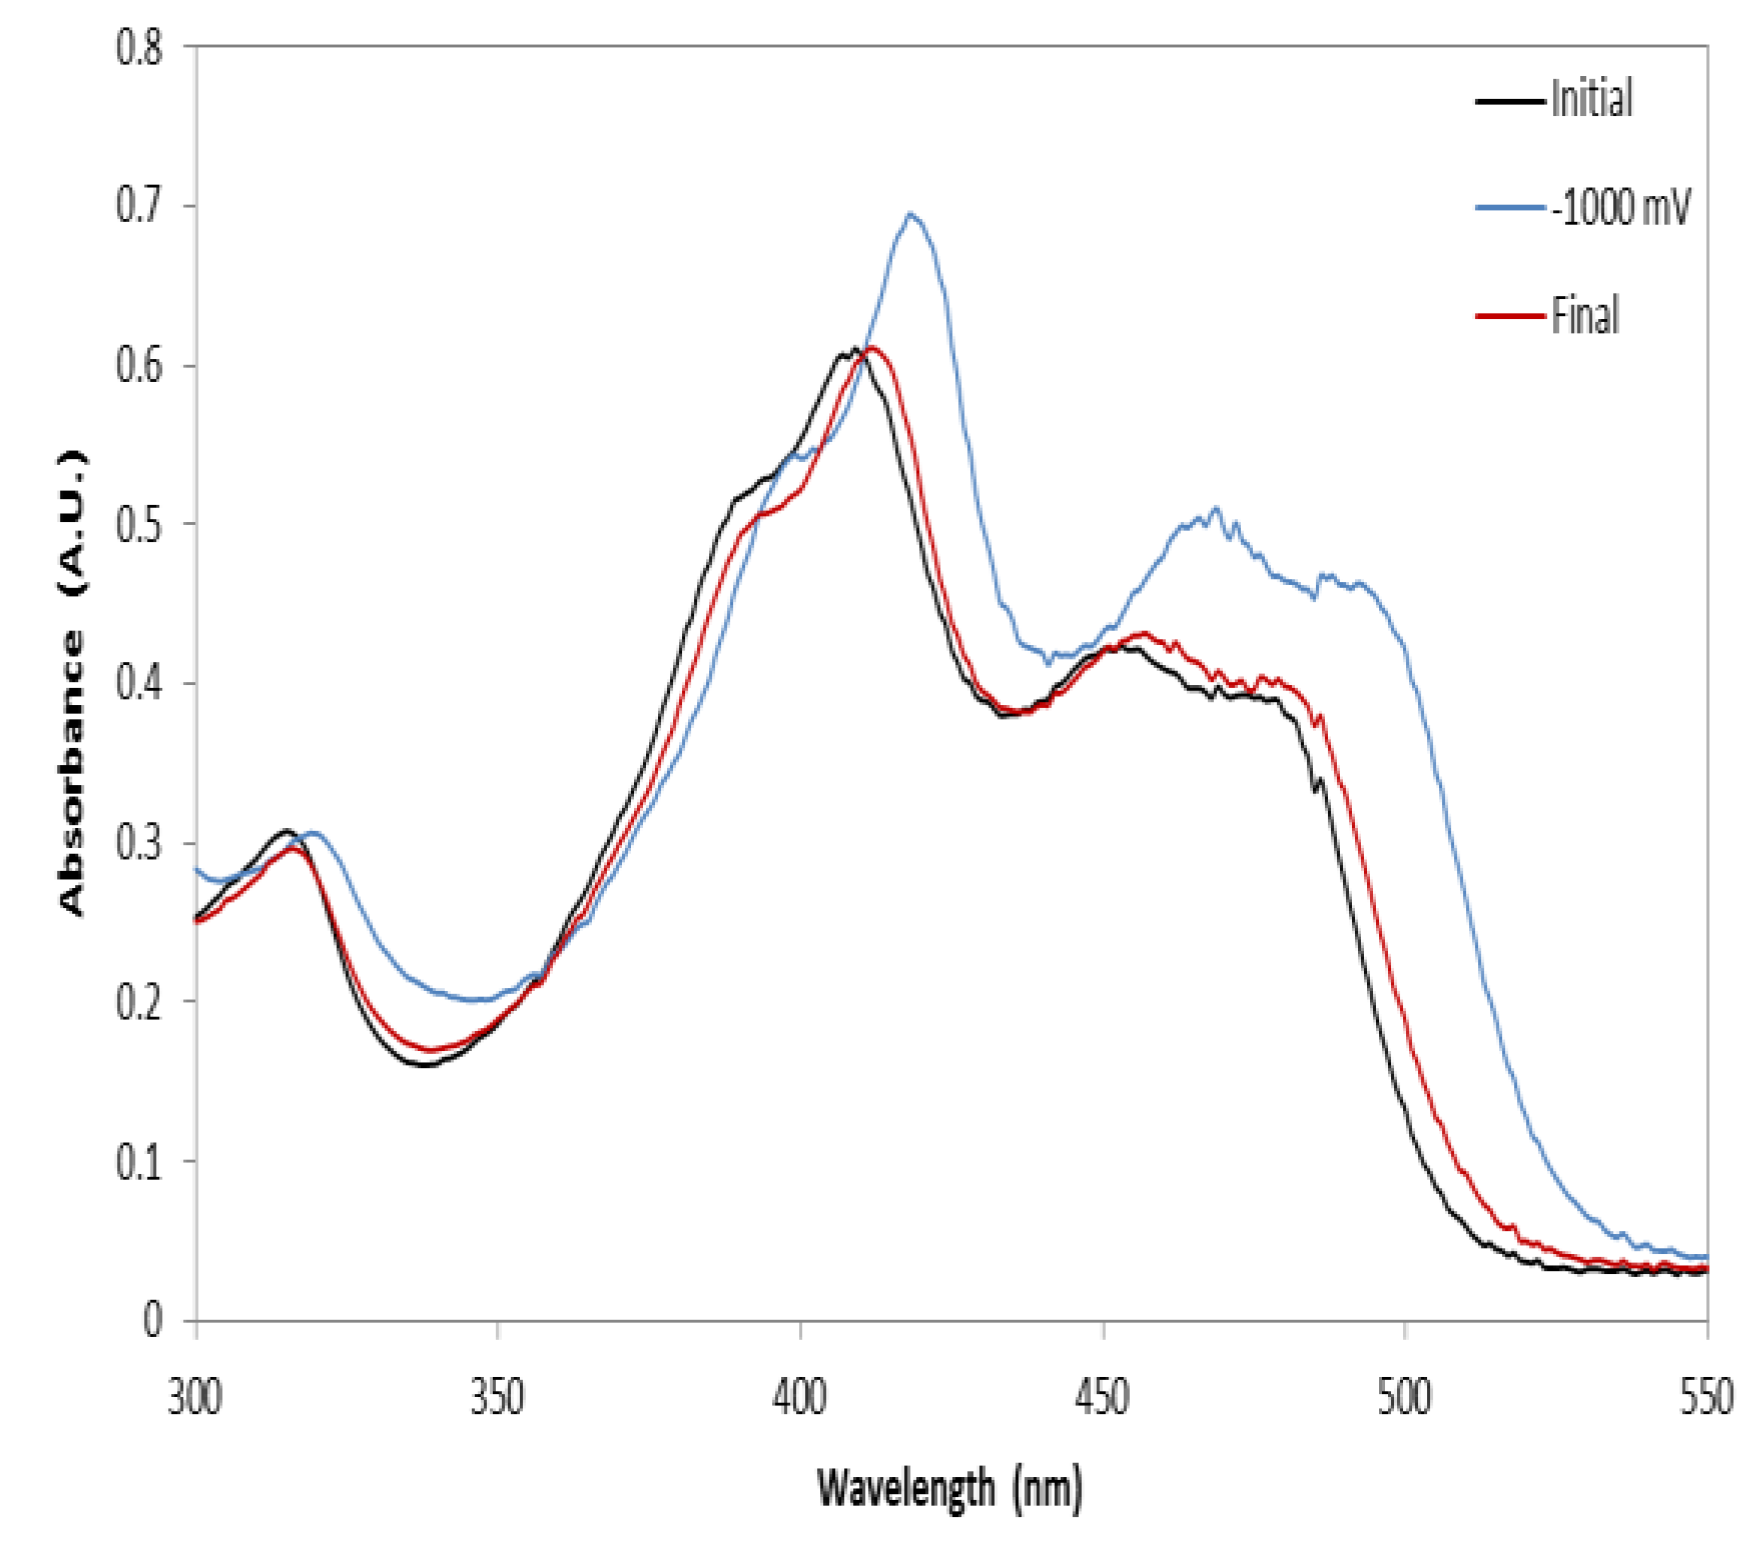
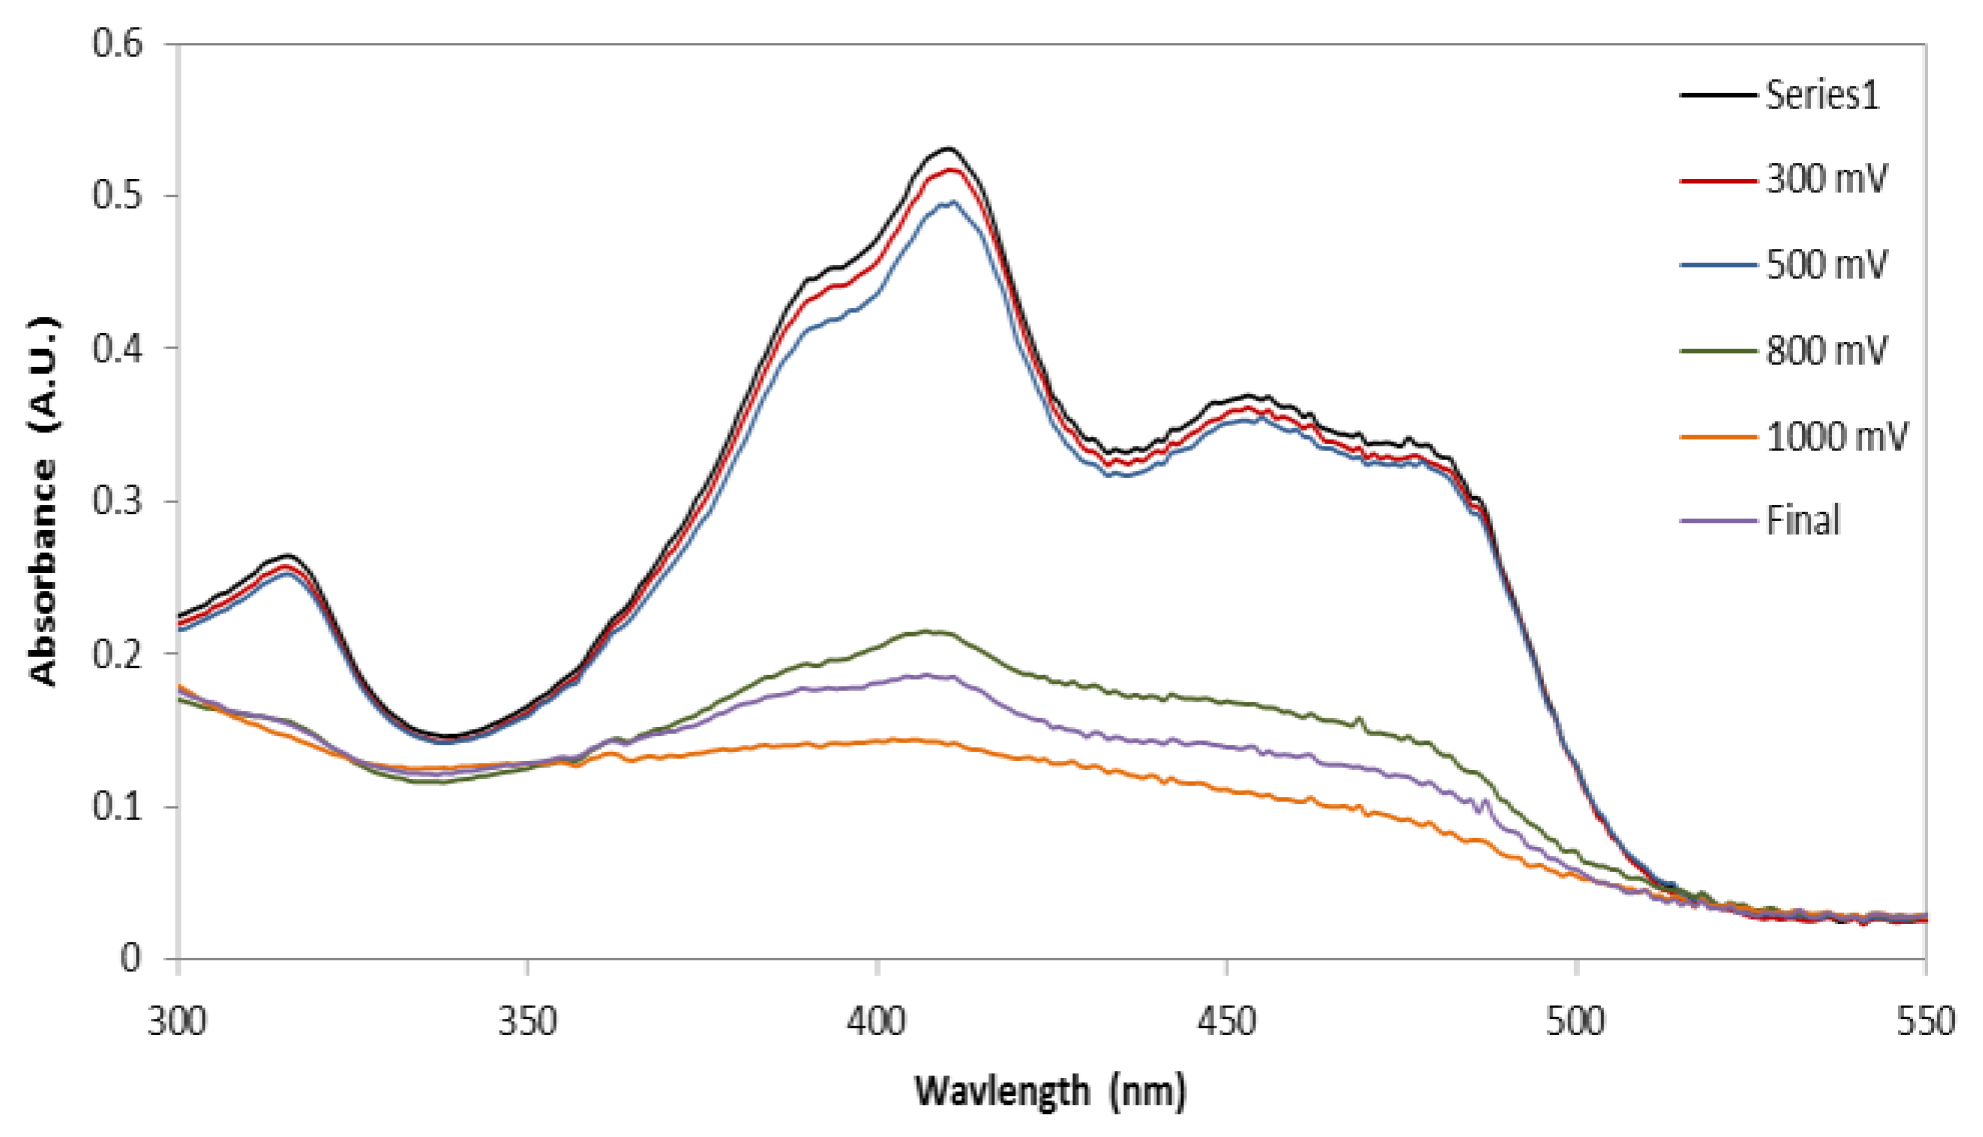
3.7. Spectroelectrochemistry

The faradaic reversibility of the +2Zn2 complex after electrochemical reduction was examined by stepping the voltage of the spectroelectrochemical cell from 0.0 to −1.2 V to 0.0 V in 100 mV steps vs. Ag/AgCl. At each potential step, the cell was allowed to equilibrate at the applied potential, and the UV-Vis spectrum was obtained. As shown in Figure 12, no noticeable changes in the absorption spectrum are observed until about −800 mV (orange curve) where the spectrum tends to red shift in all three major peaks located at 320, 420, and 480 nm. Our previous work determined that the absorption at 320 nm is consistent with the π-π* transition of the ligand, while the absorptions at 420 and 480 nm are due to ion-pair-π* charge transfer transitions [7]. The decrease in absorbance observed for the absorption at 320 nm during reduction is consistent with our findings that it corresponds to the π-π* transitions of the ligand. As the complex is reduced, the additional electrons begin to populate the LUMO, decreasing the HOMO-LUMO population differences, which lead to a decrease in the observed π-π* transitions. However, the peaks at 420 and 480 nm become more intense and are red shifted. This is indicative that the ion-to-ligand charge transfer interaction was affected by the reduction of the complex. DFT geometry optimized structures with frontier molecular orbitals are illustrated in Figures S4 and S5, and orbital energies are listed in Table S1 of the Supplementary Materials.
Electrochemical stability at higher voltages is desired for molecular spacer candidates because the amount of energy stored in a capacitor is proportional to the voltage squared; therefore, if the electrochemical stability is increased to ±4 V, a factor of 16 times more energy can be stored in the supercapacitor. We tested the reversibility throughout the electrochemical window of our solvent at −1.2 V (vs. Ag/AgCl). These data are shown in Figure 13, where the final spectra (red line) after equilibration at −1.2 V effectively overlie the initial UV-Vis spectra (black line). This was expected due to the aromatic nature of the hydrazone ligand, which can accept electrons.
The complex was tested to examine its stability upon oxidation. In a similar manner, the potential was swept to positive potentials and back to its initial potential of 0.0 V. The complex was oxidized up to +1.0 V potential and its optical absorption was measured at each potential. All three characteristic absorption peaks of +2Zn2 hydrazone diminish at approximately +700 mV, indicative of decomposition of the compound due to electrochemical oxidation of the ligands, as shown in Figure 14. After the potential was swept back to zero, the characteristic peaks did not reappear. This is shown in the final spectrum (purple curve) taken of the complex at 0.0 V after the complex was oxidized at +1.0 V. These data indicate that the complex cannot undergo a reversible oxidation process. This will limit the electrochemical window of these molecular spacers to below +0.70 V during electrical energy storage applications.

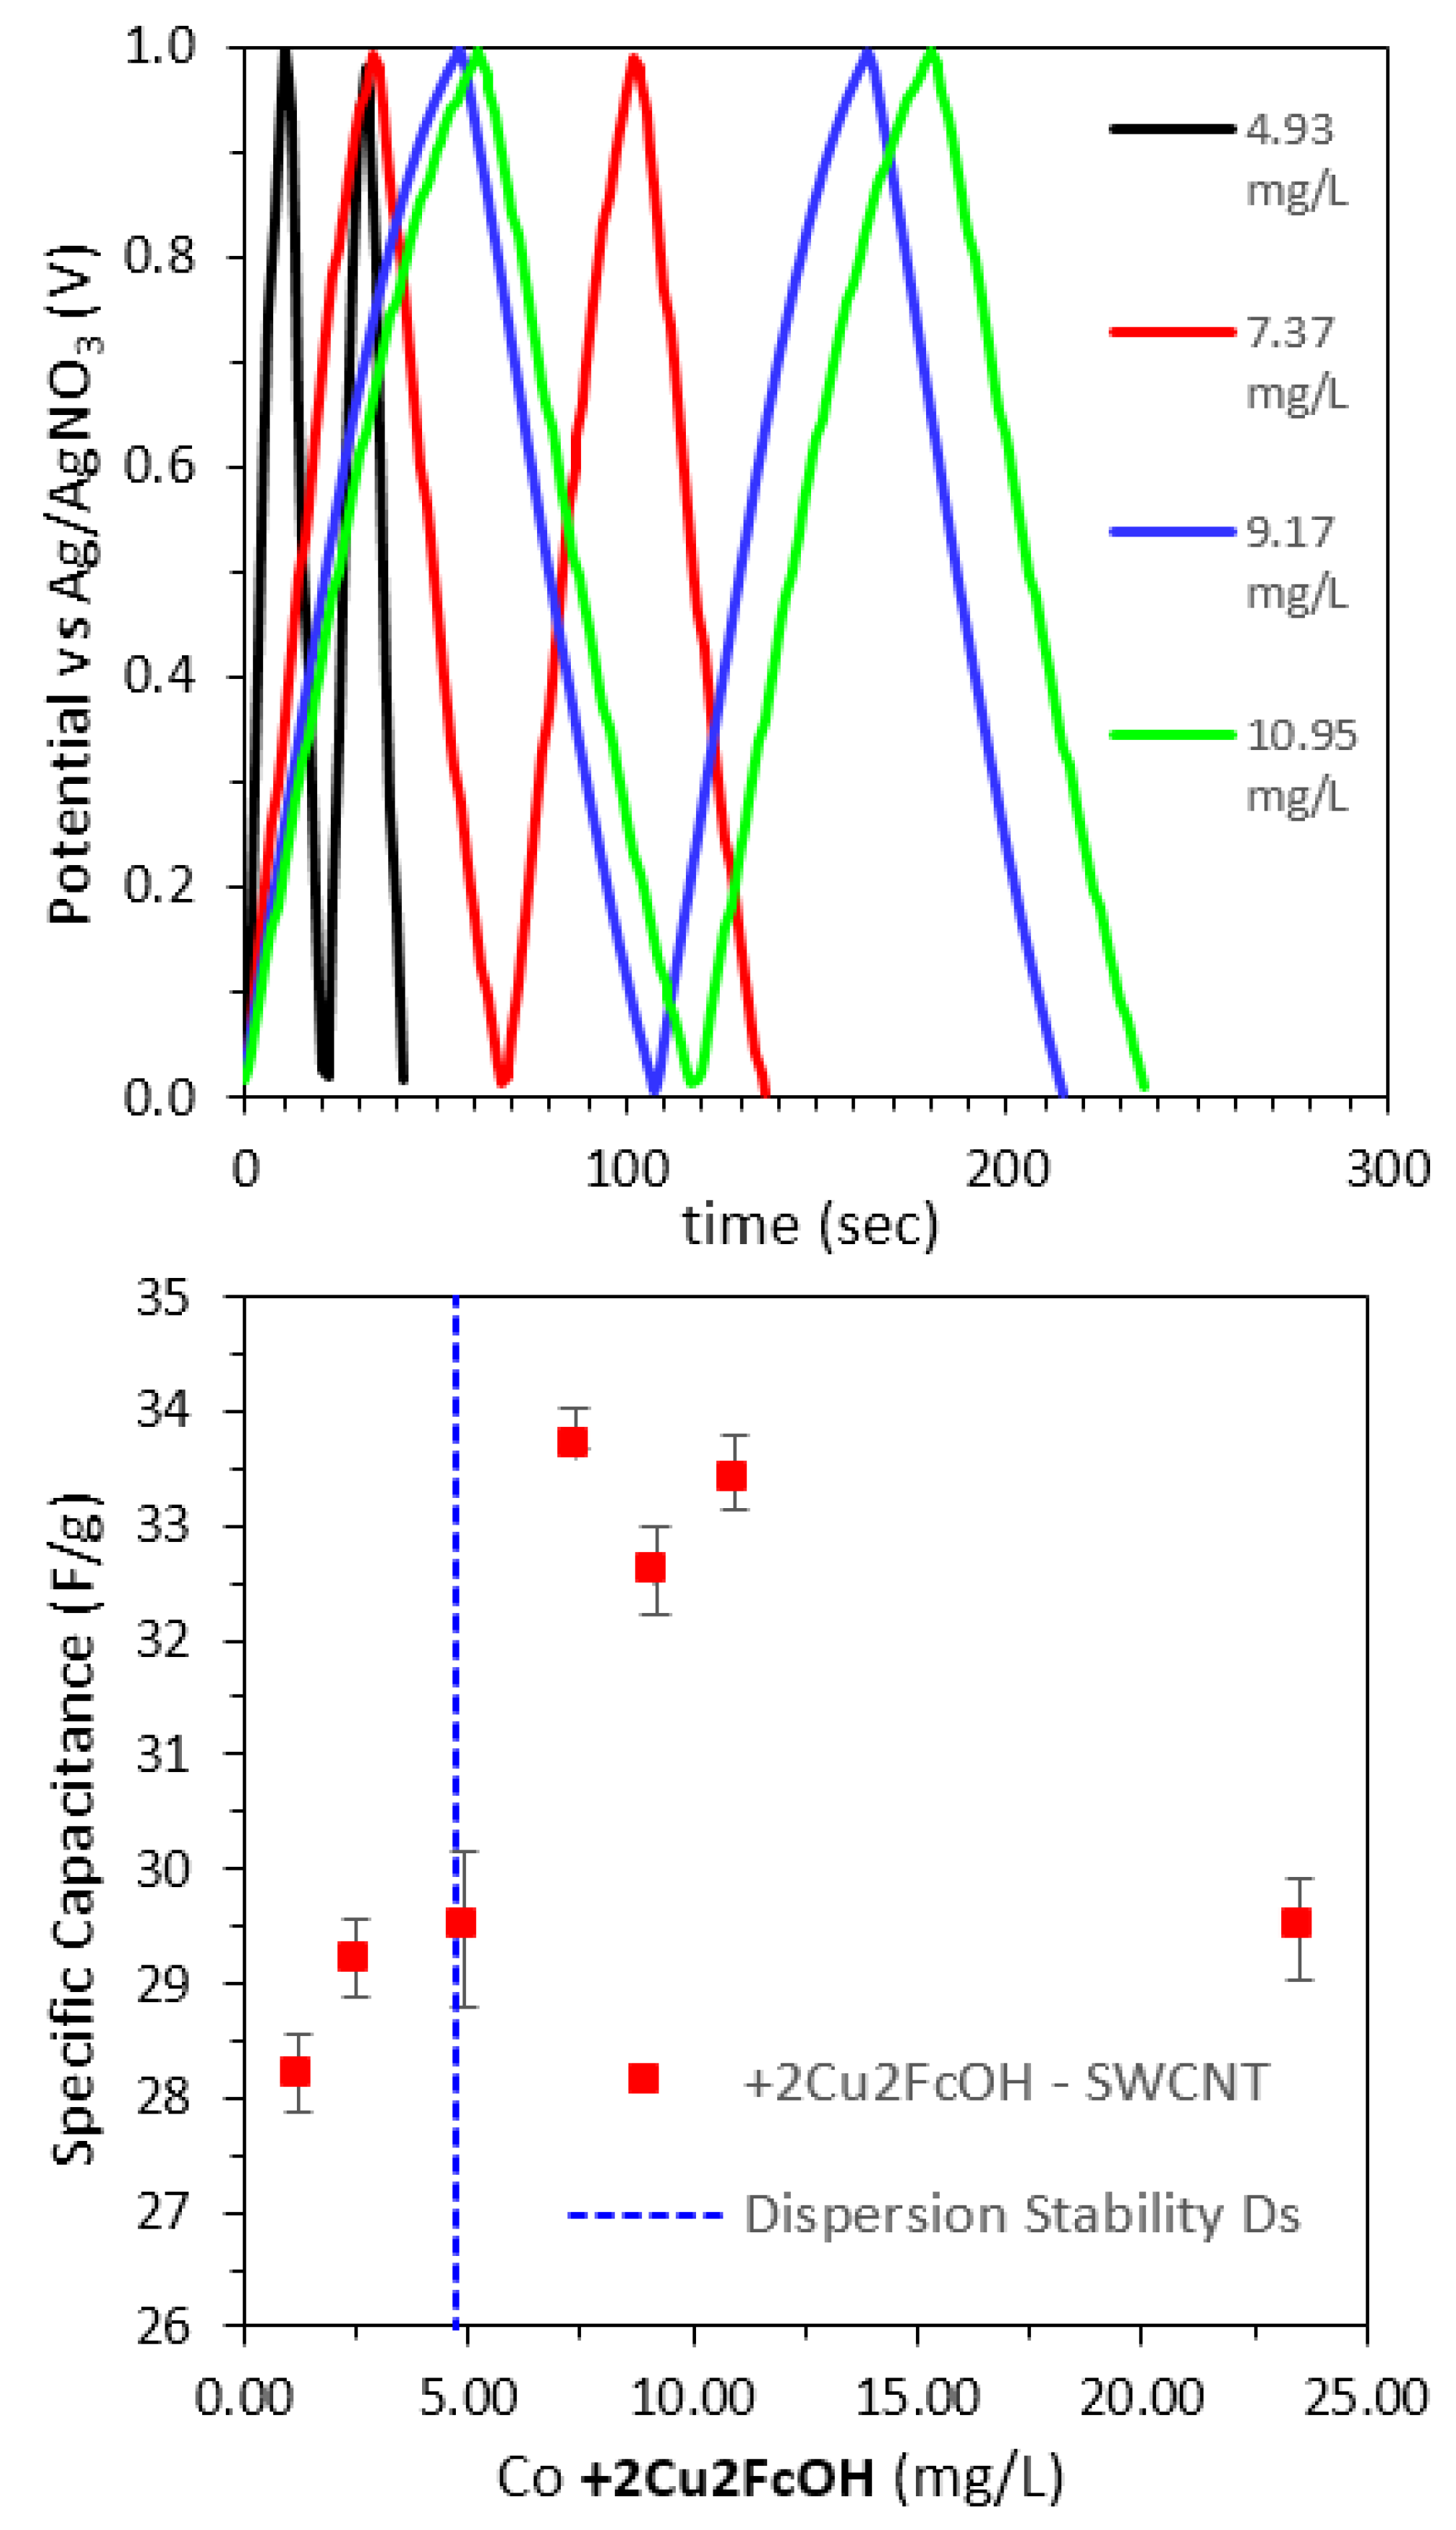
3.8. EDL Capacitor Performance

From the CV of pristine CNTs, shown in Figure 15, the rectangular shape is characteristic of EDL capacitance. As the mass of CNTs increases, the voltammogram measures a higher displacement current, and the integrated area is proportional to the capacitance. As the mass of these thin films was increased from 7 to 20 μg, the specific capacitance was independent of mass at 34.0 ± F g−1, indicative of ion transport through the entire thickness of the film. The low specific capacitance is proportional to the smaller dielectric constant of the solvent DMF where εr = 37. The average specific capacitance in propylene carbonate, where εo = 65, was 75.9 F g−1. The GCD showed a similar trend between charge–discharge cycling and CNT mass. As mass increased, the slope of cycling decreased due to more available surface area. For EIS, the average measured impedance of pristine SWCNTs was calculated as 260 ± 50 Ω at 1 V. As the frequency increased, the impedance of the system decreased (See Figure S12 in the Electronic Supplemental Materials).
Various molecular spacers were incubated with various chirality CNTs, and the resulting tube – complex adducts were filtered and deposited as a thin film onto a working electrode for EDL capacitance performance measurements. Figure 16 (top) shows the GCD curves of four films in which each was incubated with successively high initial concentrations of the +2Cu2FcOH molecular spacer. A higher spacer concentration resulted in improved performance of the material. For all four films shown in Figure 16 (top), the CNTs were incubated just above their dispersion limit against the +2Cu2FcOH spacer. These concentrations are still below the critical coagulation concentration that induced rapid diffusion limited colloid aggregation. As the CNTs aggregate due to the ionic strength-induced collapse of the EDL on the tubes, they lose significant ion accessible surface sites (IASS) where the spacers can bind and intercalate between the tubes. At the optimal spacer concentration, the films exhibited a maximum specific energy density Es = 4.7 Wh/kg at a specific power of 2 kW/kg. We did not measure any significant pseudocapacitance in these GCD curves. While the ferrocene moiety is electroactive and reversible (See CV data in Figure 15) at these potentials, their concentration is too low to affect the overall capacitance of the thin film. Larger area and thicker films are needed to experimentally measure a full Ragone plot (See Figures S11 and S12 in the Supplementary Materials for a partial Ragone plot and EIS data).
The performance of the SG65 thin films was superior to that of the HiPco films. GCD data were collected from pristine and functionalized SG65 semiconducting SWCNTs dry acetonitrile with ~100 mM TBATFB as the supporting electrolyte. Acetonitrile has a dielectric constant (εr = 36.6) similar to that of DMF, so increases in performance are due to the surface charge on the semiconducting SG65 tubes versus the metallic HiPco tubes. Using a ΔV = 1.5 V, the specific capacitance of the pristine SG65 films was 180 F/g with a specific energy Es = 56 Wh/kg at a specific power Ps = 2 kW/kg. Functionalized films were prepared by incubating the +2Zn2 complex in the SG65 dispersion and then transferring the filtered thin film onto an ITO working electrode as described above. The resultant film had a specific capacitance of only 103 F/g, which is lower than that of the pristine film. Interestingly, the Cs increased significantly after the film was held at 1.5 V (vs. NHE). After 5 min at the Vmax potential, the specific capacitance increased to Cs = 149 F/g, and after 10 min it increased again to 156 F/g. This increase is likely due to electrolytes being driven further into the thin film by the applied electric field. As the local ionic strength increases, the EDL Debye length decreases. Since capacitance is inversely related to the Debye length, the measured Cs also increased. The +2Zn2 complex was also bound to the mostly metallic HiPco tubes, and the resulting films were characterized using GCD with Vmax = 2.0 V (vs NHE) in dry propylene carbonate with 1 M TBATFB as the supporting electrolyte [7]. With the higher dielectric constant and higher ionic strength electrolyte, the pristine HiPco films had a specific capacitance Cs = 72.8 F/g (significantly lower than that of the pristine SG65 films). However, for these functionalized films, there was an increase in capacitance Cs = 100.5 F/g compared to the pristine HiPco and the Es = 55.8 Wh/kg at a specific power Ps = 10.5 kW/kg.

3.9. Efficient Automated SWCNT@Carbon-Paper Working Electrodes

We report a method to efficiently integrate functionalized CNTs into an inexpensive working electrode. The electrical performance of the SWCNT films described above is limited because of the processing and film transfer onto a conducting substrate electrode. This new method uses an automated pneumatic infusion and withdraw of dispersion through a known area of Spectracarb 2050A-0550 carbon fiber paper (127 μm thick, 78% porosity). The pneumatic infusion and withdraw apparatus and process are shown in Figures S13–S15 in the Supplementary Materials. The resulting films demonstrate excellent mechanical stability and low contact resistance to the current collector; 25 mL of dispersed SWCNTs and the molecular spacer were bath sonicated while the automated system pushed the material through the porous carbon paper. The film shown in Figure 17 was produced in one hour after ~100 infusion-withdraw cycles. The system can be scaled to larger volumes and bigger electrodes. Multiple current collectors can be filled with active material at once.

3.10. +2Ru2 Shows the Largest EDLC Enhancement

A three-electrode galvanostatic charge–discharge control study of carbon fiber paper measured a negligible capacitance in 100 mM TBATFB in propylene carbonate electrolyte. Pristine HiPco SWCNT films loaded into the carbon paper showed good capacitance and charge–discharge characteristics. These films were tested up to 1000 cycles and exhibited excellent cyclability with a small 1% decrease in EDL specific capacitance. Typical pristine films were measured to have a maximum specific capacitance and energy of 68 F/g and 80 Wh/kg, respectively, while cycled at 5 A/g and a specific power of 7.8 kW/kg. The addition of a small amount of the +2Ru2 molecular spacer into the dispersion during electrode preparation led to a significant improvement in electrode performance. A dispersion of 1.80 μM of the +2Ru2 complex was incubated with HiPco tubes during bath sonication. The dispersion was loaded into the current collector in only 15 min of infusion-withdrawal cycles. This molecular spacer concentration is close to the dispersion stability Ds = 1.4 μM as shown above in Table 1. Control studies show that the molecular spacer does not significantly adsorb to the carbon fibers in the carbon paper.
Galvanostatic charge–discharge data for this film are shown in Figure 18. This film exhibited Cs = 95 F/g, Es = 114 Wh/kg, and a specific power Ps = 8.3 kW/kg when cycled at 5 A/g. Increasing the GCD current from 5 to 8.5 A/g and 17.0 A/g showed the film operating at commensurately higher power. For ID = 8.5 A/g, we measured Cs = 70.2 F/g, Es = 73.3 Wh/kg, Ps = 11.7 kW/kg and for Id = 17.0 A/g, we measured Cs = 33.8 F/g, Es = 42.0 Wh/kg, Ps = 25.5 kW/kg. These films are robust and also exhibit good cyclability. The top panel in Figure 18 shows the first five scans, and the bottom panel shows the last five scans of a 1000 scan run. After over 8 h of operation the system only lost 1.6% of its energy storage and power performance.
The +2Ru2 is the only molecular spacer that significantly and robustly enhances the electrical performance of an SWCNT EDL capacitor electrode. The performance of the +2Zn2 complex films is increased over the pristine film. However, it does not show good cyclability. This is mostly like because the complex is poorly bound to the CNTs and the spacers desorb during operation. When the spacer desorbs, it enables the tubes to interact and aggregate within the electrode, resulting in a slow loss of the ion-accessible surface area and therefore electrical double-layer capacitance. The performance of the +2Ru2 spacer is also better than that of the +2Cu2FcOH and Cu2FcOH functionalized films. Both of these complexes also have a lower adsorption binding constant than the +2Ru2 spacer. The +2Ru2 and +2Zn2 spacers have a more aromatic nature with a large area of conjugated electron density as compared to the Cu-centered complexes. Moreover, the +2Ru2 spacer has the largest steric bulk due to the phenanthroline hetero-ligands on the Ru metal centers. Due to the strong binding of this spacer and the larger gap it can create between the tubes, it is most effective at maintaining the ion-accessible surface area.
Without molecular spacers, SWCNTs will aggregate, and all of the IASS will be inaccessible to the electrolyte. It has been reported that the ideal pore size on the electrode surface should be 0.6–0.8 nm to complement the size of ions in the electrolyte [20,21]. Figure 19 illustrates three molecular mechanics calculations of the tube–tube interactions in the DMF solvent. Two 16.0 nm long (6,5) semiconducting SWCNTs are constrained 1.0 nm, 0.95 nm, and 0.70 nm from each end (constrained atoms shown in yellow). This model incorporates one metal complex every 16.0 nm or ~2 wt.% loading, consistent with our experimental loading. The 1.0 nm wide constraints are consistent with the DFT cluster calculations of +2Ru2 bound between two SWCNTs. As we decreased the distance that the tubes are held apart at the ends, the ion-assessable surface area also decreased as the force of the tube–tube van der Waals attraction increased more than the restoring force of the Young’s modulus of the stiff tubes. Once the system is unstable, the tubes collapse together. We did not include electrical double layer repulsion in the force field model. Keeping the SWCNTs from collapsing onto themselves during film formation is critical to enable these materials for use in supercapacitor devices.

4. Conclusions

By functionalizing SWCNTs with electronically conductive molecular spacers, SSA can be further increased. Since capacitance is directly proportional to the SSA of the electrodes, this allows for more attractive applications in supercapacitors. Previous results [11] of a +2 ruthenium complex showed outstanding results with capacitance reaching 350 F g−1 (versus 75 F g−1 pristine CNTs) where commercially available materials range from 5–50 F g−1. This validates the effect of CNT functionalization. However, utilizing earth-abundant metal center complexes is necessary for a sustainable approach to electrical energy storage. Three new spacers, +2Zn2, +2Cu2FcOH, and Cu2FcOH, can bind to CNTs via Coulombic electrostatic interactions, long-range van der Waals forces, and π-π stacking between the aromatic ligands and conjugated CNT.
A difference in the CNT diameter can have an effect on the loading of a complex. +2Zn2 is more stable around smaller tubes due to less available binding. The larger tubes allow the zinc complex to collapse the EDL more effectively. For the Cu2FcOH complex, the opposite trend was observed. This is most likely due to overall weak binding to the CNTs, making the smaller tubes easier to aggregate. In general, tuning the size, shape, charge, nuclearity, and aromaticity of molecular spacers enables a non-covalent binding to nanostructured carbons. This chemical control can lead to optimized three-dimensional morphologies with high electrical conductance and maximum ion accessibility for enhanced EDL supercapacitors.

Supplementary Materials

The following are available online at https://0-www-mdpi-com.brum.beds.ac.uk/2311-5629/6/4/66/s1. Acronyms and Abreviations. Figure S1: Structure of Cu2FcOH, Figure S2: Structure of +2Zn2Ac, Figure S3: Structure of +2Cu2FcOH, Figure S4: Calculated HOMO for +2Cu2FcOH, Figure S5: Calculated LUMO for +2Cu2FcOH, Figure S6: IR spectra of Cu2FcCl3, Figure S7: IR spectra of Cu2FcOH, Figure S8: IR spectra of +2Cu2, Figure S9: IR spectra of +2Cu2FcOH, Figure S10: IR spectra of +2Zn2Ac, Figure S11: Ragone plot, Figure S12A: EIS of pristine and functionalized SWCNTs, Figure S12B: EIS of pristine SWCNTs, Figures S13–S15: Automated membrane assembly, Figure S16: Proton NMR of Cu2FcOH, Figure S17: Proton NMR of Cu2FcCl3, Figure S18: Proton NMR of +2Zn2Ac, Figure S18: Proton NMR of +2Cu2., Figure S19: Proton NMR of +2Cu2FcOH, Electrical Characterization Equations. Table S1: Calculated HOMO and LUMO energies for +2Cu2FcOH.

Author Contributions

Conceptualization, I.N.S. and J.C.P.; Methodology, I.N.S. and J.C.P.; Formal Analysis, J.Z., N.E., N.Z., J.B.M., and J.C.P.; Investigation, J.Z., N.E., N.Z., J.B.M., T.K., M.B., W.R.H., L.D.P., A.M.; Data Curation, J.C.P.; Writing—Original Draft Preparation, J.Z., N.E., N.Z., J.B.M. and J.C.P.; Writing—Review & Editing, J.Z., T.K. and J.C.P.; Visualization, I.N.S., J.Z., N.E., N.Z., J.B.M., J.C.P.; Supervision, I.N.S. and J.C.P.; Project Administration, I.N.S. and J.C.P.; Funding Acquisition, I.N.S. and J.C.P. All authors have read and agreed to the published version of the manuscript.

Funding

This publication is based on work supported by a grant from the U.S. Civilian Research & Development Foundation (CRDF Global) with funding from the United States Department of State. The opinions, findings, and conclusions stated herein are those of the author(s) and do not necessarily reflect those of CRDF Global (Grant # FSCX-17-63351-0), the Eurasia Foundation (Grant # WI6-1013), or the United States Department of State. This work was supported, in part, by funds provided by The University of North Carolina at Charlotte. L.D. Popov, A.N. Morozov, and I.N. Shcherbakov acknowledge the Program of the Southern Federal University for publication activities support.

Conflicts of Interest

The authors declare no conflict of interest.

References

  1. Frackowiak, E.; Béguin, F. Carbon materials for the electrochemical storage of energy in capacitors. Carbon 2001, 39, 937–950. [Google Scholar] [CrossRef]
  2. Ghazanfari, A.; Hamzeh, M.; Mokhtari, H.; Karimi, H. Active Power Management of Multihybrid Fuel Cell/Supercapacitor Power Conversion System in a Medium Voltage Microgrid. IEEE Trans. Smart Grid 2012, 3, 1903–1910. [Google Scholar] [CrossRef]
  3. Wang, G.P.; Zhang, L.; Zhang, J.J. A review of electrode materials for electrochemical supercapacitors. Chem. Soc. Rev. 2012, 41, 797–828. [Google Scholar] [CrossRef] [PubMed] [Green Version]
  4. Yu, Z.N.; Tetard, L.; Zhai, L.; Thomas, J. Supercapacitor electrode materials: Nanostructures from 0 to 3 dimensions. Energy Environ. Sci. 2015, 8, 702–730. [Google Scholar] [CrossRef] [Green Version]
  5. Arico, A.S.; Bruce, P.; Scrosati, B.; Tarascon, J.M.; Van Schalkwijk, W. Nanostructured materials for advanced energy conversion and storage devices. Nat. Mater. 2005, 4, 366–377. [Google Scholar] [CrossRef]
  6. Pan, H.; Li, J.; Feng, Y. Carbon nanotubes for supercapacitor. Nanoscale Res. Lett. 2010, 5, 654–668. [Google Scholar] [CrossRef] [PubMed] [Green Version]
  7. Alston, J.R.; Banks, D.J.; McNeill, C.X.; Mitchell, J.B.; Popov, L.D.; Shcherbakov, I.N.; Poler, J.C. Adsorption studies of divalent, dinuclear coordination complexes as molecular spacers on SWCNTs. Phys. Chem. Chem. Phys. 2015, 17, 29566–29573. [Google Scholar] [CrossRef] [PubMed]
  8. Li, L.; Song, B.; Maurer, L.; Lin, Z.; Lian, G.; Tuan, C.-C.; Moon, K.-S.; Wong, C.-P. Molecular engineering of aromatic amine spacers for high-performance graphene-based supercapacitors. Nano Energy 2016, 21, 276–294. [Google Scholar] [CrossRef]
  9. Song, B.; Sizemore, C.; Li, L.; Huang, X.; Lin, Z.; Moon, K.-s.; Wong, C.-P. Triethanolamine functionalized graphene-based composites for high performance supercapacitors. J. Mater. Chem. A 2015, 3, 21789–21796. [Google Scholar] [CrossRef]
  10. Ameen, A.A.; Giordano, A.N.; Alston, J.R.; Forney, M.W.; Herring, N.P.; Kobayashi, S.; Ridlen, S.G.; Subaran, S.S.; Younts, T.J.; Poler, J.C. Aggregation kinetics of single-walled carbon nanotubes investigated using mechanically wrapped multinuclear complexes: Probing the tube-tube repulsive barrier. Phys. Chem. Chem. Phys. 2014, 16, 5855–5865. [Google Scholar] [CrossRef] [PubMed]
  11. Levchenkov, S.I.; Raspopova, E.A.; Morozov, A.N.; Popov, L.D.; Titova, Y.V.; Gorbunova, M.O.; Shcherbakov, I.N. 2,6-diformyl-4-tert-butylphenol bis-ferrocenoylhydrazone and binuclear copper(II) complexes on its basis. Russ. J. Gen. Chem. 2016, 86, 2075–2080. [Google Scholar] [CrossRef]
  12. Alston, J.R.; Kobayashi, S.; Younts, T.J.; Poler, J.C. Synthesis and characterization of rigid +2 and +3 heteroleptic dinuclear ruthenium(II) complexes. Polyhedron 2010, 29, 2696–2702. [Google Scholar] [CrossRef]
  13. Forney, M.W.; Poler, J.C. Significantly Enhanced Single-Walled Carbon Nanotube Dispersion Stability in Mixed Solvent Systems. J. Phys. Chem. C 2011, 115, 10531–10536. [Google Scholar] [CrossRef]
  14. Derjaguin, B.V. Theory of Stability of Colloids and Thin Films; Plenum Publishing Corporation: New York, NY, USA, 1989; p. 174. [Google Scholar]
  15. Derjaguin, B.V.; Landau, L. Theory of the Stability of Strongly Charged Lyophobic Sols and of the Adhesion of Strongly Charged Particles in Solutions of Electrolytes. Acta Phys. Chim. Urss 1941, 14, 633–662. [Google Scholar] [CrossRef]
  16. Forney, M.W.; Anderson, J.S.; Ameen, A.L.; Poler, J.C. Aggregation Kinetics of Single-Walled Carbon Nanotubes in Nonaqueous Solvents: Critical Coagulation Concentrations and Transient Dispersion Stability. J. Phys. Chem. C 2011, 115, 23267–23272. [Google Scholar] [CrossRef]
  17. Trivedi, R.; Deepthi, S.B.; Lingamallu, G.; Ramakrishna, K.V.S. Synthesis, Crystal Structure, Electronic Spectroscopy, Electrochemistry and Biological Studies of Ferrocene-Carbohydrate Conjugates. Eur. J. Inorg. Chem. 2012, 2012, 2267–2277. [Google Scholar] [CrossRef]
  18. Chaturvedi, H.; Giordano, A.N.; Kim, M.-J.; MacDonnell, F.M.; Subaran, S.S.; Poler, J.C. “Mechanically Docked” Metallodendrimers about Single-Walled Carbon Nanotubes. J. Phys. Chem. C 2009, 113, 11254–11261. [Google Scholar] [CrossRef]
  19. Rao, A.M.; Eklund, P.C.; Bandow, S.; Thess, A.; E, R. Smalley. Evidence for charge transfer in doped carbon nanotube bundles from Raman scattering. Nature 1997, 388, 257–259. [Google Scholar] [CrossRef]
  20. Raymundo-Pinero, E.; Leroux, F.; Beguin, F. A high-performance carbon for supercapacitors obtained by carbonization of a seaweed biopolymer. Adv. Mater. 2006, 18, 1877–1882. [Google Scholar] [CrossRef]
  21. Simon, P.; Gogotsi, Y. Materials for electrochemical capacitors. Nat. Mater. 2008, 7, 845–854. [Google Scholar] [CrossRef] [PubMed] [Green Version]
Figure 1. Molecular spacer intercalation between the CNTs.
Carbon 06 00066 g001
Figure 2. +2Zn2 complex (upper left) adsorbed to various chirality and sized CNTs.
Carbon 06 00066 g002
Figure 3. UV-Vis absorption spectra of all molecular spacers. Molar extinction coefficients were calculated from known concentration solutions and absorbance measured at the charge transfer bands labeled by the λmax.
Carbon 06 00066 g003
Figure 4. Molecular spacers bind to CNTs at low concentrations. As the ionic strength increases, a higher spacer concentration collapses the EDL repulsion and the CNTs aggregate.
Carbon 06 00066 g004
Figure 5. Dispersion stability measurements of HiPco SWCNTs in the presence of various molecular spacers. The onset of aggregation for dinuclear molecular spacers with various charge states was calculated from these data. The left panel compares the strong electrolyte +2Ru (black) to the weak electrolyte +2Zn2 (red) +2Zn2 (red), and the right panel compares +2Zn2 (red) to the neutral Cu2FcOH (black). All spacers were mixed into dispersed HiPco SWCNTs (average diameter 0.95 nm).
Carbon 06 00066 g005
Figure 6. Adsorption isotherms of +2Cu2FcOH (left) and +2Ru2 (right) on HiPco SWCNTs and fit to a Langmuir model. The molecular model of +2Cu2FcOH is shown in the inset (left).
Carbon 06 00066 g006
Figure 7. Kinetics of +2Cu2FcOH binding at an initial concentration of 10.4 mg L−1. Binding stayed consistent up to 120 min, the typical length of incubation for adsorption studies. Equilibrium was reached faster than for any other molecular spacer previously studied. The inset shows aggregated dispersion after only 6 min of incubation.
Carbon 06 00066 g007
Figure 8. Raman spectrum of pristine and +2Zn2 hydrazone-functionalized HiPco SWCNTs. The spectrum of the +2Zn2 hydrazone-functionalized film appears to have been down shifted compared to the pristine film.
Carbon 06 00066 g008
Figure 9. CV anodic sweep of +2Zn2. Potential vs. (NHE) in dry degassed DMF.
Carbon 06 00066 g009
Figure 10. CV cathodic sweep of Cu2FcOH potential vs. (NHE) in dry degassed DMF.
Carbon 06 00066 g010
Figure 11. CV of +2Cu2FcOH. Potential vs. Ag/AgNO3 in dry degassed DMF. The first redox couple at E0 = 0.429 V was identified as the copper metal center. The second redox couple at E0 = 0.715 V is the ferrocene ligands.
Carbon 06 00066 g011
Figure 12. Overlaid optical absorption spectra from 300–650 nm of the +2Zn2 hydrazone complex, ~100 µM, in acetonitrile after equilibration at potentials ranging from 0 to −1.2V vs. Ag/AgCl. The first three spectra, 0 mV, −200 mV, and −600 mV, are overlapped.
Carbon 06 00066 g012
Figure 13. Absorption spectrum of +2Zn2 hydrazone in acetonitrile as it is reduced at −1.2V and swept back to its initial potential of 0V. The initial and final spectrum, black and red curves, only have slight differences, which is indicative that the complex did not decompose upon reduction at −1.2 V.
Carbon 06 00066 g013
Figure 14. Overlaid spectrum of +2Zn2 hydrazone in acetonitrile as it is oxidized to 1 V and swept back to its initial potential. The characteristic shape and peaks of the complex’s optical absorption tend to diminish between positive 600−700 mV, and it seems as if the complex is not reversible due to the vast differences in the spectrum between the initial and final spectrum.
Carbon 06 00066 g014
Figure 15. Cyclic voltammograms (left) and charge–discharge measurements (right) of three different pristine HiPco SWCNT electrodes. Rectangular CV and triangular GCD indicative of pure EDL capacitance.
Carbon 06 00066 g015
Figure 16. GCD curves (top) and specific capacitance data of thin film HiPco films after functionalization with the +2Cu2FcOH spacer at various initial concentrations. All films in the GCD graph were made with above the dispersion stability concentration of the spacer. As the initial concentration of the spacer increases well beyond the dispersion stability concentration, the CNTs rapidly aggregate before the film can be formed, resulting in the low capacitance shown at 23 mg/L.
Carbon 06 00066 g016
Figure 17. SEM image of SWCNT film integrated into a carbon fiber paper current collector. Carbon fibers of ~10 μm diameter and >50 μm porosity coated and filled with functionalized SWCNTs.
Carbon 06 00066 g017
Figure 18. Galvanostatic charge–discharge curves of a +2Ru2 functionalized HiPco SWCNT film loaded onto a carbon fiber paper current collector run for 1000 cycles. Three electrode method in 100 mM TBATFB in propylene carbonate electrolyte. Discharge current set at 8.5 A/g. First five cycles in the top graph and the last five cycles in the bottom graph.
Carbon 06 00066 g018
Figure 19. Molecular mechanics of tube–tube collapse when held apart at only the very end of each tube. The +2Ru2 complex creates a ~1 nm gap between two SWCNTs (top set). The +2Cu2FcOH separates the tubes by less than 0.7 nm (bottom set).
Carbon 06 00066 g019
Table 1. Dispersion stabilities of HiPco SWCNTs in DMF with +2Ru2, +2Zn2, +2Cu2FcOH, and Cu2FcOH coordination complexes added until the concentration was higher than the diffusion-limited colloid aggregation concentration.
Spacers+2Ru2+2Cu2FcOH+2Zn2Cu2FcOH
Dis. Stability X0 (µM) (HiPco)1.36 ± 0.025.9 ± 0.140.5 ± 0.4110 ± 7
Table 2. Dispersion stability of various CNTs against the addition of various coagulants.
CNTsDiameter (nm)Zeta Potential (mV)X0 (µM)
+2Ru2
X0 (µM)
+2Zn2
X0 (µM)
Cu2FcOH
SG 6,50.75−28 ± 61.37 ± 0.0232.9 ± 0.477.4 ± 2.8
SG 7,60.88−43 ± 11 22.7 ± 0.398 ± 20
HiPco0.95−51 ± 111.36 ± 0.0240.5 ± 0.4110 ± 7
FW100X2.03−32 ± 6 65 ± 691 ± 8
MWCNT8.0 111 ± 3
Table 3. Raman Shift data for both pristine and +2Zn2 hydrazone-functionalized HiPco SWCNTs.
SampleD (cm−1)G/G+ (cm−1)G’ (cm−1)
Pristine HiPco film1290.61559.7/1587.02575.5
+2Zn2 functionalized HiPco1288.21556.4/1583.42571.9
Publisher’s Note: MDPI stays neutral with regard to jurisdictional claims in published maps and institutional affiliations.

